restoration notes - wordpress.com · restoration notes have been a distinguishing feature of...
TRANSCRIPT
8 • March/June 2011 Ecological REstoRation 29:1–2
Restoration NotesRestoration Notes have been a distinguishing feature of Ecological Restoration for more than 25 years. This section is geared toward introducing innovative research, tools, technologies, programs, and ideas, as well as providing short-term research results and updates on ongoing efforts. Please direct submissions and inquiries to the editorial staff ([email protected]).
Ecological Restoration Vol. 29, Nos. 1–2, 2011ISSN 1522-4740 E-ISSN 1543-4079©2011 by the Board of Regents of the University of Wisconsin System.
Grassland Bird Nesting on Restored and Remnant Prairies in South Central Nebraskaluis Enrique Ramírez-Yáñez (Platte River Whooping crane Maintenance trust), Felipe chávez-Ramírez (Platte River Whooping crane Maintenance trust, Wood River, nE 68503, 308/384-4633, [email protected]), Daniel H. Kim (Platte River Whooping crane Maintenance trust) and Feliciano Heredia-Pineda (Platte River Whooping crane Maintenance trust)
Approximately 64% (402,000 km2) of mixed-grass prairie has been lost, especially to agricultural pro-
duction, since European settlement in North America (Samson and Knopf 1996). This loss has reduced wildlife habitat; 77% of grassland birds tracked by breeding bird surveys have decreased populations from 1966 to 1996 (Sauer et al. 2000). The Platte River Whooping Crane Maintenance Trust has been restoring grasslands in south central Nebraska since 1986, measuring success primarily through native vegetation establishment and cover. While evaluating restored grassland as nesting habitat for migra-tory birds, we encountered some important differences in grassland bird use between restored and native grasslands. We present preliminary findings on both plant composi-tion and structure, and grassland bird densities in natural undisturbed areas and restored sites.
The study area is located in the Platte River Valley in a landscape formerly characterized by grasslands and cur-rently dominated by corn fields. Our study sites consisted of six former farmlands restored to grassland ranging from 5 to 15 years old, and six remnant grasslands mod-erately affected by common introduced grass species such as smooth brome (Bromus inermis) and Kentucky bluegrass (Poa pratensis); all restored and native plots were at least 40 ha and less than 1.5 km from the river. Restored grass-lands were contoured to re-create former rolling terrain and planted with a high-diversity seed mix (100+ spe-cies). Management has typically consisted of light grazing (<1 AUM), and in some cases prescribed burning starting at least three years after restoration.
We identified the territory for individual males or breed-ing pairs, and located nesting sites of bobolink (Dolichonyx oryzivorus), dickcissel (spiza americana), and grasshopper sparrow (ammodramus savannarum) using Martin and Guepel’s technique (1993). We selected these three species for evaluation because they are important in mixed-grass prairie ecosystems and have different habitat requirements. Bobolinks require areas with tall vegetation structure and density, while grasshopper sparrows prefer low and sparse vegetation; dickcissel was selected as an intermediate indi-cator, with nesting requirements of continuous herbaceous cover with woody perches. We used the spot mapping technique (Bibby et al. 2000) to determine breeding bird pairs between May and July. In each site, the locations of all birds (especially singing males) and nest sites are mapped in a square 16 ha plot during a series of weekly visits (>8 total) during the breeding season. We recorded a total of 242 nests in native remnants and 264 in restored sites.
We measured vegetation vertical structure and height; aerial cover by functional group (grasses, forbs, woody, litter, bare ground, and standing dead); litter depth, at paired random points 25 m away from nest sites to obtain a better description of site variation; and plant species com-position, richness, and frequencies at site level. To obtain a more accurate description of vegetation at each nest site, we measured vertical cover using a density board (10 cm × 2 m, with 10 cm increments). Initial trials determined that the most accurate readings of visual obstruction occurred at 1 m height and 4 m away. To describe vegetation aerial cover we used five Daubenmire frames (20 × 50 cm) at each nest site, located at the center and 1 m away in each cardinal direction. Litter depth was measured at the center of each Daubenmire frame using a ruler to record thick-ness from ground level to the top of the litter layer. Species composition was sampled using the step point method (Owensby 1973), recording species encountered at basal level. Five 100 m transects were randomly established per site in July 2009, and individual species were identified at each step. We used ANOVA to compare treatments (site type).
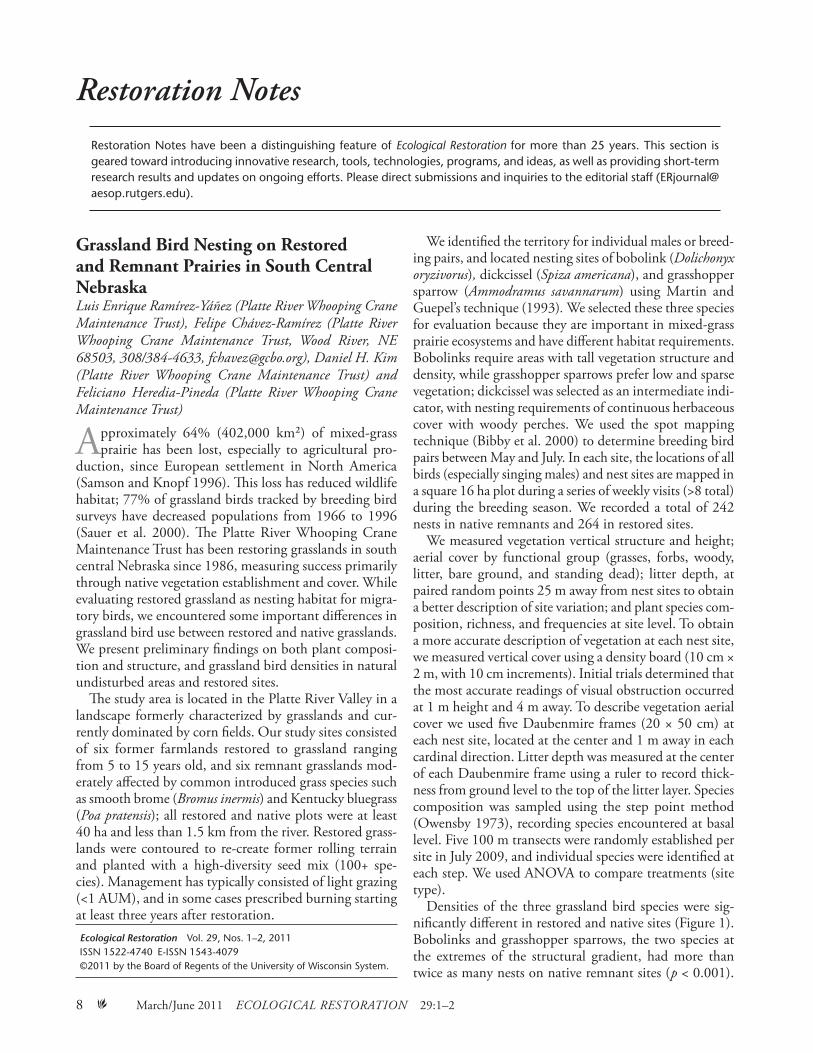
Densities of the three grassland bird species were sig-nificantly different in restored and native sites (Figure 1). Bobolinks and grasshopper sparrows, the two species at the extremes of the structural gradient, had more than twice as many nests on native remnant sites ( p < 0.001).
March/June 2011 Ecological REstoRation 29:1–2 • 9
Figure 1. Average number of nests per 16 ha study plot observed in 2009 in restored and remnant grasslands along the Platte River in south central Nebraska.
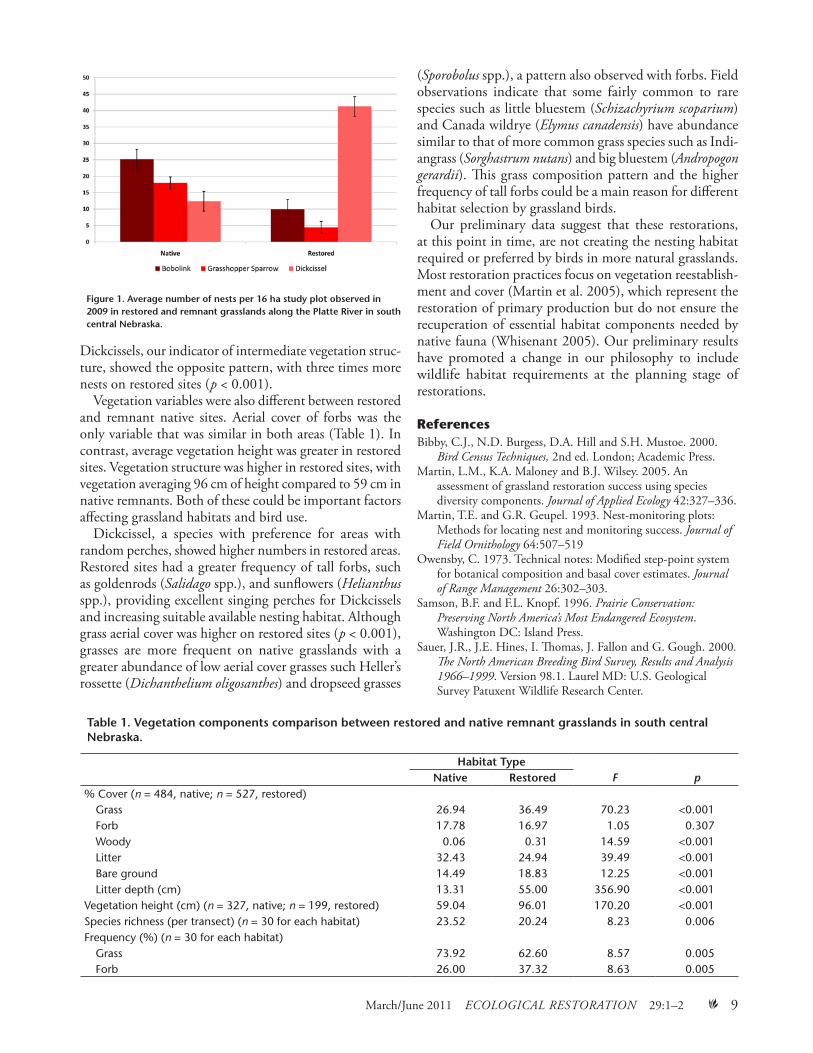
Table 1. Vegetation components comparison between restored and native remnant grasslands in south central Nebraska.
Habitat Type Native Restored F p% Cover (n = 484, native; n = 527, restored) Grass 26.94 36.49 70.23 <0.001 Forb 17.78 16.97 1.05 0.307 Woody 0.06 0.31 14.59 <0.001 Litter 32.43 24.94 39.49 <0.001 Bare ground 14.49 18.83 12.25 <0.001 Litter depth (cm) 13.31 55.00 356.90 <0.001Vegetation height (cm) (n = 327, native; n = 199, restored) 59.04 96.01 170.20 <0.001Species richness (per transect) (n = 30 for each habitat) 23.52 20.24 8.23 0.006Frequency (%) (n = 30 for each habitat) Grass 73.92 62.60 8.57 0.005 Forb 26.00 37.32 8.63 0.005
Dickcissels, our indicator of intermediate vegetation struc-ture, showed the opposite pattern, with three times more nests on restored sites ( p < 0.001).
Vegetation variables were also different between restored and remnant native sites. Aerial cover of forbs was the only variable that was similar in both areas (Table 1). In contrast, average vegetation height was greater in restored sites. Vegetation structure was higher in restored sites, with vegetation averaging 96 cm of height compared to 59 cm in native remnants. Both of these could be important factors affecting grassland habitats and bird use.
Dickcissel, a species with preference for areas with random perches, showed higher numbers in restored areas. Restored sites had a greater frequency of tall forbs, such as goldenrods (salidago spp.), and sunflowers (Helianthus spp.), providing excellent singing perches for Dickcissels and increasing suitable available nesting habitat. Although grass aerial cover was higher on restored sites ( p < 0.001), grasses are more frequent on native grasslands with a greater abundance of low aerial cover grasses such Heller’s rossette (Dichanthelium oligosanthes) and dropseed grasses
(sporobolus spp.), a pattern also observed with forbs. Field observations indicate that some fairly common to rare species such as little bluestem (schizachyrium scoparium) and Canada wildrye (Elymus canadensis) have abundance similar to that of more common grass species such as Indi-angrass (sorghastrum nutans) and big bluestem (andropogon gerardii). This grass composition pattern and the higher frequency of tall forbs could be a main reason for different habitat selection by grassland birds.
Our preliminary data suggest that these restorations, at this point in time, are not creating the nesting habitat required or preferred by birds in more natural grasslands. Most restoration practices focus on vegetation reestablish-ment and cover (Martin et al. 2005), which represent the restoration of primary production but do not ensure the recuperation of essential habitat components needed by native fauna (Whisenant 2005). Our preliminary results have promoted a change in our philosophy to include wildlife habitat requirements at the planning stage of restorations.
ReferencesBibby, C.J., N.D. Burgess, D.A. Hill and S.H. Mustoe. 2000.
Bird census techniques, 2nd ed. London; Academic Press.Martin, L.M., K.A. Maloney and B.J. Wilsey. 2005. An
assessment of grassland restoration success using species diversity components. Journal of applied Ecology 42:327–336.
Martin, T.E. and G.R. Geupel. 1993. Nest-monitoring plots: Methods for locating nest and monitoring success. Journal of Field ornithology 64:507–519
Owensby, C. 1973. Technical notes: Modified step-point system for botanical composition and basal cover estimates. Journal of Range Management 26:302–303.
Samson, B.F. and F.L. Knopf. 1996. Prairie conservation: Preserving north america’s Most Endangered Ecosystem. Washington DC: Island Press.
Sauer, J.R., J.E. Hines, I. Thomas, J. Fallon and G. Gough. 2000. The north american Breeding Bird survey, Results and analysis 1966–1999. Version 98.1. Laurel MD: U.S. Geological Survey Patuxent Wildlife Research Center.
10 • March/June 2011 Ecological REstoRation 29:1–2
Whisenant, S.G. 2005. Repairing Damaged Wildlands: a Process-oriented, landscape-scale approach. Cambridge UK: Cambridge University Press.
Do Private Land Owners Support Species Conservation? Results of a Local Survey (Oregon)Thomas n. Kaye (institute for applied Ecology, Po Box 2855, corvallis, oR 97339, 541/753-3099, [email protected]), Rachel schwindt (institute for applied Ecology) and carolyn Menke (institute for applied Ecology)
Engaging private landowners in habitat restoration and conservation is crucial for protecting species with geo-
graphic ranges fragmented by multiple ownership types. Like many grasslands that have declined in the United States, Oregon’s Willamette Valley has lost an estimated 99% of historic prairie in the past 150 years due to agricul-tural and residential development, and many rare prairie remnants are privately owned. In the Willamette Valley, several prairie species are conservation targets, including Fender’s blue butterfly (Plebejus icarioides fenderi), feder-ally listed by the U.S. Fish & Wildlife Service (USFWS) as endangered; Kincaid’s lupine (lupinus oreganus, threat-ened), Willamette daisy (Erigeron decumbens, endangered), Nelson’s checker-mallow (sidalcea nelsoniana, threatened), Bradshaw’s desert-parsley (lomatium bradshawii, threat-ened), Taylor’s checkerspot butterfly (Euphydryas editha taylori, candidate for listing), and peacock larkspur (Del-phinium × pavonaceum, listed by the state of Oregon as endangered) (USFWS 2010). In Benton County ( popula-tion 81,859 and area 1,751 km2), midvalley, these species occur on isolated remnant wet and upland prairies across a variety of ownerships, and their long-term conserva-tion may depend on coordination among many parties (Benton County, Oregon 2010).
In 2006, Benton County began a countywide process to develop a USFWS Habitat Conservation Plan, the first of its scope in Oregon. This plan is required to apply for an incidental take permit. This type of USFWS permit is required in advance for nonfederal activities that may harm threatened and endangered species to ensure that any harm is balanced with protections and enhancements. The 50-year Habitat Conservation Plan, expected to be completed in 2011, outlines steps to avoid or minimize impacts to these species, obtain permits and mitigate for impacts where they are forecasted, and promote habitat conservation on public and private lands. The plan also contains a Prairie Conservation Strategy, which guides voluntary conservation actions for these and other at-risk species.
Because public support for this plan will be important for its long-term success, the County held several public meetings as well as consultations with stakeholder and technical groups (Benton County, Oregon 2010). Stake-holders included federal, state, county, city, and university representatives as well as private landowners, watershed councils, and natural resource groups; technical advi-sors included university professors and natural resource professionals with expertise in the relevant habitats and species. In addition, as contractors developing the plan, we conducted an online survey of local residents, land owners, and land managers that allowed us to quickly and inexpensively solicit input from diverse stakeholders who might not otherwise have engaged in the process. While personal interviews can provide greater understanding of the motivations of landowners to conserve species (Fischer and Bliss 2008), online surveys provide convenience and anonymity to respondents, while allowing researchers to survey large groups at a low cost (Wright 2005). The goals of our survey were to gauge public receptivity to conser-vation on public and private lands, identify obstacles to private landowner engagement, and identify and develop tools for effective conservation of species in the region.
The survey was sent via email on June 3, 2009, to 230 recipients through a local watershed council’s membership list ( primarily private landowners); 150 land management professionals through a Cooperative Weed Management Area; and 74 private landowners in an area with high-qual-ity remnant prairies and federally protected prairie species through a local community group. Some recipients may have been contacted twice because they were in more than one of these groups. This allowed us to reach a large but local group of private landowners and land managers. Also, the survey format allowed us to ask specific questions and solicit rankings of ideas from a large group in a manner not easily accomplished in the setting of a public meeting. The survey concluded on July 1, 2009 after about four weeks.
We used SurveyMonkey (www.surveymonkey.com), an online survey administration tool. The survey was designed to take ten minutes or less to complete and consisted of ten questions divided into five sections: 1) background information about the planning process; 2) survey respon-dent information; 3) respondent interest in species/habitat conservation; 4) strategy development (understanding of regulations and ranking of plan goals); and 5) conservation tools (Institute for Applied Ecology 2009). Respondents were invited to write in ideas and comments.
We received 132 completed anonymous surveys (response rate ≥ 29%), and 92 respondents identified them-selves as Benton County residents. Of these, 51 described themselves as rural landowners in Benton County, 33 as landowners inside city limits in Benton County, and the remainder did not identify as landowners. Twenty-one respondents identified themselves as Public or NGO land managers. To inform our planning process, we compared
March/June 2011 Ecological REstoRation 29:1–2 • 11
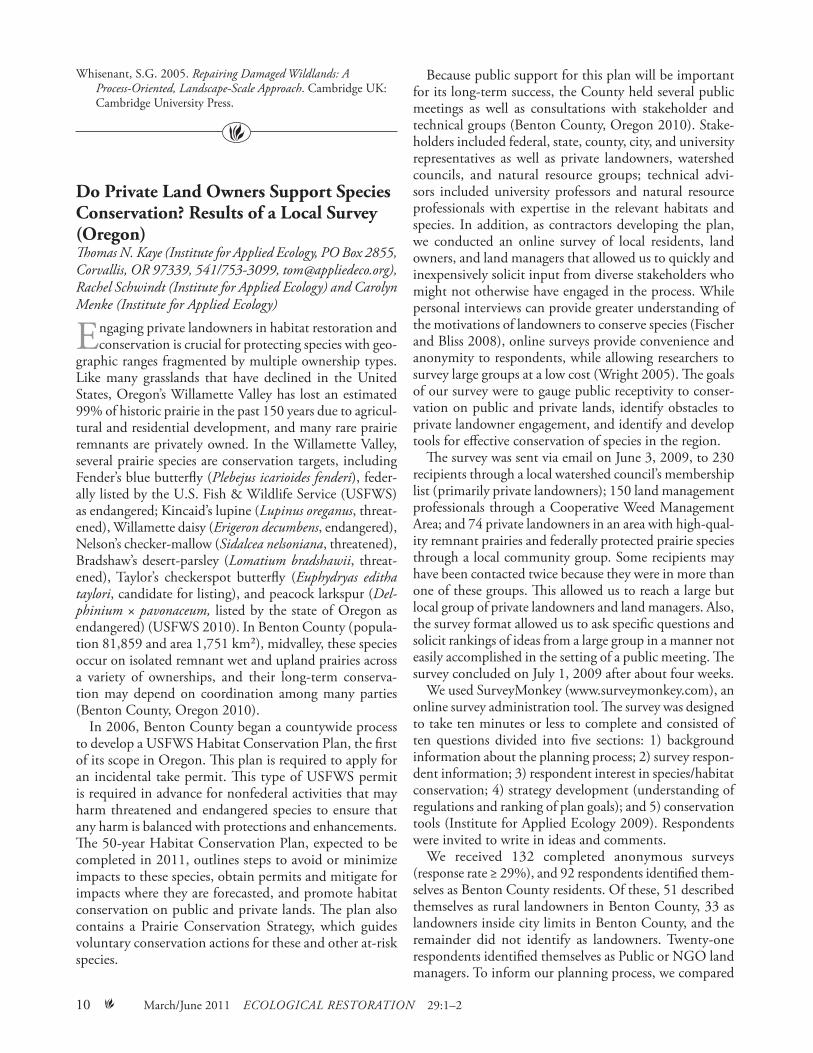
Table 1. Survey results for selected questions used to solicit feedback from rural landowners and others about spe-cies and habitat conservation on public and private lands (see Institute for Applied Ecology 2009 for more detailed findings).
Survey Question Rural Landowners OthersWhich type of land ownership should be emphasized for habitat conservation in Benton County?
Public land only 16% 1%Private land only 0% 0%Both, with emphasis on public land 33% 27%Both, with emphasis on private land 4% 6%Whichever mix meets habitat conservation needs best 41% 62%
I am interested in habitat conservation on my property.Yes 73% 36%No 14% 7%No opinion 14% 57%
Would you be interested in creating or enhancing habitat for species that are not listed as endangered but have conservation value on your private property (example: prairies for western meadowlark)?
Yes 51% 69%Maybe 29% 5%No 14% 6%No opinion 6% 20%
Are you willing to provide habitat for endangered species on your property, and does your willingness depend on how regulations are applied?
Yes, regardless of regulations 6% 21%
Yes, provided regulators are flexible and work collaboratively with me on how I manage my land
43% 46%
Yes, if their presence does not affect how I can manage my land (I don’t want to work with regulators)
31% 4%
Maybe (I need more information, I’m unsure, etc.) 4% 7%No, not under any circumstances 8% 4%No opinion 8% 19%
Did you know that under federal and state law, threatened and endangered animals are protected on private lands but plants usually are not?
Yes 53% 69%No 41% 25%No opinion 6% 6%
If seeds of rare or endangered plants were available to you, along with instructions on how to grow them, would you be interested in planting them on your property?
Yes, regardless of regulations 16% 37%
Yes, provided regulators are flexible and work collaboratively with me on how I manage my land
29% 37%
Yes, if their presence does not affect how I can manage my land (I don’t want to work with regulators)
27% 6%
Maybe (I need more information, I’m unsure, etc.) 10% 5%No, not under any circumstances 10% 2%No opinion 8% 12%
responses between rural Benton County landowners and all other respondents (Table 1).
Most survey respondents supported conservation on private land, but landowners were cautious about working with regulators. Of self-identified rural landowners, a high percentage (73%) were interested in habitat conservation on their own property. When probed further, 80% were definitely (51%) or maybe (29%) interested in creating habitat for species not listed under federal endangered species laws. These landowners were more cautious about
providing habitat for federally listed species. Even so, 43% would provide habitat for federally listed species if regula-tors were willing to be flexible and work with the land-owner, and an additional 31% would if they did not have to work with regulators and there would be no restrictions on their future land management.
This encouraging response concurred with other com-ments received during the planning process and led to innovations within the Habitat Conservation Plan that lessen regulatory disincentives for conservation of Fender’s

12 • March/June 2011 Ecological REstoRation 29:1–2
blue butterflies on private lands. For example, the plan allows ongoing historic land management activities, like livestock grazing, to continue in areas with endangered butterflies. Also, if butterflies establish new populations on properties near restoration sites, the neighbor will not be required to protect the colonizing animals. In addition, the plan includes an agency-endorsed strategy for providing seeds of endangered plants to private landowners—83% of rural respondents were interested or very interested in such a program to establish populations on their property.
During public meetings, we identified widespread mis-understanding of federal and state endangered species laws as an obstacle to public support for conservation on private lands. Only about half of rural landowners (53%) knew that federally listed plants are usually not protected on private lands, compared to 69% of other respondents. This may have been part of the reason that fewer rural landowners (16%) than others (37%) would plant seeds of endangered plants regardless of regulations and that 10% of rural landowners would not plant listed species at all. These results prompted us to provide a clearly worded explanation of endangered species regulations within the Prairie Conservation Strategy.
Relying on both public and private land for conserva-tion was favored by some respondents, but rural property owners were less likely to prefer an emphasis on private lands. When asked where habitat conservation should be emphasized, 41% of rural landowners preferred whatever mix of public and private is best for conservation and 33% preferred a mix with an emphasis on public lands, com-pared to 62% and 27% of other respondents, respectively. These responses resulted in a strategy document and mail-ings to residents explaining that habitat conservation part-nerships with private landowners were strictly voluntary and that, while countywide efforts would focus on public lands, private landowners were invited to participate to the extent they desired. Safe Harbor Agreements (USFWS 2009) are one tool to encourage landowners to restore habitats, and other innovations that do not include written agreements with government agencies may substantially increase public participation in conservation.
This survey provided clear rankings of tools and pro-grams for habitat conservation. Interests centered on access to educational materials with how-to tips for habitat conservation, clear information on federal/state regula-tions for endangered species for use on private lands, and access to seeds of endangered species on private lands. Half of the respondents identified financial incentives or cost sharing tools as good strategies to promote conservation, suggesting that cost is important but not the only factor in determining landowner participation. Also, 70% of all
respondents were interested or very interested in techni-cal assistance (developing project plans, guidance for implementation) for activities on private lands. Answers to these questions and written suggestions encouraged us to include how-to materials and links to local techni-cal and financial assistance programs within the Prairie Conservation Strategy.
Our results suggest that rural private property owners in our region are interested in habitat conservation and will-ing to support listed species conservation on their lands. Though the respondents were self-selected in that they chose to respond, results of this targeted survey helped planners prioritize conservation strategies emphasizing educational programs and materials for private landown-ers. Planning efforts that hinge on private landowner input may find that while online surveys have limitations, such surveys can solicit contributions from local citizens who would not normally engage in the planning process and can provide an opportunity for knowledge sharing.
AcknowledgmentsWe thank Karen Fleck-Harding for circulating this survey to the Mary’s River Watershed Council membership. Funding for this survey was provided by Benton County, Oregon, and Institute for Applied Ecology.
ReferencesBenton County, Oregon. 2010. Benton County prairie species
habitat conservation plan. Benton County Natural Areas and Parks Department. www.co.benton.or.us/parks/hcp/
Fischer, P. and J. Bliss. 2008. Behavioral assumptions of conservation policy: Conserving oak habitat on family-forest land in the Willamette Valley, Oregon. conservation Biology 22:275–283.
Institute for Applied Ecology. 2009. HCP prairie conservation strategy survey. Institute for Applied Ecology, Corvallis, Oregon. www.appliedeco.org/benton-county-habitat-conservation-plan/PCS_SurveySummary_07012009.pdf
U.S. Fish & Wildlife Service (USFWS). 2009. Safe harbor agreements for private landowners. U.S. Fish & Wildlife Service. www.fws.gov/ventura/endangered/safeharbors
___. 2010. Recovery Plan for the prairie species of western Oregon and southwestern Washington. Portland OR: U.S. Fish and Wildlife Service.
Wright, K.B. 2005. Researching internet-based populations: Advantages and disadvantages of online survey research, online questionnaire authoring software packages, and web survey services. Journal of computer-Mediated communication 10(3):article 11. http://jcmc.indiana.edu/vol10/issue3/wright.html
March/June 2011 Ecological REstoRation 29:1–2 • 13
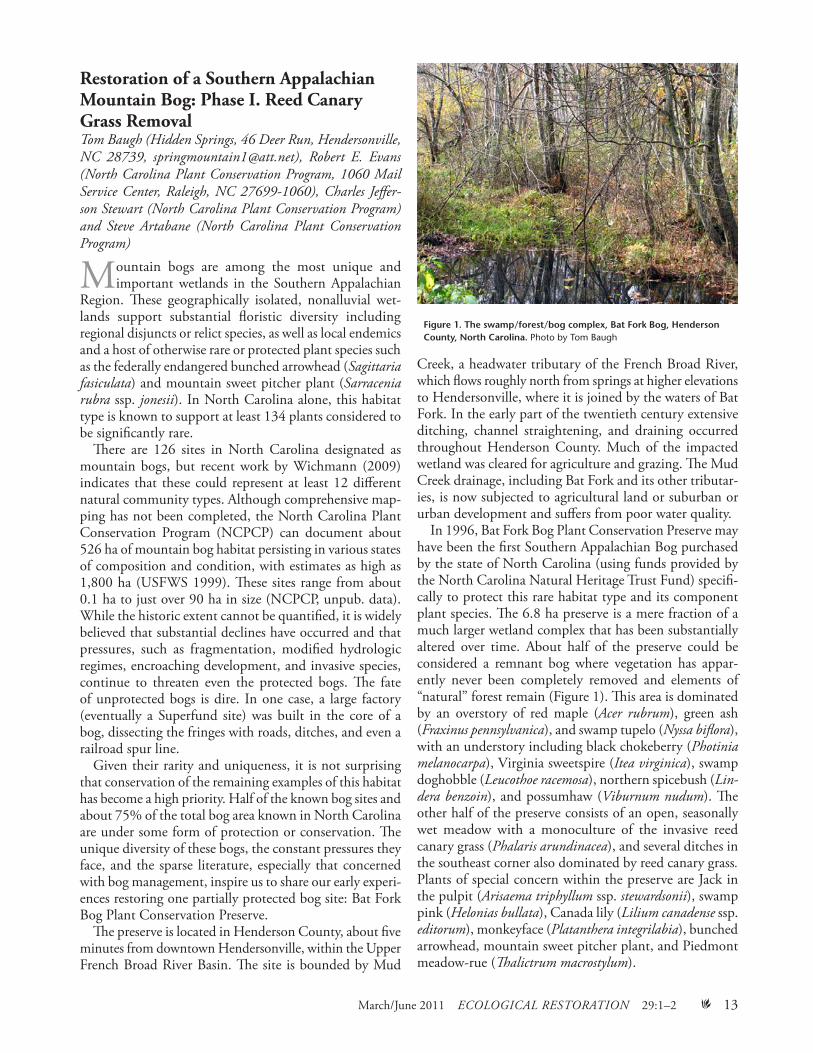
Restoration of a Southern Appalachian Mountain Bog: Phase I. Reed Canary Grass Removaltom Baugh (Hidden springs, 46 Deer Run, Hendersonville, nc 28739, [email protected]), Robert E. Evans (north carolina Plant conservation Program, 1060 Mail service center, Raleigh, nc 27699-1060), charles Jeffer-son stewart (north carolina Plant conservation Program) and steve artabane (north carolina Plant conservation Program)
Mountain bogs are among the most unique and important wetlands in the Southern Appalachian
Region. These geographically isolated, nonalluvial wet-lands support substantial floristic diversity including regional disjuncts or relict species, as well as local endemics and a host of otherwise rare or protected plant species such as the federally endangered bunched arrowhead (sagittaria fasiculata) and mountain sweet pitcher plant (sarracenia rubra ssp. jonesii). In North Carolina alone, this habitat type is known to support at least 134 plants considered to be significantly rare.
There are 126 sites in North Carolina designated as mountain bogs, but recent work by Wichmann (2009) indicates that these could represent at least 12 different natural community types. Although comprehensive map-ping has not been completed, the North Carolina Plant Conservation Program (NCPCP) can document about 526 ha of mountain bog habitat persisting in various states of composition and condition, with estimates as high as 1,800 ha (USFWS 1999). These sites range from about 0.1 ha to just over 90 ha in size (NCPCP, unpub. data). While the historic extent cannot be quantified, it is widely believed that substantial declines have occurred and that pressures, such as fragmentation, modified hydrologic regimes, encroaching development, and invasive species, continue to threaten even the protected bogs. The fate of unprotected bogs is dire. In one case, a large factory (eventually a Superfund site) was built in the core of a bog, dissecting the fringes with roads, ditches, and even a railroad spur line.
Given their rarity and uniqueness, it is not surprising that conservation of the remaining examples of this habitat has become a high priority. Half of the known bog sites and about 75% of the total bog area known in North Carolina are under some form of protection or conservation. The unique diversity of these bogs, the constant pressures they face, and the sparse literature, especially that concerned with bog management, inspire us to share our early experi-ences restoring one partially protected bog site: Bat Fork Bog Plant Conservation Preserve.
The preserve is located in Henderson County, about five minutes from downtown Hendersonville, within the Upper French Broad River Basin. The site is bounded by Mud
Creek, a headwater tributary of the French Broad River, which flows roughly north from springs at higher elevations to Hendersonville, where it is joined by the waters of Bat Fork. In the early part of the twentieth century extensive ditching, channel straightening, and draining occurred throughout Henderson County. Much of the impacted wetland was cleared for agriculture and grazing. The Mud Creek drainage, including Bat Fork and its other tributar-ies, is now subjected to agricultural land or suburban or urban development and suffers from poor water quality.
In 1996, Bat Fork Bog Plant Conservation Preserve may have been the first Southern Appalachian Bog purchased by the state of North Carolina (using funds provided by the North Carolina Natural Heritage Trust Fund) specifi-cally to protect this rare habitat type and its component plant species. The 6.8 ha preserve is a mere fraction of a much larger wetland complex that has been substantially altered over time. About half of the preserve could be considered a remnant bog where vegetation has appar-ently never been completely removed and elements of “natural” forest remain (Figure 1). This area is dominated by an overstory of red maple (acer rubrum), green ash (Fraxinus pennsylvanica), and swamp tupelo (nyssa biflora), with an understory including black chokeberry (Photinia melanocarpa), Virginia sweetspire (itea virginica), swamp doghobble (leucothoe racemosa), northern spicebush (lin-dera benzoin), and possumhaw (Viburnum nudum). The other half of the preserve consists of an open, seasonally wet meadow with a monoculture of the invasive reed canary grass (Phalaris arundinacea), and several ditches in the southeast corner also dominated by reed canary grass. Plants of special concern within the preserve are Jack in the pulpit (arisaema triphyllum ssp. stewardsonii), swamp pink (Helonias bullata), Canada lily (lilium canadense ssp. editorum), monkeyface (Platanthera integrilabia), bunched arrowhead, mountain sweet pitcher plant, and Piedmont meadow-rue (Thalictrum macrostylum).
Figure 1. The swamp/forest/bog complex, Bat Fork Bog, Henderson County, North Carolina. Photo by Tom Baugh

14 • March/June 2011 Ecological REstoRation 29:1–2
Although there are a number of invasive species on the preserve, the major task of Phase I of the restoration of Bat Fork Bog has been removing reed canary grass and halting its spread into as yet uninfested areas. This peren-nial species forms a dense root mat that appears to exclude nearly all other species of vegetation and grows to heights exceeding 2.5 m.
For reed canary grass control, glyphosate (Accord) was applied to uncut flowering stems at a rate of 395 L/ha (53.8% a.i.) between June 30 and July 21, 2010, resulting in near complete treatment of the wet meadow. We used a small boom sprayer mounted on an all-terrain vehicle to broadcast the herbicide in the monoculture. In transi-tion zones adjacent to the swamp-forest-bog complex, and around islands of native vegetation, we cut the grass culms, allowed the grass to regrow to about 50 cm, and then sprayed the new growth using backpack and handheld sprayers (Figure 2). This allowed a more precise applica-tion of the herbicide, where required to protect native vegetation. Small infestations of reed canary grass that had penetrated the interior of the forested area were either removed by hand or sprayed with a handheld sprayer. With preliminary treatment completed, we will closely monitor the site for resprouts, seedling emergence, or surviving patches. The results so far have been very promising with a near complete kill of the grass in those areas sprayed (Figure 2).
The initial stages of restoration are expected to take 12–18 months; by then, reed canary grass should be sig-nificantly reduced. The removal of much of the grass has allowed us to more carefully study and understand the hydrology of the preserve and, equally importantly, the intent of the original owner to drain the land. Baugh and Evans (2011) report on Phase II, the strategies for restor-ing the topography of the site and its hydrology. Within three years, we hope to provide a complete report on the removal of invasive vegetation, the restoration of hydrol-ogy, and the beginnings of revegetation of areas reclaimed from reed canary grass.
ReferencesBaugh, T. and R. Evans. 2011. Bat Fork Bog Plant Conservation
Preserve: Phase II. Hydrology. natural areas Journal 31:501–504.
U.S. Fish & Wildlife Service (USFWS). 1999. Mountain bogs. www.fws.gov/southeast/pubs/mtbog.pdf
Wichmann, B.L. 2009. Vegetation of geographically isolated montane non-alluvial wetlands of the Southern Blue Ridge of North Carolina. MS thesis, North Carolina State University. www.lib.ncsu.edu/resolver/1840.16/661
Long-Term Effects of Initial Site Treatment on Fescue in a Novel Prairie Ecosystem (Washington)nate Hough-snee (University of Washington school of Forest Resources and UW Botanic gardens, Box 354115, seattle, Wa 98195-4115, [email protected]), Jonathan D. Bakker (University of Washington school of Forest Resources and
Figure 2. Efforts to eliminate reed canary grass (Phalaris arundinacea) at Bat Fork Bog. Cutting when it is adjacent to sensitive areas (top), such as islands of native vegetation, and then spraying it as it regrows and reaches about 50 cm, helps maintain careful control and protects the native vegetation. Broadcast spraying in the seasonally flooded open meadow (bottom) resulted in at least 95% control several weeks after spraying. Photos by Tom Baugh
March/June 2011 Ecological REstoRation 29:1–2 • 15
UW Botanic gardens, [email protected]) and Kern Ewing (University of Washington school of Forest Resources and UW Botanic gardens, [email protected])
In prairie restoration, site preparation is a key step in altering environmental conditions to favor the establish-
ment of desirable plants over invasive species. Initial site preparation is especially important in restoration scenarios where resources may not exist for follow-up treatments and consistent maintenance. In the Pacific Northwest, for example, prairie restoration commonly involves practices such as prescribed fire, herbicide application, and manual vegetation removal before native species are planted or seeded (Sinclair et al. 2006). Despite the common use of these methods (e.g., Barnes 2004), how effectively single treatment events perpetuate desired vegetation over long timeframes has not been adequately evaluated.
In 2008, we revisited prairie plots restored in 1994 to examine the long-term impacts of initial site treatments on the survival and expansion of planted fescues (Festuca spp.). We focused our study on the perennial bunchgrass, Idaho fescue (Festuca idahoensis), because it is a fire-tolerant keystone prairie species and stress tolerator that can survive in nutrient poor soils with low moisture. Idaho fescue is common throughout Puget Sound lowland prairies and has also responded favorably to reintroduction at prairie restorations near our research site and within the Union Bay Natural Area (UBNA) in Seattle, Washington.
As part of the University of Washington Botanic Gar-dens, UBNA is presently managed as a public green space of grasslands, forests and wetlands that provide valuable research and demonstration sites. It is a former landfill that
was retired in 1966 and in 1971 was graded, capped with a dense aggregate of nutrient- and organic matter-poor clay and gravel, and seeded with a mixture of predominantly rhizomatous pasture grasses (Kentucky bluegrass [Poa pratensis], Canada bluegrass [Poa compressa], tall fescue [schedonorus arundinaceus], and sweet vernalgrass [antho-xanthum odoratum], among others) to reduce erosion. Some forbs have been planted or colonized since retirement (Ewing 2002b), but they currently make up a small com-ponent (<3% in 2008) of vegetation. Soil properties are similar to native prairies: nitrate levels are low (2–11 ppm in 1994; Ewing 2002a, 2002b), while soil moisture declines throughout the growing season as spring rains dissipate (Ewing 2002a). The location, soil properties, and non-native-dominated grass community make UBNA an ideal site to examine the effectiveness of techniques to restore bunchgrass communities similar to local Puget Sound prairies. Due to limited institutional resources, restored ecosystems at UBNA receive minimal maintenance, often limited to Himalayan blackberry (Rubus discolor) removal and noxious weed control with herbicide; within our plots, only blackberry removal occurred. A full site description is provided by Ewing (2002a, 2002b).
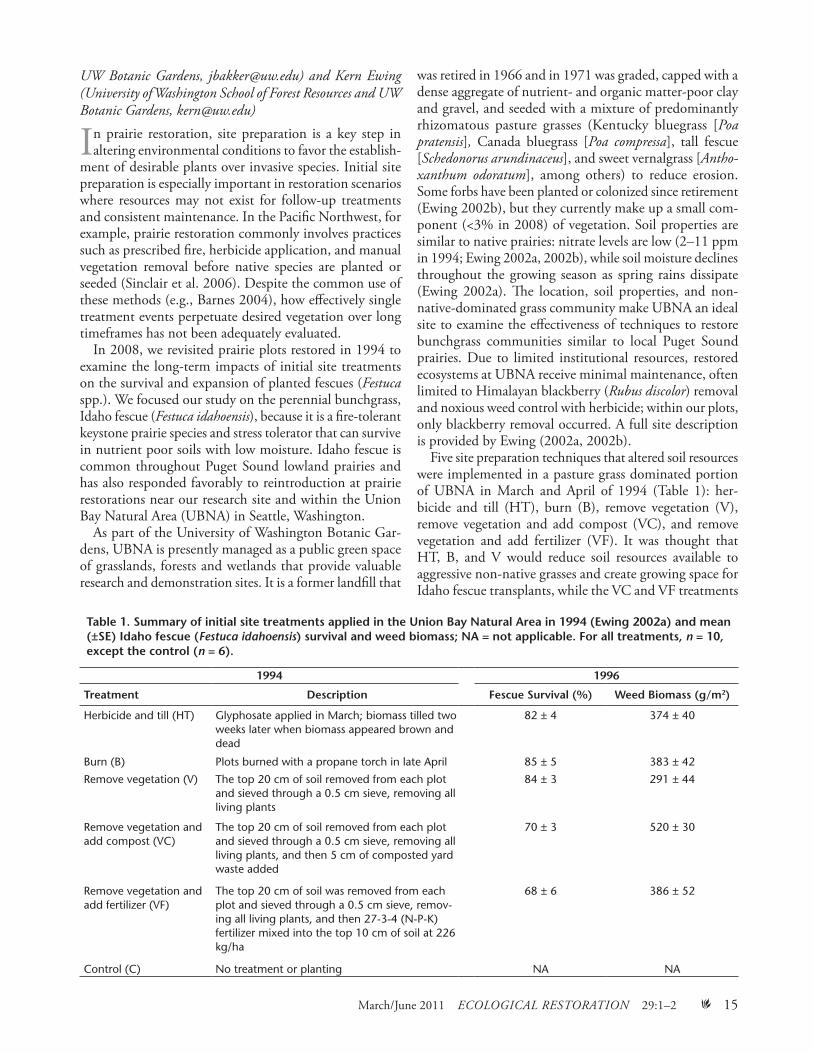
Five site preparation techniques that altered soil resources were implemented in a pasture grass dominated portion of UBNA in March and April of 1994 (Table 1): her-bicide and till (HT), burn (B), remove vegetation (V), remove vegetation and add compost (VC), and remove vegetation and add fertilizer (VF). It was thought that HT, B, and V would reduce soil resources available to aggressive non-native grasses and create growing space for Idaho fescue transplants, while the VC and VF treatments
Table 1. Summary of initial site treatments applied in the Union Bay Natural Area in 1994 (Ewing 2002a) and mean (±SE) Idaho fescue (Festuca idahoensis) survival and weed biomass; NA = not applicable. For all treatments, n = 10, except the control (n = 6).
1994 1996
Treatment Description Fescue Survival (%) Weed Biomass (g/m2)
Herbicide and till (HT) Glyphosate applied in March; biomass tilled two weeks later when biomass appeared brown and dead
82 ± 4 374 ± 40
Burn (B) Plots burned with a propane torch in late April 85 ± 5 383 ± 42
Remove vegetation (V) The top 20 cm of soil removed from each plot and sieved through a 0.5 cm sieve, removing all living plants
84 ± 3 291 ± 44
Remove vegetation and add compost (VC)
The top 20 cm of soil removed from each plot and sieved through a 0.5 cm sieve, removing all living plants, and then 5 cm of composted yard waste added
70 ± 3 520 ± 30
Remove vegetation and add fertilizer (VF)
The top 20 cm of soil was removed from each plot and sieved through a 0.5 cm sieve, remov-ing all living plants, and then 27-3-4 (N-P-K) fertilizer mixed into the top 10 cm of soil at 226 kg/ha
68 ± 6 386 ± 52
Control (C) No treatment or planting NA NA

16 • March/June 2011 Ecological REstoRation 29:1–2
would increase the initial physiological performance of transplanted Idaho fescue by improving soil resources. Treatments were randomly allocated to 50 experimental plots (2 m × 2 m), ten per treatment. In May of 1994, 16 Idaho fescue plugs were planted in each plot, for a total of 800 plants. Six untreated, unplanted control (C) plots were interspersed among the experimental plots and were not analyzed by Ewing (2002a) with treated plots. Plots in which vegetation was removed (V, VC, VF, HT) all expe-rienced similar, minimal levels of soil disturbance; soil was relatively undisturbed in B and C plots. Although Idaho fescue was the focus of the original restoration, some of the plants appear to be red fescue (Festuca rubra), a native congener. Red fescue was also seeded onto the UBNA when the landfill was retired but is difficult to distinguish from Idaho fescue and may have been present in the seed from which the original transplants were grown (e.g., Dunwiddie and Delvin 2006).
Ewing (2002a) assessed the planted plots one to three years after planting. He measured weed biomass and Idaho fescue survival, growth and photosynthesis in year one, fescue growth and survival in year two, and weed biomass and fescue survival and growth in year three. Plots where vegetation was removed and compost was added (VC) had the highest year-one photosynthesis of Idaho fescue but also yielded the most aboveground weed biomass and lowest survival of Idaho fescue in year three. The short-term benefit of improving soil nutrition for transplanted plugs in year one was largely counteracted by the rapid recolonization and expansion of non-native grasses in the following years. Ewing (2002a) concluded that treatments that create a stressful planting environment (HT, B, V) can
reduce the competitive advantage of aggressive non-native grasses and enable Idaho fescue to survive and be more competitive (e.g., Baer et al. 2003).
For our follow-up study, we collected data in 2008 and 2010. In May 2008, we measured the relative cover of all graminoids within each plot to see how vegeta-tion communities had changed over time. We pooled the covers of Idaho fescue and red fescue for these analyses. In June 2008, we measured soil volumetric water content in all plots to determine whether patterns of fescue cover were related to moisture availability, the limiting resource throughout summer in UBNA (Ewing 2002b). We per-formed an analysis of covariance (ANCOVA) on fescue cover, using 2008 soil moisture as a covariate and initial site treatment (including the control) as a factor. We used Fisher’s least significant difference to identify significant differences between treatments. Since the relative cover of all species surveyed in 2008 summed to 100%, the patterns and results for non-native grasses are not reported; they account for virtually all of the relative cover that was not fescue and so their abundance is the difference between the fescue cover and 100%.
In July of 2010, to distinguish treatment effects on the original planted fescue from expansion within plots, we counted the number of original fescue planting locations that still contained Idaho fescue. We used this count to calculate fescue density, the proportion of the initial 16 plants remaining within the original planting grid. We also overlaid this grid on the unplanted controls to quantify expansion of Idaho fescue into these plots. We conducted an ANOVA for fescue density using site treatment as a factor. We did not use soil moisture as a covariate within
Figure 1. Mean (± SE) relative cover of Idaho (Festuca idahoensis) and red (F. rubra) fescue in 2008 (left) and density (right) in 2010 as a function of 1994 site treatment; see Table 1 for abbreviations. Note that the control group (C) was not planted, but fescue has established in it since 1994. Dif-ferent letters indicate treatments that differ significantly (left); mean density (right) did not differ between treatments.

March/June 2011 Ecological REstoRation 29:1–2 • 17
this analysis due to the lag times between soil moisture and 2010 density measurements.
In spite of the minimal maintenance at this site, fescue is a substantial component of the vegetation today. Fescue cover in 2008 differed significantly among site treatments ( p = 0.0484) and was not related to soil moisture ( p = 0.153), whereas planted fescue density in 2010 did not differ among site treatments. Sites that received initial additions of organic matter or fertilizer (VC, VF) had the lowest fescue cover and density (Figure 1). The B treatment, which did not disturb the soil, had the highest fescue cover and second highest fescue density. Fescue cover and density were intermediate in the treatment where all vegetation was removed from the soil (V). The HT treatment was intended to create a stressful planting environment but appears to have had a temporary effect, as fescue cover was low and did not differ from that in the VF or VC treatments.
While the long-term survival and expansion of fescue in planted plots is notable given the minimal post-planting maintenance that they have received, the most important result of this study is that the unplanted control (C) plots had the second highest fescue cover and highest density. In spite of the overall dominance of the vegetation by non-native grasses, fescue obviously was able to success-fully disperse from treatment plots and establish within control plots. The similarities in fescue cover between C and B plots confirms Ewing’s (2002a) conclusion that treatments that do not enrich or add organic matter to the soil may improve fescue survival more than treatments in which vegetation is removed and soils amended (HT, VC, VF). Furthermore, we have anecdotally noted that fescue has spread 8 m west of and 5 m north of the experimental plots into the surrounding untreated vegetation matrix.
When planted into nutrient-poor environments (B and V treatments), fescue has persisted for at least 17 years in spite of the presence of abundant non-native grasses and a lack of postplanting management. While organic matter amendments and fertilization (VC and VF treatments) assisted in the initial performance of Idaho fescue (Ewing 2002a), they hindered its long-term survival and expe-dited colonization by weedy grasses. Plots without added organic matter or fertilizer showed the highest density and abundances of fescue and the lowest abundances of weeds. We suggest that soil impoverishment may be important for long-term bunchgrass survival (e.g., Baer et al. 2003) and may alter the competitive balance such that species like fescue are able to expand into areas dominated by aggressive non-native species such as our control plots. Incorporating organic matter as tillage (HT treatment) was beneficial in the short term but not after 14 years. This result differs from the recommendations of Barnes (2004), Ewing (2002a) and Pokorny and Mangold (2009), who saw increased bunchgrass growth and reduced weed presence in the short term following herbicide application. To enhance fescue plantings and reduce invasive weeds over the long
term, we recommend the use of fire and plant removal as site preparation treatments. We also encourage research into soil impoverishment as a means of lowering nutrient availability and giving fescue a competitive advantage.
AcknowledgmentsWe thank Royce Hale for collecting 2008 field data and performing preliminary data analyses and Chris Reyes for her comments on an early draft of this manuscript.
ReferencesBaer, S.G., J.M. Blair, S.L. Collins and A.K. Knapp. 2003.
Soil resources regulate productivity and diversity in newly established tallgrass prairie. Ecology 84:724–735.
Barnes, T.G. 2004. Strategies to convert exotic grass pastures to tall grass prairie communities. Weed technology 18:1364–1370.
Dunwiddie, P. and E. Delvin. 2006. Inadvertent selection in the propagation of native plants: A cautionary note. native Plants Journal 7:121–124.
Ewing, K. 2002a. Effects of initial site treatments on early growth and three-year survival of Idaho fescue. Restoration Ecology 10:282–288.
___. 2002b. Mounding as a technique for a restoration of prairie on a capped landfill in the Puget Sound lowlands. Restoration Ecology 10:289–296.
Pokorny, M.L. and J.M. Mangold. 2009. Converting pastureland to native plant–dominated grassland: A case study (Montana). Ecological Restoration 27:250–253.
Sinclair, M., E. Alverson, P. Dunn, P. Dunwiddie and E. Gray. 2006. Bunchgrass prairies. Pages 29–62 in D. Apostol and M. Sinclair (eds), Restoring the Pacific northwest. Washington DC: Island Press.
Testing Carbon Amendments in a Future Prairie Restoration Site (Illinois)Brenda Molano-Flores (illinois natural History survey, 1816 south oak st, champaign, il 61820, [email protected]) and Helen Mlynarski (Dept of natural Resources and Environmental sciences, University of illinois, W-503 turner Hall, 1102 south goodwin ave, Urbana, il 61801)
Prairie restorations are often conducted in areas that were once croplands. Unfortunately soils in former
croplands can be very high in nitrogen (N), encourag-ing weed growth. Weeds can out compete native species, delaying or even precluding their reestablishment, thus hampering prairie restoration. For this reason, the use of carbon (C) amendments (adding organic matter such as sugar or sawdust to the soil) has been suggested. The organic matter stimulates soil microbes, causing them to accumulate nitrogen in their biomass, thus making it unavailable to plants. As a result, species richness and
18 • March/June 2011 Ecological REstoRation 29:1–2
cover of weedy species should decrease and more bare ground should be available for the emergence of native species.
Amendments with a high carbon-to-nitrogen ratio (C/N) have been recommended for immobilizing nitro-gen (nitrate [NO3] and ammonium [NH4]). Thus most carbon amendment studies in prairie restorations have used sawdust and sugar or straw as the organic matter (e.g., Blu-menthal et al. 2003), while alternative sources such as leaf mold, soybean hulls, and brewery waste products (spent grains) have received little attention. The aim of this study was to investigate how five carbon amendments with C/N ratios ranging from 863 to 12 would impact the emergence of nitrophilic weeds in a future prairie restoration site.
In May 2006, 30 plots (1 m2), each separated by a 0.5 m buffer strip, were established in an agricultural field at Midewin National Tallgrass Prairie (Will County, Illinois). The field was farmed for nearly 30 years in a corn/wheat/soybean rotation. In June 2006, each carbon amendment was randomly assigned to five plots and manually tilled into the soil; five control plots were also tilled without receiving any amendments. Each 1 m2 plot received one of the following amendments: 2.2 kg of sawdust ( pine shavings) and 4.5 kg of white sugar (%C = 43.13; %N = 0.05; C/N = 863); 4.1 kg of aged straw (more than two years postharvest; %C = 43.48; %N = 1.79; C/N = 24); 7.3 kg of dry soybean hulls (%C = 41.88; %N = 2.19; C/N = 19); 7.3 kg of leaf mold (%C = 37.95; %N = 2.14; C/N = 18); or 7.3 kg of brewery waste products (%C = 47.52; %N = 4.04; C/N = 12), which were cooled by air-drying for two days before being incorporated into the soil.
To determine %C, %N, and C/N ratios, carbon amend-ment samples were dried, ground, and analyzed using an ECS 4010 CHNSO Analyzer (Costech Analytical, Valencia CA). Soil samples were collected from each plot before (early June) and after (October) the carbon amend-ments were established to determine soil nitrate (NO3) and ammonium (NH4) levels. These are the two most common forms of plant-available nitrogen, and their immobilization varies in response to soil microbial activity. All soil analyses were performed by A&L Great Lakes Laboratories, Fort Wayne, Indiana.
In September 2006, species richness and vegetation cover were recorded for each plot. Vegetative cover was estimated using a modified Daubenmire method for the following classes: herbaceous plants, grasses, forbs, woody plants, comprehensive (all species), and bare ground. Vegetation data were analyzed using one-way ANOVAs and Tukey’s post hoc tests. Because the number of woody species was minimal in the plots, this parameter was not analyzed. We used two-way ANOVAs followed by Tukey’s post hoc tests to compare soil nitrogen (NO3 and NH4) levels before and after carbon amendments were established. All sta-tistical analyses were conducted using SYSTAT 13 (Systat Software, Inc., Chicago IL).
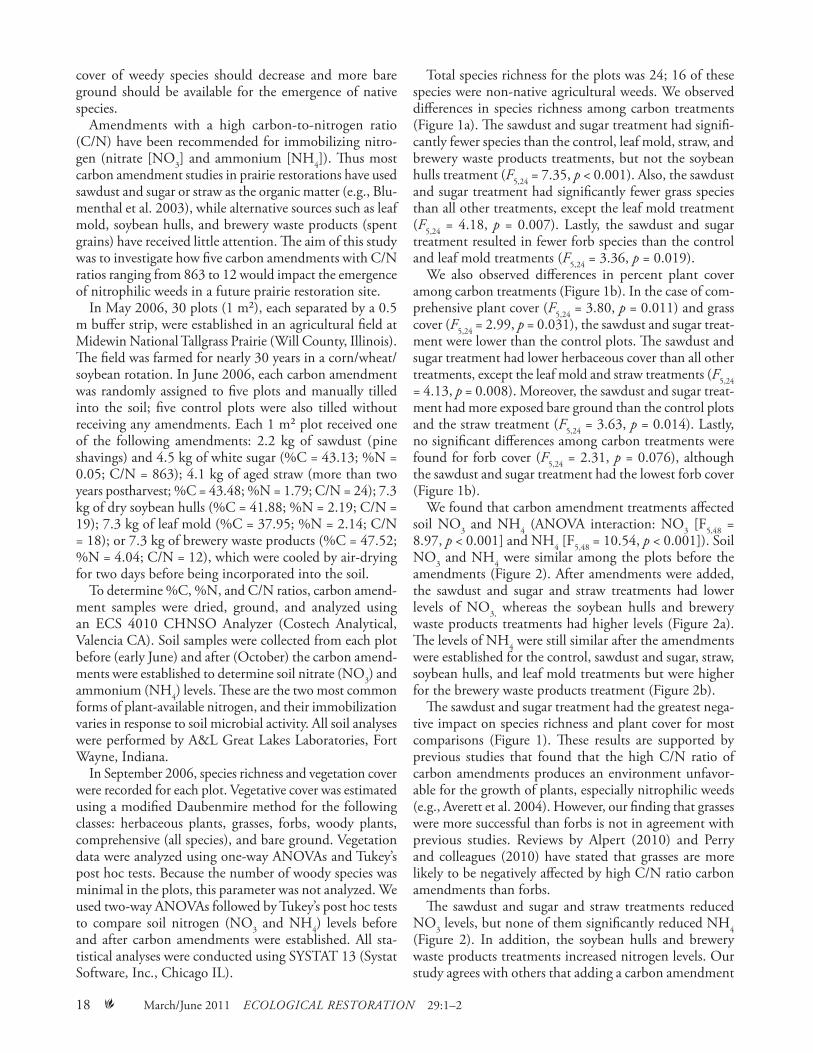
Total species richness for the plots was 24; 16 of these species were non-native agricultural weeds. We observed differences in species richness among carbon treatments (Figure 1a). The sawdust and sugar treatment had signifi-cantly fewer species than the control, leaf mold, straw, and brewery waste products treatments, but not the soybean hulls treatment (F5,24 = 7.35, p < 0.001). Also, the sawdust and sugar treatment had significantly fewer grass species than all other treatments, except the leaf mold treatment (F5,24 = 4.18, p = 0.007). Lastly, the sawdust and sugar treatment resulted in fewer forb species than the control and leaf mold treatments (F5,24 = 3.36, p = 0.019).
We also observed differences in percent plant cover among carbon treatments (Figure 1b). In the case of com-prehensive plant cover (F5,24 = 3.80, p = 0.011) and grass cover (F5,24 = 2.99, p = 0.031), the sawdust and sugar treat-ment were lower than the control plots. The sawdust and sugar treatment had lower herbaceous cover than all other treatments, except the leaf mold and straw treatments (F5,24 = 4.13, p = 0.008). Moreover, the sawdust and sugar treat-ment had more exposed bare ground than the control plots and the straw treatment (F5,24 = 3.63, p = 0.014). Lastly, no significant differences among carbon treatments were found for forb cover (F5,24 = 2.31, p = 0.076), although the sawdust and sugar treatment had the lowest forb cover (Figure 1b).
We found that carbon amendment treatments affected soil NO3 and NH4 (ANOVA interaction: NO3 [F5,48 = 8.97, p < 0.001] and NH4 [F5,48 = 10.54, p < 0.001]). Soil NO3 and NH4 were similar among the plots before the amendments (Figure 2). After amendments were added, the sawdust and sugar and straw treatments had lower levels of NO3, whereas the soybean hulls and brewery waste products treatments had higher levels (Figure 2a). The levels of NH4 were still similar after the amendments were established for the control, sawdust and sugar, straw, soybean hulls, and leaf mold treatments but were higher for the brewery waste products treatment (Figure 2b).
The sawdust and sugar treatment had the greatest nega-tive impact on species richness and plant cover for most comparisons (Figure 1). These results are supported by previous studies that found that the high C/N ratio of carbon amendments produces an environment unfavor-able for the growth of plants, especially nitrophilic weeds (e.g., Averett et al. 2004). However, our finding that grasses were more successful than forbs is not in agreement with previous studies. Reviews by Alpert (2010) and Perry and colleagues (2010) have stated that grasses are more likely to be negatively affected by high C/N ratio carbon amendments than forbs.
The sawdust and sugar and straw treatments reduced NO3 levels, but none of them significantly reduced NH4 (Figure 2). In addition, the soybean hulls and brewery waste products treatments increased nitrogen levels. Our study agrees with others that adding a carbon amendment

March/June 2011 Ecological REstoRation 29:1–2 • 19
can lower NO3 levels (Alpert 2010, Perry et al. 2010). Some researchers have found that the addition of a carbon amendment can lower NH4 levels, while others have found no reduction (Alpert 2010, Perry et al. 2010), as was the case in our study. Lastly, the increases of NO3 and NH4 associated with the soybean hulls and brewery waste products treatments may be linked to initially available inorganic N in the amendments that could have leaked into the soil, resulting in the higher NO3 and NH4 levels.
Impoverishing the soil with the right carbon amend-ments is an effective tool in prairie restoration efforts and the battle to reduce weed emergence. Our results did not support the use of alternative amendments with lower C/N ratios. If prairie restoration practitioners are looking for a carbon amendment that will reduce weedy species richness, weed plant cover, and nitrogen levels in former croplands, the sugar and sawdust amendment will produce the best outcomes.
AcknowledgmentsWe would like to thank the Midewin National Tallgrass Prairie for providing access to the study sites. Also we thank Connie Carroll Cunningham and Nick Owens for helping conduct the vegetation surveys, Michael Masters for C/N ratios and percent C and N deter-minations, and Mary Ann Feist for her helpful edits to improve this note. In addition, we would like to thank the Emmett’s Alehouse in Downers Grove, Illinois, and Morton Arboretum in Lisle, Illinois, for donating the brewery waste products and leaf mold.
ReferencesAlpert, P. 2010. Amending invasion with carbon: After fifteen
years, a partial success. Rangelands 32:12–15.Averett, J.M., R.A. Klips, L.E. Nave, S.D. Frey and P.S. Curtis.
2004. Effects of soil carbon amendment on nitrogen availability and plant growth in an experimental tallgrass prairie restoration. Restoration Ecology 12:568–574.
Blumenthal, D.M., N.R. Jordan and M.P. Russelle. 2003. Soil carbon addition controls weeds and facilitates prairie restoration. Ecological applications 13:605–615.
Perry, L.G., D.M. Blumenthal, T.A. Monaco, M.W. Paschke and E.F. Redente. 2010. Immobilizing nitrogen to control plant invasion. oecologia 163:13–24.
Figure 1. Mean (±SE) vegetation response to carbon amendments: a) species richness; b) percent plant cover. C = control, SS = sawdust and sugar, S = straw, SH = soybean hulls, LM = leaf mold, and BWP = brewery waste products. Comp = comprehensive, Herb = herbaceous, Bg = bare ground.
Figure 2. Mean (±SE) soil nitrogen levels in response to carbon amendments: a) NO3; b) NH4. C = control, SS = sawdust and sugar, S = straw, SH = soybean hulls, LM = leaf mold, and BWP = brewery waste products.
20 • March/June 2011 Ecological REstoRation 29:1–2
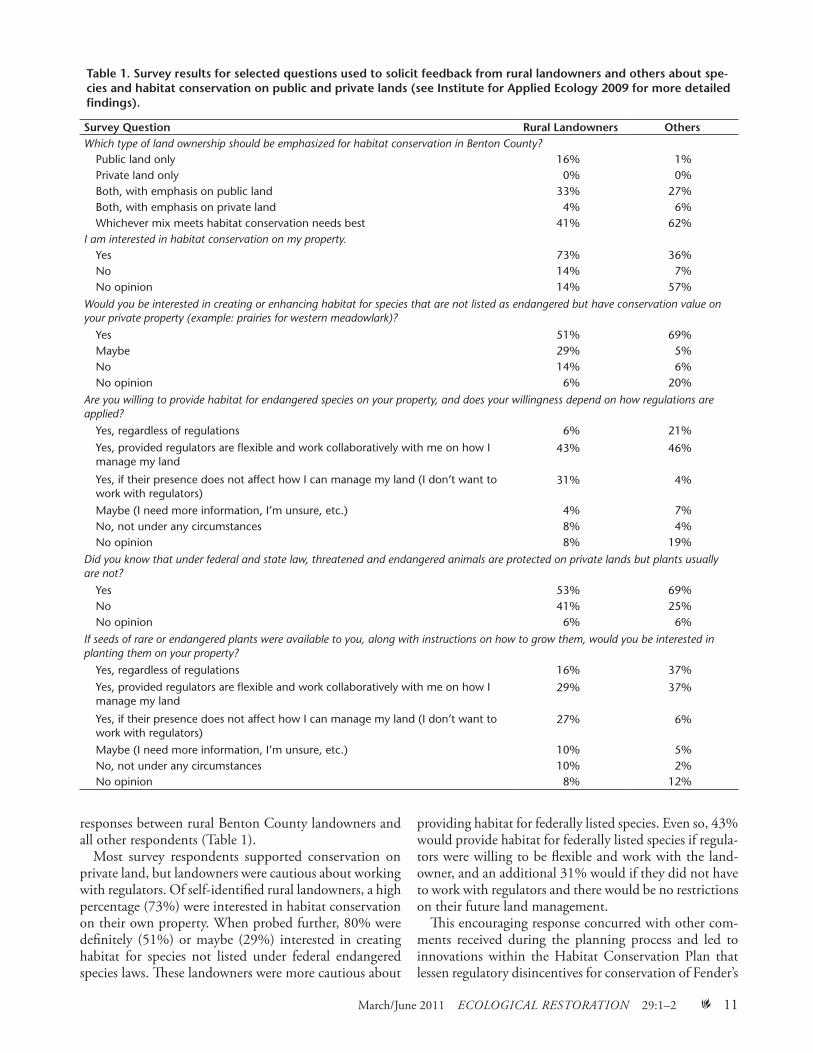
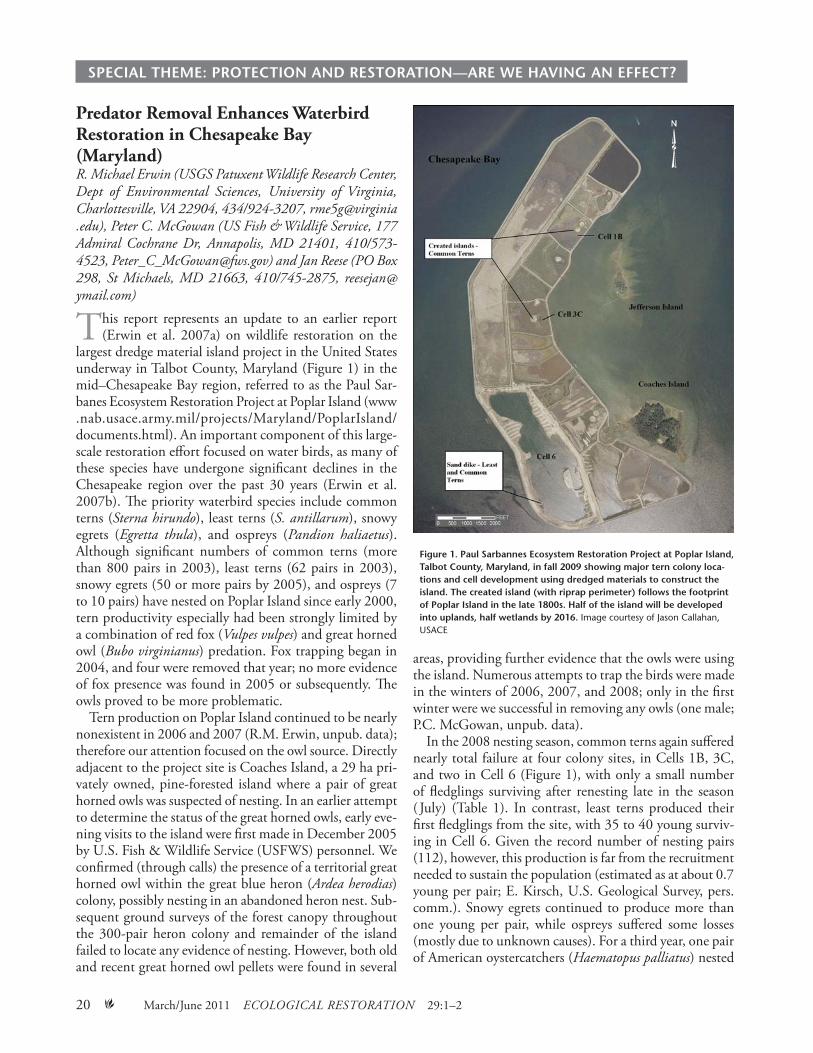
Figure 1. Paul Sarbannes Ecosystem Restoration Project at Poplar Island, Talbot County, Maryland, in fall 2009 showing major tern colony loca-tions and cell development using dredged materials to construct the island. The created island (with riprap perimeter) follows the footprint of Poplar Island in the late 1800s. Half of the island will be developed into uplands, half wetlands by 2016. Image courtesy of Jason Callahan, USACE
SPECIAL THEME: PROTECTION AND RESTORATION—ARE WE HAVINg AN EFFECT?
Predator Removal Enhances Waterbird Restoration in Chesapeake Bay (Maryland)R. Michael Erwin (Usgs Patuxent Wildlife Research center, Dept of Environmental sciences, University of Virginia, charlottesville, Va 22904, 434/924-3207, rme5g@virginia .edu), Peter c. Mcgowan (Us Fish & Wildlife service, 177 admiral cochrane Dr, annapolis, MD 21401, 410/573-4523, [email protected]) and Jan Reese (Po Box 298, st Michaels, MD 21663, 410/745-2875, [email protected])
This report represents an update to an earlier report (Erwin et al. 2007a) on wildlife restoration on the
largest dredge material island project in the United States underway in Talbot County, Maryland (Figure 1) in the mid–Chesapeake Bay region, referred to as the Paul Sar-banes Ecosystem Restoration Project at Poplar Island (www .nab.usace.army.mil/projects/Maryland/PoplarIsland/documents.html). An important component of this large-scale restoration effort focused on water birds, as many of these species have undergone significant declines in the Chesapeake region over the past 30 years (Erwin et al. 2007b). The priority waterbird species include common terns (sterna hirundo), least terns (s. antillarum), snowy egrets (Egretta thula), and ospreys (Pandion haliaetus). Although significant numbers of common terns (more than 800 pairs in 2003), least terns (62 pairs in 2003), snowy egrets (50 or more pairs by 2005), and ospreys (7 to 10 pairs) have nested on Poplar Island since early 2000, tern productivity especially had been strongly limited by a combination of red fox (Vulpes vulpes) and great horned owl (Bubo virginianus) predation. Fox trapping began in 2004, and four were removed that year; no more evidence of fox presence was found in 2005 or subsequently. The owls proved to be more problematic.
Tern production on Poplar Island continued to be nearly nonexistent in 2006 and 2007 (R.M. Erwin, unpub. data); therefore our attention focused on the owl source. Directly adjacent to the project site is Coaches Island, a 29 ha pri-vately owned, pine-forested island where a pair of great horned owls was suspected of nesting. In an earlier attempt to determine the status of the great horned owls, early eve-ning visits to the island were first made in December 2005 by U.S. Fish & Wildlife Service (USFWS) personnel. We confirmed (through calls) the presence of a territorial great horned owl within the great blue heron (ardea herodias) colony, possibly nesting in an abandoned heron nest. Sub-sequent ground surveys of the forest canopy throughout the 300-pair heron colony and remainder of the island failed to locate any evidence of nesting. However, both old and recent great horned owl pellets were found in several
areas, providing further evidence that the owls were using the island. Numerous attempts to trap the birds were made in the winters of 2006, 2007, and 2008; only in the first winter were we successful in removing any owls (one male; P.C. McGowan, unpub. data).
In the 2008 nesting season, common terns again suffered nearly total failure at four colony sites, in Cells 1B, 3C, and two in Cell 6 (Figure 1), with only a small number of fledglings surviving after renesting late in the season ( July) (Table 1). In contrast, least terns produced their first fledglings from the site, with 35 to 40 young surviv-ing in Cell 6. Given the record number of nesting pairs (112), however, this production is far from the recruitment needed to sustain the population (estimated as at about 0.7 young per pair; E. Kirsch, U.S. Geological Survey, pers. comm.). Snowy egrets continued to produce more than one young per pair, while ospreys suffered some losses (mostly due to unknown causes). For a third year, one pair of American oystercatchers (Haematopus palliatus) nested

March/June 2011 Ecological REstoRation 29:1–2 • 21
but suffered their first failure in 2008. A new nesting spe-cies, black-necked stilts (Himantopus mexicanus), colonized and produced two young from one nest. In the winter of 2009, U.S. Department of Agriculture and USFWS biolo-gists again made several trips to Coaches Island to try to remove the owls. Two male owls and one female (brood patch present) were removed during February and March. Subsequent trips to Coaches failed to detect any owls either visually or vocally.
The nesting season of 2009 revealed a marked improve-ment in tern nesting success, with least terns producing more than 1.5 young per pair in Cell 6 (Table 1). Although still below a recruitment level necessary to sustain the population, common terns produced many more young than they had previously, about 0.5 young per pair (mostly in the Cell 3C colony), while snowy egrets continued to produce at least one young per nesting pair. Even though osprey production essentially doubled from 2008 to 2009, we do not attribute this to an owl effect; in previous years (2005–2007) when owls were still depredating terns, osprey production approximated one fledgling per nesting pair (Reese 2006, 2007). The newly arrived black-necked stilts increased from one pioneering pair in 2008 to four in 2009, with two and eight fledglings noted, respectively.
These results suggest that even one or a few individual predators can greatly impact the success of some colonially nesting waterbirds. The two tern species may have been more vulnerable to both foxes and great horned owls because of their tendency to nest primarily in open, sandy habitats, and their large concentrations and vocalizations make them more conspicuous than egrets or osprey. Also, unlike the large raptorial osprey, the diminutive size of the terns presents no deterrent to a great horned owl. The tern response to owl encroachment at dusk is typically colony abandonment (Nisbet 1975).
To ensure the successful restoration of terns and other ground-nesting waterbirds at coastal locations, contin-ued annual monitoring and management appears to be necessary, albeit costly. Predator surveillance should be
implemented in the initial stages of the project to prevent several years of failed reproduction. Furthermore, from a regional landscape perspective, the long-term sustain-ability of these waterbird populations would be enhanced by having a number of alternative small nesting islands rather than having most of the population located at a single large site that may support predators (Erwin et al. 1998). For the past several years, Poplar Island has been the only site in the Maryland portion of the Chesapeake Bay supporting nesting common terns. The U.S. Army Corps of Engineers Baltimore District Office is in the process of planning two additional dredged material islands south of Poplar Island. These sites will also include habitat develop-ment for waterbirds and fish (A. Sowers, U.S. Army Corps of Engineers, pers. comm.).
AcknowledgmentsThe U.S. Army Corps of Engineers, Baltimore District and the Maryland Port Administration provided funding support for the work of the authors in their wildlife monitoring of the Paul S. Sar-banes Ecosystem Restoration Project at Poplar Island. We thank the Maryland Environmental Services personnel for providing logistic support while we are on the island. Field assistance was provided by C. Guy, U.S. Fish & Wildlife Service, P. Osenton, U.S. Geologi-cal Survey Patuxent Wildlife Research Center, and many interns and volunteers. The figure was provided by the U.S. Army Corps of Engineers. We appreciate the comments of B. Rattner and M. Kirwan of the U.S. Geological Survey Patuxent Wildlife Research Center on an earlier draft.
ReferencesErwin, R.M., J. Miller and J.G. Reese. 2007a. Poplar Island
Environmental Restoration Project: Challenges in waterbird restoration on an island in Chesapeake Bay. Ecological Restoration 25:256–262.
Erwin, R.M., J.D. Nichols, T.B. Eyler and D.B. Stotts. 1998. Modeling colony site dynamics: The metapopulation of gull-billed terns in coastal Virginia. auk 115:970–978.
Erwin, R.M., B.D. Watts, G.M. Haramis, M.C. Perry and K.A. Hobson, eds. 2007b. Waterbirds of the Chesapeake Bay and vicinity: Harbingers of change? Waterbirds 30 (special issue 1). 182 pages.
Nisbet, I.C.T. 1975. Selective effects of predation in a tern colony. condor 77:221–226.
Reese, J. 2006. Paul S. Sarbanes Ecosystem Restoration Project at Poplar Island—Bird monitoring. August report to U.S. Army Corps of Engineers and Maryland Port Administration, Baltimore, Maryland.
___. 2007. Paul S. Sarbanes Ecosystem Restoration Project at Poplar Island—Bird monitoring. August report to U.S. Army Corps of Engineers and Maryland Port Administration, Baltimore, Maryland.
Table 1. Estimates of nesting pairs (and fledglings) of priority (and newly recruited [shading]) waterbird spe-cies from Poplar Island, Maryland, before (2008) and after (2009) owl removal.
Number of Nests (Fledglings)Species 2008 2009Common tern 361 (20+) 244 (115–130)Least tern 112 (35–40) 63 (80–100)Osprey 11 (5) 10 (10)Snowy egret 55 (82) 68 (80–100)American oystercatcher 1 (0) 1 (2)Black-necked stilt 1 (2) 4 (8)
22 • March/June 2011 Ecological REstoRation 29:1–2
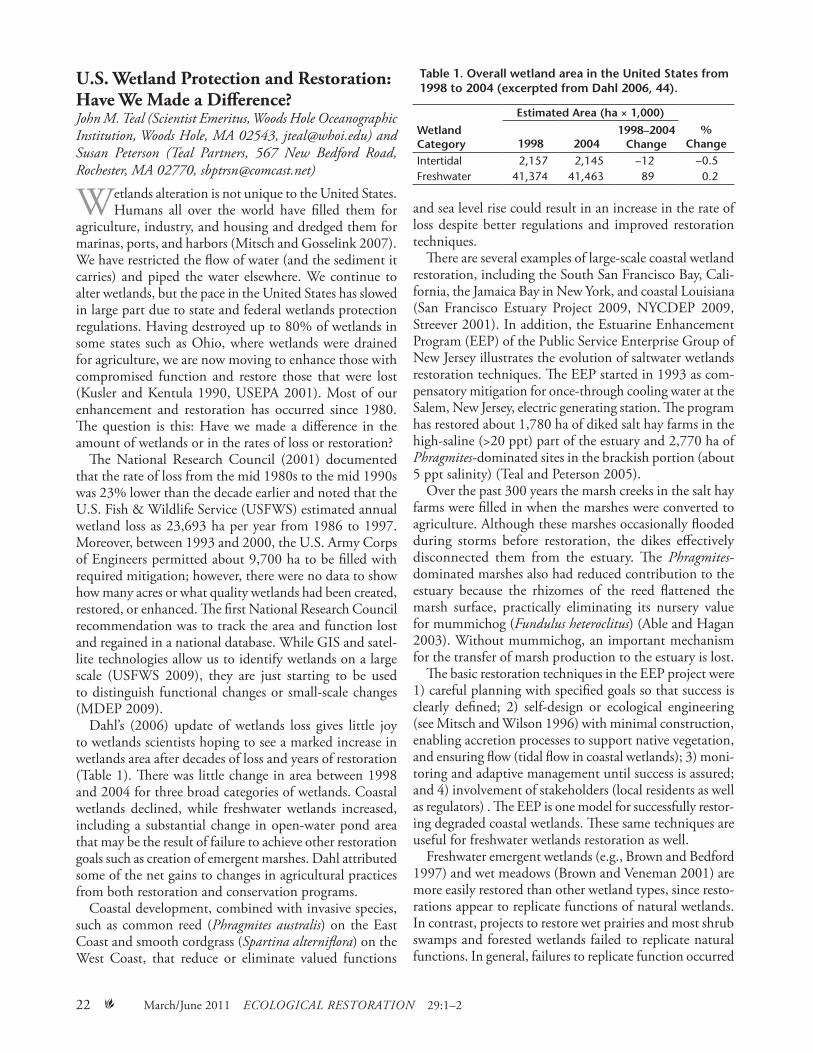
U.S. Wetland Protection and Restoration: Have We Made a Difference?John M. teal (scientist Emeritus, Woods Hole oceanographic institution, Woods Hole, Ma 02543, [email protected]) and susan Peterson (teal Partners, 567 new Bedford Road, Rochester, Ma 02770, [email protected])
Wetlands alteration is not unique to the United States. Humans all over the world have filled them for
agriculture, industry, and housing and dredged them for marinas, ports, and harbors (Mitsch and Gosselink 2007). We have restricted the flow of water (and the sediment it carries) and piped the water elsewhere. We continue to alter wetlands, but the pace in the United States has slowed in large part due to state and federal wetlands protection regulations. Having destroyed up to 80% of wetlands in some states such as Ohio, where wetlands were drained for agriculture, we are now moving to enhance those with compromised function and restore those that were lost (Kusler and Kentula 1990, USEPA 2001). Most of our enhancement and restoration has occurred since 1980. The question is this: Have we made a difference in the amount of wetlands or in the rates of loss or restoration?
The National Research Council (2001) documented that the rate of loss from the mid 1980s to the mid 1990s was 23% lower than the decade earlier and noted that the U.S. Fish & Wildlife Service (USFWS) estimated annual wetland loss as 23,693 ha per year from 1986 to 1997. Moreover, between 1993 and 2000, the U.S. Army Corps of Engineers permitted about 9,700 ha to be filled with required mitigation; however, there were no data to show how many acres or what quality wetlands had been created, restored, or enhanced. The first National Research Council recommendation was to track the area and function lost and regained in a national database. While GIS and satel-lite technologies allow us to identify wetlands on a large scale (USFWS 2009), they are just starting to be used to distinguish functional changes or small-scale changes (MDEP 2009).
Dahl’s (2006) update of wetlands loss gives little joy to wetlands scientists hoping to see a marked increase in wetlands area after decades of loss and years of restoration (Table 1). There was little change in area between 1998 and 2004 for three broad categories of wetlands. Coastal wetlands declined, while freshwater wetlands increased, including a substantial change in open-water pond area that may be the result of failure to achieve other restoration goals such as creation of emergent marshes. Dahl attributed some of the net gains to changes in agricultural practices from both restoration and conservation programs.
Coastal development, combined with invasive species, such as common reed (Phragmites australis) on the East Coast and smooth cordgrass (spartina alterniflora) on the West Coast, that reduce or eliminate valued functions
and sea level rise could result in an increase in the rate of loss despite better regulations and improved restoration techniques.
There are several examples of large-scale coastal wetland restoration, including the South San Francisco Bay, Cali-fornia, the Jamaica Bay in New York, and coastal Louisiana (San Francisco Estuary Project 2009, NYCDEP 2009, Streever 2001). In addition, the Estuarine Enhancement Program (EEP) of the Public Service Enterprise Group of New Jersey illustrates the evolution of saltwater wetlands restoration techniques. The EEP started in 1993 as com-pensatory mitigation for once-through cooling water at the Salem, New Jersey, electric generating station. The program has restored about 1,780 ha of diked salt hay farms in the high-saline (>20 ppt) part of the estuary and 2,770 ha of Phragmites-dominated sites in the brackish portion (about 5 ppt salinity) (Teal and Peterson 2005).
Over the past 300 years the marsh creeks in the salt hay farms were filled in when the marshes were converted to agriculture. Although these marshes occasionally flooded during storms before restoration, the dikes effectively disconnected them from the estuary. The Phragmites-dominated marshes also had reduced contribution to the estuary because the rhizomes of the reed flattened the marsh surface, practically eliminating its nursery value for mummichog (Fundulus heteroclitus) (Able and Hagan 2003). Without mummichog, an important mechanism for the transfer of marsh production to the estuary is lost.
The basic restoration techniques in the EEP project were 1) careful planning with specified goals so that success is clearly defined; 2) self-design or ecological engineering (see Mitsch and Wilson 1996) with minimal construction, enabling accretion processes to support native vegetation, and ensuring flow (tidal flow in coastal wetlands); 3) moni-toring and adaptive management until success is assured; and 4) involvement of stakeholders (local residents as well as regulators) . The EEP is one model for successfully restor-ing degraded coastal wetlands. These same techniques are useful for freshwater wetlands restoration as well.
Freshwater emergent wetlands (e.g., Brown and Bedford 1997) and wet meadows (Brown and Veneman 2001) are more easily restored than other wetland types, since resto-rations appear to replicate functions of natural wetlands. In contrast, projects to restore wet prairies and most shrub swamps and forested wetlands failed to replicate natural functions. In general, failures to replicate function occurred
Table 1. Overall wetland area in the United States from 1998 to 2004 (excerpted from Dahl 2006, 44).
Estimated Area (ha × 1,000)
% Change
Wetland Category 1998 2004
1998–2004 Change
Intertidal 2,157 2,145 −12 −0.5Freshwater 41,374 41,463 89 0.2

March/June 2011 Ecological REstoRation 29:1–2 • 23
with projects done as compensatory mitigation under state wetland regulations ( Johnson et al. 2000, Brown and Vene-man 2001), under the Clean Water Act (National Research Council 2001), and as part of mitigation banks (Mack and Micacchion 2006).
Failures generally resulted from inaction, indifference, or ignorance. Inaction came from regulatory authorities that lacked staff to review the systems or the authority to mandate construction/reconstruction/repair (Robb 2000).
Indifference came from the regulated parties with little or no interest in the outcome of the mitigation action and unwillingness to fund the project adequately. In Mas-sachusetts (Brown and Veneman 2001), more than half of the wetland mitigation projects did not meet the standards of the Massachusetts Wetlands Protection Act, with more than 20% of those failures from the fact they had never been built.
Ignorance about factors that sustain wetlands resulted in failures to produce a wetland as defined by the appro-priate regulatory authority. For example, 38.6% of the wetlands built in Massachusetts did not produce wetland at all (Brown and Veneman 2001), and 25% of the Ohio wetlands bank area assessed by Mack and Micacchion (2006) was not wetland. Lack of adequate provision of such critical controlling factors as hydrology, vegetation, or hydroperiods led to many of the failures ( Johnson et al. 2000).
We conclude that the techniques for successful freshwa-ter wetlands restoration are known and documented, but that the regulatory environment fails to enforce account-ability. We noted above that 20% of the wetland mitigation projects in Massachusetts failed because they had never been built; that assessment would not have required the expertise of a trained environmental scientist.
Public interest in wetlands has been fueled by research, the growth of environmentalism, and education. Research demonstrates how wetland functions are directly linked to human wellbeing, for example preserving fisheries and attenuating storm effects (Weis and Butler 2009).
Environmentalism arose from writings (and later videos) that captured public attention, such as Rachel Carson’s (1962) silent spring and Al Gore’s (2006) an inconvenient truth. There are now many books dedicated to wetlands in both professional and popular literature; for example, an online search for “A Wetland Walk” resulted in a list of 744 titles, beginning with a number of children’s books.
Education has changed dramatically in the past 30 years at all levels. Grade school and high school students now learn ecology, and colleges grant degrees in environmental studies to many students. Wetlands science in particular has been integrated into the science curricula for both middle schools and high schools. Public education has been enhanced by the growth of professional associations and their outreach programs, for example, the Society of Wetlands Scientists, the Coastal and Estuarine Research
Federation, Restore Americas Estuaries, the Ecological Society of America, Society for Ecological Restoration, and the International Association for Ecology. Wetlands-oriented education has become an integral part of many environmental advocacy groups such as the Audubon Soci-ety, the Nature Conservancy, and the Sierra Club. There are also federal agencies that involve students in hands-on restoration activities, such as NOAA Restoration Center, USFWS, U.S. Forest Service, and Americorps.
We have made a difference but have a long way to go. In spite of federal and state policies for no net loss of wetlands, losses continue to occur, although the rate has slowed. Coastal wetland restorations have largely been successful, but coastal restorations are threatened by both sea level rise and invasive species. While the techniques for restoring freshwater wetlands have improved, many freshwater wetland restorations remain woefully unman-aged and unregulated. The biggest difference is in public understanding of wetland values, where great strides have been made.
We still need to strengthen regulations and to be more clever about ensuring compliance. We need to look at a broader landscape view of wetland functions and interac-tions. And we need a national database that tracks both the wetlands area, such as that being developed by USFWS (2010), and function lost and regained.
ReferencesAble, K.W. and S.M. Hagan. 2003. Impact of common reed,
Phragmites australis, on essential fish habitat: Influence on reproduction, embryological development and larval abundance of mummichog, Fundulus heteroclitus. Estuaries 26:40–50.
Brown, S.C. and B.L. Bedford. 1997. Restoration of wetland vegetation with transplanted wetland soil: An experimental study. Wetlands 17:424–437.
Brown, S.C. and P.L.M. Veneman. 2001. Effectiveness of compensatory wetland mitigation in Massachusetts, USA. Wetlands 21: 508–518.
Carson, Rachel. 1962. silent spring. Boston: Houghton Mifflin.Dahl, T.E. 2006. Status and trends of wetlands in the
coterminous United States 1998 to 2004. , Washington DC: U.S. Fish & Wildlife Service.
Gore, Al. 2006. an inconvenient truth. Emmaus PA: Rodale Press.
Johnson, P.A., D.L. Mock, E.J. Teachout and A. McMillan. 2000. Washington State wetland mitigation evaluation study. Washington State Department of Ecology Publication No. 00-06-016.
Kusler, J. and M. Kentula. 1990. Wetland creation and Restoration: The status of the science. Washington DC: Island Press.
Mack, J.J. and M. Micacchion. 2006. An ecological assessment of Ohio mitigation banks: Vegetation, amphibians, hydrology, and soils. Ohio EPA Technical Report WET/2006-1.
Massachusetts Department of Environmental Protection (MDEP). 2009. Massachusetts wetland change data base. www.mass.gov/mgis/wetchange.htm

24 • March/June 2011 Ecological REstoRation 29:1–2
Mitsch, W.J. and J.G. Gosselink. 2007. Wetlands, 4th ed. New York: John Wiley & Sons.
Mitsch, W.J. and R.F. Wilson. 1996. Improving the success of wetland creation and restoration with know-how, time, and self-design. Ecological applications 6:77–83.
National Research Council. 2001. Compensating for wetland losses under the Clean Water Act. Committee on Mitigating Wetland Losses, Board on Environmental Studies and Toxicology, Water Science and Technology Board, Division on Earth and Life Studies. Washington DC: National Academy Press.
New York City Department of Environmental Protection (NYCDEP). 2009. A review of the state of the bay. www.nyc .gov/html/dep/html/dep_projects/jamaica_bay_symposium_recap.shtml
Robb, J.T. 2000. Indiana wetland compensatory mitigation: Inventory. Prepared for U.S. Environmental Protection Agency, Region 5, Acquisition and Assistance Branch.
San Francisco Estuary Project. 2009. San Francisco Bay Area wetlands restoration program. www.sfwetlands.ca.gov/
Streever, B. 2001. saving louisiana? The Battle for coastal Wetlands. Jackson MS: University Press of Mississippi.
Teal, J.M. and S.B. Peterson. 2005. Introduction to the Delaware Bay salt marsh restoration. Ecological Engineering 25: 199–203.
U.S. Environmental Protection Agency (USEPA). 2001. Wetland restoration. www.epa.gov/owow/wetlands/pdf/restoration_pr.pdf
U.S. Fish & Wildlife Service (USFWS). 2009. National wetlands inventory. www.fws.gov/wetlands/Data/index.html
___. 2010. National wetlands inventory, wetlands mapper. www .fws.gov/wetlands/Data/Mapper.html
Weis, J.S. and C.A. Butler. 2009. salt Marshes. Piscataway NJ: Rutgers University Press.