results 2001 annual report
TRANSCRIPT

Results 2001 Annual Report

Deutsche Bank is dedicated to being the best financial services provider
in the world. We endeavor to use our breadth of experience, capabilities
and financial strength to create value for our shareholders, customers,
employees and society as a whole.
In achieving this mission we operate by these core values:
Customer focus
We place customers at the center of our activities and they drive all
that we do.
Teamwork
We benefit from the diversity of our people and our business by working
together to achieve success.
Innovation
We are constantly challenging conventional wisdom and developing new
solutions to meet customer requirements.
Performance
We are committed to a result-oriented culture.
Trust
We behave reliably, fairly and honestly.
Our Identity

Content
Deutsche Bank Group 2 2001– Deutsche Bank’s
Consolidated Financial Statements
are converted to U.S. GAAP
5 Leading to results – Spokesman’s Letter
8 Group Executive Committee
10 Corporate Profile
13 Acting in the interests of
our stakeholders
Shareholders 19 Deutsche Bank goes forward
with globalization
Customers 23 Corporate and Investment Bank
29 Private Clients and Asset Management
35 Corporate Investments
37 DB Services
39 Corporate Center
Staff 41 Staff – our most important potential
for success
Society 45 Commitment to society
Corporate Governance 49 Corporate Governance –
a part of our identity
Management Discussion, 52 Content
Consolidated Financial
Statements and Risk Report
Confirmations and 196 Statement by the
Management Bodies Board of Managing Directors
197 Report of the Supervisory Board
200 Supervisory Board
201 Advisory Board
202 Board of Managing Directors
Supplementary Information 203 Group Five-Year Record
204 Declaration of Backing
205 Glossary
213 Impressum/Publications

The Annual Report for 2001 contains, for
the first time, Consolidated Financial State-
ments prepared in accordance with United
States Generally Accepted Accounting
Principles (U.S. GAAP). The comparative
amounts for 2000 are also prepared in
accordance with U.S. GAAP, so they are
different from the amounts published in
our 2000 Annual Report. Reporting under
U.S. GAAP is a result of listing the
Deutsche Bank share on the New York
Stock Exchange on October 3, 2001. Prior
to that, we had prepared our Consolidated
Financial Statements in accordance with
International Accounting Standards (IAS)
since 1995.
As indicated above, there are differ-
ences between U.S. GAAP and IAS. We
expect, however, that after a transitional
period the amounts reported in our finan-
cial statements under U.S. GAAP will not
be substantially different from the amounts
that would have been reported under IAS.
Overview of Accounting Differences
One important difference between
U.S. GAAP and IAS relates to the line item
structure of the Income Statement, and
the definition of some of those line items.
Under U.S. GAAP, for example, the results
of our insurance business are reported on
a gross basis: insurance premiums earned
and revenues from insurance company
investments are reported as revenues,
while policyholder benefits and claims and
their share of revenues from investments
are reported as expenses. Under IAS, the
net difference between total insurance
revenues and policyholder benefits and
claims was reported in a single line in the
revenue section of the Income Statement.
The section of the Income Statement
entitled the “Balance of other income and
expenses from ordinary activities” under
IAS does not exist under U.S. GAAP.
Instead, under U.S. GAAP the respective
revenue items that were included in that
section under IAS are included in total rev-
enues, and the expenses are included in
total expenses.
The gross recognition of revenues and
expenses under U.S. GAAP results in corre-
spondingly higher reported amounts for
both revenues and expenses, but does not
change the net income result. There is,
2001 – Deutsche Bank’s ConsolidatedFinancial Statements are converted toU.S. GAAP
2
, , ,
2001 2000
Share price
High € 105.64 € 103.27
Low € 43.20 € 68.75
Dividend per share € 1.30 € 1.30
Dividend appropriation Deutsche Bank AG € 808 m. € 801 m.
Basic earnings per share € 0.27 € 22.00
Adjusted basic earnings per share* € 2.21 € 6.88
Return on average total shareholders’ equity 0.4 % 39.2 %
Adjusted return on average active totalshareholders’ equity* 4.4 % 16.5 %
BIS capital ratio 12.1 % 13.1 %
BIS core capital ratio 8.1 % 7.8 %
Number Number
Branches 2,099 2,287
Staff 94,782 98,311
Long-term rating
Moody’s Investors Service, New York Aa3 Aa3Standard & Poor’s, New York AA AAFitch IBCA, London AA AA
* Net income used in this calculation is adjusted for the effect of German tax law changes and for the effect of accounting changes. Regarding our definition of active equity, see footnote 3 on page 203 of this Annual Report.

3
however, an impact on the cost/income
ratio calculated under the different account-
ing bases, so the ratio calculated under
U.S. GAAP may not be comparable to that
reported historically under IAS.
A significant difference which is impor-
tant to understand in reviewing Deutsche
Bank’s Consolidated Financial Statements
concerns how the effect of German tax law
changes is reported in those statements.
The reported Net Income for both 2000 and
2001are strongly influenced by the tax reform
enacted in 2000. This effect is discussed
under the section entitled “Net Income”
below and in detail in the Annual Report,
Management Discussion and in the Notes.
Income Before Income Taxes
Income before income taxes in 2001 was
€ 1.8 billion, compared to € 6.9 billion in
2000, a decline of € 5.1 billion. Of the
decrease, € 1.2 billion was due to lower
revenues from our main business activities
– interest, trading and commissions –
which were generally stable, compared to
the prior year. At € 24.7 billion (excluding
insurance premiums and trading revenues
from non-trading derivatives, which do not
qualify for hedge accounting), revenues
from these sources were down less than
5% from the prior year. This decline is due
primarily to lower commission revenues
from capital market businesses.
We also recorded € 0.5 billion in high-
er loan loss provisions in 2001 than in
2000, as a consequence of the strained
world economic conditions.
The combined effect of these two
items is € 1.7 billion, which represents
25% of income before taxes for the prior
year.
The remainder of the decline can be
attributed to three areas:
– Increased write-downs of € 1.4 billion in
our investments in private equity and
real estate,
– A decrease of € 1.5 billion in pre-tax
income from investments (principally the
reduction in the gains from the sale of
industrial holdings), insurance (net of a
reduction of policyholder benefits and
claims) and other business activities,
– Higher expenses of € 0.5 billion for
restructuring activities, severance pay-
ments and goodwill amortization.
As a result of the cost containment mea-
sures we introduced during the year, the
remaining expenses were generally flat
with the prior year totals.
Net Income
The Net Income reported in 2000
(€ 13.5 billion) and 2001 (€ 0.2 billion) are
strongly influenced by the treatment under
U.S. GAAP of the reduction in the German
corporate income tax rates and the elimina-
tion of taxes on gains from the sale of
shareholdings in corporations.
These tax rate changes resulted in
a tax benefit being reflected in our year
2000 U.S. GAAP Income Statement of
€ 9.3 billion, which increased the
U.S. GAAP net income we reported in
2000. Approximately € 6.2 billion of this
tax benefit represents the reversal of
income taxes previously accrued on the
unrealized gains on our industrial share-
holdings. U.S. GAAP requires us to record
Deutsche Bank Group

tax expense totalling € 6.2 billion reversed
in 2000 (and an additional € 0.7 billion
reversed in 1999) in subsequent years
when the shareholdings giving rise to
those benefits are sold. As a result,
Deutsche Bank reported tax expense of
almost € 1.0 billion in 2001 on industrial
shareholdings sold during the year, even
though we incurred no tax liability as a
result of those sales.
Net Income for 2001 also reflects a
charge of € 0.2 billion representing the
cumulative effect for years prior to 2001 of
implementing the U.S. GAAP standard on
accounting for derivatives that took effect
in 2001.
Net Income adjusted for the effect of
the tax law change and the prior years’
effect of the change in accounting for
derivatives is € 1.4 billion in 2001 (or € 2.21
basic earnings per share), and € 4.2 billion
in 2000 (or € 6.88 basic earnings per
share). The corresponding return on active
equity is 4.4% in 2001 and 16.5% in
2000.
Conclusion
2001 was a year characterized by impor-
tant changes for Deutsche Bank. Our stock
was listed on the New York Stock
Exchange, and we converted our account-
ing to U.S. GAAP. At the same time, it was
not an easy year for Deutsche Bank or its
competitors. However, considering the
difficult world economic conditions, and
the special situations described above, our
results demonstrate the strength of our
core business.
4

Leading to results
5
2001 was a very difficult year for the world economy. In the course of the twelve months,
the recessionary tendencies grew stronger and stronger: for the first time in a long period,
business activity weakened again simultaneously in all important economies. And then,
on September 11, 2001, the criminal attacks in the U.S.A. struck the world to the quick. To
this day, markets and companies worldwide have still not fully recovered from that terrible
event.
Deutsche Bank with almost 13,000 employees in the New York conurbation was
directly affected by the attack on the World Trade Center. In a notable act of strength and
supported by Deutsche Bank’s global network, the existing contingency plans were imple-
mented. We were able at all times to provide quotations to our customers and counter-
parties. The process of relocation from the various recovery sites to our new main U.S.
location at 60 Wall Street has now begun.
In that difficult environment we decided to take our then impending U.S. stock
exchange listing through to completion. On September 21, our share was registered with
the U.S. Securities and Exchange Commission (SEC), the American stock market and
securities regulator, and the first trade on the New York Stock Exchange (NYSE) took place
on October 3.
The NYSE listing, the additional SEC reporting duties and not least the conversion of
our accounting standard to U.S. GAAP are the reasons why this Annual Report has
changed in structure and increased in length. The Notes to the Consolidated Financial
Statements contain large sections of the so-called “Form 20-F”, the SEC’s standardized
information document which includes detailed analyses of the development of business
in the 2001 financial year.
In 1998, we launched a divisionalized Group structure, initially with the aim of build-
ing up a global investment bank that would rank with the global leaders in all business
lines. We are acknowledged to have achieved this goal.
At the beginning of 2001, we realigned our structure and combined the five Group
Divisions at that time to form two new ones: Corporate and Investment Bank (CIB) and
Private Clients and Asset Management (PCAM). With the close cooperation between CIB
and PCAM we symbolize a new type of universal bank that guarantees connectivity in an
Deutsche Bank Group

ideal format between the interests of all market participants, of issuers and borrowers,
on the one hand, and of private and institutional investors, on the other. In this way, we
are better able to satisfy the needs of our customers and, through increased participation
in future growth trends, increase our profitability and ultimately the market value of our
company.
In creating PCAM, we brought together in particular our activities in Personal Bank-
ing, Private Banking and Asset Management under one management team. In this divi-
sion, the focus is on consistent alignment with core business, supported by the selective
purchase of activities and by strategic cooperation in the distribution field. In this way, we
want to make sure quickly that our Group’s second “pillar” creates substantial and lasting
value for our shareholders.
In the financial year ended, the profits reported by PCAM were unsatisfactory. The
result was burdened by specific loss-making areas (Private Banking in the U.S.A. and
Personal Banking in France) and by special projects (for example, the introduction of euro
cash). Adjusted for these factors, a satisfactory result was achieved in a difficult market
environment. When the causes are eliminated we expect a strongly improved segment
result in the current financial year.
With the acquisitions of Scudder and RREEF to be completed in the second quarter
of 2002, Asset Management Corporate Division will become the Group’s second genuine
global player. We also intend to further strengthen worldwide the Private Banking Corpo-
rate Division for high-net-worth clients.
For the integration of Scudder and RREEF, we are confident that we can rely on the
positive experience we gathered with the successful integration of Bankers Trust. In the
past five years, having successfully brought on board a whole series of acquired compa-
nies, our bank has created an identity of its own, with whose values all Deutsche Bank
employees can identify. This corporate culture will help us achieve our goal of creating
tangible added value for our shareholders, staff and our entire community.
All our Group Divisions follow the principle of permanently reviewing their activities.
We shall continue to grow core business areas that promise value creation. Businesses
with lesser importance for our business strategy, with inadequate profitability or exces-
sive capital requirements are available for divestment. This is the background to our with-
drawal from a whole row of business areas in 2001. We intend to continue this process of
optimizing our business portfolio in the current year.
6

7
At the beginning of 2002, to complete the structural development of our Group, we
realigned Deutsche Bank’s management structure. The streamlined Group Board was
given flanking support in the form of a consultative Group Executive Committee as well as
divisional and functional committees with steering functions.
Today, Deutsche Bank is a modern client-focused financial services group dedicated
first and foremost to the principle of ongoing value creation for you, our shareholders.
We have used the difficult year 2001 to make our bank even stronger. Besides the
organizational overhaul mentioned above, we
– drew up and initiated in disciplined fashion an extensive cost containment program,
– took significant charges to our private equity investment portfolio, and
– announced an important restructuring program and created the necessary balance
sheet basis.
We feel well equipped for the current 2002 financial year, which promises to be
another difficult one. We are facing the risks in our business with healthy caution, but at
the same time we are preparing for the new upswing and the ongoing consolidation of
our industry.
Yours sincerely,
Rolf-E. Breuer
Spokesman of the Board of Managing Directors
Frankfurt am Main, March 2002
Deutsche Bank Group

8
Hermann-Josef Lamberti*
born 1956,
Board member since 1999.
Chief Operating Officer, responsible for Cost
and Infrastructure Management, Information
Technology, Operations, Building and Facilities
Management as well as Purchasing.
Kevin Parker
born 1959,
Global Head of Global Equities.
Anshu Jain
born 1963,
Global Head of Global Markets.
Clemens Börsig*
born 1948,
Board member since 2001.
Chief Financial Officer,
responsible for Controlling,
Taxes and Investor Relations.
As Chief Risk Officer provi-
sionally responsible for Risk
Management and Corporate
Security.
Rolf-E. Breuer*
born 1937,
Board member since 1985.
Until May 22, 2002, Spokesman of
the Board of Managing Directors,
Chairman of the Group Executive
Committee, responsible for Private
Clients and Asset Management
(PCAM), Corporate Investments
(CI), Corporate Development (AfK)
as well as Corporate Communica-
tions and Economics.
Group Executive Committee
Josef Ackermann*
born 1948,
Board member since 1996.
Responsible for Corporate and Investment
Bank (CIB) and Treasury (provisionally).
From May 23, 2002, Spokesman of the
Board of Managing Directors and Chair-
man of the Group Executive Committee,
responsible for Corporate and Investment
Bank (CIB), Private Clients and Asset
Management (PCAM) and Corporate
Investments (CI).
* Member of the Board of Managing Directors of Deutsche Bank AG.

9
Deutsche Bank Group
Michael Philipp
born 1953,
Global Head of Asset
Management and Wealth
Management Services.Herbert Walter
born 1953,
Global Head of Retail and
Private Banking.
Ted Virtue
born 1960,
Global Head of Corporate
Investments (CI).
Jürgen Fitschen
born 1948,
Global Head of Transaction
Banking and Relationship
Management Germany.
Tessen von Heydebreck*
born 1945,
Board member since 1994.
Chief Administrative Officer,
responsible for Human
Resources, Legal,
Compliance and Audit.
Michael Cohrs
born 1956,
Global Head of Corporate
Finance.
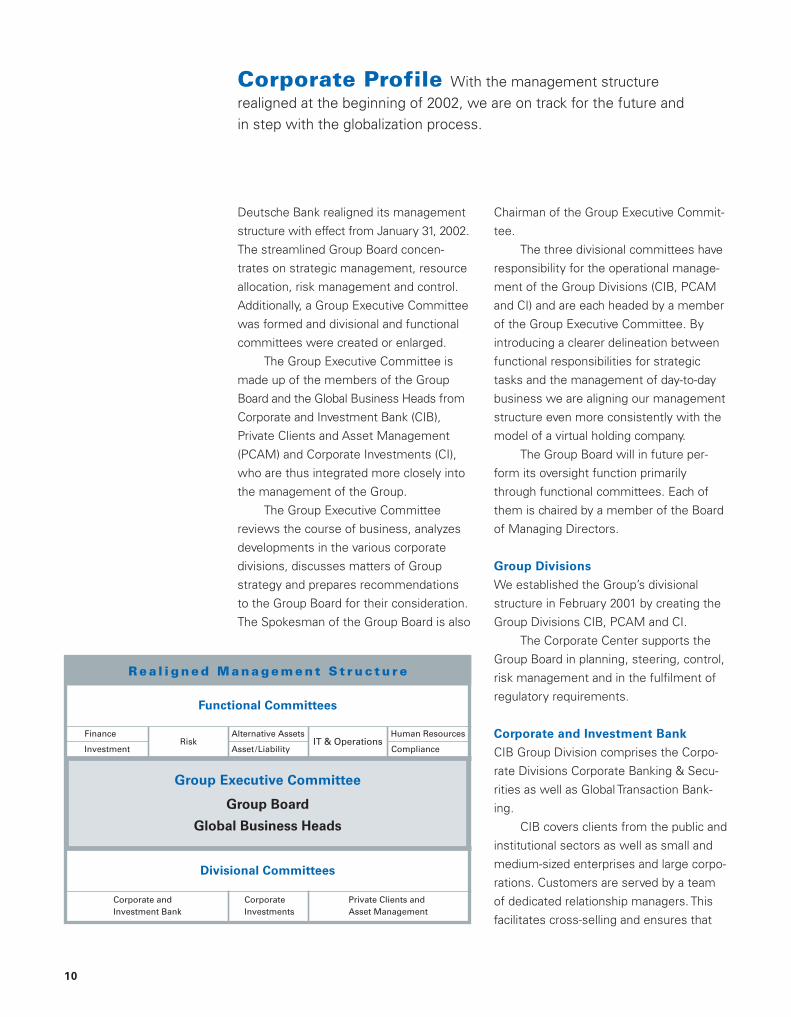
Deutsche Bank realigned its management
structure with effect from January 31, 2002.
The streamlined Group Board concen-
trates on strategic management, resource
allocation, risk management and control.
Additionally, a Group Executive Committee
was formed and divisional and functional
committees were created or enlarged.
The Group Executive Committee is
made up of the members of the Group
Board and the Global Business Heads from
Corporate and Investment Bank (CIB),
Private Clients and Asset Management
(PCAM) and Corporate Investments (CI),
who are thus integrated more closely into
the management of the Group.
The Group Executive Committee
reviews the course of business, analyzes
developments in the various corporate
divisions, discusses matters of Group
strategy and prepares recommendations
to the Group Board for their consideration.
The Spokesman of the Group Board is also
10
Corporate Profile With the management structure realigned at the beginning of 2002, we are on track for the future and in step with the globalization process.
Chairman of the Group Executive Commit-
tee.
The three divisional committees have
responsibility for the operational manage-
ment of the Group Divisions (CIB, PCAM
and CI) and are each headed by a member
of the Group Executive Committee. By
introducing a clearer delineation between
functional responsibilities for strategic
tasks and the management of day-to-day
business we are aligning our management
structure even more consistently with the
model of a virtual holding company.
The Group Board will in future per-
form its oversight function primarily
through functional committees. Each of
them is chaired by a member of the Board
of Managing Directors.
Group Divisions
We established the Group’s divisional
structure in February 2001 by creating the
Group Divisions CIB, PCAM and CI.
The Corporate Center supports the
Group Board in planning, steering, control,
risk management and in the fulfilment of
regulatory requirements.
Corporate and Investment Bank
CIB Group Division comprises the Corpo-
rate Divisions Corporate Banking & Secu-
rities as well as Global Transaction Bank-
ing.
CIB covers clients from the public and
institutional sectors as well as small and
medium-sized enterprises and large corpo-
rations. Customers are served by a team
of dedicated relationship managers. This
facilitates cross-selling and ensures that
R e a l i g n e d M a n a g e m e n t S t r u c t u r e
Group Executive Committee
Functional Committees
Group Board
Global Business Heads
Divisional Committees
Alternative AssetsFinanceIT & Operations
Human Resources
InvestmentRisk
Asset /Liability Compliance
Corporate andInvestment Bank
Private Clients andAsset Management
Corporate Investments
11
Deutsche Bank Group
clients are supplied comprehensively with
our products in accordance with their
needs.
Private Clients
and Asset Management
In PCAM we brought together the Corpo-
rate Divisions Personal Banking, Private
Banking and Asset Management on a
global platform in a first step at the begin-
ning of 2001, thereby creating the basis for
further growth.
To intensify its client relationships
and put them on a broader business basis,
PCAM realigned its structure in a second
step in autumn 2001. Production and
distribution are now managed, beyond the
product level, in a uniform operational
process, while previously each Corporate
Division had been directly responsible for
both functions. For a differentiated product
offering in the interest of customers, dis-
tribution has been organized along cus-
tomer lines. Deutsche Bank Private Wealth
Management covers ultra-high-net-worth
private clients, Deutsche Bank Private
Banking serves high-net-worth and mass
affluent clients and Deutsche Bank 24
looks after customers primarily seeking
prestructured banking and investment
products.
Additionally, we shall strengthen our
distribution capability in Germany and
Austria through a strategic cooperation
with Deutsche Vermögensberatung AG
(DVAG).
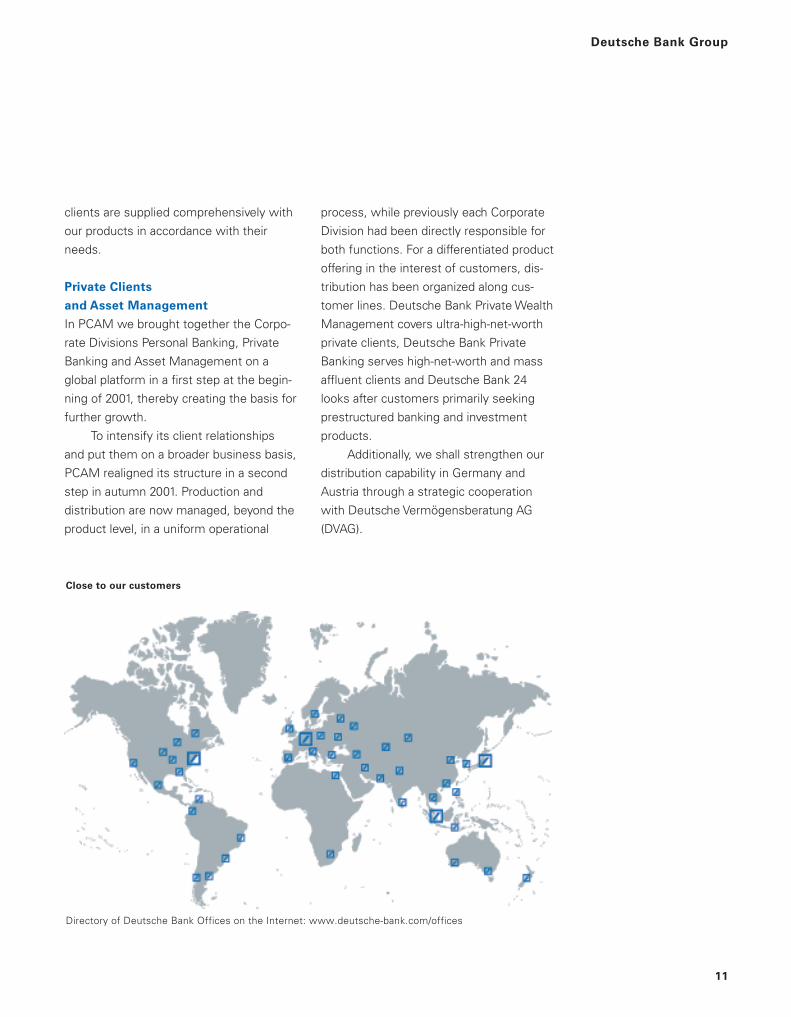
Close to our customers
Directory of Deutsche Bank Offices on the Internet: www.deutsche-bank.com/offices

12
Corporate Investments
In CI we have combined investments in
private equity and real estate as well as
our traditional industrial shareholdings and
other investments.
Core business: benefit to clients and
value creation
Our business model is intended to achieve
the greatest possible client orientation and
availability of our products. For this pur-
pose we deploy our human and financial
resources where our customers want them
and where we have comparative advan-
tages in competition. This will ultimately
increase the value of the company.
We made good progress in 2001 with
this process of concentration on core busi-
ness. For example, we withdrew from
numerous business areas. We sold GEFA
and ALD Group, which specialized in
leasing and sales finance in Europe,
National Discount Brokers Corporation in
the U.S.A. and Boullioun Aviation Services.
We disposed fully or, through joint venture
transactions, partially of subsidiaries in the
field of information technology, such as
emagine and Deutsche Software India.
We shall broaden the basis for our
mortgage banking business in Europe
through the planned combination of our
subsidiary Eurohypo AG with the mortgage
banks of Commerzbank and Dresdner
Bank. Our shareholding in the combined
business will probably be less than 40 %.
Acquisition of Scudder
We reached agreement with Zurich Finan-
cial Services on the purchase of U.S. asset
manager Scudder and of asset manage-
ment companies in Germany and Italy. In
return, we are selling our insurance arm
Deutscher Herold and our insurance activi-
ties in Spain, Italy and Portugal.
Additionally, Deutsche Bank and
Zurich Financial Services signed a broad
cooperation agreement. This will give us
access to the European retail and private
client base of Zurich Financial Services.
For our own customers in Germany,
Deutscher Herold will remain the exclusive
provider of insurance products.
These transactions are expected to
close in the first half of 2002. They will
take PCAM a big step forward in focusing
on its core business: our platform for glo-
bal asset management in the U.S.A.,
Europe and Asia/Pacific will be substantial-
ly strengthened. Furthermore, we shall
enhance our position in business with
high-net-worth private clients in the U.S.A.

Acting in the interests of our stakeholdersDeutsche Bank accepts its responsibility for its shareholders, customers, staff and society.
13
Shareholders, customers, staff and society
are Deutsche Bank’s four equally important
stakeholder groups. We want to create a
tangible added value for them.
This requires a corporate culture based
on values everyone in our company as-
cribes to. Our values – performance, inno-
vation, teamwork, trust and customer
focus – create identity, across all borders.
They set a high standard and motivate us
not to let up in our endeavor to continually
improve and innovate. Moreover, consen-
sus on what fundamentally unites us will
help us to achieve our corporate goals.
Shareholders
A company’s growth depends on the will-
ingness of its shareholders to provide
sufficient capital. They will only do so if
they receive an attractive return. Deutsche
Bank is competitive in the capital markets
and consistently realigns its strategic
focus to markets and products. For these
reasons the Deutsche Bank share remains
an attractive investment for private and
institutional investors.
Customers
Customer satisfaction essentially deter-
mines a company’s earnings. It depends
on the degree of success in offering ad-
vanced solutions providing advantages to
the customer at competitive prices. Our
customers and their requirements are at
the center of all our activities.
Staff
Business success is achieved by motivat-
ed, creative and well-trained staff mem-
bers. They play a key role in developing
and designing innovative concepts and
advanced solutions. Therefore, we invest
in being an attractive employer. In this
context, acting responsibly towards our
employees in periods of structural change
is important to us.
Society
Corporate success creates a responsibility
towards society. Deutsche Bank fulfils
this responsibility through its broad com-
mitment to cultural, scientific and social
issues. With targeted activities, for exam-
ple, we try to improve the prospects of
young people. Education and training are
essential to the development of active
people ready to accept responsibility at
the national and international levels.
Deutsche Bank Group

14
Shareholders An attractive return for our shareholders presupposessuccessful relationships with our customers.
2001 2000 1999
Structural Shareholders by group Institutional (including banks) 81 % 81 % 77 %
Data in % of share capital Private 19 % 19 % 23 %
Regional breakdown Germany 47 % 48 % 51 %
in % of share capital European Union (excluding Germany) 33 % 33 % 30 %
Switzerland 9 % 9 % 7 %
U.S.A. 8 % 9 % 9 %
Other 3 % 1 % 3 %
Key Change in total return of Deutsche Bank share – 9.5 % + 7.3 % + 75.6 %
Figures Share of Deutsche Bank equity in stock market turnover in Germany 7.6 % 6.0 % 5.6 %
Shareholder Satisfaction Index* 62 62 60
Special U.S. stock exchange listing Successful listing of the Deutsche Bank share on the New York Stock Exchange
Projects Expanded Internet website First live broadcasting of analyst workshopChats conducted after announcement of quarterly figures
* The Index is based on expected share performance and the assessment of general information about Deutsche Bank. It was calculated for the first time in 1999 in a questionnaire-based poll and subsequently in 2000 and 2001 by polls at the Deutsche Bank General Meeting.

15
Deutsche Bank Group
Customers Profitability depends on satisfied customers havingfirm ties with the bank.
2001 2000 1999
Structural Number of customers
Data Corporate and Investment Bank* 108,320 129,200 118,700
Private Clients and Personal Banking 12,000,000 11,200,000 8,872,000Asset Management Private Banking 530,000 493,000 449,000
Asset Management
– Institutional business 6,900 6,300 5,700
– Retail funds 4,840,000 4,700,000 4,100,000
Key Corporate and Investment Bank Euromoney Poll of Polls 1 1 1
Figures Euromoney Capital Raising Poll 1 1 1
Private Clients and Personal Banking (Germany)Asset Management – Client Satisfaction Index 68 67 –
– Client Loyalty Index 70 69 –
Asset Management (DWS)
– Position in – DM/Standard & Poor’s** 1 1 1
Special Euro changeover € 161 million investment for the changeover of our customer accounts (mostly
Projects completed by the end of October 2001) and preparation of the introduction ofeuro cash
Relaunch of Internet website Structural and graphical overhaul of the central Internet website
* Limited comparability of 2001 with previous-year figures due to changed calculation base.** In the category “Big Groups”.

16
Staff Strong ties with customers are created by qualified staff whoidentify with the bank.
2001 2000 1999
Structural Staff 94,782 98,311 93,232
Data* Qualifications University degree 34.5 % 37.2 % 36.8 %
Highest school certificates 32.4 % 32.3 % 32.0 %
Other school certificates 33.1 % 30.5 % 31.2 %
Divisions Private Clients and Asset Management 42.4 % 43.0 % –
Corporate and Investment Bank 41.3 % 39.1 % –
Corporate Investments 2.7 % 2.9 % –
DB Services 12.9 % 14.1 % –
Corporate Center 0.7 % 0.8 % –
Regions Germany 51.2 % 51.5 % 55.0 %
Europe (excluding Germany) 24.9 % 24.3 % 20.9 %
North America 16.2 % 16.2 % 15.7 %
South America 0.7 % 0.6 % 0.9 %
Asia/Pacific/Africa 7.0 % 7.4 % 7.5 %
Age up to 24 years 10.4 % 11.2 % 12.0 %
25–34 years 37.4 % 38.3 % 38.0 %
35–44 years 30.4 % 29.4 % 28.9 %
45–54 years 17.4 % 16.7 % 16.6 %
over 54 years 4.4 % 4.4 % 4.5 %
Key Employee Commitment Index 70 72 66
Figures Absentee rate 2.6 % 2.3 % 2.4 %
Employees leaving the bank for a new job 8.0 % 7.8 % 6.8 %
Training and advanced training (expenses in € million) 257.4 237.2 222.4
Participants in the staff share program** – 65 % 65 %
Participants in the Global Equity Plan*** – 77 % 79 %
Special Global Study on employer image with Aim: to increase our attractiveness as employer, identify and
Projects 1,200 students at 50 reputed universities establish modern incentive systems such as vocationalchallenges, career opportunities and a “work-life” balance
Redesign of the Internet career pages Long-term management of relations with external talented people andsuccessful filling of vacant positions
“Total Employment Cost Management” Integrated management of salaries, non-tariff salaried compensation, bonus and compensation payments as well as hiring and severance costs with the objective of optimizing total staff expenses
dbnetwork – internal communications Group-wide intranet portal with customized, efficient utility featuresand information system for staff members for all staff members; a broad range of information and services that
can be called up according to divisional and global/regional criteria
* Number of employees at end of reporting period. ***Global Equity Plan to be replaced as from 2002 by Deutsche Bank Global Partnership Plan.** Suspended in 2001 due to stock market situation.
17
Deutsche Bank Group
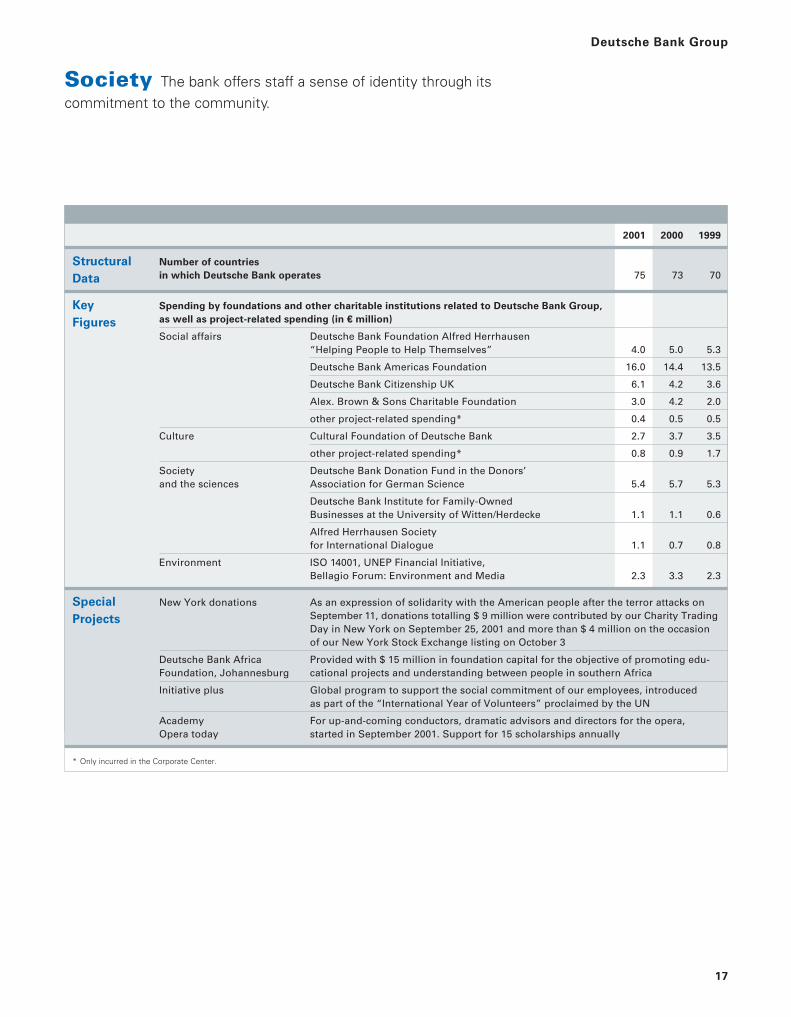
Society The bank offers staff a sense of identity through its commitment to the community.
2001 2000 1999
Structural Number of countries
Data in which Deutsche Bank operates 75 73 70
Key Spending by foundations and other charitable institutions related to Deutsche Bank Group,
Figures as well as project-related spending (in € million)
Social affairs Deutsche Bank Foundation Alfred Herrhausen “Helping People to Help Themselves” 4.0 5.0 5.3
Deutsche Bank Americas Foundation 16.0 14.4 13.5
Deutsche Bank Citizenship UK 6.1 4.2 3.6
Alex. Brown & Sons Charitable Foundation 3.0 4.2 2.0
other project-related spending* 0.4 0.5 0.5
Culture Cultural Foundation of Deutsche Bank 2.7 3.7 3.5
other project-related spending* 0.8 0.9 1.7
Society Deutsche Bank Donation Fund in the Donors’and the sciences Association for German Science 5.4 5.7 5.3
Deutsche Bank Institute for Family-OwnedBusinesses at the University of Witten/Herdecke 1.1 1.1 0.6
Alfred Herrhausen Societyfor International Dialogue 1.1 0.7 0.8
Environment ISO 14001, UNEP Financial Initiative, Bellagio Forum: Environment and Media 2.3 3.3 2.3
Special New York donations As an expression of solidarity with the American people after the terror attacks on
Projects September 11, donations totalling $ 9 million were contributed by our Charity Trading Day in New York on September 25, 2001 and more than $ 4 million on the occasionof our New York Stock Exchange listing on October 3
Deutsche Bank Africa Provided with $ 15 million in foundation capital for the objective of promoting edu-Foundation, Johannesburg cational projects and understanding between people in southern Africa
Initiative plus Global program to support the social commitment of our employees, introduced as part of the “International Year of Volunteers” proclaimed by the UN
Academy For up-and-coming conductors, dramatic advisors and directors for the opera, Opera today started in September 2001. Support for 15 scholarships annually
* Only incurred in the Corporate Center.

Performance. For investors performance is key. As market
maker for the Deutsche Bank Global Share at the New York Stock Exchange
we provide liquidity to create a fair, orderly and efficient market for the
bank‘s shareholders.
Christopher C. Quick, CEO, Fleet Meehan Specialist, Inc., New York

Deutsche Bank goes forward with globalization Our share listed on the New York Stock Exchange.
19
On October 3, 2001, after extensive pre-
paratory work, trading in our share began
on the New York Stock Exchange*.
As a global bank we are now repre-
sented with a “global share” on the
world’s leading stock exchange. We have
closed our previous program under which
our shares could be traded indirectly over-
the-counter in the U.S.A. using American
Depositary Receipts.
The terrorist attacks in the U.S.A.
on September 11 overshadowed the final
phase of preparations for our listing in
New York. Nevertheless, to signal our
solidarity with the U.S.A., we kept to our
schedule.
Greater transparency
With the listing of the Deutsche Bank
share on the New York Stock Exchange,
we again improved financial transparency
for our shareholders. As a key prerequisite
to this important step, we changed our
Group reporting to the U.S. GAAP stan-
dard. Moreover, we are now subject to
the strict disclosure requirements of the
American Securities and Exchange Com-
mission (SEC). Above all, our investors can
now compare us more easily and more
rapidly with international competitors.
Tough stock market climate in 2001
The year 2001 started with great promise
for our share. On January 30 of the re-
porting year, it reached a record high of
€ 105.64 in a friendly market.
Our share could not, however, escape
the subsequent decline in sentiment on
the capital markets. At the end of March,
the share price fell to € 75, returning to
that level at the end of August after an
interim peak.
The attacks of September 11, 2001
struck the very heart of the international
capital markets. Worldwide, share prices
dropped in many cases on a scale never
Shareholders
U s e f u l i n f o r m a t i o n o n t h e D e u t s c h e B a n k s h a r e
2001
Change in total return of Deutsche Bank share (9.5 %)
Share of Deutsche Bank equity in stock market turnover in Germany 7.6 %
Average daily trading volume 11.77 million shares
as at 31.12.2001
Shares in circulation 621,568,446
Share capital € 1,591,215,221.76
Market capitalization € 48.8 billion
Share price* € 79.30
Weighting in the DAX 6.8 %
Weighting in the Dow Jones STOXX 50 1.6 %
Securities identification codes
Registered shares 514 000 Deutsche Bank share NYSE**
Reuters DBKGn.DE Type of issue Global Registered Share
Bloomberg DBK GR Currency $
Symbol DB
ISIN DE0005140008
CINS D 18190898
* Frankfurt Stock Exchange ** New York Stock Exchange* http://nyse.db.com

thought possible. On September 21,
Deutsche Bank’s share reached the year’s
low of € 43.20.
The subsequent strengthening of our
share price is largely a reaction to the pre-
ceding share price decline. Over and above
that, stock market sentiment improved
strongly again in the fourth quarter, with
the main stimulus coming from hopes of
a cyclical turnaround in the U.S. economy.
At the end of 2001, our share closed at
€ 79.30, almost 84% above its annual low.
In the strained market environment of
2001, characterized for long periods by great
uncertainty, the Deutsche Bank equity held
up well with a price weakening of 9.5%
in the course of 2001. This stood out posi-
tively against other big German bank
stocks. The decrease was less than half
of the decline of the DAX German share
index (– 19.8%) representing the German
stock market. Compared with international
stock markets, too, our share turned in a
much better development. The EURO Stoxx
50 index, for example, which contains
European blue chip equities, shed 17.4 %
in 2001.
At the end of 2001, Deutsche Bank’s
market capitalization was € 48.8 billion. At
the same time, the Deutsche Bank share
had a weighting of 6.8% (2000: 6.2%) in
the DAX German share index. The volume
of trading in Deutsche Bank shares in 2001
was roughly € 237 billion, ranking us in fifth
place among the DAX stocks.
Profitable investment in the long term
With an average annual return of 11.8%
since 1980, our share developed much more
Number of shareholders
in thousands
0
100
200
300
400
500
’97 ’98 ’99 ’01
523539
499
’00
382
494
Distribution of share capital
621.6 million shares
Insurance companies,mutual fund companies23%
Other privatepersons8%
Employed personsand pensioners11%
Other institutionalinvestorsand companies58%
dynamically than CDAX Banks (+ 8.8%) and
also outperformed the DAX German share
index (+ 11.2%). If an investor had bought
Deutsche Bank shares worth the equivalent
of € 10,000 at the beginning of 1980, the
value of his portfolio would have increased,
with no additional capital input, to € 115,769
by the end of 2001. In the long term, there-
fore, Deutsche Bank was an extremely
attractive investment for shareholders.
More shareholders
Over the year, the number of registered
shareholders rose to 523,059 as at
December 31, 2001 (2000: 494,219). This
is especially gratifying as the number of
direct shareholders in Germany fell by
8.6% overall. Non-residents again raised
their share of Deutsche Bank: as at the
end of 2001, they held roughly 53 % of our
share capital. Of the total 621,568,446
shares in circulation, almost 19% are held
by private persons, and 81% by institutional
investors. Deutsche Bank has no major
shareholders with a share of more than 5%
to be reported under § 21 German Securi-
ties Trading Act. According to its own state-
ments, LaCaixa, the largest Spanish sav-
ings bank, holds approximately 4 % of
Deutsche Bank’s shares.
Stronger presence at General Meeting
Our General Meeting took place on May17,
2001, in the Frankfurt Festhalle. Roughly
5,300 participants (2000: 5,600) attended
and 34.4% (2000: 31.9%) of the bank’s
voting capital was represented. We were
thus able to increase shareholder participa-
tion again after the low point in 2000.
20

21
After brisk discussion between share-
holders and Deutsche Bank’s Board of
Managing Directors, all items on the agen-
da were approved by large majorities. One
resolution concerned the enhancement
of our share programs for executives
(Deutsche Bank Global Partnership Plan).
Another decision will facilitate the exercise
of voting rights at our General Meetings
beginning in 2002.
Internet gaining importance
In our communication with private inves-
tors, institutionals and analysts, we are
making greater use of the Internet*. It
allows us to broadcast information simul-
taneously worldwide and facilitates our
dialogue with shareholders.
We therefore continued to invest in
the expansion of this communication chan-
nel to improve user friendliness and in-
crease access frequency. For example,
we expanded the information service for
shareholders using e-mail and introduced
procedures to analyze the price of our
share. Furthermore, we publish all dates
important to shareholders well in advance.
Events are broadcast in the Internet and
stored for later replay. Interested persons
can also access lectures and presenta-
tions by members of the Board of Manag-
ing Directors. This adheres to the best
corporate communication practices. Higher
visit figures and excellent rankings for our
Internet site in numerous competitions
confirm our belief that we are on the right
path.
Dividend proposal for 2001
It is proposed to the General Meeting on
May 22, 2002, that an unchanged dividend
of € 1.30 per share be paid for the 2001
financial year. This also reflects our confi-
dence for the 2002 financial year.
Shareholders
� Deutsche Bank� DAX� CDAX Banks
Long-term value
100
300
500
700
900
1,100
1,300
1,500
Total Return Index, beginning of 1980 = 100Source: Datastream
’80 ’86 ’90 ’92 ’94 ’96 ’98 ’00 ’02’82 ’84 ’88
* www.deutsche-bank.com/ir

Global Reach. Deutsche Bank has undergone
a very dramatic and compelling transformation over recent
years. While broad global reach is rare, building the accompa-
nying global culture is even more so, and ensures lasting
shareholder value.
Robert Albertson, President, Pilot Financial LLC, New York
The Image of the Guggenheim Museum is a registered trademark of the Solomon R. Guggenheim Foundation. Used by permission.

Corporate and Investment Bank Client-oriented investment banking with global reach.
23
The formation of Group Division Corporate
and Investment Bank* (CIB) in February
2001 combined Deutsche Bank’s global
investment banking franchise with its Euro-
pean corporate banking network. The inte-
grated corporate and investment banking
platform improves our possibilities of offer-
ing a maximum standard of client service
from one source.
The turmoil on the international debt
and equity markets confronted CIB with
great challenges in its first financial year.
The already worsening trend in the world
economy was heightened by the terrorist
attacks in the U.S.A. in September.
Despite the widespread uncertainty,
CIB’s businesses performed well. This
demonstrated our expertise in delivering
creative solutions to our customers. Nu-
merous landmark transactions and deal
completions showed that the groundwork
of recent years has built a formidable and
diverse investment banking platform. In
many product areas, we increased our
market shares in 2001.
CIB is now firmly established among
the bulge bracket of investment banks and
we are convinced that we have both the
structure and strength to sustain this lead-
ing position.
This was confirmed by the bank top-
ping the Euromoney Poll of Polls for the
third successive year, and within that poll,
being placed number one in underwriting
and advisory. In 2001, this poll was domi-
nated by firms that are providing clients
with the new concept of universal banking.
This reflects the growing belief that the
new business paradigm will be led by
those banks that integrate the delivery of
investment, commercial and transaction
banking services in a customer-centric
fashion.
The Corporate and Investment Bank
Group Division is structured in two seg-
ments: Corporate Banking & Securities
and Global Transaction Banking. The goals
Customers
C o r p o r a t e a n d I n v e s t m e n t B a n k*
in € m. 2001 2000
Net revenues 17,436 17,894
Provision for loan losses (704) (153)
Noninterest expenses (14,029) (13,612)
including: Goodwill amortization (451) (392)
Restructuring activities (213) 102
Income before income taxes 2,703 4,129
Average allocated equity 17,034 16,010
Risk-weighted positions (BIS) 211,253 211,104
Segment assets 751,406 734,774
* for notes, see Reporting Segment Information on page 152.
Results 2001
At € 17.4 billion, net revenues in CIB almost
matched the previous year’s level. In a difficult
environment, our balanced product portfolio
and global reach proved their worth. While
revenues from the trading and placement of
fixed-income securities increased strongly, the
previous year’s figures were not matched in
equities trading and equities issuing business.
Income before income taxes was E 2.7 billion.
This includes higher restructuring activities,
severance payments and goodwill amortization,
as well as increased provision for loan losses
due to the deteriorated economic environment.
* www.db.com

for CIB are: leadership in the respective
markets; optimum utilization of capital
employed; strong profitability, first-class
earnings quality; maximum contribution to
shareholder value and exploitation of all
potential revenue synergies, especially in
cooperation with Group Division Private
Clients and Asset Management (PCAM).
Corporate Banking & Securities
The Corporate Banking & Securities Corpo-
rate Division brings together the bank’s
corporate finance activities and its sales
and trading businesses. Sales and trading
are aligned into the Business Divisions
Global Markets and Global Equities.
Global Markets. Global Markets compris-
es all trading, sales and research in foreign
exchange, government, agency and invest-
ment grade debt, emerging markets,
exchange-traded, OTC and credit deriva-
tives, commodities, structured transac-
tions, money markets, repo and securiti-
zation.
In 2001, Global Markets’ performance
was driven by our leading position in flow
businesses such as foreign exchange,
money markets and government bonds,
and innovation in high value-added areas
such as OTC and credit derivatives.
Deutsche Bank also played a critical role in
restoring stability to world currency and
bond markets following the terrible events
of September 11.
In 2001, Deutsche Bank was again
the most active European underwriter in
the international bond markets. We raised
more than E 140 billion for leading names
Global Markets:
credit derivative trading
Notional volumes in E bn.
! Credit swaps! Asset swaps
’97 ’98 ’99 ’00 ’01
10
50
40
30
20
0
5255
40
35
25
1617
11
5
from the telecoms, automotives, tech-
nology, engineering, media and financial
sectors. Five deals in which we played a
key role were named as Deals of the Year
in Euroweek’s Bond Poll. Also in the
magazine’s poll, we were highlighted for
our support for deals in the secondary
market and our ability to provide realistic
pricing.
The bank topped industry league
tables for all Euromarket issues and euro-
denominated bonds in 2001. Furthermore,
we were a leading underwriter in key sec-
tors of the bond markets in the U.S.,
including agency debt and asset-backed
securities. Among Global Markets’ major
achievements in 2001 was a record-break-
ing $ 40 billion interest rate derivatives
transaction structured on behalf of one of
the premier retail banks in the United
States.
The ability to raise capital for clients
was again recognized in industry polls and
surveys. For the third year in succession,
Deutsche Bank was named best at capital
raising by Euromoney magazine, and the
leading underwriter of international bonds.
Global Markets also made significant mar-
ket share gains with key clients, through a
proactive and globally co-ordinated rela-
tionship management initiative. Moreover,
the bank was named best risk manage-
ment house by Euromoney and won covet-
ed awards for Euro House of the Year and
European Investment Grade Corporate
Bond House of the Year in International
Financing Review’s (IFR) annual review.
24

25
Global Equities. Business Division Global
Equities comprises cash equities, research,
sales and trading, equity derivatives struc-
turing and trading as well as equity prime
services.
In 2001, Global Equities’ performance
was characterized by substantial outper-
formance in equity derivatives and equity
prime services. Against a background of
volatile market conditions, which impacted
the cash equities business and resulted
in a reduction in equity capital markets ac-
tivity, we maintained our position as a lead-
ing originator of equity-linked and equity
capital markets products.
Scale and diversification on both a
product and regional basis were achieved.
Deutsche Bank retained its dominant posi-
tion in European equities and was among
the leaders in all markets, notably the
United Kingdom, Germany, Italy, Switzer-
land, Spain, Austria and Finland. In the U.S.,
for the first time, we established ourselves
among the top 10 in U.S. equities and
executed, for a U.S. institution, the largest
ever global program trade.
In Asia we have established ourselves
as the number one firm in Japanese equi-
ties. Our presence in the region has also
been bolstered by the opening in Taiwan of
our equity brokerage, Deutsche Securities
Asia Limited. The creation of a dedicated
emerging markets platform is expected to
strengthen operations in Asia, Latin Ameri-
ca and Emerging Europe.
Corporate Finance. The realignment of
Deutsche Bank’s businesses in February
2001 had a positive effect on its corporate
finance activities. Business Division Global
Corporate Finance, which comprises
mergers and acquisitions, equity capital
markets, credit products, and relationship
management, benefited from the greater
connectivity with PCAM. There was also a
continued build-up of the bank’s corporate
finance franchises in Continental Europe,
the Americas and Asia. In relationship
management the bank successfully inte-
grated its large corporate and middle cor-
porate business around its defined target
market in Continental Europe. Lending
was leveraged to create strategic alliances
with clients and to win new mandates for
advisory, securities and transaction bank-
ing business. In Germany, client segmen-
tation and the introduction of structured
finance centers have enhanced the bank’s
coverage of mid-cap clients, a segment
that remains an important part of
Deutsche Bank’s business strategy.
The combination of strong industry
expertise and product knowledge, which
enables us to accommodate specific cus-
tomer wishes, brought us some impres-
sive mandates. For example, Deutsche
Bank played a lead role in the largest cap-
ital increase in Continental Europe, a
E 5 billion offering for a Dutch telecom com-
pany. We also played a leading role in the
largest IPOs in Germany and Asia. In addi-
tion, a E 2.8 billion equity-linked transac-
tion for one of Switzerland’s pre-eminent
companies, a £1 billion placement of equi-
ty certificates in the media sector, and a
Customers
1
2
3
4
5
6
7
1 1 1
3
6
Corporate and Investment Bank:
No. 1 for the third time
Rank
Source: Euromoney Magazine/Poll of Polls
’97 ’98 ’01’99 ’00
Global Corporate Finance:
growing market shares in M&A
in %
! 2000! 2001
0
5
10
25
35
Global U.S.A. Europe Germany
3
38
1412
Announced deal volumeSource: Thomson Financial Securities Data
15
20
30
3 4
1412

$1.2 billion convertible for a major U.S.
firm all reinforced Deutsche Bank’s reputa-
tion for innovative financial engineering.
We also saw progress in mergers and
acquisitions, despite a slowing in global
M&A volumes by almost 50 % to the low-
est level since 1997. Deutsche Bank was
the only advisor in the top 10 to increase
its deal volumes in 2001.
The bank played a pivotal role in three
of the top 10 global deals and worked with
its clients on a number of groundbreaking
cross-border transactions, including a ma-
jor energy sector acquisition, a first-time
advisory mandate from a leading oil com-
pany, and a major transatlantic media sec-
tor transaction.
In global credit products, we built a
market-leading business in 2001 in lever-
aged finance, real estate and loan portfolio
management. In the structured finance
market segment, we enhanced our com-
petitive position. IFR named us European
Leveraged Loan House of the year and
High Yield Bond House of the year 2001.
Deutsche Bank was also ranked number
one in Commercial Mortgage Backed
Securities and Global Loan Syndications.
Global Transaction Banking
The Global Transaction Banking segment
comprises securities services, cash man-
agement and trade finance. Underlining
the success of these businesses, Deut-
sche Bank was voted Best at Transaction
Services Europe in the 2001 Euromoney
Awards for Excellence poll.
Global custody, fund services, port-
folio management and corporate trust and
Asset-backed securities:
increasing U.S. market
penetration
in %
9.9
0
2
4
6
8
’99 ’00 ’01
8.5
1.8
Outstanding volumeSource: Thomson Financial Securities Data
agency services took significant steps in
2001 towards making Deutsche Bank one
of the leading providers of securities ser-
vices. Corporate trust and agency services,
which ranks among the leading providers
of debt, equity and structured finance ser-
vices globally, continued to expand in 2001,
opening an office in Tokyo for the Japanese
domestic market. Deutsche Bank’s custody
operation consolidated its position as
Europe’s leader and is now among the top
five custodians worldwide.
In fund services, Deutsche Bank
retained its position as one of the largest
providers of fund services in key offshore
markets, winning a number of significant
new mandates with large U.S. and Euro-
pean asset managers. We are also one of
the top two agency lenders in terms of
securities on loan, and one of the largest
providers of money market funds for
clients to optimize yields on excess cash.
New products and significant man-
dates have established Deutsche Bank as
a leading provider of cash management
services to corporates and financial institu-
tions worldwide. Industry accolades in
2001 included a prestigious Euromoney
award for excellence as the world’s best at
Cash Management & Payments and a top
two placing in Euromoney’s Cash Manage-
ment Poll. Our position as the dominant
cash management house in Europe was
emphasized in Treasury Management Inter-
national magazine’s awards for excellence.
In recognition of the increasing shift
in our clients‘ global purchasing behavior,
further investment was made in aligning
regional products and infrastructure. We
26

27
also embarked on a major program of ex-
pansion for our corporate business in the
United States.
In Global Trade Finance, which com-
bines all of Deutsche Bank’s trade and
export finance businesses, we have main-
tained our leading position in Europe and
Asia while continuing to expand in the
Americas.
Our ability to hedge the risks attached
to trade flows was recognized by Asia Risk
magazine with a number one ranking in
Asia in risk management-related services.
Throughout 2001, Deutsche Bank led
a number of syndicated trade transactions,
notable mandates included a financing
package for an oil company. We also
played key roles in deals, for example, in
Romania and Brazil. We led a ground-
breaking Japanese buyer credit program in
the cruise ship sector.
Customers
834
2,962
655
’99 ’00 ’01
0
1,000
1,500
2,000
2,500
500
Mandated arrangersSource: Dealogic Loanware
Syndicated Trade Loans
Volume in € m.

Trust. We all look for safe values in life. But they are hard to find.
That’s why I feel so satisfied with my investment in Deutsche Bank.
I know I can rely on their professional and visionary management. I am
in good hands.
María Isabel Vilalta, Private Shareholder, Barcelona

Private Clients and Asset ManagementFoundations laid for global market leadership.
29
In 2001 we in the Private Clients and
Asset Management Group Division
(PCAM), consisting of three segments:
Personal Banking, Private Banking and
Asset Management, laid the foundations
for world leadership in scale and global
reach, on the one hand, and efficiency
of internal structures and costs, on the
other. The new business model is consist-
ently aligned with the needs of our custo-
mers and with the value chain across our
segments. A single investment process
for all products gives our program greater
transparency and enhances its quality.
To take account of our different cus-
tomer groups, we have divided our distri-
bution channels into three parts: Deutsche
Bank 24, Private Banking and Private
Wealth Management. This differentiation
enables us to provide a better service
to affluent, wealth-accumulating clients
across Europe. Worldwide, we offer
tailored problem solutions to meet the
complex needs of very wealthy clients.
A common infrastructure for PCAM
creates synergy potential. We made
connectivity more tangible for our clients
as we systematically focused on strength-
ening the links with Corporate and Invest-
ment Bank (CIB), enabling clients around
the world to directly access capital mar-
kets and at the same time considerably
increasing our distribution and placement
capabilities.
2001 also marked a quantum leap
forward for Deutsche Bank as a global
asset manager: the agreed acquisition of
Scudder, the “Deal of the Year” according
to the magazine Institutional Investor,
will take Deutsche Bank into the “bulge
bracket” group of asset managers. We
also closed a strategic partnership with
Deutsche Vermögensberatung (DVAG),
which strengthened our client potential for
banking and investment products in Ger-
many and Austria by 3.3 million persons.
Customers
P r i v a t e C l i e n t s a n d A s s e t M a n a g e m e n t*
in € m. 2001 2000
Net revenues 10,993 12,519
Provision for loan losses (206) (192)
Noninterest expenses (10,390) (10,924)
including: Goodwill amortization (221) (213)Policyholder benefits and claims (2,948) (3,912)Restructuring activities (81) 14
Income before income taxes 397 1,403
Average allocated equity 3,392 3,045
Risk-weighted positions (BIS) 56,649 49,037
Segment assets 125,743 113,079
* for notes, see Reporting Segment Information on page 152.
Results 2001
In 2001, PCAM generated net revenues of
E 11 billion after E 12.5 billion in the preceding
year. The decrease was mainly due to lower
revenues from investments in our insurance
business and our customers’ restraint with
regard to securities transactions. Noninterest
expenses, at E 10.4 billion, were E 0.5 billion
below the previous year. While policyholder
benefits and claims were lower, the expense for
business operations (e.g. due to the introduc-
tion of euro cash) increased. Over the year, the
cost containment measures took effect increas-
ingly. Income before income taxes came to
E 0.4 billion after E 1.4 billion in 2000.
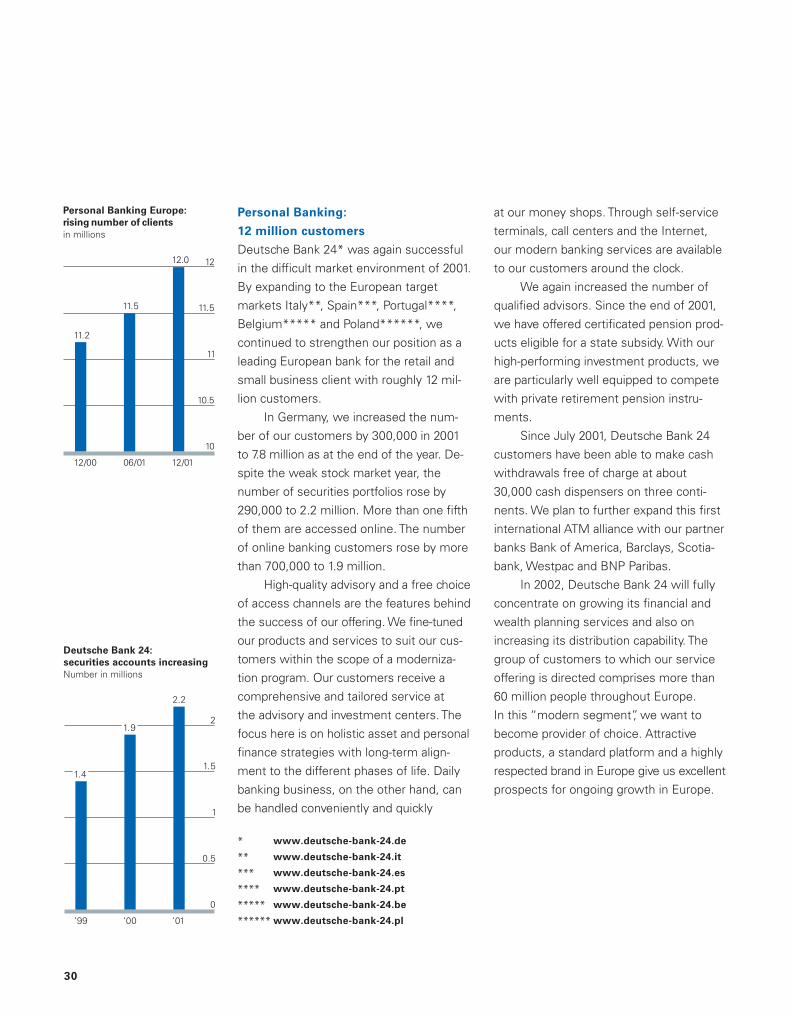
Personal Banking:
12 million customers
Deutsche Bank 24* was again successful
in the difficult market environment of 2001.
By expanding to the European target
markets Italy**, Spain***, Portugal****,
Belgium***** and Poland******, we
continued to strengthen our position as a
leading European bank for the retail and
small business client with roughly 12 mil-
lion customers.
In Germany, we increased the num-
ber of our customers by 300,000 in 2001
to 7.8 million as at the end of the year. De-
spite the weak stock market year, the
number of securities portfolios rose by
290,000 to 2.2 million. More than one fifth
of them are accessed online. The number
of online banking customers rose by more
than 700,000 to 1.9 million.
High-quality advisory and a free choice
of access channels are the features behind
the success of our offering. We fine-tuned
our products and services to suit our cus-
tomers within the scope of a moderniza-
tion program. Our customers receive a
comprehensive and tailored service at
the advisory and investment centers. The
focus here is on holistic asset and personal
finance strategies with long-term align-
ment to the different phases of life. Daily
banking business, on the other hand, can
be handled conveniently and quickly
1.9
1.4
Deutsche Bank 24:
securities accounts increasing
Number in millions
0
0.5
1
1.5
2
’99 ’00 ’01
2.2
10
10.5
11
11.5
12
12/00 06/01 12/01
11.2
12.0
11.5
Personal Banking Europe:
rising number of clients
in millions
at our money shops. Through self-service
terminals, call centers and the Internet,
our modern banking services are available
to our customers around the clock.
We again increased the number of
qualified advisors. Since the end of 2001,
we have offered certificated pension prod-
ucts eligible for a state subsidy. With our
high-performing investment products, we
are particularly well equipped to compete
with private retirement pension instru-
ments.
Since July 2001, Deutsche Bank 24
customers have been able to make cash
withdrawals free of charge at about
30,000 cash dispensers on three conti-
nents. We plan to further expand this first
international ATM alliance with our partner
banks Bank of America, Barclays, Scotia-
bank, Westpac and BNP Paribas.
In 2002, Deutsche Bank 24 will fully
concentrate on growing its financial and
wealth planning services and also on
increasing its distribution capability. The
group of customers to which our service
offering is directed comprises more than
60 million people throughout Europe.
In this “modern segment”, we want to
become provider of choice. Attractive
products, a standard platform and a highly
respected brand in Europe give us excellent
prospects for ongoing growth in Europe.
30
* www.deutsche-bank-24.de
** www.deutsche-bank-24.it
*** www.deutsche-bank-24.es
**** www.deutsche-bank-24.pt
***** www.deutsche-bank-24.be
****** www.deutsche-bank-24.pl

31
Private Banking: market position
strengthened
Private Banking* serves roughly 530,000
clients in 39 countries, 340,000 of them
in Germany. At their disposal are 7,600
employees at 350 Private Banking Centers
throughout the world. Invested assets
amounted to roughly € 240 billion as at
the end of 2001.
In the U.S.A., Private Banking and
Deutsche Banc Alex. Brown Private Client
Services cooperated even more closely in
the year under review.
In Asia, the Middle East, Latin Ameri-
ca and Central Europe, business devel-
oped very well in 2001. The workforce was
reinforced with experienced relationship
managers and we widened our range of
services and products.
In 2001 we improved our services for
ultra-high-net-worth clients. Above all, we
developed a tailored offering including the
underlying IT platform and substantially
increased our marketing efforts for this
clientele.
Private Banking is also dedicated to
the non-financial needs of these demand-
ing customers, such as their philanthropic
activities or setting up trusts, etc. In our
Private Wealth Management, we have
combined resources with specialized
know-how to ensure optimal fulfilment of
the special requirements of very wealthy
persons and families.
In Germany, business developed sat-
isfactorily despite the difficult conditions.
Since 2001, a new price model has clearly
separated the substantially reduced costs
for transactions from the costs for advi-
sory services, creating transparency for
customers. The price model, with which
we are pioneers in Germany, decouples
discretionary portfolio management rev-
enues from capital market developments.
The mission of Private Banking is to
provide “Best Advice” for clients. The key
element here is staff training (including the
Qualified Financial Consultant Program). In
addition, all customer advisors have been
brought together at Private Banking Cen-
ters to permit operation on the market
with larger and stronger units. In this way,
we offer our clients holistic wealth man-
agement from one source. To make access
to Private Banking services even easier we
optimized our “Customer Service Line”
and our online service which was judged
number 1 in Germany by three indepen-
dent studies. We again grew our mandate
business (Asset Management and Person-
al Portfolio Advisory) in a difficult environ-
ment.
Progress was made in developing an
open product architecture where propri-
etary products are supplemented by high-
quality products from third-party providers.
The new, global investment process will
help us translate customer needs more
effectively into product solutions.
International Private Banking
also successful outside
Germany*Invested assets per clientin € thousands
’98 ’99 ’00 ’01
0
300
450
600
750
150
900903
583534
406
* Excluding Deutsche Banc Alex. Brown* Private Client Services.
Customers
* www.db-privatebanking.com

maxblue: successful start
maxblue*, Deutsche Bank’s online invest-
ment center, was launched in April 2001.
Right from the beginning, maxblue suc-
ceeded in bucking the market trend
and achieved high growth rates both in
terms of clients and transactions.
Apart from Germany and Spain**, max-
blue has also been active in Italy***
since December 2001.
maxblue is the platform for all of
Deutsche Bank’s online securities business.
Clients are free to choose whether they
wish to use electronic access alone or
take advantage of personalized financial
advice at Deutsche Bank 24 or at our
Private Banking Centers.
At the end of the year, maxblue
already had more than 500,000 users for
its online brokerage services through the
online investment center. With regard to
brand awareness, maxblue, just eight
months after the launch, had already
caught up with the big competitors in
Germany.
maxblue gives all users access to the
proprietary research expertise of Group
Division Corporate and Investment Bank
(CIB). This also allows private customers to
access the international capital markets.
maxblue is basically open to partner-
ships. The first cooperation model – with
Banco do Brasil – was launched at the end
of 2001****.
DWS 23.2%
DWS:
Market leader in Germany
Total of E 361.6 bn. in 2001
Source: BVI Bundesverband DeutscherInvestment- und Vermögensverwaltungs-Gesellschaften
Asset Management
In Asset Management we are one of the
world’s leading global investment manage-
ment organizations. This applies equally in
terms of size, quality, product range and
international reach.
As global provider, we operate in all
three regions of the Triad (Europe, America
and Asia/Pacific). Distribution is grouped
into retail, institutional and alternative
investments. Our business profited in 2001
from the growing popularity of alternative
investments and innovative products.
Market leader in Europe
In Europe, Deutsche Asset Management
is market leader in both the retail and insti-
tutional businesses. Despite a year of chal-
lenging markets, we improved our market
share in the institutional sector with more
than 150 new mandates in the U.K. and
50 new mandates in Germany. These new
business wins reflect our reputation for
equities, fixed income and balanced port-
folios. In 2001, business generation activity
was also significantly accelerated in other
European countries, including Italy, France,
Benelux, Spain, Austria, Ireland and
Switzerland.
The trend in our European mutual
fund business was excellent. In Germany
our DWS Group expanded its market
share to over 23 %. Contributing to this
success was DWS’ prolific innovation in
the guarantee and money market fund
business. Once again our mutual funds
won numerous performance awards. In
Germany, for instance, DWS* was named
32
* www.maxblue.com
** www.maxblue.es
*** www.maxblue.it
**** www.maxblue.com.br * www.dws.de
33
fund company of the year for the seventh
time running in the Standard & Poor’s
Fund Awards. DWS took similar honors in
Austria, Switzerland, France, the U.K. and
Belgium. Morningstar, the research com-
pany, rates DWS as Europe’s top-perform-
ing large European fund company.
Italy again played a key role in the
profitability of our European mutual fund
business. We are the largest foreign fund
manager in this market.
As part of the continued development
of our European mutual fund operations,
we shall offer a standard product range
under the brand name “DWS Investments”.
Asia/Pacific
Deutsche Asset Management continued
to be a market leader in 2001 in the
Asia/Pacific region. In terms of funds
under management, we remained the
largest global fund manager in the region,
the largest foreign fund manager in Japan
and the fourth largest fund manager in
Australia.
New dimension with Scudder
In 2001, the decision was taken to signifi-
cantly broaden our business base, especial-
ly in the U.S.A. On December 4, Deutsche
Bank and Zurich Financial Services agreed
that Deutsche Bank would acquire Scud-
der, the asset management company, for
$ 2.5 billion.
In bringing these two organizations
together, our Asset Management Cor-
porate Division will enter a new dimension.
With assets under management then
totalling more than € 900 billion (end of
2001), a leading position in this global mar-
ket is expected. The link with Scudder will
open up additional expertise and expand
the product range, which will also benefit
the customers of Private Banking and
Deutsche Bank 24. Furthermore, the broader
product range will enable us to make more
effective use of our global resources on a
uniform platform.
The Americas
In its 80 years of activity, Scudder has ear-
ned an outstanding reputation. The brand
will therefore be used for our entire mutual
funds business in the U.S.A. Institutional
business will also be significantly enhanced
by this acquisition. We can then provide a
full array of integrated products and services
on a single platform.
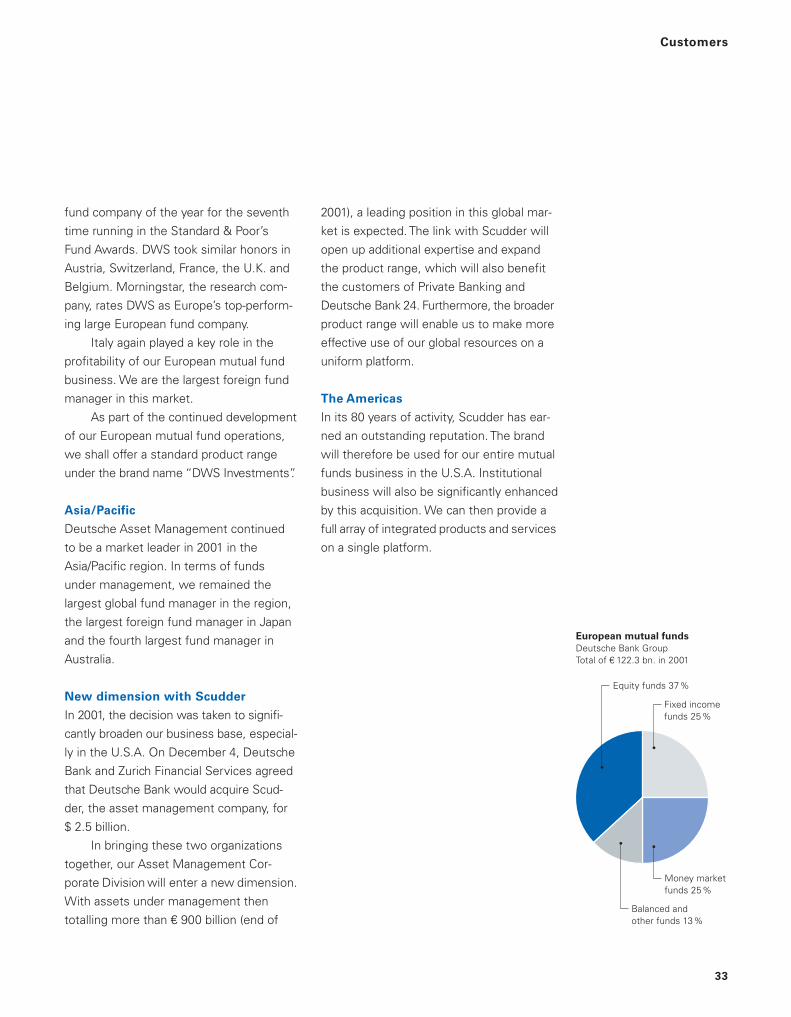
European mutual funds
Deutsche Bank GroupTotal of E 122.3 bn. in 2001
Equity funds 37%
Money marketfunds 25%
Balanced andother funds 13%
Fixed incomefunds 25%
Customers

Fresh Ideas. We have long admired Deutsche Bank for its deter-
mination to creatively lead its industry. As a long-term shareholder, business
partner, and friend, we regularly exchange innovative ideas that bridge our
respective corporate visions and cultures.
Hideichiro Kobayashi, Managing Director, Nippon Life Insurance Company,
Tokyo

Corporate Investments Investments in private equityand real estate brought together with traditional industrial holdings.
35
Group Division Corporate Investments
emerged in February 2001 from the realign-
ment of Deutsche Bank. It was formed
through the combination of activities pre-
viously dispersed throughout the Group.
Corporate Investments primarily consists
of investments in private equity (including
venture capital, buyouts, mezzanine and
fund investments) and real estate, on
the one hand, and traditional industrial
shareholdings and other investments
(DB Investor), on the other. The mission of
Corporate Investments is to achieve mar-
ket leadership in the various segments and
to generate the highest possible overall
return for third-party investors and for our
own funds.
Private equity is one of our global
core businesses, generating value for in-
vestment banking and asset management
business. Conversely, the ability to lever-
age Deutsche Bank’s global network gives
us a strong competitive advantage in the
private equity market.
The total assets in Corporate Invest-
ments at the end of 2001 were € 45.6 bil-
lion and were made up as follows: Private
Equity: € 7.1 billion, DB Investor: € 26.5 bil-
lion, and Other Corporate Investments:
€ 12.0 billion. The latter consists of Real
Estate (€ 3.5 billion), Lending Activities
(€ 7.1 billion) and Other (€ 1.4 billion).
Private Equity
DB Capital Partners* is the Deutsche Bank
unit responsible for private equity invest-
ing. At the beginning of 2001, all of the pri-
vate equity activities of Deutsche Bank
were consolidated under the management
of DB Capital Partners. Since then all of
our private equity holdings have been part
of a unified global platform.
2001 was one of the most difficult
private equity markets in recent history
due to contracting profits, declining stock
Customers
* www.dbcapitalpartners.com
C o r p o r a t e I n v e s t m e n t s*
in € m. 2001 2000
Net revenues 1,968 3,548
Provision for loan losses (105) (132)
Noninterest expenses (1,623) (1,382)
including: Goodwill amortization (156) (71)
Income before income taxes 240 2,034
Average allocated equity 6,081 3,471
Risk-weighted positions (BIS) 32,468 25,769
Segment assets 45,594 37,916
* for notes, see Reporting Segment Information on page 152.
Results 2001
Net revenues and income before income taxes in
2001, at E 2.0 billion and E 0.2 billion respectively,
were well below the previous year figures. This
reflected, above all, the higher write-downs and
adjustments to the value of our investments
in private equity and real estate due to the diffi-
cult capital market conditions. We also gener-
ated smaller proceeds from the sale of industrial
shareholdings.
Direct private equity
investments by region
Total of € 4.2 bn. in 2001
United States39%
Rest of world8%
Europe excludingGermany17%
Germany36%
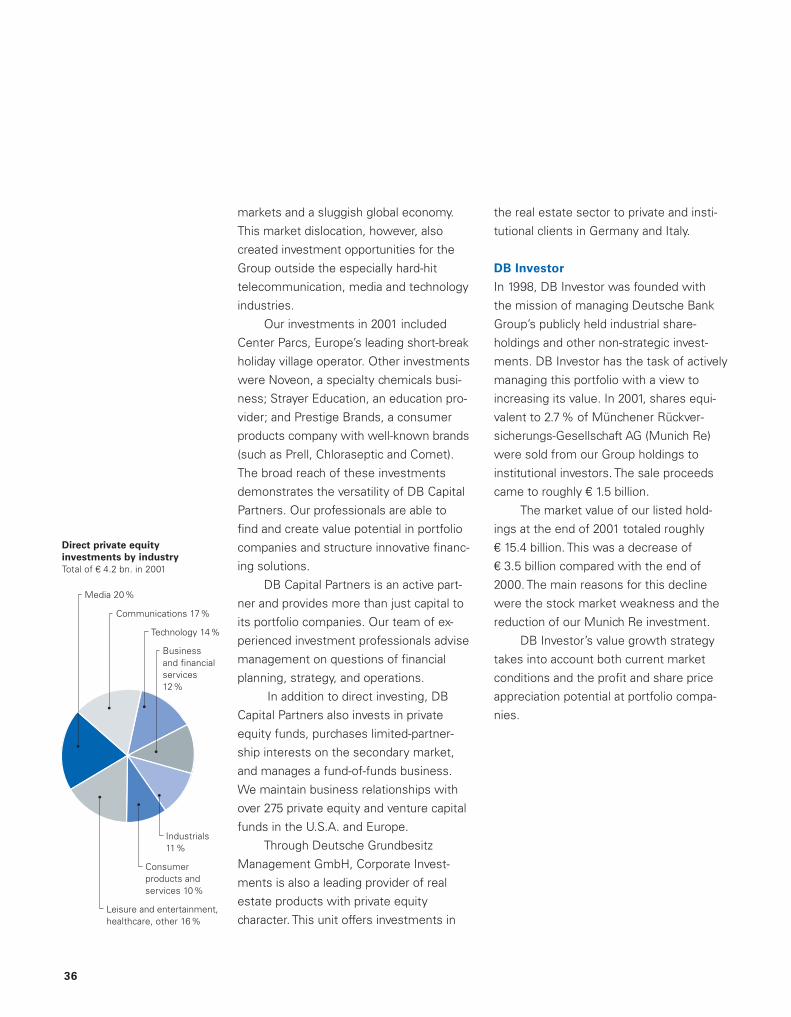
markets and a sluggish global economy.
This market dislocation, however, also
created investment opportunities for the
Group outside the especially hard-hit
telecommunication, media and technology
industries.
Our investments in 2001 included
Center Parcs, Europe’s leading short-break
holiday village operator. Other investments
were Noveon, a specialty chemicals busi-
ness; Strayer Education, an education pro-
vider; and Prestige Brands, a consumer
products company with well-known brands
(such as Prell, Chloraseptic and Comet).
The broad reach of these investments
demonstrates the versatility of DB Capital
Partners. Our professionals are able to
find and create value potential in portfolio
companies and structure innovative financ-
ing solutions.
DB Capital Partners is an active part-
ner and provides more than just capital to
its portfolio companies. Our team of ex-
perienced investment professionals advise
management on questions of financial
planning, strategy, and operations.
In addition to direct investing, DB
Capital Partners also invests in private
equity funds, purchases limited-partner-
ship interests on the secondary market,
and manages a fund-of-funds business.
We maintain business relationships with
over 275 private equity and venture capital
funds in the U.S.A. and Europe.
Through Deutsche Grundbesitz
Management GmbH, Corporate Invest-
ments is also a leading provider of real
estate products with private equity
character. This unit offers investments in
Direct private equity
investments by industry
Total of € 4.2 bn. in 2001
Industrials11%
Media 20%
Communications 17%
Technology 14%
Businessand financialservices12%
Consumerproducts andservices 10%
Leisure and entertainment,healthcare, other 16%
the real estate sector to private and insti-
tutional clients in Germany and Italy.
DB Investor
In 1998, DB Investor was founded with
the mission of managing Deutsche Bank
Group’s publicly held industrial share-
holdings and other non-strategic invest-
ments. DB Investor has the task of actively
managing this portfolio with a view to
increasing its value. In 2001, shares equi-
valent to 2.7% of Münchener Rückver-
sicherungs-Gesellschaft AG (Munich Re)
were sold from our Group holdings to
institutional investors. The sale proceeds
came to roughly € 1.5 billion.
The market value of our listed hold-
ings at the end of 2001 totaled roughly
€ 15.4 billion. This was a decrease of
€ 3.5 billion compared with the end of
2000. The main reasons for this decline
were the stock market weakness and the
reduction of our Munich Re investment.
DB Investor’s value growth strategy
takes into account both current market
conditions and the profit and share price
appreciation potential at portfolio compa-
nies.
36

DB Services Key services bundled for efficiency.
37
DB Services was created in February 2001
as part of our structural realignment. The
new structure comprises three primary
units: Corporate Center Services; IT, Con-
sulting & Transaction Services; and Divi-
sional Functions. Upon formation, DB Ser-
vices employed approximately 10,800 full-
time equivalent staff.
DB Services is managed according
to the strict market principle. The aim is
to achieve a high level of cost and service
transparency, while fostering entrepre-
neurial attitudes. Our clients are mainly our
own Corporate Divisions, but also external
firms. Internal services are provided on
the basis of negotiated service level agree-
ments. Here, DB Services is open to com-
petition with external providers.
Corporate Center Services
The primary task of this unit is the opera-
tional implementation of strategic direc-
tives from the Corporate Center. This
includes, for example, Audit, Communica-
tions, Controlling, Legal, Risk Manage-
ment and Human Resources. The unit also
provides critical services for the bank as
a whole, e.g. in purchasing, building and
facilities management and DB Research.
Roughly 35% of all DB Services staff work
in Corporate Center Services.
IT, Consulting & Transaction Services
This unit accounts for roughly 60% of all
DB Services staff. The range of services
provided stretches from IT development
and support to management consulting
and transaction services. In contrast to
Corporate Center Services, IT, Consulting
& Transaction Services delivers services
to external customers besides our own
business units. The unit is organizationally
divided into four sub-groups: IT Services,
DB Services Global Technology, Consulting
and Transaction Services.
Divisional Functions
Divisional Functions employs about 5 % of
all DB Services employees. It provides
administrative support to DB Services
and to our European regional centers, for
example in Italy, Spain and Portugal.
Developments in 2001
DB Services has changed significantly
since its formation, driven largely by our
cost containment program. The unit has
been streamlined through a combination
of containment measures including divest-
ments/asset disposals. The aim is to sus-
tain individual performance levels and, at
the same time, increase our internal effi-
ciency and overall cost awareness.
Several directives were tightened up
in the short term (e.g. on hiring, travel, and
the contracting of external consultants).
Other measures targeted long-term
effects. We carried out a comprehensive
reengineering process at our building and
facilities management, group purchasing
and securities/cash settlement units.
Corporate Center Services35%
Divisional Functions5%
IT, Consulting &Transaction Services60%
DB Services:
staff by divisions
As at 2/2001: 10,800
Customers

Finally, we reduced holdings not form-
ing part of our core business. Examples
include the sale of our subsidiary emagine
Germany GmbH to GFT Technologies AG,
and the reduction of our stake in Deutsche
Software India Ltd. to less than 50 %.
Outlook
At the end of 2001, we initiated a second
phase of efficiency and quality enhance-
ment. Our approach is two-fold in nature.
The first step is to filter out services which
are less critical to our Corporate Divisions
or are offered at more favorable terms by
external providers. In a second step, we
shall align a large percentage of DB Ser-
vices staff to the Corporate Divisions.
We expect this realignment to bring
us a number of benefits:
– Corporate Divisions will have more influ-
ence on the scope and quality of their
services. Less critical services will be
downscaled or withdrawn.
– The integration of staff offers significant
cost containment potential.
– Reducing the size of DB Services will
simplify the organizational structure.
This will increase cost transparency and
reduce our cost allocation effort.
In 2002, we shall continue in DB Ser-
vices to unlock synergy potential, increase
cost and service transparency and make
our service offering more efficient.
DB Services:
decreasing number of staff
0
2,000
4,000
6,000
8,000
10,000
02/01 12/01
10,800
9,110
38

Corporate Center The Corporate Center is an instrument for the uniform management of the Group by the Board of Managing Directors.
39
The Corporate Center supports the Board
of Managing Directors in its management
and control functions. It forms a binding
element for the Group. The close coopera-
tion between the Corporate Center and the
Corporate Divisions, supported by regional-
ly integrated Divisional Functions, guaran-
tees uniform management of our company
by the Board of Managing Directors.
Risk Management and Controlling
Our risk management organization moni-
tors credit, market and operational risks; it
has great strategic importance. Managed
and coordinated by a lean unit in the Corpo-
rate Center, it is organizationally integrated
into the Corporate Divisions: close to global
business, but still independent.
This also applies to the similarly
aligned Controlling unit in the Corporate
Center. The conversion of the Consolidated
Financial Statements to the U.S. GAAP
reporting standard was particularly work-
intensive in 2001. We thereby fulfilled the
most important condition for the listing
of our shares on the New York Stock
Exchange.
In the course of our bank’s realign-
ment, information technology (IT) was allo-
cated to the Group Divisions. To facilitate
cross-divisional solutions to strategic IT
issues, a Corporate IT Office was set up as
a neutral steering entity in the Corporate
Center. It acts as a liaison unit to coordi-
nate activities and foster communication
between the IT organizations of the Group
Divisions.
Optimal deployment of resources
The objective of our human resources poli-
cy is to improve management quality, en-
hance the methods of personnel selection
and development and integrate other im-
portant factors that shape corporate cul-
ture. The focus here is on strengthening
employees’ identification with the bank,
their motivation and their capabilities.
The Treasury unit in the Corporate
Center is responsible for managing capi-
tal, the balance sheet and liquidity risks
throughout the Group. It coordinates the
allocation of these important financial re-
sources between the Business Divisions.
Its regional and divisional structure worked
excellently in the critical liquidity phase
worldwide in the wake of September 11.
Besides our products as well as our
staff, capital and liquidity, the “Deutsche
Bank” corporate brand in particular counts
among the factors for our success. Its uni-
form profile is steered by the Brand Equity
Management unit. We constantly measure
and analyze our positioning with sharehold-
ers, customers, staff and the community.
Our reputation on the European banking
market ranks among the highest with
respect to important attributes such as
quality, competence and internationality.
Deutsche Bank brand:
strong reputation
Deutsche Bank versusEuropean competitor
! Deutsche Bank! European competitor (Index = 100)
Source: NFO Infratest Financial Research
EU
200
150
100
50
0
Germany
203
100
150
100
Customers

Performance. Exceptional results can only be achieved with
great personal effort. Our customers, Deutsche Bank’s shareholders, and we
as members of staff all share in the benefit.
Simone Meister, Deutsche Bank 24, Starnberg/Munich

Staff – our most important potential forsuccess Competent and client-oriented employees create companyvalue.
41
By the end of 2001, the number of staff
employed by the Group had fallen to 94,782
(previous year: 98,311). In addition to re-
structuring measures, this resulted mainly
from the sale of our asset-based financing
division (GEFA and ALD Group) and a sub-
sidiary emagine (together 2,276 employ-
ees). By contrast, the acquisition of sec-
tions of the French Banque Worms saw an
additional 684 employees join the Group.
Outside Germany, the number of em-
ployees declined by 1,423. At the end of
2001 almost half of all staff were employed
outside Germany (48.8%). The number of
people employed in Germany also fell (by
2,106). The percentage of all staff employed
by the two globally active Group Divisions
is more or less equal: Private Clients and
Asset Management 42.4%, Corporate and
Investment Bank 41.3%. Some 12.9% of
all staff work in DB Services, 2.7% are in
Corporate Investments and 0.7% are
employed in the Corporate Center.
Competitive pressure from the inter-
national markets in addition to ongoing
organizational development at the bank
means personnel adjustments are unavoid-
able. We will implement the personnel
measures already announced, following
agreement with the competent bodies,
without delay and using all human
resources tools available in our “Deutsche
Bank mosaic for employment”.
Promoting talent,
creating opportunities
To be able to provide our clients with the
best financial products and services, and
to ensure our quality and leadership in the
market in the long term, we need the
most talented people. In return, we have
to be an attractive employer. Our employ-
ees are the decisive factor for success.
We not only want to find and develop the
best, we also want to retain them in our
company in the long term. With a view to
these objectives, we carried out a survey
of graduates from leading universities on
Deutsche Bank’s image as an employer.
We derived a talent management strategy
from the results of the survey. We also
obtained exact information on the qualities
a sought-after employer should have.
Consequently, we continued to improve
our offers of employment accordingly.
Convincing environment,
strong culture
Deutsche Bank is striving for a corporate
identity which obliges each individual to
share common values and also, above all,
to incorporate them into their lives. This is
the basis of our personnel policy. Another
important topic involves corporate man-
agement which can get points of view
across and combine inspiration, the provi-
sion of meaning as well as active cultural
organization and humanity.
Staff
S t a f f
2001
Employee Commitment Index 70
Absentee rate 2.6 %
Share of employees leaving the bank for a new job 8.0 %
Training and advanced training (expenses in € million) 257.4

We are an attractive employer thanks
to our demanding offer: responsibility for
challenging tasks is handed over early on.
Success is recognized and personally ac-
credited. We offer enjoyable independent
work and scope to take decisions in an
inspiring environment.
Our diversity concept regards natural
human variety as wealth. Opposites are
not levelled, but rather highly valued and
encouraged. We have undertaken initiatives
to secure our employees’ indispensable
creativity and ability to innovate for the
bank. By giving the huge variety of different
employee groups in our team the opportu-
nity to develop their potential, we, in turn,
can benefit from their varying points of
view and range of experiences. Our efforts
to train women for management positions
have been successful. At the end of 2001,
809 female employees were employed at
management level; in 2000, this number
stood at 650. We are on the right path –
even if there is still a long way to go.
More and more employees wish to
arrange their professional and private lives
more efficiently. If there is harmony
between personal and professional devel-
opment, the mutual enrichment of profes-
sional and private interests will be of bene-
fit to all concerned.
We have accommodated the wish for
more sovereignty with regard to time by
means of a range of flexible time systems.
The “Zeitinvest” service account system
introduced in Germany during the reporting
period is already being used by many staff
members. Employees – including tariff
staff since November 2001 – can place
parts of the monetary and non-cash compo-
nents of their compensation (e.g. salary,
bonuses, payments for extra work, unuti-
lized vacation entitlement) in “Zeitinvest”,
have interest paid on them via the capital
market and then withdraw them as paid
leave in a variety of ways at a later date.
Global career opportunities
Employees often ask what the company
can do to ensure their employability and
increase or maintain their market value.
Under the umbrella of DB University, we
have created a central learning platform
comprising all ongoing professional devel-
opment offers. This includes intranet-based
training, profile events and virtual learning
forms. In so doing, we can strengthen the
competence of our staff while also fulfilling
the desire for individual, flexible and self-
managed learning.
Anyone offering and looking for em-
ployment throughout the Group has un-
limited access to our global internal job
market. This overall transparency promotes
the mobility and development of our staff,
and supports their employability.
Performance-based compensation
We have continued to develop our remuner-
ation concepts and have also incorporated
new programs in line with our require-
ments. One significant innovation is the
“Deutsche Bank Global Partnership Plan”,
approved at the 2001 General Meeting, the
three elements of which, namely shares,
options and cash payments, are directly
dependent on the share price. With the
combination of these components, the
42
Regional distribution
of our staff
Total of 94,782 in 2001
Asia/Pacific/Africa 7.0%
South America0.7 %
Germany 51.2%
Europe (excl.Germany)24.9%
NorthAmerica16.2 %

43
staff participation model satisfies the ex-
pectations of both participating manage-
ment staff and shareholders alike.
Talent for the bank of tomorrow
In the past financial year, Deutsche Bank
recruited 1,000 university graduates from
all parts of the world to meet our interna-
tional requirements. Our comprehensive
concept of finding employees extends from
our positioning as employer of choice with
a professional Internet site* to the cover-
age process after recruitment. In this way,
we are also consolidating Deutsche Bank’s
reputation in the employment market.
We regard trainees as another impor-
tant source of junior staff members. Voca-
tional training contracts were concluded
with 1,257 young people in 2001. At the
end of the year, a total of 3,005 appren-
tices were being trained at Deutsche Bank
Group.
Staff
* www.deutsche-bank.com/career
Staff structure by divisions
Total of 94,782 in 2001
Private Clients andAsset Management42.4%
Corporate andInvestment Bank41.3%
CorporateInvestments2.7%
DB Services12.9%
Corporate Center0.7%

Partnership. Investing in sustainable
development means investing in the future. Deutsche Bank,
an active member of the World Business Council for
Sustainable Development, understands and accepts that
this is a challenge facing each member of society.
Björn Stigson, President, World Business Council
for Sustainable Development, Geneva

Commitment to society Education was the focus ofDeutsche Bank’s society-related activities in 2001.
45
Deutsche Bank assumes responsibility for
the community with its commitment to
society – and not just where it does
business. Based on our values – trust,
teamwork, performance and innovation –
we implement projects relating to social,
cultural, scientific and environmental
issues. Our projects are aimed at sustain-
ability, pursuing the basic idea of “Helping
People to Help Themselves“ and promot-
ing the future prospects of young people.
We work with local partners and our own
foundations and we participate in interna-
tional forums.
Education in competition
Knowledge is the most important raw
material of the future and investments in
education are of primary importance for
all societies. Many of the bank’s society-
related activities in 2001 were therefore
dedicated to the topic of the year: “Orien-
tation for the Future – Education in Com-
petition“. Consequently, we introduced
“Initiative plus“, which provided support to
the voluntary commitment of our staff
members in schools in Germany, the Unit-
ed Kingdom, the U.S.A. and Latin America.
It was also a contribution to the “Interna-
tional Year of Volunteers“ proclaimed by
the UN. More than half of the 1,562 school
projects submitted received financial sup-
port from Deutsche Bank.
Social commitment
Since 1987 we have been demonstrating
our commitment to society in Germany
through the Deutsche Bank Foundation
Alfred Herrhausen “Helping People to
Help Themselves“*. Above all, it supports
projects seeking creative and innovative
solutions to society’s problems, in particu-
lar, for the development of career perspec-
tives for disadvantaged young people.
The Foundation has received widespread
acknowledgement from the public for its
“Youth-School-Industry“ project in which
young people gain insight into business life.
In the U.S.A. we committed ourselves
to the systematic renewal of underdevel-
oped city neighborhoods. The investment
and bond program for an improved stand-
ard of living in urban outskirts initiated by
Deutsche Bank Americas Foundation to-
gether with the Community Development
Group received the award “Outstanding“
Society
S o c i e t y
Spending by foundations and other charitable institutions related to
Deutsche Bank Group, as well as project-related spending (in € m.) 2001
Social affairs
Deutsche Bank Foundation Alfred Herrhausen “Helping People to Help Themselves” 4.0
Deutsche Bank Americas Foundation 16.0
Deutsche Bank Citizenship UK 6.1
Alex. Brown & Sons Charitable Foundation 3.0
other project-related spending 0.4
Culture
Cultural Foundation of Deutsche Bank 2.7
other project-related spending 0.8
Society and the sciences
Deutsche Bank Donation Fund in the Donors’Association for German Science 5.4
Deutsche Bank Institute for Family-Owned Businesses at theUniversity of Witten/Herdecke 1.1
Alfred Herrhausen Society for International Dialogue 1.1
Environment
ISO 14001, UNEP Financial Institute, Bellagio Forum: Environment and Media 2.3
* www.deutsche-bank-stiftung.de

from the U.S. Federal Reserve. As an ex-
pression of solidarity with the American
people after September 11, Deutsche Bank
donated the entire proceeds from a “Char-
ity Trading Day” (September 25) in our equi-
ties trading unit totaling $ 9 million. On the
occasion of the listing of our share on the
New York Stock Exchange, we provided an
additional donation of more than $ 4 million.
In the United Kingdom, the bank is
committed to several educational pro-
grams. For example, more than 200 bank
employees are active volunteers on a regu-
lar basis as part of an e-business program
at schools, providing realistic insights into
the business world. The new Deutsche
Bank Africa Foundation, established in
Johannesburg in 2001, is intended to sup-
port projects fostering education and inter-
national understanding in southern Africa.
Art and culture
Deutsche Bank has a long tradition of
linking contemporary art and the world of
work*. In 1997, these activities were ex-
panded by our cooperation with the Gug-
genheim Foundation of New York. Since
then, both partners have presented high-
caliber exhibitions at Deutsche Guggen-
heim Berlin, the hall specifically intended
for that purpose, including commissioned
works by outstanding artists. With its new
series entitled “Moment”, the bank is pro-
moting temporary art projects in the public
space. Following the launch in Frankfurt
am Main in 2001, exhibitions will also be
held in New York, Venice and Singapore.
Deutsche Guggenheim Berlin
Visitors in thousands
0
50
100
150147
85
99107
’01’98 ’99 ’00
The Cultural Foundation* is an
expression of our global cultural commit-
ment. The Foundation’s support includes
the reconstruction of Museum Island in
Berlin, one of the World Heritage Sites.
Furthermore, it contributed financially to
exhibitions in Frankfurt am Main, Vienna
and Moscow on the composer and painter
Arnold Schönberg. Deutsche Bank initiated
the formation of Academy Opera Today
during the reporting year. This is the first
sponsorship program aimed at promoting
up-and-coming theater managers, conduc-
tors, dramatic advisors and directors for
the opera. Deutsche Bank Citizenship UK
is continuing its program of support for
young innovative artists with its Pyramid
Award in which leading British art acad-
emies are also participating.
In the U.S.A. we are involved in the
Brooklyn Academy of Music’s New Wave
Festival as the main sponsor of the Frank-
furt Ballet. Furthermore, Deutsche Bank
supports exhibitions at the Solomon R.
Guggenheim Museum in New York and at
the National Gallery in Washington.
Social dialogue and the sciences
As Deutsche Bank’s social policy forum,
the Alfred Herrhausen Society for Interna-
tional Dialogue addressed this year’s
topic of “Education” worldwide with many
events and publications**. The annual
colloquium was the highlight with a two-
day conference where the participants –
high-ranking international experts from the
economic, scientific, political and cultural
46
* www.sammlung-deutsche-bank.com
* www.db-kulturstiftung.de
** www.deutsche-bank.de/ahg
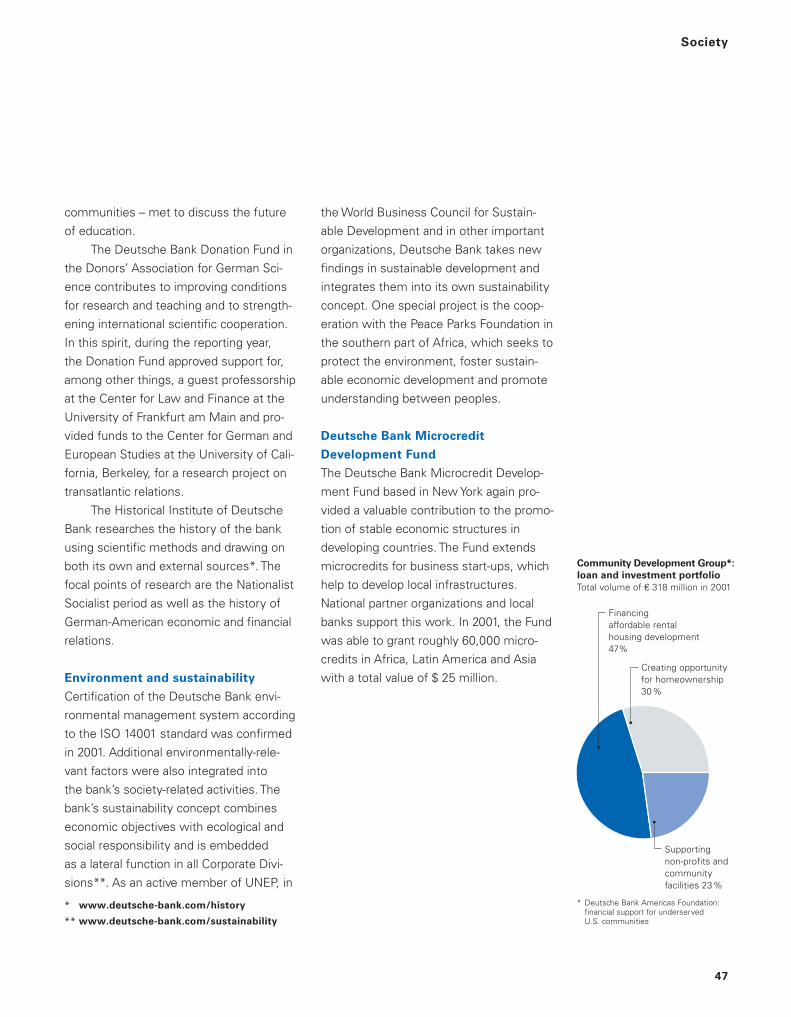
47
communities – met to discuss the future
of education.
The Deutsche Bank Donation Fund in
the Donors’ Association for German Sci-
ence contributes to improving conditions
for research and teaching and to strength-
ening international scientific cooperation.
In this spirit, during the reporting year,
the Donation Fund approved support for,
among other things, a guest professorship
at the Center for Law and Finance at the
University of Frankfurt am Main and pro-
vided funds to the Center for German and
European Studies at the University of Cali-
fornia, Berkeley, for a research project on
transatlantic relations.
The Historical Institute of Deutsche
Bank researches the history of the bank
using scientific methods and drawing on
both its own and external sources*. The
focal points of research are the Nationalist
Socialist period as well as the history of
German-American economic and financial
relations.
Environment and sustainability
Certification of the Deutsche Bank envi-
ronmental management system according
to the ISO 14001 standard was confirmed
in 2001. Additional environmentally-rele-
vant factors were also integrated into
the bank’s society-related activities. The
bank’s sustainability concept combines
economic objectives with ecological and
social responsibility and is embedded
as a lateral function in all Corporate Divi-
sions**. As an active member of UNEP, in
the World Business Council for Sustain-
able Development and in other important
organizations, Deutsche Bank takes new
findings in sustainable development and
integrates them into its own sustainability
concept. One special project is the coop-
eration with the Peace Parks Foundation in
the southern part of Africa, which seeks to
protect the environment, foster sustain-
able economic development and promote
understanding between peoples.
Deutsche Bank Microcredit
Development Fund
The Deutsche Bank Microcredit Develop-
ment Fund based in New York again pro-
vided a valuable contribution to the promo-
tion of stable economic structures in
developing countries. The Fund extends
microcredits for business start-ups, which
help to develop local infrastructures.
National partner organizations and local
banks support this work. In 2001, the Fund
was able to grant roughly 60,000 micro-
credits in Africa, Latin America and Asia
with a total value of $ 25 million.
Community Development Group*:
loan and investment portfolio
Total volume of E 318 million in 2001
Supportingnon-profits andcommunityfacilities 23%
Financingaffordable rentalhousing development47%
Creating opportunityfor homeownership30%
* Deutsche Bank Americas Foundation:financial support for underservedU.S. communities
Society
* www.deutsche-bank.com/history
** www.deutsche-bank.com/sustainability

Trust. A well-managed corporation must
be transparent and have clear corporate governance
principles, factors which contribute in our view to
the creation of long-term shareholder value.
Deutsche Bank is a leading proponent of good
corporate governance.
Michelle Edkins, Corporate Governance Director,
Hermes Investment Management Ltd., London
Th
e B
riti
sh M
use
um

Corporate Governance – a part of ouridentity Principles for the responsible management and control ofDeutsche Bank.
49
In March 2001 Deutsche Bank was the first
DAX 30 company to implement Corporate
Governance Principles after their approval
by the Board of Managing Directors and
the Supervisory Board. These guidelines
specifically tailored to Deutsche Bank regu-
late the relations with our shareholders,
the tasks and duties of the Board of Man-
aging Directors and the Supervisory Board,
the structure and disclosure of the perform-
ance-based compensation of these two
bodies and the demands on reporting and
transparency.
With these Principles, Deutsche Bank
publicly documents how it wants to ensure
the responsible and value-driven manage-
ment and control of the company. The Cor-
porate Governance Principles are intended
to promote and strengthen the trust of pre-
sent and future shareholders, customers,
staff and the public on national and interna-
tional markets.
The Board of Managing Directors, in
consultation with the Chairman of the
Supervisory Board, appointed Dr. Clemens
Börsig, member of the Board of Managing
Directors, as Corporate Governance Offi-
cer to monitor compliance with the Princi-
ples. The Corporate Governance Officer
submitted his report to the Board of Man-
aging Directors and the Supervisory Board.
The Board of Managing Directors and
the Supervisory Board are convinced that
the Corporate Governance Principles were
fully observed in 2001. The following meas-
ures deserve special mention:
– All disclosure duties relating to share-
holders were performed in full. A “One
Voice Committee”, established in 2001,
creates the basis on which capital market
participants receive the same informa-
tion at the same time (fair disclosure).
– The members of the Board of Managing
Directors as well as the Group Board
Management Committee are committed
to acting according to the Corporate
Governance Principles to avoid conflicts
of interest. Furthermore, the Board of
Managing Directors has approved a
Code of Conduct for all employees of
Deutsche Bank Group. This Code is
based on our shared values and estab-
lishes general principles of conduct,
among other things in order to avoid
conflicts of interest.
– The Compliance Officer submitted a
report to the Board of Managing Direc-
tors on the observance of compliance
regulations. This report was also sent to
the members of the Supervisory Board.
One of the tasks of Compliance is to
ensure that the standards of conduct
required under capital market law are
observed, in particular, that conflicts of
interest are avoided in securities trans-
actions. Through his monitoring meas-
ures and controls, the Compliance Officer
convinced himself that the respective
laws and corporate governance regula-
tions were observed.
– More transparency through more infor-
mation: since March 2001, all trans-
actions by members of the Board of
Managing Directors in shares or deriva-
tives of Deutsche Bank have been dis-
closed without delay on our website.
Furthermore, we are publishing for the
first time in 2002 the individual numbers
Corporate Governance

of shares (including current option rights)
held by members of the Board of
Managing Directors and the total interest
of the Supervisory Board in Deutsche
Bank AG and its Group companies.
– On the basis of audited Consolidated
Financial Statements for the years 2000
and 1999 compiled according to Ameri-
can accounting standards (U.S. GAAP),
Deutsche Bank AG registered with the
Securities and Exchange Commission.
This was a precondition to the listing
of our shares on the New York Stock
Exchange starting on October 3, 2001.
The Consolidated Financial Statements
for the 2001 financial year have also been
prepared in accordance with U.S. GAAP.
For investors, this provides greater trans-
parency and direct comparability with our
most important international competi-
tors.
– This Annual Report with the information
it contains also documents compliance
with the Corporate Governance Principles.
In the Management Discussion, we com-
ply with disclosure requirements on the
expected development of business. The
Risk Report contains information on our
risk management system. The Notes
provide information on important share-
holdings. Information on investor struc-
ture can be found in the section on
Shareholders.
– To ensure the high quality of our infor-
mation, we shall voluntarily submit all
quarterly reports for a limited review by
our auditors.
– We are preparing the preconditions
required by the Articles of Association for
the introduction of staggered periods of
office for representatives of the share-
holders on the Supervisory Board (stag-
gered board). The necessary resolution
proposals will be submitted to the
General Meeting in due time before the
election in May 2003.
We understand Corporate Governance
as a continuous process. We will regularly
check and, if necessary, amend our Prin-
ciples in light of new experience, statutory
regulations and ongoing developments in
national and international standards. Here,
we will take account of the recommen-
dations and suggestions of the German
Corporate Governance Code.
50
The complete Corporate Governance Report
for 2001 can be ordered and is available at
www.deutsche-bank.com

Global Reach. The development of a sophisticated Internet architecture
is a challenge. Our shareholders, customers, staff and other visitors can access a
wealth of information, conveniently, quickly, and around the clock – the latest share
prices or this Annual Report, for example.
Peter Lassig, Deutsche Bank AG, DB Services, Frankfurt am Main

Management Discussion, ConsolidatedFinancial Statements and Risk ReportDeutsche Bank Group
52
C o n t e n t
Management Discussion 53
Introductory Note 95
Board of Managing Directors in the reporting year 96
Independent Auditors’ Report 97
Income Statement 98
Statement of Comprehensive Income 99
Balance Sheet 100
Statement of Changes in Shareholders’ Equity 101
Cash Flow Statement 102
Notes to the Consolidated Financial Statements
[1] Significant Accounting Policies and Recent Accounting Developments 103
[2] Impact of Changes in Accounting Principles 113
[3] Acquisitions and Dispositions 114
[4] Trading Assets and Trading Liabilities 114
[5] Securities Available for Sale 115
[6] Other Investments 117
[7] Loans 119
[8] Allowances for Credit Losses 120
[9] Asset Securitizations 121
[10] Assets Pledged and Received as Collateral 122
[11] Premises and Equipment, net 123
[12] Intangible Assets, net 124
[13] Other Short-term Borrowings 124
[14] Long-term Debt 125
[15] Trust Preferred Securities 126
[16] Common Shares and Share-Based Compensation Plans 128
[17] Asset and Dividend Restrictions 135
[18] Regulatory Capital 136
[19] Interest Revenues and Interest Expense 138
[20] Trading Revenues, net 139
[21] Insurance Business 139
[22] Pension and Other Employee Benefit Plans 140
[23] Restructuring Activities 143
[24] Income Taxes 145
[25] Earnings per Common Share 148
[26] Business Segments and Related Information 150
[27] International Operations 157
[28] Derivative Financial Instruments and Financial Instruments with Off-Balance Sheet Risk 158
[29] Concentrations of Credit Risk 160
[30] Fair Value of Financial Instruments 162
[31] Litigation 164
[32] Terrorist Attacks in the United States 165
Risk Report 166

Management Discussion Operating and Financial Review and Prospects
53
You should read the following discussion and analysis in
conjunction with the consolidated financial statements
and the related notes to them included in this document,
on which we have based this discussion and analysis.
Our consolidated financial statements for the years ended
December 31, 2001, 2000 and 1999 have been audited
by KPMG Deutsche Treuhand-Gesellschaft Aktiengesell-
schaft Wirtschaftsprüfungsgesellschaft, as described in
the “Independent Auditors’ Report”.
Critical Accounting Policies
We have prepared all of the consolidated financial informa-
tion in this document in accordance with U.S.GAAP. In pre-
paring our consolidated financial statements in accordance
with U.S. GAAP, we make estimates and assumptions that
affect the reported amount of assets and liabilities, disclo-
sure of contingent assets and liabilities at the date of our
consolidated financial statements, and the reported
amounts of revenues and expenses during the reporting
period. Actual results may differ from those estimates.
We have identified the following accounting policies
as critical to the understanding of our results of operations,
since the application of these policies requires significant
management assumptions and estimates that could result
in materially different amounts to be reported if conditions
or underlying circumstances were to change.
Allowance for Loan Losses. We maintain an allowance
for loan losses for exposures in our portfolio that repre-
sents our estimate of probable losses in our loan portfolio.
Determining the allowance for loan losses requires signifi-
cant management judgments and estimates including,
among others, our ongoing risk assessment of our cus-
tomers’ ability to pay and/or the fair value of underlying
collateral. If actual events prove the estimates and
assumptions we used in determining the allowance for
loan losses to have been incorrect, we may need to make
additional provisions for loan losses. For further discussion
on our allowance for loan losses, see our Risk Report and
Note [1] to the consolidated financial statements.
Impairment of Assets other than Loans. Certain assets,
including goodwill and other intangible assets, direct
investments (including venture capital companies and
nonmarketable securities), securities available for sale,
and premises and equipment, are subject to an impair-
ment review. We record asset impairment charges when
we believe an asset has experienced an other than tempo-
rary decline in value, or its cost may not be recoverable.
Future impairment charges may be required if triggering
events occur, such as adverse market conditions, suggest-
ing deterioration in an asset’s recoverability or fair value.
Assessment of the timing of when such declines become
other than temporary and/or the amount of such impair-
ment is a matter of significant judgment.
Deferred Tax Asset Valuation Allowances. We recognize
deferred tax assets and liabilities for the estimated future
tax effects of temporary differences, net operating loss
carryforwards and tax credits. We recognize deferred tax
assets subject to management’s judgment based on avail-
able evidence that realization is more likely than not and
they are reduced, if necessary, by a valuation reserve. In
the event that we determine that we would not be able
to realize all or part of our net deferred tax assets in the
future, an adjustment to our deferred tax assets would
be charged to income tax expense in the period such
determination was made.
Fair Value Estimates. Quoted market prices in active mar-
kets are the most reliable measure of fair value. However,
quoted market prices for certain instruments, investments
and activities, such as non-exchange traded contracts and
venture capital companies, are not available. In these
cases, the determination of fair value requires us to make
estimates and certain assumptions. These may not pro-
duce a fair value determination that reflects net realizable
value.
Management Discussion

Management Reporting
We have prepared the financial information appearing in
this document about our group divisions, as well as other
information we identify, on the basis of our management
reporting systems. Our management reporting systems
are not necessarily based on U.S.GAAP, but instead on
our internal reporting systems and methodologies for man-
aging our Group Divisions, assessing their results internally
and allocating our internal resources. For information on
our management reporting systems, and for a discussion
of the major differences between our management report-
ing figures and our consolidated financial statements under
U.S.GAAP, see “– Results of Operations by Segment –
Reconciliation of our Segmental Results of Operations to
Consolidated Results of Operations according to
U.S. GAAP”.
Effects of German Tax Reform Legislation
and Accounting for Income Taxes
You should note in reviewing our results of operations that
the financial accounting treatment under U.S. GAAP for
income tax rate changes results in a negative impact on
our results of operations in 2001, a large positive impact in
2000, and a much smaller positive effect in 1999.These im-
pacts totaled an expense of € 995 million in 2001, a benefit
of € 9.3 billion in 2000 and a benefit of € 951 million in 1999.
We therefore recommend that you also consider our net
income for 2001, 2000 and 1999 excluding the effect of the
impact of changes in income tax rates when you compare
2001, 2000 and 1999 to one another and to earlier and
future periods.
Two important tax law changes occurred in 1999 and
2000 that affected and will continue to affect our net
income. In 1999, the German government reduced the
corporate income tax rate on retained profits from 45 % to
40%. In October 2000, the German government enacted
comprehensive tax reform legislation.
The comprehensive tax reform legislation in 2000
contained two major changes relevant to our corporate
taxation:
– The corporate income tax rate declined, beginning on
January 1, 2001, to 25 % for all corporate profits. Until
the end of 2000, the rates were 40% for retained prof-
its and 30 % for distributed profits.
– The tax rate applicable to capital gains on the sale of
equity securities eligible under the legislation will, be-
ginning on January 1, 2002, be reduced to zero. Until
that date, the tax rate that applies to capital gains on
these sales is the same as the tax rate applicable to
ordinary income. For 2000, this tax rate change resulted
in a tax benefit of € 9.0 billion.
The following is a description of the accounting treatment
for these income tax rate changes and its effects on our
results of operations.
U.S. GAAP requires us to record all unrealized gains
on available for sale securities, net of the related deferred
tax provisions, in other comprehensive income. The de-
ferred tax provisions are based on the excess of the fair
value of these securities over our tax basis in them. At the
end of each reporting period, we record deferred tax pro-
visions and related deferred taxes payable based on the
change in the unrealized gain for that period using the ef-
fective income tax rate we expect will apply in the period
we expect to realize the gain. Since both the unrealized
gains and the related deferred tax provision are recorded
in other comprehensive income, neither the unrealized
gains nor the deferred tax provision affects net income in
that period.
U.S.GAAP also requires that, in a period that includes
the date on which new tax rates are enacted, companies
must adjust all of the deferred tax assets and liabilities
they have recorded. These adjustments to deferred tax
assets and liabilities reflect the new effective tax rates that
will apply in the periods in which the temporary differ-
ences that led to the creation of the deferred items are
expected to be reversed. The changes in tax law we
describe above required us to make these types of adjust-
ments in 1999 and 2000. Because our available for sale
securities include an extensive portfolio of eligible equity
securities that have appreciated substantially in value, we
had a significant amount of related deferred tax liabilities.
These deferred tax liabilities were substantially reduced as
54

55
a result of this new legislation. The elimination of the Ger-
man tax on the capital gains on sales of eligible equity
securities is responsible for the majority of the income tax
benefit we recognized in 2000.
Most of the eligible equity securities are among our
industrial holdings. We acquired many of these industrial
holdings, most of which we classify as available for sale
securities under U.S. GAAP, many years ago, and most of
them have appreciated in value considerably over that
time. Since we intend to sell these industrial holdings in
the most tax-efficient and commercially prudent manner
possible, the estimated effective tax rate we applied to
these unrealized gains when the new tax rate changes
were enacted was essentially zero. As a result, most of
the reductions in deferred tax liabilities associated with
unrealized gains on our eligible equity securities related to
our industrial holdings.
Although we record the deferred tax provisions
directly to other comprehensive income for unrealized
gains on available for sale securities, U.S. GAAP neverthe-
less requires that this adjustment to the related deferred
tax liabilities for a change in expected effective income
tax rates be recorded as an adjustment of income tax
expense in the period the tax rate change is enacted.
The adjustment to deferred tax liabilities related to
eligible equity securities, however, does not result in an
adjustment to the deferred tax provisions that have accu-
mulated in other comprehensive income. These accumu-
lated provisions remain in other comprehensive income
until the related securities are sold, and they are then rec-
ognized as tax expense in the period of the sale. As such,
certain possible effects of our accounting for income tax
rate changes related to our eligible equity securities on our
results of operations are as follows:
– When we sell each eligible equity security, we will rec-
ognize tax expense in the period of its sale equal to that
investment security’s share of the deferred tax provi-
sions that had accumulated in other comprehensive
income on the tax rate change dates. The amount we
had accumulated in other comprehensive income relat-
ed to our eligible equity securities was approximately
– € 5.9 billion on December 31, 2001 and € 6.9 billion on
– December 31, 2000.
– This means that, regardless of the size of the realized
gains, if any, on future sales of these eligible equity
securities, there will be significant income tax expense
in the periods of the sales. This expense will offset part
or all of that gain or add to any loss when calculating net
income.
– Although we have recognized in 2000 a significant
deferred tax benefit as a result of the tax rate changes
related to eligible equity securities and will record signif-
icant deferred tax expense in the years these securities
are sold, any realized gains on these securities starting
in 2002 will not result in any taxes actually payable in
cash in the periods of the sales or any other time,
unless the rates are changed again before we sell the
securities. In other words, all of the deferred tax benefit
and expense amounts are non-cash items. In addition,
when we reverse the related deferred tax provisions
through the income tax expense line item, there will be
no effect on our total shareholders’ equity. This is be-
cause the deferred tax provisions, which we accumulate
in other comprehensive income, and retained earnings,
where the non-cash income tax expense will have its
effect, are both components of shareholders’ equity.
As a consequence, the accounting for income tax rate
changes related to eligible equity securities may result in
significant impacts on our results of operations in periods
in which we sell these securities. This effect is illustrated
in 2001 when we sold portions of our eligible equity secu-
rities. The gains resulting from most of these sales will not
be subject to tax until 2002, when the applicable tax rate
will be zero. We reversed the deferred taxes accumulated
in other comprehensive income, as of December 31, 2000,
in respect of these securities. We recognized this as tax
expense of € 995 million in 2001 even though there is no
tax actually payable on the gains.
Management Discussion

Effects of Derivative Transactions
and SFAS 133
The implementation of SFAS No. 133, “Accounting for De-
rivative Instruments and Hedging Activities” (“SFAS 133”)
on January 1, 2001 changed the way we account for our
derivatives activities. This change in accounting affects the
comparability of certain line items in our consolidated finan-
cial statements in which we report derivatives activities.
Prior to our implementation of SFAS 133, we marked
the derivatives we entered into for trading purposes to
market and reported the changes in their fair values in
trading revenues. We accounted for derivatives qualifying
for hedge accounting under the accounting standards then
in effect as off-balance sheet transactions and recorded
interest receivable or payable on an accrual basis.
With our implementation of SFAS 133, we mark all
derivatives to market on our balance sheet. The income
statement classification of the changes in fair value is
dependent upon whether the derivative qualifies for hedge
accounting, and, if so, the nature of the item being
hedged.
See Note [1] to the consolidated financial statements
for a further explanation of SFAS 133.
The results of our use of derivative contracts are in-
cluded in our Consolidated Statement of Income as follows:
– We include changes in the fair value of derivatives trad-
ed on behalf of customers and for our own account in
trading revenues.
– We recognize changes in the fair value of derivatives
used to manage interest rate risk that qualify for fair
value hedge accounting in earnings along with and in
the same line as the changes in the fair value of the
hedged asset or liability.
– We mark changes in the fair value of derivatives used as
economic hedges of interest rate, foreign exchange, and
investment risk that do not qualify for hedge accounting
to market and include the gains and losses in trading
revenues.
– When we implemented SFAS 133 in 2001, we recorded
an expense of € 207 million after tax as a cumulative
effect of accounting change.
Significant Acquisitions
and Divestitures
The following recent acquisitions were instrumental in
broadening our product and service offerings:
– Crédit Lyonnais Belgium S.A./N.V. Acquired in
February 1999, we renamed this entity Deutsche Bank
S.A./N.V. With this acquisition, we strengthened our
retail, private and corporate banking activities in Europe.
– Bankers Trust Corporation. Acquired in June 1999,
Bankers Trust strengthened our presence in the United
States and internationally, especially in corporate and
investment banking, asset management and private
banking.
– Prudential U.K. Institutional Asset Management busi-
ness. This acquisition in March 2000 strengthened our
institutional asset management, especially in the United
Kingdom.
– Deutsche Bank 24 Spolka Akcyjna – formerly: Bank
Wspólpracy Regionalnej S.A. (BWR). The acquisition
of a 92.55% stake in BWR in several stages in the first
half of 2000 strengthened our personal banking platform
in Poland.
– First Australian Property Group Holdings Pty. Ltd.
This acquisition in July 2000 allowed us to extend our
position in the Australian asset management market.
– National Discount Brokers Group, Inc. We acquired
National Discount Brokers Group (which we call NDB) in
2000 in two phases to strengthen our U.S. market mak-
ing business. We sold NDB’s online brokerage business
in September 2001, as we describe below.
– Banque Worms S.A. Acquired in April 2001, this com-
pany is engaged in personal banking, corporate banking
and asset management in France and Switzerland.
– AXA Australia Property Fund Management Ltd. This
acquisition from AXA Australia Ltd. in June 2001
strengthened our real estate asset management capa-
bilities, especially in Australia.
In December 2001, we signed agreements with Zurich
Financial Services (which we call Zurich) to, acquire the
greater part of Zurich’s asset management businesses
(excluding its U.K. operations) and to sell to Zurich the
56
57
greater part of our insurance business, most of which we
hold through Versicherungsholding der Deutschen Bank
AG. We expect to close these transactions in the second
quarter of 2002, pending satisfaction of certain conditions.
This transaction could fail to occur, or could occur on a
substantially different basis than we describe here. (At the
date of acquisition, we plan to book a restructuring charge
related to the consolidation of the two groups. The amount
of the restructuring charge is not yet known.)
As part of our policy of active portfolio management,
we have also disposed of non-core activities such as Boul-
lioun Aviation Services Inc. This divestiture in February
2001 allowed us to exit the highly capital-intensive aircraft
leasing business.
In May 2001, we also sold our European asset finance
and leasing business that served mid-size companies and
our European fleet management services business.
On September 6, 2001, we sold NDB’s online broker-
age business to Ameritrade Holding Corp. for approximate-
ly U.S.$ 154 million in Ameritrade common stock. NDB
had conducted its online trading business through its sub-
sidiary National Discount Brokers Corporation (which we
call NDB.com). Following the closing of the sale, we own
approximately 13% of Ameritrade common stock. We
have retained NDB’s institutional market making business.
Other than our acquisition of Bankers Trust, none of
these acquisitions or dispositions had a material effect on
our business, although we believe that each of them is
important to our strategy and/or growth in our chosen
businesses and regions. We believe that the acquisition of
Zurich Scudder Investments will significantly strengthen
our Asset Management position in the United States.
Operating Results
You should read the following discussion and analysis in
conjunction with the consolidated financial statements.
Management Discussion

Overview
The following table presents our condensed consolidated
statement of income for 2001, 2000 and 1999.
The following table shows our net income excluding the
effects of the tax rate changes we describe above:
58
in € m. 2001 2000 1999
Net interest revenues 8,620 7,028 7,994
Provision for loan losses 1,024 478 725
Net interest revenues after provision for loan losses 7,596 6,550 7,269
Commissions and fee income 10,727 11,693 7,967
Trading revenues, net 6,031 7,625 2,127
Other noninterest revenues 4,243 8,133 6,944
Total noninterest revenues 21,001 27,451 17,038
Total net revenues 28,597 34,001 24,307
Compensation and benefits 13,360 13,526 9,655
Goodwill amortization 951 771 486
Restructuring activities 294 125 459
Other noninterest expenses 12,189 12,710 11,356
Total noninterest expenses 26,794 27,132 21,956
Income before income tax expense (benefit) and cumulative effect of accounting changes 1,803 6,869 2,351
Income tax expense 434 2,643 1,689
Income tax expense (benefit) from the change in effective tax rate and the reversing effect(1) 995 (9,287) (951)
Income before cumulative effect of accounting changes, net of tax 374 13,513 1,613
Cumulative effect of accounting changes, net of tax(2) (207) – –
Net income(1) (2) 167 13,513 1,613
(1) These figures reflect income tax expense of € 995 million in 2001, € 9.3 billion of income tax benefit in 2000 and € 951 million of income tax benefit in 1999. This income tax expense (benefit) resulted from changes in effective tax rates pursuant to German tax law and the reversing effects. We describe these changes and their effects above in “Effects of German Tax Reform Legislation and Accounting for Income Taxes”. The next table presents these figures excluding these effects.
(2) In 2001, this figure reflects the cumulative effect of changes in accounting principle. We describe these changes and their effects on our Consolidated Statement of Incomebelow in “Impact of Changes in Accounting Principles”.
2001 Per Share 2000 Per Share 1999 Per Share
in € m. (except per share amounts) (basic) (basic) (basic)
Net income 167 E 0.27 13,513 E 22.00 1,613 E 2.76
Income tax expense (benefit) from the change in effective tax rateand the reversing effect 995 E 1.61 (9,287) E (15.12) (951) E (1.63)
Net income without the effect of the tax rate changes 1,162 E 1.88 4,226 E 6.88 662 E 1.13

59
Net income was € 167 million in 2001, which includes tax
expense of € 995 million representing the reversal of tax
benefits recorded in prior years for the effect of German
tax law changes. Net income was further reduced by the
€ 207 million cumulative effect of accounting changes.
Net income in 2000 of € 13.5 billion included a benefit
from those German tax law changes of € 9.3 billion. Ex-
cluding the effect of tax law changes in both years, net
income would have been € 1.2 billion in 2001 and € 4.2 bil-
lion in 2000. Further excluding the cumulative effect of
accounting changes in 2001 net income would have been
€ 1.4 billion in 2001 and € 4.2 billion in 2000.
Our net income in 2000 was € 13.5 billion, compared
to € 1.6 billion in 1999. The majority of this increase was
attributable to the income tax benefit from German tax
law changes of € 9.3 billion. This resulted from the reduc-
tion of € 9.0 billion of deferred taxes primarily on eligible
equity securities in our portfolio of securities available for
sale.
If we exclude the effect of tax rate changes, our net
income in 2000 would have been € 4.2 billion compared
with the € 662 million in net income we would have had in
1999. A significant portion of the change in components
of net income was a result of the full-year effect of the
Bankers Trust acquisition.
Basic earnings per share were € 0.27 in 2001, as com-
pared to € 22.00 in 2000. Excluding the tax rate change
effects and cumulative effects of accounting changes, our
basic earnings per share would have been € 2.21 in 2001
and € 6.88 in 2000.
Basic earnings per share increased € 19.24 to € 22.00
in 2000, as compared to € 2.76 in 1999. Excluding the tax
rate changes, our basic earnings per share would have
been € 6.88 in 2000 and € 1.13 in 1999.
Net Interest Revenues
Our net interest revenues in any period depend primarily
on the following:
– the amounts and kinds of assets and liabilities we have,
and the kinds of revenues they generate and expenses
they incur;
– general levels of and trends in interest rates; and
– to a lesser extent, trends in exchange rates.
The following table sets forth data relating to our net inter-
est revenues:
Management Discussion
in € m. 2001 2000 1999
Net interest revenues 8,620 7,028 7,994
Average interest-earning assets(1) 877,727 898,514 739,715
Average interest-bearing liabilities(1) 783,710 815,867 655,038
Gross interest yield(2) 6.11 % 6.14 % 5.43 %
Gross interest rate paid(3) 5.74 % 5.90 % 4.91 %
Net interest spread(4) 0.37 % 0.24 % 0.52 %
Net interest margin(5) 0.98 % 0.78 % 1.08 %(1) Average balances for each year are calculated based upon month-end balances.(2) Gross interest yield is the average interest rate earned on our average interest-earning assets.(3) Gross interest rate paid is the average interest rate we paid on our average interest-bearing liabilities.(4) Net interest spread is the difference between the average interest rate earned on average interest-earning assets and the average interest rate paid on average interest-bearing
liabilities.(5) Net interest margin is net interest revenues expressed as a percentage of average interest-earning assets.
Net interest revenues were € 8.6 billion in 2001, an
increase of € 1.6 billion, or 23%, as compared to 2000.
Our net interest revenues were € 7.0 billion in 2000, a
decrease of € 966 million, or 12%, as compared to 1999.
Both our net interest spread and our net interest margin
increased in 2001, after having declined substantially in
2000.

The increase in net interest revenues in 2001 occur-
red because, while both our interest revenues and our
interest expenses decreased, the decrease in interest
expenses was proportionally greater. Interest expenses
decreased € 3.1 billion, or 6%, between 2000 and 2001,
while interest revenues declined € 1.5 billion, or 3%. The
main reason for this was that our interest revenues on our
trading portfolio increased substantially (by € 1.1 billion, or
8%, in 2001 compared to 2000), even as interest revenues
in the other major categories declined. In 2000, by con-
trast, a year in which both interest revenues and interest
expense increased substantially compared to 1999, the
€ 16.0 billion, or 50%, increase in our interest expense
outstripped the € 15.0 billion, or 37%, increase in interest
revenues.
We believe that the change in our mix of businesses
is the single most important factor driving the general
development of net interest revenues, net interest margin
and net interest spread during recent years. We have
experienced a continuing shift in the mix of our business
towards investment banking activities, including trading,
and asset management. These businesses not only gener-
ate noninterest revenues, such as trading revenues and
commissions and fee income, but they also generate net
interest revenues. Trading assets are the largest category
of our assets that behave in this manner. They produce
both interest income and trading revenues, and our costs
of trading liabilities and other funding of the trading assets
include both interest and noninterest expenses. As we
have changed our asset and liability structure to empha-
size our trading businesses, we have become less focused
on earnings from net interest revenues or net trading
revenues in isolation. We instead manage our business by
reference to the total revenues our trading portfolio gene-
rates, including interest and noninterest revenues, and our
total costs of carrying them, including interest and non-
interest expenses. The proportion of interest and noninter-
est revenues and expenses our trading portfolio generates
in any period is a function of market conditions, the oppor-
tunities available to our trading units and the strategies
they adopt and instruments they use in response. To give
you what we believe is a more comprehensive indication
of the performance of our trading businesses, we con-
sider our trading related interest revenues and expenses
together with our other trading revenues and expenses
below under “Trading revenues”.
The development of our net interest spread is also
attributable to a significant extent to the accounting treat-
ment of some of our derivative transactions. We enter into
derivative transactions as economic hedges of the interest
rate risks of our non-trading assets and liabilities. As we
discuss above under “Effects of Derivative Transactions
and SFAS 133”, some of these derivatives qualify as
hedges for accounting purposes while others do not. When
derivative transactions qualify as hedges for accounting
purposes, the interest flows arising from the derivatives
appear in interest revenues and expense, where they com-
pensate the interest flows from the assets and liabilities
they are intended to hedge. When derivatives do not quali-
fy for hedge accounting treatment, the interest flows that
arose from the derivatives during any period all appear in
trading revenues for that period. Derivative transactions
that did not qualify for hedge accounting treatment pro-
duced net interest cash flows, which we included in trading
revenues, of € 259 million of revenues in 2001, € 105 mil-
lion of revenues in 2000 and € 970 million of expenses in
1999. Had these transactions all qualified as hedges,
our net interest revenues would have increased € 1.7 bil-
lion between 2000 and 2001, rather than increasing
€ 1.6 billion, as we report; and our net interest revenues
would have increased € 109 million between 1999 and
2000, rather than decreasing € 966 million as we report.
Before 2001, many of our derivative transactions did
not qualify as hedges for accounting purposes because we
did not, at the time we entered into them, document them
contemporaneously in the manner U.S. GAAP requires
for them to qualify. While we adopted SFAS 133 beginning
in 2001 such that some of these kinds of derivative
transactions qualify as hedges for accounting purposes,
we continue to enter into derivative transactions that, while
intended as economic hedges, do not qualify for hedge
accounting treatment. We do this when we believe that
the economic advantages of adopting non-qualifying
hedges, such as hedges on the cash flows from a pool of
60

61
Management Discussion
assets or liabilities, outweigh the potential disadvantages
for us of recognizing any gains or losses each period. Gain
or loss recognition each period may be disadvantageous
for us because recognizing the gains and losses from our
nonqualifying derivative transactions in every period over
their lifetimes may increase our earnings volatility on a
period to period basis. This is true even though the net
gain or loss on the transactions themselves over their
lifetimes is identical whether we recognize gain or loss
each period or only at the end of the transactions when
we recognize any gain or loss on the underlying items
we are hedging as an economic matter.
The largest single category of our interest-earning
assets continues to be our loans, despite their declining
share of our total average interest-earning assets in recent
years. Loans accounted for 32% of our average interest-
earning assets in 2001, 34% in 2000 and 35% in 1999.
Our loan portfolio earned an average yield in 2001 of
21 basis points below that of 2000 as interest rates
declined rather substantially in our major markets. In 2000,
in an environment characterized by generally increasing
interest rates, our loan portfolio earned an average yield
only 26 basis points above that of 1999. In each year, part
of the changes in yield on our loan portfolio also relates
to our changing mix of assets.
While we believe that the changing mix of our assets,
together with the effects of our accounting for derivatives
transactions, account for most of the movements in our
net interest revenues, interest rates and exchange rates
were also contributors. As noted above, interest rates
decreased rather substantially in our major markets in
2001, particularly in the United States and to a lesser
extent in Germany and the other euro zone countries. In
2000, by contrast, interest rates in our major markets in-
creased, particularly in the United States, in Germany and
in the other euro zone countries. The euro has declined
against the U.S. dollar and other major currencies in the
first years after its introduction and then remained in
a fairly narrow band during 2001. We cannot quantify the
impacts of each of these factors, but we believe, based on
the volumes of assets affected, that they had considerably
less impact than did our changing mix of businesses.

Interest Revenues
The table below sets forth a breakdown of our interest
revenues for 2001, 2000 and 1999:
62
in € m. 2001 2000 1999
Interest on interest-earning deposits in other banks
In German offices 788 472 542
In non-German offices 2,124 1,831 1,908
Total 2,912 2,303 2,450
Interest on central bank funds sold
In German offices 0 0 0
In non-German offices 91 137 118
Total 91 137 118
Interest income on securities purchased under resale agreements
In German offices 628 746 922
In non-German offices 7,507 7,124 6,637
Total 8,135 7,870 7,559
Interest on securities borrowed
In German offices 179 20 20
In non-German offices 5,148 6,624 3,141
Total 5,327 6,644 3,161
Interest and dividend income on securities available for sale and other investments
In German offices 2,728 2,175 1,717
In non-German offices 983 1,181 1,265
Total 3,711 3,356 2,982
Interest on loans
In German offices 9,781 10,742 10,056
In non-German offices 7,838 9,395 5,892
Total 17,619 20,137 15,948
Interest on trading assets
In German offices 3,035 3,008 2,276
In non-German offices 12,536 11,431 5,535
Total 15,571 14,439 7,811
Other interest revenues 273 245 113
Total interest revenues 53,639 55,131 40,142
63
Our total interest revenues decreased € 1.5 billion,
or 3%, between 2000 and 2001. The following are the
primary categories of interest-earning assets that affected
total interest revenues:
– Interest on loans decreased € 2.5 billion or 13% in
2001, as compared to 2000. This resulted primarily
from a 10% decrease in our average balance of loans.
Almost 90% of the decline in the average balance of
loans occurred outside Germany. Our average yield on
our loans decreased only slightly from 6.50% in 2000
to 6.29% in 2001. Much of the decrease in our loan
portfolio related to shorter-term credit we extended
ancillary to other businesses outside Germany. In our
domestic market, average loan volume remained basi-
cally unchanged and the interest yield on these loans
declined to 6.00% in 2001, as compared to 6.45% in
2000, in line with the overall decrease in market rates.
– Interest on securities borrowed decreased € 1.3 billion
in 2001 as compared to 2000. The decrease was the
result of an 18% decrease in the average balance of
these assets, particularly as a result of the general con-
ditions in the equities markets, which led to less busi-
ness activities. We continue to conduct this business
predominantly outside Germany.
– Interest on trading assets increased € 1.1 billion, or
8%, between 2001 and 2000, due to the higher average
volume of interest-earning securities we held in our
trading portfolio outside Germany.
Our total interest revenues increased € 15.0 billion,
or 37%, between 1999 and 2000. Our increased interest
revenue was due to growth across our business and, to a
lesser extent, higher interest rates. The following are the
primary categories of interest-earning assets that drove
the increase:
– Interest on trading assets increased € 6.6 billion, or
85%, between 1999 and 2000, due to increased inter-
est rates and the higher volume of debt securities we
held in our trading portfolio. Our average balance of
trading assets increased 40% from 1999 to 2000, and
our average yield on them increased substantially, from
4.59% in 1999 to 6.06% in 2000. Nearly three-quarters
of these assets were located outside Germany in 2000
and nearly 90 % of the increase in interest on trading
assets came from outside Germany.
– Interest on loans increased € 4.2 billion or 26% in
2000, as compared to 1999. This resulted primarily from
a 21% increase in our average balance of loans. Most
of the growth on the average balance of loans, or 85%,
occurred outside Germany. Our average yield on our
loans increased only slightly from 6.24 % in 1999 to
6.50 % in 2000, although interest rates increased in our
major markets. This is partly due to our changing mix of
assets. Much of the increase in our loan portfolio related
to shorter-term credit we extended ancillary to other
businesses. The interest we earned on many of these
loans did not keep pace with increases in interest rates
in 2000.
– Interest on securities borrowed more than doubled in
2000 as compared to 1999. The increase was the result
of a 72% increase in the average balance of these
assets, particularly in equities and, to a slightly lesser
extent, in bonds. This resulted from organic growth
in this activity, which resulted from increased market
activity and higher asset values. Our average yield on
these assets increased from 5.49 % in 1999 to 6.69%
in 2000. We conduct this business almost exclusively
outside Germany.
Management Discussion

Interest Expense
The table below shows a breakdown of our interest
expense for 2001, 2000 and 1999:
Our total interest expense decreased E 3.1 billion, or 6 %,
between 2000 and 2001. The major contributors to the
variance were the following:
– Interest on other short-term borrowings decreased
E 1.2 billion, or 37%, from 2000 to 2001. The decrease
occurred in our non-German offices, with 75% of this
decrease attributable to the lower average rate of
4.14%, as compared to 6.76% in 2000, and 25% from
reduced borrowing activities.
– Interest on deposits decreased E 1.2 billion, or 7%, in
2001 compared to 2000. This decrease arose from a
reduction of 94 basis points in the average rate paid on
time deposits, while there was a relatively stable aver-
age volume compared to 2000. Time deposits outside
Germany are still the largest single category of our aver-
age interest bearing liabilities, representing 53 % of total
average interest bearing deposits and 24 % of average
total interest bearing liabilities in 2001.
64
in € m. 2001 2000 1999
Interest on deposits
In German offices 3,169 3,877 3,357
In non-German offices 12,555 13,020 7,885
Total 15,724 16,897 11,242
Interest on trading liabilities
In German offices 1,033 2,486 1,277
In non-German offices 4,690 3,799 2,237
Total 5,723 6,285 3,514
Interest on securities sold under repurchase agreements
In German offices 702 776 273
In non-German offices 9,685 9,589 7,104
Total 10,387 10,365 7,377
Interest on securities loaned
In German offices 144 55 68
In non-German offices 1,758 2,106 1,381
Total 1,902 2,161 1,449
Interest on other short-term borrowings
In German offices 291 194 307
In non-German offices 1,787 3,128 1,265
Total 2,078 3,322 1,572
Interest on long-term debt, including trust preferred securities
In German offices 4,366 4,367 3,908
In non-German offices 4,839 4,706 3,086
Total 9,205 9,073 6,994
Total interest expense 45,019 48,103 32,148

65
– Interest on trading liabilities decreased E 562 million,
or 9%, in 2001 as compared to 2000, largely due to
decreased short positions in securities. This is interest
we pay on securities we have sold, but do not yet own.
On average during 2001, we held 81% of these liabilities
in our trading businesses outside Germany and 82 % of
the related interest expense was incurred outside Ger-
many.
– Interest on long-term debt, including trust preferred
securities increased E 132 million, or 1%, in 2001 com-
pared to 2000 due to an increased volume of long-term
debt issued to replace shorter-term funding, while the
average rate paid decreased from 6.04% in 2000 to
5.66% in 2001.
Our total interest expense increased E 16.0 billion,
or 50%, between 1999 and 2000. Our increased interest
expense has, like our interest revenues, arisen primarily
from growth across our businesses, as well as from
increased market interest rates in the first half of 2000.
The major contributors to the increase were the following:
– Interest on deposits increased 50% in 2000 compared
to 1999. Of this amount, interest on deposits from
banks contributed most substantially, amounting to
E 9.3 billion in 2000, an increase of E 4.3 billion, or 86 %,
as compared to 1999. This increase, mostly arising from
interest on time deposits, but also substantially arising
from demand deposits, developed as a result of both
higher average deposit balances and higher average
interest rates. Our average interest rate paid on depo-
sits was 3.60% in 1999 and 4.56% in 2000. Volume
growth was attributable to the expansion of our former
Global Corporates and Institutions Division (now within
our Corporate and Investment Bank Group Division).
Nearly all of the volume increase, and over 90% of the
increase in interest expense, was outside Germany.
– Interest on securities sold under repurchase agree-
ments increased by 41% in 2000 compared to 1999.
This was due mostly to a large increase in the average
rate we paid on them, from 7.50% in 1999 to 9.32% in
2000, as well as to our increased use of these as fund-
ing sources. Our average balance of securities sold
under agreements to repurchase was E 111.3 billion in
2000, an increase of 13% between 1999 and 2000.
We conduct this business almost exclusively outside
Germany.
– Interest on trading liabilities increased 79% in 2000
as compared to 1999, largely due to increased volumes
of these liabilities. We hold most of these liabilities in
our trading businesses outside Germany, and over half
of the increased interest expense was outside Germany.
Interest expense we paid on short positions on debt
securities in our trading portfolios accounted for the
substantial majority of this increase. The increase was
concentrated mainly in our former Global Corporates
and Institutions Division (now within our Corporate and
Investment Bank Group Division) and was a product
of the expansion of our business in the fixed income
area.
– Interest on long-term debt, including trust preferred
securities increased E 2.1 billion, or 30 %, in 2000 as
compared to 1999. The increase was more pronounced
outside Germany. This increase arose primarily from
increased interest expense on long-term debt issued to
partially fund our acquisition of Bankers Trust and from
the full-year impact of long-term debt we assumed in
the Bankers Trust acquisition. Our average interest rate
paid on our long-term debt was 6.04 % in 2000 and
5.76% in 1999.
– Interest on other short-term borrowings increased
E 1.8 billion, or 111%, from 1999 to 2000 due to
increased average balances in non-German offices.
Management Discussion

Our noninterest revenues were E 21.0 billion in 2001,
a decrease of e 6.5 billion, or 23%, as compared to the
E 27.5 billion reported in 2000.
The primary driver behind the decline in noninterest
revenues was the weakness of the financial markets in
2001 which deteriorated further after the terrorist acts of
September 11. The weak markets negatively affected these
revenues in 2001 as compared with 2000 in several major
ways:
– Deteriorating securities prices led to a reduction in real-
ized and unrealized gains on positions we held for trad-
ing purposes;
– We made lower revenues in businesses where our com-
missions or fees are based on the value of the client as-
sets managed or on our performance in managing them;
– We had reduced customer transaction volumes in many
of our businesses; and
– We had write-downs and valuation adjustments of our
own investments.
66
Noninterest Revenues
in € m. 2001 2000 1999
Commissions and fee revenues 10,727 11,693 7,967
Trading revenues, net 6,031 7,625 2,127
Insurance premiums 2,717 2,837 3,011
Net gains on securities available for sale 1,516 3,670 2,150
Other noninterest revenues 10 1,626 1,783
Total 21,001 27,451 17,038
Provision for Loan Losses
Our provision for loan losses consists of changes to the
allowances we carry for credit losses on loans. The allow-
ance consists of a specific loan loss component, which
relates to specific loans, and an inherent loss component.
The inherent loss component consists of a country risk
allowance, an allowance for smaller-balance standardized
loans and an additional inherent loss component to cover
losses in our loan portfolio we have not identified on an
individual basis.
The provision for loan losses was E 1.0 billion in 2001,
an increase of E 546 million, or 114%, over the E 478 million
recorded in 2000. The 2001 provision is composed of net
new specific loan loss provisions and other inherent loss
provisions, offset in part by net reductions of country risk
provisions. Our total new specific loan loss provision
amounted to E 951 million in 2001 and E 805 million in
2000. Most of this increase was due to less favorable
economic conditions in the last quarter of 2001. In that
final quarter we increased our specific loan loss provisions
in connection with a single U.S. borrower in the utility
sector and various Argentine exposures and on our lever-
aged structured finance activities.
Our provision for loan losses was E 478 million in
2000, a decrease of E 247 million, or 34 %, as compared
to 1999. This amount is composed of net new specific
provisions offset by releases of other inherent loss and
country risk provisions. Our total new specific loan loss
provision amounted to E 805 million in 2000, E 121 million
less than in 1999. Most of this decrease was due to a
higher than usual provision in 1999 due to a significant
exposure to a single German borrower in the real estate
industry. In addition, the decrease reflects a general im-
provement in the quality of our loan portfolio during 2000.

67
Our noninterest revenues were E 27.5 billion in 2000,
an increase of E 10.4 billion, or 61%, as compared to1999.
Increased revenues from trading were by far the most
significant source of this increase, reflecting in particular
the expansion of our equities trading activities as well as
higher transaction volumes at generally higher asset prices
than in 1999.
The primary driver behind the growth in non-interest
revenues was the strength of the financial markets. The
strong markets assisted the growth in our non-interest
revenues in 2000 as compared with 1999 in several major
ways:
– Increasing prices frequently led to greater gains on our
securities portfolio;
– Higher securities prices generally led to higher revenues
in businesses where we charged commissions as a
percentage of the value of assets or in similar ways; and
– Increasing prices also led to very active markets, with
high transaction volumes in many of our businesses.
A secondary driver in the growth in our noninterest
revenues in 2000 was our acquisition of Bankers Trust. We
generally cannot separate the year to year effect of the
Bankers Trust acquisition from our growth for other reasons,
including the strong markets. However, we believe that the
volumes of assets and transactions the acquisition brought
to us played an important role in increasing our overall level
of transactions and other activity. Since Bankers Trust was
part of our consolidated group for all of 2000 and 2001, we
did not experience the comparative increase in our net
revenues that the acquisition produced in comparing 2000
to 1999.
Trading revenues, net. We account for our trading activi-
ties on a mark-to-market basis. Trading revenues as report-
ed in our consolidated statement of income include both
realized and unrealized gains and losses on the positions
we hold in our trading portfolio and net interest revenues
on derivatives we hold for trading purposes. For a general
description of our trading portfolio, see Note [4] to the
consolidated financial statements.
Our trading revenues were E 6.0 billion in 2001, a
decrease of E 1.6 billion, or 21%, as compared to 2000.
The decrease in trading revenues was partially due to diffi-
cult market conditions in 2001, which led to lower transac-
tion volume in equities trading. This was partially offset by
the impact of marking to market derivatives we entered
into for non-trading purposes but which did not qualify for
hedge accounting treatment. Trading revenues were
E 7.6 billion in 2000, an increase of E 5.5 billion, or more
than double that of 1999. The strong markets that con-
tinued until late in 2000 assisted this result, as did the
further establishment of our trading businesses.
We believe, however, that you should analyze more
than our net trading revenues to assess the performance
of our trading operations. Trading revenues do not include
the following items that are part of the revenue and
expense streams our trading businesses generate:
– Interest income on trading assets, which appears in
interest revenues;
– Interest expense on trading liabilities, which appears in
interest expense; and
– The cost of funding our net trading positions, which
appears in other items across our consolidated state-
ment of income.
As we note above under “net interest revenues”,
market conditions, changing opportunities and our trading
units’ responses to them lead to changes in the composi-
tion of our trading inventories, which in turn cause changes
from period to period in the mix of revenues and expenses
our trading activities generate. In 2001, for example, the
generally weak equity markets in comparison with early
2000, and the generally strong fixed income markets, led
investors, including us, to favor less risky investment stra-
tegies. Our trading units accordingly found more value
in fixed income related trading positions, which generally
produce a mix of revenues and expenses containing a
higher proportion of interest than do equity related posi-
tions. Accordingly, we do not manage our trading business
on the basis of either trading revenues or net interest rev-
enues relating to trading activities in isolation, and we
encourage you likewise to take into account both trading
revenues and the related interest component. For this
reason, we describe in the following discussion a measure
we call “trading performance”. This measure is not pro-
Management Discussion

vided for in U.S. GAAP, and, because we may calculate it in
a different manner than other companies who may report
similarly named measures, we discourage you from com-
paring it to any measures other companies report without
analyzing how they calculate these measures. However,
we do believe that trading performance is a useful measure
for comparing the results of our trading activities from
period to period.
The following tables and narrative indicate how we
arrive at trading performance.
First, we calculate a measure we call “net trading
related interest”. Net trading related interest includes the
following elements:
– Interest revenues from our trading assets;
– Interest expenses from our trading liabilities;
– Interest expense and interest revenues representing the
funding cost or benefit associated with our trading posi-
tions; and
– Adjustment for net interest revenues from non-trading
derivatives that do not qualify for hedge accounting
treatment.
We calculate the funding cost or benefit on a continu-
ous basis based on identifiable transactions which directly
fund the positions, to the extent there are identifiable trans-
actions, and on the basis of the average cost or benefit
across our average balances of trading assets and liabili-
ties, and their corresponding market funding rates.
We adjust trading revenues for net interest revenues
from non-trading derivatives that do not qualify for hedge
accounting treatment. Had these transactions qualified as
hedges for accounting purposes, the net interest cash
flows associated with them would have been reported as
net interest revenues.
The following table shows the components of net
trading related interest:
68
in € m. 2001 2000 1999
Interest revenues on trading assets 15,571 14,439 7,811
Interest expense on trading liabilities 5,723 6,285 3,514
Funding cost 8,204 8,188 3,363
Trading related interest (included in net interest) 1,644 (34) 934
Interest from non-qualifying derivatives (included in trading revenues) (259) (105) 970
Net trading related interest 1,385 (139) 1,904
As interest revenues on our trading assets, interest
expense on our trading liabilities and the funding cost/ben-
efit are included in net interest revenues, the table indi-
cates the total of these items as “trading related interest”
before adjustment for the net interest revenues from non-
trading derivatives that do not qualify for hedge accounting
treatment (non-qualifying derivatives).

69
Our trading performance decreased by € 70 million, or
1%, in 2001. Our performance in equity trading in particu-
lar suffered from the adverse market conditions and de-
creased by € 838 million, or 28%. On the other hand,
however, a number of trading businesses achieved rev-
enue growth despite the difficult environment in 2001,
compensating for the decline in equities. Interest and
credit related trading performance increased by € 575 mil-
lion, or 21%, because of record revenues in trading in debt
securities and over-the-counter interest and credit deriva-
tives. Foreign exchange, metals and commodities trading
had another successful year, as we were able to benefit
from our leading market position in foreign exchange trad-
ing with a 27% increase in trading performance. Other
trading performance includes € 686 million gains from
derivative transactions entered into for non-trading pur-
poses, but not qualifying for hedge accounting. This repre-
sents an increase of € 226 million over the € 460 million
recognized in 2000. The fact that significant revenue was
recorded in 2001 is largely due to forward contracts on
certain of our industrial holdings which fail to qualify for
hedge accounting treatment.
In 2000 trading performance increased by € 3.5 billion
as compared with 1999. Increased trading performance
in equities, both securities and derivatives, provided the pri-
mary contribution to the overall increase in trading perform-
ance. Our business in this area had become more firmly
established by 2000, and the strong markets in early 2000
presented our clients and us with increased opportunities
for large transaction volumes in equities. These opportuni-
ties diminished by the end of 2000. Increasing asset val-
ues and high market liquidity in early 2000 generally also
contributed to this result. Trading in over-the-counter
derivatives was another significant source of this increase,
most notably reflecting the expansion of our global credit
derivatives business as this product became increasingly
important as a credit risk management tool in the financial
markets generally. Foreign exchange trading also contribu-
ted substantially, primarily from activity in Europe, but also
from activity in North America and the Asia-Pacific region,
which was contributed by the full-year effect of the former
operations of Bankers Trust.
Management Discussion
The following table combines trading revenues according
to U.S. GAAP with the net trading related interest to arrive
at to our measure of trading performance:
2001 2000 1999
Trading Net Trading Trading Net Trading Trading Net Trading
revenues Trading perform- revenues Trading perform- revenues Trading perform-
reported related ance reported related ance reported related ance
in € m. interest(1) interest(1) interest(1)
Interest and credit trading 2,203 1,070 3,273 1,740 958 2,698 820 527 1,347
Equity trading 1,632 471 2,103 3,550 (609) 2,941 1,759 (80) 1,679
Foreign exchange, metal, commodity trading 1,385 (6) 1,379 1,102 (12) 1,090 655 26 681
Other trading(2) 811 (150) 661 1,233 (476) 757 (1,107) 1,431 324
Total 6,031 1,385 7,416 7,625 (139) 7,486 2,127 1,904 4,031
(1) Includes interest income from trading assets and interest expense from trading liabilities, as well as allocations of interest expense and income representing the funding cost orbenefit associated with trading positions. These amounts are included in net interest revenue in the Consolidated Statement of Income. Also adjusts net interest revenues onderivatives entered into for non-trading purposes, but failing to qualify for hedge accounting treatment.
(2) Includes gains and losses from non-trading derivatives not qualifying for hedge accounting treatment.

Commissions and fee revenues. The following table
shows the principal components of our commissions and
fee revenues in 2001, 2000 and 1999:
70
in € m. 2001 2000 1999
Commissions and fees from fiduciary activities
Commissions for administration 643 466 305
Commissions for asset management 2,798 3,222 2,005
Commissions for other securities business 96 220 117
Total 3,537 3,908 2,427
Commissions, broker’s fees, markups on securities underwriting and
other securities activities
Underwriting and advisory fees 1,774 2,226 1,165
Brokerage fees 2,819 3,033 2,068
Total 4,593 5,259 3,233
Fees for other customer services 2,597 2,526 2,307
Total commissions and fees 10,727 11,693 7,967
Commissions and fees from fiduciary activities amounted
to € 3.5 billion in 2001, a decrease of € 371 million, or 9 %,
which was primarily due to lower management and per-
formance fees in asset management, offset in part by in-
creased commissions for administration.
Commissions and fees from fiduciary activities were
€ 3.9 billion in 2000, an increase of € 1.5 billion, or 61%,
as compared to 1999. This increase arose primarily from a
rise in commissions for asset management, which in turn
reflected:
– volume growth in our asset management and custody
businesses due to the Bankers Trust acquisition;
– growth in fees we base on the number of transactions
we execute, fees we base on our performance, and
sales loads we charge in our asset management busi-
nesses, all of which were positively impacted by the
strong market environment of early 2000; and
– growth in fees we charge based on the value of the
assets we manage given higher asset prices.
Underwriting and advisory fees decreased by € 452 mil-
lion, or 20%, to € 1.8 billion in 2001 from the € 2.2 bil-
lion we earned in 2000. The slowdown in capital markets
activity that began in the first half of 2000 continued
through 2001, and caused lower activities in our issuing
and advisory business.
Underwriting and advisory fees amounted to € 2.2 bil-
lion in 2000, an increase of € 1.1 billion, or 91%, as com-
pared to 1999. This increase reflected the full-year effect
of the acquisition of Bankers Trust, the positive market
conditions and the expansion of our investment banking
activities. The buoyant capital markets through early 2000
and the strong pace of new issues and mergers and acqui-
sition activity, together with generally increasing asset
prices, led to growth in revenues in 2000 in most of our
underwriting and advisory businesses, although activity
slowed markedly late in the year.
Brokerage fees were € 2.8 billion in 2001, a decrease
of € 214 million, or 7 % as compared to 2000, as weak
financial market conditions caused significant customer
restraint and brokerage transaction volume declined.
Brokerage fees amounted to € 3.0 billion in 2000,
an increase of 47%, as compared to 1999. This increase
reflected the positive market conditions, which led to
increased value-related transaction fees and higher trans-
action volume, and the expansion of our brokerage activi-
ties, especially in the first half of the year.

71
Insurance premiums. Insurance premiums were
€ 2.7 billion in 2001, a decrease of € 120 million or 4%
compared to 2000. In December 2001, we signed agree-
ments with Zurich Financial Services (which we call Zurich)
to acquire the greater part of Zurich´s asset management
businesses (excluding its U.K. operations) and to sell to
Zurich the greater part of our insurance business, including
our subsidiaries in Germany, Spain, Italy and Portugal.
We expect the transaction to close in mid-2002, pending
regulatory approval and other actions. Following the sale,
we will continue to exclusively distribute insurance prod-
ucts from our former subsidiaries to our private and retail
clients in the respective countries.
Insurance premiums were € 2.8 billion in 2000, a
decrease of € 174 million, or 6%, as compared to 1999.
This represented a decline in gross premiums written,
particularly in our Deutsche Herold life insurance business,
reflecting a very successful year in 1999. In 1999, we
observed substantial public interest in insurance products
because of reports that Germany would increase taxes on
yields earned from insurance policies, which caused a rush
to purchase products before effectiveness of any new tax
law. No such law was enacted. The decline also reflects
the increasing trend in Germany towards unit-linked life
insurance. Amounts paid in for these instruments, in
which a large portion of the policyholders’ premiums is
invested in investment funds, are to this extent booked
directly on the balance sheet as insurance policy claims
and reserves and do not appear in our revenues. For
further information on insurance assets and liabilities,
see Note [21] to the consolidated financial statements.
Net gains on securities available for sale. Gains on secu-
rities available for sale were € 1.5 billion in 2001, a decrease
of € 2.2 billion, or 59 %, compared to 2000. In 2001, we
disposed of approximately 25 % of our holding in Munich
Re which accounted for approximately 90 % of our net
gains on sales. We held 7.2 % of Munich Re’s shares at
December 31, 2001.
Gains on securities available for sale were € 3.7 billion
in 2000, an increase of € 1.5 billion, or 71%, as compared
to 1999. The major drivers in both years were our sales of
shares of Allianz AG, which accounted for approximately
60 % of the net gain in each year. In 1999, we disposed of
25 % of our holdings in Allianz, and in 2000 we disposed
of 42% of our remaining holdings in Allianz. We held 4.2 %
of Allianz’s shares at December 31, 2000 and 4.0% of
Allianz’s shares at December 31, 2001.
As our strategy with respect to our industrial holdings
is to significantly reduce the size of, and maximize value
from, our industrial holdings, we expect that we will con-
tinue to sell portions of these holdings.
Excluding these transactions, a substantial portion of
the decrease between 2000 and 2001 was due to write-
downs of available for sale securities for other than tempo-
rary impairement. A substantial portion of the increase
between 1999 and 2000 was due to sales of equity securi-
ties by our insurance business, which decided to sell posi-
tions and reinvest the proceeds in order to permit policy-
holders to participate in the gains from its activities in
equity securities in the strong stock markets.
The 2000 amount of gains on securities available for
sale included a € 337 million gain we recognized when
we transferred some mutual funds from securities avail-
able for sale to our trading portfolio. We transferred these
mutual funds when we determined that our management
of the market risk in these securities would be enhanced
by moving responsibility for them to the risk managers of
our trading portfolio.
Management Discussion

Other noninterest revenues. Other noninterest revenues
were negatively affected by the deteriorated capital market
conditions, which deteriorated further after the terrorist
acts of September 11. In 2001, we recorded € 1.4 billion
of net write-downs and valuation adjustments on our own
investments within other noninterest revenues as com-
pared to approximately € 200 million in such charges in
2000.
Compensation and benefits were € 13.5 billion in
2000, an increase of € 3.9 billion, or 40 %, from 1999. The
most significant effect was in our Corporate and Invest-
ment Bank Group Division. The Asset Management Corpo-
rate Division also contributed substantially to the increase.
The average number of full-time staff increased by 10,196,
or 13%, in 2000 as compared to 1999, primarily as a result
of the Bankers Trust acquisition, which contributed approxi-
mately 5,000 new staff members to the increase. In addi-
tion, high asset prices and our performance gave rise to
higher bonuses. Approximately half of our salaries and
employee benefits in 2000 were due to special payments,
including performance-driven and target-based bonus pay-
ments that were largely based on pretax profitability.
72
Noninterest Expenses
in € m. 2001 2000 1999
Compensation and benefits 13,360 13,526 9,655
Other noninterest expenses 9,187 8,707 7,500
Policyholder benefits and claims 3,002 4,003 3,856
Goodwill amortization 951 771 486
Restructuring activities 294 125 459
Total 26,794 27,132 21,956
Other noninterest revenues were € 1.6 billion in 2000,
a decrease of € 157 million, or 8.8%, as compared to
€ 1.8 billion in 1999. The decrease in other noninterest
revenue was due in part to the inclusion in 1999 of a
€ 576 million gain on the currency swap we put in place
on the U.S. dollar purchase of Bankers Trust.
Compensation and benefits were € 13.4 billion in 2001, a
decrease of 1% from 2000. This was our largest category
of noninterest expenses. The impact of inflationary salary
increases and continued selective expansion in some
of our businesses as well as an increase in severance
payments and the buy-out of the remaining Global Equity
Plans was offset by a decrease in bonus and other special
payments as well as reductions of workforce in other
areas. Although a comparison of year end total full-time
staff shows a decline from 2000 to 2001, the average num-
ber of full-time staff increased slightly compared to 2000,
primarily as a result of the acquisition of National Discount
Brokers Group, Inc. in November 2000. Approximately
40% of our compensation and benefits in 2001 were due
to special payments, including performance driven and
target based bonus payments, largely based on pretax
profitability. Given the poorer results in 2001, performance
driven and target based bonus payments declined in 2001
compared to 2000. Although bonus payments are based
on targets or performance, retention considerations pre-
cluded a proportionate decline in special payments.

73
Other noninterest expenses. Net occupancy expense
was € 1.3 billion in 2001, an increase of € 244 million, or
22%, from 2000. This increase reflects new leases, buy-
outs of redundant leases no longer required and refurbish-
ments of properties.
Net occupancy expense was € 1.1 billion in 2000, an
increase of € 68 million, or 7%, from 1999, primarily
reflecting increased rental expenses from operating leases
as a result of the full-year inclusion of Bankers Trust.
Furniture and equipment expenses were € 2.9 billion
in 2001, a decrease of € 102 million, or 3%, as compared
to 2000. The greatest component of furniture and equip-
ment expenses was attributable to our IT environment.
Information Technology consulting fees and programming
costs primarily related to development of our information
technology were reclassified to this category from agency
and other professional service fees as well as from com-
munication expenses where they were reported in prior
years. Prior period amounts have been reclassified accord-
ingly.
Furniture and equipment expenses were € 3.1 billion
in 2000 after reclassification of IT-related costs, an in-
crease of € 689 million, or 29%, as compared to 1999,
primarily reflecting increased information technology costs
arising from e-commerce activities, as well as general
increases attributable to the inclusion of Bankers Trust
for a full year. In both cases, the most significant effect
was seen in our Corporate and Investment Bank Group
Division.
Agency and other professional service fees were
€ 1.1 billion in 2001, a decrease of € 71 million, or 6%,
from 2000. This decrease arose primarily from a decline in
demand for consultants. Communication and data ser-
vices increased by € 76 million, or 13% to € 642 million in
2001 from 2000 mainly due to higher rent, maintenance
costs for software and data communications equipment
and higher telephone and line charges compared to 2000.
Agency and other professional service fees were
€ 1.2 billion in 2000 after reclassification of IT-related costs,
an increase of € 332 million, or 41%, from 1999. This
increase arose primarily from consulting fees. Mainly
because of our acquisition of Bankers Trust, communica-
tion and data services increased € 163 million, or 40%,
to € 566 million in 2000 from € 403 million in 1999.
Other expenses in 2000 included a provision of
€ 50 million in 2000 to a foundation called “Foundation for
Remembrance, Responsibility and the Future”. We had
already provided for nearly all of the remainder of our
€ 153 million contribution to this foundation in 1998. This
foundation, which German companies, including ourselves,
and the German government agreed to establish, is pro-
viding financial payments to victims of forced labor and
other injustices under the National Socialist regime. The
DM 10 billion foundation is being funded in equal amounts
by German companies and the German government.
Management Discussion

Policyholder benefits and claims. Policyholder benefits
and claims include claims payments, allocations to our
loss reserves from property/casualty and assumed reinsur-
ance business, payments to policyholders and additions
to reserves and liabilities in favor of policyholders. Policy-
holder benefits and claims, which arise from our insurance
activities, were € 3.0 billion in 2001, a 25% reduction com-
pared to 2000. This reduction reflects lower allocation
for the benefit of policyholders from the annual surplus
of our insurance affiliates in line with decreased net gains
on securities available for sale and reduced insurance
revenues.
These expenses were € 4.0 billion in 2000, an in-
crease of € 147 million, or 4%, as compared to 1999,
reflecting the growth of our business in this area.
Goodwill amortization. Goodwill amortization was
€ 951 million in 2001, an increase of € 180 million, or 23 %,
as compared to 2000. In 2001, the amortization of the
Bankers Trust goodwill was € 514 million, compared to
€ 501 million in 2000. The amortization of the Morgan
Grenfell goodwill was € 62 million. For National Discount
Brokers Group, Inc. we amortized € 43 million of goodwill
in 2001 compared to € 4.8 million in 2000.
Goodwill amortization was € 771 million in 2000, an
increase of € 285 million, or 59%, as compared to 1999,
resulting primarily from the inclusion for a full year of
Bankers Trust. The amortization on the Bankers Trust good-
will was € 501 million in 2000 as compared to € 256 mil-
lion in 1999.
Restructuring activities. We recorded € 294 million of
expenses in restructuring activities in 2001, € 125 million
in 2000 and € 459 million in 1999. The expenses related
to the following restructuring plans:
in € m. 2001 2000 1999
Group Restructuring 294 – –
Bankers Trust – (20) 392
Personal Banking – 136 –
Other – 9 67
Total 294 125 459
The Group recorded a pre-tax charge of € 294 million in
the fourth quarter of 2001 related to a restructuring plan
affecting both of our main group divisions: the Corporate
and Investment Bank Group Division (CIB) and the Private
Clients and Asset Management Group Division (PCAM).
Of the total € 294 million, € 213 million related to the
restructuring measures in CIB and € 81 million related to
PCAM. A total of approximately 2,400 staff, across all
levels of the Group, are impacted by the restructuring plan.
The restructuring in CIB covers steps to be taken as a
result of changing market conditions in the year 2001 and
to give further effect to the CIB organizational and business
model that was created during 2001. It primarily impacts
CIB’s customer coverage and relationship management
processes, certain aspects of the cash management, cus-
tody and trade finance businesses of Global Transaction
Banking and the related elements of the settlement, infra-
structure and real estate support functions.
The plan also includes the further streamlining of the
senior management structure in PCAM as a consequence
of the re-organization of this group division’s operations,
including real estate support.
When we acquired Bankers Trust in June 1999, we
began a restructuring program designed to assist our inte-
gration of the Bankers Trust businesses with our own,
reduce overlaps and reorient several business areas. We
recorded restructuring liabilities totaling € 866 million in
connection with two separate restructuring plans. Of the
restructuring liabilities, we recorded € 596 million in June
1999 reflecting severance and other termination-related
costs. A significant amount (€ 474 million) of these costs
related to severance and other termination-related costs
paid to employees of Bankers Trust. We recognized these
74

75
costs as a liability when we acquired Bankers Trust. Since
this liability reduced the value of the net assets we ac-
quired, we recognized € 474 million in June 1999 directly
to goodwill. The remaining costs, totaling € 122 million,
were attributable to employees and properties of our exist-
ing organization. We therefore expensed these costs as
restructuring activities.
During the fourth quarter of 1999, we recorded addi-
tional expenses in restructuring activities of € 270 million
in severance and other termination-related costs in con-
nection with our continuing efforts to streamline support
functions and realign some business activities.
As a result of these restructuring plans, we planned
for a reduction of approximately 3,300 positions. This
reduction affected multiple levels of employees through-
out the Group.
During 2000, we completed all of the significant re-
structuring initiatives, eliminating approximately 2,700 posi-
tions and utilizing € 834 million of our restructuring liabili-
ties. We therefore released the € 32 million of the
restructuring liability that remained after we had com-
pleted the restructuring program.
We also recorded restructuring activities in 2000 to-
taling € 136 million in connection with a plan for Deutsche
Bank 24 to consolidate its branch offices and its related
back-office functions. Of this amount, approximately
€ 100 million was for severance and other termination-
related costs attributable to approximately 1,000 positions,
and € 36 million was for other costs primarily related to
lease terminations. All actions contemplated in the plan
were completed during 2001.
As of December 31, 2000, € 85 million of the remain-
ing reserve balance related to severance and other termi-
nation-related costs for further staff reductions of approxi-
mately 900 positions and € 36 million related to lease
terminations.
In addition to the above plans, we also recorded
restructuring liabilities of € 67 million in 1999 and € 37 mil-
lion in 2000 for other restructuring plans. These other
restructuring plans included primarily the streamlining of
our transaction processing product delivery and providing
for business realignments and consolidation activities. The
plans we recorded in 1999, contemplated staff reductions
of 600 positions. However, due to a higher than expected
level of employee attrition, we did not terminate 400
positions as originally planned. Primarily as a result of
this change in severance plans, we released a total of
€ 28 million of the liabilities we recorded in 1999. Under
the restructuring plans we recorded in 2000, we planned
to eliminate a total of 400 employee positions. We elimi-
nated 300 of these positions in 2000 and eliminated 100
of these positions in 2001.
For further information on our restructuring activities,
see Note [23] to the consolidated financial statements.
During 2002, we intend to record restructuring
charges related to the completion of our Group restructur-
ing efforts as well as in connection with our acquisition of
the greater part of Zurich’s asset management business
(excluding its U.K. operations). These restructuring plans
will relate primarily to the involuntary termination of em-
ployees, including severance and other termination-related
costs, and are expected to be recorded during the first half
of 2002.
Income Tax Expense (Benefit)
Income tax expense in 2001 was € 1.4 billion, as compa-
red to income tax benefit of € 6.6 billion in 2000 and
income tax expense of € 738 million in 1999. The above
differences are primarily attributable to the accounting for
effects of German income tax rate changes that were
enacted in 1999 and 2000. The tax benefit attributable to
these changes was € 951 million in 1999 and € 9.3 billion
in 2000. In 2001 there was tax expense of € 995 million as
a result of the reversal of the deferred taxes accumulated
in other comprehensive income at December 31, 2000,
due to actual sales of equity securities. We expect further
reversal of tax expense in future years as additional equity
securities are disposed of. Excluding the effects of chan-
ges in German tax rates our effective tax rates were 24%
in 2001, 38 % in 2000 and 72% in 1999.
Management Discussion

The major reason for the decrease in adjusted 2001
tax rate as compared to 2000 was the impact of capital
gains that are tax exempt. The adjusted tax rate in 1999
was high primarily due to losses in some of our legal enti-
ties outside Germany for which we determined that we
could not record tax benefits for use in future periods.
Cumulative Effect of Accounting Changes
Effective January 1, 2001, we adopted SFAS No. 133,
“Accounting for Derivative Instruments and Hedging Activi-
ties”. SFAS 133, as amended, establishes accounting and
reporting standards for derivative instruments, including
certain derivative instruments embedded in other con-
tracts, and for hedging activities. It requires companies to
recognize all derivatives on the balance sheet as assets or
liabilities measured at fair value. The change in a deriva-
tive’s fair value is generally recognized in current period
earnings or equity. Upon adoption of SFAS 133, we record-
ed a net transition expense of € 207 million, after tax, as
a cumulative effect of a change in accounting principle in
the consolidated statement of income. This amount was
primarily due to the adjustment required to bring certain
embedded derivatives to fair value and to adjust the carry-
ing amount of the related host contracts (items in which
the derivatives are embedded) at January 1, 2001, pursuant
to the SFAS 133 transition provisions for embedded deriva-
tives that must be accounted for separately.
Results of Operations by Segment
We revised our management reporting systems in 2001 to
reflect the following changes:
– We reflected our new organizational structure;
– We changed the format of our statement of income for
management accounting purposes, to present the same
line items as in our consolidated financial statement
under U.S. GAAP; and
– We allocated the cost of the Corporate Center across
our divisions.
New Organizational Structure. On February 1, 2001, we
adopted our new organizational structure, realigning the
structure of our activities from five business divisions into
three group divisions. In addition, we have a service func-
tion called DB Services, that provides corporate services,
information technology, consulting and transaction ser-
vices to our entire organization. Finally, we have a Corpo-
rate Center to house those functions that support our
cross-divisional management.
The Corporate and Investment Bank Group Division
serves all of our corporate and institutional clients, ranging
from small- and medium-sized enterprises to multinational
corporations. By combining within one group division our
Corporate Banking & Securities activities with our Global
Transaction Banking activities, we have integrated services
we previously provided in the Corporates and Real Estate
Division, the Global Corporates and Institutions Division
and the Global Institutional Services business area of the
Global Technology and Services Division.
The Private Clients and Asset Management Group
Division integrates, on a global basis, all of our activities
for private clients, as well as our active and passive asset
management activities for both private and institutional
clients. Within this group division, we manage these activi-
ties in three global corporate divisions: Personal Banking,
Private Banking, and Asset Management.
76

77
Within the Corporate Investments Group Division, we
combine our principal investment activities. This unit man-
ages our principal investments in private equity and ven-
ture capital and our real estate holding companies, as well
as our industrial investments. Our principal investments
held by DB Investor, which were previously reported in the
reconciliation of the results of the business segments to
the consolidated financial statements, are now included in
this group division. In addition, Corporate Investments
covers strategic investments as well as activities which do
not belong to the Group’s core business.
The figures reported for the years 2000 and 1999
have been restated to make them comparable to 2001.
Format of our Statement of Income. Beginning in 2001,
our management reporting systems follow the same for-
mat as our Consolidated Statement of Income. As a result
we no longer have reclassifications among the line items
between our management reporting systems and our
consolidated financial statements under U.S. GAAP. We
have described the most significant changes below:
– Components previously reported as balance of other
expenses (income) within our management reporting
systems are now reflected either as revenues or as
noninterest expenses.
– Revenues of our insurance business were previously
reported net of policyholder benefits and claims as
revenues within our management reporting systems.
We now report these components gross as revenues
and noninterest expenses.
– Restructuring expenses (benefit) were previously
reported as a separate line item in our management
reporting systems. We now include them as noninterest
expenses.
– Credit losses on lending-related commitments were
previously reported under provisions for losses on loans
and advances in our management reporting systems.
We now include them as noninterest expenses.
The figures reported for the years 2000 and 1999
have been restated to make them comparable to 2001.
Allocation of Corporate Center costs. We previously
reported our Corporate Center as a separate unit in our
management reporting systems. Beginning in 2001,
we fully allocate the costs of our Corporate Center within
the noninterest expense line. As a consequence, the
Corporate Center contains no material result components
and is no longer reported separately.
The figures reported for the years 2000 and 1999
have been restated to make them comparable to 2001.
General information on our management reporting
systems. As discussed above, our management reporting
systems are not necessarily based on U.S. GAAP, but
instead on our internal reporting systems and methodolo-
gies for managing our divisions, assessing their results
internally and allocating our internal resources. These sys-
tems and methodologies may be different than those
other financial institutions use, and you should consider
this in making any comparisons with other financial insti-
tutions.
The process we use in our management reporting
systems allocates revenues and expenses among our
business segments. Because our business activities are
diverse in nature and our operations are integrated, we
make estimates and judgments where appropriate to
apportion our revenue and expense items among our busi-
ness segments. Our management reporting systems fol-
low the “matched transfer pricing concept”, in which we
allocate our external net interest revenues among our
business segments based on the assumption that we
fund or invest all of our assets and liabilities in the money
and capital markets. To create comparability with competi-
tors who have legally independent units that have their
own equity funding, we allocate the notional interest we
receive on our consolidated capital proportionally among
our business segments as part of their net interest rev-
enues.
Management Discussion
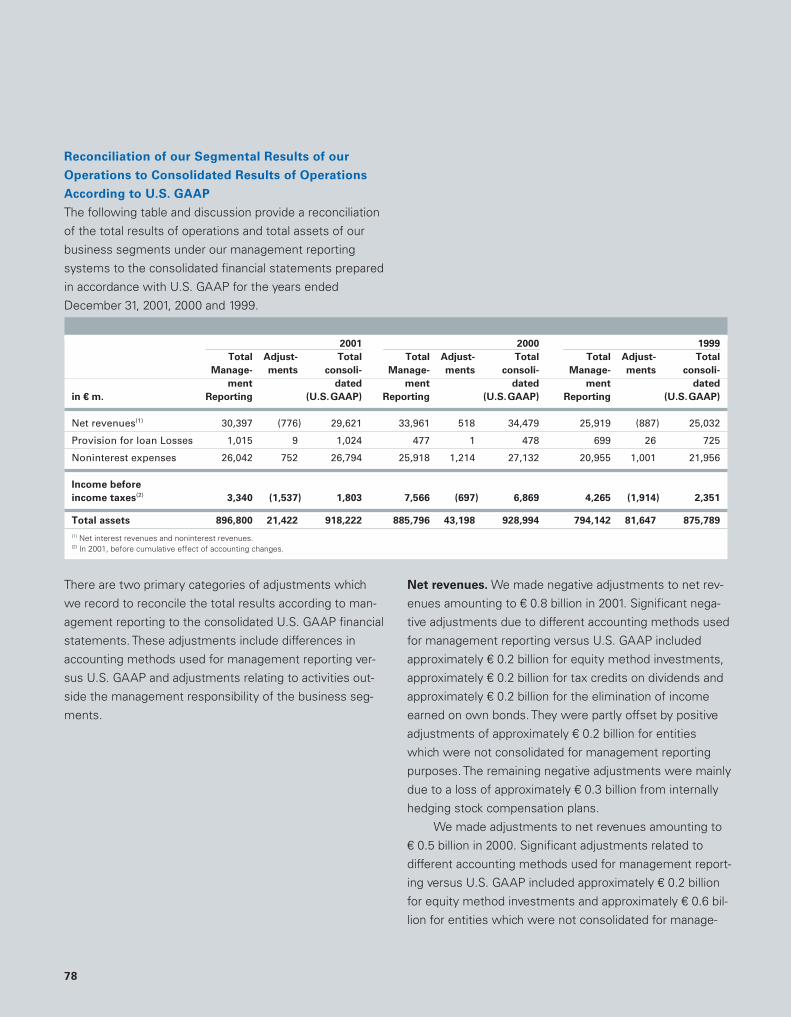
Reconciliation of our Segmental Results of our
Operations to Consolidated Results of Operations
According to U.S. GAAP
The following table and discussion provide a reconciliation
of the total results of operations and total assets of our
business segments under our management reporting
systems to the consolidated financial statements prepared
in accordance with U.S. GAAP for the years ended
December 31, 2001, 2000 and 1999.
There are two primary categories of adjustments which
we record to reconcile the total results according to man-
agement reporting to the consolidated U.S. GAAP financial
statements. These adjustments include differences in
accounting methods used for management reporting ver-
sus U.S. GAAP and adjustments relating to activities out-
side the management responsibility of the business seg-
ments.
78
2001 2000 1999
Total Adjust- Total Total Adjust- Total Total Adjust- Total
Manage- ments consoli- Manage- ments consoli- Manage- ments consoli-
ment dated ment dated ment dated
in € m. Reporting (U.S.GAAP) Reporting (U.S.GAAP) Reporting (U.S.GAAP)
Net revenues(1) 30,397 (776) 29,621 33,961 518 34,479 25,919 (887) 25,032
Provision for loan Losses 1,015 9 1,024 477 1 478 699 26 725
Noninterest expenses 26,042 752 26,794 25,918 1,214 27,132 20,955 1,001 21,956
Income before
income taxes(2) 3,340 (1,537) 1,803 7,566 (697) 6,869 4,265 (1,914) 2,351
Total assets 896,800 21,422 918,222 885,796 43,198 928,994 794,142 81,647 875,789
(1) Net interest revenues and noninterest revenues.(2) In 2001, before cumulative effect of accounting changes.
Net revenues. We made negative adjustments to net rev-
enues amounting to € 0.8 billion in 2001. Significant nega-
tive adjustments due to different accounting methods used
for management reporting versus U.S. GAAP included
approximately € 0.2 billion for equity method investments,
approximately € 0.2 billion for tax credits on dividends and
approximately € 0.2 billion for the elimination of income
earned on own bonds. They were partly offset by positive
adjustments of approximately € 0.2 billion for entities
which were not consolidated for management reporting
purposes. The remaining negative adjustments were mainly
due to a loss of approximately € 0.3 billion from internally
hedging stock compensation plans.
We made adjustments to net revenues amounting to
€ 0.5 billion in 2000. Significant adjustments related to
different accounting methods used for management report-
ing versus U.S. GAAP included approximately € 0.2 billion
for equity method investments and approximately € 0.6 bil-
lion for entities which were not consolidated for manage-

79
Noninterest expenses. We made adjustments to non-
interest expenses amounting to € 0.8 billion in 2001.
Significant adjustments due to different accounting meth-
ods used for management reporting versus U.S. GAAP
included approximately € 0.4 billion for share compensa-
tion expense (including the buy-out costs for the Global
Equity Plan), approximately € 0.2 billion for entities not
consolidated for management reporting purposes, approxi-
mately € 0.1 billion for timing differences in the recognition
and presentation of restructuring activities, approximately
€ 0.1 billion expenses for minority interests and approxi-
mately € 0.1 billion for goodwill amortization expense. The
remaining positive adjustment of € 0.1 billion was connect-
ed with internally hedging stock compensation plans.
We made adjustments to noninterest expenses
amounting to € 1.2 billion in 2000. Significant adjustments
related to different accounting methods used for manage-
ment reporting versus U.S. GAAP included approximately
€ 0.4 billion for share compensation expense, approxima-
tely € 0.4 billion for timing differences in the recognition
and presentation of restructuring activities, approximately
0.2 billion for entities not consolidated for management
reporting purposes, approximately € 0.1 billion expenses
for minority interests and approximately € 0.1 billion for
goodwill amortization expense.
We made adjustments to noninterest expenses
amounting to € 1.0 billion in 1999. Significant adjustments
related to different accounting methods used for manage-
ment reporting versus U.S. GAAP included approximately
€ 0.2 billion for share compensation expense, approxi-
mately € 0.2 billion for timing differences in the recogni-
tion and presentation of restructuring activities, approxi-
mately € 0.1 billion for entities not consolidated for
management reporting purposes and approximately
€ 0.1 billion for expenses for minority interests. The re-
maining adjustments of € 0.4 billion were due to other
accounting differences and to corporate items outside the
management responsibility of the business segments.
Management Discussion
ment reporting purposes. The remaining negative adjust-
ments of € 0.3 billion were due to other accounting differ-
ences and to corporate items outside the management
responsibility of the business segments.
We made negative adjustments to net revenues
amounting to € 0.9 billion in 1999. Significant negative
adjustments related to different accounting methods used
for management reporting versus U.S. GAAP included
approximately € 0.1 billion for equity method investments,
approximately € 0.2 billion for the elimination of income
earned on own bonds and approximately € 0.4 billion for
entities which were not consolidated for management
reporting purposes. The remaining negative adjustments
of € 0.2 billion were due to other accounting differences
and to corporate items outside the management responsi-
bility of the business segments.
Any item relating to different accounting methods
used for management reporting versus U.S. GAAP not
appearing in each of the years 2001, 2000 and 1999 was
included in other accounting differences as the amounts
were not significant.
Provision for loan losses. The adjustments primarily
reflected provisions for loan losses, none of which
was individually material, which are not under the manage-
ment responsibility of the business segments.

Any item relating to different accounting methods
used for management reporting versus U.S. GAAP not
appearing in each of the years 2001, 2000 and 1999 was
included in other accounting differences as the amounts
were not significant.
Assets. The adjustments primarily consist of assets
that are not allocated to the business segments, including
deferred tax assets and premises and equipment.
Segmental Results of Operations
The following tables show information regarding our busi-
ness segments for the years ended December 31, 2001,
2000 and 1999. The criterion for segmentation into divi-
sions is our organizational structure as it existed as at
December 31, 2001.
80
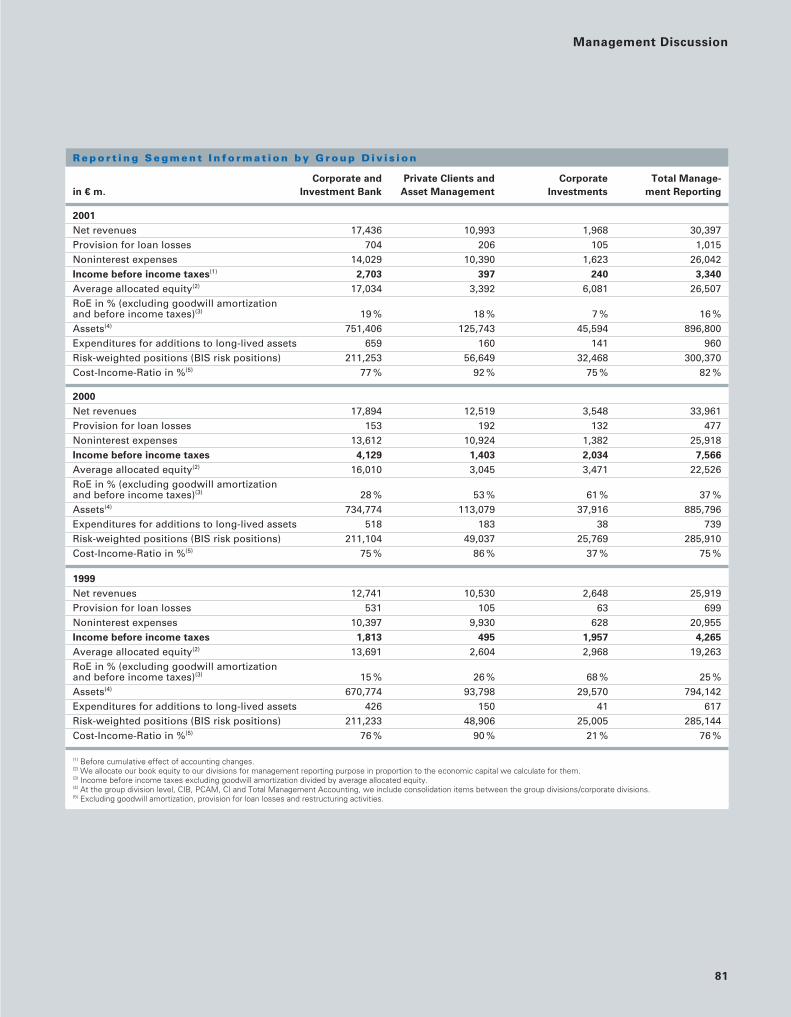
81
Management Discussion
R e p o r t i n g S e g m e n t I n f o r m a t i o n b y G r o u p D i v i s i o n
Corporate and Private Clients and Corporate Total Manage-
in € m. Investment Bank Asset Management Investments ment Reporting
2001
Net revenues 17,436 10,993 1,968 30,397Provision for loan losses 704 206 105 1,015Noninterest expenses 14,029 10,390 1,623 26,042 Income before income taxes(1) 2,703 397 240 3,340
Average allocated equity(2) 17,034 3,392 6,081 26,507 RoE in % (excluding goodwill amortization and before income taxes)(3) 19 % 18 % 7 % 16 %Assets(4) 751,406 125,743 45,594 896,800Expenditures for additions to long-lived assets 659 160 141 960Risk-weighted positions (BIS risk positions) 211,253 56,649 32,468 300,370Cost-Income-Ratio in %(5) 77 % 92 % 75 % 82 %
2000
Net revenues 17,894 12,519 3,548 33,961Provision for loan losses 153 192 132 477Noninterest expenses 13,612 10,924 1,382 25,918Income before income taxes 4,129 1,403 2,034 7,566
Average allocated equity(2) 16,010 3,045 3,471 22,526RoE in % (excluding goodwill amortizationand before income taxes)(3) 28 % 53 % 61 % 37 %Assets(4) 734,774 113,079 37,916 885,796Expenditures for additions to long-lived assets 518 183 38 739Risk-weighted positions (BIS risk positions) 211,104 49,037 25,769 285,910Cost-Income-Ratio in %(5) 75 % 86 % 37 % 75 %
1999
Net revenues 12,741 10,530 2,648 25,919Provision for loan losses 531 105 63 699Noninterest expenses 10,397 9,930 628 20,955Income before income taxes 1,813 495 1,957 4,265
Average allocated equity(2) 13,691 2,604 2,968 19,263RoE in % (excluding goodwill amortizationand before income taxes)(3) 15 % 26 % 68 % 25 %Assets(4) 670,774 93,798 29,570 794,142Expenditures for additions to long-lived assets 426 150 41 617Risk-weighted positions (BIS risk positions) 211,233 48,906 25,005 285,144 Cost-Income-Ratio in %(5) 76 % 90 % 21 % 76 %
(1) Before cumulative effect of accounting changes.(2) We allocate our book equity to our divisions for management reporting purpose in proportion to the economic capital we calculate for them.(3) Income before income taxes excluding goodwill amortization divided by average allocated equity.(4) At the group division level, CIB, PCAM, CI and Total Management Accounting, we include consolidation items between the group divisions/corporate divisions.(5) Excluding goodwill amortization, provision for loan losses and restructuring activities.

82
R e p o r t i n g S e g m e n t I n f o r m a t i o n b y C o r p o r a t e D i v i s i o n
Corporate and Investment Bank Private Clients and Asset Management
Corporate Banking Global Trans- Personal Private Asset
in € m. & Securities action Banking Banking Banking Management
2001
Net revenues 14,415 3,021 6,958 2,123 1,912Provision for loan losses 723 (19) 183 11 12Noninterest expenses 11,525 2,504 6,619 2,164 1,607Income before income taxes(1) 2,167 536 156 (52) 293
Average allocated equity(2) 14,529 2,505 1,459 479 1,454RoE in % (excluding goodwill amortization and before income taxes)(3) 18 % 24 % 13 % 3 % 28 %Assets 739,682 22,562 92,450 15,307 18,634Expenditures for additions to long-lived assets 560 99 67 62 31Risk-weighted positions (BIS risk positions) 189,482 21,771 41,866 10,416 4,367Cost-Income-Ratio in %(4) 76 % 80 % 95 % 97 % 76 %
2000
Net revenues 14,951 2,943 7,986 2,434 2,099Provision for loan losses 153 0 182 10 0Noninterest expenses 11,367 2,245 7,499 2,016 1,409Income before income taxes 3,431 698 305 408 690
Average allocated equity(2) 13,485 2,525 1,371 481 1,193RoE in % (excluding goodwill amortizationand before income taxes)(3) 28 % 30 % 25 % 99 % 67 %Assets 724,930 27,771 81,229 13,955 17,897Expenditures for additions to long-lived assets 440 78 113 46 24Risk-weighted positions (BIS risk positions) 196,829 14,275 37,929 6,104 5,004Cost-Income-Ratio in %(4) 74 % 76 % 94 % 81 % 62 %
1999
Net revenues 10,686 2,055 7,337 1,635 1,558Provision for loan losses 621 (90) 110 (5) 0Noninterest expenses 8,786 1,611 7,503 1,419 1,008Income before income taxes 1,279 534 (276) 221 550
Average allocated equity(2) 11,542 2,149 1,172 411 1,021RoE in % (excluding goodwill amortizationand before income taxes)(3) 13 % 26 % (20) % 63 % 63 %Assets 673,377 20,742 74,830 10,358 8,611Expenditures for additions to long-lived assets 374 52 109 30 11Risk-weighted positions (BIS risk positions) 196,996 14,237 37,827 6,088 4,991Cost-Income-Ratio in %(4) 77 % 74 % 98 % 83 % 56 %
(1) Before cumulative effect of accounting changes.(2) We allocate our book equity to our divisions for management reporting purpose in proportion to the economic capital we calculate for them.(3) Income before income taxes excluding goodwill amortization divided by average allocated equity.(4) Excluding goodwill amortization, provision for loan losses and restructuring activities.

83
The following tables present the revenue components of
the Corporate and Investment Bank Group Division and
the Private Clients and Asset Management Group Division
for the years ended December 31, 2001, 2000 and 1999:
Corporate and Investment Bank
in € m. 2001 2000 1999
Sales & Trading(debt and other products) 5,856 4,462 3,627
Sales & Trading (equity) 3,656 4,523 2,364
Sales & Trading 9,512 8,985 5,991
Loan products 3,365 4,021 3,164
Transaction services 3,021 2,943 2,055
Origination (debt) 429 286 197
Origination (equity) 492 937 443
Origination 921 1,223 640
Advisory 568 879 585
Other 49 (157) 306
Total 17,436 17,894 12,741
Private Clients and Asset Management
in € m. 2001 2000 1999
Insurance business 3,485 4,458 4,268
Portfolio/fund management 2,191 2,658 1,930
Loan/deposit products 2,393 2,286 2,077
Advisory 1,554 2,035 1,283
Transaction fees 633 615 623
Other 737 467 349
Total 10,993 12,519 10,530
Group Divisions
Corporate and Investment Bank Group Division
The following table sets forth the results of our Corporate
and Investment Bank Group Division for the years ended
December 31, 2001, 2000 and 1999, in accordance with
our management reporting systems:
in € m. 2001 2000 1999
Net revenues
Net interest revenues 4,946 3,366 4,496
Other net revenues 12,490 14,528 8,245
Total net revenues 17,436 17,894 12,741
Provision for loan losses 704 153 531
Noninterest expenses
Goodwill amortization 451 392 238
Restructuring activities 213 (102) 429
Other noninterest expenses 13,365 13,322 9,730
Total noninterest expenses 14,029 13,612 10,397
Income before income taxes 2,703 4,129 1,813
Total assets (in € bn.) 751 735 671
In the following paragraphs, we discuss the contribution
of the individual corporate divisions to the overall results
of the Corporate and Investment Bank Group Division.
Management Discussion

Corporate Banking & Securities Corporate Division
The following table sets forth the results of our Corporate
Banking & Securities Corporate Division for the years
ended December 31, 2001, 2000 and 1999, in accordance
with our management reporting systems:
in € m. 2001 2000 1999
Net revenues
Net interest revenues 3,852 2,240 3,579
Other net revenues 10,563 12,711 7,107
Total net revenues 14,415 14,951 10,686
Provision for loan losses 723 153 621
Noninterest expenses
Goodwill amortization 391 332 208
Restructuring activities 176 (62) 371
Other noninterest expenses 10,958 11,097 8,207
Total noninterest expenses 11,525 11,367 8,786
Income before income taxes 2,167 3,431 1,279
Total assets (in € bn.) 740 725 673
Income before income taxes. Income before income
taxes was € 2.2 billion in 2001, a decrease of 37%, or
€ 1.3 billion as compared to 2000. In-creases in the provi-
sion for loan losses and reductions in other net revenues
accounted for most of this deterioration.
Between 1999 and 2000 income before income taxes
increased by € 2.2 billion to € 3.4 billion. This increase was
mainly attributable to increases in other net revenues.
We do not see significant short term changes in mar-
ket conditions that would lead to improvements in income
before income taxes in this corporate division, and they
might decline further. Most of our businesses depend
substantially on market conditions, such as transactional
volume and the number and size of corporate restructur-
ings. We continue to regularly review our cost contain-
ment measures. However, it is possible that the results
of our cost saving initiatives will be poorer than we antici-
pated or that, via selective expansion of our businesses,
noninterest expenses may actually increase, thus reducing
our income before income taxes.
Net Revenues
in € m. 2001 2000 1999
Net revenues
Sales & Trading(debt and other products) 5,856 4,462 3,627
Sales & Trading (equity) 3,656 4,523 2,364
Loan products 3,365 4,021 3,164
Origination (debt) 429 286 197
Origination (equity) 492 937 443
Advisory 568 879 585
Other 49 (157) 306
Total net revenues 14,415 14,951 10,686
Net revenues decreased 4%, from € 15.0 billion in 2000 to
€ 14.4 billion in 2001. The € 536 million reduction in net
revenues is attributable to a reduction in other net rev-
enues of € 2.1 billion, offset by an increase in net interest
revenue of € 1.6 billion. The market deterioration in eco-
nomic conditions in the second half of 2000 continued
throughout 2001. While generally weak markets and the
reduction in transaction volumes adversely affected our
equities related sales and trading, origination and advisory
businesses, our fixed income business improved. This
reflected, in part, the favorable conditions in the fixed
income markets, together with our clients’ emphasis to
lower-risk products after September 11.
Net revenues were € 15.0 billion in 2000, an in-
crease of € 4.3 billion, or 40 %, as compared to 1999. The
€ 4.3 billion increase in net revenues is attributable to an
increase in other net revenues of € 5.6 billion, offset by
a decrease in net interest revenue of € 1.3 billion. The net
revenue increase was materially affected by the full-year
contribution of the results of Bankers Trust in 2000.
Another contributing factor was the strong growth in
volumes in our sales and trading businesses, particularly
the expansion of our equity trading business.
Total sales and trading revenues, which affect both
interest and other net revenues, continued the strong
growth of 2000, although not to the same degree, reach-
ing € 9.5 billion in 2001 from € 9.0 billion in 2000. How-
ever, there were two opposing trends. Net revenues from
84

85
sales and trading (equity) fell 19% to € 3.7 billion in 2001
from € 4.5 billion in 2000. Net revenues from sales and
trading (debt and other products) increased over the same
period by 31% to € 5.9 billion from € 4.5 billion.
Total origination revenues, which mainly affect com-
mission income within other net revenues, decreased
from € 1.2 billion in 2000 to € 921 million in 2001. Origi-
nation (equity) net revenues declined largely due to sig-
nificant reductions in transaction volume as the year pro-
gressed, falling from € 937 million in 2000 to € 492 million
in 2001. This was still ahead of the € 443 million in 1999.
Origination (debt) net revenues, on the other hand, in-
creased 50% from € 286 million in 2000 to € 429 million
in 2001, as a result of improved fixed income markets.
Advisory revenues, primarily affecting other net rev-
enues, declined from € 879 million in 2000 to € 568 mil-
lion in 2001, reflecting reduced transaction activity.
Loan products net revenues affect both net interest
revenues and other net revenues. Net revenues from loan
products fell by 16% to € 3.4 billion from € 4.0 billion.
This reduction is attributable to a number of factors;
lower average balances of loans due to increased securiti-
zations, declining interest rates in the major markets
where we do business and the sale of our European finan-
cial services business in May 2001.
Other net revenues include goodwill funding costs
of € 206 million in 2001, € 241 million in 2000 and € 134 mil-
lion in 1999. In total, other net revenues changed from an
expense of € 157 million in 2000 to revenue of € 49 million
in 2001. Other net revenues in 2001 included a gain from
the sale of our financial services business in Europe,
amounting to € 180 million.
Total sales and trading net revenues increased by
50%, or € 3.0 billion, to € 9.0 billion in 2000 from € 6.0 bil-
lion in 1999. This increase, across both equity and debt
and other products, affected both interest and other net
revenues. The strong transaction flow in the first half of
2000, itself largely a result of the robust capital markets,
led to growth in our origination and advisory businesses.
Origination net revenues increased by € 583 million to
€ 1.2 billion in 2000, while advisory revenues also in-
creased by over 50%, or € 294 million, to € 879 million.
The market conditions that led to this growth reversed in
the second half of 2000. Income from several large trans-
actions we effected on behalf of clients also contributed to
this positive result. Loan product revenues, impacting both
interest and other net revenues, increased from € 3.2 bil-
lion to € 4.0 billion. Over the period average loan balances
increased, primarily through the acquisition of Bankers
Trust assets.
Provision for Loan Losses. The provision for loan losses
was € 723 million in 2001 compared to € 153 million in 2000
and € 621 million in 1999.
The increase in 2001 arose primarily from new specific
provision for loan losses in our leveraged lending, high-yield
debt, telecommunications and loan exposure management
across most regions. Another contributing factor was pro-
vision for loan losses with regard to Argentina.
The decrease in 2000 as compared to 1999, was
due to the higher than usual provision in 1999 due to a
significant exposure to a single German borrower in the
real estate industry.
Management Discussion

Noninterest expenses. Noninterest expenses in 2001,
were € 11.5 billion, substantially unchanged from 2000,
with the exception of a € 176 million charge for restructur-
ing taken in 2001 (details of which we discussed above
under “Operating Results – Noninterest Expenses”). Due
to the economic climate, compensation and benefits were
€ 187 million, or 3%, lower than in 2000. Reduced bonus
payments were partly offset by additional severance costs
and increased salaries we incurred as part of our expan-
sion of selected businesses. This reduction was offset by
increased goodwill amortization expense, amounting to
€ 391 million in 2001 and the € 332 million in 2000, follow-
ing our acquisition of National Discount Brokers Group, Inc.
in 2000 and additional expenditure on IT and settlement sys-
tems throughout the business. With the adoption of SFAS
141/142 beginning January 1, 2002, goodwill will be periodi-
cally reviewed for impairment but no longer amortized.
Noninterest expenses were € 11.4 billion in 2000, an
increase of € 2.6 billion as compared to 1999. Our addi-
tional noninterest expenses arose predominantly from
higher compensation and benefits. This, in turn, was pri-
marily attributable the additional employees that we incor-
porated following the Bankers Trust acquisition, together
with higher bonuses in the robust market environment of
the beginning of the year. Also contributing to the increase
in noninterest expenses was an increase in information
technology costs, both directly incurred within each busi-
ness and via service relationships with support areas
housed within the Corporate and Investment Bank Group
Division, together with expenditure on e-commerce activi-
ties throughout the corporate division.
Total Assets. Total assets were essentially flat in the
years presented.
Global Transaction Banking Corporate Division
The following table sets forth the results of our Global
Transaction Banking Corporate Division for the years
ended December 31, 2001, 2000 and 1999, in accordance
with our management reporting systems:
in € m. 2001 2000 1999
Net revenues
Net interest revenues 1,094 1,126 917
Other net revenues 1,927 1,817 1,138
Total net revenues 3,021 2,943 2,055
Provision for loan losses (19) 0 (90)
Noninterest expenses
Goodwill amortization 60 60 30
Restructuring activities 37 (40) 58
Other noninterest expenses 2,407 2,225 1,523
Total noninterest expenses 2,504 2,245 1,611
Income before income taxes 536 698 534
Total assets (in E bn.) 23 28 21
Income before income taxes. Income before income
taxes was € 536 million in 2001, a decrease of 23 %, or
€ 162 million, from 2000. Increases in noninterest expense
were the main cause of this reduction. Income before
income taxes in 2000 was € 164 million, or 31%, higher
than 1999. The increase in net revenues was the primary
driver behind this change.
86

87
Net Revenues. Net revenues increased by almost 3 % in
2001 to € 3.0 billion from € 2.9 billion in 2000, with a small
decrease in net interest revenues more than offset by an
increase in other net revenues. Increases in revenues from
cash management were due in part to the acquisition of
Banque Worms in 2001. Increased revenues from securi-
ties lending resulted from the declining rate environment
in 2001 and a higher level of dividend transactions. These
increases were partially offset by reductions in net rev-
enues from our custody activities due to lower market
valuations and lower transaction volumes.
Increases of € 888 million in net revenues between
1999 and 2000, from € 2.1 billion in 1999 to € 2.9 billion
in 2000, were almost totally due to the acquisition of
Bankers Trust in 1999, and the transaction volumes that
flowed from the expanded customer base in the United
States.
Noninterest expenses. The transactional nature of this
corporate division leads to processing and settlement
costs that are high as a percentage of revenue. As transac-
tion volumes fell in 2001, these costs offset an increased
portion of our net revenues. Cost containment initiatives
helped keep the staff cost element of noninterest expense
essentially constant at € 600 million in both of 2001 and
2000. However, our investment in information technology
and operations caused total noninterest expenses to
increase by 12%, from € 2.2 billion in 2000 to € 2.5 billion
in 2001.
Noninterest expenses increased by € 634 million, or
39%, in 2000 to € 2.2 billion from € 1.6 billion in 1999.
Most of this arose from the acquisition of Bankers Trust
and the expansion of our cash management activities.
Private Clients and Asset Management Group Division
The following table sets forth the results of our Private
Clients and Asset Management Group Division for the
years ended December 31, 2001, 2000 and 1999, in accord-
ance with our management reporting systems:
in € m. 2001 2000 1999
Net revenues
Net interest revenues 3,430 3,384 3,082
Other net revenues 7,563 9,135 7,448
Total net revenues 10,993 12,519 10,530
Provision for loan losses 206 192 105
Noninterest expenses
Policyholder benefits and claims 2,948 3,912 3,790
Goodwill amortization 221 213 170
Restructuring activities 81 (14) 320
Other noninterest expenses 7,140 6,813 5,650
Total noninterest expenses 10,390 10,924 9,930
Income before income taxes 397 1,403 495
Total assets (in E bn.) 126 113 94
Invested assets (in E bn.) 969 1,000 947
In the following paragraphs, we discuss the contribution of
the individual corporate divisions to the overall results of
Private Clients and Asset Management Group Division.
Management Discussion

Personal Banking Corporate Division
The following table sets forth the results of our Personal
Banking Corporate Division for the years ended December
31, 2001, 2000 and 1999, in accordance with our manage-
ment reporting systems:
in € m. 2001 2000 1999
Net revenues
Net interest revenues 3,184 3,044 2,813
Other net revenues 3,774 4,942 4,524
Total net revenues 6,958 7,986 7,337
Provision for loan losses 183 182 110
Noninterest expenses
Policyholder benefits and claims 2,948 3,912 3,790
Goodwill amortization 35 36 41
Restructuring activities 11 (1) 258
Other noninterest expenses 3,625 3,552 3,414
Total noninterest expenses 6,619 7,499 7,503
Income before income taxes 156 305 (276)
Total assets (in E bn.) 92 81 75
Invested assets (in E bn.) 113 110 104
Income before income taxes. Income before income
taxes of our Personal Banking Corporate Division was
€ 156 million for the year ended December 31, 2001, a
decrease of € 149 million, or 49%, as compared to 2000.
Decreased net revenues accounted for most of the reduc-
tion, driven by the weakness on the international capital
markets which led to a decrease in the value of invested
assets and to substantial restraint among our customers
regarding securities transactions. Noninterest expenses
decreased to a lesser degree than revenues.
Income before income taxes was € 305 million in
2000, an increase of € 581 million as compared to 1999.
This increase was due to higher net revenues attributable
to the strong market conditions, especially in the first half
of 2000. Total noninterest expenses were essentially un-
changed.
Our expected sale of the greater part of our insurance
business to Zurich Financial Services by mid-2002, pend-
ing regulatory approval and other actions, will lead to a
significant decrease in revenues but has to be seen in con-
nection with a corresponding decrease in policyholders
benefits. Following the sale, we plan to continue to offer
our private and retail clients the insurance products from
our former subsidiaries.
Net Revenues. Net revenues were € 7.0 billion in 2001, a
decrease of € 1.0 billion, or 13%, as compared to 2000.
The decrease in net revenues is predominantly relat-
ed to our Insurance Business Division, in which our net
revenues declined by € 1.0 billion from € 4.4 billion to
€ 3.4 billion. This decline was primarily due to lower gains
from the sale of securities available for sale, write-downs
of securities available for sale for other than temporary im-
pairment and slightly lower commissions. This € 1.0 billion
decline was substantially offset by reduced policyholder
benefits and claims, reflecting lower allocation for the
benefit of policyholders from the annual surplus of our in-
surance affiliates. The net effect from the Insurance Busi-
ness Division was a decrease of € 88 million, or 17%, in
2001 compared to 2000. Net revenues excluding our insur-
ance business, were negatively affected by decreased
revenues from our advisory business as a result of weak
securities markets.
Our net interest revenues were € 3.2 billion in 2001,
an increase of € 140 million, or 5 %, as compared to 2000
due to increased volumes in customer deposits, consumer
loans and mortgage business.
Our maxblue Business Division, which started online
brokerage services in Germany and Spain in April 2001,
increased its client base by 238,000 clients, or 90 %, but
has not contributed materially to our net revenues to date.
Net revenues increased in 2000 by € 649 million, or
9%, to € 8.0 billion compared to 1999. The placement of
new products as well as our distributions of initial public
offerings and other securities products, particularly in
the positive market environment of the first half of 2000,
led to this increase. In addition, increased net interest
revenues resulted from volume growth in deposits and
loans in our retail business.
88

89
Gross revenues from the Insurance Business Division
were higher in 2000 than in 1999, as lower premiums
were offset by the result from securities available for sale.
The latter was due to our decision to sell positions and
reinvest the proceeds in order to permit policyholders to
participate in the gains from its activities in equity securi-
ties in the strong stock markets. Our net revenues from
the Insurance Business Division increased by € 64 million
in 2000 compared to 1999.
Provision for Loan Losses. In 2001, our provision for
loan losses was € 183 million, an increase of € 1 million as
compared to 2000.
Provision for loan losses was € 182 million in 2000,
an increase of € 72 million, or 65%, as compared to 1999.
The increase in 2000 arose primarily from additional provi-
sion for loan loss at Deutsche Bank 24, reflecting a deteri-
orating credit environment in eastern Germany particularly
on real estate loans. Contributing as well to the additional
provisions was the first time inclusion of BWR (Krakow),
which we acquired in 2000, accompanied by a reassess-
ment of its loan portfolio in connection with that acquisition.
Noninterest expenses. Total noninterest expenses were
€ 6.6 billion in 2001, a decrease of € 880 million, or 12%,
as compared to 2000. This decrease reflected predomi-
nantly a reduction of
€ 964 million, or 25%, in policyholder benefits and claims
in connection with the decrease of net revenues in our
Insurance Business Division.
Net of policyholder benefits and claims, noninter-
est expenses were € 3.7 billion in 2001, an increase of
€ 84 million, or 2%, compared to 2000. The increase is
mainly attributable to expenses for specific projects such
as the introduction of the euro and Personal Banking´s
share of the project costs of the New York Stock Exchange
listing. Also contributing to this increase were € 11 million
expenses for restructuring activities in connection with
the Group Restructuring activities we plan to complete in
2002. Excluding these items, noninterest expenses were
substantially unchanged reflecting cost containment activi-
ties we implemented.
Total noninterest expenses were € 7.5 billion in 2000,
a decrease of € 4.0 million, as compared to 1999. Net of
policyholder benefits and claims, noninterest expenses
were € 3.6 billion in 2000, a decrease of € 126 million.
After adjusting 1999’s noninterest expenses by € 258 mil-
lion for restructuring activities, noninterest expenses in
2000 increased by € 133 million on 1999. This was mainly
attributable to higher expenses for information technology
support.
Invested Assets. Invested assets in 2001 were slightly
higher compared to 2000. Reductions of € 6.0 billion due
to performance effects were more than offset by € 9.0
billion in new business. Deposits increased only slightly.
The increase in invested assets in 2000 compared to 1999
related to increases in both deposits and securities.
Management Discussion

Private Banking Corporate Division
The following table sets forth the results of our Private
Banking Corporate Division for the years ended December
31, 2001, 2000 and 1999, in accordance with our manage-
ment reporting systems:
in € m. 2001 2000 1999
Net revenues
Net interest revenues 281 334 237
Other net revenues 1,842 2,100 1,398
Total net revenues 2,123 2,434 1,635
Provision for loan losses 11 10 (5)
Noninterest expenses
Goodwill amortization 67 66 39
Restructuring activities 35 (12) 23
Other noninterest expenses 2,062 1,962 1,357
Total noninterest expenses 2,164 2,016 1,419
Income before income taxes (52) 408 221
Total assets (in E bn.) 15 14 10
Invested assets (in E bn.) 239 261 254
Income (loss) before income taxes. Income (loss)
before income taxes of our Private Banking Corporate Divi-
sion was a loss of € 52 million for the year ended Decem-
ber 31, 2001. The primary contributors to our loss in 2001
were the brokerage business in the United States, which
suffered declining revenues and increasing expenses, and
a decline in net revenues from our advisory business.
Income before income taxes in 2000 increased by
€ 187 million, or 85%, compared to 1999. The increase
was primarily attributable to higher commission revenues
from the distribution of initial public offerings and other
securities products.
Net Revenues. Net revenues amounted to € 2.1 billion
in 2001, a decline of € 311 million, or 13%, compared to
2000. Net interest revenues accounted for € 53 million of
this decline. The two primary reasons for this decline were
lower spreads we earned on customer deposits as interest
rates declined during the year and reduced volume in the
margin loan portfolio of our U.S. brokerage business as bro-
kerage activity declined. Other net revenues were € 1.8 bil-
lion in 2001, a decrease of € 258 million, or 12%, compared
to 2000. Our advisory revenues were € 368 million, or
26 %, below those of 2000 mainly due to lower brokerage
fees. The weak market environment in 2001 led to substan-
tial restraint among our customers and a decline in secu-
rities-related commissions. Brokerage activity dropped
significantly, especially in the United States, and our ability
to market new products was constrained.
Net revenues in 2000 were € 2.4 billion, an increase
of € 799 million, or 49 %, compared to 1999. This was
mainly due to the full-year effect of revenues contributed
by the Bankers Trust acquisition. In addition, the favorable
securities market conditions in the first half of 2000 led to
significantly higher securities transaction volume and high-
er revenues in the brokerage business. We took advantage
of this positive environment by launching several new pro-
ducts as well as placing initial public offerings. In addition,
increased assets in client portfolios led to higher volume-
based fees.
Noninterest expenses. Total noninterest expenses were
€ 2.2 billion in 2001, an increase of € 148 million, or 7%
compared to 2000.
The largest single item contributing to the increase
was restructuring activities. Additional contributors were
severance payments, software and premises write-offs
and Private Banking’s share of the project costs of our
New York Stock Exchange listing. Some of the restructur-
ing and severance payments related to our U.S. brokerage
business.
The 42 % increase in noninterest expenses in 2000
resulted primarily from the full-year effect of costs related
to the Bankers Trust acquisition.
90

91
Invested Assets. Our invested assets declined by € 22 bil-
lion, or 8%, to € 239 billion at December 31, 2001. De-
creases in invested assets in our U.S. business and declines
due to the overall stock market conditions more than off-
set new asset investments elsewhere.
Asset Management Corporate Division
The following table sets forth the results of our Asset
Management Corporate Division for the years ended
December 31, 2001, 2000 and 1999, in accordance with
our management reporting systems:
in € m. 2001 2000 1999
Net revenues
Net interest revenues (35) 6 32
Other net revenues 1,947 2,093 1,526
Total net revenues 1,912 2,099 1,558
Provision for loan losses 12 0 0
Noninterest expenses
Goodwill amortization 119 111 90
Restructuring activities 35 (1) 39
Other noninterest expenses 1,453 1,299 879
Total noninterest expenses 1,607 1,409 1,008
Income before income taxes 293 690 550
Total assets (in € bn.) 19 18 9
Invested assets (in € bn.) 617 629 589
Income before income taxes. Income before income
taxes of our Asset Management Corporate Division was
€ 293 million in 2001, a decrease of € 397 million, or 58 %,
as compared to 2000. Decreased revenues of € 187 million
due to unfavorable market conditions and increased nonin-
terest expenses of € 198 million accounted for the
decrease in income before income taxes.
In 2000, income before income taxes of the Asset
Management Corporate Division was € 690 million, an
increase of € 140 million, or 25%, as compared to 1999.
This increase, as is the case for each of the increases in
the items discussed below, reflects, in addition to organic
increases, a one-time effect created by the fact that the
results of operations of Bankers Trust are reflected for all
of 2000, but only for seven months of 1999.
Net Revenues. Net revenues were € 1.9 billion in 2001, a
decrease of € 187 million, or 9 %, as compared to 2000.
This decrease arose principally from weaker market condi-
tions in 2001, which led to a decrease of funds performance
fees and funds management fees arising from lower under-
lying funds under management. This was partly offset by
net new business in all our regions in both institutional and
retail funds.
In 2000 net revenues were € 2.1 billion, an increase
of € 541 million, or 35 %, as compared to 1999. This in-
crease arose principally from the full-year effect of Bankers
Trust, primarily in the Americas and Japan, and from or-
ganic growth in performance fees, in both Europe and our
other regions of operation. This growth was due in part to
appreciation in underlying funds under management. This
combined with significant net new business in continental
Europe, the United Kingdom and the Asia-Pacific region in
both institutional and retail funds. These effects were off-
set slightly by losses in our index fund and other passive
business in the United States arising from overlap be-
tween the business of Bankers Trust and pre-acquisition
Deutsche Bank.
Management Discussion
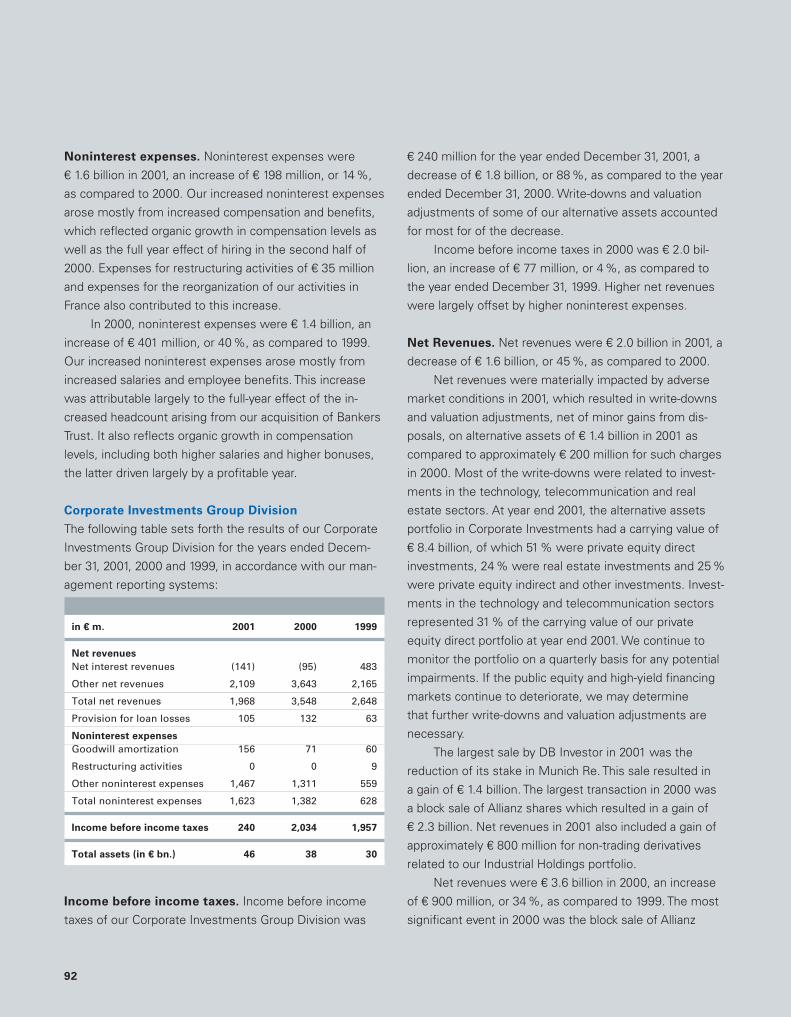
Noninterest expenses. Noninterest expenses were
€ 1.6 billion in 2001, an increase of € 198 million, or 14%,
as compared to 2000. Our increased noninterest expenses
arose mostly from increased compensation and benefits,
which reflected organic growth in compensation levels as
well as the full year effect of hiring in the second half of
2000. Expenses for restructuring activities of € 35 million
and expenses for the reorganization of our activities in
France also contributed to this increase.
In 2000, noninterest expenses were € 1.4 billion, an
increase of € 401 million, or 40%, as compared to 1999.
Our increased noninterest expenses arose mostly from
increased salaries and employee benefits. This increase
was attributable largely to the full-year effect of the in-
creased headcount arising from our acquisition of Bankers
Trust. It also reflects organic growth in compensation
levels, including both higher salaries and higher bonuses,
the latter driven largely by a profitable year.
Corporate Investments Group Division
The following table sets forth the results of our Corporate
Investments Group Division for the years ended Decem-
ber 31, 2001, 2000 and 1999, in accordance with our man-
agement reporting systems:
in € m. 2001 2000 1999
Net revenues
Net interest revenues (141) (95) 483
Other net revenues 2,109 3,643 2,165
Total net revenues 1,968 3,548 2,648
Provision for loan losses 105 132 63
Noninterest expenses
Goodwill amortization 156 71 60
Restructuring activities 0 0 9
Other noninterest expenses 1,467 1,311 559
Total noninterest expenses 1,623 1,382 628
Income before income taxes 240 2,034 1,957
Total assets (in € bn.) 46 38 30
Income before income taxes. Income before income
taxes of our Corporate Investments Group Division was
€ 240 million for the year ended December 31, 2001, a
decrease of € 1.8 billion, or 88 %, as compared to the year
ended December 31, 2000. Write-downs and valuation
adjustments of some of our alternative assets accounted
for most for of the decrease.
Income before income taxes in 2000 was € 2.0 bil-
lion, an increase of € 77 million, or 4 %, as compared to
the year ended December 31, 1999. Higher net revenues
were largely offset by higher noninterest expenses.
Net Revenues. Net revenues were € 2.0 billion in 2001, a
decrease of € 1.6 billion, or 45 %, as compared to 2000.
Net revenues were materially impacted by adverse
market conditions in 2001, which resulted in write-downs
and valuation adjustments, net of minor gains from dis-
posals, on alternative assets of € 1.4 billion in 2001 as
compared to approximately € 200 million for such charges
in 2000. Most of the write-downs were related to invest-
ments in the technology, telecommunication and real
estate sectors. At year end 2001, the alternative assets
portfolio in Corporate Investments had a carrying value of
€ 8.4 billion, of which 51% were private equity direct
investments, 24 % were real estate investments and 25%
were private equity indirect and other investments. Invest-
ments in the technology and telecommunication sectors
represented 31% of the carrying value of our private
equity direct portfolio at year end 2001. We continue to
monitor the portfolio on a quarterly basis for any potential
impairments. If the public equity and high-yield financing
markets continue to deteriorate, we may determine
that further write-downs and valuation adjustments are
necessary.
The largest sale by DB Investor in 2001 was the
reduction of its stake in Munich Re. This sale resulted in
a gain of € 1.4 billion. The largest transaction in 2000 was
a block sale of Allianz shares which resulted in a gain of
€ 2.3 billion. Net revenues in 2001 also included a gain of
approximately € 800 million for non-trading derivatives
related to our Industrial Holdings portfolio.
Net revenues were € 3.6 billion in 2000, an increase
of € 900 million, or 34 %, as compared to 1999. The most
significant event in 2000 was the block sale of Allianz
92

93
shares by DB Investor. The gain was partially offset by
write-downs and valuation adjustments on alternative
assets of approximately € 200 million.
Provision for Loan Losses. Provision for loan losses was
€ 105 million in 2001, a decrease of € 27 million, or 20%,
as compared to 2000. This decrease was primarily related
to lower provision in connection with our industrial hold-
ings portfolio.
Provision for loan losses was € 132 million in 2000,
an increase of € 69 million, or 110%, as compared to 1999
mainly relating to provisions in connection with our indus-
trial holdings portfolio and our North American financial
services business.
Noninterest expenses. Noninterest expenses were
€ 1.6 billion in 2001, an increase of € 241 million, or 17%,
as compared to 2000. This increase was largely attributable
to valuation adjustments of our real estate portfolio (ap-
proximately € 200 million) and increased expenses for
e-commerce activities (approximately € 100 million). In
addition, the North American financial services business
was valued at the lower of carrying value or fair value less
cost to sell.
Noninterest expenses were € 1.4 billion in 2000, an
increase of € 754 million, or 120%, as compared to 1999.
This increase arose predominantly from expenses in stra-
tegic e-commerce activities and other strategic initiatives.
Total Assets. Total assets were € 46 billion as of Decem-
ber 31, 2001. This was an increase of € 8 billion, or 21%,
as compared to 2000 which was primarily attributable to
a change in management reporting accounting rules
towards fair-value accounting for our industrial holdings
portfolio. This adjustment had no effect on the income
before income taxes.
Total assets were € 38 billion as of December 31,
2000. This was an increase of € 8 billion, or 27%, as com-
pared to 1999. The increase is a result of significant growth
in the private equity business of approximately € 2.8 billion
in 2000. Additionally, the real estate and North American
financial services portfolios increased
by € 1.4 billion and € 1.3 billion, respectively.
Management Discussion

Outlook
Despite the overall difficult economic situation, which
deteriorated further after the terrorist acts of September
11 in the United States, signs of an upturn in the United
States are now becoming more visible. We believe this
development will also take hold in Europe and Germany.
For the second half of 2002, we expect growth in the eco-
nomy, which we anticipate should accelerate further in the
upcoming years. The financial markets, we believe, will
positively react to this development, allowing us to increase
our revenues. However, our forecasts for Eastern Europe
and the emerging markets in Asia and South America are
somewhat more cautious. Japan, too, will probably recov-
er only slowly from its recession.
We expect the recovery of the markets in the second
half of 2002 to have positive effects on the revenues of our
three Group Divisions: Corporate and Investment Bank
(CIB), Private Clients and Asset Management (PCAM) and
Corporate Investments (CI).
In CIB, we want to continue to expand our advising
of companies in mergers and acquisitions and further
build up our market position in this area. Through consis-
tent implementation of our ongoing and planned cost con-
tainment measures, we want to further reduce our
expenses.
In PCAM, we intend to sharpen our focus on our core
fields of business. We aim to increasingly withdraw from
business lines that we view as unprofitable or capital-
intensive, and to focus on areas that we believe promise
greater profitability. With our proposed acquisition of the
asset manager Scudder, we want to supplement our favor-
able position in asset gathering in Europe by a solid pres-
ence on the U.S. market.
By actively managing our shareholding portfolios in CI,
our target is to further increase the risk-adjusted return on
these investments. Over the course of 2002, we expect an
improvement of the presently volatile market conditions
affecting and restricting our current sale opportunities for
these shareholdings.
As to the credit risk situation, we do not yet see a
recovery. We must continue to carefully and attentively
manage and assess our credit exposures, and to continu-
ously collect information on this portfolio. Our risk man-
agement function will have to continue to face the
demands of the difficult market environment.
We are continuing our cost containment program.
We are now in the second phase of the program, and we
are confident we can successfully implement our restruc-
turing programs, to the benefit of our Business Divisions.
One of our most important tasks continues to be
furthering the implementation of our comprehensive
realignment of our management structure. A decisive step
in this connection was the implementation of the new
management structure at the beginning of the financial
year 2002. The streamlined Group Board concentrates on
strategic management, resource allocation, risk manage-
ment and control. Additionally, a Group Executive Commit-
tee was formed and divisional and functional committees
were created or enlarged. This, we believe, will in turn help
us achieve cost synergies and above all help us to better
align our Group Divisions to meet the needs of our cus-
tomers.
All this enables us to look forward into the year 2002
with confidence.
94

Introductory Note
95
The accompanying consolidated financial statements were
prepared for the first time in accordance with United
States generally accepted accounting principles
(U.S. GAAP).
In order to comply with Section 292a of the HGB
(German Commercial Code), the consolidated financial
statements were supplemented with a consolidated busi-
ness review report, a list of mandates, a list of sharehold-
ings, and additional explanations. Therefore, the consoli-
dated financial statements, which have to be filed with the
Commercial Register and published in the Federal Gazette,
comply with the Accounting and Banking Directives of the
European Community (Directive 83/349/EWG, Directive
84/253/EWG, Directive 86/635/EWG). For the interpreta-
tion of these directives we relied on the statement by the
German Accounting Standards Committee.
The consolidated financial statements and the con-
solidated business review report as of December 31, 2001
prepared in accordance with Section 292a of the HGB
(German Commercial Code) is filed with the Commercial
Register in Frankfurt under the number HRB 30 000. It will
be as well as the list of mandates and the list of share-
holdings provided to shareholders on request.
Consolidated Financial Statements

Board of Managing Directors in the reporting year
96
B o a r d o f M a n a g i n g D i r e c t o r s i n t h e r e p o r t i n g y e a r
Josef Ackermann Thomas R. Fischer
Carl L. von Boehm-Bezing Jürgen Fitschen
(until 17. 5. 2001) (since 28.3.2001)
Clemens Börsig Tessen von Heydebreck
Rolf-E. Breuer Hermann-Josef Lamberti
(Spokesman) Michael Philipp

Independent Auditors’ Report
97
The Board of Managing Directors of
Deutsche Bank Aktiengesellschaft
We have audited the accompanying
consolidated balance sheets of Deutsche
Bank Aktiengesellschaft and subsidiaries
(the “Company”) as of December 31, 2001
and 2000, and the related consolidated
statements of income, comprehensive
income, changes in shareholders’ equity,
and cash flows for each of the years in the
three-year period ended December 31, 2001.
These consolidated financial statements
are the responsibility of the Company’s
management. Our responsibility is to
express an opinion on these consolidated
financial statements based on our audits.
We conducted our audits in accord-
ance with auditing standards generally
accepted in the United States of America.
Those standards require that we plan
and perform the audit to obtain reasonable
assurance about whether the financial
statements are free of material misstate-
ment. An audit includes examining, on
a test basis, evidence supporting the
amounts and disclosures in the financial
statements. An audit also includes assess-
ing the accounting principles used and sig-
nificant estimates made by management,
as well as evaluating the overall financial
statement presentation. We believe that
our audits provide a reasonable basis for
our opinion.
In our opinion, the consolidated
financial statements referred to above
present fairly, in all material respects,
the financial position of Deutsche Bank
Aktiengesellschaft and subsidiaries as
of December 31, 2001 and 2000, and the
results of their operations and their cash
flows for each of the years in the three-
year period ended December 31, 2001, in
conformity with accounting principles
generally accepted in the United States of
America.
Frankfurt am Main, March 12, 2002
KPMG Deutsche Treuhand-Gesellschaft
Aktiengesellschaft
Wirtschaftsprüfungsgesellschaft
Nonnenmacher Findeisen
Wirtschaftsprüfer Wirtschaftsprüfer
Auditors’ Report

Income Statement Deutsche Bank Group
98
I n c o m e S t a t e m e n t
1.1.–31.12. 1.1.–31.12. 1.1.–31.12.
in € m. [Notes] 2001 2000 1999
Interest revenues [1], [19], [28] 53,639 55,131 40,142
Interest expense [1], [19], [28] 45,019 48,103 32,148
Net interest revenues 8,620 7,028 7,994
Provision for loan losses [1], [7], [8] 1,024 478 725
Net interest revenues after provision for loan losses 7,596 6,550 7,269
Commissions and fees from fiduciary activities 3,537 3,908 2,427
Commissions, broker’s fees, markups on securities underwriting and other securities activities 4,593 5,259 3,233
Fees for other customer services 2,597 2,526 2,307
Insurance premiums [1] 2,717 2,837 3,011
Trading revenues, net [1], [20], [28] 6,031 7,625 2,127
Net gains on securities available for sale [1], [5] 1,516 3,670 2,150
Net income (loss) from equity investments [1], [6] (375) 312 79
Other revenues [1] 385 1,314 1,704
Total noninterest revenues 21,001 27,451 17,038
Compensation and benefits [1], [16], [22], [28] 13,360 13,526 9,655
Net occupancy expense of premises [1], [11] 1,334 1,090 1,022
Furniture and equipment [1], [11] 2,949 3,051 2,362
Agency and other professional service fees 1,080 1,151 819
Communication and data services [11] 642 566 403
Policyholder benefits and claims [1] 3,002 4,003 3,856
Other expenses [1] 3,182 2,849 2,894
Goodwill amortization [1], [3] 951 771 486
Restructuring activities [23] 294 125 459
Total noninterest expenses 26,794 27,132 21,956
Income before income tax expense (benefit) and cumulative effect of accounting changes 1,803 6,869 2,351
Income tax expense [1], [24] 434 2,643 1,689
Income tax expense (benefit) from the change in effective tax rate and the reversing effect 995 (9,287) (951)
Income before cumulative effect of accounting changes, net of tax 374 13,513 1,613
Cumulative effect of accounting changes, net of tax [2] (207) – –
Net income 167 13,513 1,613
E a r n i n g s p e r s h a r e f i g u r e s
1.1.–31.12. 1.1.–31.12. 1.1.–31.12.
in € [16], [25] 2001 2000 1999
Earnings per common share
Basic
Income before cumulative effect of accounting changes, net of tax 0.60 22.00 2.76
Cumulative effect of accounting changes, net of tax (0.33) – –
Net income 0.27 22.00 2.76
Diluted
Income before cumulative effect of accounting changes, net of tax 0.60 21.72 2.74
Cumulative effect of accounting changes, net of tax (0.33) – –
Net income 0.27 21.72 2.74
Cash dividends declared per common share 1.30 1.15 1.12
The accompanying notes are an integral part of the Consolidated Financial Statements.

Statement of Comprehensive Income Deutsche Bank Group
99
Consolidated Financial Statements
S t a t e m e n t o f C o m p r e h e n s i v e I n c o m e
1.1.–31.12. 1.1.–31.12. 1.1.–31.12.
in € m. 2001 2000 1999
Net income 167 13,513 1,613
Unrealized gains (losses) on securities available for sale
Net unrealized gains (losses) arising during the year, net of tax and other(a) (2,496) (1,185) 967
Net reclassification adjustment for realized net gains, net of tax and other(b) (428) (1,516) (865)
Net unrealized derivative gains (losses), net of tax(c) (1) – –
Net unrealized foreign currency translation gains arising during the year, net of tax(d) 85 432 386
Other comprehensive income (loss) (2,840) (2,269) 488
Comprehensive income (loss) (2,673) 11,244 2,101
(a) Amounts are net of an income tax (benefit) expense of € (105) million, € (820) million and € 677 million for the years ended December 31, 2001, 2000 and 1999, respectively, and adjustments to insurance policyholder liabilities and deferred acquisition costs of € (610) million, € 5 million and € 323 million for the years ended December 31, 2001, 2000 and 1999, respectively.
(b) Amounts are net of income tax expense of € 1,139 million (€ 995 million of this amount relates to the reversing effect of a tax benefit realized in 2000 due to a law change enacted in 2000), € 1,702 million and € 1,022 million for the years ended December 31, 2001, 2000 and 1999, respectively, and adjustments to insurance policyholder liabilities and deferred acquisition costs of € (44) million, € 429 million and € 250 million for the years ended December 31, 2001, 2000 and 1999, respectively.
(c) The amount is net of an income tax benefit for the year ended December 31, 2001.(d) Amounts are net of an income tax (benefit) expense of € (41) million, € (35) million and € 70 million for the years ended December 31, 2001, 2000 and 1999, respectively.
The accompanying notes are an integral part of the Consolidated Financial Statements.

Balance Sheet Deutsche Bank Group
A s s e t s
in € m. [Notes] 31.12.2001 31.12.2000
Cash and due from banks [1], [17], [30] 10,388 8,502Interest-earning deposits with banks [10], [30] 37,986 46,733Central bank funds sold [30] 4 240Securities purchased under resale agreements [1], [30] 103,681 55,486Securities borrowed [1], [30] 40,318 73,455Trading assets(a) [1], [4], [10], [30] 293,653 284,871Securities available for sale(b) [1], [5], [10], [30] 71,666 92,250Other investments [6], [30] 11,997 12,759Loans, net [1], [7], [8], [9], [10], [29], [30] 259,838 274,660Premises and equipment, net [1], [10], [11] 9,806 10,384Intangible assets, net [1], [12] 8,947 9,479Other assets related to insurance business [21] 13,875 11,453Due from customers on acceptances 553 1,076Accrued interest receivable 5,907 9,146Other assets 49,603 38,500
Total Assets 918,222 928,994(a) of which € 16 billion and € 48 billion were pledged to creditors and can be sold or repledged at December 31, 2001 and 2000, respectively(b) of which € 524 million and € 222 million were pledged to creditors and can be sold or repledged at December 31, 2001 and 2000, respectively
L i a b i l i t i e s a n d S h a r e h o l d e r s ’ E q u i t y
in € m. [Notes] 31.12.2001 31.12.2000
Noninterest-bearing deposits [30]Domestic offices 22,244 20,540Foreign offices 7,487 8,075
Interest-bearing deposits [30]Domestic offices 96,659 99,161Foreign offices 247,699 222,776
Total deposits 374,089 350,552Trading liabilities [1], [4], [30] 121,329 123,951Securities sold under repurchase agreements [1], [30] 73,299 46,648Securities loaned [1], [30] 7,620 35,916Other short-term borrowings [13], [30] 28,548 60,871Acceptances outstanding 553 1,076Insurance policy claims and reserves [21] 35,241 32,481Accrued interest payable 7,423 10,502Other liabilities [22], [23] 58,943 64,917Long-term debt [14], [30] 166,908 154,484Trust preferred securities [15], [30] 4,076 3,913
Total Liabilities 878,029 885,311
Common shares, no par value, nominal value of € 2.56(a) 1,591 1,578Additional paid-in capital 11,253 10,876Share awards 899 867Retained earnings 22,619 23,331Common shares in treasury, at cost(b) (479) (119)Accumulated other comprehensive income [1]
Net unrealized gains on securities available for sale, net of tax and other 3,419 6,343Net unrealized losses on derivatives hedging variability of cash flows, net of tax (1) –Foreign currency translation, net of tax 892 807
Total Shareholders’ Equity [16], [18] 40,193 43,683
Total Liabilities and Shareholders’ Equity 918,222 928,994
Commitments and contingent liabilities (Notes 11, 28 and 32)(a) Issued: 2001: 621,568,446 shares; 2000: 616,514,046 shares(b) Common shares in treasury, at cost: 2001: 7,092,821 shares; 2000: 1,913,281 shares
The accompanying notes are an integral part of the Consolidated Financial Statements.100

Statement of Changes in Shareholders’Equity Deutsche Bank Group
101
Consolidated Financial Statements
S t a t e m e n t o f C h a n g e s i n S h a r e h o l d e r s ’ E q u i t y
1.1.–31.12. 1.1.–31.12. 1.1.–31.12.
in € m. 2001 2000 1999
Common shares
Balance, beginning of year 1,578 1,573 1,363
Common shares distributed under employee benefit plans 13 5 5
Issuance of common shares 0 0 205
Balance, end of year 1,591 1,578 1,573
Additional paid-in capital
Balance, beginning of year 10,876 10,556 7,265
Common shares distributed under employee benefit plans 462 188 120
Issuance of common shares 0 0 3,053
Net gains (losses) on treasury shares sold (85) 132 118
Balance, end of year 11,253 10,876 10,556
Retained earnings
Balance, beginning of year 23,331 10,581 9,592
Net income 167 13,513 1,613
Cash dividends declared and paid (801) (706) (600)
Other (78) (57) (24)
Balance, end of year 22,619 23,331 10,581
Common shares in treasury, at cost
Balance, beginning of year (119) (61) (52)
Purchases of shares (37,032) (35,731) (22,065)
Sale of shares 36,090 35,366 21,907
Treasury shares distributed under employee benefit plans 582 307 149
Balance, end of year (479) (119) (61)
Share awards – common shares issuable
Balance, beginning of year 1,883 821 270
Deferred share awards granted, net 487 1,356 689
Deferred shares distributed (704) (294) (138)
Balance, end of year 1,666 1,883 821
Share awards – deferred compensation
Balance, beginning of year (1,016) (538) (154)
Deferred share awards granted, net (487) (1,356) (689)
Amortization of deferred compensation, net 736 878 305
Balance, end of year (767) (1,016) (538)
Accumulated other comprehensive income
Balance, beginning of year 7,150 9,419 8,931
Unrealized net gains (losses) on securitiesavailable for sale, net of tax and other (2,924) (2,701) 102
Unrealized net losses on derivatives hedging variability of cash flows, net of tax (1) – –
Foreign currency translation, net of tax 85 432 386
Balance, end of year 4,310 7,150 9,419
Total Shareholders’ Equity, end of year 40,193 43,683 32,351
The accompanying notes are an integral part of the Consolidated Financial Statements.
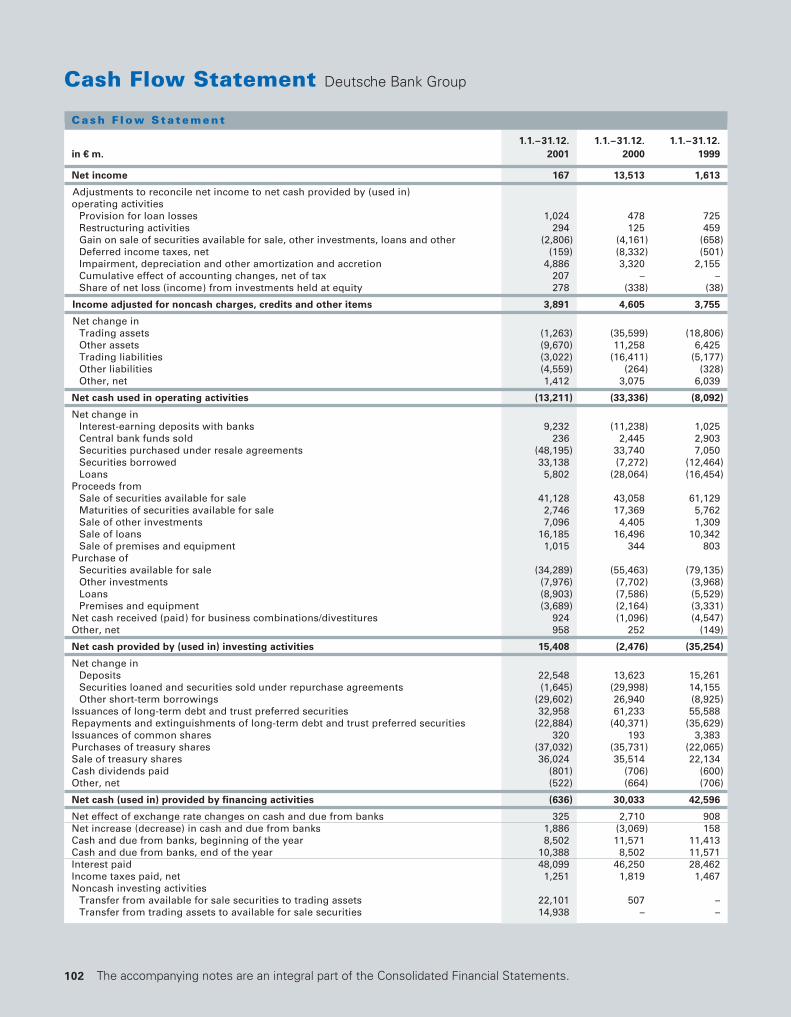
Cash Flow Statement Deutsche Bank Group
102
C a s h F l o w S t a t e m e n t
1.1.–31.12. 1.1.–31.12. 1.1.–31.12.
in X m. 2001 2000 1999
Net income 167 13,513 1,613
Adjustments to reconcile net income to net cash provided by (used in)operating activities
Provision for loan losses 1,024 478 725Restructuring activities 294 125 459Gain on sale of securities available for sale, other investments, loans and other (2,806) (4,161) (658)Deferred income taxes, net (159) (8,332) (501)Impairment, depreciation and other amortization and accretion 4,886 3,320 2,155Cumulative effect of accounting changes, net of tax 207 – –Share of net loss (income) from investments held at equity 278 (338) (38)
Income adjusted for noncash charges, credits and other items 3,891 4,605 3,755
Net change inTrading assets (1,263) (35,599) (18,806)Other assets (9,670) 11,258 6,425Trading liabilities (3,022) (16,411) (5,177)Other liabilities (4,559) (264) (328)Other, net 1,412 3,075 6,039
Net cash used in operating activities (13,211) (33,336) (8,092)
Net change inInterest-earning deposits with banks 9,232 (11,238) 1,025Central bank funds sold 236 2,445 2,903Securities purchased under resale agreements (48,195) 33,740 7,050Securities borrowed 33,138 (7,272) (12,464)Loans 5,802 (28,064) (16,454)
Proceeds fromSale of securities available for sale 41,128 43,058 61,129Maturities of securities available for sale 2,746 17,369 5,762Sale of other investments 7,096 4,405 1,309Sale of loans 16,185 16,496 10,342Sale of premises and equipment 1,015 344 803
Purchase ofSecurities available for sale (34,289) (55,463) (79,135)Other investments (7,976) (7,702) (3,968)Loans (8,903) (7,586) (5,529)Premises and equipment (3,689) (2,164) (3,331)
Net cash received (paid) for business combinations/divestitures 924 (1,096) (4,547)Other, net 958 252 (149)
Net cash provided by (used in) investing activities 15,408 (2,476) (35,254)
Net change inDeposits 22,548 13,623 15,261Securities loaned and securities sold under repurchase agreements (1,645) (29,998) 14,155Other short-term borrowings (29,602) 26,940 (8,925)
Issuances of long-term debt and trust preferred securities 32,958 61,233 55,588Repayments and extinguishments of long-term debt and trust preferred securities (22,884) (40,371) (35,629)Issuances of common shares 320 193 3,383Purchases of treasury shares (37,032) (35,731) (22,065)Sale of treasury shares 36,024 35,514 22,134Cash dividends paid (801) (706) (600)Other, net (522) (664) (706)
Net cash (used in) provided by financing activities (636) 30,033 42,596
Net effect of exchange rate changes on cash and due from banks 325 2,710 908Net increase (decrease) in cash and due from banks 1,886 (3,069) 158Cash and due from banks, beginning of the year 8,502 11,571 11,413Cash and due from banks, end of the year 10,388 8,502 11,571Interest paid 48,099 46,250 28,462Income taxes paid, net 1,251 1,819 1,467Noncash investing activities
Transfer from available for sale securities to trading assets 22,101 507 –Transfer from trading assets to available for sale securities 14,938 – –
The accompanying notes are an integral part of the Consolidated Financial Statements.

Notes to the Consolidated Financial Statements
103
[1] Significant Accounting Policies and
Recent Accounting Developments
Deutsche Bank Aktiengesellschaft (“Deutsche Bank” or
the “Parent”) is a stock corporation organized under the
laws of the Federal Republic of Germany. Deutsche Bank
together with all majority-owned subsidiaries (the “Group”)
is a global provider of a full range of corporate and invest-
ment banking, private clients and asset management
products and services. For a discussion of the Group’s
business segment information, see Note 26.
The accompanying consolidated financial statements
have been prepared in accordance with accounting princi-
ples generally accepted in the United States of America
(“U.S. GAAP”).
The preparation of financial statements in conformity
with U.S. GAAP requires management to make estimates
and assumptions that affect the reported amounts of
assets and liabilities and disclosure of contingent assets
and liabilities at the balance sheet date, and the reported
amounts of revenues and expenses during the reporting
period. Actual results could differ from management’s
estimates.
Certain prior period amounts have been reclassified
to conform to the current presentation.
The consolidated financial statements are stated in
euros.
The following is a description of the significant
accounting policies of the Group.
Principles of Consolidation and Other Investments
The consolidated financial statements include Deutsche
Bank together with all majority-owned subsidiaries. All
material intercompany transactions and accounts have
been eliminated.
Investments in enterprises over which the Group has
the ability to significantly influence operating and financial
policies of the investee are accounted for using the equity
method. Generally, this is where the Group has an invest-
ment between 20% and 50% of the voting stock of a
corporation or 3% or more of a limited partnership. Other
factors that are considered in determining significant influ-
ence include representation on the board of directors
(supervisory board in the case of German stock corpora-
tions) and material intercompany transactions. These
investments are reported in other investments and the pro-
rata share of their income or loss, on a U.S. GAAP basis, as
well as disposition gains and losses, are included in net
income from equity investments. Equity method losses in
excess of the Group’s carrying amount of the investment in
the enterprise are charged against other assets held by the
Group related to the investee. The difference between the
Group’s cost and its proportional underlying equity in net
assets of the investee at the date of investment is amor-
tized on a straight-line basis against net income from equi-
ty investments over a period not exceeding fifteen years.
Special Purposes Entities (“SPEs”) are legal entities
created for a particular purpose and are used in structuring
a wide range of capital markets products. Unless the SPE
meets the criteria for a Qualifying Special Purpose Entity
(“QSPE”) as defined in SFAS No. 140, “Accounting for
Transfers and Servicing of Financial Assets and Extinguish-
ments of Liabilities” (“SFAS 140”) (see Asset Securitiza-
tions below), the Group consolidates SPEs when it is
deemed to control and/or retain the majority of the risks
and rewards of the SPE.
Designated investment companies which are sub-
sidiaries of the Parent are consolidated. The underlying
holdings of such designated investment companies are
included in other investments, as they primarily represent
non-marketable equity securities, and are carried at fair
value. Changes in fair value of the underlying holdings are
included in other revenues.
Direct investments, including venture capital compa-
nies and non-marketable securities, over which the Group
does not have significant influence are included in other
investments and carried at historical cost, net of declines
in fair value below cost that are deemed to be other than
temporary. Gains and losses upon sale or impairment are
included in other revenues.
Consolidated Financial Statements

Foreign Currency Translation
With the introduction of the euro on January 1, 1999, the
Group adopted the euro as its reporting currency.
Revenues and expenses are translated at the weight-
ed-average rate during the year. Assets and liabilities
denominated in currencies other than an entity’s functional
currency are translated into its functional currency using
the period end exchange rates and the resulting transac-
tion gains and losses, as well as any gains and losses from
related hedges, are reported in the Consolidated State-
ment of Income. Assets and liabilities of entities whose
functional currency is not the euro are translated into the
euro using the period end exchange rates and the transla-
tion gains and losses, net of any hedge and tax effects,
are reported in accumulated other comprehensive income
within shareholders’ equity.
Reverse Repurchase and Repurchase Agreements
Securities purchased under resale agreements (“reverse
repurchase agreements”) and securities sold under agree-
ments to repurchase (“repurchase agreements”) are gen-
erally treated as collateralized financings and are carried at
the amount of cash disbursed and received, respectively.
Generally, the party disbursing the cash takes possession
of the securities serving as collateral for the financing.
Securities purchased under resale agreements consist
primarily of OECD country sovereign bonds or sovereign
guaranteed bonds. Securities owned and pledged as col-
lateral under repurchase agreements in which the counter-
party has the right by contract or custom to sell or
repledge the collateral are disclosed on the Consolidated
Balance Sheet in accordance with SFAS 140.
The Group monitors the fair value of the securities
received or delivered. For securities purchased under
resale agreements, the Group requests additional securi-
ties or the return of a portion of the cash disbursed when
appropriate in response to a decline in the market value of
the securities received. Similarly, the return of excess
securities or additional cash is requested when appropri-
ate in response to an increase in the market value of secu-
rities sold under repurchase agreements. The Group off-
sets reverse repurchase and repurchase agreements with
the same counterparty which meet the applicable netting
criteria in FASB Interpretation No. 41, “Offsetting of
Amounts Related to Certain Repurchase and Reverse
Repurchase Agreements” (“FIN 41”). Interest earned on
reverse repurchase agreements and interest incurred on
repurchase agreements are reported as interest revenues
and interest expense, respectively.
Securities Borrowed and Securities Loaned
Securities borrowed and securities loaned are recorded at
the amount of cash advanced and cash received, respec-
tively, and are collateralized primarily by equity and fixed
income securities. Securities borrowed transactions gen-
erally require the Group to deposit cash with the securities
lender. In a securities loaned transaction, the Group gener-
ally receives either cash collateral, in an amount equal to
or in excess of the market value of securities loaned, or
securities. If the securities received may be sold or
repledged, they are accounted for as trading assets. The
Group monitors the fair value of securities borrowed and
securities loaned and additional collateral is obtained, if
necessary. Fees received or paid are reported in interest
revenues and interest expense, respectively. Securities
owned and pledged as collateral under securities lending
agreements in which the counterparty has the right by
contract or custom to sell or repledge the collateral are
disclosed on the Consolidated Balance Sheet in accor-
dance with SFAS 140.
104
105
Trading Securities and Securities Available for Sale
The Group designates debt and marketable equity securi-
ties as either held for trading purposes or available for sale
at the date of acquisition.
Trading assets, as well as short trading positions
which are classified as trading liabilities, are carried at their
fair values and related realized and unrealized gains and
losses are included in trading revenues.
Securities available for sale are carried at fair value
with the changes in fair value, net of applicable deferred
income taxes and, where applicable, adjustments to insur-
ance policyholder liabilities and deferred acquisition costs,
reported in accumulated other comprehensive income
within shareholders’ equity. Declines in fair value of securi-
ties available for sale below their amortized cost that are
deemed to be other than temporary are reflected in the
Consolidated Statement of Income in net gains on securi-
ties available for sale. The amortization of premiums and
accretion of discounts are recorded in interest revenues,
and realized gains and losses are recorded in net gains on
securities available for sale. Generally, the weighted-aver-
age cost method is used to determine the cost of securi-
ties sold.
Fair value is generally based on quoted market prices,
price quotes from brokers or dealers or discounted expect-
ed cash flows.
Derivatives
All freestanding derivatives, whether held for trading or
non-trading purposes, are carried at fair value in the bal-
ance sheet. Derivative features embedded in other con-
tracts that meet certain criteria are also measured at fair
value. Fair values for derivatives are based on quoted mar-
ket prices or pricing models which take into account cur-
rent market and contractual prices of the underlying instru-
ments as well as time value and yield curve or volatility
factors underlying the positions. Fair values also take into
account expected market risks, modeling risks, administra-
tive costs and credit considerations. Assets and liabilities
arising from contracts covered by qualifying master netting
agreements are reported on a net basis, in accordance
with FASB Interpretation No. 39, “Offsetting of Amounts
Related to Certain Contracts” (“FIN 39”).
The Group enters into swaps, futures contracts, for-
ward commitments, options and other similar types of
contracts and commitments based on interest and foreign
exchange rates, and equity and commodity prices, for
trading purposes. Such positions are carried at their fair
values as either trading assets or trading liabilities, and
related gains and losses are included in trading revenues.
Derivative features embedded in other non-trading
contracts are measured separately at fair value when they
are not clearly and closely related to the host contract and
meet the definition of a derivative. Unless designated as a
hedge, changes in the fair value of such an embedded
derivative are reported in trading revenues. The carrying
amount is reported on the Consolidated Balance Sheet
with the host contract.
Certain derivatives entered into for non-trading pur-
poses, not qualifying for hedge accounting, that are other-
wise effective in offsetting the effect of transactions on
noninterest revenues and expenses are recorded in other
assets or other liabilities with changes in fair value record-
ed in the same noninterest revenues and expenses cap-
tions affected by the transaction being offset. The changes
in fair value of all other derivatives not qualifying for hedge
accounting are recorded in trading revenues.
Beginning January 1, 2001, the Group has applied
hedge accounting in accordance with SFAS No. 133,
“Accounting for Derivative Instruments and Hedging Activi-
ties” (“SFAS 133”). There are three possible types of
hedges under this standard, each of which is accounted
for differently: (1) fair value hedges, (2) cash flow hedges,
and (3) hedges of net investments in foreign operations.
For fair value hedges, changes in the fair value of the
hedged asset or liability due to the risk being hedged are
recognized in earnings along with changes in the entire fair
value of the derivative. When hedging interest rate risk,
for both the derivative and the hedged item any interest
accrued or paid is reported in interest income or expense
and the unrealized gains and losses from the fair value
adjustments are reported in other revenues or other
expenses. When hedging the foreign exchange risk in an
Consolidated Financial Statements

available for sale security, the fair value adjustments relat-
ed to the foreign exchange exposures are also recorded in
other revenues or other expenses. Hedge ineffectiveness
for a fair value hedge is measured as the net amount of
the unrealized gain and loss for the period from these fair
value adjustments to the derivative and hedged item
recorded in other revenues or other expenses.
If a fair value hedge is canceled because the deriva-
tive is terminated or de-designated, any remaining fair
value adjustment made to the currency-denominated car-
rying amount of a hedged debt instrument is amortized to
interest over the remaining life of the original hedge. For
other types of fair value hedges or anytime the hedged
asset or liability is sold or terminated, any basis adjust-
ments are included in the calculation of the gain or loss on
sale or termination.
For cash flow hedges, there is no special accounting
for the hedged item and the derivative is carried at fair
value with changes in value reported initially in other com-
prehensive income to the extent the hedge is effective.
These amounts in other comprehensive income are subse-
quently reclassified into earnings in the same periods
during which the forecasted transaction affects earnings.
Thus, for hedges of interest rate risk the amounts are
amortized into interest revenues or expense along with
the interest accruals on the hedged transaction. When
hedging the foreign exchange risk in an available for sale
security, the amounts resulting from foreign exchange
risk are included in the calculation of the gain or loss on
sale once the hedged security is sold. Hedge ineffective-
ness for cash flow hedges is recorded in other revenues
or other expenses and is generally measured as the differ-
ence between the changes in fair value of the actual hedg-
ing derivative and a hypothetically perfect hedge.
When cash flow hedges related to debt instruments
are canceled, amounts remaining in other comprehensive
income are amortized to interest revenues or expense
over the original life of the hedge, except for amounts
offsetting translation effects of securities available for sale.
For cancellations of other types of cash flow hedges,
amounts accumulated in other comprehensive income are
recognized into earnings either in the same income state-
ment caption and period as the forecasted transaction, or
in other revenues or other expenses when it is no longer
probable that the forecasted transaction will occur.
For hedges of net investments in foreign operations,
the portion of the change in fair value of the derivative due
to changes in the spot foreign exchange rate is recorded
as a foreign currency translation adjustment in other com-
prehensive income, the remainder is recorded as other
revenues or other expenses.
Any derivative de-designated as a hedge is
transferred to trading assets and liabilities and marked to
market with changes in fair value recognized in trading
revenues. For any hedging derivative that is terminated,
the difference between the derivative’s carrying amount
and the cash paid or received is recognized as other rev-
enues or other expenses.
Prior to 2001, most of the derivatives entered into for
non-trading purposes, although considered effective as
economic hedges, did not qualify for hedge accounting
mainly due to contemporaneous documentation require-
ments that could not be fulfilled when initially adopting
U.S. GAAP after the fact. Consequently, these derivatives
have been accounted for as trading derivatives, that is,
they are marked to market and the changes in fair value
are reported in trading revenues.
In addition, for periods prior to January 1, 2001, hedge
accounting was different for the limited cases where it
was applied for certain interest rate and foreign currency
hedges. Interest rate swaps were accounted for as off-
balance sheet transactions with interest payable or receiv-
able recorded on an accrual basis. For cross currency inter-
est rate swaps, interest was accrued and the foreign
currency notional amount of the swaps was translated at
spot rates with the resulting gain or loss reported in earn-
ings. No special accounting was applied to the hedged
items.
106

107
Loans
Loans generally are carried at their outstanding unpaid
principal balances net of charge-offs, net of any deferred
fees and costs on originated loans, and net of any unamor-
tized premiums or discounts on loans. Interest revenues
are accrued on the unpaid principal balance. Net deferred
fees and premiums or discounts are recorded as an adjust-
ment of the yield (interest revenues) over the lives of the
related loans.
Loans are placed on a non-accrual status if either the
loan has been in default as to payment of principal or inter-
est for 90 days or more and the loan is neither well
secured nor in the process of collection; or the loan is not
yet 90 days past due, but in the judgement of manage-
ment the accrual of interest should be ceased before 90
days because it is probable that all contractual payments
of interest and principal will not be collected. Prior to 2001,
entities regulated outside the U.S. placed loans on non-
acccrual status when management determined that the
payment of principal or interest was doubtful of collection;
adopting the 90 day practice did not have a material effect
on interest income recognized in 2001. Management’s
judgment is applied based on its credit assessment of the
borrower in determining when a loan should be placed on
non-accrual status. When a loan is placed on a non-accrual
status, any accrued but unpaid interest previously recorded
is reversed against current period interest revenues. Cash
receipts of interest on non-accrual loans are recorded as
either interest revenues or a reduction of principal accord-
ing to management’s judgment as to the collectibility of
principal.
Leasing Transactions
Lease financing transactions, which include direct financ-
ing and leveraged leases, in which a Group entity is the
lessor are classified as loans. Unearned income is amor-
tized to interest revenues over the lease term using the
interest method. Capital leases in which a Group entity is
the lessee are capitalized as assets and reported in
premises and equipment.
Allowances for Credit Losses
The allowances for credit losses represent management’s
estimate of probable losses that have occurred in the loan
portfolio and other lending-related commitments as of the
date of the consolidated financial statements. The
allowance for loan losses is reported as a reduction of
loans and the allowance for credit losses on lending-relat-
ed commitments is reported in other liabilities.
To allow management to determine the appropriate
level of the allowance for loan losses, all significant coun-
terparty relationships are reviewed periodically, as are
loans under special supervision, such as impaired loans.
Smaller-balance standardized homogeneous loans are
collectively evaluated for impairment. This review encom-
passes current information and events related to the coun-
terparty, as well as industry, geographic, economic, politi-
cal, and other environmental factors. This process results
in an allowance for loan losses which consists of a specific
loss component and an inherent loss component.
The specific loss component is the allowance for
impaired loans as calculated under SFAS No. 114,
“Accounting by Creditors for Impairment of a Loan” as
amended by SFAS No. 118 “Accounting by Creditors for
Impairment of a Loan – Income Recognition and Disclo-
sures” (collectively “SFAS 114”). Impaired loans represent
loans for which, based on current information and events,
it is probable that the Group will not be able to collect all
principal and interest amounts due in accordance with the
contractual terms of the loan agreement. The measure-
ment of specific loss is determined by the excess of the
recorded investment in the loan, including accrued inter-
est, over either the present value of expected future cash
flows, the fair value of the underlying collateral or the mar-
Consolidated Financial Statements
ket price of the loan. No specific loss is provided for
impaired loans for which either the present value of
expected future cash flows, the fair value of the underly-
ing collateral or the market price of the loan exceeds the
recorded investment. Impaired loans are generally placed
on a non-accrual status. The inherent loss component is
for all other loans not individually considered impaired but
that, on a portfolio basis, are believed to have some inher-
ent loss, in accordance with SFAS No. 5, “Accounting for
Contingencies” (“SFAS 5”). The inherent loss component
consists of an allowance for country risk, an allowance for
smaller-balance standardized homogeneous exposures
and an other inherent loss component. The country risk
component is for loan exposures in countries where there
are serious doubts about the ability of counterparties to
comply with the repayment terms due to the economic or
political situation prevailing in the respective country of
domicile, that is, for transfer and currency convertibility
risks. The allowance for smaller-balance standardized
homogeneous exposures, which includes automobile
loans, residential and smaller commercial mortgages,
overdrafts, small business working capital loans and loans
to private banking customers and retail customers, is
established by dividing the portfolio into two segments: an
allowance for those loans that are current and performing
is established using the other inherent loss methodology
described below, and an allowance for those that are delin-
quent is established by individual loan evaluation using
techniques based upon the collateral available, past due
status and other characteristics. These allowances are
then aggregated and maintained at a portfolio level. The
other inherent loss component represents an estimate of
inherent losses resulting from the imprecisions and uncer-
tainties in determining credit losses. Loans subject to this
component of the allowance exclude those that have been
determined to be impaired under SFAS 114. This compo-
nent is calculated by applying loss factors, which are
derived for each legal entity, to the corresponding period
end loan categories. Loss factors for each legal entity are
derived as a ratio of historical average loan losses (net of
recoveries) to an historical average of its loan exposures
and adjusted for relevant environmental factors.
Amounts determined to be uncollectible are charged
to the allowance. Subsequent recoveries, if any, are credit-
ed to the allowance. The provision for loan losses, which is
charged to income, is the amount necessary to adjust the
allowance to the level determined through the process
described above.
108

109
Asset Securitizations
When the Group transfers financial assets to securitization
trusts in securitizations of mortgage or other loan port-
folios, it may retain one or more subordinated tranches,
cash reserve accounts, or in some cases, servicing rights
or interest-only strips, all of which are retained interests in
the securitized assets. Gain or loss on transfers accounted
for as sales depends in part on the previous carrying
amounts of the financial assets involved in the transfer,
allocated between the assets sold and the retained inter-
ests based on their relative fair values at the date of trans-
fer. Retained interests other than servicing rights are clas-
sified as trading assets, securities available for sale or
other assets depending on the nature of the retained inter-
est. Servicing rights are classified in intangible assets,
carried at the lower of the allocated basis or current fair
value and amortized in proportion to and over the period of
net servicing revenue. To obtain fair values, quoted market
prices are used if available. However, for securities repre-
senting retained interests from securitizations of financial
assets, quotes are often not available, so the Group gener-
ally estimates fair value based on the present value of
future expected cash flows using management’s best
estimates of the key assumptions (loan losses, prepay-
ment speeds, forward yield curves, and discount rates)
commensurate with the risks involved. Interest revenues
on retained interests are recognized using the effective
yield method. Securitization trusts that meet the criteria
for QSPEs, as defined in SFAS 140, are not consolidated.
Premises and Equipment
Premises and equipment are stated at cost less accumu-
lated depreciation and amortization. Depreciation is gener-
ally computed using the straight-line method over the
estimated useful lives of the assets. The estimated useful
lives of premises is 25 to 50 years and for furniture and
equipment is 3 to 10 years. Leasehold improvements are
depreciated on a straight-line basis over the term of the
lease or the estimated useful life of the improvement,
whichever is shorter, generally 3 to 15 years. Depreciation
and amortization of premises is included in net occupancy
expense of premises, while depreciation of equipment is
included in furniture and equipment expense. Maintenance
and repairs are charged to expense and improvements are
capitalized. Gains and losses on dispositions are reflected
in other noninterest revenues.
Leased properties meeting certain criteria are capital-
ized as assets in premises and equipment and depreciated
over the terms of the leases.
Eligible costs related to software developed or
obtained for internal use are capitalized and depreciated
using the straight-line method over a period of 3 to 5
years. Eligible costs include external direct costs for mate-
rials and services, as well as payroll and payroll related
costs for employees directly associated with an internal-
use software project. Overhead, as well as costs incurred
during planning or after the software is ready for use, are
expensed as incurred.
Goodwill and Other Intangible Assets
Goodwill and other intangible assets, which includes ser-
vicing rights related to asset securitizations, are amortized
over their estimated useful lives. Goodwill represents the
excess of cost over the fair value of net assets acquired at
the date of acquisition and is amortized on a straight-line
basis over a period not exceeding fifteen years. Other
intangible assets are amortized over a period of 3 to 15
years.
Consolidated Financial Statements
Impairment
Securities available for sale, equity method and direct
investments (including venture capital companies and non-
marketable securities) are subject to impairment reviews.
An impairment charge is recorded if a decline in fair value
below the asset’s amortized cost or carrying value,
depending on the nature of the asset, is deemed to be
other than temporary.
Goodwill, other intangible assets, and property, plant,
and equipment are also subject to impairment reviews if a
change in circumstances indicates that the carrying
amount of an asset may not be recoverable. If estimated
undiscounted cash flows relating to an asset held for use
are less than its carrying amount, an impairment charge is
recorded to the extent the fair value of the asset is less
than its carrying amount. For an asset held for disposal, an
impairment charge is recorded based on the lower of the
asset’s carrying value or net realizable value.
Income Taxes
The Group recognizes the current and deferred tax conse-
quences of all transactions that have been recognized in
the consolidated financial statements, using the provisions
of the appropriate jurisdictions’ tax laws. Deferred tax
assets and liabilities are recognized for the estimated
future tax effects of temporary differences, net operating
loss carryforwards and tax credits. The amount of deferred
tax assets is reduced by a valuation reserve, if necessary,
to the amount that based on available evidence will more
likely than not be realized.
Deferred tax liabilities and assets are adjusted for the
effect of changes in tax laws and rates in the period that
includes the enactment date.
Share-Based Compensation
The Group has elected to account for its share awards
under the intrinsic value-based method of accounting pre-
scribed by Accounting Principles Board Opinion No. 25,
“Accounting for Stock Issued to Employees” (“APB 25”) as
permitted by SFAS No. 123, “Accounting for Stock-Based
Compensation” (“SFAS 123”). Under the intrinsic value-
based method, compensation expense is the excess, if
any, of the quoted market price of the shares at grant date
or other measurement date over the amount an employee
must pay, if any, to acquire the shares. Compensation
expense is recorded over the period in which employees
perform services to which the awards relate. Compensa-
tion expense is reversed in the period an award is forfeited.
The Group records its obligations under outstanding
deferred share awards in shareholders’ equity as share
awards – common shares issuable. The related deferred
compensation is also included in shareholders’ equity.
These classifications are based upon the Group’s intent to
settle these awards with its common shares. Compensa-
tion expense for share-based awards payable in cash is
remeasured based on the underlying share price changes
and the related obligations are included in other liabilities
until paid.
The Group discloses pro forma net income and earn-
ings per share under the fair value method prescribed by
SFAS 123.
Comprehensive Income
Comprehensive income is defined as the change in equity
of an entity excluding transactions with shareholders such
as the issuance of common or preferred shares, payment
of dividends and purchase of treasury shares. Comprehen-
sive income has two major components: net income, as
reported in the Consolidated Statement of Income, and
other comprehensive income as reported in the Consoli-
dated Statement of Comprehensive Income. Other com-
prehensive income includes such items as unrealized
gains and losses on foreign currency translation and on
securities available for sale, net of applicable deferred
income taxes and the effective portions of realized and
unrealized gains and losses from derivatives used as cash
flow hedges, less amounts reclassified to earnings in com-
bination with the hedged items. It also includes, where
applicable, adjustments to insurance policyholder liabilities
and deferred acquisition costs. Comprehensive income
does not include changes in the fair value of non-
marketable securities, traditional credit products and other
assets generally carried at cost.
110

111
Cash Flow Statement
For purposes of the Consolidated Cash Flow Statement,
the Group’s cash and cash equivalents are cash and due
from banks.
Insurance Activities
Insurance Premiums and Policyholder Benefits and
Claims. Insurance premiums from long duration life and
health contracts are earned when due. Premiums from
short duration contracts, primarily property and casualty,
are earned over the period of the contract in proportion to
the amount of insurance protection provided. The Group
does not have significant reinsurance activities. Policyhold-
er benefits and claims are associated with premiums by
means of the insurance policy and claim reserves and
other insurance activity related expenses.
Deferred Acquisition Costs. Acquisition costs that vary
with and are primarily related to the acquisition of new and
renewal insurance contracts, principally commissions,
certain underwriting and agency expenses and the costs
of issuing policies are deferred to the extent that they are
recoverable from future earnings. Deferred acquisition
costs for non-life business are amortized over the premi-
um-paying period of the related policies. Deferred acquisi-
tion costs of life business are generally amortized over the
life of the insurance contract or at a constant rate based
upon the present value of estimated gross profits or esti-
mated gross margins expected to be realized.
Insurance liabilities. Benefit reserves for life business,
annuities and health policies have been computed based
upon mortality, morbidity, persistency and the interest rate
assumptions applicable to these coverages, including pro-
visions for adverse deviation. Participating life contracts
include provisions for terminal dividends. These assump-
tions consider Group experience and industry standards
that may be revised if it is determined that future experi-
ence will differ substantially from those previously
assumed.
The provision for premium refunds includes amounts
allocated to policyholder accounts under relevant local
statutory or contractual requirements as well as amounts
that result from differences between these financial state-
ments and statutory financial statements and that will
reverse and enter into future deferred profit sharing calcu-
lations. Unrealized gains and losses in connection with the
valuation of investments are also recognized in the provi-
sion for premium refunds to the extent that the policyhold-
er will participate in such gains and losses on the basis of
statutory or contractual regulations when they are realized.
Included in other insurance provisions and liabilities
are property and casualty loss reserves which include
estimates for both reported and unreported claims incurred
and related claims adjustment expenses. Loss reserves
for property and casualty insurance represent the estimat-
ed ultimate unpaid cost of all incurred claims and are
adjusted regularly based on experience. Unearned premi-
ums for property and casualty insurance included in other
insurance provisions represent the unexpired portion of
policy premiums.
Liabilities under unit-linked business where the
investment risk is borne by the contract holders represent
funds for contracts in which investment income and
investment gains and losses accrue directly to the contract
holders, as well as reserves for mortality risks and expens-
es related to those contracts. The assets related to these
accounts are legally segregated and are not subject to
claims that arise out of any other business of the Group.
The assets are carried at fair value. Deposits received
under unit-linked business have been reduced for amounts
assessed for management services and risk premiums.
Consolidated Financial Statements

Deposits, net investment income and realized investment
gains and losses for these accounts are excluded from
revenues and related liability increases are excluded from
policyholder benefits and claims.
In determining insurance reserves, the Group per-
forms a continuing review of its overall position, its reserv-
ing techniques and its reinsurance. Since the reserves are
based on estimates, the ultimate liability may be more or
less than carried reserves. The effects of changes in such
estimated reserves are included in the Consolidated State-
ment of Income in the period in which the estimates are
changed.
Recent Accounting Developments
SFAS 141 and 142. In July 2001, the Financial Accounting
Standards Board (“FASB”) issued SFAS No. 141, “Business
Combinations” (“SFAS 141”) and SFAS No. 142, “Goodwill
and Other Intangible Assets” (“SFAS 142”). SFAS 141
requires that all business combinations initiated after
June 30, 2001 be accounted for by the purchase method
and eliminates the use of the pooling-of-interests method.
Other provisions of SFAS 141 and SFAS 142 require that,
as of January 1, 2002, goodwill no longer be amortized,
reclassifications between goodwill and other intangible
assets be made based upon certain criteria, and, once
allocated to reporting units (the business segment level, or
one level below), that tests for impairment of goodwill be
performed on an ongoing basis. Upon adoption of the
requirements of SFAS 142 as of January 1, 2002, the
Group discontinued the amortization of goodwill with a net
carrying amount of € 8.7 billion. The annual amortization of
this goodwill was estimated at € 815million for 2002. The
Group continues to evaluate the additional effects, if any,
that the adoption of SFAS 141 and SFAS 142 will have on
the Group’s consolidated financial statements.
SFAS 144 . In October 2001, the FASB issued SFAS
No. 144, “Accounting for the Impairment or Disposal of
Long-Lived Assets” (“SFAS 144”). SFAS 144 supersedes
FASB Statement No. 121, “Accounting for the Impairment
of Long-Lived Assets and for Long-Lived Assets to Be
Disposed Of” (“SFAS 121”), and the accounting and report-
ing provisions of APB Opinion No. 30, “Reporting the
Results of Operations – Reporting the Effects of Disposal
of a Segment of a Business, and Extraordinary, Unusual
and Infrequently Occurring Events and Transactions”
(“APB 30”), for the disposal of a segment of a business.
This Statement also amends ARB No. 51, “Consolidated
Financial Statements” (“ARB 51”), to eliminate the excep-
tion to consolidation for a subsidiary for which control is
likely to be temporary. SFAS 144 is effective for fiscal years
beginning after December 15, 2001. Upon adoption all
long-lived assets to be disposed of and discontinued oper-
ations shall be measured at the lower of carrying amount
or fair value less cost to sell. This Statement also broadens
the existing definition of discontinued operations to
include a component of an entity (rather than a segment
of a business). The adoption of SFAS 144 will not have a
material impact on the Group’s consolidated financial
statements.
112

113
[2] Impact of Changes in Accounting
Principles
SFAS 133
Effective January 1, 2001, the Group adopted SFAS 133.
SFAS 133, as amended, establishes accounting and report-
ing standards for derivative instruments, including certain
derivative instruments embedded in other contracts, and
for hedging activities. It requires companies to recognize
all derivatives on the balance sheet as assets or liabilities
measured at fair value. The change in a derivative’s fair
value is generally recognized in current period earnings or
equity. Upon adoption of SFAS 133, the Group recorded a
net transition expense of € 207 million, net of an income
tax benefit of € 118 million, as a cumulative effect of a
change in accounting principle in the Consolidated State-
ment of Income. This amount was primarily due to the
adjustment required to bring certain embedded derivatives
to fair value and to adjust the carrying amount of the relat-
ed host contracts (items in which the derivatives are
embedded) at January 1, 2001, pursuant to the SFAS 133
transition provisions for embedded derivatives that must
be accounted for separately. As permitted by SFAS 133,
upon adoption the Group transferred debt securities with a
fair value of € 22,101 million from securities available for
sale to trading assets and recognized the related unreal-
ized gains of € 150 million in earnings for the year ended
December 31, 2001.
SFAS 140
Effective April 1, 2001, the Group adopted SFAS 140, a
replacement of FASB Statement No.125. SFAS 140 carries
forward most of the provisions of SFAS 125. It requires
additional disclosures for collateral and securitization trans-
actions, which were effective for fiscal years ending after
December 15, 2000. Effective for the quarter commencing
April 1, 2001, it also includes revised criteria, to be applied
prospectively, for the transfer of assets and QSPEs. The
adoption of SFAS 140 did not have a material impact on
the Group’s consolidated financial statements.
EITF 99-20
Effective April 1, 2001, the Group adopted EITF Issue
No. 99-20, “Recognition of Interest Income and Impair-
ment on Purchased and Retained Beneficial Interests in
Securitized Financial Assets” (“EITF 99-20”). EITF 99-20
provides new guidance regarding income recognition and
determination of impairment on certain asset-backed
securities held as investments, with particular impact on
those investments held outside of trading accounts. The
adoption of EITF 99-20 did not have a material impact on
the Group’s consolidated financial statements.
Consolidated Financial Statements

[3] Acquisitions and Dispositions
On June 4, 1999, the Group acquired all of the outstanding
common shares of Bankers Trust Corporation (“Bankers
Trust”), a registered bank holding company located in the
United States, for a purchase price in cash of approximate-
ly U.S.$ 9.2 billion. Deutsche Bank accounted for this
acquisition as a purchase. A portion of the purchase price
has been allocated to assets acquired and liabilities
assumed based on estimated fair market value at the date
of acquisition while the remaining balance of U.S.$ 6.9 bil-
lion was recorded as goodwill. In the period from the
acquisition to December 31, 2001, the goodwill arising
from this transaction was amortized on a straight-line
basis based upon an estimated useful life of 15 years. The
results of operations of Bankers Trust are included in the
consolidated financial statements of the Group beginning
June 5, 1999.
The Group acquired National Discount Brokers Group,
Inc. (“NDB”) in two steps with control being achieved in
November 2000. The total purchase price was approxi-
mately U.S.$ 1.0 billion. The acquisition was accounted for
as a purchase, which resulted in the recording of goodwill
of U.S.$ 616 million. In the period from the acquisition to
December 31, 2001, goodwill was amortized on a straight-
line basis based upon an estimated useful life of 15 years.
In September 2001, Deutsche Bank sold NDB’s on-line
brokerage business to Ameritrade Holding Corp., which
reduced goodwill related to the NDB acquisition by
U.S.$ 146 million. As a result of this transaction, the Group
owns approximately 13% of Ameritrade Holding Corp.
During 2001, Deutsche Bank decided that its commer-
cial finance operation in North America was no longer a
core business and committed to a plan to dispose of it.
The business was transferred to the Corporate
Investments Group Division and valued at the lower of
carrying value or fair value less cost to sell.
While management’s estimate of fair value is based
on an analysis of the business and valuations M&A activity
in the U.S. commercial finance industry remained weak
when preparing such valuations. Consequently, the price
ultimately realized for the business could differ materially
from the current estimate of fair value.
114
in € m. 31.12.2001 31.12.2000
Bonds and other fixed-income securities 150,698 148,005
Equity shares and other variable-yield securities 77,683 77,859
Positive market values from derivative financial instruments(a) 60,622 56,466
Other trading assets 4,650 2,541
Trading assets 293,653 284,871
Bonds and other fixed-income securities 48,784 40,430
Equity shares and other variable-yield securities 18,346 25,957
Negative market values from derivative financial instruments(a) 54,199 57,564
Trading liabilities 121,329 123,951
(a) Derivatives under master netting agreements are shown net.
[4] Trading Assets and Trading Liabilities
The components of these accounts, which are carried at
fair value, are as follows:

115
[5] Securities Available for Sale The fair value, amortized cost and gross unrealized holding
gains and losses for the Group’s securities available for
sale follow:
Consolidated Financial Statements
31.12.2001
Fair Gross Unrealized Amortized
Value Holding Cost
in € m. Gains Losses
Debt securities
German government 4,339 66 (9) 4,282
U.S. Treasury and U.S. government agencies 192 0 0 192
U.S. local (municipal) governments 50 0 0 50
Other foreign governments 14,676 229 (210) 14,657
Corporates 22,116 643 (193) 21,666
Other asset-backed securities 3,189 12 (2) 3,179
Mortgage-backed securities, principallyobligations of U.S. Federal agencies 1,083 21 (1) 1,063
Other debt securities 1,857 55 (1) 1,803
Equity securities
Equity shares 22,600 10,022 (750) 13,328
Investment certificates and mutual funds 1,507 48 (13) 1,472
Other 57 36 0 21
Total securities available for sale 71,666 11,132 (1,179) 61,713
31.12.2000
Fair Gross Unrealized Amortized
Value Holding Cost
in € m. Gains Losses
Debt securities
German government 634 11 (5) 628
U.S. Treasury and U.S. government agencies 172 0 (1) 173
U.S. local (municipal) governments 17 0 0 17
Other foreign governments 16,902 277 (227) 16,852
Corporates 37,200 1,360 (797) 36,637
Other asset-backed securities 4,252 35 (53) 4,270
Mortgage-backed securities, principallyobligations of U.S. Federal agencies 3,803 21 (51) 3,833
Other debt securities 200 17 0 183
Equity securities
Equity shares 27,136 14,493 (607) 13,250
Investment certificates and mutual funds 1,769 128 (15) 1,656
Other 165 45 (6) 126
Total securities available for sale 92,250 16,387 (1,762) 77,625

At December 31, 2001, securities issued by DaimlerChrys-
ler AG with a fair value of € 5.9 billion were the only securi-
ties of an individual issuer that exceeded 10% of the
Group’s total shareholders’ equity.
The components of gains (losses) on securities available
for sale as reported in the Consolidated Statement of
Income follow:
116
On January 1, 2001, the Group transferred debt securities
with a fair value of € 14.9 billion from trading assets to
securities available for sale. There was no impact on earn-
ings from this transfer which primarily involved securities
issued by German and other foreign governments. Prior to
2001, these securities were risk managed together with
derivatives which were classified as trading mainly due to
contemporaneous hedge documentation requirements
that could not be fulfilled when initially adopting
U.S. GAAP after the fact. Beginning 2001, these securities
are hedged in accordance with the Group’s management
practices with derivatives that qualify for hedge accounting
and were reclassified accordingly.
In 2000, the Group transferred certain portfolios, con-
sisting of mutual funds with an aggregate cost of € 170 mil-
lion, from securities available for sale to trading assets.
31.12.1999
Fair Gross Unrealized Amortized
Value Holding Cost
in € m. Gains Losses
Debt securities
German government 3,453 13 (15) 3,455
U.S. Treasury and U.S. government agencies 721 0 (10) 731
U.S. local (municipal) governments 16 0 0 16
Other foreign governments 20,768 485 (250) 20,533
Corporates 31,499 1,463 (705) 30,741
Other asset-backed securities 1,157 10 (59) 1,206
Mortgage-backed securities, principallyobligations of U.S. Federal agencies 5,968 52 (60) 5,976
Other debt securities 86 3 (5) 88
Equity securities
Equity shares 31,460 19,037 (196) 12,619
Investment certificates and mutual funds 1,500 482 (6) 1,024
Other 193 42 (9) 160
Total securities available for sale 96,821 21,587 (1,315) 76,549
in € m. 2001 2000 1999
Debt securities – gross realized gains 405 268 374
Debt securities – gross realized losses(a) (256) (363) (257)
Equity securities – gross realized gains 2,376 4,288 2,284
Equity securities – gross realized losses(b) (1,009) (523) (251)
Total net gains on securities available for sale 1,516 3,670 2,150
(a) Includes E 27 million of write-downs for other than temporary impairment for the year ended December 31, 2001.(b) Includes E 401 million of write-downs for other than temporary impairment for the year ended December 31, 2001.

117
These available for sale securities were not subject to
active risk management or included in market risk report-
ing. Management concluded that the market risk manage-
ment on these securities would be enhanced by moving
responsibility for them to the risk managers of the Group’s
trading portfolio. The resulting gross gain on the transfer of
€ 337 million was recognized in net gains on securities
available for sale for the year ended December 31, 2000.
The following table shows the fair value, remaining
maturities, approximate weighted-average yields (based on
amortized cost) and total amortized cost by maturity distri-
bution of the debt security components of the Group’s
securities available for sale at December 31, 2001:
Consolidated Financial Statements
[6] Other Investments
The following table summarizes the composition of other
investments:
in € m. 31.12.2001 31.12.2000
Equity method investments 5,344 4,581
Investments held by designatedinvestment companies 274 537
Other equity interests 6,379 7,641
Total 11,997 12,759
Equity Method Investments
Investments for which the Group has significant influence,
generally evidenced by a 20% to 50% ownership of the
voting stock of a corporation or 3% or more of a limited
partnership, are accounted for under the equity method of
accounting. These investments totaled € 5.3 billion and
€ 4.6 billion at December 31, 2001 and 2000, respectively.
The aggregate market value of the investments for which
a quoted market price was available amounted to
€ 592 million at December 31, 2001. These investments
had an aggregated carrying value of € 546 million. The
Group’s pro-rata share of the investees’ income or loss
determined on a U.S. GAAP basis was a loss of € 278 mil-
lion and income of € 338 million for the years ended
December 31, 2001 and 2000, respectively. In addition,
amortization of goodwill of € 31 million and € 26 million for
the years ended December 31, 2001 and 2000, respective-
ly, and write-offs for other than temporary impairments of
€ 113 million for the year ended December 31, 2001 were
included in net income (loss) from equity investments.
Related party loans to equity method investees
amounted to € 1,348 million and € 685 million at Decem-
ber 31, 2001 and 2000, respectively. All loans to three equi-
Up to one More than one More than five More than Total
year year and up to years and up to ten years
five years ten years
in € m. Amount Yield Amount Yield Amount Yield Amount Yield Amount Yield
German government 493 5.50 % 1,025 6.11 % 2,188 5.49 % 633 5.74 % 4,339 5.67 %
U.S. Treasury and U.S. government agencies 144 2.63 % 14 4.50 % 9 7.61 % 25 8.68 % 192 3.78 %
U.S. local (municipal) governments 9 3.52 % 0 – 38 4.06 % 3 5.33 % 50 4.02 %
Other foreign governments 2,760 4.91 % 4,408 5.70 % 3,121 5.37 % 4,387 5.63 % 14,676 5.46 %
Corporates 1,970 5.25 % 8,382 5.32 % 9,780 5.58 % 1,984 6.72 % 22,116 5.56 %
Other asset-backed securities 0 – 1 2.71 % 273 5.52 % 2,915 5.75 % 3,189 5.73 %
Mortgage-backed securities, principally obligations of U.S. federal agencies 0 – 34 7.60 % 129 5.58 % 920 6.91 % 1,083 6.78 %
Other debt securities 1,833 2.58 % 7 4.04 % 17 4.37 % 0 – 1,857 2.61 %
Total fair value 7,209 13,871 15,555 10,867 47,502
Total amortized cost 7,132 13,581 15,246 10,933 46,892
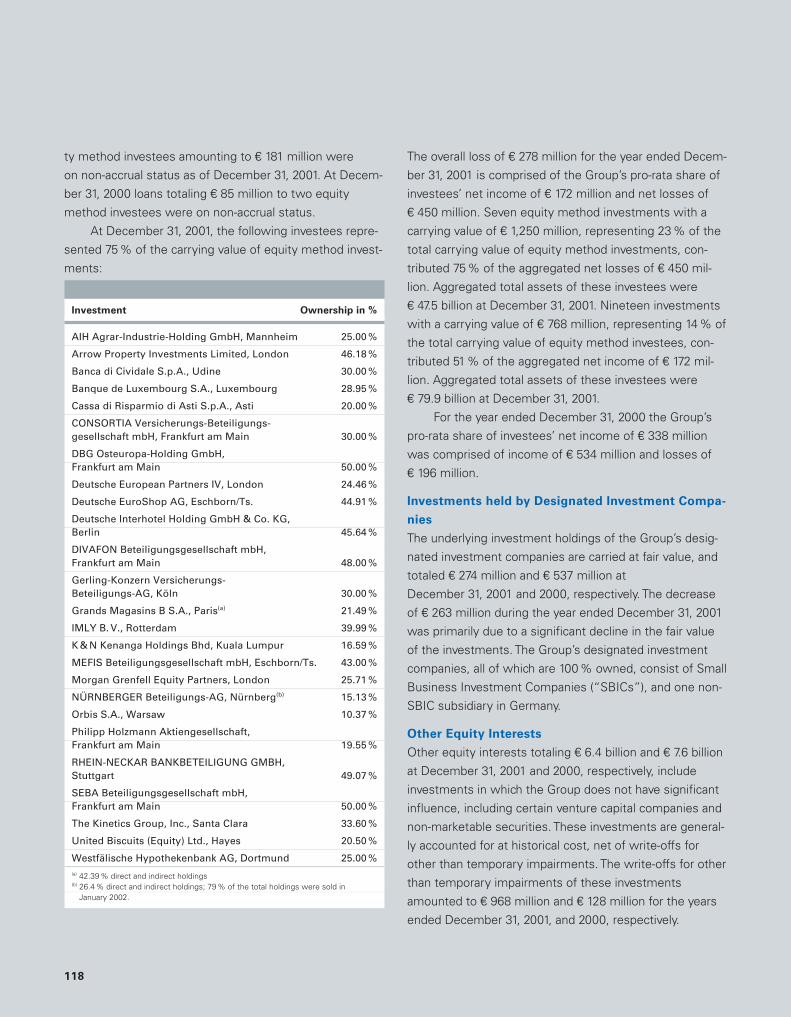
ty method investees amounting to € 181 million were
on non-accrual status as of December 31, 2001. At Decem-
ber 31, 2000 loans totaling € 85 million to two equity
method investees were on non-accrual status.
At December 31, 2001, the following investees repre-
sented 75% of the carrying value of equity method invest-
ments:
Investment Ownership in %
AIH Agrar-Industrie-Holding GmbH, Mannheim 25.00 %
Arrow Property Investments Limited, London 46.18 %
Banca di Cividale S.p.A., Udine 30.00 %
Banque de Luxembourg S.A., Luxembourg 28.95 %
Cassa di Risparmio di Asti S.p.A., Asti 20.00 %
CONSORTIA Versicherungs-Beteiligungs-gesellschaft mbH, Frankfurt am Main 30.00 %
DBG Osteuropa-Holding GmbH,Frankfurt am Main 50.00 %
Deutsche European Partners IV, London 24.46 %
Deutsche EuroShop AG, Eschborn/Ts. 44.91 %
Deutsche Interhotel Holding GmbH & Co. KG,Berlin 45.64 %
DIVAFON Beteiligungsgesellschaft mbH, Frankfurt am Main 48.00 %
Gerling-Konzern Versicherungs-Beteiligungs-AG, Köln 30.00 %
Grands Magasins B S.A., Paris(a) 21.49 %
IMLY B. V., Rotterdam 39.99 %
K & N Kenanga Holdings Bhd, Kuala Lumpur 16.59 %
MEFIS Beteiligungsgesellschaft mbH, Eschborn/Ts. 43.00 %
Morgan Grenfell Equity Partners, London 25.71 %
NÜRNBERGER Beteiligungs-AG, Nürnberg(b) 15.13 %
Orbis S.A., Warsaw 10.37 %
Philipp Holzmann Aktiengesellschaft,Frankfurt am Main 19.55 %
RHEIN-NECKAR BANKBETEILIGUNG GMBH,Stuttgart 49.07 %
SEBA Beteiligungsgesellschaft mbH,Frankfurt am Main 50.00 %
The Kinetics Group, Inc., Santa Clara 33.60 %
United Biscuits (Equity) Ltd., Hayes 20.50 %
Westfälische Hypothekenbank AG, Dortmund 25.00 %(a) 42.39 % direct and indirect holdings(b) 26.4 % direct and indirect holdings; 79 % of the total holdings were sold in
January 2002.
The overall loss of € 278 million for the year ended Decem-
ber 31, 2001 is comprised of the Group’s pro-rata share of
investees’ net income of € 172 million and net losses of
€ 450 million. Seven equity method investments with a
carrying value of € 1,250 million, representing 23 % of the
total carrying value of equity method investments, con-
tributed 75% of the aggregated net losses of € 450 mil-
lion. Aggregated total assets of these investees were
€ 47.5 billion at December 31, 2001. Nineteen investments
with a carrying value of € 768 million, representing 14% of
the total carrying value of equity method investees, con-
tributed 51% of the aggregated net income of € 172 mil-
lion. Aggregated total assets of these investees were
€ 79.9 billion at December 31, 2001.
For the year ended December 31, 2000 the Group’s
pro-rata share of investees’ net income of € 338 million
was comprised of income of € 534 million and losses of
€ 196 million.
Investments held by Designated Investment Compa-
nies
The underlying investment holdings of the Group’s desig-
nated investment companies are carried at fair value, and
totaled € 274 million and € 537 million at
December 31, 2001 and 2000, respectively. The decrease
of € 263 million during the year ended December 31, 2001
was primarily due to a significant decline in the fair value
of the investments. The Group’s designated investment
companies, all of which are 100% owned, consist of Small
Business Investment Companies (“SBICs”), and one non-
SBIC subsidiary in Germany.
Other Equity Interests
Other equity interests totaling € 6.4 billion and € 7.6 billion
at December 31, 2001 and 2000, respectively, include
investments in which the Group does not have significant
influence, including certain venture capital companies and
non-marketable securities. These investments are general-
ly accounted for at historical cost, net of write-offs for
other than temporary impairments. The write-offs for other
than temporary impairments of these investments
amounted to € 968 million and € 128 million for the years
ended December 31, 2001, and 2000, respectively.
118

119
[7] Loans
The following table summarizes the composition of loans:
in € m. 31.12.2001 31.12.2000
German
Banks and insurance 7,444 11,068
Manufacturing 12,612 13,507
Households (excluding mortgages) 13,509 13,920
Households – mortgages 35,283 34,593
Public sector 20,752 22,531
Wholesale and retail trade 6,559 8,865
Commercial real estate activities 28,311 24,695
Lease financing 436 3,107
Other 22,878 27,907
Total German 147,784 160,193
Non-German
Banks and insurance 18,954 25,919
Manufacturing 19,462 21,253
Households (excluding mortgages) 7,873 8,832
Households – mortgages 3,718 1,112
Public sector 2,817 3,144
Wholesale and retail trade 9,139 12,680
Commercial real estate activities 9,946 7,864
Lease financing 3,263 4,500
Other 43,131 37,133
Total Non-German 118,303 122,437
Gross loans 266,087 282,630
Less: Unearned income 664 1,225
Less: Allowance for loan losses 5,585 6,745
Total loans, net 259,838 274,660
The “other” category included no single industry group
with aggregate borrowings from the Group in excess of
10% of the total loan portfolio at December 31, 2001.
Certain related third parties have obtained loans from
the Group on various occasions. All such loans have been
made in the ordinary course of business and on substan-
tially the same terms, including interest rates and collater-
al, as those prevailing at the time for comparable transac-
tions with unrelated persons. There were € 1.6 billion and
€ 1.8 billion of related party loans (excluding loans to equi-
ty method investees) outstanding at December 31, 2001
and December 31, 2000, respectively.
Consolidated Financial Statements

Impaired Loans
This table sets forth information about the Group’s
impaired loans:
120
in € m. 31.12.2001 31.12.2000 31.12.1999
Total impaired loans(a) 10,797 10,296 10,913
Allowance for impaired loans under SFAS 114(b) 3,720 4,577 4,609
Average balance of impaired loans during the year 10,363 7,399 8,647
Interest income recognized on impaired loans during the year 248 376 242(a) Included in these amounts are E 8.2 billion, E 8.5 billion and E 8.3 billion as of December 31, 2001, 2000 and 1999, respectively that require an allowance. The remaining
impaired loans do not require a specific allowance because either the present value of expected future cash flows, the fair value of the underlying collateral or the market price of the loan exceed the recorded investment.
(b) The allowance for impaired loans under SFAS 114 is included in the Group’s allowance for loan losses.
in € m. 2001 2000 1999
Balance, beginning of year 6,745 7,281 6,516
Provision for loan losses 1,024 478 725
Net charge-offs (1,988) (1,221) (789)
Charge-offs (2,055) (1,296) (839)
Recoveries 67 75 50
Allowance related to acquisitions/divestitures (156) 44 594
Foreign currency translation (40) 163 235
Balance, end of year 5,585 6,745 7,281
in € m. 2001 2000 1999
Balance, beginning of year 453 569 642
Releases of provision for credit losses (30) (33) (88)
Net charge-offs (22) (34) (3)
Allowance related to acquisitions/divestitures (2) 5 28
Foreign currency translation 97 (54) (10)
Balance, end of year 496 453 569
[8] Allowances for Credit Losses
The allowances for credit losses consist of an allowance
for loan losses and an allowance for credit losses on lend-
ing-related commitments.
The following table shows the activity in the Group’s
allowance for loan losses:
The following table shows the activity in the Group’s
allowance for credit losses on lending-related commitments:

121
[9] Asset Securitizations
In the normal course of business, the Group accounts for
transfers of financial assets in securitization transactions
as sales when certain criteria are met, otherwise they are
accounted for as secured borrowings. These financial
assets are then sold by the securitization trusts to third
parties as debt instruments. The third party investors and
the securitization trusts have no recourse to the Group’s
other assets for failure of debtors to perform under the
original terms of the underlying financial assets. The Group
may retain interests in the assets created in the securitiza-
tion trusts.
For the years ended December 31, 2001 and 2000,
the Group recognized € 168 million and € 48 million,
respectively, of gains on securitizations primarily related to
residential and commercial mortgage loans.
The following table summarizes certain cash flows
received from and paid to securitization trusts during 2001
and 2000:
Consolidated Financial Statements
At December 31, 2001, the key assumptions used in deter-
mining the fair value of retained interests, including servicing
rights, and the impact of adverse changes in those assump-
tions on the carrying amount/fair value are as follows:
Commercial Marine and Residential and Revolving
Corporate Recreational Commercial Commercial
Loans Vehicle Loans Mortgage Loans Finance Loans
in € m. 2001 2000 2001 2000 2001 2000 2001 2000
Proceeds from new securitizations 0 0 977 0 6,573 6,200 938 4,299
Proceeds from collections reinvested innew trust receivables 0 0 0 0 0 0 18,520 18,201
Servicing fees received 4 6 7 8 15 11 81 74
Cash flows received on retained interests 49 65 13 21 56 21 128 80
Other cash flows received from (paid to)securitization trusts 0 0 16 2 0 0 (16) (102)
Commercial Marine and Residential and Revolving
Corporate Recreational Commercial Commercial
in E m. Loans Vehicle Loans Mortgage Loans(a) Finance Loans
Carrying amount/fair value of retained interests 126 112 179 1,102
Prepayment speed (current assumed) 3.00 % 19.34 % 12.50 % 28.95 %
Impact on fair value of 10 % adverse change 0 (5) (6) (7)
Impact on fair value of 20 % adverse change 0 (9) (12) (13)
Default rate (current assumed) 0.37 % 0.15 % 2.67 % 0.34 %
Impact on fair value of 10 % adverse change (1) (2) (7) (4)
Impact on fair value of 20 % adverse change (2) (4) (14) (8)
Discount factor (current assumed) 11.38 % 9.26 % 14.37 % 10.79 %
Impact on fair value of 10 % adverse change 0 (3) (6) (2)
Impact on fair value of 20 % adverse change 0 (5) (12) (4)(a) Excluded from the retained interest amounts for Residential and Commercial Mortgage Loans are Commercial Mortgage Interest Only Bonds in the amount of € 146 million.
These are short duration assets priced within the base case using conservative prepayment speeds which assume all underlying loans within the securitized pool are paid off at the earliest possible point in time after the expiration of contractual limitations.
(b) Included in the retained interest amounts for Revolving Commercial Finance Loans are seller’s certificates in the amount of E 912 million, which represent a pro-rata share of undivided interests in a pool of loans sold into a Master Trust and outstanding at December 31, 2001 and which do not provide direct credit enhancement to the certificates sold to investors.
(b)
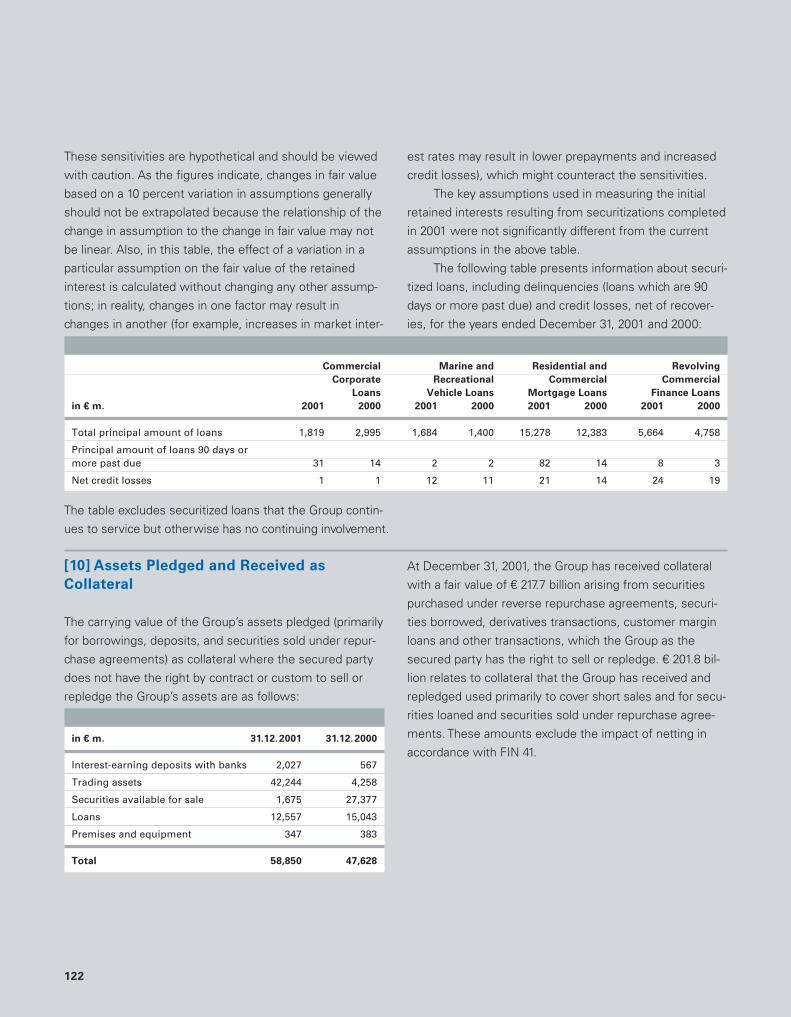
These sensitivities are hypothetical and should be viewed
with caution. As the figures indicate, changes in fair value
based on a 10 percent variation in assumptions generally
should not be extrapolated because the relationship of the
change in assumption to the change in fair value may not
be linear. Also, in this table, the effect of a variation in a
particular assumption on the fair value of the retained
interest is calculated without changing any other assump-
tions; in reality, changes in one factor may result in
changes in another (for example, increases in market inter-
est rates may result in lower prepayments and increased
credit losses), which might counteract the sensitivities.
The key assumptions used in measuring the initial
retained interests resulting from securitizations completed
in 2001 were not significantly different from the current
assumptions in the above table.
The following table presents information about securi-
tized loans, including delinquencies (loans which are 90
days or more past due) and credit losses, net of recover-
ies, for the years ended December 31, 2001 and 2000:
122
The table excludes securitized loans that the Group contin-
ues to service but otherwise has no continuing involvement.
[10] Assets Pledged and Received as
Collateral
The carrying value of the Group’s assets pledged (primarily
for borrowings, deposits, and securities sold under repur-
chase agreements) as collateral where the secured party
does not have the right by contract or custom to sell or
repledge the Group’s assets are as follows:
in € m. 31.12.2001 31.12.2000
Interest-earning deposits with banks 2,027 567
Trading assets 42,244 4,258
Securities available for sale 1,675 27,377
Loans 12,557 15,043
Premises and equipment 347 383
Total 58,850 47,628
At December 31, 2001, the Group has received collateral
with a fair value of € 217.7 billion arising from securities
purchased under reverse repurchase agreements, securi-
ties borrowed, derivatives transactions, customer margin
loans and other transactions, which the Group as the
secured party has the right to sell or repledge. € 201.8 bil-
lion relates to collateral that the Group has received and
repledged used primarily to cover short sales and for secu-
rities loaned and securities sold under repurchase agree-
ments. These amounts exclude the impact of netting in
accordance with FIN 41.
Commercial Marine and Residential and Revolving
Corporate Recreational Commercial Commercial
Loans Vehicle Loans Mortgage Loans Finance Loans
in € m. 2001 2000 2001 2000 2001 2000 2001 2000
Total principal amount of loans 1,819 2,995 1,684 1,400 15,278 12,383 5,664 4,758
Principal amount of loans 90 days or more past due 31 14 2 2 82 14 8 3
Net credit losses 1 1 12 11 21 14 24 19

123
[11] Premises and Equipment, net
An analysis of premises and equipment, including assets
under capital leases, follows:
in € m. 31.12.2001 31.12.2000
Land 1,655 1,218
Buildings 6,293 5,149
Leasehold improvements 1,513 1,306
Furniture and equipment 3,772 6,386
Purchased software 737 704
Self-developed software 998 754
Construction-in-progress 237 378
Total 15,205 15,895
Less: Accumulated depreciation and amortization 5,399 5,511
Premises and equipment, net(a) 9,806 10,384
(a) Amounts at December 31, 2001 and 2000 include € 2.5 billion and € 3.0 billion, respectively, of net book value of premises and equipment held for investment purposes.
The Group is lessee under lease agreements covering real
property and equipment. The future minimum lease pay-
ments, excluding executory costs required under the
Group’s capital leases at December 31, 2001, were as fol-
lows:
in € m. 31.12.2001
2002 164
2003 163
2004 160
2005 153
2006 152
2007 and later 1,646
Total future minimum lease payments 2,438
Less: Amount representing interest 1,446
Present value of minimum lease payments 992
At December 31, 2001, the total minimum sublease rentals
to be received in the future under subleases are € 1.1 bil-
lion. Contingent rental expense incurred during the year
ended December 31, 2001, was € 3 million.
The future minimum lease payments, excluding
executory costs required under the Group’s operating
leases at December 31, 2001, were as follows:
in € m. 31.12.2001
2002 596
2003 489
2004 429
2005 349
2006 284
2007 and later 1,571
Total future minimum lease payments 3,718
Less: Minimum sublease rentals 242
Net minimum lease payments 3,476
The following shows the net rental expense for all operat-
ing leases:
in € m. 2001 2000 1999
Gross rental expense 970 905 872
Less: Sublease rental income 79 121 145
Net rental expense 891 784 727
Consolidated Financial Statements

[12] Intangible Assets, net
An analysis of goodwill and other intangible assets follows:
in E m. 31.12.2001 31.12.2000
Goodwill 12,241 11,912
Accumulated amortization (3,500) (2,535)
Goodwill, net 8,741 9,377
Other intangible assets 238 129
Accumulated amortization (32) (27)
Other intangible assets, net 206 102
Total intangible assets, net 8,947 9,479
For the year ended December 31, 2001, goodwill increased
by € 329 million. This was due to an increase of € 466 mil-
lion resulting from the impact of the foreign currency
translation of the goodwill, which is primarily denominated
in U.S. dollars, offset by a net decrease of € 137 million
from acquisitions and dispositions of subsidiaries.
Effective January 1, 2002, as required by SFAS 142,
goodwill will no longer be amortized but will be subject to
annual tests for impairment.
124
[13] Other Short-term Borrowings
Short-term borrowings are borrowed funds generally with
an original maturity of one year or less. Central bank funds
purchased and commercial paper generally mature within
90 days. Components of other short-term borrowings
include:
in E m. 31.12.2001 31.12.2000
Central bank funds purchased 8,076 25,863
Commercial paper 14,251 17,107
Other 6,221 17,901
Total 28,548 60,871

125
[14] Long-term Debt
Deutsche Bank issues fixed and floating rate long-term
debt denominated in various currencies, although predom-
inately in euros.
Fixed rate debt outstanding at December 31, 2001
matures at various dates through 2050 and carries contrac-
tual interest rates ranging from 0.01% to 18.00%. The
consolidated weighted-average interest rates on fixed rate
debt at December 31, 2001 and 2000 were 5.12% and
5.44 %, respectively. Floating rate debt outstanding, with
contractually determined interest rates ranging from
0.08 % to 11.64 % at December 31, 2001, matures at various
dates through 2050. The consolidated weighted-average
contractual interest rates on floating rate debt at Decem-
ber 31, 2001 and 2000 were 3.84 % and 5.43 %, respec-
tively.
The following table is a summary of the Group’s long-
term debt:
Consolidated Financial Statements
By remaining maturities Due in Due in Due in Due in Due in Due after Total Total
in E m. 2002 2003 2004 2005 2006 2006 31.12.2001 31.12.2000
Senior debt
Mortgage bonds(a)
Fixed rate 5,926 5,008 9,043 5,000 6,500 17,024 48,501 45,910
Floating rate 2,916 1,300 602 952 502 1,943 8,215 7,644
Other bonds and notes
Fixed rate 6,169 10,514 7,053 8,054 2,206 25,777 59,773 45,889
Floating rate 1,887 5,866 6,520 6,116 3,993 14,785 39,167 43,545
Subordinated debt
Bonds and notes(b)
Fixed rate 2,038 2,147 98 300 1,509 2,793 8,885 9,318
Floating rate 91 233 311 102 0 1,630 2,367 2,178
Total 19,027 25,068 23,627 20,524 14,710 63,952 166,908 154,484
(a) Includes bonds known as “Pfandbriefe”, which are issued by German mortgage banks.(b) Includes DM 1.2 billion and DM 1.4 billion in nominal amounts of bearer participatory certificates which mature on December 31, 2002 and 2003, respectively. These certificates
carry an annual dividend rate of 9 % and 8.75 %, respectively, and will be redeemed, subject to the stipulations on loss participation, on June 30, 2003 and June 30, 2004, respectively. These dividends have priority over the rights of shareholders to share in the Group profits. During 2001, DM 75 million was extinguished from the second tranche.

Based solely on the contractual terms of the debt issues,
the following table represents the range of interest rates
payable on this debt for the periods specified:
The weighted-average effective interest rates for total
long-term debt were 4.73% and 5.45% at December 31,
2001 and December 31, 2000, respectively.
The interest rates for the floating rate debt issues are
generally based on LIBOR, although in certain instances
they are subject to minimum interest rates as specified in
the agreements governing the respective issues.
The Group enters into various transactions related to
the debt it issues. This debt may be traded or held for a
period of time. Purchases of the debt are accounted for as
extinguishments; however, the resulting net gains during
2001 and 2000 were insignificant.
126
31.12.2001(a) 31.12.2000(a)
Senior debt
Mortgage bonds
Fixed rate 0.01 % –18.45 % 0.01 % –18.45 %
Floating rate(b) 3.03 % –15.89 % 3.41 % –19.65 %
Other bonds and notes
Fixed rate 0.02 % – 16.00 % 0.98 % – 14.25 %
Floating rate 0.08 % – 11.64 % 0.94 % – 14.38 %
Subordinated debt
Bonds and notes
Fixed rate 0.88 % – 18.00 % 3.05 % –19.40 %
Floating rate 0.70 % –18.00 % 3.72 % – 10.50 %(a) The Group issues senior and subordinated long-term debt denominated in various currencies. Interest rates on Japanese Yen denominated debt represent the lower end of the
range while interest rates on South African Rand denominated debt represent the higher end of the range.(b) Excludes approximately € 1.4 billion and € 285 million in 2001 and 2000, respectively, which relates to unusually-priced structured transactions with floating interest rates
ranging from 1.79 % to 11.23 %.
[15] Trust Preferred Securities
The Group has formed fourteen statutory business trusts,
of which the Group owns all of the common securities and
which it consolidates into the Group’s financial
statements. These trusts have no independent assets or
operations, and exist for the sole purpose of issuing cumu-
lative and noncumulative trust preferred securities and
investing the proceeds thereof in an equivalent amount of
junior subordinated debentures or noncumulative preferred
securities, respectively, within the Group.
The Group’s trust preferred securities at December 31,
2001 and 2000 totaled € 4.1 billion and € 3.9 billion,
respectively, comprised of € 1.5 billion and € 1.4 billion
cumulative trust preferred securities (net of deferred
issuance costs and unamortized discount), respectively,
and € 2.6 billion and € 2.5 billion noncumulative trust pre-
ferred securities, respectively.
Cumulative Trust Preferred Securities
The junior subordinated debentures, which are the sole
assets of the trusts, are unsecured obligations of the
Group, and are subordinate and junior in right of payment
to all present and future senior and subordinated indebted-
ness and certain other financial obligations of the Group.
The principal amount of subordinated debentures held by
each trust equals the aggregate liquidation amount of its
trust securities and its common securities. The subordinat-

127
ed debentures bear interest at the same rate, and will
mature on the same date, as the corresponding trust
securities. The debentures are redeemable prior to the
stated maturity at the option of the Group during the
redemption periods described below.
The cumulative trust preferred securities are eligible
for inclusion in the Group’s supplementary capital.
A summary of the cumulative trust preferred securi-
ties issued and outstanding follows:
Consolidated Financial Statements
Aggregate Aggregate Per Annum Interest Stated Earlier Redemption
Liquidation Liquidation Interest Rate Payment Maturity of Maturity Period of
Amount of Amount of of Debentures Dates Debentures Date(a) Debentures
Trust Trust and Trust and Trust on or after
Preferred Preferred Preferred Preferred
Securities at Securities at Securities Securities
31.12.2001 31.12.2000
BT InstitutionalCapital Trust A E 312 m. E 296 m. 8.09 % 1.6., 1.12. 1.12.2026 – 1.12.2006
BT InstitutionalCapital Trust B E 180 m. E 171 m. 7.75 % 1.6., 1.12. 1.12.2026 – 1.12.2006
BT Capital Trust B E 233 m. E 220 m. 7.90 % 15.1., 15.7. 15.1.2027 15.1.2017 15.1.2007
BT Preferred 31.3., 30.6.Capital Trust I(b) E 283 m. E 269 m. 8.13 % 30.9., 31.12. 1.2.2037 1.2.2002 1.2.2002
BT PreferredCapital Trust II E 230 m. E 218 m. 7.88 % 25.2., 25.8. 25.2.2027 25.2.2012 25.2.2007
BTC Capital 3 month LIBOR 30.3., 30.6.Trust I(c) E 236 m. E 238 m. plus 0.75 % 30.9., 30.12. 30.12.2026 – 30.12.2006
Total(d) E 1,474 m. E 1,412 m.
(a) The maturity dates may be shortened under certain circumstances.(b) Outstanding shares were redeemed at par on February 28, 2002.(c) During 2001, the Group repurchased approximately € 15 million BTC Capital Trust I securities.(d) Excludes deferred issuance costs and unamortized discount of € 13 million and € 6 million at December 31, 2001 and 2000, respectively.
Noncumulative Trust Preferred Securities
The noncumulative preferred securities, which are the sole
assets of the trusts, evidence preferred ownership inter-
est in limited liability companies which are wholly-owned
subsidiaries of the Group. The limited liability companies
invest the proceeds from the noncumulative preferred
securities in subordinated notes issued by the Group.
Interest on the subordinated notes will be paid to the limit-
ed liability companies on the dates described in the table
below. Amounts available to the trusts for distribution to
the holders of the noncumulative trust preferred securities
will be limited to distributions received by the trusts from
the limited liability companies with respect to the noncu-
mulative preferred securities. The terms of the noncumula-
tive trust preferred securities are substantially identical to
the terms of the noncumulative preferred securities and
do not have any scheduled maturity date. Capital pay-
ments on the trust preferred securities are discretionary
and noncumulative and are expected to be paid out of
capital payments received by the trusts. Upon redemption
of the noncumulative preferred securities, the trust must
redeem a corresponding number of the trust preferred
securities. The noncumulative preferred securities are
redeemable at the option of the Group after expiry of indi-
vidual periods between 5 and 30 years.
The noncumulative trust preferred securities are eligi-
ble for inclusion in the Group’s core capital.

A summary of the noncumulative trust preferred
securities issued and outstandings follows:
128
Aggregate Liquidation Aggregate Liquidation Per Annum Interest Interest Payment
Amount of Trust Amount of Trust Rate of Notes Dates
Preferred Securities Preferred Securities
at 31.12.2001 at 31.12.2000
Deutsche Bank CapitalFunding Trust I(a) E 760 m. E 699 m. 7.87 % 30.6., 30.12.
Deutsche Bank CapitalFunding Trust II E 249 m. E 236 m. 7.75 % 30.3., 30.6., 30.9., 30.12.
Deutsche Bank CapitalFunding Trust III E 500 m. E 500 m. 6.60 % 30.3., 30.6., 30.9., 30.12.
Deutsche Bank CapitalTrust I E 361 m. E 342 m. 3 month LIBOR + 1.70 % 30.3., 30.6., 30.9., 30.12.
Deutsche Bank CapitalTrust II E 172 m. E 187 m. 5.20 % 30.6., 30.12.
Deutsche Bank CapitalTrust III E 134 m. E 127 m. 3 month LIBOR + 1.90 % 30.3., 30.6., 30.9., 30.12.
Deutsche Bank CapitalTrust IV E 184 m. E 174 m. 3 month LIBOR + 1.80 % 30.3., 30.6., 30.9., 30.12.
Deutsche Bank CapitalTrust V E 255 m. E 242 m. 3 month LIBOR + 1.80 % 30.3., 30.6., 30.9., 30.12.
Total E 2,615 m. E 2,507 m.
(a) Includes basis adjustments on qualified hedges of E 22.1million.
The junior subordinated debentures, noncumulative pre-
ferred securities, subordinated notes and related income
effects are eliminated in the consolidated financial state-
ments.
[16] Common Shares and Share-Based
Compensation Plans
Deutsche Bank’s share capital consists of common shares
issued in registered form without par value. Under German
law, no par value shares are deemed to have a “nominal”
value equal to the total amount of share capital divided by
the number of shares.

129
Our shares have a nominal value of E 2.56. Common share
activity was as follows:
Shares purchased for treasury consist of shares held for
a period of time by the Group as well as any shares pur-
chased with the intention of being resold in the short
term. All such transactions were recorded in shareholders’
equity and no revenue was recorded in connection with
these activities.
Authorized and Conditional Capital
Deutsche Bank’s share capital may be increased by issuing
new shares for cash and in some circumstances for non-
cash consideration. At December 31, 2001, Deutsche Bank
had authorized but unissued capital of € 689,468,911
which may be issued at various dates through April 30,
2006 as follows:
Authorized Authorized Capital Expiration Date
Capital excluding Shareholders’
Pre-Emptive Rights
€ 103,645,941 – 30. 4. 2002
€ 127,822,970(a) – 30. 4. 2003
€ 300,000,000 – 30. 4. 2004
– € 30,000,000 31. 5. 2005
€ 128,000,000(a) – 30. 4. 2006(a) Capital increase may be effected for non-cash contributions with the intent of
acquiring a company or holdings in companies.
Deutsche Bank also has conditional capital of € 358,798,848.
Conditional capital includes various instruments which
may potentially be converted into common shares. At
December 31, 2001, € 153,600,000 and € 80,000,000 of
conditional capital is available for participatory certificates
with warrants and/or convertible participatory certificates,
bonds with warrants, and convertible bonds which may be
issued in one or more issuances on or before
April 30, 2002 and April 30, 2004, respectively.
In addition, Deutsche Bank has conditional capital
totaling € 125,198,848 of which € 51,200,000 is related to
option rights issued until May 10, 2003 under the DB Glob-
al Partnership Plan and € 40,000,000 is related to the
option rights issued under the DB Global Share Plan and
the db Share Plan. € 33,998,848 are available for the Glob-
al Equity Plan. These plans are described below.
The German Securities Trading Act (Wertpapierhan-
delsgesetz) requires investors in publicly traded corpora-
tions whose investments reach certain thresholds to notify
both the corporation and the German Securities Trading
Supervisory Authority. On April 23, 1999, Allianz AG
informed the Group that it held 4.93 % (corresponding to
approximately 30.4 million shares) of the Group’s share
capital on such date. However, its annual report for 1999
indicated that as of December 31, 1999, Allianz AG held
5.6% (corresponding to approximately 34.5 million) of the
Group’s shares. The Group assumes that this 5.6% includ-
ed trading positions. Allianz’s consolidated financial state-
ments included in its annual report for 2000 indicated that
as of December 31, 2000, the Allianz group held 4.6%
(corresponding to approximately 28.3 million) of the
Group’s shares.
Consolidated Financial Statements
Number of shares 2001 2000 1999
Common shares outstanding, beginning of year 614,600,765 613,058,750 531,818,711
Shares issued under employee benefit plans 5,054,400 2,171,526 1,900,074
Common shares issued – – 79,457,232
Shares purchased for treasury (447,045,982) (436,326,857) (394,034,631)
Shares sold or distributed from treasury 441,866,442 435,697,346 393,917,364
Common shares outstanding, end of year 614,475,625 614,600,765 613,058,750

DB Global Partnership
Under the DB Global Partnership Plan (“DB Global Partner-
ship”), the Group may grant various employees deferred
share awards, performance options, and share apprecia-
tion rights.
DB Equity Units (“DB Equity Units”) are deferred
share awards, each of which entitles the holder to one of
the Group’s shares four years from the date of the grant,
subject to certain exceptions. DB Equity Units are forfeited
if a participant terminates employment under certain cir-
cumstances within the first two years following the grant.
Approximately 339,000 DB Equity Units were granted in
February 2002 related to the 2001 performance year.
Compensation expense for the DB Equity Units is
recognized in the performance year as they relate to annu-
al bonuses earned as part of compensation. During the
year ended December 31, 2001, the Group recognized
compensation expense of € 19 million. Compensation
expense recorded in 2001 is based on the fair value of the
award at the date of grant.
We grant an exceptional award to a selected group of
employees as a retention incentive which is forfeited if the
participant terminates employment for any reason prior to
the end of a four year vesting period. Compensation
expense for the exceptional award is recognized over the
vesting period. Approximately 85,000 DB Equity Units
were granted in February 2002, with an effective grant
date of December 31, 2001.
Performance options (“Performance Options”) are
rights to purchase the Group’s shares. The reference price
is set at the higher of the fair market value of the Group’s
shares on the date of grant or an average of the fair mar-
ket value of the Group’s shares for the ten trading days on
the Frankfurt Stock Exchange up to and including the date
of the grant. Performance Options are granted with an
exercise price equal to 120% of the reference price.
Performance Options are subject to a minimum vest-
ing period of two years. In general, one-third of the options
will become exercisable at each of the second, third and
fourth anniversaries of the grant date. However if the
Group’s shares trade at more than 130 % of the reference
price for 35 consecutive trading days, the Performance
Options will become exercisable on the later of the end of
the 35-day trading period or the end of the two-year vest-
ing period. In general, if a participant terminates employ-
ment prior to the end of the two-year vesting period, the
participant will forfeit the Performance Options. All options
not previously exercised or forfeited expire on the sixth
anniversary of the grant date.
Performance Options to acquire approximately 12 mil-
lion of the Group’s shares, with a strike price of € 89.96,
were granted in February 2002 related to the 2001 perfor-
mance year. No compensation expense was recognized
130
in E m. 2001 2000 1999
DB Global Partnership 19 0 0
Global Equity Plan 302 236 110
DB Global Share Plan 4 0 0
db Share Plan 53 126 60
DB Share Scheme 726 890 521
Share Appreciation Rights Plans 93 54 44
Total 1,197 1,306 735
Share-Based Compensation
The Group recognized compensation expense related to
its significant share-based compensation plans, described
below, as follows:

131
for the year ended December 31, 2001 because the exer-
cise price of the Performance Options exceeds the market
price of the underlying shares on the date of grant.
Partnership Appreciation Rights (“PARs”) are rights to
receive a fixed cash bonus in an amount equal to 20% of
the reference price described above. The vesting of PARs
will occur at the same time and to the same extent as the
vesting of Performance Options. PARs are automatically
exercised at the same time and in the same proportion as
the exercise of the Performance Options.
Approximately 12 million PARs were granted in Febru-
ary 2002 related to the 2001 performance year. No com-
pensation expense was recognized for the year ended
December 31, 2001 as the PARs represent a cash bonus
which are only exercisable in conjunction with the exercise
of Performance Options. This effectively reduces the exer-
cise price of any Performance Option exercised to the fair
market value of the Group’s share market price on grant
date.
Global Equity Plan
During 1998, 1999, and 2000, certain key employees of
the Group participated in the Global Equity Plan (“GEP”)
and were eligible to purchase convertible bonds in
1,000 DM denominations at par. These bonds are convert-
ible into 200 shares of Deutsche Bank AG common shares
(“common shares”) on the conversion date if specific
performance criteria for the three-year period prior to the
conversion date had been met. The conversion price was
based on the average quoted price of a common share on
the Frankfurt Stock Exchange (XETRA) on the five trading
days before the conversion period started. A discount was
applied to the exercise price at an amount that depended
on the Group’s performance criteria. The maximum dis-
count the participant was eligible to receive was 66.67 %.
On October 16, 2001, the Board of Managing Direc-
tors gave approval to buy out the remaining participants in
the Global Equity Plan at a fixed discount per underlying
share. For purposes of the buy-out, the Group set the
reference price at € 73.72 which was the average Frankfurt
Stock Exchange (XETRA) price from November 19, 2001 to
November 30, 2001 inclusive of those dates. Employees
could accept the offer in a period from November 19, 2001
through December 7, 2001 (acceptance period).
As of December 31, 2001, 2,775 participants holding
DM 55,429,000 (€ 28,340,398) bonds convertible into
11,085,800 shares accepted the offer and received cash
payments totaling € 490,347,106. Participants holding
DM 3,034,000 (€ 1,551,260) bonds convertible into
606,800 shares elected not to participate in the buy-out
and remained in the Global Equity Plan.
As of December 31, 2001, convertible bonds outstand-
ing for the remaining participants may be converted into
606,800 common shares at maturity if the specific perfor-
mance criteria are met. Bonds not converted will be
redeemed at maturity at their nominal value.
Compensation expense is recorded using variable
plan accounting over the vesting period for remaining par-
ticipants in the GEP based upon an estimated discount for
the applicable three-year performance period and the cur-
rent price of the Group’s common shares. Compensation
expense relating to terminated participants who retain
their award is fully accrued in the year of termination and
remeasured at the end of each reporting period until the
conversion date. Compensation expense accrued for
participants whose rights are forfeited is reversed upon
termination. Compensation expense relating to partici-
pants who accepted the buy-out offer was fully accrued in
2001. For the years ended December 31, 2001, 2000 and
1999, the Group recognized compensation expense of
€ 302 million, € 236 million and € 110 million, respectively.
Consolidated Financial Statements

Information concerning convertible bonds issued
pursuant to the GEP is summarized as follows:
in E thousands 2001 2000
Beginning balance outstanding 44,472 28,062
Convertible bonds issued 0 17,814
Convertible bonds converted (12,921) 0
Convertible bonds redeemedpursuant to buy-out provisions (28,340) 0
Convertible bonds forfeited (1,660) (1,404)
Ending balance outstanding(a) 1,551 44,472
(a) Convertible bonds are included in long-term debt on the Consolidated Balance Sheet.
The weighted-average contractual life of convertible bonds
outstanding at December 31, 2001, was approximately one
year.
DB Global Share Plan
Certain employees who have worked for at least one year
with the Group are eligible to purchase up to 60 shares of
the Group’s common shares at a discount. Retirees in
certain geographic regions are eligible to participate in the
plan and are eligible to purchase up to 25 shares of the
Group’s common shares at a discount. The discount is
linked to the Group’s previous year’s earnings and ranges
from 20% to 40% of the quoted price of the common
shares on the date of grant. The participant is fully vested
and receives all dividend rights for the shares purchased.
At the date of purchase, the Group recognized as compen-
sation expense the difference between the quoted market
price of a common share at the grant date and the price
paid by the participant.
In addition, employee participants receive an option
to purchase one share for each share purchased. Options
issued in connection with the purchase of shares vest two
years after the date of grant and expire after six years.
Following the vesting period, options may be exercised at
a strike price of 120% of the DB share price at date of
grant.
Generally, a participant must have been working for
the Group for at least one year and have an active employ-
ment contract in order to participate. Rights are forfeited
upon termination of employment. Participants who retire
or become permanently disabled prior to fulfillment of the
vesting period may still exercise their rights during the
exercise period if they have worked at least one year from
the grant date.
There is no compensation expense recorded for the
option grants under the DB Global Share Plan because the
exercise price exceeds the market price of the underlying
shares on the date of grant.
The Group issued 237,098 common shares for the year
ended December 31, 2001 and 176,237 options at a strike
of € 87.66 for the year ended December 31, 2001 in con-
nection with the DB Global Share Plan. During that period,
compensation expense recognized for shares purchased
was € 4 million.
The following is a summary of the DB Global Share
Plan option transactions that occurred during 2001 (num-
ber of options in thousands):
2001
Beginning balance outstanding 0
Options granted 176
Options forfeited (1)
Ending balance outstanding 175
There were no options exercisable at December 31, 2001.
The weighted-average contractual life of options outstand-
ing at December 31, 2001 was six years.
db Share Plan
Prior to the adoption of the DB Global Share Plan, certain
employees were eligible to purchase up to 60 shares of
the Group’s common shares at a discount under the
db Share Plan. Retirees in certain geographic regions were
eligible to participate in the plan and were eligible to pur-
chase up to 25 shares of the Group’s common shares at a
discount. The discount was linked to the Group’s previous
year’s earnings and ranged from 20% to 40 % of the quot-
132

133
ed price of the common shares on the date of grant. The
participant is fully vested and receives all dividend rights
for the shares purchased. At the date of purchase, the
Group recognized as compensation expense the difference
between the quoted market price of a common share at
the grant date and the price paid by the participant.
In addition, employee participants received options to
purchase up to 60 shares, depending on the number of
shares purchased. Options issued in connection with the
purchase of shares vest over a period of approximately
three years beginning on the date of grant. Following the
vesting period, options may be exercised if specific perfor-
mance criteria are met. If the performance criteria are
met, the options are exercisable during a fifteen-day exer-
cise period beginning on the sixth trading day following
the respective annual shareholders’ meeting. The exercise
price is based on the average quoted price of a common
share on the Frankfurt Stock Exchange (XETRA) on the five
trading days before the exercise period starts. A discount
is applied to the exercise price at an amount that depends
on the Group’s performance criteria. The maximum dis-
count the participant is eligible to receive is 66.67%.
Rights are forfeited upon termination of employment.
Participants who retire or become permanently disabled
prior to fulfillment of the vesting period may still exercise
their rights during the exercise period if they have worked
at least one year from the grant date.
Compensation expense for the db Share Plan is
recorded using variable plan accounting over the vesting
period based upon an estimated exercise price for the
applicable three-year period and the current market price
of the Group’s common shares. Compensation expense
relating to terminated participants who retain their award
is fully accrued in the year of termination and remeasured
at the end of each reporting period until the exercise date.
Compensation expense accrued for participants whose
rights are forfeited is reversed upon termination.
No common shares or options were issued for the
year ended December 31, 2001. The Group issued
2,171,526 and 1,900,074 common shares for the years
ended December 31, 2000 and 1999, respectively, and
1,889,237 and 1,636,782 options for the years ended
December 2000 and 1999, respectively in connection with
the db Share Plan. Compensation expense recognized for
shares purchased and unpriced options was € 126 million
and € 60 million during 2000 and 1999, respectively. Dur-
ing 2001, the Group recognized compensation expense of
€ 53 million related to the unpriced stock options granted
in 2000 and 1999.
The following is a summary of the db Share Plan
option transactions that occurred during 2001, 2000 and
1999 (number of options in thousands):
Consolidated Financial Statements
2001 2000 1999
Beginning balance outstanding 3,488 1,633 0
Options granted 0 1,889 1,637
Options forfeited (12) (34) (4)
Ending balance outstanding 3,476 3,488 1,633
There were no options exercisable at December 31, 2001,
2000 and 1999. The options outstanding as of Decem-
ber 31, 2001 will expire in two tranches after the share-
holder meetings in 2002 and 2003.

DB Share Scheme
Under the DB Share Scheme (“DB Share Scheme”), the
Group may grant various employees deferred share
awards which provide the right to receive common shares
of the Group at a specified future date. The expense relat-
ed to a portion of the shares awarded under the plan is
recognized in the performance year if it relates to annual
bonuses earned as part of compensation, while the
remainder of the shares awarded are expensed over the
vesting period, which is generally three years.
Compensation expense is recorded in the period that
the employees perform services and is based on the quot-
ed market price of a common share at the grant date of
the awards. Compensation expense recognized for
deferred share awards was € 726 million, € 890 million and
€ 521 million for the years ended December 31, 2001, 2000
and 1999, respectively. The weighted-average grant-date
fair value per share of deferred share awards granted dur-
ing 2001, 2000 and 1999 was € 80.06, € 82.64 and € 51.76,
respectively.
The following table sets forth information about
deferred shares under this plan (number of shares in thou-
sands):
134
2001 2000 1999
Beginning balance outstanding 10,312 4,867 2,642
Deferred shares granted 16,102 10,162 4,874
Deferred shares issued (6,914) (4,243) (2,350)
Deferred shares forfeited (473) (474) (299)
Ending balance outstanding 19,027 10,312 4,867
Share Appreciation Rights Plans
The Group has share appreciation rights plans (“SARs”)
which provide eligible employees of the Group the right to
receive cash equal to the appreciation of the Group’s
shares over an established strike price. During 2001, the
Group granted 10,615,144 SARs at various strike prices.
The share appreciation rights granted can be exercised
approximately three years from the date of grant. Partici-
pants can exercise the share appreciation rights through
January 2007. In October 2001, 16,223,276 SARs with a
strike price of € 98.00 vesting in 2004 and expiring in 2007
were replaced by 10,328,417 rights at a strike price of
€ 67.00. During the year ended December 31, 2001, approx-
imately 195,000 SARs were forfeited. At December 31,
2001, approximately 17 million SARs were outstanding.
Compensation expense on SARs, calculated as the
excess of the current market price of the Group’s common
shares over the strike price, is recorded using variable plan
accounting. The expense related to a portion of the awards
is recognized in the performance year if it relates to annual
bonuses earned as part of compensation, while remaining
awards are expensed over the vesting periods. For the
years ended December 31, 2001, 2000 and 1999, the
Group recognized compensation expense of € 93 million,
€ 54 million and € 44 million, respectively. For the year
ended December 31, 2001, net losses of € 27 million from
non-trading equity derivatives, used to offset fluctuations
in employee share based compensation expense, were
included in compensation and benefits expense.
Other
The Group has other local share-based compensation
plans, none of which, individually or in the aggregate are
material to the consolidated financial statements.
SFAS 123 Pro Forma Information
Pro forma information regarding net income and earnings
per share is required by SFAS 123, and was determined for
the years ended December 31, 2001, 2000 and 1999, as if
the Group had accounted for its employee share options
under the fair value method of SFAS 123.

135
The expense for the deferred share awards is the same
under APB 25 and SFAS 123. For purposes of pro forma
disclosure, the estimated fair value of the options is amor-
tized to expense over the options’ vesting period.
Consolidated Financial Statements
2001 2000 1999
Net Income
As reported E 167 m. E 13,513 m. E 1,613 m.
Pro forma E 135 m. E 13,575 m. E 1,649 m.
Basic earnings per share
As reported E 0.27 E 22.00 E 2.76
Pro forma E 0.22 E 22.10 E 2.82
Diluted earnings per share
As reported E 0.27 E 21.72 E 2.74
Pro forma E 0.22 E 21.82 E 2.80
The fair value of share options granted in 2000 and 1999
was estimated on the date of grant using a forward valua-
tion model. In 2001, the fair value of share options was
estimated on the date of grant using a full binomial option
pricing model. The weighted-average fair value per option
and related assumptions were:
31.12.2001 31.12.2000 31.12.1999
Weighted-average fair value per option E 22.76 E 63.06 E 41.37
Estimated discount (a) 66.67 % 66.67 %
Risk free interest rate 4.70 % 4.99 % 3.62 %
Expected lives (in years) 6 2.78 2.81
Dividend yield 1.59 % 1.59 % 2.10 %
Volatility 36.00 % – –(a) Not applicable. Exercise price for options granted in 2001 was 120 % of grant date price. Options granted in 2000 and 1999 were based on a discount.
[17] Asset and Dividend Restrictions
Since January 1, 1999, when stage three of the European
Economic and Monetary Union was implemented, the
European Central Bank has had responsibility for monetary
policy and control in all the member countries of the Euro-
pean Monetary Union, including Germany.
The European Central Bank sets minimum reserve
requirements to the European Central Bank for institutions
that engage in the customer deposit and lending business.
These minimum reserves must equal a certain percentage
of the institutions’ liabilities resulting from certain
deposits, and the issuance of bonds and money market
instruments. Liabilities to European Monetary Union
national central banks and to other European Monetary
Union Banking institutions that are themselves subject to
the minimum reserve requirements are not included in
this calculation. Since January 1, 1999, the European Cen-
tral Bank has set the minimum reserve rate at 2%. For
deposits with a term to maturity or a notice period of
more than two years, bonds with a term to maturity of
more than two years and repurchase transactions, the
minimum reserve rate has been set at 0 %. Each institu-
tion is required to deposit its minimum reserve with the
national central bank of its home country.
Cash and due from banks includes reserve balances
that the Group is required to maintain with certain central
banks. These required reserves are comprised primarily of
deposits outstanding and were € 454 million and € 605 mil-
lion at December 31, 2001 and 2000, respectively.
Certain other subsidiaries are subject to various regu-
latory and other restrictions that may limit cash dividends
and certain advances to Deutsche Bank.
136
[18] Regulatory Capital
The regulatory capital adequacy guidelines applicable to
the Group are set forth by the Bank for International Sett-
lements (“BIS”) and by European Council directives, as
implemented by the German Banking Supervisory Autho-
rity (“BAK”). Effective December 31, 2001 the BAK permit-
ted the Group to calculate its BIS capital adequacy ratios
using U.S. GAAP amounts. Prior to December 31, 2001 the
Group used International Accounting Standards (“IAS”) for
disclosure to the Group’s regulators. The figures for
December 31, 2000 have been presented according to
U.S. GAAP for comparison purposes.
The BIS capital ratio is the principal measure of capi-
tal adequacy for international banks. This ratio compares a
bank’s regulatory capital with its counterparty risks and
market risks (which the Group refers to collectively as the
“risk position”). Counterparty risk is measured by asset
and off-balance sheet exposures according to broad cate-
gories of relative credit risk. The Group’s market risk com-
ponent is a multiple of its value-at-risk figure, which may
be calculated for regulatory purposes based on the
Group’s internal models. These models were approved by
the BAK for use in determining the Group’s market risk
equivalent component of its risk position. A bank’s regula-
tory capital is divided into three tiers (core or Tier I capital,
supplementary or Tier II capital, and Tier III capital). Core or
Tier I capital consists primarily of share capital, additional
paid-in capital and retained earnings less certain intangi-
bles (principally goodwill) and the impact from the tax law
changes (as described below). Supplementary or Tier II
capital consists primarily of participatory capital, long-term
subordinated debt and unrealized gains on listed securi-
ties. Tier III capital consists mainly of certain short-term
subordinated liabilities. The minimum BIS total capital ratio
(Tier I + Tier II + Tier III) is 8% of the risk position, and the
minimum BIS core (Tier I) capital ratio is 4% of the risk
position. Under BIS guidelines, the amount of subordinat-
ed debt that may be included as Tier II capital is limited to
50 % of Tier I capital. Total Tier II capital is limited to 100%
of Tier I capital.
The effect of the German Tax Reform Legislation on
available for sale securities is treated differently for the
regulatory capital calculation and financial accounting. For
financial accounting purposes, deferred tax provisions for
unrealized gains on available for sale securities are record-
ed directly to other comprehensive income whereas the
adjustment to the related deferred tax liabilities for a
change in expected effective income tax rates is recorded
as an adjustment of income tax expense in current period
earnings. The positive impact from the above on retained
earnings of the Group from the two important German tax
law changes in 1999 and 2000 amounts to approximately
€ 5.9 billion as of December 31, 2001. For the purpose of
calculating the regulatory capital, gross unrealized gains on
available for sale securities are to be excluded from Tier I
capital. The adjustment relates to accumulated other
comprehensive income (€ 3.4 billion) and the release of
deferred tax provisions (€ 5.9 billion) included in retained
earnings.
Failure to meet minimum capital requirements can
initiate certain mandates, and possibly additional discre-
tionary actions by the BAK and other regulators that, if
undertaken, could have a direct material effect on the con-
solidated financial statements of the Group.

137
The following table sets forth the Group’s total capital
and capital adequacy ratios (as a percentage of the risk
position) based on BIS guidelines:
in € m. 31.12.2001 31.12.2000(a)
BIS total capital 37,058 39,343
BIS core capital 24,803 23,504
BIS risk position(b) 305,079 299,879
BIS capital ratio (Tier I + II + III) 12.1 % 13.1 %
BIS core capital ratio (Tier I) 8.1 % 7.8 %(a) Unaudited(b) Primarily comprised of credit risk weighted assets. Also includes market risk
equivalent assets of € 8.0 billion as of December 31, 2001, and € 7.9 billion as of December 31, 2000.
Capital According to BIS
Capital in accordance with BIS is shown in the table
below. With a capital ratio of 12.1% at December 31, 2001,
Deutsche Bank is well above the minimum ratio of 8%
required by BIS.
The components of core and supplementary capital
for the Group of companies consolidated for regulatory
purposes are as follows at December 31, 2001:
Consolidated Financial Statements
in € m.
Core capital 31.12.2001 Supplementary capital 31.12.2001
Unrealized gains Common shares 1,591 on listed securities (45 % eligible) 4,170
Additional paid-in capital 11,253 General allowances for loan losses 479
Retained earnings, consolidated profit, treasury Cumulative preferred securities,shares, cumulative translation adjustments, participatory capital 2,190share awards 23,931
Subordinated liabilities, Minority interests 958 if eligible according to BIS 5,416
Noncumulative trust preferred securities 2,593
Other (equity contributed by silent partners) 811
Items deducted (principally goodwill and tax effectof available for sale securities) (16,334)
Total Core Capital 24,803 Total Supplementary Capital 12,255
The group of companies consolidated for regulatory pur-
poses includes all credit, financial services and financing
companies, as well as companies providing auxiliary bank-
ing services in the Group. It does not include insurance
companies, fund management companies inside the Euro-
pean Union or companies outside the finance sector.

[19] Interest Revenues and Interest Expense
The following are the components of interest revenues
and interest expense:
138
in € m. 2001 2000 1999
Interest-earning deposits with banks 2,912 2,303 2,450
Central bank funds sold 91 137 118
Securities purchased under resale agreements 8,135 7,870 7,559
Securities borrowed 5,327 6,644 3,161
Interest income on securities available for sale and other investments 2,682 2,594 2,284
Dividend income on securities available for saleand other investments 1,029 762 698
Loans 17,619 20,137 15,948
Trading assets 15,571 14,439 7,811
Other 273 245 113
Interest revenues 53,639 55,131 40,142
Interest-bearing deposits
Domestic 3,169 3,877 3,357
Foreign 12,555 13,020 7,885
Trading liabilities 5,723 6,285 3,514
Securities sold under repurchase agreements 10,387 10,365 7,377
Securities loaned 1,902 2,161 1,449
Other short-term borrowings 2,078 3,322 1,572
Long-term debt 8,918 8,767 6,788
Trust preferred securities 287 306 206
Interest expense 45,019 48,103 32,148
Net interest revenues 8,620 7,028 7,994
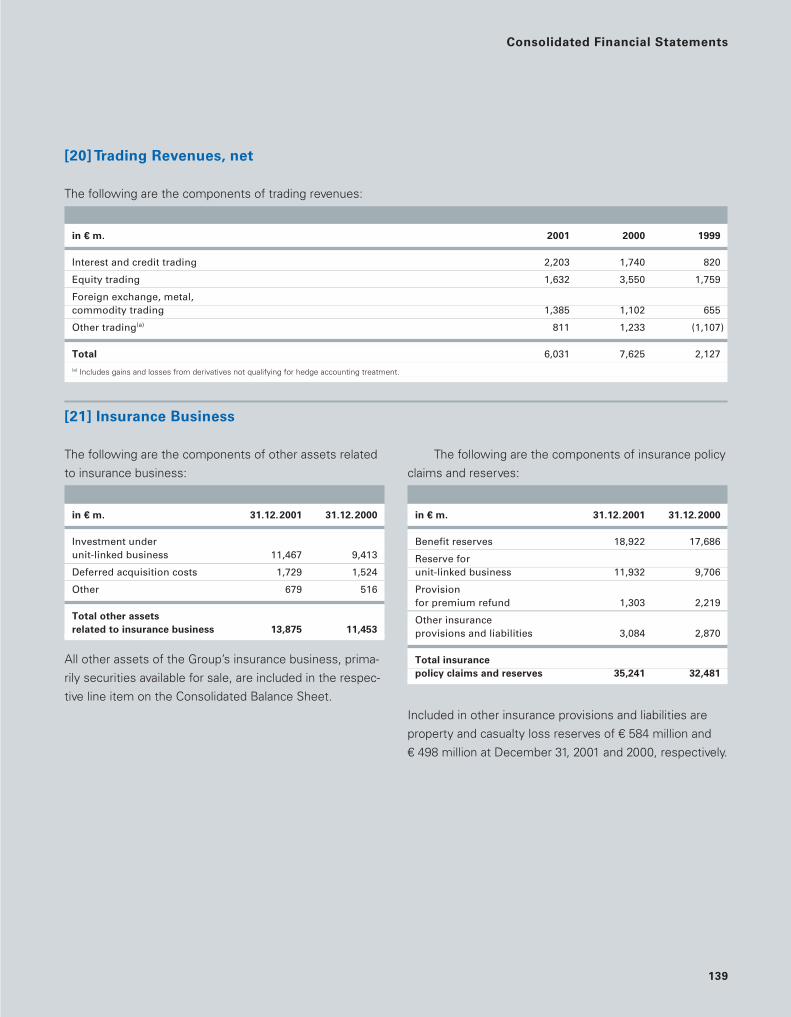
139
[20] Trading Revenues, net
The following are the components of trading revenues:
[21] Insurance Business
The following are the components of other assets related
to insurance business:
in E m. 31.12.2001 31.12.2000
Investment under unit-linked business 11,467 9,413
Deferred acquisition costs 1,729 1,524
Other 679 516
Total other assets
related to insurance business 13,875 11,453
All other assets of the Group’s insurance business, prima-
rily securities available for sale, are included in the respec-
tive line item on the Consolidated Balance Sheet.
The following are the components of insurance policy
claims and reserves:
in E m. 31.12.2001 31.12.2000
Benefit reserves 18,922 17,686
Reserve for unit-linked business 11,932 9,706
Provision for premium refund 1,303 2,219
Other insurance provisions and liabilities 3,084 2,870
Total insurance
policy claims and reserves 35,241 32,481
Included in other insurance provisions and liabilities are
property and casualty loss reserves of € 584 million and
€ 498 million at December 31, 2001 and 2000, respectively.
Consolidated Financial Statements
in € m. 2001 2000 1999
Interest and credit trading 2,203 1,740 820
Equity trading 1,632 3,550 1,759
Foreign exchange, metal, commodity trading 1,385 1,102 655
Other trading(a) 811 1,233 (1,107)
Total 6,031 7,625 2,127(a) Includes gains and losses from derivatives not qualifying for hedge accounting treatment.

[22] Pension and Other Employee Benefit
Plans
Employee retirement arrangements, covering the majority
of the Group’s subsidiaries and employees, are provided
in the principal countries in which the Group operates. The
value of a participant’s accrued benefit is based primarily
on each employee’s salary and length of service.
The Group’s most significant retirement arrange-
ments are provided for employees working in the United
States, Germany, Spain, Italy, Belgium, France, Nether-
lands and the United Kingdom. The majority of beneficia-
ries of the retirement arrangements are principally located
in Germany. All plans are valued using the projected unit
credit method. Plans in the United States, United King-
dom, Belgium, Netherlands and Asia are generally funded,
while the German, French, Spanish and Italian plans are
unfunded.
The Group also sponsors a number of defined contri-
bution plans covering employees of certain subsidiaries.
The assets of all the Group’s defined contribution plans
are held in independently administered funds. Contribu-
tions are generally determined as a percentage of salary.
In addition, the Group’s subsidiaries offer unfunded
contributory defined benefit postretirement health care
plans to a number of retired employees who are principally
located in the United States. These plans pay stated per-
centages of necessary medical and dental expenses of
retirees after a stated deductible has been met. The Group
funds these plans on a cash basis as benefits are due.
140

141
The following tables provide a reconciliation of the
changes in the Group’s plans’ benefit obligations and fair
value of assets over the two-year period ended Decem-
ber 31, 2001 and a statement of the funded status as of
December 31 for each year:
Consolidated Financial Statements
Pension Benefits Postretirement Benefits
in € m. 2001 2000 2001 2000
Change in benefit obligation
Benefit obligation at beginning of year 6,416 5,890 121 145
Service cost 309 314 4 2
Interest cost 367 339 10 7
Plan amendments 0 0 0 (5)
Acquisitions/divestitures (25) 0 0 0
Actuarial loss (gain) (83) 280 25 (21)
Benefits paid (266) (291) (10) (7)
Curtailment/settlement 0 (177) (5) (8)
Foreign currency exchange rate changes 54 61 6 8
Benefit obligation at end of year 6,772 6,416 151 121
Change in plan assets
Fair value of plan assets at beginning of year 2,634 2,504 1 4
Actual return on plan assets (350) 60 0 0
Employer contributions 97 80 10 13
Benefits paid (100) (107) (10) (6)
Curtailment/settlement 0 0 (1) (10)
Foreign currency exchange rate changes 88 97 0 0
Fair value of plan assets at end of year 2,369 2,634 0 1
Funded status (4,403) (3,782) (151) (120)
Unrecognized net actuarial loss (gain) 690 248 (21) (38)
Unrecognized prior service cost (benefit) 26 4 (8) (8)
Unrecognized transition assets (5) (16) 0 0
Accrued benefit cost at end of year(a) (3,692) (3,546) (180) (166)
(a) Prepaid pension costs totaled € 665 million and € 620 million at December 31, 2001 and 2000, respectively. No prepaid postretirement costs were recognized at these dates.
The aggregate projected benefit obligation, accumulated
benefit obligation, and fair value of plan assets for those
pension plans with accumulated benefit obligations in
excess of plan assets were € 4,654 million, € 4,185 million
and € 297 million, respectively, as of December 31, 2001
and € 4,421 million, € 3,802 million and € 136 million,
respectively, as of December 31, 2000.
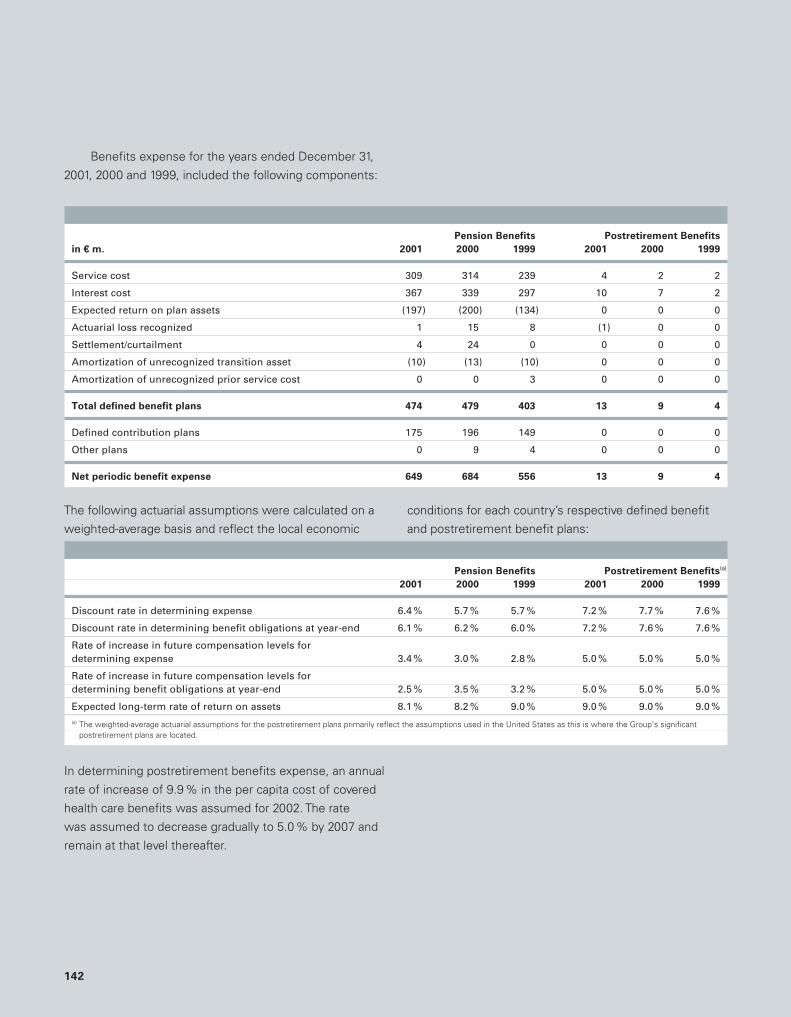
Benefits expense for the years ended December 31,
2001, 2000 and 1999, included the following components:
142
Pension Benefits Postretirement Benefits
in € m. 2001 2000 1999 2001 2000 1999
Service cost 309 314 239 4 2 2
Interest cost 367 339 297 10 7 2
Expected return on plan assets (197) (200) (134) 0 0 0
Actuarial loss recognized 1 15 8 (1) 0 0
Settlement/curtailment 4 24 0 0 0 0
Amortization of unrecognized transition asset (10) (13) (10) 0 0 0
Amortization of unrecognized prior service cost 0 0 3 0 0 0
Total defined benefit plans 474 479 403 13 9 4
Defined contribution plans 175 196 149 0 0 0
Other plans 0 9 4 0 0 0
Net periodic benefit expense 649 684 556 13 9 4
Pension Benefits Postretirement Benefits(a)
2001 2000 1999 2001 2000 1999
Discount rate in determining expense 6.4 % 5.7 % 5.7 % 7.2 % 7.7 % 7.6 %
Discount rate in determining benefit obligations at year-end 6.1 % 6.2 % 6.0 % 7.2 % 7.6 % 7.6 %
Rate of increase in future compensation levels for determining expense 3.4 % 3.0 % 2.8 % 5.0 % 5.0 % 5.0 %
Rate of increase in future compensation levels for determining benefit obligations at year-end 2.5 % 3.5 % 3.2 % 5.0 % 5.0 % 5.0 %
Expected long-term rate of return on assets 8.1 % 8.2 % 9.0 % 9.0 % 9.0 % 9.0 %(a) The weighted-average actuarial assumptions for the postretirement plans primarily reflect the assumptions used in the United States as this is where the Group’s significant
postretirement plans are located.
The following actuarial assumptions were calculated on a
weighted-average basis and reflect the local economic
conditions for each country’s respective defined benefit
and postretirement benefit plans:
In determining postretirement benefits expense, an annual
rate of increase of 9.9% in the per capita cost of covered
health care benefits was assumed for 2002. The rate
was assumed to decrease gradually to 5.0% by 2007 and
remain at that level thereafter.

143
Assumed health care cost trend rates have a signifi-
cant effect on the amounts reported for the retiree health
care plans. A one-percentage-point change in assumed
health care cost trend rates would have the following
effects on the Group’s retiree health care plans:
Consolidated Financial Statements
[23] Restructuring Activities
Restructuring charges are recorded in conjunction with
acquisitions as well as business realignments.
The following table presents the activity in the
Group’s restructuring programs for the years ended
December 31, 2001, 2000, and 1999:
One-Percentage One-Percentage
Point Increase Point Decrease
in € m. 2001 2000 2001 2000
Effect on total of service and interest cost components 2 2 (2) (2)
Effect on accumulated postretirement benefit obligation 16 15 (14) (13)
Group Restructuring Bankers Trust Personal Banking Other Restructuring Total
Restructuring Restructuring Programs
Plan 1 Plan 2
in € m. Severance Other Severance Severance Severance Other Severance Other
Additions 0 0 596 270 0 0 44 23 933(a)
Utilization 0 0 458 162 0 0 2 9 631
As at 31.12.1999 0 0 138 108 0 0 42 14 302
Additions 0 0 0 0 100 36 30 7 173
Utilization 0 0 129 103 15 0 47 14 308
Releases 0 0 19 13 0 0 22 6 60(b)
Effects from exchange rate fluctuations 0 0 10 8 0 0 3 0 21
As at 31.12.2000 0 0 0 0 85 36 6 1 128
Additions 234 60 0 0 0 0 0 0 294
Utilization 22 0 0 0 85 36 6 1 150
Releases 0 0 0 0 0 0 0 0 0
Effects from exchange rate fluctuations 0 0 0 0 0 0 0 0 0
As at 31.12.2001 212 60 0 0 0 0 0 0 272
(a) Includes € 474 million recorded as goodwill; net expense is € 459 million.(b) Includes € 12 million recorded as goodwill; net expense, after additions, is € 125 million.
Severance includes employee termination benefits related
to the involuntary termination of employees. Such costs
include obligations resulting from severance agreements,
termination of employment contracts and early-retirement
agreements. Other costs primarily include amounts for
lease terminations and related costs.
At December 31, 2001, € 212 million of the remaining
restructuring liabilities related to severance and other ter-

mination-related costs for further staff reductions of
approximately 2,200 positions. These severance actions,
as well as the actions related to other exit activities are
expected to be completed during 2002.
During the year ended December 31, 2001, 1,200
employees were terminated, resulting in a payment of
€ 113 million against restructuring liabilities.
The following is a description of the Group’s restruc-
turing plans for the years ended December 31, 2001, 2000
and 1999.
Group Restructuring
The Group recorded a pre-tax charge of € 294 million in
the fourth quarter of 2001 related to a restructuring plan
affecting two of Deutsche Bank’s group divisions: Corpo-
rate and Investment Bank (CIB) and Private Clients and
Asset Management (PCAM). Of the total € 294 million,
€ 213 million are related to the restructuring measures in
CIB and € 81 million to PCAM. A total of approximately
2,400 staff, across all levels of the Group, are impacted by
the restructuring plan.
The restructuring in CIB covers steps to be taken as a
result of changing market conditions in the year 2001, and
to give further effect to the CIB organizational and business
model that was created during 2001. It primarily impacts
CIB’s customer coverage and relationship management
processes, certain aspects of the cash management, cus-
tody and trade finance businesses of Global Transaction
Banking and the related elements of the settlement, infra-
structure and real estate support functions.
The plan also includes the further streamlining of the
senior management structure in PCAM as a consequence
of the re-organization of that group division’s business
model and operations, including real estate support.
As of December 31, 2001, approximately 200 posi-
tions were eliminated and € 22 million of the reserve was
utilized. As of December 31, 2001, € 212 million of the
remaining reserve balance related to severance and other
termination-related costs for further staff reductions of
approximately 2,200 positions and € 60 million to lease
terminations, net losses on subleases and other related
costs. All actions contemplated in the plan are expected to
be completed during 2002.
Bankers Trust Restructuring
During 1999, the Group recorded a restructuring liability
totaling € 866 million in connection with the acquisition of
Bankers Trust. The Group recorded € 596 million in the
second quarter of 1999 in conjunction with the acquisition
(“Plan 1”), which reflected severance and other termina-
tion-related costs. Costs totaling € 474 million of severance
and other termination-related costs attributable to employ-
ees of Bankers Trust were recognized as a liability
assumed as of the acquisition date and charged directly to
goodwill. The remaining costs, totaling € 122 million, were
attributable to employees of the existing Group and, there-
fore, were expensed as restructuring activities. During the
fourth quarter of 1999, the Group recorded additional
charges related to severance and other termination-related
costs of € 270 million in connection with its continuing
efforts to streamline support functions and realign certain
business activities (“Plan 2”).
As a result of these restructuring plans, the Group
planned for a reduction of approximately 3,300 positions.
This reduction affected multiple levels of employees
throughout the Group. The Group eliminated 2,700 posi-
tions and during the year ended December 31, 2000 the
remaining reserves totaling € 32 million were released.
144

145
Personal Banking Restructuring
During 2000, the Group recorded charges for restructuring
activities totaling € 136 million in connection with a plan
for Personal Banking (Deutsche Bank 24) to consolidate
branch offices and the related back office functions. Of
this amount, approximately € 100 million was for sever-
ance and other termination-related costs attributable to
approximately 1,000 positions, and € 36 million for other
costs primarily related to lease terminations. As of Decem-
ber 31, 2000, € 85 million of the remaining reserve balance
related to severance and other termination-related costs
for further staff reductions of 900 positions and € 36 mil-
lion to lease terminations. All actions contemplated in the
plan were completed during 2001.
Other Restructuring Programs
Other restructuring programs include plans to streamline
transaction processing product delivery and to provide for
certain business realignments and consolidation of activi-
ties. The plans recorded in 1999 contemplated staff reduc-
tions of 600 positions. Due to a higher than anticipated
level of employee attrition, 400 employee positions were
not terminated and € 28 million, primarily related to sever-
ance, was released in the year ended December 31, 2000.
Plans recorded in 2000 included the additional elimination
of 400 positions. All actions were completed during 2001.
Consolidated Financial Statements
[24] Income Taxes
The components of income taxes (benefits) follow:
in € m. 2001 2000 1999
Domestic 486 337 54
Foreign 1,102 1,351 1,185
Current taxes 1,588 1,688 1,239
Domestic 100 (8,356) 143
Foreign (259) 24 (644)
Deferred taxes (159) (8,332) (501)
Total 1,429 (6,644) 738

The following is an analysis of the difference between the
German statutory income tax expense (benefit) and the
Group’s effective tax (benefit) expense on income before
income taxes:
146
in € m. 2001 2000 1999
Computed expected tax expense at German corporate tax rate of 39.2 %
(52.4 % for 2000 and 1999) 707 3,599 1,232
Effect of changes in German tax law and the reversing effect 995 (9,287) (951)
Domestic rate differential on dividend distributions 0 (172) (204)
Tax-exempt income (1,077) (101) (320)
Foreign tax-rate differential (146) (903) 114
Valuation allowance 286 (108) 570
Nondeductible expenses 354 98 42
Amortization of goodwill 363 404 255
Tax credit related to domestic dividend received (109) (144) (139)
Other 56 (30) 139
Actual income tax expense (benefit) 1,429 (6,644) 738
During 2000, a new tax law was enacted in Germany
which reduced the corporate tax rates and exempted from
tax certain gains from the sale of German stock invest-
ments. The corporate tax rate was reduced from 40 % on
retained earnings and 30% on distributed earnings to
a single 25% rate effective January 1, 2001. The domestic
tax rate including corporate tax, solidarity surcharge, and
trade tax used for calculating deferred tax assets and liabil-
ities as of December 31, 2000 was 39.3% which at that
time was the expected statutory rate for 2001. The tax law
change also exempted certain gains on the sale of stock
investments effective January 1, 2002. The effect of the
above changes was a net income tax benefit of € 9.3 bil-
lion for the year ended December 31, 2000. Approximately
€ 6.2 billion of the tax benefit from the change in tax rates
in 2000 is related to the reduction of deferred tax liabilities
previously recorded on unrealized gains on securities avail-
able for sale – even though these deferred taxes were
originally established through a charge to other compre-
hensive income, not through a charge to earnings.
For the year 2001, due to actual sales of equity securi-
ties on which there was accumulated deferred tax provi-
sion in other comprehensive income, it was necessary
to reverse those provisions as income tax expense. This
treatment led to income tax expense of € 995 million.
This adjustment does not result in actual tax payments
and has no net effect on shareholders’ equity.
During 1999, the corporate tax rate on retained
earnings was reduced from 45 % to 40 % effective Jan-
uary 1, 1999. The combined tax rate including corporate
tax, solidarity surcharge and trade tax rate was reduced
from 56.7% in 1998 to 52.4% in 1999 and 2000. The
effect of the tax rate change was a net benefit of
€ 951 million for the year ended December 31, 1999, of
which approximately € 700 million relates to the reduction
of deferred tax liabilities previously recorded on unrealized
gains on securities available for sale.
The accumulated deferred tax amounts recorded
within other comprehensive income will, however, be
reversed as income tax expense in the periods that the
related securities are sold. At December 31, 2001 and
2000, the amount of these deferred taxes accumulated
within other comprehensive income that will reverse in a
future period as tax expense when the securities are sold
is approximately € 5.9 billion and € 6.9 billion, respectively.

147
The sources and tax effects of temporary differences
and net operating loss carryforwards that give rise to sig-
nificant deferred income tax assets and liabilities are the
following:
in € m. 31.12.2001 31.12.2000
Trading activities 17,424 16,407
Net operating loss carryforwards and tax credits 2,222 1,555
Property and equipment, net 322 1,121
Other assets 2,913 2,979
Allowance for loan losses 315 333
Other provisions 883 1,606
Deferred income tax assets 24,079 24,001
Valuation allowance (965) (679)
Deferred tax assets
after valuation allowance 23,114 23,322
Trading activities 19,468 21,988
Securities valuation 236 582
Other liabilities 974 121
Deferred income tax liabilities 20,678 22,691
Net deferred income tax assets 2,436 631
Included in other assets and other liabilities at Decem-
ber 31, 2001 and 2000 are deferred tax assets of € 3.8 bil-
lion and € 3.0 billion and deferred tax liabilities of € 1.4 bil-
lion and € 2.4 billion, respectively.
Certain foreign branches and companies in the Group
have deferred tax assets related to net operating loss car-
ryforwards and tax credits available to reduce future tax
expense. The net operating loss carryforwards at Decem-
ber 31, 2001 were € 5.3 billion of which € 4.4 billion has no
expiration date and € 833 million expire at various dates
extending to 2021. Net operating loss carryforwards at
December 31, 2000 were € 2.6 billion. Tax credits were
€ 470 million (€ 567 million in 2000) of which € 347 million
will expire in 2004 and € 63 million will expire in 2005 and
€ 60 million have other expiration dates. The Group has
established a valuation allowance where realization of
those losses and credits is not likely.
The Group did not provide income taxes or foreign
withholding taxes on € 5.8 billion, € 4.9 billion and € 3.1bil-
lion for the years ended December 31, 2001, 2000 and
1999, respectively, of cumulative earnings of foreign sub-
sidiaries because these earnings are intended to be indefi-
nitely reinvested in those operations. It is not practicable
to estimate the amount of unrecognized deferred tax liabil-
ities for these undistributed foreign earnings.
Consolidated Financial Statements

[25] Earnings per Common Share
Basic earnings per common share amounts were comput-
ed by dividing net income by the average number of com-
mon shares outstanding during the year. The average num-
ber of common shares outstanding is the sum of the
average number of common shares outstanding and
undistributed vested shares awarded under deferred share
plans.
Diluted earnings per share amounts were calculated
by adding back to net income the interest expense on the
convertible bonds and dividing this amount by the average
number of common shares and dilutive potential common
shares outstanding during the year.
Diluted earnings per share assumes the conversion
into common shares of outstanding share options, unvest-
ed deferred share awards and convertible bonds, as com-
puted under the treasury stock method, if dilutive. Under
the treasury share method, the number of incremental
shares is determined by assuming the issuance of the
outstanding share options, deferred share awards, and
shares from convertible bonds, reduced by the number of
shares assumed to be repurchased from the issuance
proceeds, using the Group’s average market share price
for the year.
148
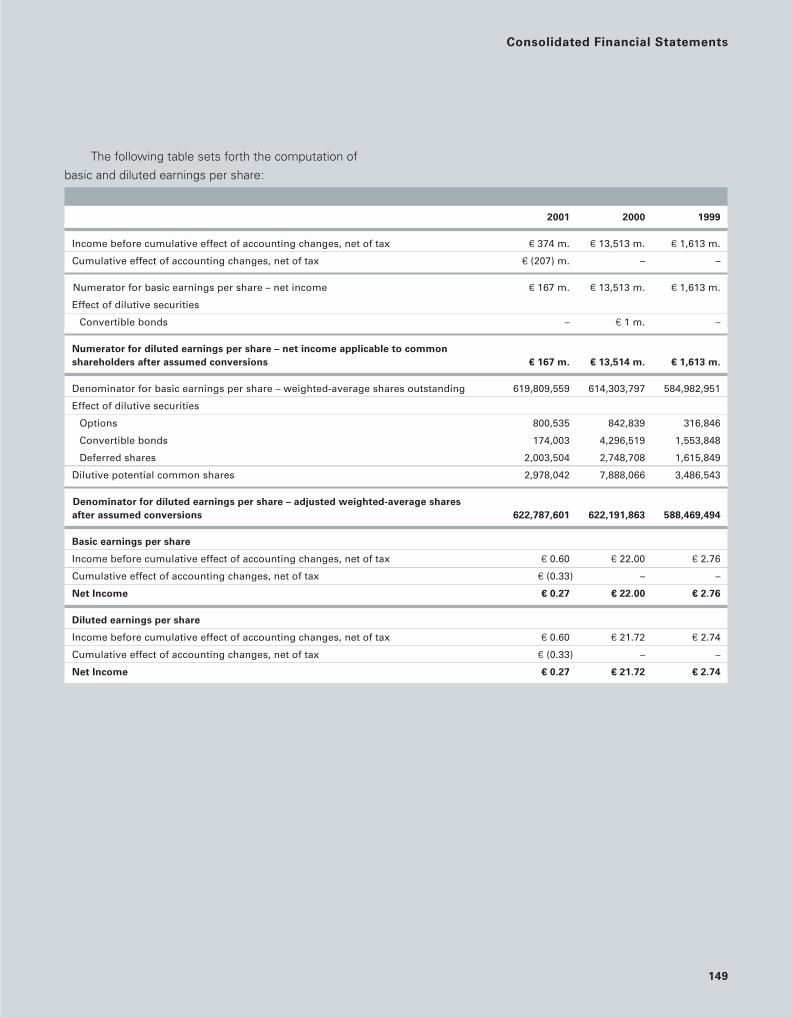
149
The following table sets forth the computation of
basic and diluted earnings per share:
Consolidated Financial Statements
2001 2000 1999
Income before cumulative effect of accounting changes, net of tax € 374 m. € 13,513 m. € 1,613 m.
Cumulative effect of accounting changes, net of tax € (207) m. – –
Numerator for basic earnings per share – net income € 167 m. € 13,513 m. € 1,613 m.
Effect of dilutive securities
Convertible bonds – € 1 m. –
Numerator for diluted earnings per share – net income applicable to common
shareholders after assumed conversions X 167 m. X 13,514 m. X 1,613 m.
Denominator for basic earnings per share – weighted-average shares outstanding 619,809,559 614,303,797 584,982,951
Effect of dilutive securities
Options 800,535 842,839 316,846
Convertible bonds 174,003 4,296,519 1,553,848
Deferred shares 2,003,504 2,748,708 1,615,849
Dilutive potential common shares 2,978,042 7,888,066 3,486,543
Denominator for diluted earnings per share – adjusted weighted-average shares
after assumed conversions 622,787,601 622,191,863 588,469,494
Basic earnings per share
Income before cumulative effect of accounting changes, net of tax € 0.60 € 22.00 € 2.76
Cumulative effect of accounting changes, net of tax € (0.33) – –
Net Income € 0.27 € 22.00 € 2.76
Diluted earnings per share
Income before cumulative effect of accounting changes, net of tax € 0.60 € 21.72 € 2.74
Cumulative effect of accounting changes, net of tax € (0.33) – –
Net Income € 0.27 € 21.72 € 2.74

[26] Business Segments and Related Infor-
mation
The Group revised its management reporting systems in
2001 to reflect the following changes:
– A new organizational structure;
– The format of the statement of income for management
accounting purposes, to present the same line items as
in the consolidated financial statements under
U.S. GAAP; and
– The allocation of Corporate Center costs across divisions.
New Organizational Structure
On February 1, 2001, the Group adopted its new organiza-
tional structure, realigning the structure of its activities
from five business divisions into three group divisions.
The Group also has a service function called DB Services,
that provides corporate services, information technology,
consulting and transaction services to the entire organiza-
tion. The Corporate Center includes those functions that
support cross-divisional management.
The Corporate and Investment Bank Group Division
serves all of the Group’s corporate and institutional clients,
ranging from small- and medium-sized enterprises to
multinational corporations. By combining within one group
division the Corporate Banking & Securities activities with
the Global Transaction Banking activities, the Group has
integrated services previously provided in the Corporates
and Real Estate Division, the Global Corporates and Insti-
tutions Division and the Global Institutional Services busi-
ness area of the Global Technology and Services Division.
The Private Clients and Asset Management Group
Division integrates, on a global basis, all of the Group’s
activities for private clients, as well as active and passive
asset management activities for both private and institu-
tional clients. Within this group division, the Group man-
ages these activities in three global corporate divisions:
Personal Banking, Private Banking, and Asset Management.
Within the Corporate Investments Group Division, the
Group combines its principal investment activities. This
unit manages principal investments in private equity and
venture capital, real estate holding companies, as well as
industrial investments. Principal investments, which were
previously reported in the reconciliation of the results of
the business segments to the consolidated financial state-
ments, are now included in this group division. In addition,
Corporate Investments covers strategic investments as
well as activities which do not belong to the Group’s core
business.
The figures reported for the years 2000 and 1999
have been restated to make them comparable to 2001.
Format of the Statement of Income
Beginning in 2001, the Group’s management reporting
systems follow the same format as the Consolidated
Statement of Income. As a result, there are no longer
reclassifications among the line items between the man-
agement reporting systems and the consolidated financial
statements under U.S. GAAP. The most significant
changes are described below:
– Components previously reported as balance of other
expenses (income) within the management reporting
systems are now reflected either as revenues or as
noninterest expenses.
– Revenues of the Group’s insurance business were
previously reported net of policyholder benefits and
claims as revenues within our management reporting
systems. These components are now reported gross as
revenues and noninterest expenses.
150

151
– Restructuring expenses (benefit) were previously
reported as a separate line item in the management
reporting systems. They are now included as noninterest
expenses.
– Credit losses on lending-related commitments were
previously reported under provisions for losses on loans
and advances in the management reporting systems.
They are now included as noninterest expenses.
The classifications reported for the years 2000 and 1999
have been restated to conform to the 2001 presentation.
Allocation of Corporate Center costs
Corporate Center was previously reported as a separate
unit in the management reporting systems. Beginning in
2001, costs of the Corporate Center are fully allocated
within the noninterest expense line. As a consequence,
the Corporate Center contains no material result compo-
nents and is no longer reported separately.
The figures reported for the years 2000 and 1999
have been restated to make them comparable to 2001.
General information on the Group’s management
reporting systems
Business segment results are determined based on the
Group’s internal management reporting process, which
reflects the way management views its businesses,
and are not necessarily prepared in accordance with the
Group’s U.S. GAAP consolidated financial statements. This
internal management reporting process may be different
than the processes used by other financial institutions and
therefore, should be considered in making any compar-
isons with those institutions. Since the Group’s business
activities are diverse in nature and its operations are inte-
grated, certain estimates and judgments have been made
to apportion revenue and expense items among the busi-
ness segments.
The management reporting system follows the
“matched transfer pricing concept” in which the Group’s
external net interest revenues are allocated to the busi-
ness segments based on the assumption that all positions
are funded or invested via the money and capital markets.
To create comparability with legally independent units with
their own equity funds, the notional interest received on
the Group’s consolidated capital is allocated proportionate-
ly to the business segments as part of their net interest
revenues.
Revenues from intersegment transactions are allocat-
ed to the business segments on a mutually agreed basis.
In addition, cost centers are internal service providers
operating on a non-profit basis and allocate their costs to
the service recipient. The allocation criteria are generally
contractually agreed and are either determined based
upon “price per unit” (for areas with countable services)
or “fixed price” or “agreed percentages” (for all areas
without countable services).
Segmental Results of Operations
The following tables present the results of the business
segments for the years ended December 31, 2001,
2000 and 1999. The criterion for Segmentation into divi-
sions is our organizational structure as it existed as at
December 31, 2001.
Consolidated Financial Statements

152
R e p o r t i n g S e g m e n t I n f o r m a t i o n b y G r o u p D i v i s i o n
Corporate and Private Clients and Corporate Total Manage-
in € m. Investment Bank Asset Management Investments ment Reporting
2001
Net revenues(a) 17,436 10,993 1,968 30,397Provision for loan losses 704 206 105 1,015Noninterest expenses(b) 14,029 10,390 1,623 26,042 Income before income taxes(c) 2,703 397 240 3,340
Average allocated equity 17,034 3,392 6,081 26,507 RoE in % (excluding goodwill amortization and before income taxes)(d) 19 % 18 % 7 % 16 %Assets(e) 751,406 125,743 45,594 896,800Expenditures for additions to long-lived assets 659 160 141 960Risk-weighted positions (BIS risk positions) 211,253 56,649 32,468 300,370Cost-Income-Ratio in %(f) 77 % 92 % 75 % 82 %(a) Includes: Net interest revenues 4,946 3,430 (141) 8,235
Net revenues from external customers 17,533 10,896 1,845 30,274Net intersegment revenues (97) 97 123 123
(b) Includes: Depreciation, depletion and amortization 451 328 117 896Goodwill amortization 451 221 156 828Policyholder benefits and claims 0 2,948 0 2,948Severance payments 297 76 14 387Restructuring activities 213 81 0 294
(c) Before cumulative effect of accounting changes.
2000
Net revenues(a) 17,894 12,519 3,548 33,961Provision for loan losses 153 192 132 477Noninterest expenses(b) 13,612 10,924 1,382 25,918Income before income taxes 4,129 1,403 2,034 7,566
Average allocated equity 16,010 3,045 3,471 22,526RoE in % (excluding goodwill amortizationand before income taxes)(d) 28 % 53 % 61 % 37 %Assets(e) 734,774 113,079 37,916 885,796Expenditures for additions to long-lived assets 518 183 38 739Risk-weighted positions (BIS risk positions) 211,104 49,037 25,769 285,910Cost-Income-Ratio in %(f) 75 % 86 % 37 % 75 %(a) Includes: Net interest revenues 3,366 3,384 (95) 6,655
Net revenues from external customers 17,967 12,460 3,467 33,894Net intersegment revenues (73) 59 81 67
(b) Includes: Depreciation, depletion and amortization 539 280 88 907Goodwill amortization 392 213 71 676Policyholder benefits and claims 0 3,912 0 3,912Severance payments 170 18 3 191Restructuring activities (102) (14) 0 (116)
1999
Net revenues(a) 12,741 10,530 2,648 25,919Provision for loan losses 531 105 63 699Noninterest expenses(b) 10,397 9,930 628 20,955Income before income taxes 1,813 495 1,957 4,265
Average allocated equity 13,691 2,604 2,968 19,263RoE in % (excluding goodwill amortizationand before income taxes)(d) 15 % 26 % 68 % 25 %Assets(e) 670,774 93,798 29,570 794,142Expenditures for additions to long-lived assets 426 150 41 617Risk-weighted positions (BIS risk positions) 211,233 48,906 25,005 285,144 Cost-Income-Ratio in %(f) 76 % 90 % 21 % 76 %(a) Includes: Net interest revenues 4,496 3,082 483 8,061
Net revenues from external customers 12,719 10,552 2,495 25,766Net intersegment revenues 22 (22) 153 153
(b) Includes: Depreciation, depletion and amortization 170 111 75 356 Goodwill amortization 238 170 60 468 Policyholder benefits and claims 0 3,790 0 3,790 Severance payments 26 3 2 31 Restructuring activities 429 320 9 758
(d) Income before income taxes excluding goodwill amortization divided by average allocated equity.(e) At the group division level, CIB, PCAM, CI and Total Management Accounting, consolidation items between group divisions/corporate divisions are included.(f) Excluding goodwill amortization, provision for loan losses and restructuring activities.
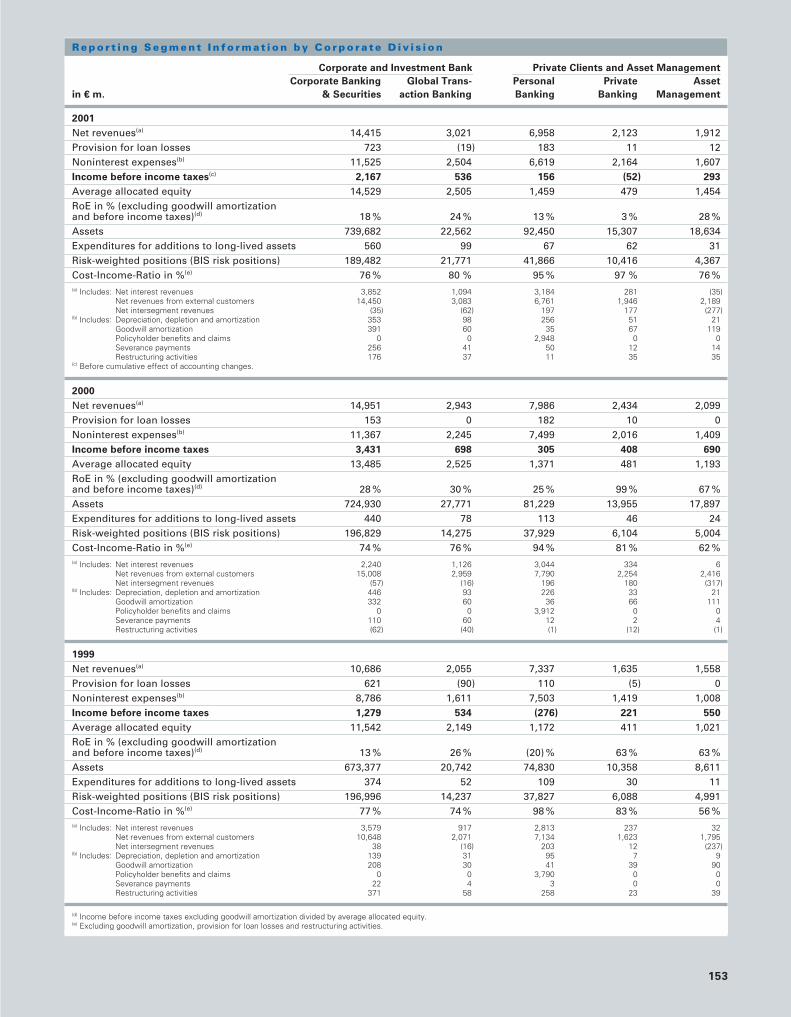
153
R e p o r t i n g S e g m e n t I n f o r m a t i o n b y C o r p o r a t e D i v i s i o n
Corporate and Investment Bank Private Clients and Asset Management
Corporate Banking Global Trans- Personal Private Asset
in € m. & Securities action Banking Banking Banking Management
2001
Net revenues(a) 14,415 3,021 6,958 2,123 1,912Provision for loan losses 723 (19) 183 11 12Noninterest expenses(b) 11,525 2,504 6,619 2,164 1,607Income before income taxes(c) 2,167 536 156 (52) 293
Average allocated equity 14,529 2,505 1,459 479 1,454RoE in % (excluding goodwill amortization and before income taxes)(d) 18 % 24 % 13 % 3 % 28 %Assets 739,682 22,562 92,450 15,307 18,634Expenditures for additions to long-lived assets 560 99 67 62 31Risk-weighted positions (BIS risk positions) 189,482 21,771 41,866 10,416 4,367Cost-Income-Ratio in %(e) 76 % 80 % 95 % 97 % 76 %(a) Includes: Net interest revenues 3,852 1,094 3,184 281 (35)
Net revenues from external customers 14,450 3,083 6,761 1,946 2,189Net intersegment revenues (35) (62) 197 177 (277)
(b) Includes: Depreciation, depletion and amortization 353 98 256 51 21Goodwill amortization 391 60 35 67 119Policyholder benefits and claims 0 0 2,948 0 0Severance payments 256 41 50 12 14Restructuring activities 176 37 11 35 35
(c) Before cumulative effect of accounting changes.
2000
Net revenues(a) 14,951 2,943 7,986 2,434 2,099Provision for loan losses 153 0 182 10 0Noninterest expenses(b) 11,367 2,245 7,499 2,016 1,409Income before income taxes 3,431 698 305 408 690
Average allocated equity 13,485 2,525 1,371 481 1,193RoE in % (excluding goodwill amortizationand before income taxes)(d) 28 % 30 % 25 % 99 % 67 %Assets 724,930 27,771 81,229 13,955 17,897Expenditures for additions to long-lived assets 440 78 113 46 24Risk-weighted positions (BIS risk positions) 196,829 14,275 37,929 6,104 5,004Cost-Income-Ratio in %(e) 74 % 76 % 94 % 81 % 62 %(a) Includes: Net interest revenues 2,240 1,126 3,044 334 6
Net revenues from external customers 15,008 2,959 7,790 2,254 2,416Net intersegment revenues (57) (16) 196 180 (317)
(b) Includes: Depreciation, depletion and amortization 446 93 226 33 21Goodwill amortization 332 60 36 66 111Policyholder benefits and claims 0 0 3,912 0 0Severance payments 110 60 12 2 4Restructuring activities (62) (40) (1) (12) (1)
1999
Net revenues(a) 10,686 2,055 7,337 1,635 1,558Provision for loan losses 621 (90) 110 (5) 0Noninterest expenses(b) 8,786 1,611 7,503 1,419 1,008Income before income taxes 1,279 534 (276) 221 550
Average allocated equity 11,542 2,149 1,172 411 1,021RoE in % (excluding goodwill amortizationand before income taxes)(d) 13 % 26 % (20) % 63 % 63 %Assets 673,377 20,742 74,830 10,358 8,611Expenditures for additions to long-lived assets 374 52 109 30 11Risk-weighted positions (BIS risk positions) 196,996 14,237 37,827 6,088 4,991Cost-Income-Ratio in %(e) 77 % 74 % 98 % 83 % 56 %(a) Includes: Net interest revenues 3,579 917 2,813 237 32
Net revenues from external customers 10,648 2,071 7,134 1,623 1,795Net intersegment revenues 38 (16) 203 12 (237)
(b) Includes: Depreciation, depletion and amortization 139 31 95 7 9Goodwill amortization 208 30 41 39 90Policyholder benefits and claims 0 0 3,790 0 0Severance payments 22 4 3 0 0Restructuring activities 371 58 258 23 39
(d) Income before income taxes excluding goodwill amortization divided by average allocated equity.(e) Excluding goodwill amortization, provision for loan losses and restructuring activities.

154
The following tables present the revenue components of
the Corporate and Investment Bank Group Division and
the Private Clients and Asset Mangement Group Division
for the years ended December 31, 2001, 2000 and 1999:
Corporate and Investment Bank
in € m. 2001 2000 1999
Sales & Trading(debt and other products) 5,856 4,462 3,627
Sales & Trading (equity) 3,656 4,523 2,364
Sales & Trading 9,512 8,985 5,991
Loan products 3,365 4,021 3,164
Transaction services 3,021 2,943 2,055
Origination (debt) 429 286 197
Origination (equity) 492 937 443
Origination 921 1,223 640
Advisory 568 879 585
Other 49 (157) 306
Total 17,436 17,894 12,741
Private Clients and Asset Management
in € m. 2001 2000 1999
Insurance business 3,485 4,458 4,268
Portfolio/fund management 2,191 2,658 1,930
Loan/deposit products 2,393 2,286 2,077
Advisory 1,554 2,035 1,283
Transaction fees 633 615 623
Other 737 467 349
Total 10,993 12,519 10,530
Reconciliation of the results of the business seg-
ments to the consolidated financial statements.
The following table and discussion provide a reconciliation
of the total results of operations and total assets of the
Group’s business segments under management reporting
to the consolidated financial statements prepared in accor-
dance with U.S. GAAP.
2001 2000 1999
Total Adjust- Total Total Adjust- Total Total Adjust- Total
Manage- ments consoli- Manage- ments consoli- Manage- ments consoli-
ment dated ment dated ment dated
in € m. Reporting (U.S.GAAP) Reporting (U.S.GAAP) Reporting (U.S.GAAP)
Net revenues(a) 30,397 (776) 29,621 33,961 518 34,479 25,919 (887) 25,032
Provision for loan Losses 1,015 9 1,024 477 1 478 699 26 725
Noninterest expenses 26,042 752 26,794 25,918 1,214 27,132 20,955 1,001 21,956
Income before
income taxes(b) 3,340 (1,537) 1,803 7,566 (697) 6,869 4,265 (1,914) 2,351
Total assets 896,800 21,422 918,222 885,796 43,198 928,994 794,142 81,647 875,789
(a) Net interest revenues and noninterest revenues.(b) In 2001, before cumulative effect of accounting changes.

155
Consolidated Financial Statements
There are two primary categories of adjustments which
we record to reconcile the total results according to man-
agement reporting to the consolidated U.S. GAAP financial
statements. These adjustments include differences in
accounting methods used for management reporting
versus U.S. GAAP and adjustments relating to activities
outside the management responsibility of the business
segments.
Net revenues. Negative adjustments to net revenues
totaled € 0.8 billion in 2001. Significant negative adjust-
ments due to different accounting methods used
for management reporting versus U.S. GAAP included
approximately € 0.2 billion for equity method investments,
approximately € 0.2 billion for tax credits on dividends and
approximately € 0.2 billion for the elimination of income
earned on own bonds. They were partly offset by positive
adjustments of approximately € 0.2 billion for entities
which were not consolidated for management reporting
purposes. The remaining negative adjustments were
mainly due to a loss of approximately € 0.3 billion from
internally hedging stock compensation plans.
Adjustments to net revenues totaled € 0.5 billion in
2000. Significant adjustments related to different account-
ing methods used for management reporting versus
U.S. GAAP included approximately € 0.2 billion for equity
method investments and approximately € 0.6 billion for
entities which were not consolidated for management
reporting purposes. The remaining negative adjustments
of € 0.3 billion were due to other accounting differences
and to corporate items outside the management responsi-
bility of the business segments.
Negative adjustments to net revenues totaled
€ 0.9 billion in 1999. Significant negative adjustments relat-
ed to different accounting methods used for management
reporting versus U.S. GAAP included approximately
€ 0.1 billion for equity method investments, approximately
€ 0.2 billion for the elimination of income earned on own
bonds and approximately € 0.4 billion for entities which
were not consolidated for management reporting purpos-
es. The remaining negative adjustments of € 0.2 billion
were due to other accounting differences and to corporate
items outside the management responsibility of the busi-
ness segments.
Any item relating to different accounting methods
used for management reporting versus U.S. GAAP not
appearing in each of the years 2001, 2000 and 1999 was
included in other accounting differences as the amounts
were not significant.
Provision for loan losses. The adjustments primarily
reflected provisions for loan losses, none of which was
individually material, which are not under the management
responsibility of the business segments.
Noninterest expenses. Adjustments to noninterest
expenses totaled € 0.8 billion in 2001. Significant adjust-
ments due to different accounting methods used for man-
agement reporting versus U.S. GAAP included approxi-
mately € 0.4 billion for share compensation expense
(including the buy-out costs for the Global Equity Plan),
approximately € 0.2 billion for entities not consolidated
for management reporting purposes, approximately
€ 0.1 billion for timing differences in the recognition and
presentation of restructuring activities, approximately
€ 0.1 billion expenses for minority interests and approxi-
mately € 0.1 billion for goodwill amortization expense. The
remaining positive adjustment of € 0.1 billion was connect-
ed with internally hedging stock compensation plans.

Adjustments to noninterest expenses totaled € 1.2 bil-
lion in 2000. Significant adjustments related to different
accounting methods used for management reporting ver-
sus U.S. GAAP included approximately € 0.4 billion for
share compensation expense, approximately € 0.4 billion
for timing differences in the recognition and presentation
of restructuring activities, approximately € 0.2 billion for
entities not consolidated for management reporting pur-
poses, approximately € 0.1 billion expenses for minority
interests and approximately € 0.1 billion for goodwill amorti-
zation expense.
Adjustments to noninterest expenses totaled € 1.0 bil-
lion in 1999. Significant adjustments related to different
accounting methods used for management reporting ver-
sus U.S. GAAP included approximately € 0.2 billion for
share compensation expense, approximately € 0.2 billion
for timing differences in the recognition and presentation
of restructuring activities, approximately € 0.1 billion for
entities not consolidated for management reporting pur-
poses and approximately € 0.1billion for expenses for
minority interests. The remaining adjustments of € 0.4 bil-
lion were due to other accounting differences and to cor-
porate items outside the management responsibility of
the business segments.
Any item relating to different accounting methods
used for management reporting versus U.S. GAAP not
appearing in each of the years 2001, 2000 and 1999 was
included in other accounting differences as the amounts
were not significant.
Assets. The adjustments primarily consist of assets that
are not allocated to the business segments, including
deferred tax assets and premises and equipment.
Net revenues (including provision for loan losses) by
geographical location
The following table presents net revenues (including provi-
sion for loan losses) by geographical location prepared
according to U.S. GAAP:
156
in € m. 2001 2000 1999
Germany 12,788 14,295 12,885
Europe (excluding Germany) 7,429 9,739 5,023
North America (primarily U.S.) 6,186 7,585 4,711
South America 211 181 235
Asia-Pacific(a) 1,983 2,201 1,453
Consolidated net revenues(b) 28,597 34,001 24,307
(a) Includes revenues from Africa, which were not material in 2001, 2000 and 1999.(b) Consolidated net revenues include net interest revenues after provision for loan losses and noninterest revenues. Revenues are attributed to countries based on the location in
which entities are located.

157
[27] International Operations
The following table presents asset and income statement
information by major geographic area. The information
presented has been classified based primarily on the loca-
tion of the Group’s office in which the assets and transac-
tions are recorded. However, due to the highly integrated
nature of the Group’s operations, estimates and assump-
tions have been made to allocate items between regions.
Consolidated Financial Statements
2001 Total Total Total Income/(loss) Net income/
in € m. assets revenues(a) expenses(a) before taxes(c) (loss)
Europe (excluding Germany) 311,711 23,919 22,918 1,001 522
North America (primarily U.S.) 237,456 21,874 22,429 (555) (811)
South America 2,433 816 708 108 41
Asia-Pacific(b) 58,487 4,875 4,723 152 7
International operations 610,087 51,484 50,778 706 (241)
Domestic operations (Germany) 308,135 23,156 22,059 1,097 408
Total 918,222 74,640 72,837 1,803 167
International as a percentage of total above 66 % 69 % 70 % 39 % N/M(a) Total revenues include interest revenues and noninterest revenues. Total expenses include interest expenses, noninterest expenses and provision for loan losses.(b) Includes balance sheet and income statement data from Africa, which were not material in 2001.(c) Before cumulative effect of accounting changes.N/M – Not meaningful
2000 Total Total Total Income Net income
in € m. assets revenues(a) expenses(a) before taxes
Europe (excluding Germany) 319,664 25,723 23,099 2,624 1,854
North America (primarily U.S.) 256,260 25,402 23,912 1,490 1,030
South America 1,475 759 701 58 52
Asia-Pacific(b) 69,865 5,470 5,128 342 203
International operations 647,264 57,354 52,840 4,514 3,139
Domestic operations (Germany) 281,730 25,228 22,873 2,355 10,374
Total 928,994 82,582 75,713 6,869 13,513
International as a percentage of total above 70 % 69 % 70 % 66 % 23 %(a) Total revenues include interest revenues and noninterest revenues. Total expenses include interest expense, noninterest expenses and provision for loan losses.(b) Includes balance sheet and income statement data from Africa, which were not material in 2000.

[28] Derivative Financial Instruments and
Financial Instruments with Off-Balance
Sheet Risk
In the normal course of business, the Group enters into a
variety of derivative transactions for both trading and non-
trading purposes. The Group’s objectives in using derivative
instruments are to meet customers’ needs, to manage the
Group’s exposure to risks and to generate revenues through
trading activities. Derivative contracts used by the Group
in both trading and non-trading activities include swaps,
futures, forwards, options and other similar types of con-
tracts based on interest rates, foreign exchange rates and
the prices of equities and commodities (or related indices).
Derivatives held or issued for trading purposes
The Group trades derivative instruments on behalf of cus-
tomers and for its own positions. The Group transacts
derivative contracts to address customer demands both as
a market maker in the wholesale markets and in structuring
tailored derivatives for customers. The Group also takes
proprietary positions for its own accounts. Trading derivative
products include swaps, options, forwards and futures and
a variety of structured derivatives which are based on inter-
est rates, equities, credit, foreign exchange and commodi-
ties.
Derivatives held or issued for non-trading purposes
Derivatives held or issued for non-trading purposes primari-
ly consist of interest rate swaps used to manage interest
rate risk. Through the use of these derivatives, the Group is
able to modify the volatility and interest rate characteristics
of its non-trading interest-earning assets and interest-bear-
ing liabilities. The Group is subject to risk from interest rate
fluctuations to the extent that there is a gap between the
amount of interest-earning assets and the amount of inter-
est-bearing liabilities that mature or reprice in specified
periods. The Group actively manages this interest rate risk
through, among other things, the use of derivative con-
tracts. Utilization of derivative financial instruments is modi-
fied from time to time within prescribed limits in response
to changing market conditions, as well as changes in the
characteristics and mix of the related assets and liabilities.
The Group also uses cross-currency interest rate
swaps to hedge both foreign currency and interest rate
risks from securities available for sale.
For these hedges, the Group applies either fair value
or cash flow hedge accounting when cost beneficial. When
hedging only interest rate risk, fair value hedge accounting
is applied for hedges of assets or liabilities with fixed inter-
est rates, and cash flow hedge accounting is applied for
hedges of floating interest rates. When hedging both for-
eign currency and interest rate risks, cash flow hedge
158
1999 Total Total Total Income (loss) Net income
in € m. assets revenues(a) expenses(a) before taxes (loss)
Europe (excluding Germany) 253,310 15,665 16,222 (557) (591)
North America (primarily U.S.) 241,433 15,207 15,121 86 (404)
South America 1,818 830 717 113 104
Asia-Pacific(b) 86,440 4,009 4,040 (31) (39)
International operations 583,001 35,711 36,100 (389) (930)
Domestic operations (Germany) 292,788 21,469 18,729 2,740 2,543
Total 875,789 57,180 54,829 2,351 1,613
International as a percentage of total above 67 % 62 % 66 % N/M N/M(a) Total revenues include interest revenues and noninterest revenues. Total expenses include interest expense, noninterest expenses and provision for loan losses.(b) Includes balance sheet and income statement data from Africa, which were not material in 1999.N/M – Not meaningful

159
accounting is applied when all functional-currency-equiva-
lent cash flows have been fixed, otherwise fair value hedge
accounting is applied.
For the year ended December 31, 2001, net hedge
ineffectiveness from fair value hedges was a € 67 million
gain. As of December 31, 2001, the longest term cash flow
hedge outstanding matures in 2019.
Derivatives entered into for non-trading purposes that
do not qualify for hedge accounting are also classified as
trading assets and liabilities. These include interest rate
swaps, foreign exchange forwards and cross currency inter-
est rate swaps used to economically hedge interest and
foreign exchange risk, but for which it is not cost beneficial
to apply hedge accounting. Also included are negotiated
transactions related to the Group’s industrial holdings clas-
sified as available for sale, which the Group has entered
into for strategic and economic purposes despite the fact
that hedge accounting is precluded.
For the year ended December 31, 2001, net losses of
€ 27 million from non-trading equity derivatives used to
offset fluctuations in employee share-based compensation
expense were included in compensation and benefits.
Prior to January 1, 2001, most of the derivatives
entered into for non-trading purposes, although considered
effective as economic hedges, did not qualify for hedge
accounting mainly due to contemporaneous documentation
requirements that could not be fulfilled when initially adopt-
ing U.S. GAAP after the fact. Consequently, these deriva-
tives have been accounted for as trading derivatives, that is,
they are marked to market and the changes in fair value are
reported in trading revenues.
Financial Instruments with Off-Balance Sheet Credit
Risk
The Group utilizes various lending-related financial instru-
ments in order to meet the financing needs of its customers.
The Group issues commitments to extend credit, standby
and other letters of credit and guarantees. The contractual
amount of these instruments is the maximum amount at
risk for the Group if the customer fails to meet its obliga-
tions.
Off-balance sheet credit risk amounts are determined
without consideration of the value of any related collateral
and reflect the total potential loss on undrawn commitments
to extend credit, guarantees, standby and other letters of
credit and similar arrangements.
Consolidated Financial Statements
in € m. 31.12.2001 31.12.2000
Commitments to extend credit
Fixed rates 23,197 21,641
Variable rates 97,532 87,101
Guarantees, standby letters of credit and similar arrangements(a) 42,402 39,399
Commitments to purchase loans 1,265 352
Commitments to sell loans 2,999 351(a) Includes commitments to extend guarantees and letters of credit of € 3.2 billion and € 4.7 billion at December 31, 2001 and 2000, respectively.
This table does not include securities lending indemnifica-
tions issued to customers, which totaled € 42.2 billion and
€ 47.1 billion at December 31, 2001 and 2000, respectively.
These balances represent the fair value of customers’
securities loaned to third parties. The Group indemnifies
customers to the extent of the replacement cost and/or
the market value of the securities in the event of a failure
by a third party to return the securities loaned. The market
value of collateral, primarily cash, received for customers’
securities loaned is generally in excess of the contract
amounts and totaled approximately € 44.0 billion and
€ 49.0 billion at December 31, 2001 and 2000, respectively.
As of December 31, 2001, commitments to enter into
reverse repurchase and repurchase agreements amounted
to € 3.9 billion and € 7.1 billion, respectively.
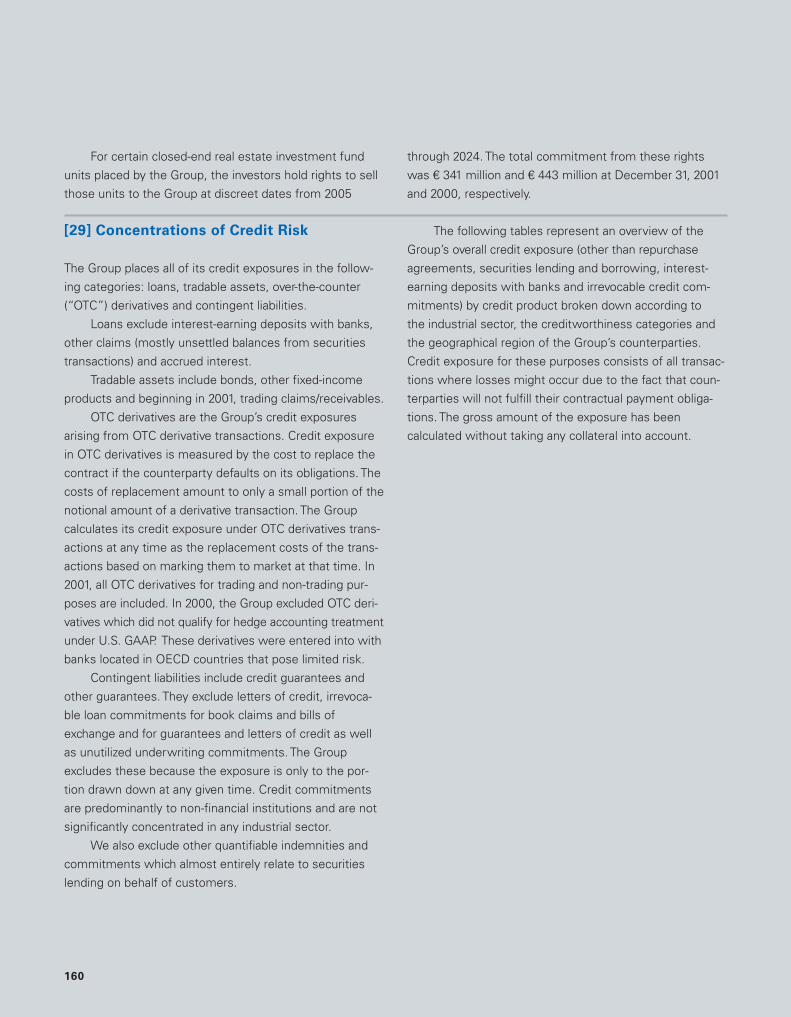
For certain closed-end real estate investment fund
units placed by the Group, the investors hold rights to sell
those units to the Group at discreet dates from 2005
through 2024. The total commitment from these rights
was € 341 million and € 443 million at December 31, 2001
and 2000, respectively.
160
[29] Concentrations of Credit Risk
The Group places all of its credit exposures in the follow-
ing categories: loans, tradable assets, over-the-counter
(“OTC”) derivatives and contingent liabilities.
Loans exclude interest-earning deposits with banks,
other claims (mostly unsettled balances from securities
transactions) and accrued interest.
Tradable assets include bonds, other fixed-income
products and beginning in 2001, trading claims/receivables.
OTC derivatives are the Group’s credit exposures
arising from OTC derivative transactions. Credit exposure
in OTC derivatives is measured by the cost to replace the
contract if the counterparty defaults on its obligations. The
costs of replacement amount to only a small portion of the
notional amount of a derivative transaction. The Group
calculates its credit exposure under OTC derivatives trans-
actions at any time as the replacement costs of the trans-
actions based on marking them to market at that time. In
2001, all OTC derivatives for trading and non-trading pur-
poses are included. In 2000, the Group excluded OTC deri-
vatives which did not qualify for hedge accounting treatment
under U.S. GAAP. These derivatives were entered into with
banks located in OECD countries that pose limited risk.
Contingent liabilities include credit guarantees and
other guarantees. They exclude letters of credit, irrevoca-
ble loan commitments for book claims and bills of
exchange and for guarantees and letters of credit as well
as unutilized underwriting commitments. The Group
excludes these because the exposure is only to the por-
tion drawn down at any given time. Credit commitments
are predominantly to non-financial institutions and are not
significantly concentrated in any industrial sector.
We also exclude other quantifiable indemnities and
commitments which almost entirely relate to securities
lending on behalf of customers.
The following tables represent an overview of the
Group’s overall credit exposure (other than repurchase
agreements, securities lending and borrowing, interest-
earning deposits with banks and irrevocable credit com-
mitments) by credit product broken down according to
the industrial sector, the creditworthiness categories and
the geographical region of the Group’s counterparties.
Credit exposure for these purposes consists of all transac-
tions where losses might occur due to the fact that coun-
terparties will not fulfill their contractual payment obliga-
tions. The gross amount of the exposure has been
calculated without taking any collateral into account.
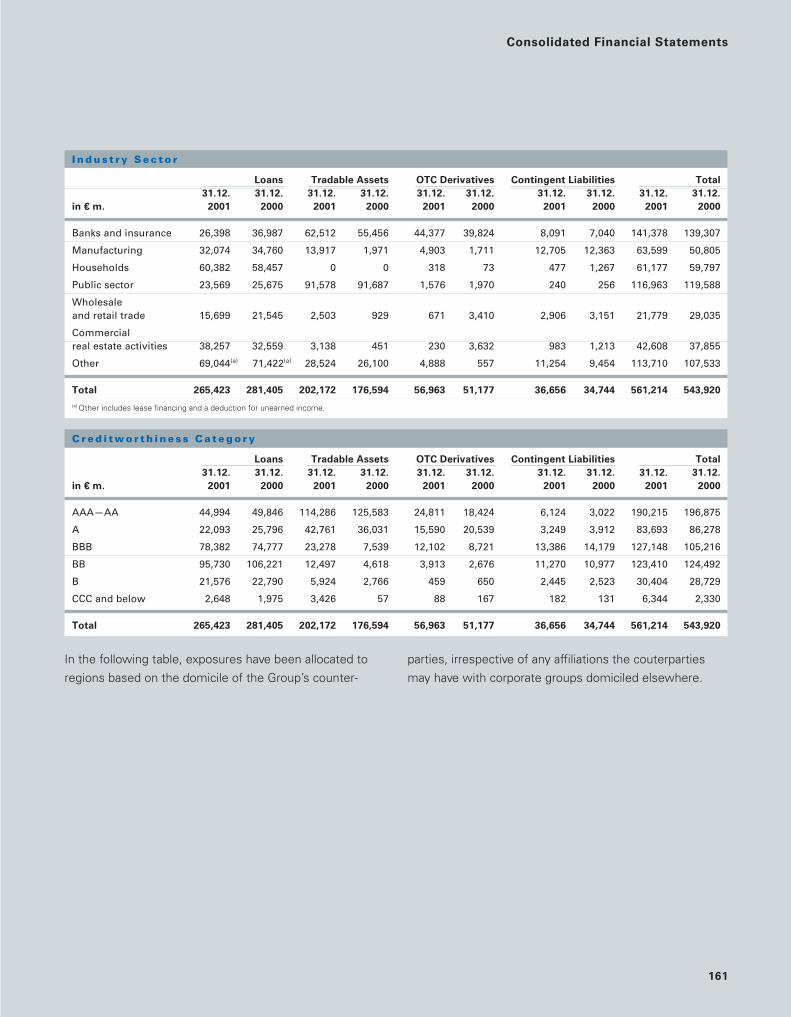
161
In the following table, exposures have been allocated to
regions based on the domicile of the Group’s counter-
parties, irrespective of any affiliations the couterparties
may have with corporate groups domiciled elsewhere.
Consolidated Financial Statements
I n d u s t r y S e c t o r
Loans Tradable Assets OTC Derivatives Contingent Liabilities Total
31.12. 31.12. 31.12. 31.12. 31.12. 31.12. 31.12. 31.12. 31.12. 31.12.
in € m. 2001 2000 2001 2000 2001 2000 2001 2000 2001 2000
Banks and insurance 26,398 36,987 62,512 55,456 44,377 39,824 8,091 7,040 141,378 139,307
Manufacturing 32,074 34,760 13,917 1,971 4,903 1,711 12,705 12,363 63,599 50,805
Households 60,382 58,457 0 0 318 73 477 1,267 61,177 59,797
Public sector 23,569 25,675 91,578 91,687 1,576 1,970 240 256 116,963 119,588
Wholesale and retail trade 15,699 21,545 2,503 929 671 3,410 2,906 3,151 21,779 29,035
Commercialreal estate activities 38,257 32,559 3,138 451 230 3,632 983 1,213 42,608 37,855
Other 69,044(a) 71,422(a) 28,524 26,100 4,888 557 11,254 9,454 113,710 107,533
Total 265,423 281,405 202,172 176,594 56,963 51,177 36,656 34,744 561,214 543,920
(a) Other includes lease financing and a deduction for unearned income.
C r e d i t w o r t h i n e s s C a t e g o r y
Loans Tradable Assets OTC Derivatives Contingent Liabilities Total
31.12. 31.12. 31.12. 31.12. 31.12. 31.12. 31.12. 31.12. 31.12. 31.12.
in € m. 2001 2000 2001 2000 2001 2000 2001 2000 2001 2000
AAA—AA 44,994 49,846 114,286 125,583 24,811 18,424 6,124 3,022 190,215 196,875
A 22,093 25,796 42,761 36,031 15,590 20,539 3,249 3,912 83,693 86,278
BBB 78,382 74,777 23,278 7,539 12,102 8,721 13,386 14,179 127,148 105,216
BB 95,730 106,221 12,497 4,618 3,913 2,676 11,270 10,977 123,410 124,492
B 21,576 22,790 5,924 2,766 459 650 2,445 2,523 30,404 28,729
CCC and below 2,648 1,975 3,426 57 88 167 182 131 6,344 2,330
Total 265,423 281,405 202,172 176,594 56,963 51,177 36,656 34,744 561,214 543,920

[30] Fair Value of Financial Instruments
SFAS 107, “Disclosures about Fair Value of Financial Instru-
ments,” requires the disclosure of fair value information
about financial instruments, whether or not recognized in
the balance sheet, for which it is practicable to estimate
that value. Quoted market prices, when available, are used
as the measure of fair value. In cases where quoted mar-
ket prices are not available, fair values are based on pre-
sent value estimates or other valuation techniques. These
derived fair values are significantly affected by assump-
tions used, principally the timing of future cash flows and
the discount rate. Because assumptions are inherently
subjective in nature, the estimated fair values cannot be
substantiated by comparison to independent market
quotes and, in many cases, the estimated fair values
would not necessarily be realized in an immediate sale or
settlement of the instrument. The disclosure requirements
of SFAS 107 exclude certain financial instruments and all
nonfinancial instruments (e.g., franchise value of business-
es). Accordingly, the aggregate fair value amounts present-
ed do not represent management’s estimation of the
underlying value of the Group.
162
C r e d i t R i s k P r o f i l e b y R e g i o n
Loans Tradable Assets OTC Derivatives Contingent Liabilities Total
31.12. 31.12. 31.12. 31.12. 31.12. 31.12. 31.12. 31.12. 31.12. 31.12.
in € m. 2001 2000 2001 2000 2001 2000 2001 2000 2001 2000
Eastern Europe 2,334 3,460 1,659 1,291 762 279 573 691 5,328 5,721
Western Europe 205,981 221,112 93,233 97,066 30,956 26,332 26,065 24,995 356,235 369,505
Africa 324 300 993 597 669 463 266 384 2,252 1,744
Asia/Pacific 13,035 13,481 29,315 18,426 6,143 7,475 3,077 3,210 51,570 42,592
North America 39,817 38,921 70,967 50,495 17,236 13,152 6,150 4,562 134,170 107,130
Central and South America 3,884 4,101 4,177 2,593 1,080 3,088 516 902 9,657 10,684
Other(a) 48 30 1,828 6,126 117 388 9 0 2,002 6,544
Total 265,423 281,405 202,172 176,594 56,963 51,177 36,656 34,744 561,214 543,920
(a) Includes supra-national organizations and other exposures that have not been allocated to a single region.

163
The following are the estimated fair values of the
Group’s financial instruments recognized on the Consoli-
dated Balance Sheet, followed by a general description of
the methods and assumptions used to estimate such fair
values.
Consolidated Financial Statements
Carrying Amount Fair Value
in € m. 31.12.2001 31.12.2000 31.12.2001 31.12.2000
Financial Assets
Cash and due from banks/Central bank funds sold 10,392 8,742 10,392 8,742
Interest-earning deposits with banks 37,986 46,733 38,086 46,761
Securities purchased under resale agreements and securities borrowed 143,999 128,941 144,003 128,941
Trading assets 293,653 284,871 293,653 284,871
Securities available for sale 71,666 92,250 71,666 92,250
Other investments 6,221 7,604 6,225 7,605
Loans (excluding leases), net 256,194 267,046 259,235 268,861
Other financial assets 62,275 52,379 62,275 52,379
Financial Liabilities
Noninterest-bearing deposits 29,731 28,615 29,731 28,615
Interest-bearing deposits 344,358 321,937 344,357 321,966
Trading liabilities 121,329 123,951 121,329 123,951
Securities sold under repurchase agreements and securities loaned 80,919 82,564 80,912 82,564
Other short-term borrowings 28,548 60,871 28,499 60,999
Other financial liabilities 68,950 76,794 68,950 76,794
Long-term debt(a) 170,984 158,397 172,138 158,715
Other positions
Contingent liabilities(b) 42,402 39,399 42,402 39,407
Commitments to extend credit 120,729 108,742 120,694 108,800(a) Includes trust preferred securities.(b) Includes commitments to extend guarantees and letters of credit.

Methods and Assumptions
For short-term financial instruments, defined as those with
remaining maturities of 90 days or less, the carrying
amounts were considered to be a reasonable estimate of
fair value. The following instruments were predominantly
short-term:Assets
Cash and due from banks
Central bank funds sold
Interest-earning deposits with banks
Securities purchased under resale agreements and securities borrowed
Other financial assets
Liabilities
Interest-bearing deposits
Securities sold under repurchase agreements and securities loaned
Other short-term borrowings
Other financial liabilities
For those components of the above listed financial instru-
ments with remaining maturities greater than 90 days, fair
value was determined by discounting contractual cash
flows using rates which could be earned for assets with
similar remaining maturities and, in the case of liabilities,
rates at which the liabilities with similar remaining maturi-
ties could be issued as of the balance sheet date.
Trading assets/liabilities (including derivatives) and
securities available for sale are carried at their fair values.
For short-term loans and variable rate loans which
reprice within 90 days, the carrying value was considered
to be a reasonable estimate of fair value. For those loans
for which quoted market prices were available, fair value
was based on such prices. For other types of loans, fair
value was estimated by discounting future cash flows
using the current rates at which similar loans would be
made to borrowers with similar credit ratings and for the
same remaining maturities. In addition, specific loss com-
ponent, including recoverable amounts of collateral, were
considered in the fair value determination of loans. The fair
value estimate of commitments to extend credit, standby
and other letters of credit and guarantees represented the
unrealized gains and losses on those off-balance sheet
positions and was generally determined in the same man-
ner as loans. Other investments consist primarily of invest-
ments in equity instruments (excluding, in accordance
with SFAS 107, investments accounted for under the equi-
ty method).
Other financial assets consisted primarily of accounts
receivable, accrued interest receivable, cash and cash
margins with brokers and due from customers on accep-
tance.
Noninterest-bearing deposits do not have defined
maturities. Fair value represents the amount payable on
demand as of the balance sheet date.
Other financial liabilities consisted primarily of
accounts payable, accrued interest payable, accrued
expenses and acceptances outstanding.
The fair value of long-term debt and trust preferred
securities was estimated by using market quotes, as well
as discounting the remaining contractual cash flows using
a rate at which the Group could issue debt with a similar
remaining maturity as of the balance sheet date.
164
[31] Litigation
Due to the nature of its business, the Group is involved in
litigation and arbitration proceedings in Germany and in a
number of jurisdictions outside Germany, including the
United States, arising in the ordinary course of business.
While it is not feasible to predict or determine the ultimate
outcome of all pending or threatened legal and regulatory
proceedings, the Group does not believe that the outcome
of these proceedings, including the litigation described
below relating to the acquisition of Bankers Trust, will have
a material adverse effect on the Group’s financial condition
or results of operations.
On April 12, 1999, Deutsche Bank AG and Dr. Rolf-E.
Breuer, Spokesman of the Group’s Board of Managing
Directors, were sued in the U.S. District Court for the
Southern District of New York in a securities class action
complaint on behalf of all persons who sold Bankers Trust
common stock or call options or who purchased put
options on the open market during the period from Octo-

165
ber 26, 1998 through November 20, 1998. The complaint
alleges that Deutsche Bank and Dr. Breuer violated the
United States securities laws by making untrue
statements of material fact and omitting to state material
facts about negotiations to acquire Bankers Trust. The
plaintiffs claim damages of approximately U.S.$ 128 mil-
lion. On March 6, 2000, the court denied the defendants’
motion to dismiss. Discovery is close to completion. On
February 1, 2002, the court denied the motions of both
parties for summary judgment and ordered trial to start on
June 24, 2002.
Consolidated Financial Statements
[32] Terrorist Attacks in the United States
As a result of the terrorist attacks in the United States on
September 11, 2001, the Group’s office buildings located at
130 Liberty Street and 4 Albany Street in New York were
damaged. The Group’s employees located at these office
buildings, in addition to employees located in leased prop-
erties at 4 World Trade Center and 14–16 Wall Street were
relocated to contingency premises. The global financial
and certain other industries were immediately adversely
impacted which in turn had an adverse impact on the
results of operations of the Group.
The Group is currently evaluating the future plans for
the building located at 130 Liberty Street, which was
severely damaged due to the destruction of the World
Trade Center. The Group’s building at 4 Albany Street,
which was less severely damaged, is being renovated,
although no timetable for reoccupation has been estab-
lished. Employees based at 14–16 Wall Street have
returned to their offices. The Group accelerated its occupa-
tion of a 47-story building at 60 Wall Street, which the
Group acquired in November 2001. The leased property
and all leasehold improvements at 4 World Trade Center
were destroyed.
The Group continues to evaluate the costs that it will
incur and the adverse impact of the terrorist attacks on its
results of operations. Such costs will include, but are not
limited to, write-offs of fixed assets, costs to repair the
buildings, expenses incurred to replace fixed assets that
were damaged, relocation expenses, and the abatement
of the contamination of its buildings adjacent to the World
Trade Center site. The Group expects to make a claim
for these costs, including those related to business inter-
ruption, through its insurance policies, which have cover-
age limits of U.S.$ 1.7 billion in total damages and a
U.S.$ 750 million sublimit for business interruption, ser-
vice interruption and extra expense. The Group believes
that it will recover substantially all of these costs under its
insurance policies, but there can be no assurance that all
of the costs incurred, losses from business interruption,
losses from service interruption or extra expenses will be
paid by the insurance carriers, as they may dispute por-
tions of the Group’s claims. At December 31, 2001, no
losses have been recorded by the Group.

The wide variety of our businesses requires us to identify,
measure, aggregate and manage our risks effectively, and
to allocate our capital among our businesses appropriately.
We manage risk through a framework of risk principles,
organizational structures and risk measurement and moni-
toring processes that are closely aligned with the activities
of our Group Divisions.
Risk Management Principles
The following key principles underpin our approach to risk
management:
– Our Group Board provides overall risk management
oversight for our consolidated Group as a whole. Our
Supervisory Board regularly monitors our risk profile.
– Our Group Risk Committee has responsibility for man-
aging our risks.
– We manage credit, market, liquidity, operational and
business risks in a coordinated manner at all levels
within our organization.
– The structure of our global risk management depart-
ment is closely aligned with the structure of our Group
Divisions.
– The risk management function is independent of our
Group Divisions.
Risk Management Organization
Our Group Chief Risk Officer, who is a member of our
Group Board, is responsible for all risk management
activities within our consolidated Group. The Group Chief
Risk Officer chairs our Group Risk Committee. Each of our
Group Divisions has a divisional Chief Risk Officer, who
sits on the Group Risk Committee and reports directly to
the Group Chief Risk Officer. The Group Risk Committee
has the mandate to:
– define our risk appetite in a manner that is consistent
with our overall business strategies;
– approve risk policies, procedures and methodologies
that are consistent with our risk appetite;
– manage the portfolio of risks throughout our organiza-
tion;
– allocate our economic capital (which we describe
below) among our businesses in a rational manner that
is consistent with the amount of risk we assume; and
– approve the organizational structure of our risk manage-
ment department and appoint its key management
personnel.
Each of our Group Divisions then has a divisional risk unit,
which reports to the divisional Chief Risk Officer. Each
divisional risk unit has the mandate to:
– ensure that the business conducted within its division
is consistent with the risk appetite the Group Risk Com-
mittee has set;
– formulate and implement risk policies, procedures and
methodologies that are appropriate to the businesses
within its division;
– approve credit risk, market risk and operational risk
limits;
– conduct periodic portfolio reviews to ensure that the
portfolio of credit risks is within acceptable parameters;
and
– develop and implement risk management infrastruc-
tures and systems that are appropriate for its division.
Our controlling, audit and legal departments support our
risk management function. They operate independently
both of the divisions and of the risk management depart-
ment. Controlling’s role is to quantify the risk we have
assumed and ensure the quality and integrity of our risk-
related data. Audit reviews the compliance of our internal
control procedures with internal and regulatory standards.
Legal provides legal advice and support on topics ranging
from collateral arrangements to netting.
We realigned our risk management responsibilities
in February 2001 to match the divisional realignment we
announced at that time. The essential risk management
functions and responsibilities have not changed.
Risk Report
166

167
Categories of Risk
The most important risks we assume are specific banking
risks and risks arising from the general business environ-
ment. We also assume risks in our insurance companies.
Specific Banking Risks. Our risk management processes
distinguish among four kinds of specific banking risks:
credit risk, market risk, liquidity risk and operational risk.
– Credit risk arises from all transactions that give rise to
actual, contingent or potential claims against any coun-
terparty, obligor or borrower (which we refer to collec-
tively as “counterparties”). This is the largest single risk
we face. We distinguish among three kinds of credit
risk:
– Default risk is the risk that counterparties fail to meet
contractual payment obligations.
– Country risk is the risk that counterparties are unable
to fulfil their payment obligations as a result of gov-
ernment measures (such as currency transfer restric-
tions) or country-specific economic factors (such as
currency devaluations).
– Settlement risk is the risk that the settlement or clear-
ance of transactions will fail. It arises whenever the
exchange of cash, securities and/or other assets is
not simultaneous.
– Market risk arises from the uncertainty concerning
changes in market prices and rates (including interest
rates, equity prices, foreign exchange rates and com-
modity prices), the correlations among them and their
levels of volatility.
– Liquidity risk is the risk to our earnings and capital
arising from our potential inability to meet obligations
when they are due without incurring unacceptable
losses.
– Operational risk is the potential for incurring losses in
relation to staff, technology, projects, assets, customer
relationships, other third parties or regulators, such as
through unmanageable events, business disruption,
inadequately defined or failed processes or control/sys-
tem failure.
General Business Risk. General business risk describes
the risks that changes in general business conditions, such
as our market environment, client behavior and technologi-
cal progress, can cause. These can affect our earnings if
we are unable to quickly adjust to changing conditions.
Insurance-Specific Risks. Insurance-specific risks arise in
the context of our insurance business. They consist of
accidental risk and change risk.
– Accidental risk arises from the risk that we may, due to
the random occurrence of insured events, have to pay
out more claims than expected.
– Change risk is the risk that, as overall conditions or the
behavior of insured persons change, we do not recog-
nize these changes promptly and allow for them by
adjusting our insurance premiums or the terms on
which we write insurance policies.
Risk Management Tools
We use a comprehensive range of quantitative tools and
metrics for monitoring and managing risks. Some of these
tools are common to a number of risk categories, while
others are tailored to the particular features of specific risk
categories. These quantitative tools and metrics generate
the following kinds of information:
– information that quantifies the susceptibility of the mar-
ket value of single positions or portfolios to changes in
market parameters (commonly referred to as sensitivity
analysis);
– information that measures aggregate risk using statisti-
cal techniques, taking into account the interdependen-
cies and correlations between individual risks; and
– information that quantifies exposures to losses that
could arise from extreme movements in market prices
or rates, using scenario analysis to simulate crisis
situations.
– We also calculate risk data for regulatory purposes.
As a matter of policy, we continuously assess the appro-
priateness and the reliability of our quantitative tools and
metrics in the light of our changing risk environment. The
following are the most important quantitative tools and
Risk Report

metrics we currently use to measure, manage and report
our risk:
Economic Capital. We rely on our book capital, meaning
the amount of equity capital that appears in our balance
sheet, to absorb any losses that result from the risks we
assume in our businesses. We use economic capital as
our primary tool to allocate our book capital among our
businesses. We also use it to assess their profitability and
their relative abilities to employ capital efficiently. Eco-
nomic capital is a measure designed to state with a high
degree of certainty the amount of equity capital we need
at any given date to absorb unexpected losses arising
from our exposures on that date. We use it to show an
aggregated view of our risk position from individual busi-
ness lines up to our consolidated Group level.
We calculate economic capital for the default risk,
country transfer risk and settlement risk elements of cred-
it risk, for market risk, for operational risk and for general
business risk. We have not calculated economic capital for
liquidity risk, the risk at our insurance companies nor the
industrial holdings of DB Investor, each of which we cover
using other risk management tools.
Value-at-Risk. We use value-at-risk analysis to measure
and manage market risks in both our trading and our non-
trading portfolios. Our value-at-risk (or VAR) figures play
a role in both internal and external (regulatory) reporting.
The value-at-risk approach is used to derive a quantitative
measure specifically for market risks under normal market
conditions. For a given portfolio, value-at-risk measures
the possible future loss (in terms of market value) which,
under normal market conditions, will not be exceeded with
a defined probability in a certain period. The value-at-risk
for a total portfolio represents a measure of our aggre-
gated market risk in that portfolio.
Stress Testing. We supplement our analysis of market risk
with stress testing. Stress tests help us determine the
effects of potentially extreme market developments on
the market values of our assets. We use stress testing to
determine the amount of economic capital we need to
allocate to cover our market risk exposure under extreme
market conditions.
Expected Loss. We use expected loss as a measure of
the default and country transfer risk parts of our credit
risk. Expected loss quantifies the loss we expect from
credit defaults within a one-year period based on historical
data we have gathered from our credit-related business.
Regulatory Risk Reporting. German banking regulations
assess our capacity to assume risk in several ways:
– Risk position. The total risk we have assumed, which
we calculate according to regulations by risk-weighting
our assets for credit risks and market risks. The German
Banking Supervisory Authority permits us to use our
proprietary value-at-risk approach to calculate the mar-
ket risk component. Our risk position must be backed
by capital such that we maintain the required regulatory
capital ratios.
– Regulatory capital and reserves. The regulatory capital
we must maintain to back our risk position.
168
169
Credit Risk
Credit risk makes up the largest part of our risk exposures.
Our credit risk management follows these principles:
– Every extension of credit to any counterparty requires
approval at the appropriate (pre-established) seniority
level.
– All of our Group Divisions must apply consistent stan-
dards in arriving at their credit decisions.
– The approval of credit limits for counterparties and the
management of our individual credit exposures must fit
within our portfolio guidelines and our credit strategies,
and each decision must also be justified on a risk-ver-
sus-return basis.
– Every material change to a credit facility (such as of its
tenor, collateral structure or major covenants) requires
approval at the appropriate (pre-established) level.
– We assign credit approval authorities to individuals
according to their qualifications, experience and training,
and we review these periodically.
– We measure and consolidate all our credit exposures to
each obligor on a global, consolidated basis that applies
across our consolidated Group. We define an “obligor”
as a group of individual borrowers or counterparties that:
– are linked to one another by any of a number of crite-
ria we have established, including capital ownership,
voting rights, demonstrable control or other indication
of group affiliation;
– are jointly and severally liable for all or significant por-
tions of the credit we have extended; and/or
– whose commercial and economic interests are inter-
dependent.
Credit Risk Ratings
A primary element of the credit approval process is a
detailed risk assessment of every credit exposure associ-
ated with an obligor. Our risk assessment procedures
consider both the creditworthiness of the counterparty
and the risks related to the specific type of credit facility or
exposure. The resulting risk rating not only affects the
outcome of the credit decision, but also influences the
level of decision-making authority we require to extend the
credit, the terms and conditions of the transaction and the
monitoring procedures we apply to the ongoing exposure.
Whenever possible, we review the external risk rat-
ings that recognized risk rating agencies assign to our
counterparties. However, we also have our own in-house
assessment methodologies and rating scales for evaluat-
ing our client groupings. When we assign our internal risk
ratings, we compare them for consistency with risk rat-
ings used by the major international rating agencies.
Credit Limits
Credit limits set forth maximum credit exposures we are
willing to assume over specified periods. They relate to
products, conditions of the exposure and other factors.
Exposure Measurement for Approval Purposes
In making credit decisions, we measure and consolidate
globally all exposures and facilities to the same obligor
that carry credit risk. This includes loans, repurchase
agreements, reverse repurchase agreements, letters of
credit, guarantees and derivative transactions. We exclude
exposures that we feel do not expose us to any significant
default risk, or that we handle under our policies relating
to other categories of risk such as settlement or market
risk. For approval purposes, we do not distinguish between
committed and uncommitted or advised and unadvised
facilities. We treat any prolongation of an existing credit
exposure as a new credit decision requiring the appropri-
ate procedures and approvals.
A written credit report forms the basis of every credit
decision we make. This report presents and assesses the
material information for a decision regarding a credit expo-
sure. A key component of the report is a risk assessment
of the credit exposure, which we describe in greater detail
above.
We generally update our credit reports annually. We
require credit reports for all initial credit approvals and for
subsequent internal reviews. They contain at a minimum
an overview of our relevant limits and exposures, a sum-
mary of our internal rating history of the counterparty, an
overview of the particular facilities, key financial data, a
Risk Report

short description of the reason for the report’s submission
and a summary credit risk assessment.
Our Overall Credit Exposures
Tables which break down our total credit exposure (other
than repurchase agreements, securities lending and bor-
rowing, interest-earning deposits with banks and irrevocable
credit commitments) according to the industrial sectors,
the creditworthiness categories of our counterparties and
geographical region are shown in Note [29] to the consoli-
dated financial statements.
The following table represents the gross fair values
and notional amounts of OTC and exchange-traded deriva-
tive contracts we held for trading and non-trading purpos-
es as of December 31, 2001.
To reduce our derivatives-related credit risk, we regu-
larly seek the execution of master agreements (such as
the International Swap Dealers Association (ISDA) contract
for swaps) with our clients. A master agreement allows
the offsetting of the obligations arising under all of the
derivatives contracts the agreement covers, resulting in
one single net claim against the counterparty (called
“close-out netting”). In addition, we also enter into “pay-
ment netting” agreements under which we net non-simul-
taneous settlement of cash flows, reducing our principal
risk. We frequently enter into these agreements in our
foreign exchange business. For internal credit exposure
measurement purposes, we only apply netting when we
believe it is legally enforceable for the relevant jurisdiction
and counterparty. Similarly, we enter into collateral support
agreements only when we believe that the risk situation
justifies doing so. These collateral arrangements generally
provide risk mitigation through periodic (usually daily)
margining of the covered portfolio or transactions and
termination of the master agreement if the counterparty
fails to honor a collateral call. As with netting, when we
believe the collateral is enforceable we reflect this in our
exposure measurement. In the second quarter of 2001,
netting arrangements related to several counterparties
were internally approved which increased significantly the
number of transactions subject to netting.
170
31.12.2001
Within One Year
in X m.
Interest-rate-related transactions
OTC productsFRAs 852,774Interest rate swaps (single currency) 2,577,291Purchased interest rate options 154,642Written interest rate options 154,965Other interest rate trades 0
Exchange-traded productsInterest rate futures 641,346Purchased interest rate options 85,628Written interest rate options 320,404
Sub-total 4,787,050
Currency-related transactions
OTC productsForward exchange trades 1,118,557Cross currency swaps 861,174Purchased foreign currency options 117,994Written foreign currency options 108,057
Exchange-traded productsForeign currency futures 8,419Purchased foreign currency options 210Written foreign currency options 18
Sub-total 2,214,429
Equity/index-related transactions
OTC productsEquity/index swaps 44,327 Purchased equity/index options 35,682Written equity/index options 35,700Other equity/index trades 0
Exchange-traded productsEquity/index futures 575Equity/index purchased options 44,383Equity/index written options 45,326
Sub-total 205,993
Other transactions
OTC productsPrecious metal trades 18,180 Non-precious metal trades 7,608
Exchange-traded productsFutures 112Purchased options 2,502Written options 2,041
Sub-total 30,443
Total OTC business 6,086,951
Total exchange-traded business 1,150,964
Total 7,237,915
Positive market values after netting agreements

171
Risk Report
Notional Amount Distribution Positive Negative Net
After One Year But After Five Years Total Market Value Market Value Market Value
Within Five Years
57,124 23 909,921 336 (450) (114)2,372,353 1,938,660 6,888,304 111,469 (109,752) 1,717
396,240 276,128 827,010 16,320 0 16,320 356,620 303,712 815,297 0 (16,015) (16,015)
0 0 0 0 0 0
93 0 641,439 78 (399) (321)0 0 85,628 11 0 110 0 320,404 0 (25) (25)
3,182,430 2,518,523 10,488,003 128,214 (126,641) 1,573
34,022 1,268 1,153,847 20,692 (17,978) 2,714134,361 98,538 1,094,073 26,174 (25,121) 1,053
17,392 619 136,005 6,883 0 6,88316,830 702 125,589 0 (6,028) (6,028)
1,068 13 9,500 0 0 00 0 210 0 0 00 0 18 0 0 0
203,673 101,140 2,519,242 53,749 (49,127) 4,622
111,574 37,594 193,495 8,044 (10,436) (2,392)49,789 8,254 93,725 13,188 0 13,18861,183 4,802 101,685 0 (11,128) (11,128)
0 0 0 0 0 0
0 0 575 8 (352) (344)9,567 0 53,950 3,958 0 3,9589,950 16 55,292 0 (3,737) (3,737)
242,063 50,666 498,722 25,198 (25,653) (455)
19,810 3,593 41,583 1,446 (1,337) 1094,068 212 11,888 1,515 (718) 797
15 0 127 0 0 036 0 2,538 8 0 852 0 2,093 0 (5) (5)
23,981 3,805 58,229 2,969 (2,060) 909
3,631,366 2,674,105 12,392,422 206,067 (198,963) 7,104
20,781 29 1,171,774 4,063 (4,518) (455)
3,652,147 2,674,134 13,564,196 210,130 (203,481) 6,649
60,999

Because the replacement values of our portfolios
fluctuate with movements in market rates and with
changes in the transactions in the portfolios, we also esti-
mate the potential future replacement costs of the port-
folios over their lifetimes or, in case of collateralized port-
folios, over appropriate unwind periods.
Trading activities in credit derivatives led to positive
market values of € 1.1 billion after netting as at December 31,
2001. Credit derivatives are included in the table above; they
are assigned to interest-rate related or equity/index-related
transactions in accordance with German banking regula-
tions. Outside the trading activities, derivative transactions
are also used to manage credit risks in the banking book.
In particular, we entered into a number of credit protection
transactions. As at December 31, 2001 the loan volume
covered by these transactions amounted to € 26.4 billion.
Country Risk
We manage the country risk portion of credit risk by focus-
ing on the following three major measures of risk:
– Cross Border Transfer Risk. Cross border transfer risk
arises from exposures to counterparties in countries
other than the country where our unit that assumes the
exposure is located. We define transfer risk as arising
where an otherwise solvent and willing debtor is unable
to meet its obligations due to the imposition of govern-
mental or regulatory controls restricting its ability either
to obtain foreign exchange or to transfer assets to non-
residents. Events such as payment moratoria and ex-
change controls may cause this risk to materialize. For
internal risk management purposes cross border trans-
fer risk includes credit we have extended to our own
international branches and subsidiaries, although for this
disclosure we have not included these transactions.
– Total Country Credit Exposure. This is risk arising from
exposures to counterparties we view as being at risk of
events that occur in a particular country. We include
credit that our local operations extend to counterparties
in the local operations’ jurisdictions (even if the expo-
sure is denominated in local currency). It also includes
credit we extend to offshore subsidiaries of those local
clients. Events such as currency devaluations (govern-
ment- or market-driven) may cause this risk to material-
ize.
– Highly-Stressed Event Risk Scenarios. We use stress
testing to measure potential market risk on our trading
positions. We view these as market risks and discuss
them under Market Risk below.
172
173
Country Risk Ratings. A key component of our country
risk management process is a detailed risk assessment
of each country to which we have exposure. The internal
country research departments at our DB Research unit,
which is independent of our Credit Department, carry out
this assessment. They base it on an analysis of economic
and political risk indicators relating to each country and its
region. The assessment produces risk ratings, the most
important of which are a Country Risk Rating, a Country
Transfer Risk Rating and a Country Event Risk Rating.
We regularly compare our internal risk ratings with
the ratings the major international rating agencies publish
to identify possible areas for further consideration. We
review the Country Risk Ratings for all countries at least
annually in connection with our annual review of our coun-
try risk limits. We generally review the Country Risk Rat-
ings of the major emerging market countries in which we
conduct business on a quarterly basis. Countries which
we view as particularly volatile are subject to continuous
review in connection with our country event risk process.
Our Country Transfer Risk Ratings are based on the
Country Risk Rating, but reflect the fact that not all cases
of economic disruption automatically lead to the imposi-
tion of controls over the transfer of money or other assets
to non-residents. Country Transfer Risk Ratings are estab-
lished, approved and monitored in the same process as
the Country Risk Ratings upon which they are based.
We describe our Country Event Risk Ratings under
Market Risk below.
Country Risk Limits. We base our limits for our cross
border transfer risk exposures on a “money-at-risk”
methodology. Money-at-risk is an estimate of the impact
that an actual or potential payment moratorium could have
on our results of operations.
For each country in which we extend credit, either
our Group Board or our Group Credit Policy Committee
(pursuant to delegated authority) sets our money-at-risk
limits. We also calibrate our money-at-risk limits along our
exposure maturity profile, setting lower limits for longer
term exposure.
We manage our exposure to country risk in our trad-
ing book using event risk scenario limits. Event risk sce-
nario limits are a form of stress-tested market risk limit.
For further information on event risk scenario limits, see
Market Risk.
Cross Border Transfer Risk. As at December 31, 2001, our
exposures to cross border transfer risk totaled € 86.4 bil-
lion. This exposure includes unutilized committed lines.
As stated above this amount does not include our funding
of our local units in emerging markets (which include all
countries in Latin America (including the Caribbean), Asia
(excluding Japan), Eastern Europe, the Middle East and
Africa), which totaled € 0.8 billion on December 31, 2001.
Our international portfolio amounted to € 106.9 billion in
cross border transfer risk terms as of December 31, 2000.
The significant majority of our cross border exposures
are to counterparties in other OECD countries with high
credit ratings (including other countries within the euro
zone). We face limited cross border transfer risk with
respect to these claims. Of our cross border transfer risk
exposures with emerging markets of € 9.5 billion, only
€ 7.6 billion represents utilized exposures, down from
€ 8.9 billion on December 31, 2000 and € 11.1 billion on
December 31, 1999.
Risk Report
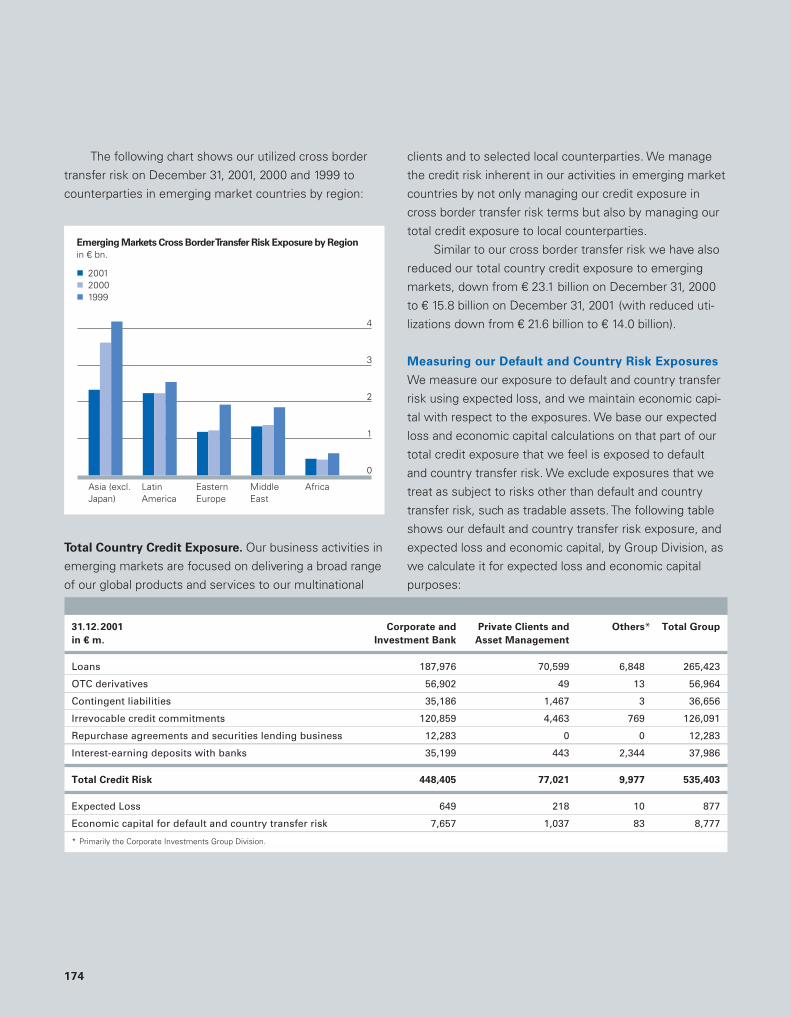
The following chart shows our utilized cross border
transfer risk on December 31, 2001, 2000 and 1999 to
counterparties in emerging market countries by region:
Total Country Credit Exposure. Our business activities in
emerging markets are focused on delivering a broad range
of our global products and services to our multinational
clients and to selected local counterparties. We manage
the credit risk inherent in our activities in emerging market
countries by not only managing our credit exposure in
cross border transfer risk terms but also by managing our
total credit exposure to local counterparties.
Similar to our cross border transfer risk we have also
reduced our total country credit exposure to emerging
markets, down from € 23.1 billion on December 31, 2000
to € 15.8 billion on December 31, 2001 (with reduced uti-
lizations down from € 21.6 billion to € 14.0 billion).
Measuring our Default and Country Risk Exposures
We measure our exposure to default and country transfer
risk using expected loss, and we maintain economic capi-
tal with respect to the exposures. We base our expected
loss and economic capital calculations on that part of our
total credit exposure that we feel is exposed to default
and country transfer risk. We exclude exposures that we
treat as subject to risks other than default and country
transfer risk, such as tradable assets. The following table
shows our default and country transfer risk exposure, and
expected loss and economic capital, by Group Division, as
we calculate it for expected loss and economic capital
purposes:
174
31.12.2001 Corporate and Private Clients and Others* Total Group
in € m. Investment Bank Asset Management
Loans 187,976 70,599 6,848 265,423
OTC derivatives 56,902 49 13 56,964
Contingent liabilities 35,186 1,467 3 36,656
Irrevocable credit commitments 120,859 4,463 769 126,091
Repurchase agreements and securities lending business 12,283 0 0 12,283
Interest-earning deposits with banks 35,199 443 2,344 37,986
Total Credit Risk 448,405 77,021 9,977 535,403
Expected Loss 649 218 10 877
Economic capital for default and country transfer risk 7,657 1,037 83 8,777
* Primarily the Corporate Investments Group Division.
Emerging Markets Cross Border Transfer Risk Exposure by Region
in E bn.
! 2001! 2000! 1999
Asia (excl.Japan)
LatinAmerica
EasternEurope
MiddleEast
0
1
2
3
4
Africa

175
Expected Loss. Expected loss is a measurement of the
default loss we can expect over a one-year period on our
credit exposure, based on our historical loss experience.
We have collected empirical loss data for periods ranging
from ten years for some of our traditional lending products
in Germany down to considerably shorter periods for our
newest credit products and regions of operation. In calcu-
lating expected loss, we take collateralization, maturities
and statistical averaging procedures into account to reflect
the risk characteristics of our different types of exposures
and facilities.
We use expected loss as a tool of our risk manage-
ment process and as part of our management reporting
systems. While expected loss provides us with a useful
measure for planning purposes of the losses we can expect
on our credit exposures, it does not affect the credit perfor-
mance information contained in our financial statements in
any way. You should distinguish between expected loss, on
the one hand, and the credit provisions and allowances that
appear in our financial statements, on the other. Our provi-
sions are, as we describe below, based on actual experi-
ence with and expectations concerning each of our specific
exposures, on country transfer risk determinations and on
the other inherent loss calculation we describe below.
Economic Capital. We define credit exposures the same
way for calculating economic capital on default and country
transfer risks as we do for calculating expected loss. We
calculate the economic capital requirement for our credit
exposures as the amount we would need to protect our-
selves against very severe losses caused by defaults.
“Very severe” means a 0.02% probability that losses with-
in one year will exceed our economic capital for that year.
We take diversification effects across our exposures
into account when calculating divisional economic capital,
and across our Group Divisions when calculating our Group
economic capital. In this context, “diversification effects”
refer to the relatively low probability that severe losses will
occur simultaneously across our exposures and Group
Divisions.
Monitoring Our Default and Country Risk Exposures
Monitoring Default Risk. We monitor all of our credit
exposures on a continuing basis using the credit risk moni-
toring tools described above. We also have procedures in
place to identify at an early stage credit exposures for
which there may be a risk of loss. Accountability for recog-
nition of problem credits rests with the relationship manag-
er in conjunction with the appropriate credit officer. We
believe that problem customers must be identified well in
advance to effectively manage the credit exposure. The
objective of an early warning system is to address potential
problems while adequate alternatives for action are still
available. This early detection is a tenet of our credit culture
and is intended to ensure that greater attention is paid to
such an exposure. In instances where we have identified
potential problem customers, we transfer the related expo-
sures to a special loan management team. The function of
this group is to effectively manage problem exposures by
taking prompt corrective action so that asset values are
preserved and our losses minimized. The special loan man-
agement team performs this function either through con-
sultation with the credit unit or direct management of an
exposure.
Monitoring Country Risk. We charge our Group Divisions
with the responsibility of managing their country risk within
the approved limits. In addition, the regional units within
Credit Risk Management (the credit risk function within our
risk management department) monitors our cross border
transfer risk (expressed in money-at-risk terms) based on
information our controlling department provides. Our Group
Credit Policy Committee also regularly reviews data on
cross border transfer risk. In addition, in connection with
our emerging markets exposure reduction strategy, Credit
Risk Management closely monitors our total credit expo-
sure to emerging markets countries and regularly provides
reports to our Group Credit Policy Committee.
Group Market Risk Management (the market risk
function within our risk management department) monitors
country event risk regularly with data our risk controlling
department produces. Our Event Risk Committee, a sub-
committee of our Group Credit Policy Committee, meets
Risk Report

every two weeks and monitors country event risk limits
and our usage of the limits. The Risk and Resources Com-
mittee within our Corporate and Investment Bank Group
Division also oversees key country event risk concentrations.
Credit Loss Experience and Allowance for Loan
Losses
We establish an allowance for loan losses that represents
our estimate of probable losses in our loan portfolio. The
components of this allowance are:
– Specific loss component: Provisions we take to cover
the default risk of specific exposures.
– Inherent loss component:
– Country risk allowance: Provisions we take to cover
credit losses inherent in our pool of cross border loans
to borrowers located in certain countries solely as a
result of transfer and currency convertibility risks.
– Smaller-balance standardized homogenous loan loss
allowance: Provisions we maintain at a portfolio level
for these types of loans.
– Other inherent loss allowance: Provisions we take
as an estimate of credit losses we have not identified
on an individual or portfolio basis.
Specific Loss Component. We establish allowances for
those exposures that are considered impaired, that is,
where we determine that it is probable that we will be
unable to collect all interest and principal due under the
loan agreement. We determine the amount, if any, of the
specific provision we should make, taking into account the
present value of expected future cash flows, the fair value
of the underlying collateral or the market price of the loan.
Inherent Loss Component. The inherent loss component
is for all other loans we do not individually provision for, but
which we believe to have some inherent loss on a portfolio
basis.
Country Risk Allowance. We establish country risk provi-
sions for loan exposures in countries where we have seri-
ous doubts about the ability of our counterparties to comply
with the repayment terms due to the economic or political
situation prevailing in the respective countries of domicile,
that is, for transfer and currency convertibility risks.
Smaller-Balance Standardized Homogenous Loan Loss
Allowance. Our smaller-balance standardized homogenous
portfolio includes automobile loans, residential and smaller
commercial mortgages, overdrafts, small business working
capital loans and loans to private banking customers and
retail customers. In order to determine the amount of the
allowance we provide for these loans, we divide the port-
folio into two segments. The first segment consists of cur-
rent and performing loans, for which we provide through
our other inherent loss provision. The second segment
consists of loans that are delinquent and for which we
establish specific allowances. These are considered our
non-performing homogenous loans. We individually evalu-
ate these loans and establish allowances using techniques
based upon the collateral available, past due status and
other characteristics. We then aggregate the allowances
we establish and maintain them at a portfolio level.
Other Inherent Loss Allowance. This component of the
allowance (which constituted approximately 10% of our
total allowance as at December 31, 2001 and 2000) repre-
sents an estimate of our inherent losses resulting from
the imprecisions and uncertainties in determining credit
losses. This estimate of inherent losses excludes those
exposures we have already included in the specific loan
loss provisioning. We calculate this component by applying
loss factors derived for each legal entity to the correspond-
ing period end loan categories. We derive the loss factors
for each entity as a ratio of historical average loan losses
(net of recoveries) to an historical average of its loan expo-
sures, the result of which is adjusted for relevant current
environmental factors. We believe that this component of
the allowance is necessary to establish an allowance at a
level sufficient to absorb probable losses not otherwise
provided for.
176

177
Chargeoff Policy. We take chargeoffs when we determine
that the loans underlying the allowances are uncollectable.
Determining when a loan is uncollectable is a question of
judgment.
We generally charge off a loan when all economically
sensible means of recovery have been exhausted. Our
determination considers information such as the occur-
rence of significant changes in the borrower’s financial
position such that the borrower can no longer pay the
obligation, or that the proceeds from collateral will not be
sufficient to pay the loan.
Prior to 2001, our entities regulated outside the United
States, which accounted for approximately 87% of our net
chargeoffs in 2000, consistently charged off loans when all
legal means of recovery had been exhausted. This practice
resulted in chargeoffs occurring at a later date than for our
entities regulated in the United States.
As we have previously disclosed in connection with
our New York Stock Exchange listing on October 3, 2001
and the conversion to U.S. GAAP, we began to develop a
methodology in 2001 to bring our worldwide chargeoff
practices more into line with industry practices in the Unit-
ed States and had anticipated that the timing of our charge-
offs would accelerate. In 2001, entities regulated outside
the United States began to implement this change, which
resulted in a higher level of chargeoffs relative to that which
would have occurred under the prior practice. Our percent-
age of total net chargeoffs to average loans for the year
2001 was 0.71% compared to 0.39% for 2000 and 0.31%
for 1999. The full implementation of this change may con-
tinue to affect the timing of chargeoffs in future years.
Problem Loans. Our problem loans are comprised of non-
accrual loans, loans ninety days past due and still accruing,
troubled debt restructurings and potential problem loans.
As we have previously disclosed in connection with our
New York Stock Exchange listing on October 3, 2001 and the
conversion to U.S. GAAP, we began in 2001 to apply the
non-accrual practice of our entities regulated in the United
States (whose aggregate non-accrual loans comprised
approximately 15% of our total non-accrual loans as at
December 31, 2000) to our entities regulated outside the
United States as well. This did not increase the overall level
of problem loans but did increase non-accrual loans with a
similar decrease in potential problem loans and loans ninety
days past due and still accruing. Our discussed change in
non-accrual practice did not significantly impact interest
revenues as we continue to recognize interest payments
received currently on a cash basis.
The change in our total problem loans in 2001 includes
€ 2.5 billion of net new problem loans offset by € 2.0 billion
of net chargeoffs.
Risk Report

The following table presents the components of our 2001
and 2000 problem loans:
Non-Accrual Loans. Beginning in 2001, we place a loan
on non-accrual status if either
– the loan has been in default as to payment of principal
or interest for 90 days or more and the loan is neither
well secured nor in the process of collection, or
– the loan is not yet 90 days past due, but in the judgment
of management the accrual of interest should be
ceased before 90 days because it is probable that we
will be unable to collect all contractual payments of
interest and principal.
We apply management judgment based on our credit
assessment of the borrower in determining when a loan
should be placed on non-accrual status. When a loan is
placed on a non-accrual status, any accrued but unpaid
interest previously recorded is reversed against current
period interest revenue. Cash receipts of interest on non-
accrual loans are recorded as either interest revenue or a
reduction of principal according to management’s judg-
ment as to collectibility of principal.
As at December 31, 2001, our non-accrual loans
totaled € 11.5 billion, a net increase of € 4.9 billion, or 74%,
from 2000. We estimate that the impact of the change in
our non-accrual practice, as discussed above, was approxi-
mately € 3.4 billion. € 2.0 billion was due to additional
non-accruals in our U.S. entities, a further € 745 million
was due to our medium-sized corporate portfolio and real
estate businesses in Germany and € 290 million was due
to a deterioration in our smaller-balance homogenous
portfolio in Italy. These increases were partially offset by
movements in other portfolios and net chargeoffs.
Ninety Days Past Due and Still Accruing. These are
loans in which contractual interest or principal payments
are 90 days or more past due but on which we continue to
recognize interest revenue. Due to the change in our non-
accrual practice of continuing to accrue interest on loans
that are 90 days past due only if they are well secured and
in the process of collection, the amount of these loans
declined as at December 31, 2001.
In 2001, our 90 days past due and still accruing inter-
est loans decreased by € 651 million, or 44 %, to € 847 mil-
lion, primarily reflecting the movement of our real estate
portfolios in Germany (€ 410 million) and the smaller-bal-
ance homogenous portfolio in Italy (€ 255 million) to non-
accrual status.
178
31.12.2001 31.12.2000
Impaired Non-Performing Total Impaired Non-Performing Total
Loans* Homogenous Loans* Homogenous
in € bn. Loans Loans
Non-accrual loans 10.0 1.5 11.5 5.1 1.5 6.6
90 days past due and still accruing 0.5 0.4 0.9 1.0 0.4 1.4
Troubled debt restructurings 0.3 0.0 0.3 0.1 0.0 0.1
Potential problem loans** 0.0 0.0 0.0 4.1 0.0 4.1
Total problem loans 10.8 1.9 12.7 10.3 1.9 12.2
* Loans for which we determine that it is probable that we will be unable to collect all interest and principal due under the loan agreement.** Impaired loans that were not previously classified as non-accrual, 90 days past due and still accruing or as troubled debt restructurings. In 2001, such loans are classified as
non-accrual.

179
Troubled Debt Restructurings. Troubled debt restructur-
ings are loans which we have restructured due to deterio-
ration in the borrower’s financial position. We may restruc-
ture these loans by one or more of the following:
– reducing the stated interest rate for the remaining por-
tion of the original life of the debt;
– extending the maturity date (or dates) at an interest rate
lower than the current market rate for new debt with a
similar risk profile;
– reducing the face amount or maturity amount of the
debt; and
– reducing the accrued interest on the debt.
If a loan is restructured by means of a modification of its
terms and at the time of the restructuring the new interest
rate was greater than or equal to the market rate for simi-
lar credit risks, then, once the borrower performs satisfac-
torily for one year under the terms of the restructured loan,
we no longer consider that borrower’s loan to be a trou-
bled debt restructuring.
Our troubled debt restructurings totaled € 279 mil-
lion as at December 31, 2001, an 80% increase from 2000.
This increase is primarily attributable to restructured cred-
its in Western Europe and Asia.
The following table shows the approximate effect on
interest revenue of non-accrual loans and troubled debt
restructurings. It shows the gross interest income that
would have been recorded in 2001 if those loans had been
current in accordance with their original terms and had
been outstanding throughout 2001 or since their origina-
tion, if we only held them for part of 2001. It also shows
the amount of interest income on those loans that was
included in net income for 2001.
in € m. 31.12.2001
German loans
Gross amount of interest that would have been recorded at original rate 288
Less interest, net of reversals, recognized in interest revenue 93
Reduction of interest revenue 195
Non-German loans
Gross amount of interest that would have been recorded at original rate 349
Less interest, net of reversals, recognized in interest revenue 154
Reduction of interest revenue 195
Total reduction of interest revenue 390
Our previously discussed change in non-accrual practice
did not significantly impact interest revenues as we con-
tinue to recognize interest payments received currently
on a cash basis.
Risk Report
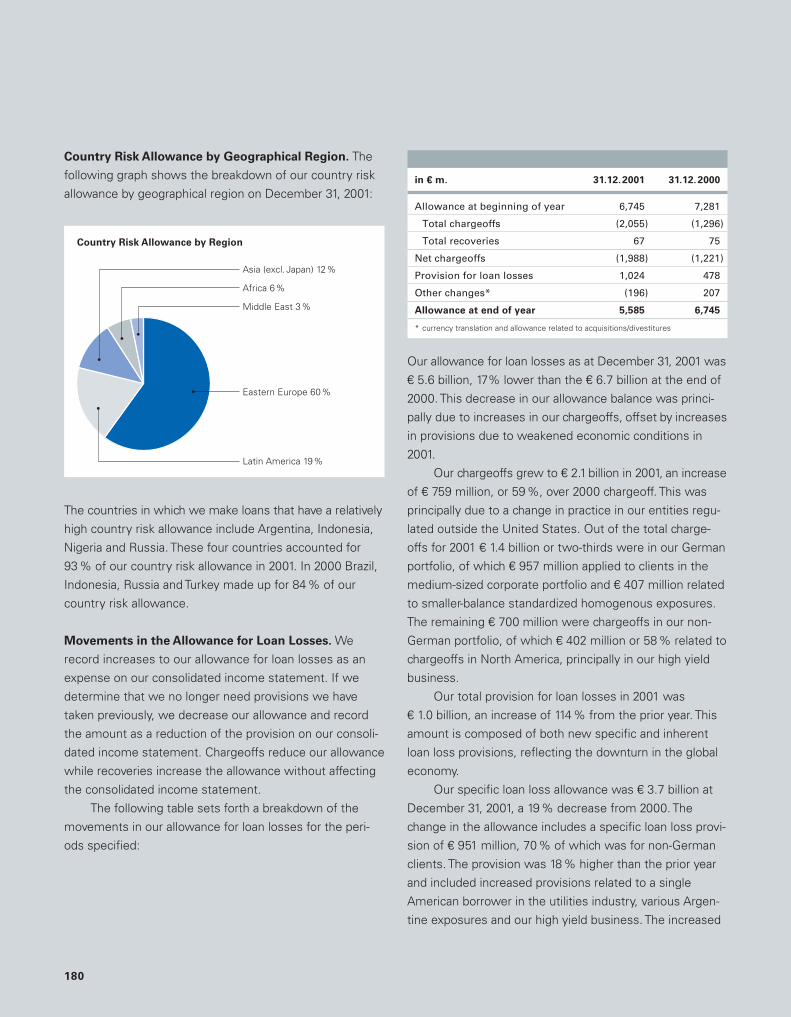
Country Risk Allowance by Geographical Region. The
following graph shows the breakdown of our country risk
allowance by geographical region on December 31, 2001:
The countries in which we make loans that have a relatively
high country risk allowance include Argentina, Indonesia,
Nigeria and Russia. These four countries accounted for
93% of our country risk allowance in 2001. In 2000 Brazil,
Indonesia, Russia and Turkey made up for 84% of our
country risk allowance.
Movements in the Allowance for Loan Losses. We
record increases to our allowance for loan losses as an
expense on our consolidated income statement. If we
determine that we no longer need provisions we have
taken previously, we decrease our allowance and record
the amount as a reduction of the provision on our consoli-
dated income statement. Chargeoffs reduce our allowance
while recoveries increase the allowance without affecting
the consolidated income statement.
The following table sets forth a breakdown of the
movements in our allowance for loan losses for the peri-
ods specified:
in € m. 31.12.2001 31.12.2000
Allowance at beginning of year 6,745 7,281
Total chargeoffs (2,055) (1,296)
Total recoveries 67 75
Net chargeoffs (1,988) (1,221)
Provision for loan losses 1,024 478
Other changes* (196) 207
Allowance at end of year 5,585 6,745
* currency translation and allowance related to acquisitions/divestitures
Our allowance for loan losses as at December 31, 2001 was
€ 5.6 billion, 17% lower than the € 6.7 billion at the end of
2000. This decrease in our allowance balance was princi-
pally due to increases in our chargeoffs, offset by increases
in provisions due to weakened economic conditions in
2001.
Our chargeoffs grew to € 2.1 billion in 2001, an increase
of € 759 million, or 59 %, over 2000 chargeoff. This was
principally due to a change in practice in our entities regu-
lated outside the United States. Out of the total charge-
offs for 2001 € 1.4 billion or two-thirds were in our German
portfolio, of which € 957 million applied to clients in the
medium-sized corporate portfolio and € 407 million related
to smaller-balance standardized homogenous exposures.
The remaining € 700 million were chargeoffs in our non-
German portfolio, of which € 402 million or 58 % related to
chargeoffs in North America, principally in our high yield
business.
Our total provision for loan losses in 2001 was
€ 1.0 billion, an increase of 114% from the prior year. This
amount is composed of both new specific and inherent
loan loss provisions, reflecting the downturn in the global
economy.
Our specific loan loss allowance was € 3.7 billion at
December 31, 2001, a 19% decrease from 2000. The
change in the allowance includes a specific loan loss provi-
sion of € 951 million, 70 % of which was for non-German
clients. The provision was 18% higher than the prior year
and included increased provisions related to a single
American borrower in the utilities industry, various Argen-
tine exposures and our high yield business. The increased
180
Eastern Europe 60%
Latin America 19%
Country Risk Allowance by Region
Asia (excl. Japan) 12%
Africa 6%
Middle East 3%

181
provision was offset in part by € 1.6 billion in net charge-
offs.
Our inherent loss allowance totaled € 1.9 billion as at
December 31, 2001, a decrease of € 303 million, or 14%,
from the level at the end of 2000. A major driver of the net
reduction was € 383 million of chargeoffs in our Private
and Personal Banking business in Germany, partially offset
by a provision for smaller-balance standardized homoge-
nous exposures of € 127 million. Furthermore, our country
risk allowance shows a net decrease of 16% reflecting the
sell down of assets which previously attracted country risk
allowance in Turkey and throughout Asia excluding Japan,
and an increase in collateral held against cross border
assets.
Our allowance for loans as at December 31, 2000
was € 6.7 billion, 7% lower than the € 7.3 billion at the end
of 1999. This decrease in our allowance balance was princi-
pally due to increases in our chargeoffs, lower specific
provisions and a net release of our inherent loss provi-
sions.
Our chargeoffs increased to € 1.3 billion in 2000, a
€ 457 million, or 54%, increase over 1999 chargeoffs. Of
this increase, € 423 million is exclusively attributable to our
non-German customers. Approximately 70%, or € 296 mil-
lion, of this increase is due to chargeoffs related to Russia
and Iraq. We also had € 34 million of chargeoffs for our
German clients in the medium-sized corporate portfolio.
Approximately 60% of the chargeoffs captured in the
German-Other category related to a single medium-sized
German corporate customer in the construction industry.
Our total provision for loan losses in 2000 was
€ 478 million, a decline of 34% from the prior year. This
balance is composed of net new specific loan loss provi-
sions and a release of our inherent loss provisions. Our
total net new specific loan loss provision amounted to
€ 805 million, which was almost equally split between
German and non-German clients. Our specific loan loss
provisions declined between 1999 and 2000, reflecting the
improvement of the quality of our loan portfolio. Specific
provisions were approximately 13% less in 2000 than the
prior year due in large part to provisions we took in 1999
with respect to a significant exposure to a single German
borrower in the real estate industry.
Our inherent loss allowance totaled € 2.2 billion as at
December 31, 2000, a 19% drop from the level at the end
of 1999. This decline reflects the effect of the € 296 mil-
lion of chargeoffs described above and country provision
releases totaling € 154 million. Of the € 154 million country
provision releases, € 88 million is due to reduced exposure
(mainly in Brazil and Turkey), € 34 million is due to a net
reduction in provisioning rates applied to individual coun-
tries, and the remaining amount relates to other changes,
primarily foreign exchange. In addition to a small increase
in our allowances on the homogenous loan portfolio, we
released a net € 98 million from our other inherent loss
allowance in 2000 due to two legal entities: Eurohypo and
Bankers Trust. Each of these entities had a decrease in its
loss factors in 2000 because of a decline in its historical
average chargeoffs and an increase in its average loan
exposures.
Risk Report
Treatment of Default Situations under Derivatives.
Unlike in the case of our standard loan assets, we general-
ly have more options to manage the credit risk in our over-
the-counter derivatives when movement in the current
replacement costs of the transactions and the behavior of
our counterparty indicate that there is the risk that upcom-
ing payment obligations under the transactions might not
be honored. In these situations, we frequently are able
to obtain additional collateral or terminate the transactions
or the related master agreement.
When our decision to terminate transactions or the
related master agreement results in a residual net obliga-
tion of the counterparty, we restructure the obligation into
a non-derivative claim and manage it through our regular
workout process. As a consequence, we do not show any
non-performing derivatives.
Settlement Risk
Our extensive trading activities may give rise to risk at the
time of settlement of those trades.
For many types of transactions, we mitigate settle-
ment risk by closing the transaction through a clearing
agent which effectively acts as a stakeholder for both par-
ties, only settling the trade once both parties have fulfilled
their sides of the bargain.
Where no such settlement system exists, as is com-
monly the case with foreign exchange trades, the simulta-
neous commencement of the payment and the delivery
parts of the transaction is common practice between trad-
ing partners. We call this “free settlement”. In these cases,
we may seek to mitigate our settlement risk through the
execution of bilateral payment netting agreements. We are
also an active participant in industry initiatives to reduce
settlement risks.
Market Risk
Substantially all of our businesses are subject to the risk
that market prices and rates will move and result in profits
or losses for us. We distinguish among four types of mar-
ket risk:
– interest rate risk (including specific risk as well as
general risk, as described below);
– equity price risk (including specific risk as well as
general risk);
– foreign exchange risk;
– commodity price risk.
We assume market risk in both our trading and our non-
trading activities. Trading risks arise either from customer-
driven business or from our proprietary positions. We
assume risk by making markets in interest rate, foreign
exchange, equity and commodity derivatives, as well as in
foreign exchange, debt, equity, other securities and com-
modities.
Our market risk disclosures are based on German
banking regulations which permit banks to calculate mar-
ket risk using their own internal models. Our internal pro-
prietary value-at-risk model has been duly approved by the
German Banking Supervisory Authority and is used to
calculate the market risk component of our regulatory risk
position for interest rate and equity price risks in assets
held for trading purposes and for foreign exchange and
commodity price risks.
Limits. We manage our market risk through risk limits. We
establish limits using a variety of risk measurement tools,
including position sensitivity, value-at-risk and stress test
methodologies. Our members of the Group Board and
Group Risk Committee, supported by Group Market Risk
Management which is part of our internally independent
risk management function, set a Group-wide hierarchy of
value-at-risk limits. Starting with a Group limit, these limits
also include a maximum value-at-risk for our Corporate and
Investment Bank Group Division, which includes all of our
trading units as well as a portion of our non-trading bank-
ing book, and further global limits. We allocate these limits
among our Group Divisions and the Group Divisions
182

183
further allocate these limits to specific business lines and
trading portfolio groups and to geographical regions.
The overall value-at-risk limit for our Corporate and
Investment Bank Group Division was € 73 million both
throughout the year 2001 and on December 31, 2001 (with
a 99% probability level and a one-day holding period). This
includes both our trading activities and the part of our non-
trading banking book that we allocate to our Corporate and
Investment Bank Group Division. The value-at-risk limit for
our consolidated Group was € 77million both throughout
the year 2001 and on December 31, 2001.
Value-at-Risk Analysis. We use the value-at-risk approach
to derive quantitative measures specifically for market
risks under normal market conditions. We include all mate-
rial instruments and exposures to material market risks in
the value-at-risk figures we calculate, with the exception
of:
– equity investments and
– foreign exchange risk arising from currency positions
that German regulation permits us to exclude from cur-
rency risk reporting. These are both currency positions
which are fully deducted from, or covered by, equity
capital recognized for regulatory reporting and shares in
affiliated companies we record in foreign currency and
value at historical cost (structural currency position).
For a given portfolio, value-at-risk measures the potential
future loss (in terms of market value) that, under normal
market conditions, will not be exceeded in a defined peri-
od and with a defined probability. The value-at-risk mea-
sure enables us to apply a constant and uniform measure
across all of our trading businesses and products. This
facilitates comparisons of our market risk estimates both
over time and against our actual daily trading results.
Since January 1, 1999, we have calculated value-at-risk
for both internal and external reporting using a 99% proba-
bility level, in accordance with BIS rules. For internal report-
ing purposes, we use a holding period of one day. For regu-
latory reporting purposes, the holding period is ten days.
We believe that our value-at-risk model takes into
account all material risk factors, assuming normal market
conditions. Examples of these factors are interest rates,
equity prices, foreign exchange rates and commodity
prices, as well as their volatilities. The model incorporates
both linear and non-linear effects of the risk factors on the
portfolio value. In our model, the non-linear effects capture
risks specific to derivatives. The statistical parameters
required for the value-at-risk calculation are based on a 261
trading day history (corresponding to one calendar year of
trading days) with equal weighting being given to each
observation.
The value-at-risk for interest rate and equity price
risks is made up in each case of two components. The
general risk describes value changes due to general mar-
ket movements, while the specific risk has issuer-related
causes. We assume when aggregating general and spe-
cific risk that there is no correlation between them.
It is our strategy to calculate value-at-risk using
Monte Carlo simulations. However, we still use a variance-
covariance approach for some portfolios. In particular, we
use a variance-covariance method to calculate specific
interest rate risk for some portfolios. In 2001 we moved
the calculation of specific interest rate risk for major busi-
nesses from the variance-covariance approach to the
Monte Carlo simulation method.
Back-testing. We use back-testing to verify the predictive
power of the value-at-risk procedure. In back-testing, we
compare the daily profits and losses we actually generate
with the estimates we had forecast using the value-at-risk
procedure.
A back-testing committee meets on a quarterly basis
to discuss back-testing results on the Group and lower
levels. The committee consists of risk managers, risk con-
trollers and business area controllers. They analyze perfor-
mance fluctuations and assess the predictive power of our
value-at-risk models. Using the results of statistical analy-
ses of the back-testing results, the committee contributes
to our initiatives to improve the risk estimation process.
Risk Report

Stress testing. While value-at-risk, calculated on a daily
basis, supplies forecasts for maximum losses under nor-
mal market conditions, we simulate extreme market
movements using stress tests, in which we value our
trading portfolios under extreme market scenarios not
covered by value-at-risk.
We calculate country-specific event risk scenarios for
all of the major emerging markets where we take material
risk. We assess these event risk results twice weekly and
daily for selected countries and a committee reviews the
ratings and the limits bi-weekly (although Group Market
Risk Management can alter these limits, like any other
market risk limits, at any time). In addition to the country-
specific event risk scenarios for emerging markets, we
also run periodic global market stress scenarios on the
positions of every major business line.
The quantification of market risk under extreme
stress scenarios forms the basis of our assessment of the
economic capital we need to cover the market risk in all of
our positions. Underlying risk factors (market parameters)
applicable to the different products are stressed, meaning
that we assume a sudden change, according to pre-defined
scenarios. We take the resulting predicted losses from
applying the worst of these scenarios to the various port-
folios as the economic capital for those businesses. We
derive the stress scenarios from historic worst case sce-
narios adjusted for structural changes in current markets.
Our scenarios cover:
– emerging market risks, including equity price declines,
strong interest rate movements and currency devalua-
tions;
– credit spread risk for bonds and traded loans from
industrialized and emerging markets countries;
– price and volatility risk for interest rate, equity price,
foreign exchange and commodity prices for industrial-
ized countries. This covers both securities and deriva-
tives portfolios;
– underwriting risk in debt capital markets and asset
securitization business, as well as provisions for hedge
fund exposures in our equity business.
We aggregate the economic capital by aggregating losses
from those scenarios using correlations that reflect
stressed market conditions.
On December 31, 2001, our economic capital for mar-
ket risk (excluding that relating to our alternative assets
businesses) totaled € 1.2 billion.
Limitations of our Proprietary Risk Models. Although
we believe that our proprietary market risk models are of a
high standard, we are committed to their further develop-
ment.
You should view our value-at-risk analyses in the con-
text of the limitations of the methodology we use. Our
value-at-risk results should not, therefore, be viewed as
maximum amounts that we can lose on our market risk
positions.
Although we believe that the aggregate value-at-risk
estimates for our consolidated Group as a whole stand up
well against our back-testing procedures, we acknowledge
the limitations in the value-at-risk methodology by aug-
menting the value-at-risk limits with other position and
sensitivity limit structures, as well as with stress testing,
both on individual portfolios and on a consolidated basis.
184

185
Aggregated Value-at-Risk of the Group. Our consolidat-
ed Group value-at-risk calculation includes the value-at-risk
of the trading units that were in our Corporate and Invest-
ment Bank Group Division and the interest rate and for-
eign exchange risks of our non-trading units. A comparison
of the consolidated Group’s and trading units’ value-at-risk
numbers shown below indicates that the non-trading units’
market risk is relatively small.
The following table shows the value-at-risk calculation
for our consolidated Group. The minimum and maximum
value-at-risk amounts show the bands within which the
values fluctuated during the periods specified. We calculate
the value-at-risk with a holding period of one day and a
probability level of 99%. ‘Diversification effect’ refers to the
effect that the total value-at-risk on a given day is lower
than the sum of the value-at-risk figures relating to the
individual risk factors. We exclude our structural currency
position pursuant to German banking regulation.
Risk Report
Value-at-risk of our Corporate and Investment Bank
Group Division Trading Units. The following table shows
the value-at-risk of our trading units in 2001 and 2000:
Within our Corporate and Investment Bank Group Divi-
sion, our interest rate exposures are dominated (in terms
of net directional exposures) by instruments denominated
in euro, U.S. dollar, pound sterling and Japanese yen.
Foreign exchange risk is mainly driven by U.S. dollar,
pound sterling, Japanese yen and Swiss franc exposures
as measured against our base currency of euro.
The graph on the following page shows the daily
aggregate value-at-risk of our trading units in 2001 includ-
ing diversification effects. As the value-at-risk of our trad-
ing units is the major contributor to our consolidated
Group value-at-risk, the shapes of the value-at-risk curves
Total Diversification Interest Equity Foreign Commodity
effect rate risk price risk exchange risk price risk
in € m. 2001 2000 2001 2000 2001 2000 2001 2000 2001 2000 2001 2000
Average 43.11 43.63 23.44 24.32 37.36 38.26 19.89 18.67 6.08 7.49 3.21 3.53
Maximum 54.21 65.51 31.04 36.49 48.54 62.56 35.04 42.15 16.27 11.81 7.60 6.77
Minimum 29.36 30.86 16.73 17.65 24.15 25.84 11.67 10.79 3.02 3.53 1.78 1.33
Year-end 41.58 37.75 21.64 17.65 36.07 35.22 20.09 12.30 3.55 5.00 3.52 2.89
Total Diversification Interest Equity Foreign Commodity
effect rate risk price risk exchange risk price risk
in € m. 2001 2000 2001 2000 2001 2000 2001 2000 2001 2000 2001 2000
Average 41.02 40.79 23.19 23.84 34.91 35.05 19.90 18.67 6.19 7.39 3.22 3.53
Maximum 55.38 60.79 30.60 34.33 51.69 49.20 35.04 42.15 16.61 11.96 7.60 6.77
Minimum 27.89 29.41 16.68 17.42 22.35 25.36 11.67 10.79 2.87 3.64 1.78 1.33
Year-end 40.53 34.87 21.11 17.42 34.88 32.11 20.09 12.30 3.15 4.99 3.52 2.89

of our consolidated Group are similar to those of our
trading units.
Our trading value-at-risk largely fluctuated between
€ 35 million and € 45 million in 2001, with the peaks above
€ 45 million almost all due to above-average interest rate
risk positions that were taken in anticipation of rate cuts
in the world’s largest industrialized countries. The third
quarter drop in value-at-risk below € 35 million coincided
with quiet northern hemisphere summer markets and
reduced risk positions generally.
The value-at-risk and actual income of the trading
units throughout the year are shown in the following
graph. We used this data as a basis for back-testing.
186
Daily Value-at-Risk of Trading Units in 2001
in E m.
25
30
35
40
45
50
55
1/01 2/01 3/01 4/01 5/01 6/01 7/01 8/01 10/019/01 11/01 12/01
The following bar chart shows the distribution of actual
daily income of our trading units in 2001. The chart also
indicates the number of trading days on which we reached
each of the levels of trading units’ income shown on the
horizontal axis in millions of euro. The trading units
achieved a positive income for over 99% of the trading
days and on no trading day did they incur a loss which
exceeded the value-at-risk for that day.
1/01 2/01 3/01 4/01 5/01 6/01 7/01 8/01 10/019/01 11/01 12/01
Income of Trading Units and Value-at-Risk in 2001
in E m.
– 30
0
Value-at-Risk
Income of Trading Units 30
– 70
100
70

187
The distribution of our trading units’ income enables us to
compare the reasonableness of our value-at-risk estimate
with the volatility of our actual daily income. The bar chart
shows that the actual distribution of our trading units’
income implies a 99% downside risk level of € 35.4 mil-
lion below the average daily income level of € 41.8 million.
This is less than the average value-at-risk estimate of
€ 41.0 million.
Market Risk Management in our Other Non-Trading
Portfolios. We manage the market risks arising from our
non-trading portfolios on behalf of our entire consolidated
Group. Apart from the Corporate and Investment Bank
Group Division (which includes Eurohypo, our mortgage
bank subsidiary in Germany), Deutsche Bank 24, Deutsche
Bank Lübeck, Deutsche Financial Services and Deutsche
Bank Saar incur market risk. The market risk our other
subsidiaries incur is immaterial.
Alternative Assets
Consolidation and Management of our Alternative
Assets Investment Portfolio. As part of our corporate
reorganization in February 2001, we consolidated all of our
alternative assets investments (except industrial holdings;
see below) under a new management structure irrespec-
tive of the originating business division. The alternative
assets investment portfolio aggregates our private equity
and venture capital assets with the alternative assets and
other non-trading equity investments that we previously
managed in our different business divisions.
Alternative Assets Investment Activities. All of our three
Group Divisions engage in alternative assets investment
activities. The Corporate Investments and the Private
Clients and Asset Management Group Divisions conduct
investment activities in alternative assets as principals,
fiduciaries and on behalf of third parties as fund managers.
We define alternative assets as direct investments in pri-
vate equity, venture capital, mezzanine debt, real estate
principal investments, investments in leveraged buy-out
funds, venture capital funds and hedge funds. We manage
our investments in hedge funds as principal in the Private
Clients and Asset Management Group Division and on
a smaller scale, in the Corporate and Investment Bank
Group Division.
Alternative Assets Governance Committee. To ensure
a coordinated investment strategy, a consistent risk
management process and appropriate portfolio diversifica-
Risk Report
Daily Income of Trading Units in 2001
in E m.
0
10
20
30
40
–10 – 5 0
Days
>1005 10 15 20 25 30 35 40 45 50 55 60 65 70 75 80 85 90 95
35.4*
41.0**
Daily average 41.8
* 99% quantile of daily income distribution** average value-at-risk (confidence level 99%)
tion, our Alternative Assets Governance Committee super-
vises all of our alternative asset investment activities.
This Committee defines investment strategies,
determines risk adjusted return requirements, sets limits for
investment asset classes, allocates economic capital
among the various alternative assets units and approves
policies, procedures and methodologies for managing alter-
native assets risk. The Committee receives monthly port-
folio reports showing performance, estimated market
values, economic capital usage and risk profiles of the
investments. The Committee also oversees the portfolio
of industrial holdings and other strategic investments in
financial services entities held in our Corporate Invest-
ments Group Division.
The Committee has established dedicated investment
commitment committees for each alternative asset cate-
gory, including private equity and venture capital, real
estate and hedge funds. The investment commitment
committees review and approve transactions that exceed
the delegated approval authority of investment managers.
Investments that exceed delegated authority levels of an
investment commitment committee must be approved by
the Group Board.
We carry private equity, venture capital and real
estate investments on our balance sheet at their costs of
acquisition (less write-downs, if applicable) or fair value.
In certain circumstances, depending on our ownership
percentage or management rights, we apply the equity
method to our investments. In some situations, we con-
solidate investments made by the private equity business.
We account for our investments in leveraged buy-out
funds using the equity method and carry hedge fund
investments at current market value.
At the end of 2001 the book value of our alternative
assets investment portfolio amounted to € 11.9 billion.
It consisted mainly of our private equity investments of
€ 7.1 billion, € 3.9 billion of real estate investments and
€ 0.9 billion of hedge funds. This includes real estate invest-
ments of € 3.1 billion and hedge fund investments of
€ 0.9 billion which we added in 2001 when we realigned
our businesses and created the unified alternative assets
investment portfolio.
The portfolio is dominated by the private equity and
real estate investments which amounted to € 11.0 billion at
December 31, 2001. They were invested in North America
(50 %) and Western Europe (40 %), with only small per-
centages in Central and South America and the Asia-Pacific
region. In terms of industrial sectors we believe the major-
ity of the private equity portfolio is well diversified. Of the
above € 7.1 billion, a € 2.0 billion portion is held in funds for
which we do not have data to support disclosure of their
profile by industry.
At the end of 2000, the book value of our private
equity and real estate investments was € 7.9 billion. The
increase in the value is solely the result of the inclusion
of additional real estate and hedge fund exposures that
we managed elsewhere and not due to growth of the
business. On a comparable basis, the book value of the
portfolio has, in fact, declined due to the significant write-
downs and value adjustments of private equity and real
estate investments in 2001, which totaled € 1.6 billion.
Predominantly all the risk in our alternative assets
portfolio is equity price risk. We assess the risk of these
businesses through the use of stress testing procedures
that are particular to each risk class, taking into account
the liquidity of each class. This assessment forms the
basis of economic capital needed for the portfolio. On
December 31, 2001, our economic capital for alternative
assets under the aegis of the Alternative Assets Govern-
ance Committee totaled € 6.1 billion. This increased from
€ 2.8 billion in 2000 due to new positions being taken on
and a downgrade in ratings on some of the portfolio.
188

189
Management of our Industrial Holdings. DB Investor is
responsible for administering and restructuring our industrial
portfolio. However, Deutsche Bank AG holds some industrial
holdings directly. DB Investor currently plans to sell most of
its publicly listed holdings over the next few years, subject
to the legal environment and market conditions.
Our Mutual Fund Investments. Our mutual fund invest-
ments (held in the Private Clients and Asset Management
and Corporate and Investment Bank Group Divisions)
amounted to € 5.5 billion at December 31, 2001 and had not
changed significantly in value since the end of 2000. They
were invested predominatly in securities and shares of
Western European (mainly German) issuers and across a
broad mix of industries (including governments).
Liquidity Risk
As our balance sheet has grown significantly in the recent
years, our liquidity management function has become more
important. With our finalizing of the funding matrix and the
stress testing capabilities we describe below, we have
concluded the last steps to establish a fully integrated liq-
uidity risk management framework.
Funding Matrix
We have created what we call our “Funding Matrix”, on
which we have mapped all of our funding relevant assets
and liabilities in time buckets corresponding to their maturi-
ties. Given that trading assets are typically more liquid than
their contractual maturities suggest, we have divided them
into liquids (assigned to the time bucket one year and
under) and illiquids (assigned to time buckets up to five
years based on modeling of their liquidation profile). We
have modeled assets and liabilities that show a behavior of
being renewed or prolonged regardless of capital market
conditions (such as some retail products) and assigned
them to time buckets accordingly. The Funding Matrix
shows the excess or shortfall of assets over liabilities in
each time bucket and thus allows us to identify and man-
age open liquidity exposures. We have also developed a
cumulative mismatch vector, which enables us to predict
whether any excess or shortfall will grow, decline or switch
over time. The Funding Matrix forms the basis for our annu-
al securities issuance plan which upon approval of our
Group Asset and Liability Committee establishes issuing
targets for securities by tenor, volume and instrument. On
the basis of this model we have not identified any material
funding mismatches.
Short-term Liquidity
We have established a system to track net cash outflows
over an eight-week horizon. This system allows manage-
ment to assess our short-term liquidity position in any loca-
tion, region and globally on a by-currency and by-product
basis. The system captures all of our cash flows, thereby
including liquidity risks resulting from off-balance sheet
transactions as well as from transactions on our balance
sheet. We model transactions which have no specific con-
tractual maturities using statistical analysis to capture the
actual behavior of these transactions. Our Group Board,
upon the recommendations of our Group Asset and Liability
Committee, has set global and regional limits for the liquidi-
ty exposures which we monitor on a daily basis.
Unsecured Funding
Unsecured wholesale funding is a finite resource. Over the
course of 2001, we have reduced our unsecured wholesale
(as opposed to retail) funding by approximately € 25 billion
(see table on next page). Our Group Asset and Liability
Committee has set limits to restrict utilization of unsecured
wholesale funding.
Risk Report

Funding Diversification and Asset Liquidity
Diversification of our funding profile in terms of investor
types, regions, products and instruments is an important
part of our liquidity policy. Our core funding resources,
such as retail and fiduciary deposits and long-term capital
markets funding, form the cornerstone of our liability pro-
file. Customer deposits, funds from institutional investors
and interbank funding are additional sources of funding.
We use interbank deposits primarily to fund liquid assets.
The above chart shows the composition of our unsecured
liabilities as at December 31, 2001 in euro. Our total un-
secured liabilities amounted to approximately € 366 billion
on that date. The liability diversification report is a manage-
ment information tool we use to actively manage our liabil-
ity composition. It contains all relevant unsecured liabilities
and can selectively be reconciled against balance sheet
items.
We track the volume and location within our consoli-
dated inventory of unencumbered, highly liquid assets
which we can use immediately to raise funds either in the
repurchase agreement markets or by selling the assets.
The securities inventory consists of a wide variety of liquid
securities, which we can convert into cash even in times
of market stress.
The liquidity of these assets is an important element
in protecting us against short-term liquidity squeezes.
By holding these liquid assets, we also protect ourselves
against unexpected liquidity squeezes resulting from cus-
tomers drawing large amounts under committed credit
facilities. In addition, we maintained, on average, a
€ 26 billion portfolio of highly liquid securities in major
currencies around the world to supply collateral for cash
needs associated with clearing activities in euro, U.S. dol-
lar and other major currencies.
Stress Testing and Scenario Analysis
In 2001, we completed the development of stress testing
and scenario analysis to evaluate the impact of sudden,
unforeseen events with an unfavorable impact on the
bank’s liquidity. The scenarios are either based on historic
events (such as the stock market crash of 1987, the U.S.
liquidity crunch of 1990 and the terrorist attack of Septem-
ber 11, 2001) or modeled using hypothetical events. They
include internal scenarios (such as operational risk, merger
or acquisition, credit rating downgrade by 2 and 4 notches)
as well as external scenarios (such as market risk, emerg-
ing markets, systemic shock and prolonged global reces-
sion). Under each of these scenarios we assume that all
maturing assets will need to be rolled over and require
funding whereas rollover of liabilities will be partially
impaired. We then model the steps we would take to
counterbalance the resulting net shortfall in funding needs
such as selling assets and adjusting the price we would
pay for liabilities. This analysis is fully integrated within the
existing liquidity framework. We take our contractual cash
flows as a starting point, which enables us to track the
cash flows per currency and product over an eight-week
horizon (the most critical time span in a liquidity crisis) and
apply the relevant stress case to each product. Asset
saleability as described in the paragraph above comple-
ments the analysis. Our stress testing analysis provides
guidance as to our ability to survive critical scenarios and
would, if deficiencies were detected, cause us to make
190
in E bn.! December 31, 2000: total E 378 billion! December 31, 2001: total E 366 billion
Total External Unsecured Liabilities by Product
Retaildepos-its
93
108
Fidu-ciarydeposits
Capitalmarkets
Small/mid cap*
0
25
50
75
100
19 20
74 74
17 14
61
47
59
4855 55
CP-CD** Bankdepos-its
Othernon-bankdeposits
December 2001 data – Bank deposits are split between Bank deposits E 36 billion/Central bank E 12 billion.
* Small/mid cap: refers to deposits by small and medium-sized European corporates.** CP-CD: refers to Commercial Paper-Certificates of Deposit.

191
changes to our asset and liability structure. The analysis is
performed monthly. The following report is illustrative of
our stress testing results as at December 31, 2001. For
each scenario, the table shows what our maximum fund-
ing gap would be over an eight week horizon after occur-
rence of the triggering event, whether the risk to our liq-
uidity would be immediate and whether it would improve
or worsen over time and how much liquidity we believe
we would have been able to generate at the time to close
the gap.
Risk Report
With the increasing importance of liquidity management
in the financial industry, we consider it important to contri-
bute to our financial stability by regularly addressing central
banks, supervisors and market participants on liquidity
risk-related topics. We participate in a number of working
groups regarding liquidity and will strive to assist in creat-
ing an industry standard that is appropriate to evaluate and
manage liquidity risk.
Off-balance Sheet Arrangements with Uncon-
solidated Special Purpose Entities
Special purpose entities (SPEs) are legal entities created
for a particular purpose and are used in structuring a wide
range of capital markets products. We take into considera-
tion our commitments arising from off-balance sheet
arrangements with unconsolidated SPEs when we assess
our liquidity and related risks. We consolidate the majority
of the SPEs we are involved with. Those we do not con-
solidate relate primarily to asset securitizations and com-
mercial paper programs.
In an asset securitization, we sell financial assets to
a securitization trust which funds its purchase by issuing
debt (asset-backed securities) to investors. We have no
control over the securitization trust after the sale and we
and our creditors have no claim on the assets we have
sold. Similarly, the investors and the securitization trust
have no recourse to our other assets if the loans go into
default. For these reasons, we are not permitted to con-
solidate these trusts. Asset-backed securities are attractive
to investors in what is a deep and liquid market that low-
ers borrowing costs and increases credit availability to
businesses and to consumers.
The securitization trusts we use in these transactions
pose limited liquidity risks since the payments to investors
are directly tied to the payments received from the trust’s
assets and are unaffected by changes in our own credit
rating or financial situation.A sudden drop in investor
demand for asset-backed securities could cause us to
restrict our lending thereafter for the types of loans we
typically securitize, but we are not dependent on securiti-
zations as a source of funding and such a market shift
would not pose any significant additional liquidity risk not
already considered in our risk analyses. To the extent we
hold senior or subordinated debt issued by a securitization
Scenario Funding Gap* Liquidity Impact Gap Closure**in € m. in € m.
Market Risk 6,060 Gradually increasing 64,750
Emerging Markets 12,939 Gradually increasing 77,537
Prolonged Global Recession 17,795 Gradually increasing 71,297
Systemic Shock 30,934 Immediate, duration 2 weeks 64,750
DB downgrade to A1/P1 (short term)and A1/A+ (long term) 13,958 Gradually increasing 64,750
Operational Risk 20,921 Immediate, duration 2 weeks 64,750
Merger & Acquisition 36,101 Gradually increasing, pay-out in week 6 64,750
DB downgrade to A2/P2 (short term)and A3/A- (long term) 55,450 Gradually increasing 70,578
* Funding gap after assumed partially impaired rollover of liabilities. All assets are renewed.** Additional liquidity generated through counterbalancing activity.

trust we have credit risk which is considered as part of our
credit risk assessments or market valuations. Note [9] to
the consolidated financial statements provides additional
information regarding the volume of our asset securitiza-
tion activities.
Commercial paper programs represent a way for third
parties to securitize their financial assets. In commercial
paper programs, we do not securitize any of our own
financial assets, but act as administrative agent. As admin-
istrative agent, we facilitate the sale of loans, other receiv-
ables, or securities from various third parties to an SPE.
We may also facilitate the transfer of the loans and securi-
ties that represent collateral provided by the third parties
in return for loans granted by the SPE. The SPE then
issues collateralized commercial paper to the market. In
these situations, the commercial paper issuer is restricted
from purchasing assets from or making loans to us. Rating
agencies typically rate such commercial paper in the high-
est short-term category because of the collateral and cred-
it support normally provided by a financial institution.
Unlike securitization trusts, commercial paper pro-
grams do pose liquidity risk since the commercial paper
issued is short-term whereas the issuer’s assets are
longer term. We take on this risk as well as the credit risk
of the assets of the issuer whenever we provide a liquidity
support facility to the issuer. We had € 24.6 billion of such
facilities outstanding as at December 31, 2001. These facili-
ties are included in our overall assessments of credit and
liquidity risks.
Besides these two main types of activities, we also
engage in activities with SPEs which do not pose any off-
balance sheet risk. For example, we may act as investor,
servicer or administrator or we may be sought out to pro-
vide a financial product. The effects of these transactions
are fully reflected in our consolidated financial statements.
Contractual Financial Obligations and Commercial
Commitments
The following table shows the maturity breakdown of the
indicated contractual financial obligations outstanding as
at December 31, 2001:
192
Due in Due after
in € m. 2002 2003 2004 2005 2006 2006 Total
Long-term debt* 19,027 25,068 23,627 20,524 14,710 63,952 166,908
Capital lease obligations 164 163 160 153 152 1,646 2,438
Operating lease obligations 596 489 429 349 284 1,571 3,718
Total 19,787 25,720 24,216 21,026 15,146 67,169 173,064
* Excludes € 4.1 billion of trust preferred securities.
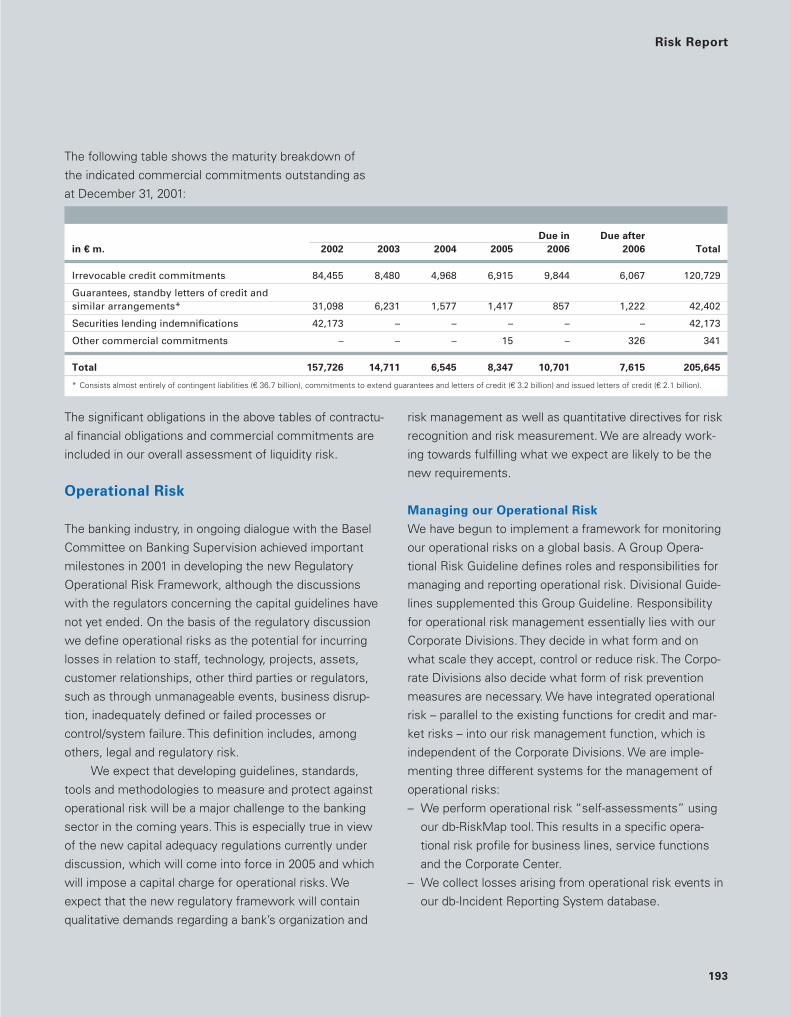
193
The following table shows the maturity breakdown of
the indicated commercial commitments outstanding as
at December 31, 2001:
The significant obligations in the above tables of contractu-
al financial obligations and commercial commitments are
included in our overall assessment of liquidity risk.
Operational Risk
The banking industry, in ongoing dialogue with the Basel
Committee on Banking Supervision achieved important
milestones in 2001 in developing the new Regulatory
Operational Risk Framework, although the discussions
with the regulators concerning the capital guidelines have
not yet ended. On the basis of the regulatory discussion
we define operational risks as the potential for incurring
losses in relation to staff, technology, projects, assets,
customer relationships, other third parties or regulators,
such as through unmanageable events, business disrup-
tion, inadequately defined or failed processes or
control/system failure. This definition includes, among
others, legal and regulatory risk.
We expect that developing guidelines, standards,
tools and methodologies to measure and protect against
operational risk will be a major challenge to the banking
sector in the coming years. This is especially true in view
of the new capital adequacy regulations currently under
discussion, which will come into force in 2005 and which
will impose a capital charge for operational risks. We
expect that the new regulatory framework will contain
qualitative demands regarding a bank’s organization and
risk management as well as quantitative directives for risk
recognition and risk measurement. We are already work-
ing towards fulfilling what we expect are likely to be the
new requirements.
Managing our Operational Risk
We have begun to implement a framework for monitoring
our operational risks on a global basis. A Group Opera-
tional Risk Guideline defines roles and responsibilities for
managing and reporting operational risk. Divisional Guide-
lines supplemented this Group Guideline. Responsibility
for operational risk management essentially lies with our
Corporate Divisions. They decide in what form and on
what scale they accept, control or reduce risk. The Corpo-
rate Divisions also decide what form of risk prevention
measures are necessary. We have integrated operational
risk – parallel to the existing functions for credit and mar-
ket risks – into our risk management function, which is
independent of the Corporate Divisions. We are imple-
menting three different systems for the management of
operational risks:
– We perform operational risk “self-assessments” using
our db-RiskMap tool. This results in a specific opera-
tional risk profile for business lines, service functions
and the Corporate Center.
– We collect losses arising from operational risk events in
our db-Incident Reporting System database.
Risk Report
Due in Due after
in € m. 2002 2003 2004 2005 2006 2006 Total
Irrevocable credit commitments 84,455 8,480 4,968 6,915 9,844 6,067 120,729
Guarantees, standby letters of credit and similar arrangements* 31,098 6,231 1,577 1,417 857 1,222 42,402
Securities lending indemnifications 42,173 – – – – – 42,173
Other commercial commitments – – – 15 – 326 341
Total 157,726 14,711 6,545 8,347 10,701 7,615 205,645
* Consists almost entirely of contingent liabilities (€ 36.7 billion), commitments to extend guarantees and letters of credit (€ 3.2 billion) and issued letters of credit (€ 2.1 billion).
– We capture and monitor qualitative and quantitative risk
indicators in our tool db-Score.
These systems help to give an overview of our current
operational risk profiles and to define risk management
measures and priorities. We monitor the status of imple-
mentation in a tracking tool, which forms the basis for
quarterly review by the Operational Risk Committee.
Our Group Chief Risk Officer has appointed a Chief
Risk Officer Operational Risk with Group-wide responsibili-
ty. He is represented on the Group Risk Committee and is
Chairman of the Operational Risk Committee. This com-
mittee, whose members include the divisional Operational
Risk Officers and representatives of Service Functions
and Corporate Center such as Audit, Controlling, Human
Resources, Legal, Tax and Compliance, develops and im-
plements our internal guidelines for managing operational
risk. In 2001 we have created an independent Operational
Risk function within each of our Group Divisions Corporate
and Investment Bank and Private Clients and Asset Man-
agement, headed by the divisional Operational Risk Offi-
cers. The Operational Risk Officers established divisional
Operational Risk Committees which meet on a monthly
basis.
We seek to minimize operational risk associated with
our communication, information and settlement systems
through the development of back-up systems and emer-
gency plans. We engage in regular employee training,
operating instructions and inspections to help limit opera-
tional defects or mistakes. Where appropriate, we pur-
chase insurance against operational risks.
The introduction of the euro has posed special opera-
tional risks. In 2001, we prepared for the final phase of the
euro’s introduction, including distribution of euro notes
and coins. In addition, the project comprised final conver-
sion of accounts and adaptation of our information tech-
nology systems. We incurred costs of € 161 million in 2001
in connection with this last phase of the euro conversion.
Insurance-Specific Risks
We have put in place instruments to monitor and manage
the risks specific to our insurance business, which is
focused on life insurance products. The risks specific to life
insurance are:
– the “accidental risk” that we will have to pay higher
benefits for policyholders than we expected, and
– the risk that we will not recognize changes in basic con-
ditions or in the behavior of policyholders promptly
enough to adjust our premiums or the terms on which
we write insurance policies or for which we are other-
wise unable to adjust premiums or terms.
Insurance companies like ours are also subject to general
underwriting and pricing risks. Our insurance businesses
have developed underwriting guidelines for the assump-
tion of risks appropriate to the local markets in which they
operate. We continuously monitor compliance with the
underwriting guidelines.
Our insurance businesses are exposed to a risk that
the price they charge for an insurance product may be
inadequate to cover the expenses we incur to cover future
obligations arising from that product. When we calculate
our premiums, we take into consideration assumptions as
to future investment returns, expenses, persistency, mor-
tality, morbidity and taxes, where appropriate.
We take into account the long-term nature of most of
the liabilities from our life insurance business by matching
assets and liabilities and suitable cash flows from our
investment portfolio to limit the liquidity risk we face.
In the normal course of business, we, like other insur-
ance companies, seek to limit losses, minimize exposure
to large risks, provide additional capacity for future growth
and effect business sharing arrangements by reinsuring
certain levels of risk in various areas of exposure with
other insurance enterprises or reinsurers. When our insur-
ance businesses enter reinsurance arrangements they are
not discharged from legal responsibility as the primary
insurer. We estimate amounts recoverable from reinsurers
in a manner consistent with the liability associated with
the reinsured policies.
194

195
Regulatory Risk Reporting
The following table shows the development of our risk
position, capital and reserves and capital adequacy ratios
for the companies we consolidate for the purposes of our
regulatory risk reporting. We calculate these figures in
compliance with BIS guidelines and the related guidance
of the German Banking Supervisory Authority.
in € m. 31.12.2001 31.12.2000**
Risk-weighted positions 297,063 291,951
Market risk equivalent* 8,016 7,928
Risk position 305,079 299,879
Core capital (Tier I) 24,803 23,504
Supplementary capital (Tier II) 12,255 15,839
Available Tier III capital 0 0
Total capital 37,058 39,343
Core capital ratio (Tier I) 8.1 % 7.8 %
Capital ratio (Tier I + II + III) 12.1 % 13.1 %
* A multiple of our value-at-risk, calculated with a probability level of 99 % and a ten-day holding period.
** Restated according to U.S. GAAP and unaudited.
Overall Risk Position
On December 31, 2001, our economic capital totaled
€ 20.9 billion, compared to € 15.7 billion as at December 31,
2000, taking into account cross-divisional diversification
effects of the credit portfolio. This does not include liquidity
risk and the risk at our insurance companies or the indus-
trial holdings of DB Investor. The following table allocates
our economic capital as at December 31, 2001 among
these risks. The overall increase is largely driven by the
inclusion of additional positions in the alternative assets’
risk calculation (part of market risk) and the general wors-
ening of the market environment for this risk class. More-
over, the methodology for operational risk and business
risk has been refined leading to an increase in business
risk and a slight decrease in operational risk.
E c o n o m i c C a p i t a l
in € m. 31.12.2001
Credit risks 9,064
Market risks 7,257
Operational risks 2,538
Business risks 2,026
Total 20,885
Risk Report
196
Statement by the Board of Managing Directors
The Board of Managing Directors of
Deutsche Bank AG is responsible for the
Consolidated Financial Statements. They
have been prepared in accordance with
the U.S. Generally Accepted Accounting
Principles and thus fulfil the conditions of
§ 292a German Commercial Code for
exemption from preparation of consoli-
dated financial statements in accordance
with German commercial law. In addition,
the disclosure requirements of the Euro-
pean Union are satisfied.
The responsibility for correct account-
ing requires an efficient internal manage-
ment and control system and a functioning
audit apparatus. Deutsche Bank’s internal
control system is based on written com-
munication of policies and procedures
governing structural and procedural organi-
zation, enlarged risk controlling for default
and market risks as well as the segrega-
tion of duties. It covers all business trans-
actions, assets and records. Deutsche
Bank’s audit is carried out in accordance
with the extensive audit plans covering all
divisions of the Group and also including
compliance with the organizational terms
of reference.
KPMG Deutsche Treuhand-Gesell-
schaft Aktiengesellschaft Wirtschafts-
prüfungsgesellschaft audited the Consoli-
dated Financial Statements in accordance
with German auditing regulations, and in
supplementary compliance with United
States Generally Accepted Auditing Stan-
dards and issued an unqualified opinion.
KPMG Deutsche Treuhand-Gesellschaft
and the Audit Department of Deutsche
Bank had free access to all documents
needed in the course of their audits for an
evaluation of the Consolidated Financial
Statements and for an assessment of the
appropriateness of the internal control
system.
Frankfurt am Main, March 5, 2002
Deutsche Bank AG
Josef Ackermann Clemens Börsig Rolf-E. Breuer
Tessen von Heydebreck Hermann-Josef Lamberti

Report of the Supervisory Board
197
The Supervisory Board held extensive discussions at its four meetings last year on the
bank’s business situation and strategy and the development of its Group Divisions as well
as on current events and fundamental policy issues.
Alongside the Annual Financial Statements for 2000 and planning for the financial
year 2001, discussions concentrated on the formation and tasks of the Group Divisions
Corporate and Investment Bank (CIB), Private Clients and Asset Management (PCAM),
and Corporate Investments (CI).
The Supervisory Board also discussed changes in the bank’s portfolio of holdings.
The relevant proposals of the Board of Managing Directors were closely examined and
approved, where required by German law or the Articles of Association.
The general economic situation was also the subject of regular and thorough discus-
sion, particularly with regard to its effects on the bank. Talks centered on the global inter-
est rate and currency situation, the change of the stock and bond markets, as well as the
development of important economies in the Triad and in selected emerging markets. The
work of the Supervisory Board Committees was regularly presented at each subsequent
meeting of the entire Supervisory Board.
The Supervisory Board and its Committees were informed regularly by the Board of
Managing Directors without delay and comprehensively on all of the important issues of
business development, strategy, earnings and risk situation, risk management and risk
controlling as well as staff development and principles of human resources policies – also
with regard to senior executives (Group Board Management Committee). Furthermore,
individual topics of current interest were also dealt with in regular discussions between
the Spokesman of the Board of Managing Directors and the Chairman of the Supervisory
Board.
In the course of its six meetings, the Credit and Market Risk Committee discussed
in due time all commitments subject to mandatory approval under German law and the
Articles of Association, and all major loans and loans entailing high risks. Where neces-
sary, the Committee gave its approval. Apart from credit, market, country and liquidity
risks, the Committee also reviewed operational risks. Global industry portfolios were pre-
sented and discussed at length. In particular, the Committee investigated the influence
of the events of September 11 on the bank’s various risk categories. The Committee also
obtained information on the Group Division Corporate Investments, including an overview
of its portfolio, organizational structure and internal authorization procedures.
The Chairman’s Committee met four times and the Audit Committee met twice in
the period under review. The Mediation Committee, established pursuant to the regula-
tions of the Co-Determination Act, was not convened in 2001.
Confirmations and Management Bodies
Hilmar Kopper
Chairman of the Supervisory Board

At its meeting on January 31, 2001, the Supervisory Board discussed the develop-
ment of the bank’s business in 2000 as well as the business plans for 2001. The Board of
Managing Directors reported on the new organizational structure providing for an align-
ment of the bank into the Group Divisions Corporate and Investment Bank (CIB), Private
Clients and Asset Management (PCAM) and Corporate Investments (CI). Furthermore,
the Supervisory Board resolved to extend the appointments to the Board of Managing
Directors of Dr. Josef Ackermann and Carl L. von Boehm-Bezing.
At its meeting on March 28, the Annual Financial Statements of Deutsche Bank AG
for 2000 were approved and thus established. The Consolidated Financial Statements
and Management Report were also approved. The same applied to the Report of the
Supervisory Board. The agenda for the General Meeting in 2001 was approved. Further-
more, the Supervisory Board gave its approval to the Corporate Governance Principles of
the bank. The Group’s risk situation was presented. The Supervisory Board resolved to
comply with Carl L. von Boehm-Bezing’s wish to allow his appointment to expire early
with effect from the General Meeting in 2001. Jürgen-Hinrich Fitschen was appointed full
member of the Board of Managing Directors of the bank with immediate effect for a peri-
od of five years until March 27, 2006.
On July 31, the Supervisory Board was informed of the development of business in
the first half of 2001 and of the structure and work in Controlling. A resolution was taken
to rename the “Bilanzausschuss” as “Prüfungsausschuss” (Audit Committee).
At its last meeting of the year on October 31, reports were given on the development
of the Group’s business in the first nine months of the year and on the planned activities
in the Group Division PCAM. Furthermore, the merger of Eurohypo AG with the mortgage
bank subsidiaries of Dresdner Bank AG and Commerzbank AG were discussed extensive-
ly, along with the acquisition of Scudder Investments and the sale of Deutscher Herold
Group and Deutsche Bank Offshore Group. The corresponding resolutions of the Supervi-
sory Board were subsequently taken in writing. A new version of the Terms of Reference
for the Supervisory Board was resolved. Approval was given to issue option rights to
shares of the bank to active staff of Deutsche Bank Group (Global Share 2001).
All of the members of the Supervisory Board participated in more than half of the
Supervisory Board meetings taking place during the period of their membership for the
year 2001.
Representatives of the bank’s auditor attended the Financial Statements Meetings of
the Supervisory Board, the Audit Committee and the Credit and Market Risk Committee
and commented on questions raised. The Audit Committee convinced itself of the inde-
pendence of the auditor.
KPMG Deutsche Treuhand-Gesellschaft Aktiengesellschaft Wirtschaftsprüfungs-
gesellschaft, Frankfurt am Main, the auditor of the Annual Financial Statements elected
at last year’s General Meeting, has audited the accounting, the Annual Financial State-
198
199
ments for 2001 and the Management Report as well as the Consolidated Financial State-
ments and the Notes, and issued an unqualified opinion. The relevant reports of the audi-
tor were given to the Supervisory Board for inspection. The Supervisory Board agrees with
the results of this audit.
The Annual Financial Statements, prepared by the Board of Managing Directors, have
been approved by the Supervisory Board today and are thus established. The Supervisory
Board agrees with the proposed appropriation of profits.
All of the members of the Supervisory Board have undertaken to voluntarily comply
with the Corporate Governance Principles of the bank issued during the preceding year to
avoid conflicts of interest. The members of the Supervisory Board took note of the Report
on Corporate Governance submitted by the Board of Managing Directors.
With effect from June 30, 2001, Dr. Klaus Liesen and Dr. Hermann Scholl resigned
from the Supervisory Board to avoid possible conflicts of interest due to their concurrent
mandates on the Supervisory Board of Allianz AG following its takeover of Dresdner
Bank AG. The court appointed Tilman Todenhöfer, Deputy Chairman of the Board of Man-
agement of Robert Bosch GmbH, with effect from July 16, 2001, and Sir Peter Job, former
Chief Executive Officer of Reuters Group, with effect from October 2, 2001, as succes-
sors. Gerhard Renner resigned from the Supervisory Board with effect from the General
Meeting in 2001. The District Court of Frankfurt am Main appointed Gerald Herrmann,
Federal Executive Secretary of Unified Services Union, as his successor with effect from
June 8, 2001. Heinz Brülls resigned his mandate with effect from December 31, 2001. As
his successor, Peter Kazmierczak, his substitute member, was appointed to the Super-
visory Board with effect from January 1, 2002.
The Supervisory Board is indebted to Dr. Liesen, Dr. Scholl, Mr. Renner and Mr. Brülls
for their loyal support and commitment.
The Supervisory Board would like to thank the Board of Managing Directors and the
bank’s employees for their great personal dedication.
Frankfurt am Main, March 22, 2002
The Supervisory Board
Hilmar Kopper, Chairman
Confirmations and Management Bodies
S u p e r v i s o r y B o a r d
Hilmar Kopper
Chairman,
Frankfurt am Main
Heidrun Förster*
Deputy Chairperson
Deutsche Bank 24 AG, Berlin
Dr. rer. oec. Karl-Hermann Baumann
Chairman of the Supervisory Board
of Siemens Aktiengesellschaft, Munich
Heinz Brülls*
Deutsche Bank AG, Aachen,
until December 31, 2001
Dr. Ulrich Cartellieri
Frankfurt am Main
Klaus Funk*
Deutsche Bank 24 AG,
Frankfurt am Main
Gerald Herrmann*
Federal Executive Secretary
of Unified Services Union, Berlin,
from June 8, 2001
Sabine Horn*
Deutsche Bank AG,
Frankfurt am Main
Sir Peter Job
London, from October 2, 2001
Prof. Dr. Henning Kagermann
Co-Chairman and CEO
of SAP AG,
Walldorf/Baden
Ulrich Kaufmann*
Deutsche Bank AG, Düsseldorf
Peter Kazmierczak*
Deutsche Bank AG, Essen,
from January 1, 2002
Adolf Kracht
Consultant, Munich
Supervisory Board
200
Professor Dr.-Ing. E. h.
Berthold Leibinger
Chairman of the Board of Management
of TRUMPF GmbH + Co. KG, Ditzingen
Dr. Klaus Liesen
Chairman of the Supervisory Board
of Ruhrgas AG, Essen, until June 30, 2001
Margret Mönig-Raane*
Vice President of
Unified Services Union, Berlin
Dr. Michael Otto
Chairman of the Board of Management
of Otto-Versand (GmbH & Co.), Hamburg
Gerhard Renner*
Member of the Board of DAW AG,
Managing Director of the Asset
Management of DAG GmbH, Hamburg,
until May 17, 2001
Dr. Hermann Scholl
Chairman of the Board of Management
of Robert Bosch GmbH, Stuttgart,
until June 30, 2001
Klaus Schwedler*
GTG Gesellschaft für Technisches
Gebäudemanagement mbH, Eschborn
Tilman Todenhöfer
Deputy Chairman of the Board of
Management of Robert Bosch GmbH,
Stuttgart, from July 16, 2001
Michael Freiherr Truchseß
von Wetzhausen*
Deutsche Bank AG, Frankfurt am Main
Lothar Wacker*
Deutsche Bank AG, Cologne
Dipl.-lng. Albrecht Woeste
Chairman of the Supervisory Board
and the Shareholders’ Committee
of Henkel KGaA, Düsseldorf
Committees
Chairman’s Committee
Hilmar Kopper
– Chairman
Heidrun Förster*
– Deputy Chairperson
Dr. Ulrich Cartellieri
Lothar Wacker*
Mediation Committee
Hilmar Kopper
– Chairman
Heidrun Förster*
– Deputy Chairperson
Dr. Ulrich Cartellieri
Ulrich Kaufmann*, from July 31, 2001
Gerhard Renner*, until May 17, 2001
Audit Committee
Hilmar Kopper
– Chairman
Heidrun Förster*
– Deputy Chairperson
Dr. rer. oec. Karl-Hermann Baumann
Heinz Brülls*, until December 31, 2001
Dr. Ulrich Cartellieri
Sabine Horn*, from January 30, 2002
Michael Freiherr Truchseß
von Wetzhausen*
Credit and Market
Risk Committee
Hilmar Kopper
– Chairman
Dr. rer. oec. Karl-Hermann Baumann
Dr. Ulrich Cartellieri
Dr. Klaus Liesen, until June 30, 2001
Sir Peter Job, from January 30, 2002
– Substitute Member
Adolf Kracht
– Substitute Member
* elected by the staff

Advisory Board
201
Confirmations and Management Bodies
A d v i s o r y B o a r d
Dr. Mark Wössner
Chairman
Munich
Dipl.-Volkswirt Dr. h. c. Tyll Necker
Deputy Chairman
President of Hako-Werke GmbH & Co.,
Bad Oldesloe
† March 28, 2001
Ulrich Hartmann
Deputy Chairman
from November 1, 2001,
Chairman of the Board of
Managing Directors
of E.ON AG, Düsseldorf
Carl L. von Boehm-Bezing
Frankfurt am Main, from May 28, 2001
Sir John Craven
London
until March 12, 2002
Dr. jur. Walter Deuss
KarstadtQuelle AG, Essen
Michael Dobson
Frankfurt am Main
Dr. Karl-Gerhard Eick
Member of the Executive Board
of Deutsche Telekom AG, Bonn
Dr. Michael Endres
Frankfurt am Main
Dr. Karl-Ludwig Kley
Member of the Executive Board
of Deutsche Lufthansa AG, Cologne
Max Dietrich Kley
Member of the Board
of Executive Directors
of BASF Aktiengesellschaft,
Ludwigshafen
Dr. Jürgen Krumnow
Frankfurt am Main
Georg Krupp
Frankfurt am Main
Francis Mer
Président Directeur Général
UNISOR, Paris
Heinz-Joachim Neubürger
Member of the Management Board
of Siemens Aktiengesellschaft,
Munich, until May 11, 2001
August Oetker
General Partner
of Dr. August Oetker, Bielefeld
Eckhard Pfeiffer
Houston
Dr. techn. h. c. Dipl.-lng. ETH
Ferdinand Piëch
Chairman of the Board of Management
of Volkswagen AG, Wolfsburg
Dr. rer. pol. Michael Rogowski
Chairman of the Supervisory Board
of J. M. Voith AG, Heidenheim
from June 1, 2001
Dr. rer. pol. Dipl.-Kfm.
Gerhard Rüschen
Bad Soden am Taunus
Dr. Ronaldo H. Schmitz
Frankfurt am Main
Jürgen E. Schrempp
Chairman of the Board of Management
of DaimlerChrysler AG, Stuttgart
Dipl.-lng. Hans Peter Stihl
Chairman of the Board and
Chief Executive Officer
of Andreas Stihl, Waiblingen
Dr. Frank Trömel
Deputy Chairman of the
Supervisory Board
of DELTON Aktiengesellschaft
für Beteiligungen,
Bad Homburg vor der Höhe
Marcus Wallenberg
Executive Vice President
INVESTOR AB, Stockholm
Dr. Ulrich Weiss
Frankfurt am Main
Werner Wenning
Member of the Board of Management
of Bayer AG, Leverkusen
Dr. Jürgen Zech
Gerling Group, Cologne

Board of Managing Directors
202
B o a r d o f M a n a g i n g D i r e c t o r s
Josef Ackermann
Carl L. von Boehm-Bezing
(until May 17, 2001)
Clemens Börsig
Rolf-E. Breuer
(Spokesman)
Thomas R. Fischer
(until January 30, 2002)
Jürgen Fitschen
(from March 28, 2001 until January 30, 2002)
Tessen von Heydebreck
Hermann-Josef Lamberti
Michael Philipp
(until January 30, 2002)

Group Five-Year Record Figures according to U.S. GAAP
203
Supplementary Information
in X m.
B a l a n c e S h e e t 2001 2000 1999 1998(1) 1997(1)
Total Assets 918,222 928,994 875,789 652,269 543,448Loans, net 259,838 274,660 254,173 218,160 199,019
Deposits 374,089 350,552 331,872 260,460 227,816Long-term debt 166,908 154,484 131,964 92,785 80,859Common shares 1,591 1,578 1,573 1,363 1,359Total shareholders’ equity 40,193 43,683 32,351 27,215 22,701
BIS core capital(2) 24,803 23,504 17,338 15,979 12,177BIS total capital(2) 37,058 39,343 35,172 29,343 24,692
I n c o m e S t a t e m e n t 2001 2000 1999 1998(1) 1997(1)
Net interest revenues 8,620 7,028 7,994 6,235 6,440Provision for loan losses 1,024 478 725 908 856Commissions and fee income 10,727 11,693 7,967 5,514 4,807Trading revenues, net 6,031 7,625 2,127 262 1,438Other noninterest revenues 4,243 8,133 6,944 5,192 5,159Total net revenues 28,597 34,001 24,307 16,295 16,988
Compensation and benefits 13,360 13,526 9,655 6,557 9,648Goodwill amortization 951 771 486 189 191Restructuring activities 294 125 459 289 –Other noninterest expenses 12,189 12,710 11,356 8,735 4,473Total noninterest expenses 26,794 27,132 21,956 15,770 14,312
Income before income tax expense (benefit)
and cumulative effect of accounting changes 1,803 6,869 2,351 525 2,676
Income tax expense 434 2,643 1,689 240 1,474Income tax expense (benefit) from the change in effective tax rate and the reversing effect 995 (9,287) (951) – –Cumulative effect of accounting changes, net of tax (207) – – – –Net income 167 13,513 1,613 285 1,202
K e y F i g u r e s 2001 2000 1999 19981 1997
Basic earnings per share X 0.27 X 22.00 X 2.76 X 0.54 X 2.33Diluted earnings per share X 0.27 X 21.72 X 2.74 X 0.54 X 2.33Dividends paid per share X 1.30 X 1.15 X 1.12 X 0.92 X 0.92Return on average total shareholders’ equity (RoE) 0.40% 39.16% 5.51% 1.34% –Return on adjusted average total shareholders’ equity(3) 0.53% 52.80% 7.98% 2.32% –Cost/income ratio 90.5% 78.7% 87.7% 91.7% 80.2 %Price/earnings ratio 294.07 4.12 30.56 90.31 –BIS core capital ratio (Tier I)(2) 8.1% 7.8% 5.9% 6.3% 5.2 %BIS capital ratio (Tier I + II + III)(2) 12.1% 13.1% 12.0% 11.5% 10.6 %Employees 94,782 98,311 93,232 75,306 76,141(1) Amounts in this column are unaudited. We have restated in euro the amounts we originally reported in Deutsche Mark, using the fixed conversion rate of DM 1.95583 per euro.(2) For 2001 and 2000 on the basis of U.S. GAAP, for 1999, and 1998 on the basis of IAS, for 1997 on the basis of the German Commercial Code.(3) We calculate an adjusted measure of our Return on Equity (RoE) to make it easier to compare us to our competitors. We refer to this adjusted measure as our “Active Equity”.
However, this is not a measure of performance under U.S. GAAP and you should not compare our ratio to other companies’ ratios without considering the differences in calcula-tion of the ratios. The principal item for which we adjust our ratio is the aggregate unrealized gains and losses (including tax effect) in our large portfolio of shareholdings in publicly-listed industrial companies. We include realized gains and losses (net of tax effect) in “Active Equity” from the time those shareholdings are sold and the related gains areemployed by our businesses.

204
Declaration of Backing
For the following companies, Deutsche
Bank AG ensures, except in the case of
political risk, that they are able to meet
their contractual liabilities:
DB Investments (GB) Limited, London
Deutsche Asset Management Europe GmbH, Frankfurt am Main(formerly: Deutsche Fonds Holding GmbH)
Deutsche Asset ManagementInternational GmbH, Frankfurt am Main (formerly: Deutsche Asset ManagementGmbH)
Deutsche Asset ManagementInvestmentgesellschaft mbHvormals DEGEF Deutsche Gesellschaft für Fondsverwaltung mbH,Frankfurt am Main
Deutsche Australia Limited, Melbourne
Deutsche Bank Americas Holding Corp.,New York/U.S.A. (formerly: Deutsche BankNorth America Holding Corp.)
Deutsche Bank Lübeck Aktiengesellschaftvormals Handelsbank, Lübeck
Deutsche Bank Luxembourg S.A.,Luxembourg
Deutsche Bank (Malaysia) Berhad,Kuala Lumpur
Deutsche Bank OOO, Moscow
Deutsche Bank Polska S.A., Warsaw
Deutsche Bank (Portugal), S.A., Lisbon(formerly: Deutsche Bank de Investimento,S.A.)
Deutsche Bank Rt., Budapest
Deutsche Bank S.A., Buenos Aires
Deutsche Bank S.A. – Banco Alemão,São Paulo
Deutsche Bank S.A./N.V., Antwerp (business domicile Brussels)
Deutsche Bank Saar Aktiengesellschaft,Saarbrücken
Deutsche Bank, Sociedad AnónimaEspañola, Barcelona
Deutsche Bank Società per Azioni, Milan
Deutsche Bank (Suisse) S.A., Geneva
Deutsche Bank Trust AktiengesellschaftPrivate Banking, Frankfurt am Main
Deutsche – Equities S.A., Paris (formerly:Deutsche Morgan Grenfell – Equities S.A.)
Deutsche Futures London Limited, London (formerly: Deutsche Morgan GrenfellFutures Limited)
Deutsche Futures Singapore Pte Ltd.,Singapore (formerly: Deutsche MorganGrenfell Futures Pte Ltd.)
Deutsche Grundbesitz-lnvestment-gesellschaft mbH, Eschborn
Deutsche GrundbesitzManagement GmbH, Eschborn
Deutsche Morgan Grenfell Group plc,London
Deutsche Securities Limited, Hong Kong(formerly: Deutsche Morgan GrenfellCapital Markets Limited)
Deutsche Securities Asia Limited,Hong Kong
DWS Investment GmbH, Frankfurt amMain (formerly: DWS DeutscheGesellschaft für Wertpapiersparen mbH)
DWS Investment S.A., Luxembourg(formerly: DB Investment Management S.A.)
Schiffshypothekenbank zu LübeckAktiengesellschaft, Hamburg
D e c l a r a t i o n o f B a c k i n g *
* Companies with which a profit and loss transfer agreement exists are marked in the List of Shareholdings.

205
Supplementary Information
G l o s s a r y
Balanced scorecard
Tool for transforming strategic manage-
ment goals into qualitative and quantita-
tive targets. The combination of financial
and non-financial figures allows a bal-
anced performance measurement at
various management levels.
Banking book
All risk positions that are not entered in
the � Trading book.
BIS
Bank for International Settlements domi-
ciled in Basel.
BIS capital ratio
Ratio used by international banks to
cover their default risk (risk-weighted
assets including off-balance-sheet trans-
actions) and � Market risk with regula-
tory capital (core capital, supplementary
capital and Tier III capital; � Capital and
reserves according to BIS). There is a
minimum ratio of 8 % for Tier I, Tier II
and Tier III capital to risk-weighted
assets and the market risk positions
multiplied by a factor of 12.5. A mini-
mum of 4 % is prescribed for the ratio of
core capital to risk-weighted assets.
Broker/brokerage
Brokers accept orders to buy and sell
securities from banks and private
investors and execute them on behalf of
the customer. For this activity, the bro-
ker usually receives a commission.
Business angels
Wealthy private individuals who con-
tribute their entrepreneurial experience,
business or technical know-how, their
networks of professional contacts and
capital to help get young technology
companies started. The advantage for
the business angel lies in the alternative
form of investing capital: while a direct
investment in new technology-oriented
companies entails high risks it also holds
a high return potential.
B2B (business to business)
Term used to describe the settlement of
� E-business between companies, i.e.
between suppliers, manufacturers and
commercial firms. B2B therefore relates
to the entire value-added chain.
Buyout
Purchase (in full or in part) of a company
or specific corporate activities.
Capital allocation
Allocation of available capital to the
business areas of a company.
Capital and reserves according to BIS
Regulatory capital and reserves accord-
ing to the Basel Capital Adequacy Accord
of 1988 (last amended in January 1996)
for international banks. They consist of
core capital (primarily share capital,
reserves and hybrid capital components),
supplementary capital (primarily participa-
tory capital, long-term subordinated
liabilities, unrealized gains on listed
securties and general allowance for loan
Agency debt
Debt issued by U.S. government-backed
mortgage corporations such as Freddie
Mac and Fannie Mae.
Alternative assets
Direct investments in private equity,
venture capital, mezzanine capital, real
estate capital investments and invest-
ments in leveraged buyout funds, ven-
ture capital funds and hedge funds.
Arbitrage
The simultaneous buying and selling of
the same security in different markets,
intended to achieve profits with little to
no risk.
Asset backed securities
Particular type of securitization of pay-
ment receivables in the form of tradable
securities. These securities are created
by the repackaging of certain financial
assets (� Securitization).
Asset financing
A type of finance for selected assets in
the corporate and consumer sector.
Back-testing
Back-testing is used to verify the predic-
tive power of the � Value-at-risk model.
Daily profits and losses are compared
with the estimates we had forecast
using the value-at-risk model.
Glossary

206
G l o s s a r y
Confidence level
The probability of a potential loss arising
within the interval stated by the � Value-
at-risk.
Corporate finance
General term for capital market-related,
innovative financing services that meet
special consulting requirements in corpo-
rate customer business.
Corporate Trust and Agency Services
Services to safeguard the smooth admin-
istration of equity and fixed-income finan-
cings, sometimes known as post-IPO
services.
Cost/income ratio
In general: a ratio for assessing a com-
pany’s cost effectiveness which ex-
presses operating expenses in relation
to operating income.
Here: sum of noninterest expenses as a
percentage of the aggregate sum of
net interest revenues and noninterest
revenues.
Country risk
Risk that counterparties are no longer
able to fulfil their payments obligations
as a result of government measures
(such as currency transfer restrictions) or
country-specific economic factors (such
as currency devaluations.)
Credit derivative
Instruments with which � Credit risks
connected with loans, bonds or other
risk-weighted assets or market risk posi-
tions are transferred to collateral provi-
ding parties. This does not alter or re-
establish the underlying credit relation-
ship of the original risk takers (parties
selling the credit risks).
Credit product
Primarily specialized lending such as
structured products and forms of finance
for corporate acquisitions (� Leveraged
finance).
Credit risk
Risk that customers may not be able
to meet their contractual payment obli-
gations. Credit risk includes default risk,
country risk and settlement risk.
Credit trading
Trading in loan or credit-related products.
Custody
Custody and administration of securities
as well as additional services in the field
of securities.
Derivative
Product whose value derives largely from
the price, price fluctuations or price expec-
tations of an underlying instrument (e.g.
share, bond, foreign exchange or index).
Derivatives include � Swaps, � Options
and � Futures.
losses) and Tier III capital (mainly short-
term, subordinated debt and excess
Tier II capital).
Cash flow statement
Calculation and presentation of the cash
flow a company has generated or con-
sumed during a financial year as a result
of its business, investing and financing
activities, and reconciliation of holdings
of cash and cash equivalents (cash re-
serve) at the beginning and end of a
financial year.
Cash management
Cash management covers the manage-
ment of liquid assets in dollars, euro and
other currencies for companies and
financial institutions to optimize financial
activities.
Commitment
Ability to identify with one’s company,
its goals and values, the willingness to
work hard and the inclination to stay
with the company.
Comprehensive income
Change of equity excluding transactions
with shareholders (e.g. dividends, issu-
ance of shares). It primarily consists of
net income and � Other comprehensive
income.

207
audited by an official environmental
expert.
Economic capital
Capital designated to cover unexpected
losses suffered as a result of � Credit
risk, � Market risk or � Operational risks
and � Business risks. It must therefore
be clearly distinguished from reported
capital and reserves. Required economic
capital corresponds to the estimated
loss that, based on a certain probability
(� Confidence level), will not be
exceeded in any given year. The aggre-
gate economic capital figure for the
overall bank states how much equity
capital the bank needs to hold to be able
to meet its obligations even in case of
extreme losses.
Electronic banking
The transaction of banking business via
electronic networks such as the � Inter-
net or by data carrier exchange.
Emerging markets
Up-and-coming markets in developing
nations, mainly in the financial sector.
Equity capital markets
Primarily, activities connected with the
IPO of a company or the placement of
new shares. This also covers the privati-
zation of state-owned companies.
Equity method
Valuation method for holdings in com-
panies whose business policy can be
significantly influenced (associated com-
panies). Under the equity method the pro
rata share of the company’s net
income/loss is reflected in the book value
of the holding. For distributions the value
is reduced by the pro rata amount.
Euro medium-term notes (MTNs)
Medium-term notes are flexible bond
programs used to issue unsecured debt
instruments at different times. Volumes,
currencies and maturities (one to ten
years) can be adjusted according to
financing needs. Euro-MTNs are issued
on the Euromarket mainly in U.S. dollars;
bank syndicates guarantee the complete
placement of each issue.
Event risk scenario
Event risk scenarios describe important
events, e.g. large movements in interest
rate or exchange rates.
Exposure
Amount of money the bank stands to
lose in case of losses suffered as a result
of a risk taken on, for instance in case of
payment default on the part of
a borrower or contracting partner.
Fair value
Amount at which assets or liabilities
would be traded fairly between knowl-
edgeable, willing and independent
counterparties. Fair value is often iden-
tical to market price.
Direct brokerage
Securities trading (broking) by online
media such as the � Internet or by
telephone. Direct brokerage clients
decide themselves what securities they
trade and when they trade them. In doing
so, they do not receive any personal advice
from the bank.
Earnings per share
Key figure determined according to
� U.S. GAAP which expresses a com-
pany’s net income in relation to the
average number of common shares.
Apart from basic earnings per share,
diluted earnings per share must also be
reported if the conversion and exercise
of outstanding stock options, share
awards and convertible bonds could
raise the number of shares.
E-business/e-commerce
The aggregate total of all electronic data
exchanged in connection with commer-
cial activities: information flows and
transactions with products or services.
E-commerce covers relations between
companies, companies and authorities
and companies and private individuals.
E-commerce uses various forms of data
transmission (telephone, television,
data networks � Internet).
Eco-audit
An official certificate documenting that
a company’s environmental management
system complies with EU regulations.
It is awarded after the company’s
environmental management has been
Supplementary Information

208
G l o s s a r y
(instead of physical delivery or purchase
of securities).
General business risk
Risk arising from changes in general
business conditions, such as our market
environment, client behavior and techno-
logical progress. These can affect our
earings if we are unable to adjust quickly
to changing conditions.
Global-E activities
For Deutsche Bank, Global-E means all
of its electronic business activities.
Global-E is a synonym for Deutsche
Bank’s Internet strategy. Features of
Global-E include several major products
in � E-commerce.
Goodwill
The amount the buyer of a company
pays in expectation of future earnings,
over and above the � Fair value of the
individual identifiable assets and liabili-
ties.
Growth financing
Growth investing in private equity con-
sists of investing in privately held com-
panies that are raising financing in order
to fund growth initiatives within the
business.
Hedge accounting
Balance sheet reporting of hedging
relationships (creation of valuation units)
which are subject to certain precondi-
tions.
Hedge funds
A fund generally invested in by institu-
tions and wealthy individuals. Hedge
funds can employ strategies often un-
available to mutual funds. Examples
include short selling, leveraging, � Arbi-
trage and � Derivatives. Because there
is a legal restriction of no more than
100 investor in the U.S.A., the minimum
investment is typically U.S.$ 1 million.
Hedge fund returns are often uncorrelat-
ed with traditional investment returns.
Hybrid capital instruments
Capital instruments characterized by
profit-related payments that are not accu-
mulated in case of loss. Under banking
regulations they are part of core capital.
They are shown as subordinated capital
on the balance sheet.
IAS (International Accounting Stan-
dards)
Accounting standards developed by
international associations of accoun-
tants, preparers of financial statements
and financial experts; these standards
ensure comparability of accounting and
disclosure not just within the European
Union but worldwide. The main objective
of such reporting is to present informa-
tion needed for decision-making by a
broad group of parties interested in
financial statements, especially inves-
tors. The body of rules contains general
reporting principles and, at present,
roughly forty standards.
Finance Center
On the basis of a relationship banking
approach, personal and small business
customers can obtain advice on ques-
tions of company pension schemes,
company start-ups or property finance.
Fund of funds
In Germany: a securities fund that in-
vests in other funds. Investments can be
made in any fund registered for public
distribution in Germany. For reasons of
risk diversification, funds of funds may
not invest more than 20 % of their as-
sets in any one target fund. For custom-
ers, funds of funds combine a risk-
adjusted � Portfolio with professional
fund picking.
International: a mutual fund that invests
in other mutual funds. These can be
securities funds, real estate funds,
� Hedge funds or private equity funds.
Fund services
A number of services performed on
behalf of third party fund managers,
ranging from valuations, share registra-
tion, custodian bank services to ac-
counting and risk management services.
Futures
Forward contracts standardized with
respect to quantity, quality and delivery
date, in which an instrument traded on
the money, capital, precious metal or
foreign exchange market is to be bought
or sold at an agreed price at a certain
future date. Cash settlement is often
stipulated for such contracts (e.g. those
on equity indices) to meet the obligation

209
Investor relations
Investor relations describes the syste-
matic and continuous two-way commu-
nication between companies and both
current and potential providers of capital.
Information is made available on major
corporate events, financial results, busi-
ness strategy and the capital market’s
expectations of management. One of
the main objectives of investor relations
is to ensure that a company’s equity is
correctly valued by the market.
Investor Services
Offers investment services, performance
measurement, portfolio advisory ser-
vices, trust and portfolio administration,
securities lending and structured invest-
ment management.
Leveraged finance
Financing a company purchase, usually
transacted with the help of outside
capital investors and, as a rule, involving
the management. Typical is a very high
leverage on the financing of the pur-
chase price, that is serviced solely on
the basis of the future cash flow of the
take-over target and collateralized with
the company’s assets.
Liquidity risk
Risk to our earnings and capital arising
from our potential inability to meet
payment obligations when they are due
without incurring unacceptable losses.
Mark to market
Valuation at current market prices.
Applies, for instance, to trading activities
(� Trading profit).
Market risk
Arises from the uncertainty concerning
changes in market prices and rates
(including interest rates, equity prices,
foreign exchange rates and commodity
prices), the correlations among them and
their levels of volatility.
Mergers & acquisitions (M&A)
Company amalgamations and takeovers.
Mezzanine
Mezzanine investments primarily consist
of investments in debt securities with an
equity component. The debt securities
typically rank junior to the issuer’s bank
debt but senior to other debt securities,
preferred stock and common equity. The
equity component is usually in the form
of warrants.
Monte Carlo simulation
A Monte Carlo simulation is a model that
calculates profit or loss for a transaction
by analyzing a large number of different
market scenarios (10,000 for instance).
Netting agreement
An arrangement reached between two
parties that under certain circumstances
– insolvency, for instance – mutual claims
from outstanding business can be offset
against each other. The inclusion of a
Internet
The world’s biggest computer network
that consists of numerous interlinked
networks and individual resources. The
Internet’s main services include elec-
tronic post (e-mail), the world wide web
(www), search engines, file transfer (FTP)
and discussion forums (Usenet/news-
groups).
Internet portal
A gateway on the � Internet designed
as a navigation aid for users through
the World Wide Web. Data is compiled
and processed to present web contents
in a clearly structured manner.
Intranet
An in-house electronic network that uses
Internet technologies and is located in
the � Internet. It offers features such
as information services, job offers and e-
mail facilities for staff. Usually a firewall
will be installed between the � Internet
and the Intranet which protects the
internal network from damage and unau-
thorized access from the � Internet but
allows full access to the latter.
Investment banking
Generic term for capital market-orien-
ted business. This primarily includes
the issuing and trading of securities
and their � Derivatives, interest and
currency management, � Corporate
finance, M&A advisory functions, struc-
tured financing and � Private equity.
Supplementary Information

210
G l o s s a r y
prehensive income in shareholders’
equity.
Personal and
online investment centers
Deutsche Bank 24’s personal investment
center offers customers investment faci-
lities with advice at the bank’s branches.
maxblue, Deutsche Bank’s online in-
vestment center, enables clients to trade
securities over the � Internet. Taken
together, these offerings provide cus-
tomers with an optimum level of service
in securities and investments.
Personal Banking
In general: business with private individ-
uals, self-employed people and small
businesses.
Here: branch business including com-
plementary distribution channels such as
self-service, online banking and cards.
Personal Banking does not include �
Private Banking.
Portfolio
In general: all or a selection of assets
held, belonging to one or more category
(e.g. securities, loans, equity participa-
tions or real estate). Portfolios are
formed primarily to diversify risk.
Securities: similar deals, in particular
securities and/or � Derivatives, grouped
together according to price risk criteria.
Portfolio management
Management and administration of a
� Portfolio of securities for a client.
This can involve continual review of the
portfolio with purchases and sales, as
agreed with the client.
Private Banking
Business with high-net-worth and capi-
tal-accumulating clients.
Private equity
Equity investment in non-listed compa-
nies. Examples are venture capital and
buy-out funds.
Projected unit credit method
An accrued benefit valuation method,
according to SFAS 87, used to determine
the actuarial present value of an enter-
prise’s defined benefit obligations and
the related current service cost. This
method takes into account the expected
rates of salary increases, for instance, as
the basis for future benefit increases.
The rate used to discount post-employ-
ment benefit obligations is determined
by reference to market yields at the
balance sheet date on high quality corpo-
rate bonds.
Rating
1) External: Standardized evaluation of
issuers’ credit standing and debt
instruments, carried out by special-
ized agencies.
2) Internal: Detailed risk assessment of
every � Exposure associated with an
obligor.
Registered shares
Shares registered in the name of a
certain person. As required under joint
legally binding netting agreement re-
duces the default risk from a gross to a
net amount.
Online banking
The transaction of banking business via
electronic networks (� Internet).
Operational risk
Potential for incurring losses in relation
to staff, technology, projects, assets,
customer relationships, other third par-
ties or regulators, such as through un-
managegable events, business disrup-
tion, inadequately defined or failed
processes or control/system failure.
Option
Right to purchase (call option) or sell (put
option) a particular asset (e.g. security or
foreign exchange) from a counterparty
(seller) at a predetermined price at or
before a specific future date.
OTC derivative
Non-standardized financial instrument
(� Derivative) not traded on a stock
exchange but directly between market
participants (over the counter).
Other comprehensive income
Primarily includes such items as unreal-
ized gains and losses on foreign curren-
cy translation and on securities available
for sale. These unrealized gains and
losses are not included in net income
but reported in accumulated other com-

211
Return on equity (RoE)
In general: ratio showing the income
situation of a company or bank, relating
profit (net income) to capital employed.
Here: net income as a percentage of
average capital employed over the year
� Return on adjusted average total
shareholders’ equity.
Risk management services
Services to identify and quantify a com-
pany’s risks that are dependent
on each other, and to derive effective
strategies of risk diversification.
Risk position according to BIS
The risk position according to BIS is
made up of risk-weighted assets, com-
prising above all the counterparty risks of
the � Investment book and the �
Trading book, and the risk-weighted
amounts of the market risk position
(interest, foreign exchange, equity and
commodity price risks). The bank’s risk
position must be computed in accor-
dance with regulatory requirements and
backed by equity.
Securities available for sale
Securities which are not held for trading
purposes and not held to maturity (debt
securities) and are carried at fair value.
Changes in the fair value are generally
reported in accumulated other compre-
hensive income within stockholders’
equity. If there are other than temporary
declines in fair value below the amor-
tized costs the difference between the
two is recognized in expenses. Realized
gains and losses are also reflected in the
Income Statement of the Group.
Securitization
In general: rights evidenced by securities
(e.g. shares or bonds).
Here: replacing loans or financing various
kinds of claims by issuing securities
(such as bonds or commercial paper).
Segment information
Disclosure of a company’s assets and
income, broken down by activity (divi-
sion) and geographical area (region).
Shareholder value
Management concept that focuses stra-
tegic and operational decision-making on
steadily increasing a company’s value.
The guiding principle is that only returns
above the cost of capital add value for
shareholders.
Start-up investment
Capital participation in an early phase of
company development.
Structured products
Financial products comprised of ele-
mentary investment instruments from
the interest, stock, foreign exchange
or commodities areas.
Sustainability
Sustainability stands for the interplay
of the economy, ecology and social
responsibility with the objective of sus-
stock company law, that person is regis-
tered in the share register with several
personaldetails and the number of shares
owned. Only those persons entered in
the share register are deemed to be
shareholders of the company and are
entitled, for instance, to exercise rights
at the General Meeting.
Relationship banking/management
In general: together with product special-
ists, qualified relationship managers look
after selected corporate customers in a
defined market segment.
Here: a relationship management
approach in national and international
corporate client business.
Repo
An agreement to repurchase securities
sold (genuine repurchase agreement
where the asset is still the property of
the seller). From the buyer’s viewpoint,
the transaction is a reverse repo.
Return on adjusted average total
shareholders’ equity
An adjusted measure to make it easier
to compare us to our competitors. The
principal item for which we adjust our
ratio is the aggregate unrealized gains
and losses (including tax effect) in our
portfolio of shareholdings in publicly-
listed industrial companies. We include
realized gains and losses (net of tax
effect) in the Active Equity position from
the time those shareholdings are sold
and the related gains are employed by
our businesses. � Return on equity
(RoE).
Supplementary Information

212
G l o s s a r y
Trust banking
Generic term for all types of securities
transactions. It mainly comprises finan-
cial analyses, investment advice for
clients, portfolio management and secu-
rities custody and settlement.
U.S. GAAP (United States Generally
Accepted Accounting Principles)
U.S. accounting principles drawn up by
the Financial Accounting Standards
Board (FASB) and the American Institute
of Certified Public Accountants (AICPA).
In addition, the interpretations and expla-
nations furnished by the Securities and
Exchange Commission (SEC) are particu-
larly relevant for companies listed on the
stock exchange. As in the case of � IAS
the main objective is to provide informa-
tion needed for decision-making in con-
nection with financial statements, espe-
cially for investors.
Value-at-risk
Value-at-risk measures, for a given port-
folio, the potential future loss (in terms
of market value) that, under normal
market conditions, will not be exceeded
in a given period and with a defined �
Confidence level.
Xavex HedgeSelect Certificate
Share (certificate) in a � Portfolio of
� Hedge funds combined to spread risk.
tainably advancing the basis of human
life while preparing it for the future.
Swaps
In general: exchanging one payment
flow for another.
Interest rate swap: exchanging interest
payment flows in the same currency with
different terms and conditions (e.g. fixed
or floating).
Currency swap: exchange of interest
payment flows and principal amounts in
different currencies.
Trading book
A banking regulatory term for positions
in financial instruments, shares and
tradable claims held by a bank and which
are intended for resale in the short term
to benefit from price and interest rate
fluctuations. This also includes business
that is closely associated with trading
book positions (e.g. for hedging pur-
poses). Risk positions not belonging to
the trading book are shown in the
� Investment book.
Trading profit
Balance of income and expenses from
proprietary trading in securities, financial
instruments (especially � Derivatives),
foreign exchange or precious metals
valued at market prices (� Mark to mar-
ket). This item also includes the propor-
tion of interest accruing, dividends and
funding components allocated to trading
activities, plus commissions from pro-
prietary trading.
Impressum/Publications
213
I m p r e s s u m / P u b l i c a t i o n s
Deutsche Bank Aktiengesellschaft
Taunusanlage 12
D-60262 Frankfurt am Main
Telephone: +49 69 9 10-00
e-mail: [email protected]
Investor Relations:
+49 69 9 10-3 80 80
e-mail: [email protected]
Annual Report on the Internet:
www.deutsche-bank.com/01
Photos
Group Executive Committee
page 8:
Frank Bauer, London (1)
Wolfgang von Brauchitsch, Bonn (1)
Andreas Pohlmann, Munich (3)
Gary Spector, New York (1)
page 9:
Harry Borden, London (1)
Andreas Pohlmann, Munich (3)
Gary Spector, New York (1)
Andreas Teichmann, Essen (1)
Portraits of Deutsche Bank
shareholders
pages 18, 22, 28, 34, 40, 44, 48 and 51:
Florian Jaenicke, Hamburg
Supervisory Board
page 197
Andreas Pohlmann, Munich
Forward-looking statements contain risks
This report contains forward-looking statements.
Forward-looking statements are statements that
are not historical facts, including statements
about our beliefs and expectations. Any state-
ment in this report that states our intentions,
beliefs, expectations or predictions (and the
assumptions underlying them) is a forward-
looking statement. These statements are based
on plans, estimates and projections as they are
currently available to the management of
Deutsche Bank. Forward-looking statements
therefore speak only as of the date they are
made, and we undertake no obligation to update
publicly any of them in light of new information
or future events.
By their very nature, forward-looking state-
ments involve risks and uncertainties. A number
of important factors could therefore cause actual
results to differ materially from those contained
in any forward-looking statement. Such factors
include the conditions in the financial markets in
Germany, in Europe, in the United States and
elsewhere from which we derive a substantial
portion of our trading revenues, potential
defaults of borrowers or trading counterparties,
the implementation of our restructuring includ-
ing the envisaged reduction in headcount, the
reliability of our risk management policies, pro-
cedures and methods, and other risks refer-
enced in our filings with the U.S. Securities
and Exchange Commission. Such factors are
described in detail in our SEC Form 20-F of
September 20, 2001 on pages 9 through 13 under
the heading “Risk Factors”. Copies of this
document are available upon request or can be
downloaded from www.deutsche-bank.com/ir.
We shall be happy to send you any of
the following publications relating to
the financial statements:
Results 2001 – Annual Report of
Deutsche Bank Group (U.S. GAAP)
(German, English and French;
Spanish – as Short Summary)
Form 20-F (English)
Annual Financial Statements
and Management Report of
Deutsche Bank AG for 2001
(German, English, French)
List of mandates 2001
(German/English)
List of shareholdings 2001
(German/English)
List of Advisory Council members 2001
(German)
Corporate Governance Principles
(German, English)
Corporate Governance Report 2001
(German, English)
How to order:
– by e-mail to [email protected]
– on the internet at
www.deutsche-bank.com/01
– by fax to +49 69 95 00 95 29
– by phone to +49 69 95 00 95 30
– by post from:
Deutsche Bank AG
Leser-Service-PKS
D-60262 Frankfurt am Main
Germany

Financial Calendar for 2002
April 29, 2002 Interim Report as at March 31, 2002
May 22, 2002 General Meeting in the Festhalle, Frankfurt am Main (Exhibition Centre)
May 23, 2002 Dividend payment
August 1, 2002 Interim Report as at June 30, 2002
003 83304 02 · 3/02