results - inflibnetshodhganga.inflibnet.ac.in/bitstream/10603/39025/14/14...58 chapter 4 results 4.1...
TRANSCRIPT

58
Chapter 4
Results
4.1 PLANT EXTRACTS
Herbal medicines have a vital role in the prevention and treatment of cancer.
According to one of the ancient proverbs in India, “there is no plant on earth which
has no medicinal property”. Hence, the present study have utilized the potentials of
two medicinal plants, O. indicum and R. emodi, and tested their cell annihilation
capacities against human breast cancer cells through molecular targets.
The use of five different solvents namely petroleum ether, chloroform, ethyl
acetate, methanol and water to extract phytocomponents from these plants through
soxhlet extraction and cold maceration have collectively yielded 20 crude extracts
(PHO, PCO, CHO, CCO, EHO, ECO, MHO, MCO, AHO, ACO, PHR, PCR, CHR,
CCR, EHR, ECR, MHR, MCR, AHR and ACR). The minimum obtained extract yield
was for PCO (0.26% of dry mass); while the maximum yield was for MHR (37.86%
of dry mass). The yields (per 50 g of dry mass) for all the extracts were enlisted in
table 4.1.
Table 4.1: List of crude extracts from O. indicum and R. emodi, with their yield.
Solvents
Oroxylum indicum
Soxhlet
Yield per
50 g dry
mass (in g)
Maceration
Yield per
50 g dry
mass (in g)
Petroleum ether PHO 0.29 PCO 0.13
Chloroform CHO 0.20 CCO 0.15
Ethyl acetate EHO 0.37 ECO 0.19
Methanol MHO 1.36 MCO 0.49
Water AHO 1.7 ACO 1.02
59
Rheum emodi
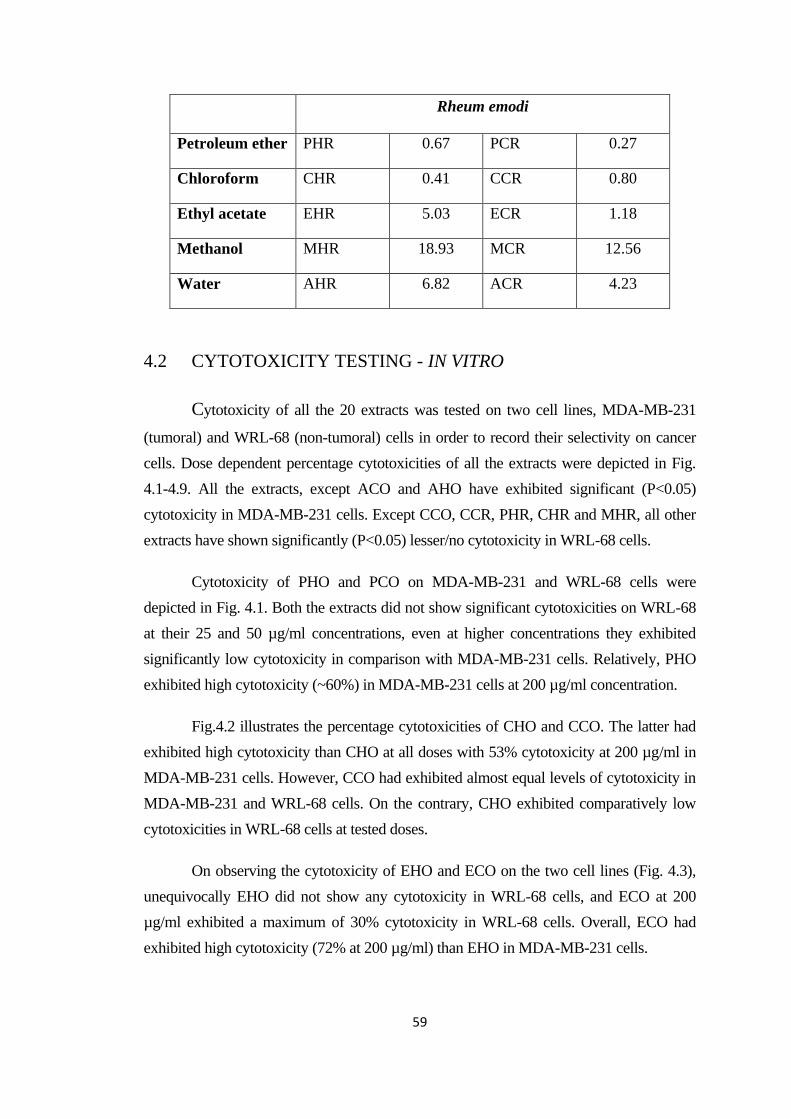
Petroleum ether PHR 0.67 PCR 0.27
Chloroform CHR 0.41 CCR 0.80
Ethyl acetate EHR 5.03 ECR 1.18
Methanol MHR 18.93 MCR 12.56
Water AHR 6.82 ACR 4.23
4.2 CYTOTOXICITY TESTING - IN VITRO
Cytotoxicity of all the 20 extracts was tested on two cell lines, MDA-MB-231
(tumoral) and WRL-68 (non-tumoral) cells in order to record their selectivity on cancer
cells. Dose dependent percentage cytotoxicities of all the extracts were depicted in Fig.
4.1-4.9. All the extracts, except ACO and AHO have exhibited significant (P<0.05)
cytotoxicity in MDA-MB-231 cells. Except CCO, CCR, PHR, CHR and MHR, all other
extracts have shown significantly (P<0.05) lesser/no cytotoxicity in WRL-68 cells.
Cytotoxicity of PHO and PCO on MDA-MB-231 and WRL-68 cells were
depicted in Fig. 4.1. Both the extracts did not show significant cytotoxicities on WRL-68
at their 25 and 50 µg/ml concentrations, even at higher concentrations they exhibited
significantly low cytotoxicity in comparison with MDA-MB-231 cells. Relatively, PHO
exhibited high cytotoxicity (~60%) in MDA-MB-231 cells at 200 µg/ml concentration.
Fig.4.2 illustrates the percentage cytotoxicities of CHO and CCO. The latter had
exhibited high cytotoxicity than CHO at all doses with 53% cytotoxicity at 200 µg/ml in
MDA-MB-231 cells. However, CCO had exhibited almost equal levels of cytotoxicity in
MDA-MB-231 and WRL-68 cells. On the contrary, CHO exhibited comparatively low
cytotoxicities in WRL-68 cells at tested doses.
On observing the cytotoxicity of EHO and ECO on the two cell lines (Fig. 4.3),
unequivocally EHO did not show any cytotoxicity in WRL-68 cells, and ECO at 200
µg/ml exhibited a maximum of 30% cytotoxicity in WRL-68 cells. Overall, ECO had
exhibited high cytotoxicity (72% at 200 µg/ml) than EHO in MDA-MB-231 cells.

60
A)
B)
Fig. 4.1: Dose-dependent cytotoxicity of PHO (A) and PCO (B) on MDA-MB-231
and WRL-68 cells.

61
A)
B)
Fig. 4.2: Dose-dependent cytotoxicity of CHO (A) and CCO (B) on MDA-MB-231
and WRL-68 cells.

62
A)
B)
Fig. 4.3: Dose-dependent cytotoxicity of EHO (A) and ECO (B) on MDA-MB-231
and WRL-68 cells.

63
A)
B)
Fig. 4.4: Dose-dependent cytotoxicity of MHO (A) and MCO (B) on MDA-MB-231
and WRL-68 cells.

64
Both MHO and MCO resulted in a dose-dependent increase of cytotoxicity on
MDA-MB-231 cells. Cytotoxicity on WRL-68 cells expressed by MHO was minimal
with only 20% at 200 µg/ml, whereas MCO demonstrated a high cytotoxicity in
WRL-68 cells compared with MDA-MB-231 cells at all doses (Fig. 4.4). The extracts
AHO and ACO did not show significant (P<0.05) cytotoxicity on both the cell lines.
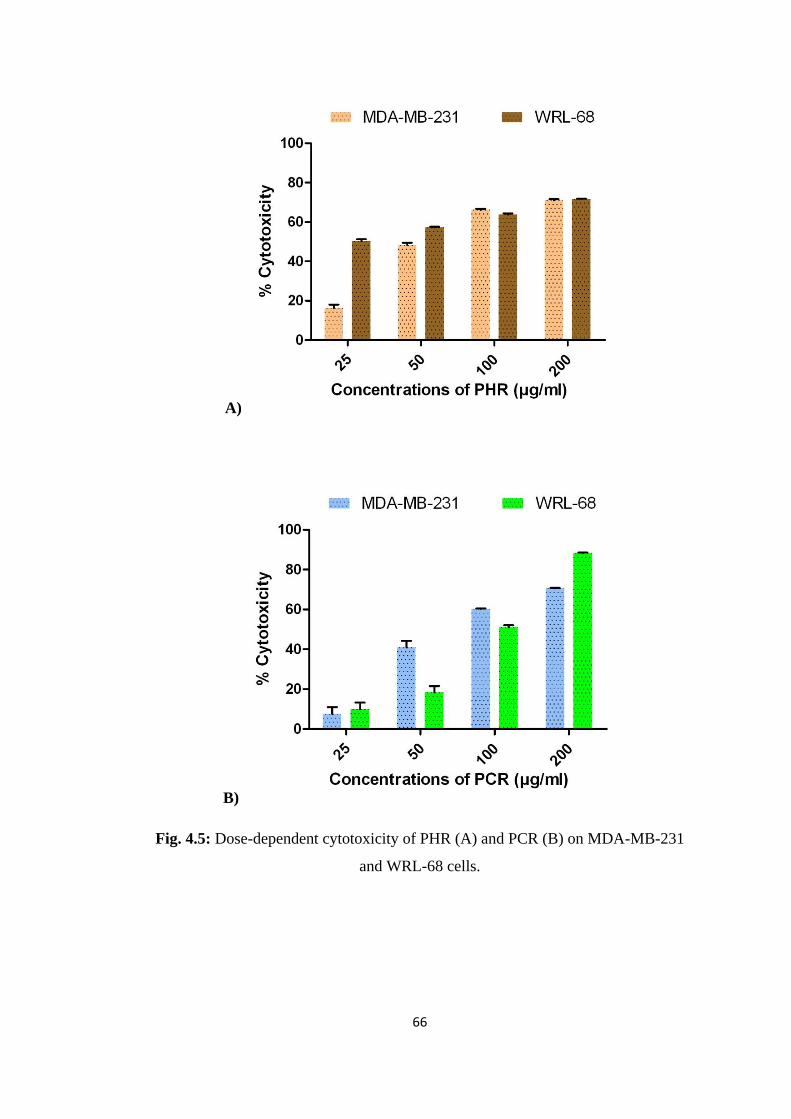
In Fig. 4.5, percentage cytotoxicities of PHR and PCR were portrayed. PHR and
PCR displayed a dose-dependent increase in cytotoxicity on MDA-MB-231 cells.
Except 100 µg/ml of PHR, and 50 and 100 µg/ml of PCR, all other doses of both
extracts exhibited high/equal cytotoxicity in WRL-68 cells in comparison with MDA-
MB-231 cells.
In the case of CHR and CCR, the percentage cytotoxicities exhibited in WRL-
68 cells were high than in MDA-MB-231 cells (200 µg/ml of CHR - 97%, and 100
and 200 µg/ml of CCR - 93% and 94% in WRL-68 cells) (Fig. 4.6). Nonetheless,
CHR had also exhibited a nearly high cytotoxicity of 87% in MDA-MB-231 cells.
Fig 4.7 illustrates the dose-dependent increase of cytotoxicities in MDA-MB-
231 and WRL-68 cells exhibited by EHR and ECR. Both the extracts have exhibited
significantly (P<0.05) high cytotoxicity at all doses in MDA-MB-231 cells in
comparison with WRL-68 cells. The maximum cytotoxicities exhibited by EHR and
ECR at 200 µg/ml were 86% and 66% respectively in MDA-MB-231 cells.
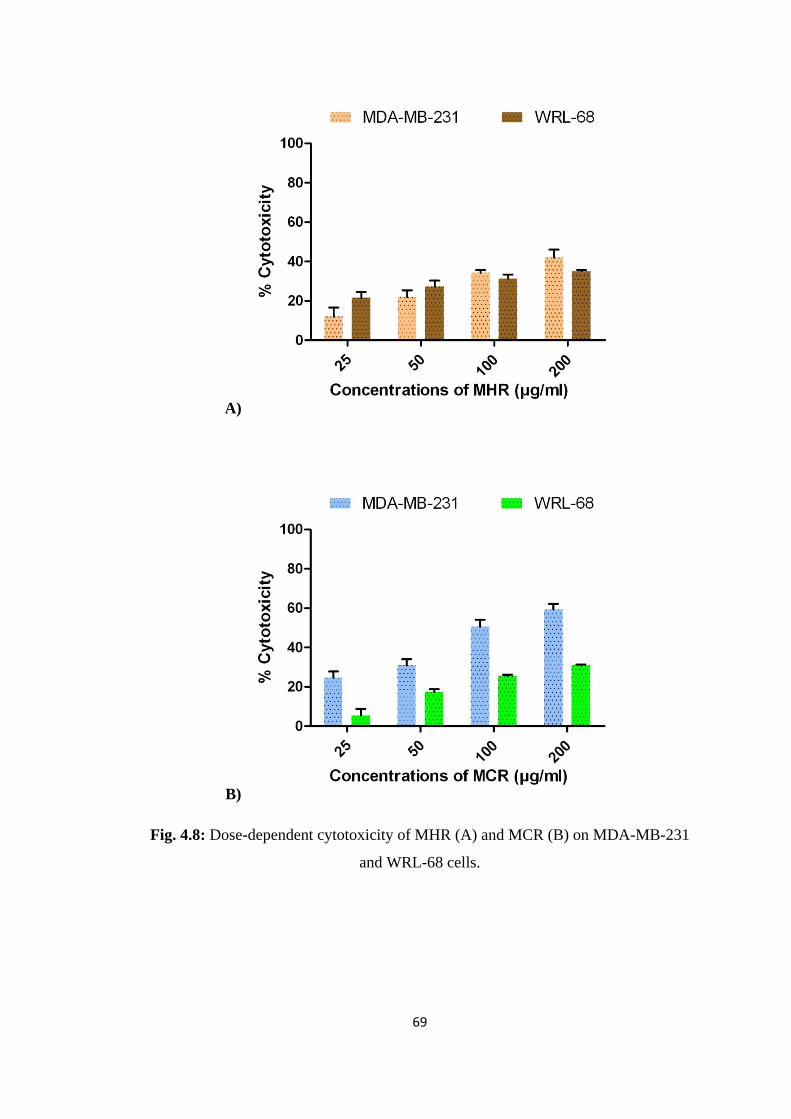
Percentage cytotoxicities of MHR and MCR in MDA-MB-231 cells and WRL-68
cells were depicted in Fig. 4.8. MCR had exhibited a significantly (P<0.05) higher
cytotoxicity in MDA-MB-231 cells than in WRL-68 cells, with a maximum of 59%
cytotoxicity at 200 µg/ml in the former cell type. On the contrary, MHR showed higher
cytotoxicity in WRL-68 cells than in MDA-MB-231 cells at 25 and 50 µg/ml
concentrations.
The cytotoxicities of AHR and ACR in MDA-MB-231 and WRL-68 cells were
portrayed in Fig. 4.9. ACR at all doses exhibited high cytotoxicity than AHR in MDA-
MB-231 cells with maximum cytotoxicity of 80% (at 200 µg/ml), whereas it did not
show any cytotoxicity in WRL-68 cells similar to EHO. On the other hand, AHR
exhibited equal levels of cytotoxicity at all doses in MDA-MB-231 and WRL-68 cells.

65
All the extracts were evaluated statistically to be selected for further analysis
based on its cytotoxicity in MDA-MB-231 (tumoral) and WRL-68 (non-tumoral)
cells. IC50 of any chemical/reagent has been defined as the concentration at which it
showed 50% inhibitory function. Lower IC50 values represent higher cytotoxicity.
From the IC50 values of the extracts, which were expressed as mean ± SD (n = 3,
P<0.05) in table 4.2, the extracts with highest cytotoxicity in MDA-MB-231 cells and
lowest cytotoxicity in WRL-68 cells were given the top rank. Cumulative ranks of
extracts including both the parameters were statistically calculated and given in Fig.
4.10 – 4.13. The IC50 data have clearly shown that R. emodi extracts were
significantly (P<0.05) more toxic when compared to O. indicum extracts. Thus, four
extracts from O. indicum and eight extracts from R. emodi were selected based on
their cumulative ranking. Respectively, MHO, PHO, ECO and MCO from O.
indicum, and EHR, AHR, CHR, PHR, ACR, CCR, PCR and MCR from R. emodi
were selected for further analysis in this study.
66
A)
B)
Fig. 4.5: Dose-dependent cytotoxicity of PHR (A) and PCR (B) on MDA-MB-231
and WRL-68 cells.

67
A)
B)
Fig. 4.6: Dose-dependent cytotoxicity of CHR (A) and CCR (B) on MDA-MB-231
and WRL-68 cells.

68
A)
B)
Fig. 4.7: Dose-dependent cytotoxicity of EHR (A) and ECR (B) on MDA-MB-231
and WRL-68 cells.
69
A)
B)
Fig. 4.8: Dose-dependent cytotoxicity of MHR (A) and MCR (B) on MDA-MB-231
and WRL-68 cells.

70
A)
B)
Fig. 4.9: Dose-dependent cytotoxicity of AHR (A) and ACR (B) on MDA-MB-231
and WRL-68 cells.

71
Table 4.2: List presenting IC50 of all the extracts from cytotoxicity assay.
NS = Non-significant
S.No. Extracts
IC50 (in µg/ml) ± SD
(at P<0.05)
MDA-MB-231 WRL-68
1. PHO 122.49 ± 3.30 217.64 ± 6.17
2. CHO 209.45 ± 1.47 253.62 ± 1.75
3. EHO 243.00 ± 1.94 NS
4. MHO 191.5 ± 2.05 270.96 ± 0.69
5. AHO NS NS
6. PCO 179.60 ± 3.88 261.43 ± 4.88
7. CCO 196.62 ± 0.99 81.92 ± 3.72
8. ECO 95.15 ± 2.41 203.54 ± 2.96
9. MCO 185.66 ± 1.43 206.74 ± 4.60
10. ACO NS NS
11. PHR 61.60 ± 1.02 31.04 ± 0.50
12. CHR 16.70 ± 1.26 17.57 ± 0.22
13. EHR 56.59 ± 1.29 102.60 ± 1.61
14. MHR 231.92 ± 3.38 223.82 ± 2.20
15. AHR 207.00 ± 1.95 290.56 ± 1.47
16. PCR 76.06 ± 1.76 111.40 ± 1.98
17. CCR 64.17 ± 3.28 29.90 ± 1.12
18. ECR 152.38 ± 1.45 242.34 ± 2.72
19. MCR 101.72 ± 3.23 208.92 ± 1.45
20. ACR 113.42 ± 3.06 NS

72
A)
B)
Fig. 4.10: IC50 of O. indicum - soxhlet extracts (A) and their cumulative ranking (B).

73
A)
B)
Fig. 4.11: IC50 of O. indicum - macerated extracts (A) and their cumulative ranking
(B).

74
A)
B)
Fig. 4.12: IC50 of R. emodi - soxhlet extracts (A) and their cumulative ranking (B).

75
A)
B)
Fig. 4.13: IC50 of R. emodi - macerated extracts (A) and their cumulative ranking (B).

76
4.4 APOPTOSIS DETECTION BY CELLULAR DNA
FRAGMENTATION ELISA
The ability of extracts to induce apoptosis in cancer cells were quantified by
the amount of BrdU-labeled-apoptotic DNA fragments released in the
cytoplasm of treated cells. The apoptosis inducing property was tested in human
breast cancer cells (MDA-MB-231 and MCF-7) and the results were expressed in
mean ± SD (n = 3, P<0.05) (Fig. 4.14 – 4.17). All the 10 extracts tested
have shown significant (P<0.05) levels of apoptosis induction in MDA-MB-231 cells.
In contrast, the extracts have shown a diminutive apoptotic levels in MCF-7 cells
(except ACR and AHR).
PHO had exhibited a steady increase of apoptotic induction till 200 µg/ml
except for a decline at 100 µg/ml in MDA-MB-231 cells, while in MCF-7 cells; it
exhibited a low down apoptotic levels till 100 µg/ml and a slight increase at 200
µg/ml (Fig. 4.14A). MHO had demonstrated a steady dose-dependent increase of
apoptotic fragments in MDA-MB-231 cells though it did not show any increase in
apoptotic fragments in MCF-7 cells (Fig. 4.14B).
ECO resulted in mediocre levels of apoptosis in MDA-MB-231 cells from
12.5 to 50 µg/ml; however it showed a trivial decline at 100 and 200 µg/ml, and in
MCF-7 cells the extract recorded a nominal apoptotic induction till 200 µg/ml (Fig.
4.15A). MCO had exhibited a higher apoptotic induction levels when compared to
other extracts of O. indicum. In MDA-MB-231 cells, it demonstrated an
increasing pattern of apoptotic potentials upto 200 µg/ml except for a trifling
decline at 25 and 100 µg/ml, while in MCF-7 cells it showed a diminutive apoptosis
induction (Fig. 4.15B).
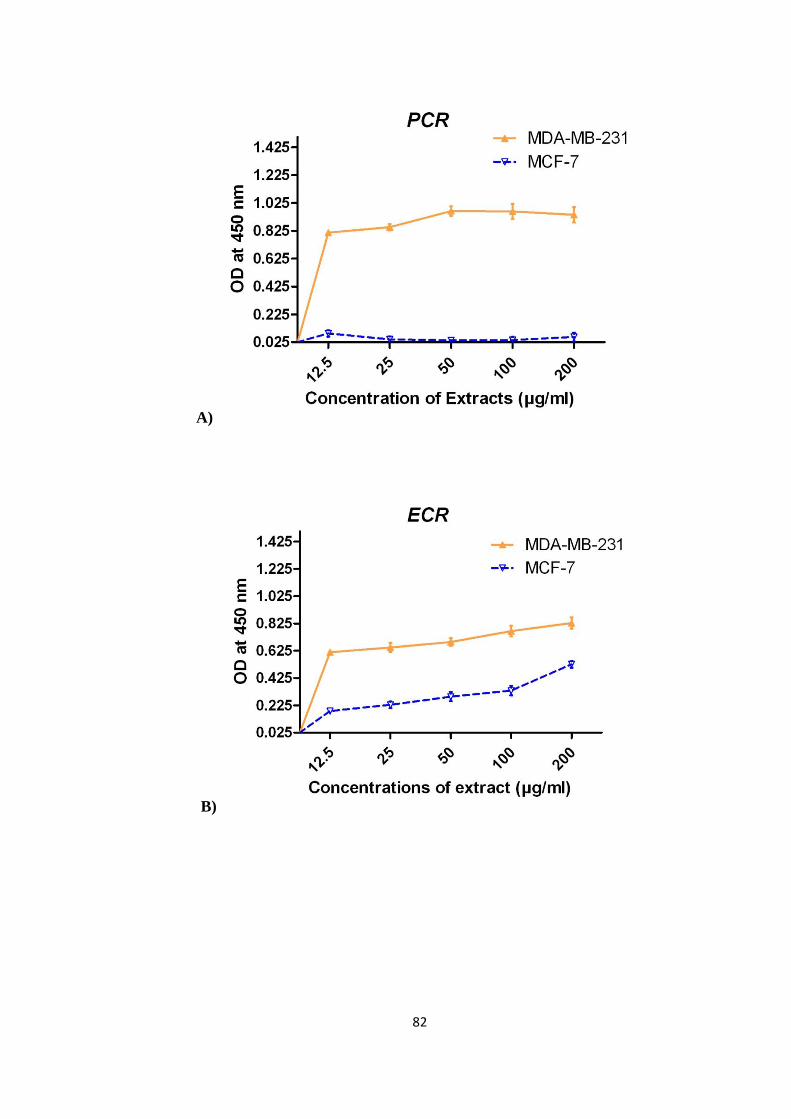
PHR and PCR showed a dose-dependent apoptosis induction in
MDA-MB-231 cells with a slight decline at higher concentrations, whereas in
MCF-7 cells, they exhibited very low apoptosis levels (Fig. 4.16A and Fig. 4.17A).
In MDA-MB-231 cells, CHR, EHR and ECR had exhibited a prominent
and slow increase of apoptosis induction (Fig. 4.16B, Fig. 4.16C and Fig. 4.17B).
77
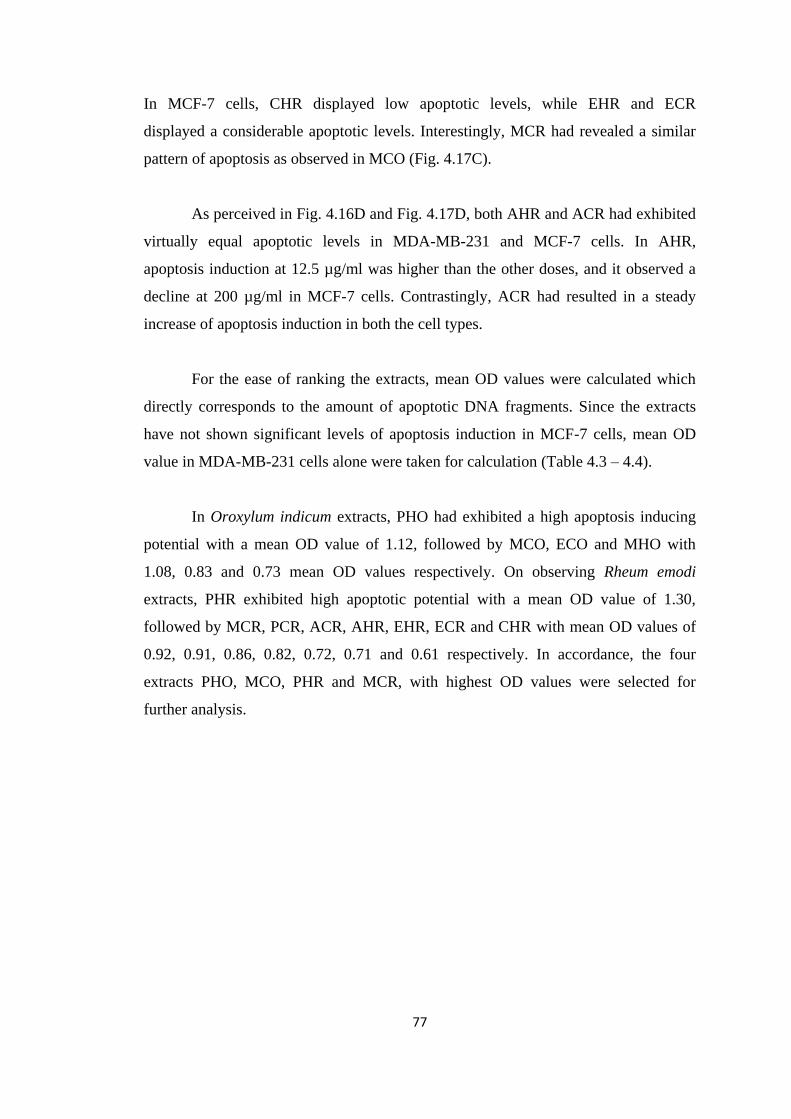
In MCF-7 cells, CHR displayed low apoptotic levels, while EHR and ECR
displayed a considerable apoptotic levels. Interestingly, MCR had revealed a similar
pattern of apoptosis as observed in MCO (Fig. 4.17C).
As perceived in Fig. 4.16D and Fig. 4.17D, both AHR and ACR had exhibited
virtually equal apoptotic levels in MDA-MB-231 and MCF-7 cells. In AHR,
apoptosis induction at 12.5 µg/ml was higher than the other doses, and it observed a
decline at 200 µg/ml in MCF-7 cells. Contrastingly, ACR had resulted in a steady
increase of apoptosis induction in both the cell types.
For the ease of ranking the extracts, mean OD values were calculated which
directly corresponds to the amount of apoptotic DNA fragments. Since the extracts
have not shown significant levels of apoptosis induction in MCF-7 cells, mean OD
value in MDA-MB-231 cells alone were taken for calculation (Table 4.3 – 4.4).
In Oroxylum indicum extracts, PHO had exhibited a high apoptosis inducing
potential with a mean OD value of 1.12, followed by MCO, ECO and MHO with
1.08, 0.83 and 0.73 mean OD values respectively. On observing Rheum emodi
extracts, PHR exhibited high apoptotic potential with a mean OD value of 1.30,
followed by MCR, PCR, ACR, AHR, EHR, ECR and CHR with mean OD values of
0.92, 0.91, 0.86, 0.82, 0.72, 0.71 and 0.61 respectively. In accordance, the four
extracts PHO, MCO, PHR and MCR, with highest OD values were selected for
further analysis.

78
A)
B)
Fig. 4.14: Levels of apoptotic DNA fragments in, PHO (A) and MHO (B) treated
MDA-MB-231 and MCF-7 cells.

79
A)
B)
Fig. 4.15: Levels of apoptotic DNA fragments in, ECO (A) and MCO (B) treated
MDA-MB-231 and MCF-7 cells.

80
A)
B)

81
C)
D)
Fig. 4.16: Levels of apoptotic DNA fragments in, PHR (A), CHR (B), EHR (C) and
AHR (D) treated MDA-MB-231 and MCF-7 cells.
82
A)
B)

83
C)
D)
Fig. 4.17: Levels of apoptotic DNA fragments in, PCR (A), ECR (B), MCR (C) and
ACR (D) treated MDA-MB-231 and MCF-7 cells.

84
Table 4.3: Mean OD value corresponding to amount of apoptotic DNA fragments by
the effect of O. indicum extracts in MDA-MB-231 cells.
Extracts
Mean OD ± SD
in MDA-MB-231
cells
Rank
PHO 1.12 ± 0.03 1
MHO 0.73 ± 0.03 4
ECO 0.83 ± 0.02 3
MCO 1.08 ± 0.03 2
Table 4.4: Mean OD value corresponding to amount of apoptotic DNA fragments by
the effect of R. emodi extracts in MDA-MB-231 cells.
Extracts
Mean OD ± SD
in MDA-MB-231
cells
Rank
PHR 1.30 ± 0.02 1
PCR 0.91 ± 0.04 3
MCR 0.92 ± 0.04 2
EHR 0.72 ± 0.03 6
ECR 0.71 ± 0.03 7
CHR 0.61 ± 0.03 8
AHR 0.82 ± 0.03 5
ACR 0.86 ± 0.03 4

85
4.6 CASPASE-3 ACTIVATION ANALYSIS
Caspase-3 serves as a convergence point for different apoptotic signalling
pathway. Hence, the study has explored the activation of this protein in breast cancer
cells where it is said to be inactive. In this study, the selected four extracts had shown
significant (P<0.05) caspase-3 activation in MDA-MB-231 (Fig. 4.18) but not in
MCF-7 cells as expected, since it lacks the procaspase-3. MCO had showcased a top
percentage caspase-3 activation of 74.5, which was comparable to that of
74.6% by 10 µM vincristine and 72.96% by 0.1 mM H2O2. This was followed by
69.8% by PHR and 62.9% by MCR, whereas PHO had exhibited lowest caspase-3
activation of 7.14%. Thus the most efficient extract MCO was designated for the
purpose of eluting pure compounds.
Fig. 4.18: Percentage caspase-3 activation by plant extracts compared with V
(10 µM vincristine) and 0.1 mM H2O2 as positive controls.

86
4.7 PURIFICATION OF PHYOCHEMICALS FROM MCO
Primarily, MCO was subjected to TLC using various solvent mixtures
(hexane, chloroform, ethyl acetate and methanol) which employed an increasing
polarity range from non-polar to polar. Maximum separation of the components in the
extract was achieved at 60% hexane in ethyl acetate (Fig. 4.19). Later on, the extract
was loaded on a silica gel column and was run using a gradient solvent range with
ethyl acetate in hexane. Around 170 fractions were collected which were
simultaneously analyzed in TLC for single spot. Fractions with equal Rf values were
pooled together that yielded a total of 5 compounds from the crude extract at different
solvent polarities. The corresponding Rf values of the isolated compounds were C1 -
0.98, C2 - 0.74, C3 - 0.3, C4 - 0.08 and C5 - 0.01. Pictures of which were depicted in
Fig. 4.20.
Fig. 4.19: TLC of MCO showing separated compounds with 60% hexane in ethyl
acetate.

87
(A) (B) (C)
(D) (E)
Fig. 4.20: TLC of isolated compounds (A) C1, (B) C2, (C) C3, (D) C4 and (E) C5
through column chromatography.

88
4.8 BIOACTIVITY OF ISOLATED COMPOUNDS
4.8.1 CYTOTOXICITY OF COMPOUNDS IN VITRO
The isolated compounds were tested for its cytotoxicity in MDA-MB-231 cells
in vitro. All 5 compounds have shown significant (P<0.05) cytotoxicity towards the
tested cell line with a dose-dependent increase (Fig. 4.21). C1 had demonstrated a
highest cytotoxicity (99%) at 1000 µg/ml, whereas C3 had resulted in
52% cytotoxicity even at lower concentration of 62.5 µg/ml. However, overall low
cytotoxicity (12%) was displayed by C2 at 62.5 µg/ml. The compounds were then
consecutively ranked based on their IC50 values in MDA-MB-231 cells
(Table 4.5), and the top three compounds (C1, C3 and C4) with high cytotoxicity
were selected for further analysis.
(A)

89
(B)
C)

90
(D)
(E)
Fig. 4.21: Dose dependent cytotoxicity of compounds C1 (A), C2 (B), C3 (C), C4 (D)
and C5 (E) in MDA-MB-231 cells.

91
Table 4.5: List of isolated compounds with their IC50 values in MDA-MB-231 cells.
S. No. Compound IC50 (in µg/ml) ±
SD (at P<0.05)
Rank
1. C3 62.1 ± 3.47 1
2. C4 185.3 ± 6.53 2
3. C1 196 ± 3.09 3
4. C5 249.01 ± 7.58 4
5. C2 1029.85 ± 7.81 5
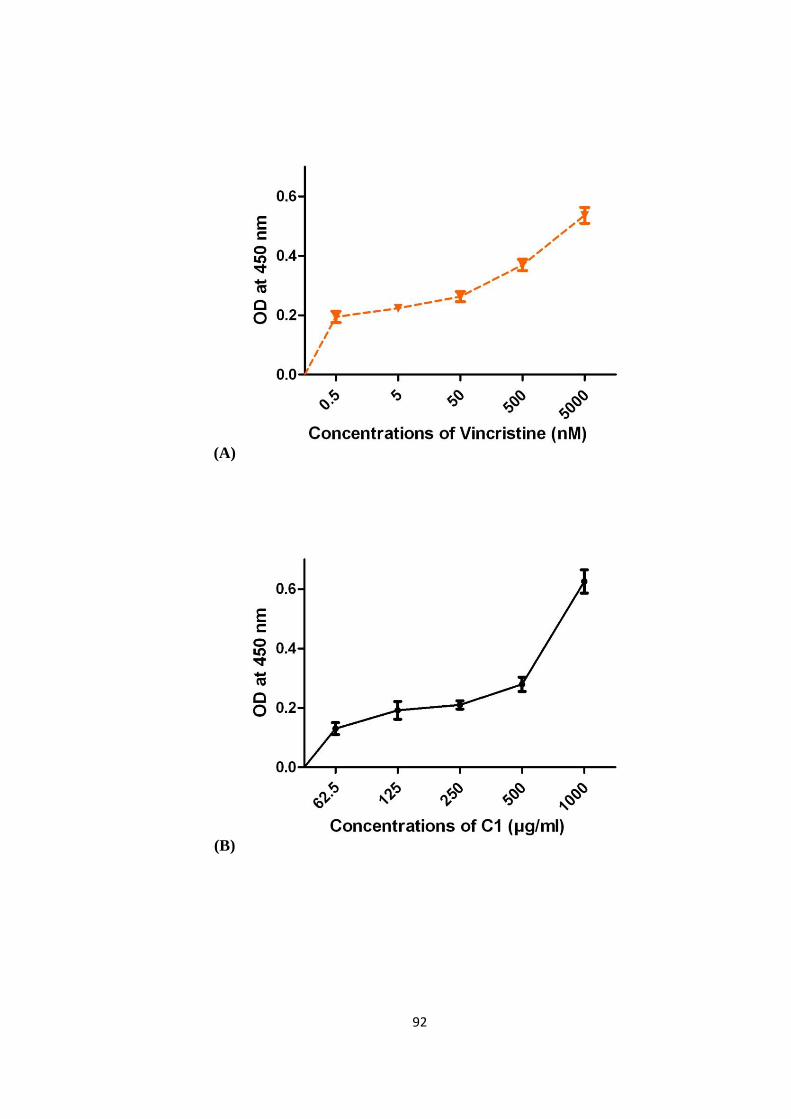
4.8.2 APOPTOSIS INDUCTION BY COMPOUNDS
The selected compounds C1, C3 and C4 were tested for their efficiency to
induce apoptosis in MDA-MB-231 and MCF-7 cells. The absorbance recorded
directly corresponds to the amount of apoptotic DNA fragments. All the three
compounds have shown a significant (P<0.05) dose dependent increase of apoptotic
DNA fragments in MDA-MB-231 cells (Fig 4.22), whereas there was no significant
increase in apoptotic fragments in MCF-7 cells. Vincristine was used as a positive
control, and all three compounds have shown a same pattern of apoptosis, with C1
showing highest apoptosis induction at 1000 µg/ml and C3 exhibiting lowest
apoptosis induction at 62.5 µg/ml.
92
(A)
(B)

93
(C)
(D)
Fig 4.22: Dose-dependent increase of apoptotic fragments by Vincristine (A), C1 (B),
C3 (C) and C4 (D) in MDA-MB-231 cells.

94
4.8.3 CASPASE-3 ACTIVATION BY COMPOUNDS
All the three compounds demonstrated a significant (P<0.05) caspase-3
activation levels in MDA-MB-231 cells (Fig. 4.23). Compound C4 at its IC50 value
(185.3 µg/ml) had shown the highest percentage caspase-3 activation of 70.37, which
was comparable to that of the tested standards, whereas C1 had resulted in 65.2% and
C3 had recorded a comparatively low (52.97%) caspase-3 activation. Subsequently,
C4 was chosen for characterization and structural elucidation by employing a set of
analytical examines.
Fig. 4.23: Percentage caspase-3 activation by compounds C1, C3 and C4 compared
with V (10 µM vincristine) and 0.1 mM H2O2 as positive controls.

95
4.9 CHARACTERIZATION OF COMPOUND C4
4.9.1 UV-VISIBLE SPECTRUM
The λmax for every chemical compound is different which finds a use in the
analytical appreciation of the compound. The UV-visible spectral scan of the
compound C4 had revealed the λmax to be 258 nm (Fig. 4.24).
4.9.2 HPLC
The accurate determination of the compound purity is vital prior to other
characterization techniques. HPLC had been acknowledged as a powerful tool for the
analysis of compound purity and is essential for the identification of plant metabolites
(Hajnos and Sherma, 2010).
Correspondingly, gradient HPLC for compound C4 has given a single peak at
RT 3.535 in the chromatogram (Fig. 4.25), thereby confirming the purity of the
compound.
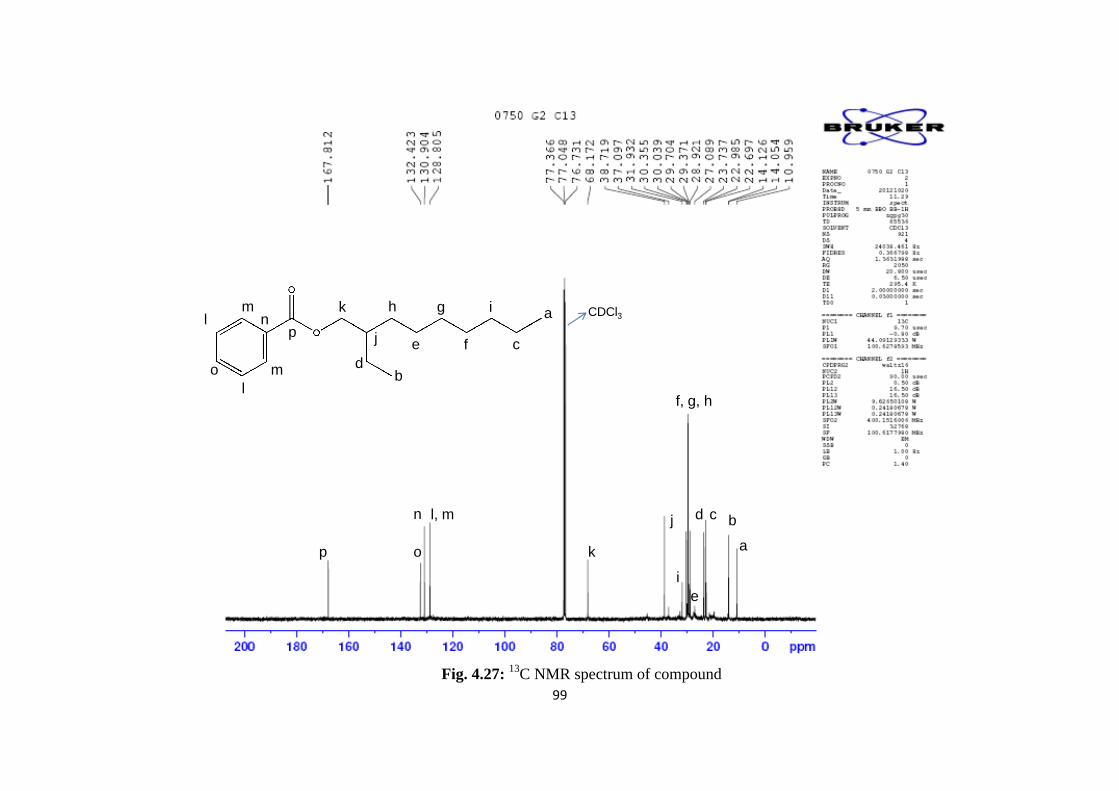
4.9.3 NMR
NMR analysis is a traditional method that has been used as a confirmatory
technique in structural elucidation of most phytocompounds (Leiss et al., 2011). In
this study, 1H NMR and
13C NMR for the compound C4 had revealed the molecular
structure of the compound. 1H NMR spectra for the compound read as CH (7.621),
CH (7.621), CH (7.451), CH (7.451), CH (7.465), CH2 (4.146), CH (2.07), CH2
(1.259), CH2 (1.597), CH2 (1.259), CH2 (1.259), CH2 (1.291), CH2 (1.291), CH2
(1.313), CH3 (0.805) and CH3 (0.796) in their respective ppm (Fig. 4.26).
The 13
C NMR spectra read as C (130.904), CH (130.904), CH (130.904), CH
(128.805), CH (128.805), CH (132.423), C (167.812), CH2 (68.172), CH (38.719),
CH2 (30.039), CH2 (23.737), CH2 (27.089), CH2 (29.704), CH2 (29.371),
CH2 (31.932), CH2 (22.697), CH3 (10.959) and CH3 (14.054) in their respective
ppm (Fig. 4.27).

96
4.9.4 MASS SPECTRA
MS is commonly used as a qualitative approach for structural identifications.
However, quantitative results like NMR spectra entail confirmation by the use of MS
technique. The expected mass for the compound C4 was confirmed by observing a
peak at 279.32 m/z (Fig. 4.28).
4.9.5 FTIR
The FTIR spectrum of any compound discloses the minutiae about the
functional groups present in it. The FTIR spectrum of C4 confirmed the presence of
functional groups as observed by the distinct vibration modes in their respective
wavenumbers (cm-1
), C=O (1730.15), C-O (1124.50), CH2 (1400.32) and CH
(aromatic) (3134.33) (Fig. 4.29).

97
Fig. 4.24: UV-Visible spectrum of compound C4 portraying the λmax.
Fig. 4.25: Figure displaying a single peak to ensure the purity of compound C4 by
gradient HPLC.

98
Fig. 4.26: 1H NMR spectrum of compound C4
a
a
b
c
c
c
c
c
d
e
fg
g
h
h
ia
b
c
d
e
f
gi, h
CDCl3
Fig. 4.26: 1H NMR spectrum of compound
99
a
a
b
b
c
d
e f
gh i
jp
k
l
l
m
mn
o
cd
e
f, g, h
i
j
k
CDCl3
l, mn
op
Fig. 4.27: 13
C NMR spectrum of compound

100
Fig. 4.28: Mass spectrum of compound C4.

101
Fig. 4.29: FTIR spectrum of compound C4 showing the functional groups.