results - massmart
TRANSCRIPT

Saving our customers money
so they can live better
Results For the 52 weeks ended 29 December 2019
For the 52 weeks ended 29 December 2019 1
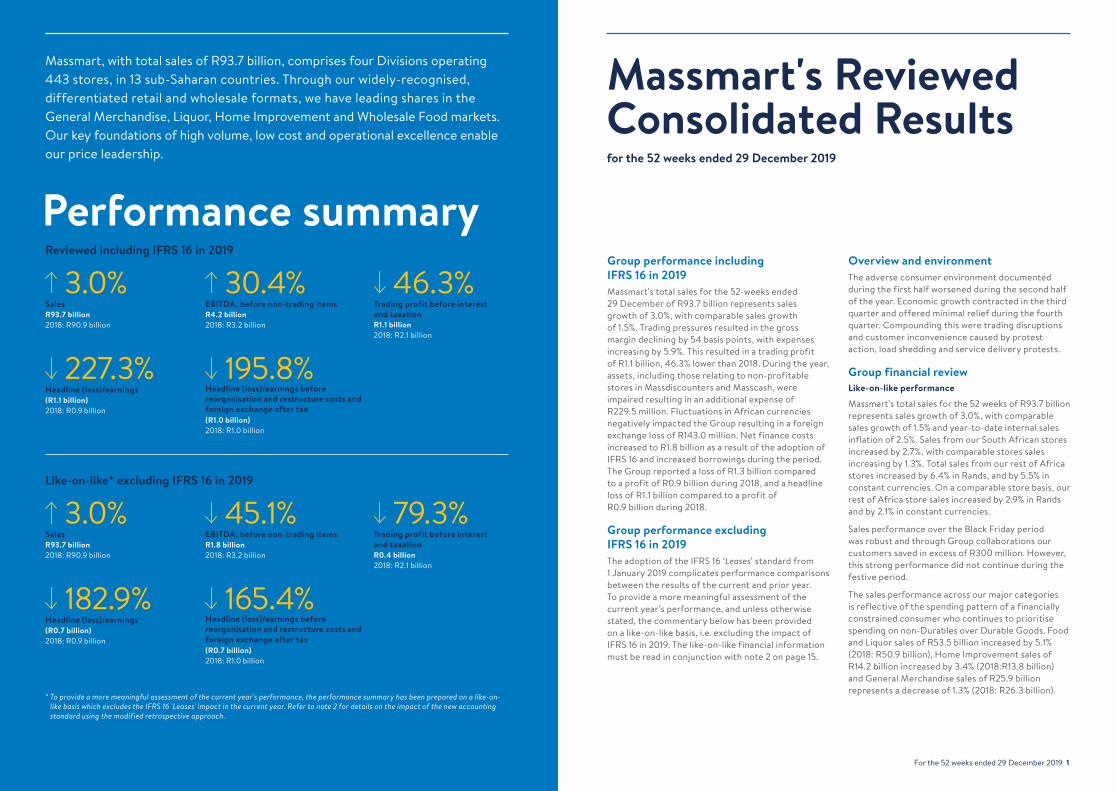
Group performance including IFRS 16 in 2019Massmart’s total sales for the 52-weeks ended 29 December of R93.7 billion represents sales growth of 3.0%, with comparable sales growth of 1.5%. Trading pressures resulted in the gross margin declining by 54 basis points, with expenses increasing by 5.9%. This resulted in a trading profit of R1.1 billion, 46.3% lower than 2018. During the year, assets, including those relating to non-profitable stores in Massdiscounters and Masscash, were impaired resulting in an additional expense of R229.5 million. Fluctuations in African currencies negatively impacted the Group resulting in a foreign exchange loss of R143.0 million. Net finance costs increased to R1.8 billion as a result of the adoption of IFRS 16 and increased borrowings during the period. The Group reported a loss of R1.3 billion compared to a profit of R0.9 billion during 2018, and a headline loss of R1.1 billion compared to a profit of R0.9 billion during 2018.
Group performance excluding IFRS 16 in 2019The adoption of the IFRS 16 ‘Leases’ standard from 1 January 2019 complicates performance comparisons between the results of the current and prior year. To provide a more meaningful assessment of the current year’s performance, and unless otherwise stated, the commentary below has been provided on a like-on-like basis, i.e. excluding the impact of IFRS 16 in 2019. The like-on-like financial information must be read in conjunction with note 2 on page 15.
Massmart's Reviewed Consolidated Results for the 52 weeks ended 29 December 2019
Overview and environment The adverse consumer environment documented during the first half worsened during the second half of the year. Economic growth contracted in the third quarter and offered minimal relief during the fourth quarter. Compounding this were trading disruptions and customer inconvenience caused by protest action, load shedding and service delivery protests.
Group financial reviewLike-on-like performance
Massmart’s total sales for the 52 weeks of R93.7 billion represents sales growth of 3.0%, with comparable sales growth of 1.5% and year-to-date internal sales inflation of 2.5%. Sales from our South African stores increased by 2.7%, with comparable stores sales increasing by 1.3%. Total sales from our rest of Africa stores increased by 6.4% in Rands, and by 5.5% in constant currencies. On a comparable store basis, our rest of Africa store sales increased by 2.9% in Rands and by 2.1% in constant currencies.
Sales performance over the Black Friday period was robust and through Group collaborations our customers saved in excess of R300 million. However, this strong performance did not continue during the festive period.
The sales performance across our major categories is reflective of the spending pattern of a financially constrained consumer who continues to prioritise spending on non-Durables over Durable Goods. Food and Liquor sales of R53.5 billion increased by 5.1% (2018: R50.9 billion), Home Improvement sales of R14.2 billion increased by 3.4% (2018:R13.8 billion) and General Merchandise sales of R25.9 billion represents a decrease of 1.3% (2018: R26.3 billion).
Massmart, with total sales of R93.7 billion, comprises four Divisions operating 443 stores, in 13 sub-Saharan countries. Through our widely-recognised, differentiated retail and wholesale formats, we have leading shares in the General Merchandise, Liquor, Home Improvement and Wholesale Food markets. Our key foundations of high volume, low cost and operational excellence enable our price leadership.
* To provide a more meaningful assessment of the current year's performance, the performance summary has been prepared on a like-on-like basis which excludes the IFRS 16 'Leases' impact in the current year. Refer to note 2 for details on the impact of the new accounting standard using the modified retrospective approach.
Performance summary
R93.7 billion2018: R90.9 billion
Sales 3.0%
R4.2 billion2018: R3.2 billion
EBITDA, before non-trading items 30.4%
(R1.0 billion)2018: R1.0 billion
Headline (loss)/earnings before reorganisation and restructure costs and foreign exchange after tax
195.8%
R1.1 billion2018: R2.1 billion
Trading profit before interest and taxation
46.3%Reviewed including IFRS 16 in 2019
R93.7 billion2018: R90.9 billion
Sales 3.0%
R1.8 billion2018: R3.2 billion
EBITDA, before non-trading items 45.1%
(R0.7 billion)2018: R1.0 billion
Headline (loss)/earnings before reorganisation and restructure costs and foreign exchange after tax
165.4%
R0.4 billion2018: R2.1 billion
Trading profit before interest and taxation
79.3%Like-on-like* excluding IFRS 16 in 2019
(R1.1 billion)2018: R0.9 billion
Headline (loss)/earnings 227.3%
(R0.7 billion)2018: R0.9 billion
Headline (loss)/earnings 182.9%
2 Massmart Reviewed Consolidated Results For the 52 weeks ended 29 December 2019 3
Road to Recovery*Massmart’s slowing sales growth over the years necessitated a review of the business. Our review revealed that while Massmart’s portfolio consists of strong brands with high market shares in key categories, some strategic and operational gaps impacted our performance. We have mapped out our Road to Recovery to reinvigorate growth within our business, reset the cost base and serve our customers better:
• Restructuring the Group operating model• Portfolio optimisation including Game customer
value proposition and wholesale route to market• Supply Chain optimisation• Cost reset
OutlookMassmart’s total sales for the seven weeks to 16 February 2020 amounted to R11.4 billion and represents an increase of 2.2% over the prior year. Comparable store sales increased by 1.0% and product inflation is estimated at 2.3%. The subdued economic environment experienced in the latter part of 2019 continues and we expect margin pressure to persist in 2020. The financial information on which this outlook statement is based has not been reviewed and reported on by the Company’s external auditors.
Dividend Our current dividend policy is to declare and pay an interim and final cash dividend representing a 2.0 times dividend cover, unless circumstances dictate otherwise. Due to the headline loss reported, no final dividend has been declared.
Mitchell SlapeChief Executive Officer
Mohammed Abdool-SamadChief Financial Officer
26 February 2020
A combination of increased promotional activity during the year and the shift of consumers prioritising lower margin categories (Food and Liquor) over higher margin categories (General Merchandise and Home Improvement) resulted in gross margins declining from 19.5% to 18.9%. Gross margin was further impacted by additional provisioning adjustments relating to the Masscash business.
While expense growth of 10.2% exceeded our sales growth of 3.0% during 2019, the second half of the year saw expenses increasing at a lower rate (8.6%) than the first half (11.8%) due to cost saving initiatives implemented by the Group. Expense growth however, still outpaced sales growth in the second half of 2019. Employment costs, the Group’s biggest cost category increased by 8.0% (with a comparable increase of 7.8%), mainly impacted by the legislative requirement of converting temporary contractors to permanent associates in late 2018, in addition to the impact of new stores and annual labour cost inflation.
During the period, seven net new stores were opened, including the Makro store in Cornubia, north of Durban. Consequently, and further impacted by increased municipal tariffs, electricity costs and the cost associated with power generation as a result of load-shedding in February and again in December, occupancy costs increased by 8.4%. On a comparable stores basis, the increase was limited to 4.4%, as the impact of some of the cost pressure was offset by initiatives including consumption monitoring and energy efficiency.
Contributing to the 17.3% increase in depreciation and amortisation during the period was the impact of new stores and increased cost associated with the new SAP Hybris web and fulfilment platform in Makro. In addition, 2018 included a credit adjustment of R80 million to depreciation relating to the reassessment of useful lives to certain Masscash assets. Excluding this adjustment, depreciation and amortisation would have increased by 9.6%.
Other operating expenses increased by 14.2%. This was impacted by costs associated with the current economic climate: 5.8% increase in credit card costs as we see bigger credit sales participation; 9.6% increase in security costs driven by the need to increase our security efforts; and a 66.1% increase in bad debts. In addition, pre-opening costs associated with opening new stores, increased by 21.2%.
Trade creditors also decreased by 5.0% resulting in credit days decreasing by seven days due to the change in the mix of goods purchased.
Operating cash before working capital movements, excluding IFRS 16, was R1,911.5 million, 44.0% lower than 2018 aligned to lower operating performance. An increased focus on working capital resulted in improved working capital cash flows relative to 2018. Free cash flow of R239.6 million declined by R1,046.0 million compared to the prior year, due mainly to cash generated from operations being R1,142.8 million lower than the prior year.
AppreciationWe are sincerely appreciative to all our associates for their contributions during the year, especially given our adverse economic environment. We would also like to thank the Board for their support and guidance and our Management teams for their ongoing focus and commitment to driving the Group’s turnaround plan.
Directorate As previously reported, Mohammed Abdool-Samad was announced as Chief Financial Officer and Executive Director of the Board effective 1 August 2019; and Mitchell (Mitch) Slape was announced as Chief Executive Officer and Executive Director of the Board effective 1 September 2019.
On 5 September 2019, the resignation of the Group’s General Counsel and Company secretary, Joseph Ralebepa, was announced effective 31 December 2019. Nicole Morgan was announced as the Interim Company secretary effective 1 January 2020.
On 25 February 2020, the resignation of Enrique Ostalé from the Board, Remuneration and Nominations Committees was announced. The appointment of JP Suarez to the Remuneration and Nominations Committees was also announced, effective 25 February 2020. On the same day shareholders were informed that Charles Redfield was nominated for appointment as a non-Executive Director of the Board effective 25 February 2020.
The combination of the factors explained above culminated in trading profit decreasing by 79.3%.
The evaluation of loss-making stores conducted during the period and an assessment of non-current assets held for sale resulted in impairment costs of R169.5 million recognised during the period.
Currency weaknesses continued into the second half of the year, resulting in a foreign exchange loss of R53.3 million. Net finance costs increased by 10.6% to R689.8 million.
The Group’s effective tax rate of -67.4% (2018: 31.5%) is as a result of impairing certain deferred taxation assets previously raised, limiting the recognition of further deferred tax assets and the impact of the taxation charge on profit-making entities. In addition to this, the decrease in share price further impacted the deferred tax asset recognised on the Group share scheme.
Consequently, the Group incurred a net loss for the year of R861.0 million, down from a profit of R868.7 million in 2018. Headline losses amounted to R747.3 million, down from headline earnings of R901.2 million in 2018.
Financial positionCommentary on our financial position has been provided taking into account the adoption of IFRS 16.
While capital expenditure was cautiously spent during the period, we invested in store openings, refurbishment of selected existing stores and IT infrastructure. This, together with impairments, resulted in property, plant and equipment decreasing by 5.7% over 2018. Total capital expenditure was well managed during the year and decreased by 14.6% to R1,371.8 million. Expansionary expenditure was R791.5 million and included nine new store openings during the year. Replacement expenditure was R580.3 million, of which R341.7 million relates to investment in IT.
Our concerted and focused effort on working capital improvement continued into the second half of this year. Continued focus on inventory management led to a 2.4% decrease in inventory levels compared to 2018, despite the impact of new stores. Inventory days decreased by four days to 57 days compared to 2018. Trade receivables decreased by 10.7% with debtors days decreasing by two days to eight days. *For more information refer to our Business Update presentation held on 30 January 2020 on www.massmart.co.za

4 Massmart Reviewed Consolidated Results For the 52 weeks ended 29 December 2019 5
Comprises the 110 Builders Warehouse, Builders Express, Builders Trade Depot and Builders Superstores, trading DIY, Home Improvement and building materials in South Africa; and eight stores in Botswana, Mozambique and Zambia.
Comprises the 54 Wholesale Cash & Carry stores and 63 Retail stores in South Africa; 13 Cash & Carry stores in Botswana, Lesotho, Mozambique, Namibia, Swaziland and Zambia; and Shield, a voluntary buying association.
Comprises the 150 Game stores, trading General Merchandise and Food in South Africa and 11 other African countries; and the 23 DionWired stores, trading Hi-tech in South Africa
Comprises the 22 Makro stores, Warehouse club trading General Merchandise, Food and Liquor in South Africa; and Massfresh, housing the Group’s fresh produce, fresh meat and bakery operations, including the Fruitspot
Massdiscounters total sales for the 52 weeks of R19.8 billion was 0.3% up on last year, most notably impacted by lower consumer spending on Durable Goods. Comparable stores sales contracted by 2.1% and product deflation was 0.2%.
Encouragingly, Game South Africa saw foot traffic increase by 4% year-on-year, resulting in sales increasing by 1.9%. In the rest of Africa, Game’s sales decreased by 0.8% in Rands and by 1.5% in constant currencies owing to currency weaknesses during the period. Sales continued to decrease in DionWired and was 19.8% lower than 2018.
Margins were negatively impacted by a lower contribution of General Merchandise sales to total sales and the impact of a higher promotional mix, specifically in Game. Expenses increased by 8.7%, with comparable expenses increasing by 6.9%. Included in this were the costs associated with store openings and IT costs expensed. The implementation of the SAP S/4 HANA ERP system is continuing and is expected to be completed during 2020.
Four Game stores were opened during the period and two DionWired stores were closed. Massdiscounters’ trading space increased by 0.2% to 561,934m2.
Masswarehouse recorded total sales of R29.4 billion, which was 2.0% up on last year, with comparable stores sales contracting by 0.3%. While General Merchandise sales remained flat on last year, Liquor sales grew by 3.5%, Food sales grew by 2.5% and product inflation of 2.2%.
Expenses of R4.1 billion, represent an increase of 6.8% over 2018, with a 4.5% increase in comparable expenses. Included in this is pre-opening expenses of approximately R14 million for the opening of the Makro Cornubia store during the period.
The Cornubia store increased trading space by 6.5% to 246,125m2.
Masscash total sales of R30.3 billion grew by 5.6%, especially supported by strong wholesale sales growth of 8.6%. Comparable store sales have shown a similar increase. Product inflation was 3.6%. Retail sales are flat on last year, testament to a very competitive market environment. Sales from the rest of Africa stores increased by 11.6% and by 10.4% in constant currencies.
No new stores were opened or closed during the year, resulting in trading space remaining at 388,714m2.
Massbuild total sales of R14.2 billion grew by 3.4% and continues to maintain its market leading performance in DIY, home maintenance and building supplies. Comparable store sales increased by 1.4%, while product inflation was 4.0%. Sales from the rest of Africa stores increased by 15.9% and similarly in constant currencies.
The significant slowdown in the construction sector negatively impacted Massbuild, with commercial and yard sales decreasing by 0.5% compared to last year. This was however more than offset by retail sales growing by 5.3%, as consumers' focus shifted to prioritise smaller home improvement and DIY type projects as opposed to major renovations and builds.
New stores opened during the period and significant increases in utility and energy costs contributed to the 5.7% increase in expenses during the period (comparable increase of 4.3%).
Online continues to be a focus area and online traffic increased by 36%. Click-and-collect has been expanded further into the rest of Africa and is now in Botswana and Zambia.
During the period, four Builders stores were opened in South Africa, resulting in a 2.2% increase in trading space to 478,279m2.
(R674.6 million) R669.8 millionR934.9 million (R501.8 million)2018: R32.6 million 2018: R749.1 million2018: R1,100.8 million 2018: R188.6 million
Trading (loss)/profit* Trading profit*Trading profit* Trading (loss)/profit* 2,169.3% 10.6% 15.1% 366.1%
R19.8 billion R14.2 billionR29.4 billion R30.3 billion 2018: R19.7 billion 2018: R13.8 billion2018: R28.8 billion 2018: R28.7 billion
Sales SalesSales Sales 0.3% 3.4% 2.0% 5.6%
* Divisional trading profit/(loss) includes Corporate allocations.
Divisional performance

6 Massmart Reviewed Consolidated Results For the 52 weeks ended 29 December 2019 7
* To provide a more meaningful comparison of the current year's performance, the performance summary has been prepared on a like-on-like basis which excludes the impact of IFRS 16 'Leases' in the current financial year. Refer to note 2 for detail on the impact of the new accounting standard using the modified retrospective approach. The like-on-like financial effects, for which the Directors of Massmart are responsible, are provided for illustrative purposes only to compare the current financial year's results with the 30 December 2018 Income Statement, allowing for a like-on-like comparison to December 2019. The Group’s external auditor has issued a reporting accountants’ report on the December 2019 Income Statement. A copy of their procedures report is available at the Group’s registered office.
Condensed consolidated income statement
Rm
52 weeks December
2019 (Reviewed)
IFRS 16 adjustment*
52 weeks December
2019 (Adjusted)*
52 weeks December
2018 (Audited)
Period % change
Adjusted* % change
Revenue 93,843.1 – 93,843.1 91,180.6 2.9 2.9 Sales 93,660.0 – 93,660.0 90,941.6 3.0 3.0 Cost of sales (75,946.8) – (75,946.8) (73,250.4) (3.7) (3.7)Gross profit 17,713.2 – 17,713.2 17 691.2 0.1 0.1 Other income 179.7 – 179.7 231.0 (22.2) (22.2)Depreciation and amortisation (3,067.1) 1,736.3 (1,330.8) (1,134.6) (170.3) (17.3)Employment costs (8,188.0) – (8,188.0) (7,582.9) (8.0) (8.0)Occupancy costs (1,365.8) (2,419.2) (3,785.0) (3,491.3) 60.9 (8.4)Other operating costs (4,160.8) – (4,160.8) (3,644.5) (14.2) (14.2)Trading profit before interest and taxation 1,111.2 (682.9) 428.3 2,068.9 (46.3) (79.3)Reorganisation and restructure costs (33.1) – (33.1) (161.0) 79.4 79.4Impairment of assets (229.5) 60.0 (169.5) (21.4) (972.4) (692.1)Insurance proceeds on items in PP&E 3.4 – 3.4 8.0 (57.5) (57.5)Operating profit before foreign exchange movements and interest 852.0 (622.9) 229.1 1,894.5 (55.0) (87.9)Foreign exchange loss (note 4) (143.0) 89.7 (53.3) (2.7) (5,196.3) (1,874.1)Operating profit before interest 709.0 (533.2) 175.8 1 891.8 (62.5) (90.7)– Finance costs (1,860.4) 1,109.3 (751.1) (648.8) (186.7) (15.8)– Finance income 61.3 – 61.3 25.1 144.2 144.2 Net finance costs (1,799.1) 1 109.3 (689.8) (623.7) (188.5) (10.6)(Loss)/Profit before taxation (1,090.1) 576.1 (514.0) 1,268.1 (186.0) (140.5)Taxation (note 9) (206.3) (140.7) (347.0) (399.4) 48.3 13.1 (Loss)/Profit for the period (1,296.4) 435.4 (861.0) 868.7 (249.2) (199.1)
(Loss)/Profit attributable to:– Owners of the parent (1,307.5) 434.9 (872.6) 888.6 (247.1) (198.2)– Non–controlling interests 11.1 0.5 11.6 (19.9) 155.8 158.3 (Loss)/Profit for the period (1,296.4) 435.4 (861.0) 868.7 (249.2) (199.1)
Basic EPS (cents) (600.6) 199.8 (400.8) 410.6 (246.3) (197.6)Diluted basic EPS (cents) (594.9) 197.9 (397.0) 401.9 (248.0) (198.8)Dividend (cents):– Interim – – – 68.0 (100.0) (100.0)– Final – – – 140.0 (100.0) (100.0)– Total – – – 208.0 (100.0) (100.0)
Like-on-like divisional trading review
Rm
52 weeks December
2019(Like-on-
like)*% of
sales
52 weeksDecember
2018(Audited)
% ofsales
Like-on-like*% change
Comparable % sales change
Estimated % sales
inflation#
Sales 93,660.0 90,941.6 3.0 1.5 2.5 Massdiscounters 19,796.0 19,729.4 0.3 (2.1) (0.2)Masswarehouse 29,367.5 28,778.2 2.0 (0.3) 2.2 Massbuild 14,219.0 13,756.1 3.4 1.4 4.0 Masscash^ 30,277.5 28,677.9 5.6 5.8 3.6 Trading profit/(loss) before interest and taxation** 428.3 0.5 2,071.1 2.3 (79.3)Massdiscounters (674.6) (3.4) 32.6 0.2 (2,169.3)Masswarehouse 934.9 3.2 1,100.8 3.8 (15.1)Massbuild 669.8 4.7 749.1 5.4 (10.6)Masscash (501.8) (1.7) 188.6 0.7 (366.1)
* The Group has adopted IFRS 16 ‘Leases’ using the modified retrospective approach in the 2019 period. Prior year comparatives are on an IAS 17 ‘Leases’ basis. Refer to note 2.
** The ‘trading profit/(loss) before interest and taxation’ above is the amount per the Condensed Consolidated Income Statement less the BEE transaction IFRS 2 charge and excludes reorganisation and restructure costs. Divisional trading profit/(loss) includes Corporate allocations.
# Group sales inflation is a weighted inflation.^ Included in the sales number is R312.6 million commission income (2018: R324.9 million) earned by acting as an agent through the Shield
arrangement (a voluntary buying association). In cases where the Group acts as an agent in a transaction and where sales are recognised on a net basis, the contractual terms of such arrangements do not meet the requirements that allow offsetting financial instruments resulting in the related receivable and payable balances being disclosed on a gross basis.
Divisional trading review
Rm
52 weeksDecember
2019(Reviewed)
IFRS16 adjustment*
52 weeksDecember
2019(Adjusted)*
52 weeksDecember
2018(Audited)
Sales 93,660.0 93,660.0 90,941.6
Massdiscounters 19,796.0 19,796.0 19,729.4
Masswarehouse 29,367.5 29,367.5 28,778.2
Massbuild 14,219.0 14,219.0 13,756.1
Masscash^ 30,277.5 30,277.5 28,677.9
Trading profit/(loss) before interest and taxation** 1,111.2 (682.9) 428.3 2,071.1
Massdiscounters (391.0) (283.6) (674.6) 32.6
Masswarehouse 1,039.1 (104.2) 934.9 1,100.8
Massbuild 848.5 (178.7) 669.8 749.1
Masscash (385.4) (116.4) (501.8) 188.6
8 Massmart Reviewed Consolidated Results For the 52 weeks ended 29 December 2019 9
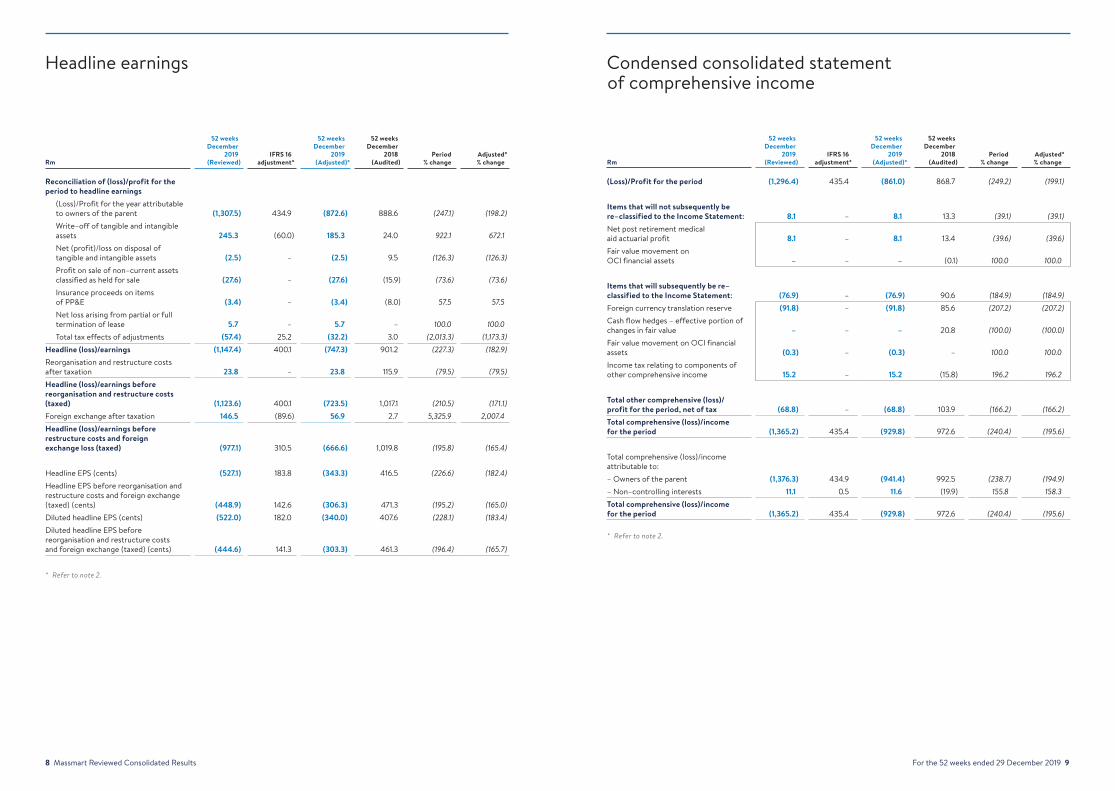
Headline earnings
Rm
52 weeks December
2019 (Reviewed)
IFRS 16 adjustment*
52 weeks December
2019 (Adjusted)*
52 weeks December
2018 (Audited)
Period % change
Adjusted* % change
Reconciliation of (loss)/profit for the period to headline earnings
(Loss)/Profit for the year attributable to owners of the parent (1,307.5) 434.9 (872.6) 888.6 (247.1) (198.2)Write–off of tangible and intangible assets 245.3 (60.0) 185.3 24.0 922.1 672.1 Net (profit)/loss on disposal of tangible and intangible assets (2.5) – (2.5) 9.5 (126.3) (126.3)Profit on sale of non–current assets classified as held for sale (27.6) – (27.6) (15.9) (73.6) (73.6)Insurance proceeds on items of PP&E (3.4) – (3.4) (8.0) 57.5 57.5 Net loss arising from partial or full termination of lease 5.7 – 5.7 – 100.0 100.0Total tax effects of adjustments (57.4) 25.2 (32.2) 3.0 (2,013.3) (1,173.3)
Headline (loss)/earnings (1,147.4) 400.1 (747.3) 901.2 (227.3) (182.9)Reorganisation and restructure costs after taxation 23.8 – 23.8 115.9 (79.5) (79.5)Headline (loss)/earnings before reorganisation and restructure costs (taxed) (1,123.6) 400.1 (723.5) 1,017.1 (210.5) (171.1)Foreign exchange after taxation 146.5 (89.6) 56.9 2.7 5,325.9 2,007.4Headline (loss)/earnings before restructure costs and foreign exchange loss (taxed) (977.1) 310.5 (666.6) 1,019.8 (195.8) (165.4)
Headline EPS (cents) (527.1) 183.8 (343.3) 416.5 (226.6) (182.4)Headline EPS before reorganisation and restructure costs and foreign exchange (taxed) (cents) (448.9) 142.6 (306.3) 471.3 (195.2) (165.0)Diluted headline EPS (cents) (522.0) 182.0 (340.0) 407.6 (228.1) (183.4)Diluted headline EPS before reorganisation and restructure costs and foreign exchange (taxed) (cents) (444.6) 141.3 (303.3) 461.3 (196.4) (165.7)
Condensed consolidated statement of comprehensive income
Rm
52 weeks December
2019 (Reviewed)
IFRS 16 adjustment*
52 weeks December
2019 (Adjusted)*
52 weeks December
2018 (Audited)
Period % change
Adjusted* % change
(Loss)/Profit for the period (1,296.4) 435.4 (861.0) 868.7 (249.2) (199.1)
Items that will not subsequently be re–classified to the Income Statement: 8.1 – 8.1 13.3 (39.1) (39.1)Net post retirement medical aid actuarial profit 8.1 – 8.1 13.4 (39.6) (39.6)Fair value movement on OCI financial assets – – – (0.1) 100.0 100.0
Items that will subsequently be re–classified to the Income Statement: (76.9) – (76.9) 90.6 (184.9) (184.9)Foreign currency translation reserve (91.8) – (91.8) 85.6 (207.2) (207.2)Cash flow hedges – effective portion of changes in fair value – – – 20.8 (100.0) (100.0)Fair value movement on OCI financial assets (0.3) – (0.3) – 100.0 100.0Income tax relating to components of other comprehensive income 15.2 – 15.2 (15.8) 196.2 196.2
Total other comprehensive (loss)/profit for the period, net of tax (68.8) – (68.8) 103.9 (166.2) (166.2)Total comprehensive (loss)/income for the period (1,365.2) 435.4 (929.8) 972.6 (240.4) (195.6)
Total comprehensive (loss)/income attributable to:– Owners of the parent (1,376.3) 434.9 (941.4) 992.5 (238.7) (194.9)– Non–controlling interests 11.1 0.5 11.6 (19.9) 155.8 158.3Total comprehensive (loss)/income for the period (1,365.2) 435.4 (929.8) 972.6 (240.4) (195.6)
* Refer to note 2.
* Refer to note 2.

10 Massmart Reviewed Consolidated Results For the 52 weeks ended 29 December 2019 11
Condensed consolidated statement of financial position
Rm
December2019
(Reviewed)
December2018
(Audited)
IFRS 16at adoption adjustment*
2019 Opening
balance (Adjusted)*
Period % change
Adjusted* % change
ASSETSNon–current assets 21,747.2 14,165.8 8,530.0 22,695.8 53.5 (4.2)Property, plant and equipment 8,585.9 9,109.5 – 9,109.5 (5.7) (5.7) Lease assets 8,283.1 537.7 8,530.0 9,067.7 1,440.5 (8.7) Goodwill and other intangible assets 3,865.5 3,656.3 – 3,656.3 5.7 5.7 Investments and other financial assets 127.0 119.2 – 119.2 6.5 6.5 Deferred taxation 885.7 743.1 – 743.1 19.2 19.2 Current assets 18,431.1 20,605.2 (118.1) 20,487.1 (10.6) (10.0) Inventories 11,893.8 12,180.9 – 12,180.9 (2.4) (2.4) Trade, other receivables and prepayments 5,020.8 5,693.2 (118.1) 5,575.1 (11.8) (9.9) Taxation 224.7 361.3 – 361.3 (37.8) (37.8)Cash on hand and bank balances 1,291.8 2,369.8 – 2,369.8 (45.5) (45.5) Non–current assets classified as held for sale 159.5 11.6 – 11.6 1,275.0 1,275.0
Total assets 40,337.8 34,782.6 8,411.9 43,194.5 16.0 (6.6)
EQUITY AND LIABILITIESTotal equity 4,800.8 6,528.6 (227.1) 6,301.5 (26.5) (23.8) Equity attributable to owners of the parent 4,785.5 6,514.0 (227.1) 6,286.9 (26.5) (23.9) Non–controlling interests 15.3 14.6 – 14.6 4.8 4.8Non–current liabilities 11,121.2 3,694.5 7,673.9 11,368.4 201.0 (2.2) Interest–bearing borrowings 2,000.0 1,606.0 – 1,606.0 24.5 24.5 Lease liability 8,950.7 648.1 8,950.2 9,598.3 1,281.1 (6.7) Deferred taxation 79.7 76.7 – 76.7 3.9 3.9 Other non–current liabilities and provisions 90.8 1,363.7 (1,276.3) 87.4 (93.3) 3.9 Current liabilities 24,415.8 24,559.5 965.1 25,524.6 (0.6) (4.3)Trade, other payables and provisions 21,117.0 21,925.1 (145.3) 21,779.8 (3.7) (3.0) Taxation 200.4 205.3 – 205.3 (2.4) (2.4) Bank overdrafts and debt facilities (note 8) 141.2 1,744.0 – 1,744.0 (91.9) (91.9) Interest–bearing borrowings 1,572.8 616.1 – 616.1 155.3 155.3 Lease liability 1,384.4 69.0 1,110.4 1,179.4 1,906.4 17.4
Total equity and liabilities 40,337.8 34,782.6 8,411.9 43,194.5 16.0 (6.6)
* Refer to note 2.
Condensed consolidated statement of cash flows
Rm
December 2019
(Reviewed) IFRS 16
adjustment*
December 2019
(Adjusted)*
December 2018
(Audited)
Operating cash before working capital movements 4,296.8 (2,385.3) 1,911.5 3,411.3 Working capital movements (82.0) (106.8) (188.8) (545.8)Cash generated from operations 4,214.8 (2,492.1) 1,722.7 2,865.5 Taxation paid (191.1) – (191.1) (324.6)Net interest paid (1,714.7) 1,003.0 (711.7) (482.9)Dividends received 20.0 – 20.0 34.0 Dividends paid (162.4) – (162.4) (750.0)Cash inflow from operating activities 2,166.6 (1,489.1) 677.5 1,342.0
Investment to maintain operations (580.3) – (580.3) (772.4)Investment to expand operations (791.5) – (791.5) (833.6)Proceeds on disposal of property, plant and equipment 7.9 – 7.9 20.4 Proceeds on disposal of assets classified as held for sale 41.3 – 41.3 32.8 Other net investing activities 11.3 – 11.3 5.9 Cash outflow from investing activities (1,311.3) – (1,311.3) (1,546.9)
Increase/(Decrease) in non–current liabilities 600.0 – 600.0 (583.7)(Decrease)/Increase in current liabilities (2,613.4) 1,489.1 (1,124.3) 1,043.5 Net acquisition of treasury shares (48.4) – (48.4) (221.1)Cash (outflow)/inflow from financing activities (2,061.8) 1,489.1 (572.7) 238.7
Net (decrease)/increase in cash and cash equivalents (1,206.5) – (1,206.5) 33.8 Foreign exchange movements on cash and cash equivalents (12.7) – (12.7) 29.9 Opening cash and cash equivalents 2,369.8 – 2,369.8 2,306.1
Closing cash and cash equivalents 1,150.6 – 1,150.6 2,369.8
* Refer to note 2.
12 Massmart Reviewed Consolidated Results For the 52 weeks ended 29 December 2019 13
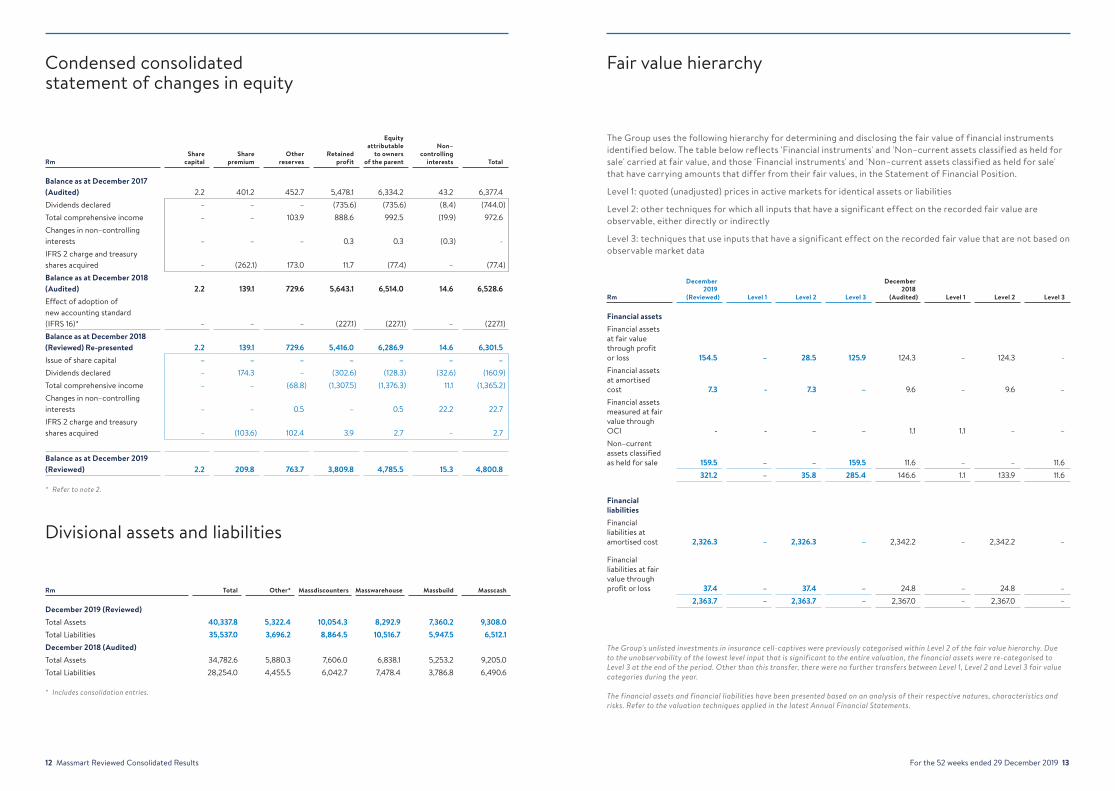
Condensed consolidated statement of changes in equity
Divisional assets and liabilities
RmShare
capitalShare
premiumOther
reservesRetained
profit
Equity attributable
to ownersof the parent
Non–controlling
interests Total
Balance as at December 2017 (Audited) 2.2 401.2 452.7 5,478.1 6,334.2 43.2 6,377.4 Dividends declared – – – (735.6) (735.6) (8.4) (744.0)Total comprehensive income – – 103.9 888.6 992.5 (19.9) 972.6 Changes in non–controlling interests – – – 0.3 0.3 (0.3) -IFRS 2 charge and treasury shares acquired – (262.1) 173.0 11.7 (77.4) – (77.4)Balance as at December 2018 (Audited) 2.2 139.1 729.6 5,643.1 6,514.0 14.6 6,528.6 Effect of adoption of new accounting standard (IFRS 16)* – – – (227.1) (227.1) – (227.1)Balance as at December 2018 (Reviewed) Re-presented 2.2 139.1 729.6 5,416.0 6,286.9 14.6 6,301.5 Issue of share capital – – – – – – – Dividends declared – 174.3 – (302.6) (128.3) (32.6) (160.9)Total comprehensive income – – (68.8) (1,307.5) (1,376.3) 11.1 (1,365.2)Changes in non–controlling interests – – 0.5 – 0.5 22.2 22.7 IFRS 2 charge and treasury shares acquired – (103.6) 102.4 3.9 2.7 – 2.7
Balance as at December 2019 (Reviewed) 2.2 209.8 763.7 3,809.8 4,785.5 15.3 4,800.8
Rm Total Other* Massdiscounters Masswarehouse Massbuild Masscash
December 2019 (Reviewed) Total Assets 40,337.8 5,322.4 10,054.3 8,292.9 7,360.2 9,308.0Total Liabilities 35,537.0 3,696.2 8,864.5 10,516.7 5,947.5 6,512.1December 2018 (Audited) Total Assets 34,782.6 5,880.3 7,606.0 6,838.1 5,253.2 9,205.0Total Liabilities 28,254.0 4,455.5 6,042.7 7,478.4 3,786.8 6,490.6
* Refer to note 2.
* Includes consolidation entries.
Fair value hierarchy
The Group uses the following hierarchy for determining and disclosing the fair value of financial instruments identified below. The table below reflects 'Financial instruments' and 'Non–current assets classified as held for sale' carried at fair value, and those 'Financial instruments' and 'Non–current assets classified as held for sale' that have carrying amounts that differ from their fair values, in the Statement of Financial Position.
Level 1: quoted (unadjusted) prices in active markets for identical assets or liabilities
Level 2: other techniques for which all inputs that have a significant effect on the recorded fair value are observable, either directly or indirectly
Level 3: techniques that use inputs that have a significant effect on the recorded fair value that are not based on observable market data
Rm
December 2019
(Reviewed) Level 1 Level 2 Level 3
December2018
(Audited) Level 1 Level 2 Level 3
Financial assets Financial assets at fair value through profit or loss 154.5 – 28.5 125.9 124.3 – 124.3 -Financial assets at amortised cost 7.3 - 7.3 – 9.6 – 9.6 – Financial assets measured at fair value through OCI - - – – 1.1 1.1 – – Non–current assets classified as held for sale 159.5 – – 159.5 11.6 – – 11.6
321.2 – 35.8 285.4 146.6 1.1 133.9 11.6
Financial liabilitiesFinancial liabilities at amortised cost 2,326.3 – 2,326.3 – 2,342.2 – 2,342.2 –
Financial liabilities at fair value through profit or loss 37.4 – 37.4 – 24.8 – 24.8 –
2,363.7 – 2,363.7 – 2,367.0 – 2,367.0 –
The Group's unlisted investments in insurance cell-captives were previously categorised within Level 2 of the fair value hierarchy. Due to the unobservability of the lowest level input that is significant to the entire valuation, the financial assets were re-categorised to Level 3 at the end of the period. Other than this transfer, there were no further transfers between Level 1, Level 2 and Level 3 fair value categories during the year.
The financial assets and financial liabilities have been presented based on an analysis of their respective natures, characteristics and risks. Refer to the valuation techniques applied in the latest Annual Financial Statements.
14 Massmart Reviewed Consolidated Results For the 52 weeks ended 29 December 2019 15
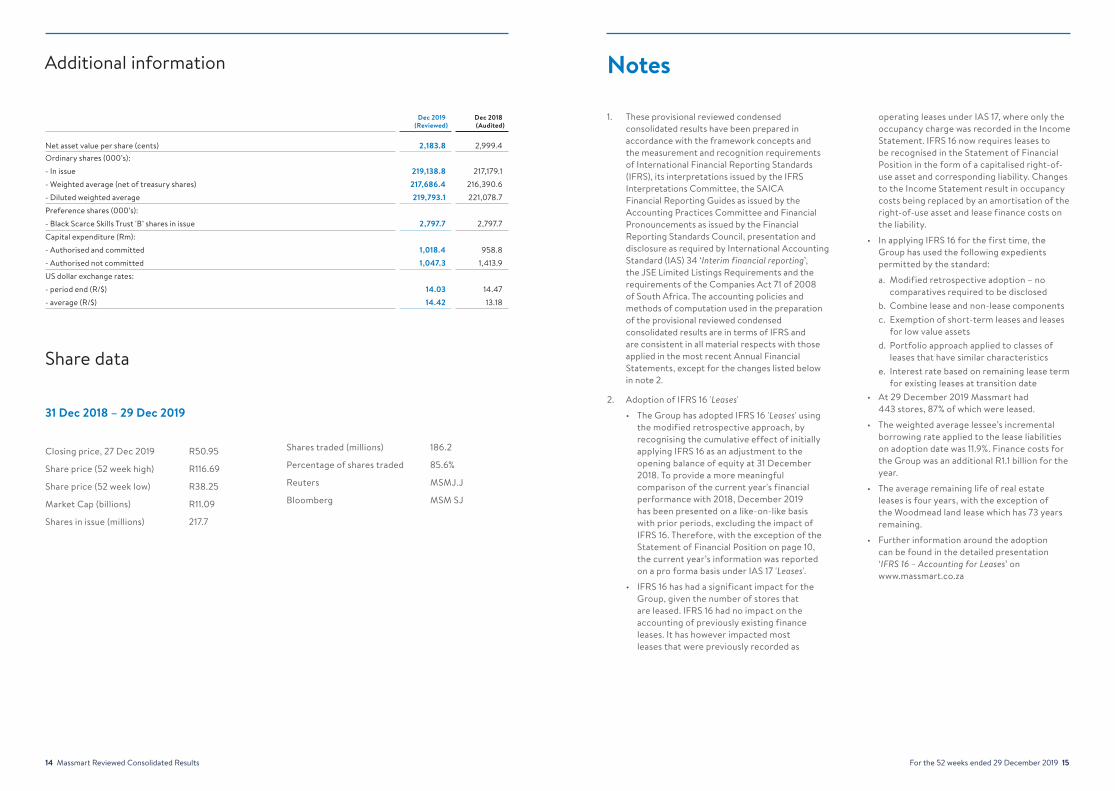
Additional information
Dec 2019(Reviewed)
Dec 2018(Audited)
Net asset value per share (cents) 2,183.8 2,999.4 Ordinary shares (000’s):
- In issue 219,138.8 217,179.1
- Weighted average (net of treasury shares) 217,686.4 216,390.6
- Diluted weighted average 219,793.1 221,078.7
Preference shares (000’s):
- Black Scarce Skills Trust 'B’ shares in issue 2,797.7 2,797.7
Capital expenditure (Rm):
- Authorised and committed 1,018.4 958.8
- Authorised not committed 1,047.3 1,413.9
US dollar exchange rates:
- period end (R/$) 14.03 14.47
- average (R/$) 14.42 13.18
Share data
31 Dec 2018 – 29 Dec 2019
Closing price, 27 Dec 2019 R50.95
Share price (52 week high) R116.69
Share price (52 week low) R38.25
Market Cap (billions) R11.09
Shares in issue (millions) 217.7
Shares traded (millions) 186.2
Percentage of shares traded 85.6%
Reuters MSMJ.J
Bloomberg MSM SJ
1. These provisional reviewed condensed consolidated results have been prepared in accordance with the framework concepts and the measurement and recognition requirements of International Financial Reporting Standards (IFRS), its interpretations issued by the IFRS Interpretations Committee, the SAICA Financial Reporting Guides as issued by the Accounting Practices Committee and Financial Pronouncements as issued by the Financial Reporting Standards Council, presentation and disclosure as required by International Accounting Standard (IAS) 34 ‘Interim financial reporting’, the JSE Limited Listings Requirements and the requirements of the Companies Act 71 of 2008 of South Africa. The accounting policies and methods of computation used in the preparation of the provisional reviewed condensed consolidated results are in terms of IFRS and are consistent in all material respects with those applied in the most recent Annual Financial Statements, except for the changes listed below in note 2.
2. Adoption of IFRS 16 'Leases'
• The Group has adopted IFRS 16 'Leases' using the modified retrospective approach, by recognising the cumulative effect of initially applying IFRS 16 as an adjustment to the opening balance of equity at 31 December 2018. To provide a more meaningful comparison of the current year's financial performance with 2018, December 2019 has been presented on a like-on-like basis with prior periods, excluding the impact of IFRS 16. Therefore, with the exception of the Statement of Financial Position on page 10, the current year’s information was reported on a pro forma basis under IAS 17 'Leases'.
• IFRS 16 has had a significant impact for the Group, given the number of stores that are leased. IFRS 16 had no impact on the accounting of previously existing finance leases. It has however impacted most leases that were previously recorded as
Notes
operating leases under IAS 17, where only the occupancy charge was recorded in the Income Statement. IFRS 16 now requires leases to be recognised in the Statement of Financial Position in the form of a capitalised right-of-use asset and corresponding liability. Changes to the Income Statement result in occupancy costs being replaced by an amortisation of the right-of-use asset and lease finance costs on the liability.
• In applying IFRS 16 for the first time, the Group has used the following expedients permitted by the standard:
a. Modified retrospective adoption – no comparatives required to be disclosed
b. Combine lease and non-lease componentsc. Exemption of short-term leases and leases
for low value assetsd. Portfolio approach applied to classes of
leases that have similar characteristicse. Interest rate based on remaining lease term
for existing leases at transition date• At 29 December 2019 Massmart had
443 stores, 87% of which were leased.
• The weighted average lessee’s incremental borrowing rate applied to the lease liabilities on adoption date was 11.9%. Finance costs for the Group was an additional R1.1 billion for the year.
• The average remaining life of real estate leases is four years, with the exception of the Woodmead land lease which has 73 years remaining.
• Further information around the adoption can be found in the detailed presentation ‘IFRS 16 – Accounting for Leases’ on www.massmart.co.za
16 Massmart Reviewed Consolidated Results For the 52 weeks ended 29 December 2019 17
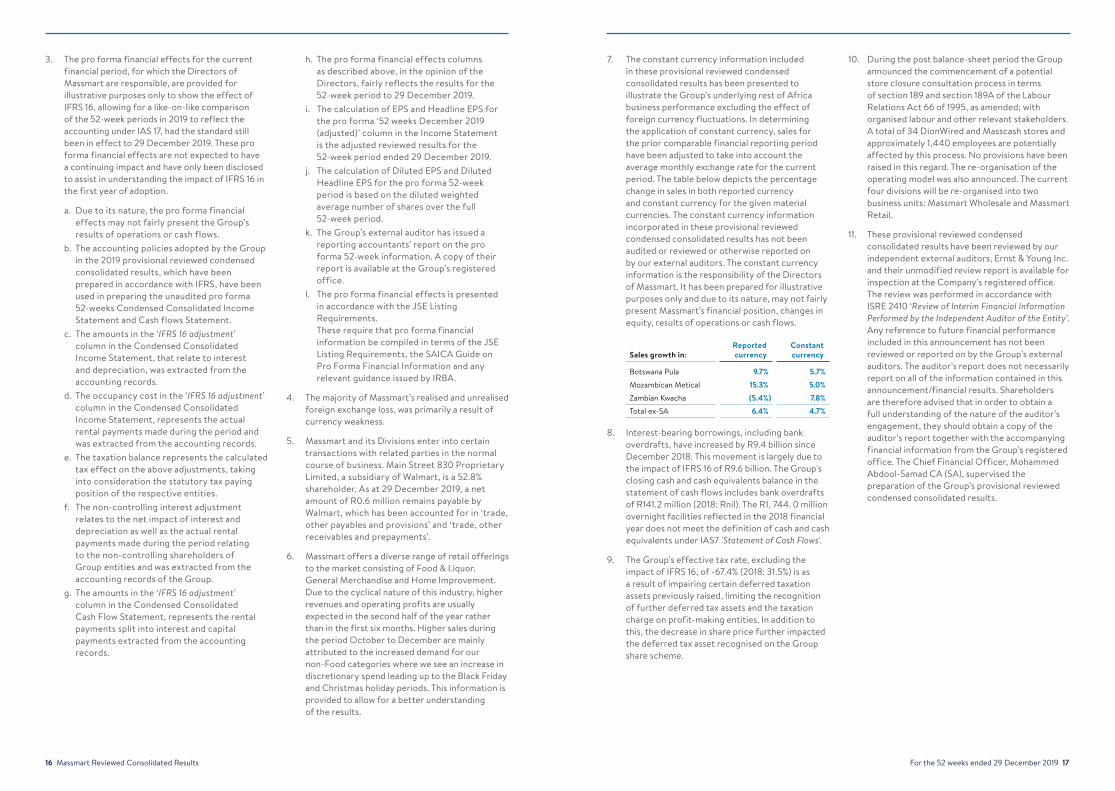
3. The pro forma financial effects for the current financial period, for which the Directors of Massmart are responsible, are provided for illustrative purposes only to show the effect of IFRS 16, allowing for a like-on-like comparison of the 52-week periods in 2019 to reflect the accounting under IAS 17, had the standard still been in effect to 29 December 2019. These pro forma financial effects are not expected to have a continuing impact and have only been disclosed to assist in understanding the impact of IFRS 16 in the first year of adoption.
a. Due to its nature, the pro forma financial effects may not fairly present the Group’s results of operations or cash flows.
b. The accounting policies adopted by the Group in the 2019 provisional reviewed condensed consolidated results, which have been prepared in accordance with IFRS, have been used in preparing the unaudited pro forma 52-weeks Condensed Consolidated Income Statement and Cash flows Statement.
c. The amounts in the ‘IFRS 16 adjustment’ column in the Condensed Consolidated Income Statement, that relate to interest and depreciation, was extracted from the accounting records.
d. The occupancy cost in the ‘IFRS 16 adjustment’ column in the Condensed Consolidated Income Statement, represents the actual rental payments made during the period and was extracted from the accounting records.
e. The taxation balance represents the calculated tax effect on the above adjustments, taking into consideration the statutory tax paying position of the respective entities.
f. The non-controlling interest adjustment relates to the net impact of interest and depreciation as well as the actual rental payments made during the period relating to the non-controlling shareholders of Group entities and was extracted from the accounting records of the Group.
g. The amounts in the ‘IFRS 16 adjustment’ column in the Condensed Consolidated Cash Flow Statement, represents the rental payments split into interest and capital payments extracted from the accounting records.
h. The pro forma financial effects columns as described above, in the opinion of the Directors, fairly reflects the results for the 52-week period to 29 December 2019.
i. The calculation of EPS and Headline EPS for the pro forma ‘52 weeks December 2019 (adjusted)’ column in the Income Statement is the adjusted reviewed results for the 52-week period ended 29 December 2019.
j. The calculation of Diluted EPS and Diluted Headline EPS for the pro forma 52-week period is based on the diluted weighted average number of shares over the full 52-week period.
k. The Group’s external auditor has issued a reporting accountants’ report on the pro forma 52-week information. A copy of their report is available at the Group’s registered office.
l. The pro forma financial effects is presented in accordance with the JSE Listing Requirements. These require that pro forma financial information be compiled in terms of the JSE Listing Requirements, the SAICA Guide on Pro Forma Financial Information and any relevant guidance issued by IRBA.
4. The majority of Massmart’s realised and unrealised foreign exchange loss, was primarily a result of currency weakness.
5. Massmart and its Divisions enter into certain transactions with related parties in the normal course of business. Main Street 830 Proprietary Limited, a subsidiary of Walmart, is a 52.8% shareholder. As at 29 December 2019, a net amount of R0.6 million remains payable by Walmart, which has been accounted for in ‘trade, other payables and provisions’ and ‘trade, other receivables and prepayments’.
6. Massmart offers a diverse range of retail offerings to the market consisting of Food & Liquor, General Merchandise and Home Improvement. Due to the cyclical nature of this industry, higher revenues and operating profits are usually expected in the second half of the year rather than in the first six months. Higher sales during the period October to December are mainly attributed to the increased demand for our non-Food categories where we see an increase in discretionary spend leading up to the Black Friday and Christmas holiday periods. This information is provided to allow for a better understanding of the results.
7. The constant currency information included in these provisional reviewed condensed consolidated results has been presented to illustrate the Group’s underlying rest of Africa business performance excluding the effect of foreign currency fluctuations. In determining the application of constant currency, sales for the prior comparable financial reporting period have been adjusted to take into account the average monthly exchange rate for the current period. The table below depicts the percentage change in sales in both reported currency and constant currency for the given material currencies. The constant currency information incorporated in these provisional reviewed condensed consolidated results has not been audited or reviewed or otherwise reported on by our external auditors. The constant currency information is the responsibility of the Directors of Massmart. It has been prepared for illustrative purposes only and due to its nature, may not fairly present Massmart’s financial position, changes in equity, results of operations or cash flows.
Sales growth in:Reported currency
Constant currency
Botswana Pula 9.7% 5.7%Mozambican Metical 15.3% 5.0%Zambian Kwacha (5.4%) 7.8%Total ex-SA 6.4% 4.7%
8. Interest-bearing borrowings, including bank overdrafts, have increased by R9.4 billion since December 2018. This movement is largely due to the impact of IFRS 16 of R9.6 billion. The Group's closing cash and cash equivalents balance in the statement of cash flows includes bank overdrafts of R141.2 million (2018: Rnil). The R1, 744. 0 million overnight facilities reflected in the 2018 financial year does not meet the definition of cash and cash equivalents under IAS7 'Statement of Cash Flows'.
9. The Group’s effective tax rate, excluding the impact of IFRS 16, of -67.4% (2018: 31.5%) is as a result of impairing certain deferred taxation assets previously raised, limiting the recognition of further deferred tax assets and the taxation charge on profit-making entities. In addition to this, the decrease in share price further impacted the deferred tax asset recognised on the Group share scheme.
10. During the post balance-sheet period the Group announced the commencement of a potential store closure consultation process in terms of section 189 and section 189A of the Labour Relations Act 66 of 1995, as amended; with organised labour and other relevant stakeholders. A total of 34 DionWired and Masscash stores and approximately 1,440 employees are potentially affected by this process. No provisions have been raised in this regard. The re-organisation of the operating model was also announced. The current four divisions will be re-organised into two business units: Massmart Wholesale and Massmart Retail.
11. These provisional reviewed condensed consolidated results have been reviewed by our independent external auditors, Ernst & Young Inc. and their unmodified review report is available for inspection at the Company’s registered office. The review was performed in accordance with ISRE 2410 ‘Review of Interim Financial Information Performed by the Independent Auditor of the Entity’. Any reference to future financial performance included in this announcement has not been reviewed or reported on by the Group’s external auditors. The auditor’s report does not necessarily report on all of the information contained in this announcement/financial results. Shareholders are therefore advised that in order to obtain a full understanding of the nature of the auditor’s engagement, they should obtain a copy of the auditor’s report together with the accompanying financial information from the Group’s registered office. The Chief Financial Officer, Mohammed Abdool-Samad CA (SA), supervised the preparation of the Group’s provisional reviewed condensed consolidated results.

18 Massmart Reviewed Consolidated Results
For more information call +27 11 517 0000 or visit massmart.co.za/results2019
Massmart Holdings Limited (“the Company” or “the Group”)
JSE code MSM
ISIN ZAE000152617
Company registration number 1940/014066/06
Registered office Massmart House, 16 Peltier Drive, Sunninghill Ext 6, 2157
Interim company secretary N Morgan
Sponsor JP Morgan Equities South Africa Proprietary Limited 1 Fricker Road, Illovo Johannesburg, 2196, South Africa
Transfer secretaries Computershare Investor Services Pty Ltd, Rosebank Towers, 15 Biermann Avenue, Rosebank, Johannesburg, 2196, South Africa
Registered auditors Ernst & Young Inc. 102 Rivonia Road, Sandton, Johannesburg, 2196, South Africa
Directorate KD Dlamini (Chairman), MW Slape*^ (Chief Executive Officer), JP Suarez*, Dr NN Gwagwa, O Ighodaro***, P Langeni, L Mthimunye, SW Muigai**, C Redfield*, M Abdool-Samad^ (Chief Financial Officer)
*USA **Canada ***British and Nigerian ^Executive
Date of publication 27 February 2020
in South Africa, Botswana, Ghana, Kenya, Lesotho, Malawi, Mozambique, Namibia, Nigeria, Tanzania, Uganda, Zambia
173 stores2018: 171 stores
in South Africa
22 stores2018: 21 stores
in South Africa, Botswana, Mozambique, Zambia
118 stores2018: 114 stores
in South Africa, Botswana, Lesotho, Mozambique, Namibia, Swaziland, Zambia
130 stores2018: 130 stores
General Merchandise and Food discounter
Home improvement Retailer and building
materials supplier
Food Wholesaler, Retailer and buying association
Warehouse club
R19.8bnSales2018: R19.7bn
R29.4bnSales2018: R28.8bn
R14.2bnSales2018: R13.8bn
R30.3bnSales2018: R28.7bn
(R674.6m)*Trading (loss)/profit2018: R32.6m
R934.9m*Trading profit2018: R1,100.8m
R669.8m*Trading profit2018: R749.1m
(R501.8m)*Trading (loss)/profit2018: R188.6m
Trading space2018: 560,828m2
561,934m2
Trading space2018: 231,021m2
246,125m2
Trading space2018: 468,155m2
478,279m2
Trading space2018: 388,714m2
388,714m2
Full-time employee equivalents2018: 11,730
Full-time employee equivalents2018: 10,646
Full-time employee equivalents2018: 10,421
Full-time employee equivalents2018: 14,984
11,964
9,776
10,226
16,965
* Refer to note 2.