results of the 2010 delaware river and bay integrated list ... bayresults.pdfresults of the 2010...
TRANSCRIPT
Results of the 2010 Delaware River and Bay Integrated List
Water Quality Assessment
NJWMCSeptember 21, 2011John Yagecic, P.E.Erik Silldorff, Ph.D.

Assessment Participants
DRBC• Ron MacGillivray, Ph.D.• Erik Silldorff, Ph.D.• Bob Limbeck• John Yagecic, P.E.• Tom Fikslin, Ph.D.• Ed Santoro
State Contacts• Deb Hammond (NJ)• Dave Wolanski (DE)• Rod Kime (PA)• Jeff Myers (NY)

This Presentation
• Designated uses and support of those uses
• Parameter specific assessments• Issues
– Nearing resolution– Ongoing– New
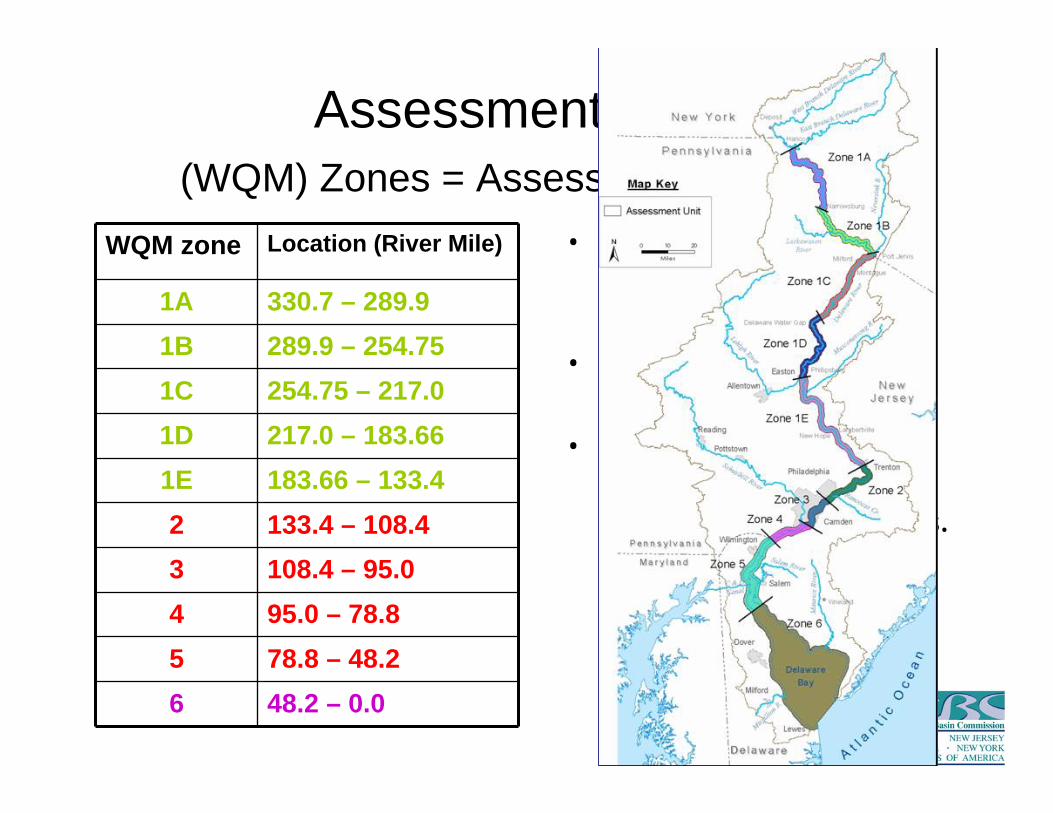
Assessment Units(WQM) Zones = Assessment Units (AU)
WQM zone Location (River Mile)
1A 330.7 – 289.9 1B 289.9 – 254.75 1C 254.75 – 217.0 1D 217.0 – 183.66 1E 183.66 – 133.4 2 133.4 – 108.4 3 108.4 – 95.0 4 95.0 – 78.8 5 78.8 – 48.2 6 48.2 – 0.0
• Assessment units match DRBC water quality management zones.
• Zones E, W1, W2, N1 and N2 not assessed (i.e., intrastate zones).
• Zone 6 still subdivided for shellfish based on DE and NJ shellfish management directives.
Estuary or Tidal
Bay
Non-tidal

Designated UsesDesignatedWater Use DRBC WQM Zone or AU
1A 1B 1C 1D 1E 2 3 4A 5 6
Aquatic Life X X X X X X X X X X
Drinking Water X X X X X X X
Primary Recreation X X X X X X X X X
SecondaryRecreation
X X
Fish Consumption X X X X X X X X X X
Shellfish Consumption X
A Primary recreation below RM 81.8; Secondary recreation above RM 81.8

2010 Assessment ResultsAquatic Life Drinking Water Recreation Fish Consumption ShellfishingAU 2010 2008 2010 2008 2010 2008 2010 2008 2010 2008
1A NS NS S S S S NS NS NA NA 1B NSA ID S S S S NS NS NA NA 1C IDA ID S S S S NS NS NA NA 1D NSA ID S S S S NS NS NA NA 1E NS NS S S S S NS NS NA NA 2 NS NS S S S S NS NS NA NA 3 NSA S S S S S NS NS NA NA 4 NSA NS NA NA ID/S ID/S NS NS NA NA 5 NSA,B NS NA NA S S NS NS NA NA 6 NSA S NA NA S S NS NS See Table
4-13
S: The assessment unit supports the designated use. SS: The assessment unit supports the designated use, but with special conditions. NS: The assessment does not support the designated use. NA: DRBC WQR does not contain applicable criteria for a parameter in the AU. ID: Insufficient or unreliable data is present. A NS for this Zone is considered tentative due to uncertainties associated with comparison to EPArecommended toxics criteria in the absence of DRBC numerical criteria and/or observations that exceededEPA’s currently required threshold of 1 violation and 1 confirmation, but not the previously utilizedthreshold of 10%. B Assessment against copper criteria in Zone 5 was inconclusive. See description in Section 4.3.1.6.
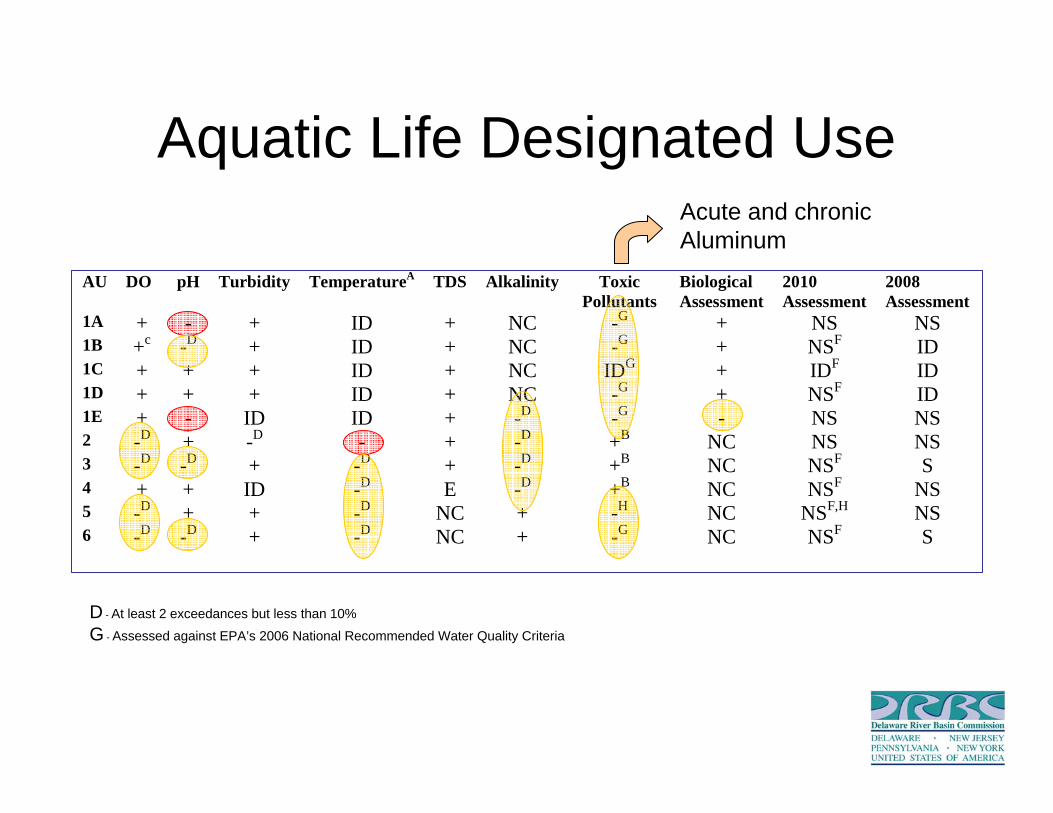
Aquatic Life Designated Use
AU DO pH Turbidity TemperatureA TDS Alkalinity Toxic Pollutants
Biological Assessment
2010 Assessment
2008 Assessment
1A + - + ID + NC -G + NS NS 1B +c -D + ID + NC -G + NSF ID 1C + + + ID + NC IDG + IDF ID 1D + + + ID + NC -G + NSF ID 1E + - ID ID + -D -G - NS NS 2 -D + -D - + -D +B NC NS NS 3 -D -D + -D + -D +B NC NSF S 4 + + ID -D E -D +B NC NSF NS 5 -D + + -D NC + -H NC NSF,H NS 6 -D -D + -D NC + -G NC NSF S
Acute and chronic Aluminum
D - At least 2 exceedances but less than 10%
G - Assessed against EPA’s 2006 National Recommended Water Quality Criteria
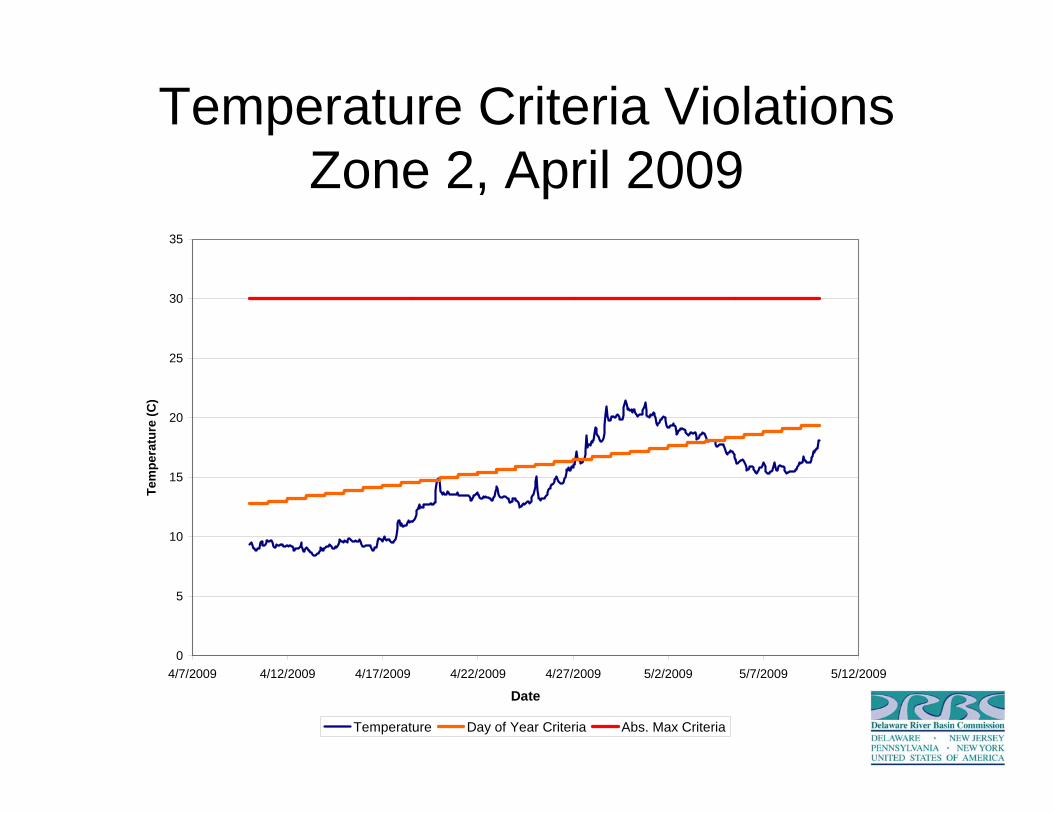
Temperature Criteria ViolationsZone 2, April 2009
0
5
10
15
20
25
30
35
4/7/2009 4/12/2009 4/17/2009 4/22/2009 4/27/2009 5/2/2009 5/7/2009 5/12/2009
Date
Tem
pera
ture
(C)
Temperature Day of Year Criteria Abs. Max Criteria
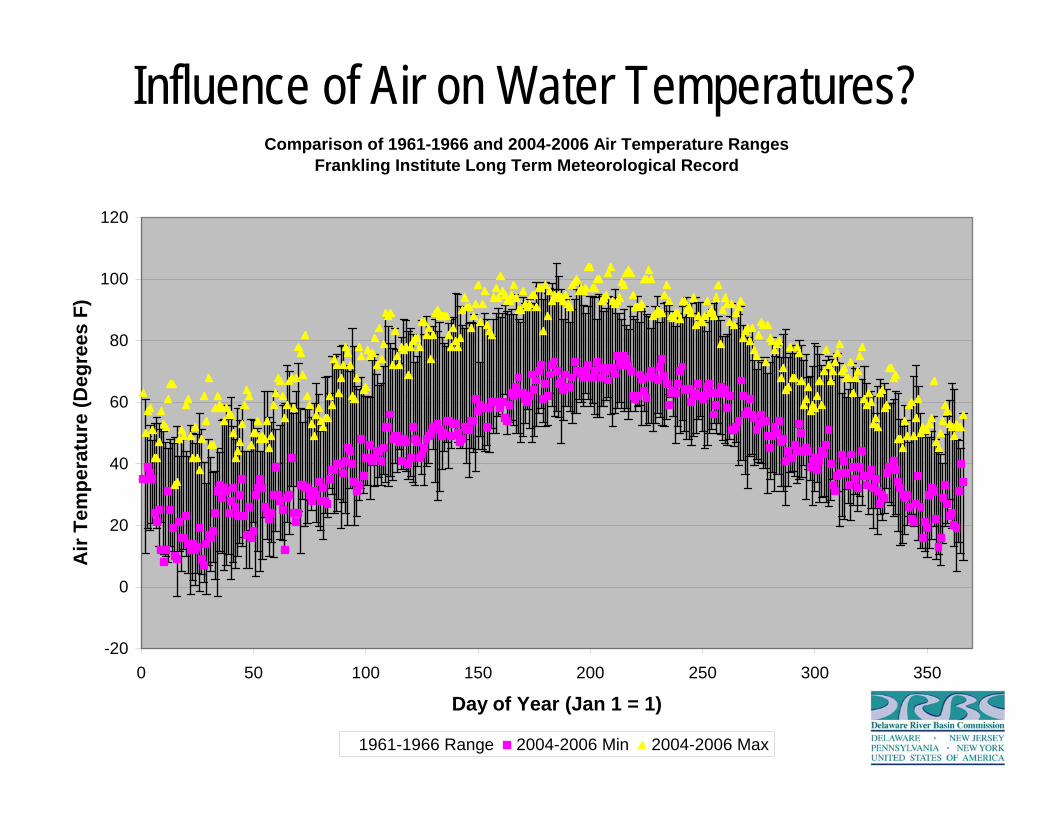
Influence of Air on Water Temperatures?Comparison of 1961-1966 and 2004-2006 Air Temperature Ranges
Frankling Institute Long Term Meteorological Record
-20
0
20
40
60
80
100
120
0 50 100 150 200 250 300 350
Day of Year (Jan 1 = 1)
Air
Tem
pera
ture
(Deg
rees
F)
1961-1966 Range 2004-2006 Min 2004-2006 Max

Comparison of distribution of daily high and low temperatures during
1961-1966 to 2004-2006Comparison of 1961-1966 and 2004-2006 Daily Maximum Air Temperature Distributions
Frankling Institute Long Term Meteorological Record
0
20
40
60
80
100
120
0 0.1 0.2 0.3 0.4 0.5 0.6 0.7 0.8 0.9 1
Percentiles
Daily
Max
imum
Air
Tem
pera
ture
(Deg
rees
F)
1961-1966 Max 2004-2006 Max
Comparison of 1961-1966 and 2004-2006 Daily Minimum Air Temperature DistributionsFrankling Institute Long Term Meteorological Record
0
10
20
30
40
50
60
70
80
90
0 0.1 0.2 0.3 0.4 0.5 0.6 0.7 0.8 0.9 1
Percentile
Daily
Min
imum
Air
Tem
pera
ture
(Deg
rees
F)
1961-1966 Min 2004-2006 Min
~ 7.5 degree difference throughout the range

Comparison of Air and Water Temperaturesfor August 2005
Comparison of Observed Water Temperature in Zone 2 to DRBC Criteria August 2005
20
22
24
26
28
30
32
34
7/27/2005 8/1/2005 8/6/2005 8/11/2005 8/16/2005 8/21/2005 8/26/2005 8/31/2005 9/5/2005
Date
Wat
er T
empe
ratu
re (D
egre
es C
)
Newbold Temperature Burlington Temperature Zone 2 Criteria
Comparison of Daily Min and Max Air Temperatures to 1961-1966 Range
40
50
60
70
80
90
100
110
210 215 220 225 230 235 240 245 250
Day of Year
Air
Tem
pera
ture
(Deg
rees
F)
1961-1966 Range August 2005 Max August 2005 Min
• If surface water temperature is influenced by meteorological forces and thermal loads, what is the influence of each?
• Currently, don’t know.

2010 2010 BioassessmentBioassessment
• Interim Methodology using a 6-metric IBI
• 75.6 score threshold (10th percentile reference)
• 30% failure rate for “not-supporting”
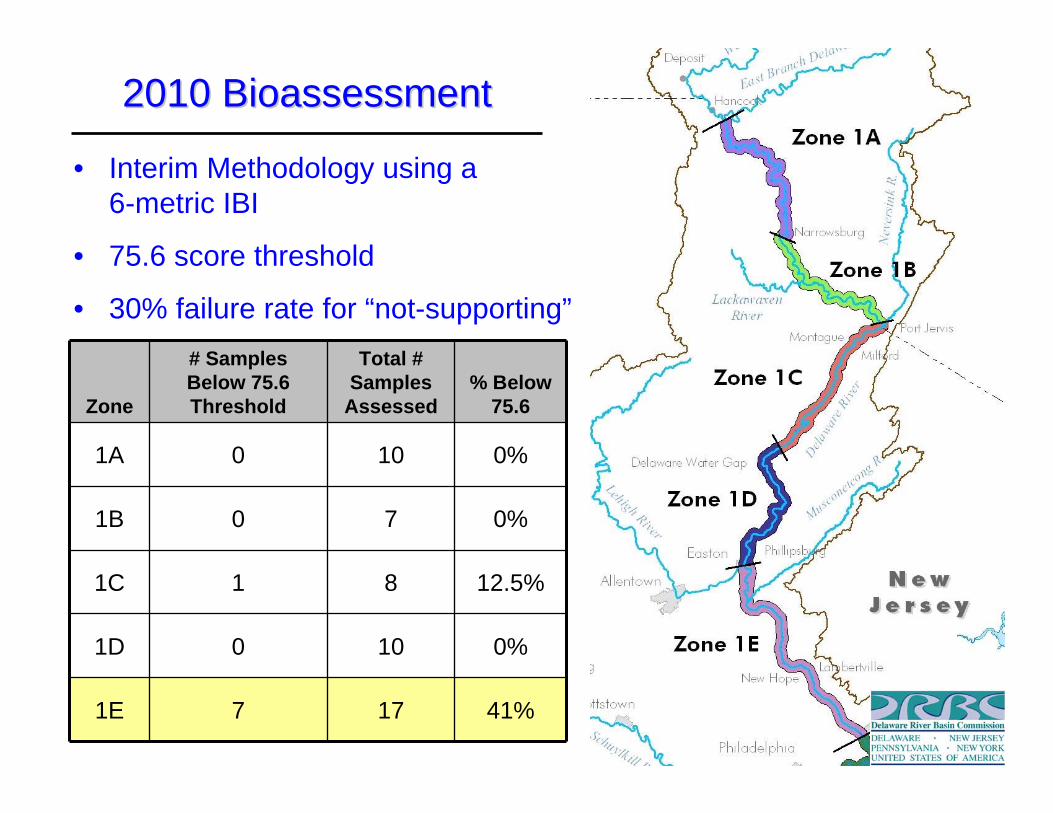
2010 2010 BioassessmentBioassessment
• Interim Methodology using a 6-metric IBI
• 75.6 score threshold
• 30% failure rate for “not-supporting”
Zone
# Samples Below 75.6 Threshold
Total # Samples
Assessed% Below
75.6
1A 0 10 0%
1B 0 7 0%
1C 1 8 12.5%
1D 0 10 0%
1E 7 17 41%

Some Assessment Uncertainties
• “Ambient” and “natural” temperature not defined for Zones 1A-1E;
• Flagged “D” means exceeded EPA’s currently required threshold of 1 violation and 1 confirmation, but is below the previously utilized threshold of 10%;
• TDS criteria in Zone 4 expressed only as not to exceed 133% of background for Zones 4, but background is not defined;
• Toxics NS for Zones 1’s and 6 tentative. Compared to EPA recommended toxics criteria in absence of DRBC numerical criteria;
• Assessment against copper criteria in Zone 5 was inconclusive. More on this…

Copper Aquatic Life Assessment
0123456789
101112131415
48 58 68 78
River Mile
ug/L
Total Copper
Zone 5 Monitoring Data 2007 to 2009
Marine CMC 5.3
Marine CCC 3.4
FW CCC 9.14
FW CMC 13.35
One exceedance at 5.6. Other samples do not meet DRBC and DNREC salinity guideline of >5 ppt for marine waters. May exceed NJ or EPA criteria.
One exceedance at 10.5
Sources of Uncertainty in copper aquatic life assessment
• Sampling and analytical methodology;– Clean metals;
• Application of freshwater versus marine criteria;– For freshwater, regulation specified versus
paired hardness values;• Need to assess revisions to criteria;

Drinking Water Assessment Results
AU TDS Hardness Chlorides Odor Phenols Sodium (Na)
Turbidity Systemic Toxicants
Carcinogens Drinking Water
Closures
2010 Assessment
2008 Assessment
1A + NA NA ID ID NA + + + + S S 1B + NA NA ID ID NA + + + + S S 1C + NA NA ID ID NA + + - + S S 1D + NA NA ID ID NA + + + + S S 1E + NA NA ID ID NA ID + - + S S 2 + + + ID ID NA + + + + S S 3 + + + ID ID + + + + + S S
Exceedances of EPA recommended human health criteria for arsenic only, in absence of DRBC numerical criteria

Zone 1 Arseniccompared to HH criteria
0
2
4
6
8
10
12
133 143 153 163 173 183 193 203 213 223 233 243 253
River Mile
Ars
enic
(ug/
L)
NJDEP Unfiltered NJDEP Filtered USGS-NJL unfilteredUSGS-WRD Filtered USGS-WRD Unfiltered EPA Recommended HHNJ HH and DRBC proposed HH PA HH
Zone 1CZone 1DZone 1E
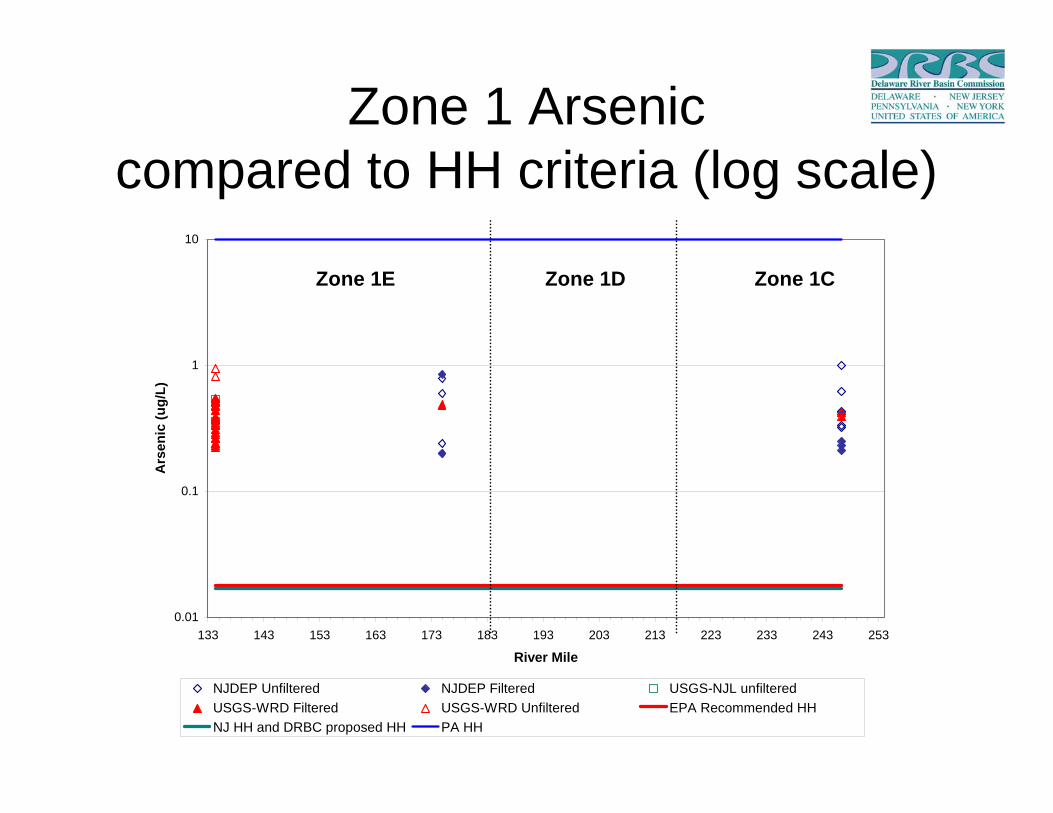
Zone 1 Arseniccompared to HH criteria (log scale)
0.01
0.1
1
10
133 143 153 163 173 183 193 203 213 223 233 243 253
River Mile
Ars
enic
(ug/
L)
NJDEP Unfiltered NJDEP Filtered USGS-NJL unfilteredUSGS-WRD Filtered USGS-WRD Unfiltered EPA Recommended HHNJ HH and DRBC proposed HH PA HH
Zone 1CZone 1DZone 1E
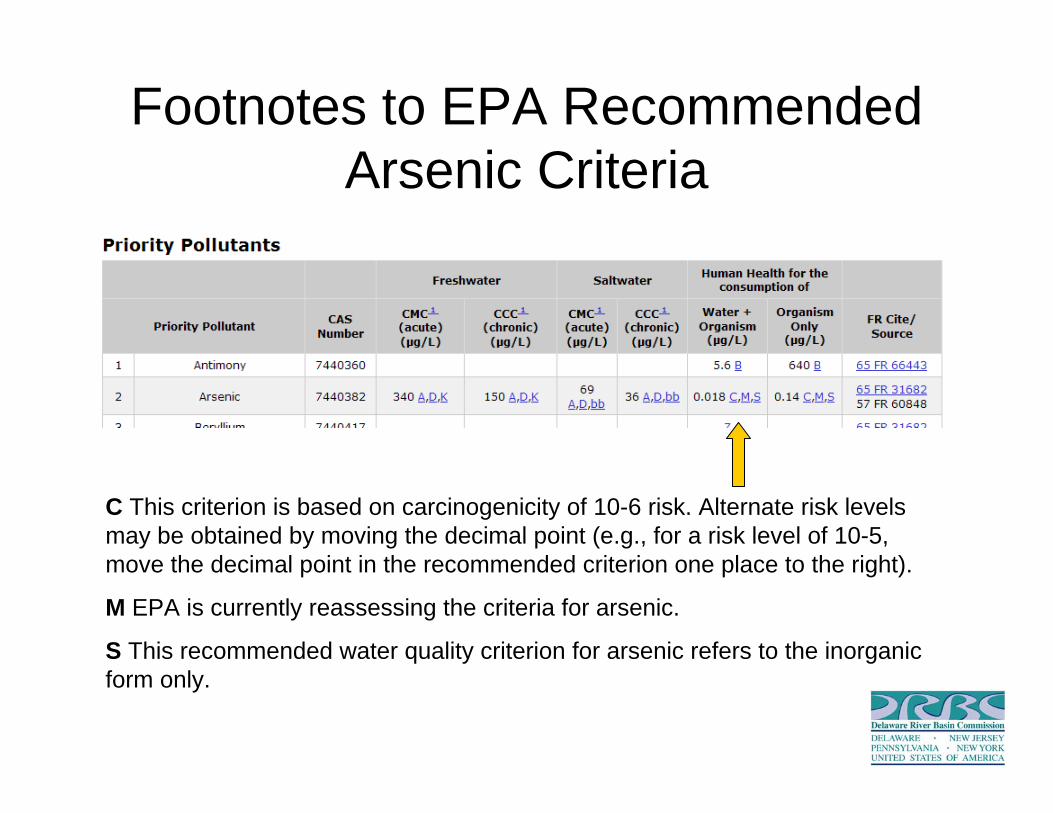
Footnotes to EPA Recommended Arsenic Criteria
C This criterion is based on carcinogenicity of 10-6 risk. Alternate risk levels may be obtained by moving the decimal point (e.g., for a risk level of 10-5, move the decimal point in the recommended criterion one place to the right).
M EPA is currently reassessing the criteria for arsenic.
S This recommended water quality criterion for arsenic refers to the inorganic form only.

Contact Recreation AssessmentFecal Coliform Enterococcus
AUA Primary Secondary Primary Secondary 2010
Assessment 2008
Assessment 1A + + NA NA S S 1B + + NA NA S S 1C + + NA NA S S 1D + + NA NA S S 1E + + NA NA S S 2 + + + + S S 3 NA + NA + S S 4 NA/ID +/ID NA/ID +/ID ID/S ID/S 5 + + + + S S 6 + + + + S S
In Zone 4, Primary recreation below RM 81.8; Secondary recreation above RM 81.8

Fish Consumption Assessment
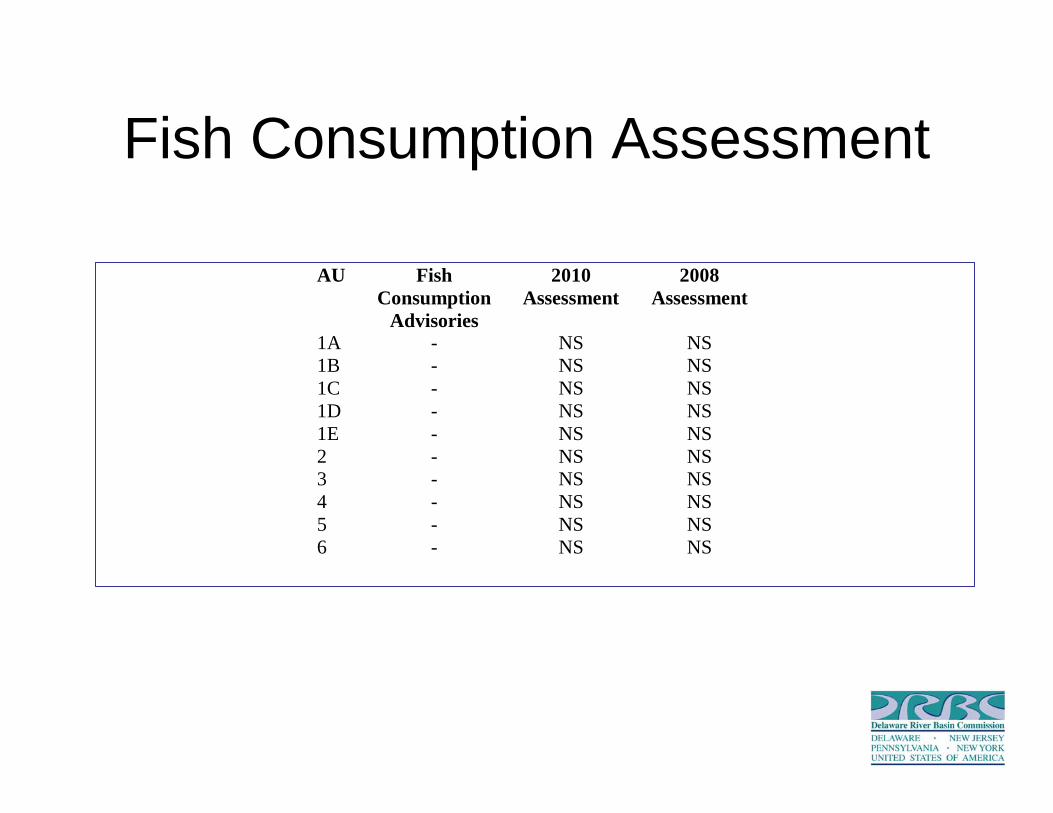
Fish Consumption Assessment
AU Fish Consumption
Advisories
2010 Assessment
2008 Assessment
1A - NS NS 1B - NS NS 1C - NS NS 1D - NS NS 1E - NS NS 2 - NS NS 3 - NS NS 4 - NS NS 5 - NS NS 6 - NS NS
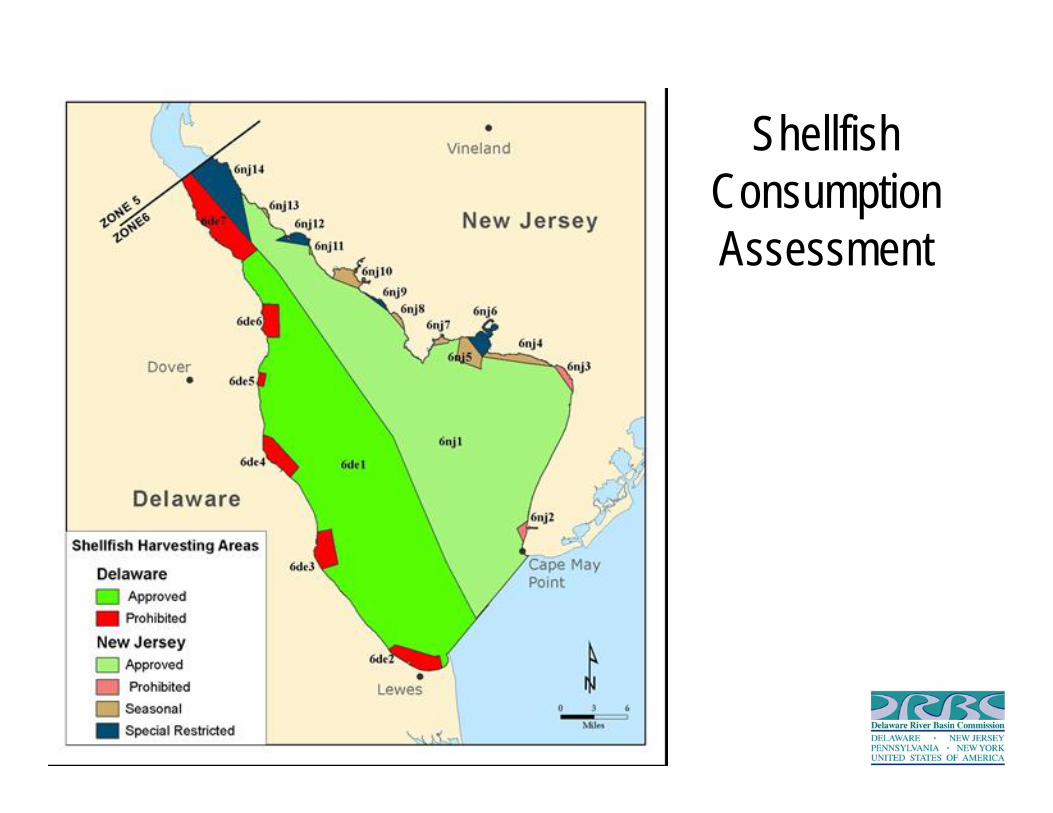
Shellfish Consumption Assessment
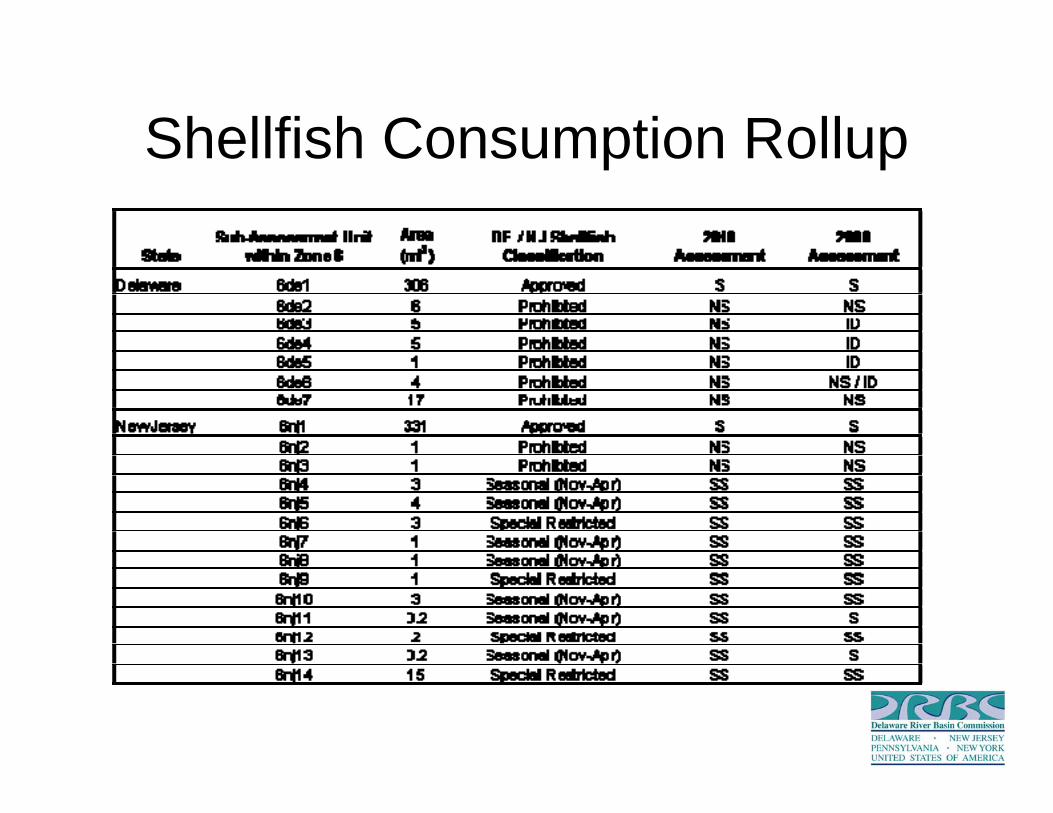
Shellfish Consumption Rollup
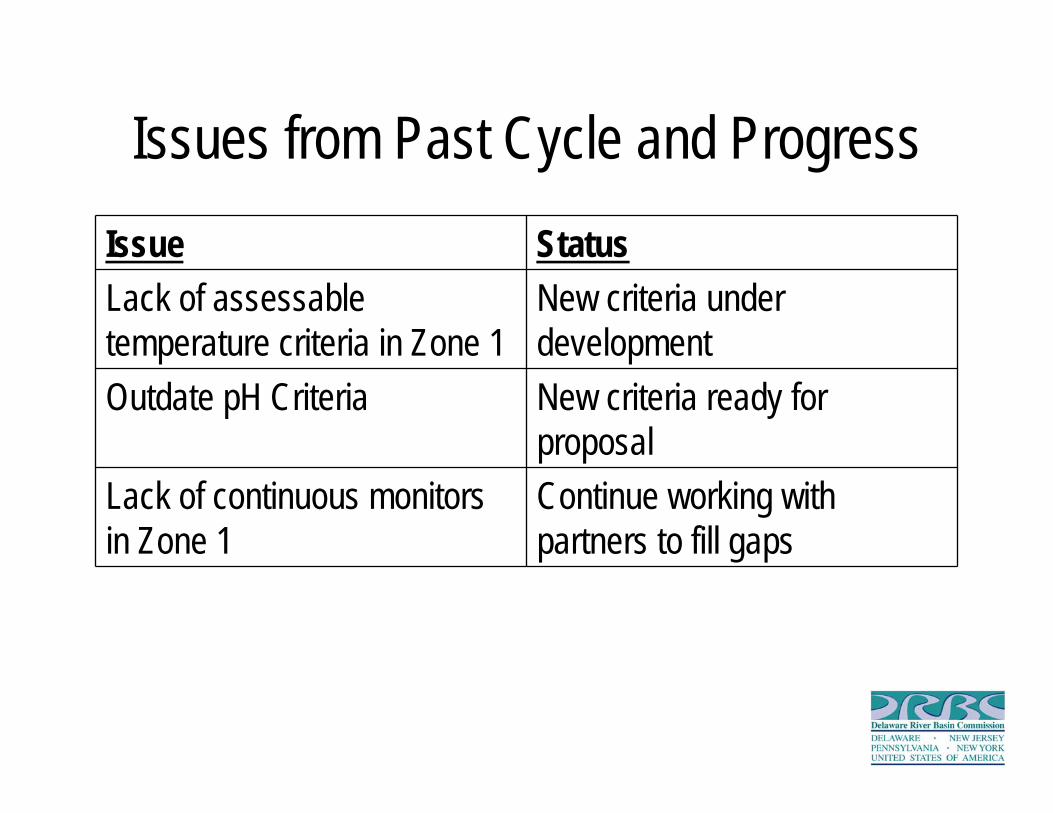
Issues from Past Cycle and ProgressIssue StatusLack of assessable temperature criteria in Zone 1
New criteria under development
Outdate pH Criteria New criteria ready for proposal
Lack of continuous monitors in Zone 1
Continue working with partners to fill gaps
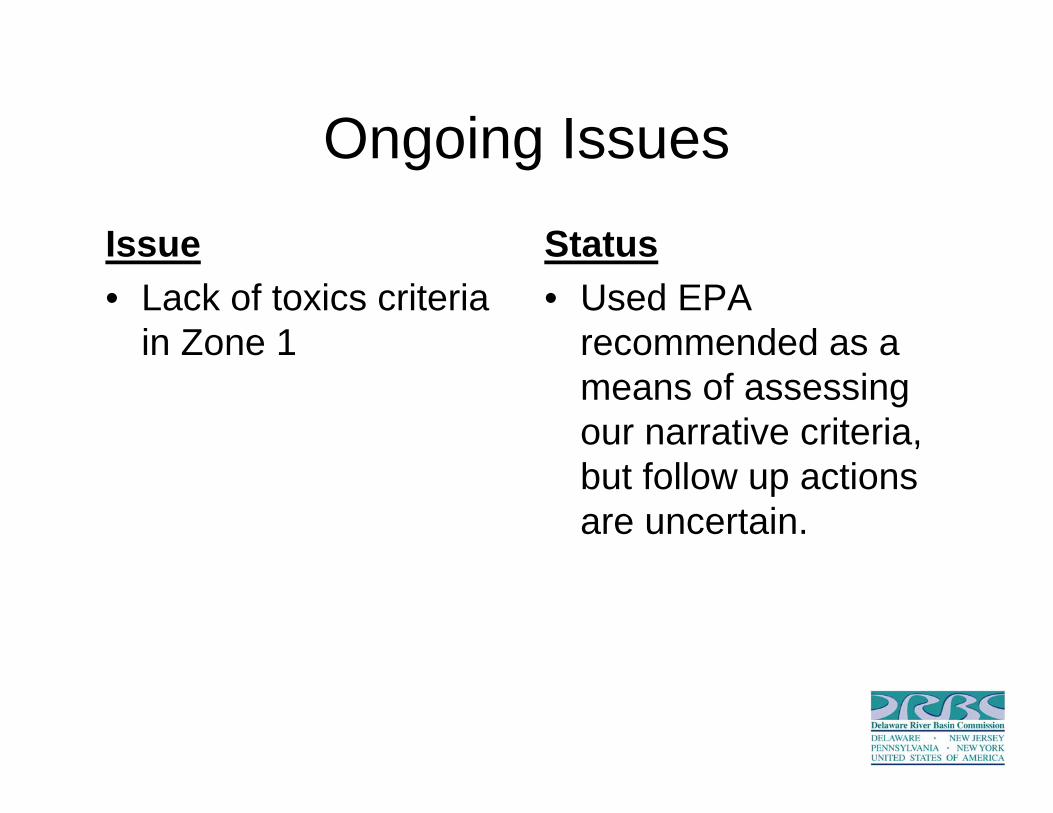
Ongoing Issues
Issue• Lack of toxics criteria
in Zone 1
Status• Used EPA
recommended as a means of assessing our narrative criteria, but follow up actions are uncertain.
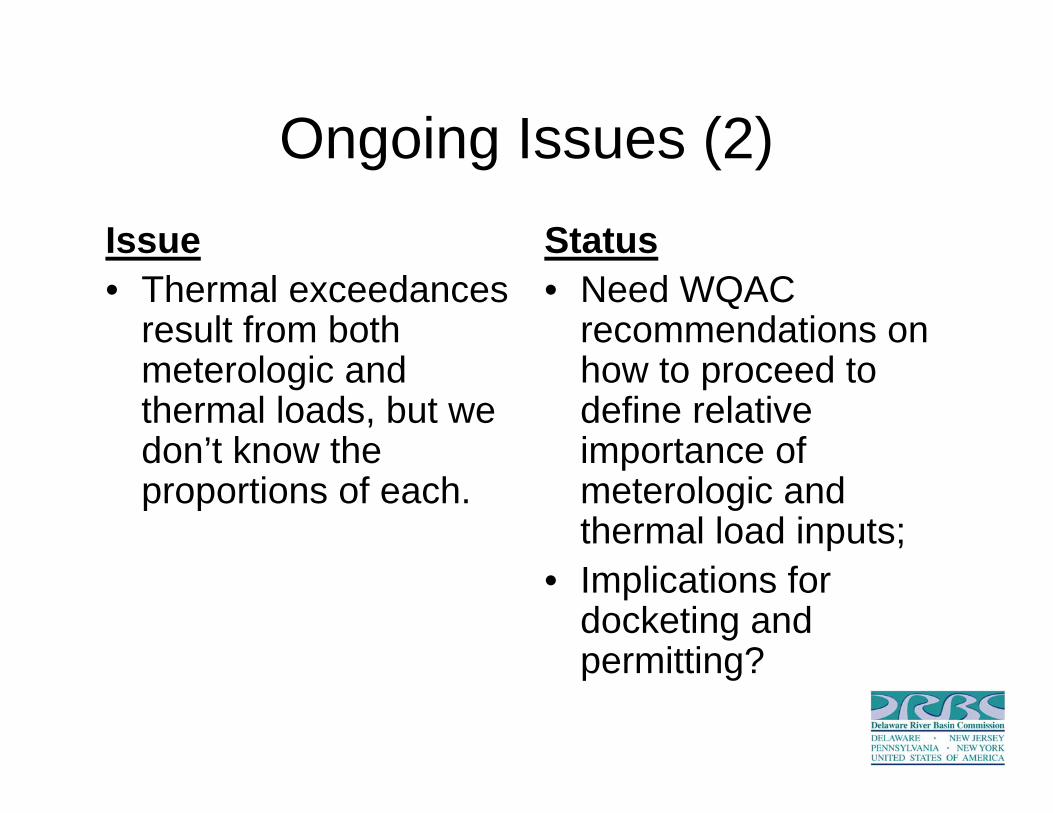
Ongoing Issues (2)Issue• Thermal exceedances
result from both meterologic and thermal loads, but we don’t know the proportions of each.
Status• Need WQAC
recommendations on how to proceed to define relative importance of meterologic and thermal load inputs;
• Implications for docketing and permitting?

Ongoing Issues (3)
Issue• Continued concern
over appropriate hardness and salinity values for toxics criteria
• Copper values continue to skirt DRBC criteria
Status• Special assessment
of copper using modified field protocols consistent with states’ clean metals protocols;
• Updated field protocols next sampling season.
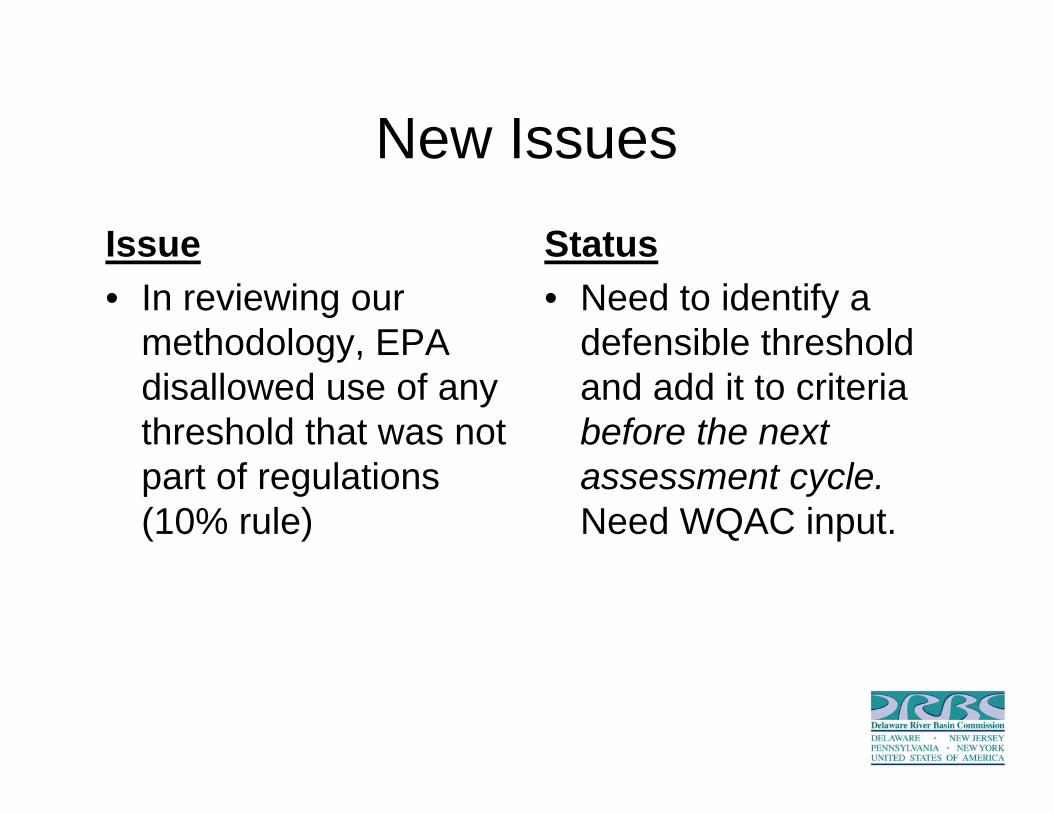
New Issues
Issue• In reviewing our
methodology, EPA disallowed use of any threshold that was not part of regulations (10% rule)
Status• Need to identify a
defensible threshold and add it to criteria before the next assessment cycle. Need WQAC input.

New Issues (2)
Issue• DRBC doesn’t add
waters to the 303d list. Calling our product an “Integrated List” is confusing
Status• Next cycle, document
will be clearly identified as a 305(b) Report

Results of the 2010 Delaware River and Bay Integrated List
Water Quality Assessment
NJWMCSeptember 21, 2011John Yagecic, P.E.Erik Silldorff, Ph.D.
Questions?