results of the 2021 greater hollywood volunteer homeless count
TRANSCRIPT
Results of the 2021 Greater Hollywood Volunteer Homeless Count
Louis Abramson1,2,3,†, Brian Kohan4, Jackie Vorhauer1,5, Douglas Walker1,5, Heather Carmichael1,6,Helen Eigenberg1,7, Stephen Fiechter1,8, David Gordon1, Emily Uyeda Kantrim1,9, Arnali Ray1,9, Elyse
Schwartz5, Sandy Andres10, Nick Semensky10, and Kerry Morrison1
1Hollywood 4WRD Homelessness Coalition, 6255 Sunset Blvd, Ste 150, Los Angeles, CA 900282Central Hollywood Neighborhood Council, PO Box 93907, Los Angeles, CA 90093
3Carnegie Observatories, 813 Santa Barbara St, Pasadena, CA 911014SELAH Neighborhood Homelessness Coalition, 2658 Griffith Park Blvd, Unit 194, Los Angeles, CA 90039
5The Center in Hollywood, 6636 Selma Ave, Los Angeles, CA 900286My Friend’s Place, 5850 Hollywood Blvd, Los Angeles, CA 90028
7Hang Out Do Good, 153 S Norton Ave, Los Angeles, CA 900048People Assisting The Homeless, 340 N Madison Ave, Los Angeles, CA 90004
9Mid City West Community Council, 644 N Fuller Ave, PMB 7059, Los Angeles, CA 9003610Covenant House, 1325 N Western Ave, Los Angeles, CA 90027
†Corresponding author; [email protected]
April 13, 2021
Abstract
Data from February 25, 2021 censuses of Hollywoodand East Hollywood show that adult unsheltered home-lessness has fallen by 10%± 9% and 15%± 12%, re-spectively, in those communities compared to the 2020LAHSA Count (90% CI). A 30% drop in individualsseen on the street drives this change, reducing the num-ber of identified persons and dwellings in about a thirdof census tracts. The adult unsheltered population isthus likely to have declined even if average dwellingoccupancies are updated. Nevertheless, 28% of tractssaw at least a doubling of tents and makeshift structures.This enhanced visual salience—combined with COVID-related sanitation and social service disruptions—wouldsupport perceptions that conditions worsened over thepast year despite the potential success of initiatives tobring and keep Angelenos indoors. Coordinated EntrySystem data will reveal whether homelessness has de-clined in general, or merely Greater Hollywood’s un-sheltered portion.
1 Context
The Los Angeles Homelessness Services Authority(LAHSA) conducts an annual Point In Time (PIT)
census of Los Angeles County’s unhoused population.These data inform programmatic funding levels, educateresidents, undergird legislation, and shape the practicesof professional and volunteer service providers.
As the official assessment of the scope of one of ourmost pressing humanitarian issues, the LAHSA Countis invaluable. Due to disruptions from COVID-19, how-ever, the unsheltered portion of the 2021 count was can-celled. Since 70% of unhoused residents of the City ofLA (“LA”) were unsheltered in 2020, without additionalefforts, this cancellation will substantially erode ourunderstanding of homelessness following an unprece-dented year of economic disruption and governmentintervention—both of which may have significantly af-fected the number of unhoused Angelenos.
Greater Hollywood is an epicenter of the homeless-ness crisis. According to the 2020 Count, the Holly-wood and East Hollywood Communities were home to2203 unhoused residents, 1714 of whom (78%) wereunsheltered. This figure corresponds to roughly 5% ofLA’s homeless population in an area with 3.5% of itstotal population.1 In some places, 1-in-25 Hollywoodresidents are unhoused compared to 1-in-100 citywide.
While the above statistics are tragic, Hollywood is
1 https://geomap.ffiec.gov/FFIECGeocMap/GeocodeMap1.aspx;assumes 4M total Angelenos.
1
also home to large and increasingly robust coalitions ofservice providers, business leaders, residents, and gov-ernmental entities dedicated to humanely housing ev-eryone in their community. Given the capacity of theabove organizations and the importance of the annualPIT count in educating residents, funders, and legisla-tors, Hollywood proceeded as a collective to conduct agrassroots PIT count on Thursday, February 25, 2021.
This document details the methodology and findingsof that count. Section 2 describes the volunteer train-ing, data acquisition, and analysis protocols. Section3 presents estimates of the unsheltered populations inHollywood and East Hollywood, contextualizes them interms of the 2020 LAHSA PIT results and those com-munities’ total populations, and presents cross-checks.Section 4 provides interpretation and highlights areaswhere quantitive findings may drive qualitative impres-sions as to the “felt” state of the crisis. Section 5 sum-marizes. The Appendix provides additional informa-tion, including tract-level tallies and population infer-ences. All data are available at https://hollywood4wrd.live/2021-homeless-count.
2 Methods
2.1 Data Acquisition
The count was based out of The Center in Hollywood(“The Center”), a major service provider in Hollywood.All volunteers reported and returned to this location asthey would a LAHSA community hub in the past.2 Un-like previous PIT counts, however, training was per-formed offsite, volunteers never left their vehicles, andall surveying occurred before 10:00 PM.
The count covered the 40 US Census tracts con-stituting the LAHSA-defined Hollywood and EastHollywood Communities (22 and 18 tracts, respec-tively). It did not recognize census tract “splits”—e.g.,“1905.10a”—which modified of the definition of Hol-lywood to include all of tract 1905.10 and East Holly-wood to include all of tract 1913.01. Since 2016, split1905.10b has never hosted more than 7 unsheltered peo-ple; 1913.01a never more than 15. As such, these modi-fications do not significantly affect community-level re-sults. Figure 1 shows the count footprint.
All tracts were vetted by outreach professionals fromThe Center prior to assignment. Tracts deemed espe-cially challenging—e.g., due to their proximity to free-
2Except for those counting tract 1919.02; see Section 2.1.1.
way onramps/peripheries—were reserved for profes-sional counting teams. Vetting produced 9 such tracts,which were surveyed by personnel from The Center andCovenant House circa 3:00 PM on 25 Feb. All but one ofthe remaining tracts were surveyed by volunteer vehicle-based teams and beginning at 7:00 PM. The final volun-teer tract was surveyed on 16 March (Section 2.1.1).
With the exception of one tract in East Hollywood,teams were restricted to one or the other community,making the community-level results nearly independent.Cross-comparisons therefore serve as data quality indi-cators (Section 3.5). Table 1 records which tracts weresurveyed by which kind of team.
Thirty-two volunteer teams participated in the count,which was limited to existing “pods” of two to three peo-ple to minimize the possibility of COVID transmission.All participants wore personal protective equipment andmaintained social distancing when appropriate.
Counting followed 2020 LAHSA PIT protocols tothe greatest extent possible. Each volunteer team com-prised at least a driver and a counter and was assignedtwo tracts. Three-person teams included a navigator, aswell. If present, the navigator directed the driver whilethe counter tallied individuals/dwellings. In two-personteams, the counter doubled as the navigator. Trainingemphasized techniques aimed at reducing counters’ cog-nitive loads to minimize errors (e.g., covering interiorstreets in a serpentine pattern before circling the tractborder). Teams were instructed to count both sides ofinterior streets but only interior sides of border streets asdescribed in the official 2020 PIT training materials.
All teams were deployed by roughly 7:30 PM and re-turned by 9:55 PM.
Upon arriving at The Center, organizers gave eachteam a clipboard containing two tract maps, two tallysheets, and a 1-page training summary with a contactnumber for field issues.
The tally sheets were the data acquisition tool. Thesecontained separate columns for each of the nine cate-gories of unsheltered individuals/dwellings recognizedin the 2020 LAHSA PIT count:
1. adults (ages ≥25);2. transition age youths (“TAY,” 18–24);3. unaccompanied minors;4. families (at least one adult with at least one minor);5. cars;6. vans;7. RVs;8. tents;
2

East Hollywood
Hollywood
East Hollywood
Hollywood
Figure 1: The 2021 volunteer count covered the LAHSA-recognized Hollywood and East Hollywood Communities. Theformer spans Laurel Canyon at Hollywood to Western at Melrose. The latter spans Western at Hollywood to Hoover at Temple.Top: inferred 2021 unsheltered population (darker is higher). Bottom: inferred change from 2020 (red+, blue−). The tractswith the largest gain (1912.01) and loss (1927.00) are highlighted in both panels. Explore more at https://h4wrd.demoply.org.
9. makeshift structures.
Dwellings—items (5) to (9)—are treated specially in theanalysis and hereafter may be referred to as “CVRTM.”Adults+TAY may also be combined into “Persons” (P).3
3NB: LAHSA counts unhoused TAY via a dedicated census. OurPIT teams identified such individuals, but their tally does not reflectLAHSA’s methodology. As such, all data in this document betterreflect the adult unsheltered population as compared to that samequantity in 2020. Since only 6 TAY were sighted, combining themwith adults changes no results. We occasionally treat TAY as a stan-dalone class for analytic purposes (Section 2.2.2).
No families or unaccompanied minors were identified.4
See Appendix for examples of the above documents.Upon returning, counters verbally read their results to
organizers who entered them into a Google Form. Orga-nizers verbally confirmed the counts before submitting
4 One potential unaccompanied minor was reported in tract1912.01 but could not be confirmed by outreach personnel dis-patched to that location. One potential family was also reporteddwelling in a van in tract 1899.05 but could also not be confirmed.These categories’ upper limits capture this uncertainty (3 each at95% confidence), but their raw counts are set to zero.
3

the form and recovering the paper tally sheets.Once all materials were collected, organizers cross-
checked the electronic records—a Google Sheet gener-ated by the form responses—with the paper tallies andidentified any uncounted areas. None requiring follow-up were found. Disagreements between electronic andpaper references were corrected to the paper tally.
Given turnout, every volunteer tract was assigned toat least two teams. Four tracts were counted in triplicate.Beyond increasing the count’s accuracy, repeat mea-surements enhance our understanding of errors (Sec-tions 2.3) and provide robustness: one tally was uninter-pretable, leaving only the result from the second team.
All told, the data comprise 38 pair-wise volunteermeasurements, one unique volunteer measurement, andnine unique professional assessments. The latter ac-count for ∼20% of tracts in both communities androughly 40% of identified individuals and dwellings.Year-on-year trends are consistent between volunteer-and professional-counted tracts (Section 3.5).
2.1.1 Tract 1919.02
Tract 1919.02 escaped assignment on the night of thecount. This omission was recognized 15 March and thearea independently surveyed by experienced volunteersat 6:00 AM (Abramson) and 8:15 PM (Eigenberg) thenext day. Despite the 19-day delay, we include thesedata to conform the 2021 PIT results to LAHSA-definedgeographies. While SELAH tract monitoring suggestscounts are stable on ∼month timescales, no conclusionschange if this tract is excluded.
2.1.2 Volunteer Training
Teams underwent mandatory, ∼30 minute Zoom-basedtraining sessions before arriving for the count. Eachparticipant was also required to watch the official 2020LAHSA PIT training video.
The training covered the motivation for the count, anoverview of the survey geography, team roles, and ex-amples of unhoused dwellings. Except for people stand-ing next to tents—as described in the 2020 LAHSAvideo—volunteers were instructed to count CVRTMand individuals separately and not to estimate how manypeople might live in or be associated with a specificdwelling. This ensured that results could be analyzed asa function of the CVRTM weights, which may changewith future information.
Table 1: 2021 Greater Hollywood PIT Count Summary
Tract Community Countera Passesb Median Est. 90% CI[people] [people]
1898.00 Hollywood Vol 3 7 0–151899.02 Hollywood Vol 3 19 12–241899.03 Hollywood Vol 2 0 0–121899.04 Hollywood Vol 2 18 11–251899.05 Hollywood Vol 2 20 10–301901.00 Hollywood Vol 2 89 75–1021902.01 Hollywood Vol 2 21 13–291902.02 Hollywood Vol 2 30 20–401903.01 Hollywood Pro 1 75 54–981905.10 Hollywood Pro 1 34 22–461905.20 E. Hollywood Vol 2 13 6–181907.00 Hollywood Vol 2 110 93–1271908.01 Hollywood Vol 2 63 50–761908.02 Hollywood Pro 1 72 54–901909.01 Hollywood Pro 1 55 39–711909.02 Hollywood Vol 3 7 0–181910.00 Hollywood Pro 1 169 140–2001911.10 E. Hollywood Vol 2 9 2–151911.20 E. Hollywood Pro 1 66 48–841912.01 E. Hollywood Vol 2 56 44–681912.03 E. Hollywood Vol 2 27 14–391912.04 E. Hollywood Vol 2 6 0–161913.01 E. Hollywood Vol 2 32 22–411913.02 E. Hollywood Vol 2 23 15–311914.10 E. Hollywood Vol 2 21 13–281914.20 E. Hollywood Vol 2 24 16–321915.00 E. Hollywood Vol 2 29 21–381916.10 E. Hollywood Pro 1 49 32–681916.20 E. Hollywood Pro 1 18 6–301917.10 Hollywood Vol 2 21 14–291917.20 Hollywood Vol 3 22 12–311918.10 Hollywood Vol 2 24 14–341918.20 Hollywood Vol 2 16 10–231919.01 Hollywood Vol 2 61 49–731919.02 Hollywood Vol 2 20 12–271925.10 E. Hollywood Vol 2 13 4–211925.20 E. Hollywood Vol 1 14 1–281926.10 E. Hollywood Vol 2 8 1–141926.20 E. Hollywood Vol 2 18 9–261927.00 E. Hollywood Pro 1 129 96–167
All 74 1513 1358–1679aVolunteer vs. professional surveyor; bno. counting teams; c
surveyed 16 March; done tally rejected during quality control.
The training primed volunteers only with min/maxestimates of tract-level individual+dwelling counts (“0–120”) and the likelihood of encountering unaccompa-nied minors or families (“very unlikely”) or TAY (“sometracts, especially in Hollywood”). These statementswere informed by the 2020 LAHSA PIT results. Noother prior was established. The training presentationis available here.
2.2 Data Analysis
The data form a 9× 75 array containing each team’stract-level tallies for each unhoused individual/dwelling
4

class. The population inference entails averaging du-plicate tract counts and weighting CVRTM by theirmean occupancies. We produce 10,000 realizations ofthis inference incorporating random perturbations of thecounts and weights based on their errors (see below).The final product is a 9× 10000× 40 array that maybe split and summed to provide aggregate, tract, orcategory-level population estimates and uncertainties.
Our baseline result assumes the 2020 SPA4/CD13CVRTM weights underpinning the 2020 LAHSA Com-munity Summaries. We recognize that these weightsmay have changed since they were last defined and en-courage robust efforts to reassess them. However, atleast one survey of tent-dwellers in Hollywood suggeststhat the tent weight has remained stable. Section 3.3 re-views the impact of adopting the other CVRTM choicesin Table 2; none significantly affects our findings.
2.2.1 Monte Carlo Population Inferences
We wish to infer the true unsheltered population in Hol-lywood and East Hollywood as of 25 February. We doso by constructing probability density functions (PDFs)describing the likelihood of encountering a given num-ber of unsheltered people in those communities as con-strained by our PIT data. To accomplish this, we modelthree known uncertainties: (1) errors in the visual tal-lies, (2) deviations of the CVRTM weights from theirquoted means, and (3) the intrinsic background rate ofpersons/dwellings in areas where none were actuallysighted. Items (1) and (3) reflect how our PIT tallymight change if performed at a different time or by dif-ferent teams. Item (2) reflects how the mean occupancyof CVRTM in our survey area might differ from that inthe geography in which the weights were defined.
We model count and weight errors as independentrandom draws from Gaussian distributions with stan-dard deviations of
√n and σ , respectively, where n is
the raw PIT tally and σ is the standard error on the re-spective CVRTM weight, w. The i-th estimate of thetrue number, N, of people in the j-th unsheltered classin any tract is then:
Ni, j =[n j +Gi(0,
√n j)]× max[Gi(w j,σ j),1], (1)
where G (µ,Σ) is a Gaussian random number with meanµ and standard deviation Σ. If more than one teamcounted a tract, n is replaced by the average of their tal-lies and the attendant counting error is divided by thesquare root of the number of teams. If no membersof the j-th unsheltered category were observed, √n j is
Figure 2: Intercounter result comparisons. Top: mean tract-level differences (large blue points; 10-pair bins) are 1.4×the Poisson expectation (dot-dashes;
√〈ν〉); 1.3× excluding
outlier tract 1901.00 (large green point). Small points showpairwise differences. Bottom: mean category-level disper-sions are consistent with random errors except for RVs, whichare identified significantly more consistently. Only means areshown at bottom to reduce clutter.
replaced in the first term by that category’s estimatedbackground rate, σ
bkgj , discussed in the next section.
The final output PDFs reflect 10,000 realizations ofEquation 1. Weights for adults and TAY are fixed tounity—(w,σ) ≡ (1,0)—such that uncertainties reflectonly counting errors.
We place a floor on the CVRTM mean occupanciesat 1 person per dwelling; i.e., we assume that the meanperson does not own more than one dwelling. This isnot to say no one may own more than one, just that sucha statement is never representative. This choice inducesa mild asymmetry in our global PDFs but does not sig-nificantly affect inferences.
5

Table 2: 2021 CVRTM Mean Occupancy Assumptions
wC wV wR wT wM
2020 SPA4/CD13 1.51±0.25 1.77±0.42 1.42±0.28 1.48±0.11 1.68±0.312021 wT
a – – – 1.39±0.14 –2021 wT non-resp modelb – – – 1.51±0.24 –2020 SPA4 1.38±0.11 1.68±0.22 1.32±0.15 1.45±0.06 1.64±0.16
The baseline scenario incorporating the is bolded. Dashes denote values identical to entries above them. aReflects occupancydata for 38 out of 47 tents surveyed in Hollywood. bAssumes 9 “non-responding” tents sheltered 0–4 occupants each.
2.2.2 Null Entries and Background Rates
Often, no persons or dwellings of a specific category areobserved in a given tract. Probabilistically, these dataare consistent with non-zero values for the true pop-ulation. The Monte Carlo PDF reconstruction allowsall such entries to fluctuate based on an assumed back-ground rate, σ
bkgj .
Ideally, σbkgj would derive from category variations in
similar tracts defined by independent criteria. Sufficientdata may exist to support that exercise, but it is beyondthe scope of this analysis. Instead, we adopt a noise floorbased on the counts expected if all members of a givencategory were distributed evenly across tracts:
σbkgj ≡
√140 ∑
tractsn j. (2)
While oversimplistic (Section 3.4), this methodworks for any category for which at least one in-dividual/dwelling was observed in any tract. How-ever, for categories for which this is not the case—unaccompanied minors and families, here—we set σ
bkgj
to the lowest non-zero value of the other categories (cor-responding to TAY). The adopted backgrounds are thus:
σbkgj = {3.1,0.4,0.4,0.9,1.3,1.2,2.8,2.5,0.4} (3)
adults, TAY, unaccompanied minors, cars, vans, RVs,tents, makeshifts, and families per tract.
Note that the above numbers are not added to nullentries, but random draws from normal distributions ofthat width. This treatment is somewhat arbitrary, but weemploy it symmetrically—per-tract category inferencescan be negative—so it does not bias the final estimate.Instead, it sets the upper limits of intrinsically rare cate-gories and inflates aggregate uncertainties.
2.3 Duplicate Counts
Each volunteer tract in both communities (31) were as-signed to at least two independent counting teams. Fourtracts additionally received a third pass. Pass 1 pairedtracts by tract number. Pass 2 paired projected high-population tracts with ones geographically nearby. Pass3 was the same as Pass 1 with pairings presented in re-verse order, such that teams deployed simultaneouslywould likely start in different tracts.
Results for one of the two teams assigned to tract1925.20 could not be interpreted, making it the only vol-unteer tract with one population estimate.
Figure 2 shows intercounter comparisons of rawcounts (people+dwellings) at the tract and category lev-els. Average offsets are close to Poisson expectations inall cases except for the highest occupancy tracts, wherethey are inflated by an outlier (see below). Explic-itly, 〈
√(ν1−ν2)2/(ν1 +ν2)〉 = 1.4, where ν is the to-
tal number of dwellings and people in a given tract re-turned by one of the teams. In the one instance where nopersons or dwellings of any kind were identified (tract1899.03), both teams agreed exactly.
The outlier is tract 1901.00, whose repeat mea-surements differ by 6.6σ . There, one team counted{P,C,V,R,T,M} = {23,1,1,1,6,2} while the othercounted {77,15,10,1,6,6}. Abramson re-counted thistract on-foot 14 hours after the PIT tally, obtaining{36,4,6,0,8,2}. In total, this tally (νAbr = 56± 7) iswithin 1.9σ of the volunteers’ mean (〈νPIT〉 = 75± 6).As such, we retain the volunteer PIT estimate as-is. Asillustrated in Figure 2, top, the mean intercounter disper-sion drops to 1.3σ if this tract is excluded.
In terms of categories, all dispersions are consistentwith Poisson expectations except for RVs, where agree-ment is significantly better. Given their salience, thisfinding is reassuring if unsurprising.
No team counted tracts in both Hollywood and EastHollywood. As such, the volunteer counts in those com-
6
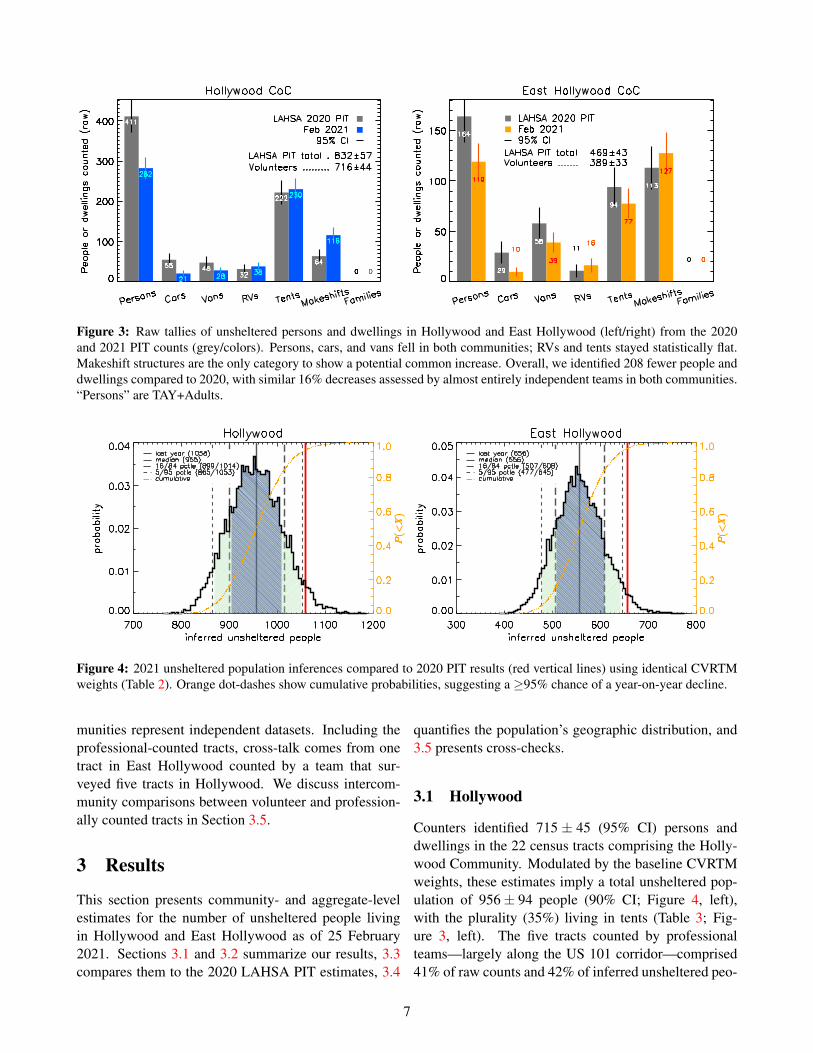
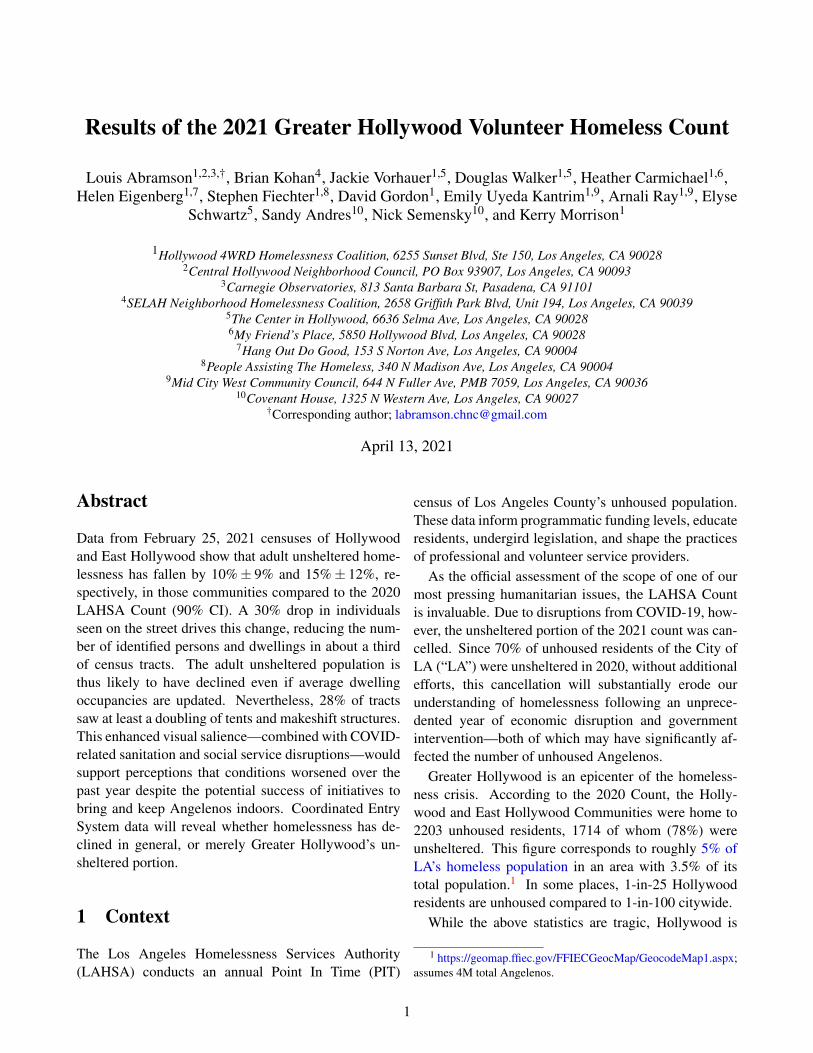
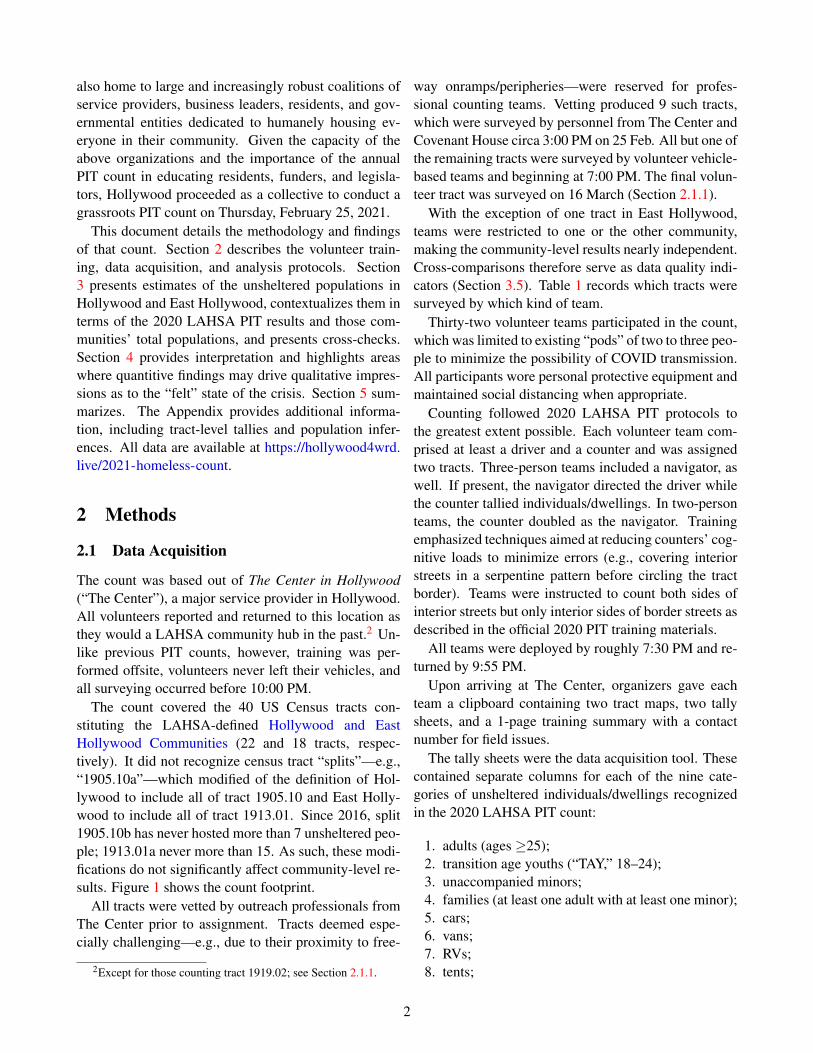
Figure 3: Raw tallies of unsheltered persons and dwellings in Hollywood and East Hollywood (left/right) from the 2020and 2021 PIT counts (grey/colors). Persons, cars, and vans fell in both communities; RVs and tents stayed statistically flat.Makeshift structures are the only category to show a potential common increase. Overall, we identified 208 fewer people anddwellings compared to 2020, with similar 16% decreases assessed by almost entirely independent teams in both communities.“Persons” are TAY+Adults.
Figure 4: 2021 unsheltered population inferences compared to 2020 PIT results (red vertical lines) using identical CVRTMweights (Table 2). Orange dot-dashes show cumulative probabilities, suggesting a ≥95% chance of a year-on-year decline.
munities represent independent datasets. Including theprofessional-counted tracts, cross-talk comes from onetract in East Hollywood counted by a team that sur-veyed five tracts in Hollywood. We discuss intercom-munity comparisons between volunteer and profession-ally counted tracts in Section 3.5.
3 Results
This section presents community- and aggregate-levelestimates for the number of unsheltered people livingin Hollywood and East Hollywood as of 25 February2021. Sections 3.1 and 3.2 summarize our results, 3.3compares them to the 2020 LAHSA PIT estimates, 3.4
quantifies the population’s geographic distribution, and3.5 presents cross-checks.
3.1 Hollywood
Counters identified 715 ± 45 (95% CI) persons anddwellings in the 22 census tracts comprising the Holly-wood Community. Modulated by the baseline CVRTMweights, these estimates imply a total unsheltered pop-ulation of 956± 94 people (90% CI; Figure 4, left),with the plurality (35%) living in tents (Table 3; Fig-ure 3, left). The five tracts counted by professionalteams—largely along the US 101 corridor—comprised41% of raw counts and 42% of inferred unsheltered peo-
7

Table 3: Greater Hollywood 2021 PIT Unsheltered Data and Population Estimates
Adult TAY Car Van RV Tent Makeshift 2021 Total 2020 Total Difference
HollywoodCounts 280 2 21 28 38 230 116 715 831 −14%Inhabitants 280 (28) 2 (3) 32 (11) 51 (14) 56 (14) 339 (29) 196 (24) 956 (94) 1058 −10%(9%)Category share 29% (3%) 0% (0%) 3% (1%) 5% (1%) 6% (1%) 35% (3%) 20% (3%) – – –
East HollywoodCounts 114 4 10 39 16 77 127 389 469 −17%Inhabitants 114 (19) 4 (4) 15 (8) 70 (15) 24 (9) 115 (19) 216 (23) 557 (83) 656 −15%(12%)Category share 20% (3%) 1% (1%) 3% (1%) 13% (3%) 4% (2%) 20% (3%) 39% (4%) – – –
Parentheses denote 90% uncertainties (binomial for categories). Uncertainties larger than estimates imply only upper limitsare available. Marginalized upper limits imply <3 unaccompanied minors and families in either community.
ple. Tract 1910.00 (pro-counted) had the most peopleand dwellings (123; 170 total population); 1899.03 hadthe fewest (0; <12 total population).
Modifying the CVRTM weights from the baselineSPA4/CD13 values to their SPA4-wide values lowersHollywood’s inferred total unsheltered population to933±68 people; applying an updated tent weight basedon a survey in Hollywood raises it to 964± 118 people(Section 3.3). Neither shift is significant.
3.2 East Hollywood
Counters identified 389 ± 33 (95% CI) persons anddwellings in the 18 census tracts comprising East Hol-lywood. Modulated by the baseline CVRTM weights,these estimates imply a total unsheltered population of556± 83 people (Figure 4, right), with the plurality(39%) living in makeshift structures (Table 3, Figure 3,right). The four tracts counted by professional teamscomprised 46% of those counts and 47% of inferred un-sheltered people. Tract 1927.00 (pro-counted) had themost people and dwellings (87; 129 total population);1912.04 had the fewest (5; <16 total population).
Modifying the CVRTM weights from the baselineSPA4/CD13 values to the SPA4-wide values lowers EastHollywood’s inferred total unsheltered population to539±59 people; applying the updated tent weight raisesit to 559±87 people. Neither shift is significant.
3.3 Comparison to 2020
The official LAHSA estimates from the 2020 PIT countare overplotted in Figure 4 as red vertical lines in eachpanel: 1058 unsheltered people in Hollywood, 656 inEast Hollywood. Our baseline inferences suggest a>95% probability that the current population has fallenfrom those levels. Using the PDFs’ medians and 90%
CIs, we infer declines of 10%± 9% and 15%± 12%,respectively.
Figure 5 shows the tract-level changes in counts andinferred populations as geographically illustrated in Fig-ure 1. We find significant gains in 7 tracts and significantdeclines in 14, resulting in net changes of −199± 45and −218± 71 counts or people, respectively.5 Tract1912.01 saw the largest year-on-year gain (BarnsdallPark; +40 people), tract 1927.00 the largest loss (US101;−125 people). Both are located in East Hollywood.
Tract 1927.00 is unique (Section 4). Its precipitousdecline since 2020 can account for all of East Holly-wood’s total unsheltered population change. It is alsothe only tract assessed by a team that worked in bothcommunities. If it is excluded, we infer 427± 61 un-sheltered people in E. Hollywood vs. 407 in 2020. Per-son/dwelling trends remain similar to those in Holly-wood regardless of whether 1927.00 is examined, how-ever (Figure 6).
Given the deficit in raw counts, it seems unlikelythat reasonable modifications to the CVRTM weightswill qualitatively affect our inferences. Nevertheless,due to the high proportion of people living in tents andmakeshift structures, wT and wM are the largest potentialerror sources.
To constrain their evolution from last year, SELAHoutreach teams surveyed 47 tents (38 responses) in Hol-lywood on 28 Feb. This exercise yielded a mean oc-cupancy of wT = 1.39± 0.14 people per tent, or wT =1.50± 0.22 if non-responses are assumed to have any-where from 0 to 4 occupants, each. While neitherthe full 2021 PIT area nor wM has been assessed, theabove values are consistent with the 2020 estimate ofwT = 1.48± 0.11. Neither adopting the updated wT
5Tract-level CVRTM counts inferred from LAHSA’s data portal.We verified that they sum to the correct community totals.
8

Figure 5: Compared to 2020, the 2021 PIT count identified 7 tracts with significantly more persons/dwellings, 14 with fewer(purple). The same holds for total unsheltered population (orange; parentheses denote 1 σ -significant changes). Circles denoteprofessional-counted tracts (1 increase; 3 declines). Net, we identified about 200 fewer persons+structures or unshelteredpeople. Tract 1927.00 saw the biggest decline (over 120 people; Section 4), and may drive all of East Hollywood’s inferredchange from 2020.
value nor replacing all weights with the last SPA4-widevalues leads to less than a 89% chance of a decline inunsheltered populations compared to 2020.
We encourage robust efforts to update the CVRTMweights, but the changes required to null the declinewe find are substantial. Only wT and wM can reason-ably achieve it. These must rise to 2.1 and 2.5 peo-ple from 1.5 and 1.7 people, respectively, in 2020. Notwithstanding the above survey, such ∼45% increases inmean occupancies seem unlikely. While 2021 is un-precedented in many ways, no SPA4/CD13 CVRTMweight has changed by more than ∼30% year-on-yearsince 2018.6
Largely, our results reflect the fact that persons seenon the street fell by ∼30% (Figure 3). Cars and vans arealso down from last year by more than the number ofsafe parking spaces (Section 3.5). Only makeshift struc-tures show a potential common gain. All told, however,the total number of dwellings remained roughly flat. Al-though uncertainties in East Hollywood and effects fromtract 1927.00 are large, Figure 6 reveals this trend to becommon across communities and areas counted by vol-
6wR fell from ∼2 to ∼1.4 between 2019 and 2020.
unteers or professionals. Such consistencies in nearlyindependent datasets suggest the results are robust.
3.4 Geographic Concentration
Everyday experience (and Figure 1) confirms that un-sheltered homelessness is unevenly distributed. Thisstatement is worth quantifying so that arguments over,e.g., the placement of new housing facilities may begrounded in data. Figure 7 is one attempt to do so.
Combining our PIT count with 2020 US Census data,we compare the distribution of unsheltered Angelenosvs. all Angelenos in Greater Hollywood. The top panelshows the proportion of people in a given tract that areunsheltered. This fraction spans 0% to over 4%, with amean near 1%—1.4× higher than LA’s global unshel-tered fraction in Jan. 2020 (assuming 4M Angelenos).
The bottom panel shows the cumulative contributionof each tract to Greater Hollywood’s total and unshel-tered populations. If people were equitably distributed,the curves would form a diagonal line of unit slope,yielding a Gini coefficient cGini = 0. The total pop-ulation in Greater Hollywood has cGini ' 0.1—50%of people living 40% of tracts—close to evenly dis-
9
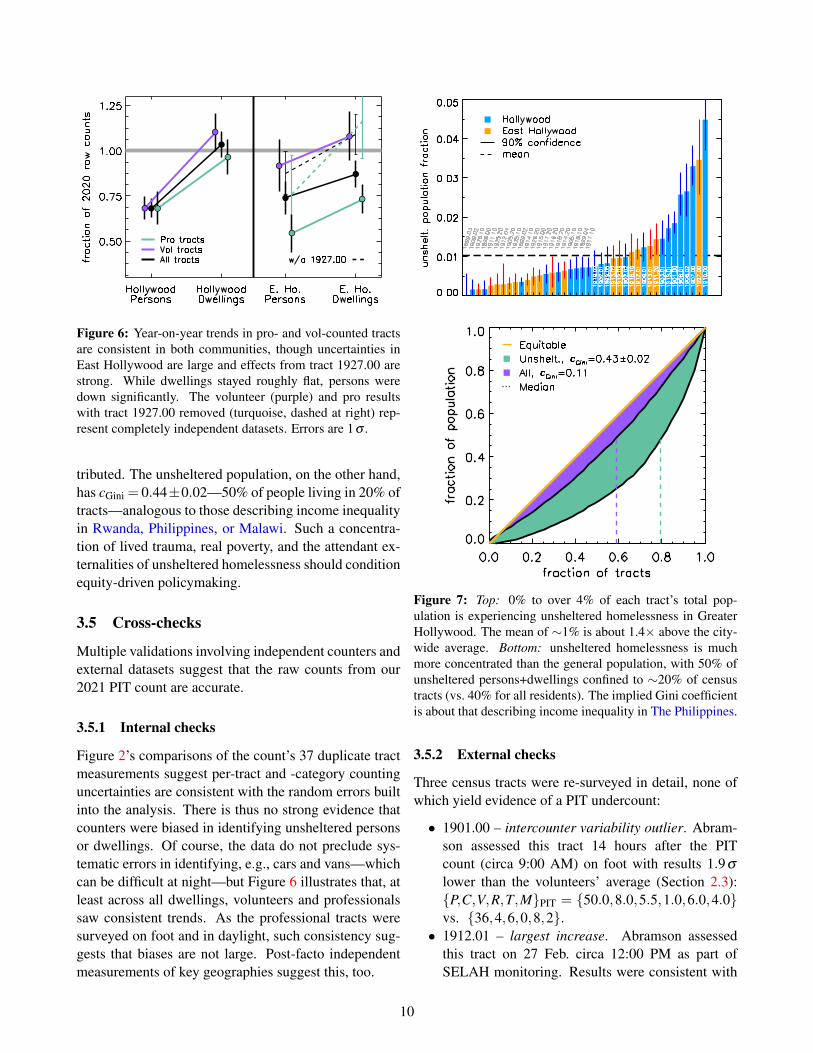
Figure 6: Year-on-year trends in pro- and vol-counted tractsare consistent in both communities, though uncertainties inEast Hollywood are large and effects from tract 1927.00 arestrong. While dwellings stayed roughly flat, persons weredown significantly. The volunteer (purple) and pro resultswith tract 1927.00 removed (turquoise, dashed at right) rep-resent completely independent datasets. Errors are 1σ .
tributed. The unsheltered population, on the other hand,has cGini = 0.44±0.02—50% of people living in 20% oftracts—analogous to those describing income inequalityin Rwanda, Philippines, or Malawi. Such a concentra-tion of lived trauma, real poverty, and the attendant ex-ternalities of unsheltered homelessness should conditionequity-driven policymaking.
3.5 Cross-checks
Multiple validations involving independent counters andexternal datasets suggest that the raw counts from our2021 PIT count are accurate.
3.5.1 Internal checks
Figure 2’s comparisons of the count’s 37 duplicate tractmeasurements suggest per-tract and -category countinguncertainties are consistent with the random errors builtinto the analysis. There is thus no strong evidence thatcounters were biased in identifying unsheltered personsor dwellings. Of course, the data do not preclude sys-tematic errors in identifying, e.g., cars and vans—whichcan be difficult at night—but Figure 6 illustrates that, atleast across all dwellings, volunteers and professionalssaw consistent trends. As the professional tracts weresurveyed on foot and in daylight, such consistency sug-gests that biases are not large. Post-facto independentmeasurements of key geographies suggest this, too.
Figure 7: Top: 0% to over 4% of each tract’s total pop-ulation is experiencing unsheltered homelessness in GreaterHollywood. The mean of ∼1% is about 1.4× above the city-wide average. Bottom: unsheltered homelessness is muchmore concentrated than the general population, with 50% ofunsheltered persons+dwellings confined to ∼20% of censustracts (vs. 40% for all residents). The implied Gini coefficientis about that describing income inequality in The Philippines.
3.5.2 External checks
Three census tracts were re-surveyed in detail, none ofwhich yield evidence of a PIT undercount:
• 1901.00 – intercounter variability outlier. Abram-son assessed this tract 14 hours after the PITcount (circa 9:00 AM) on foot with results 1.9σ
lower than the volunteers’ average (Section 2.3):{P,C,V,R,T,M}PIT = {50.0,8.0,5.5,1.0,6.0,4.0}vs. {36,4,6,0,8,2}.• 1912.01 – largest increase. Abramson assessed
this tract on 27 Feb. circa 12:00 PM as part ofSELAH monitoring. Results were consistent with
10

the PIT count to within 1σ . {P,C,V,R,T,M}PIT ={18.5,0.5,3.5,1.5,5.5,12.0} vs. {21,0,4,1,8,6}.• 1927.00 – largest decrease. Abramson assessed
this tract on 4 March circa 8:30 AM by vehi-cle. Results were 35 inferred people lower thanthan the PIT estimate, though with 9 additionalvans sighted. Given this tract’s configuration—intersecting many freeway ramps and shoulders—the PIT survey was conducted on foot by outreachprofessionals. As such, we take the recount onlyto suggest that the PIT data were likely not biasedto induce an artificial deficit of more than about9wV ' 16 people.
Two larger-geography surveys concur:
• Biweekly data from The Hollywood Partnershipfrom 19 Feb. are consistent with PIT counts in acommon tract (1902.02) and with an independentrecount of the entire Business Improvement Dis-trict performed 28 Feb. by Abramson and Kohan.These data also imply a decline from past values.• Three additional tracts in Echo Park and Silver
Lake monitored biweekly by SELAH since May2020 show declines similar to that inferred forGreater Hollywood.
Finally, if the 49 safe parking spaces in or near thesurvey area7 were occupied on 25 Feb., these locationsprobably went uncounted. Adding the implied 80± 16total car and van dwellers to our results (equal mix) re-duces the baseline chance of a decline in unshelteredpeople from 98% to 89%.
All of the above suggests that our results are reliable.
4 Discussion
As far as we can assess, the number of people experi-encing unsheltered homelessness in Greater Hollywoodhas fallen by roughly 10% from its Jan. 2020 level. Anumber of factors may contribute to this decline, someCOVID-related and some not.
4.1 Government Initiatives
Foremost among these are government programs aimedat moving people indoors and stanching inflow intohomelessness. The two most salient are COVID-related:Project Roomkey and eviction moratoria.
7Per CD13 field deputy. Includes Echo Park. Safe parkingproviders did not respond to an email query.
Figure 8: An example of one of 11 tracts wheretent+makeshift frequencies at least doubled. 1907.00 lies inthe heart of Central Hollywood, increasing the visual impactof this rise in dwellings, which was almost offset by a declinein identified persons on the street.
4.1.1 Eviction Moratoria
We do not know how many people the moratoria haveprevented from becoming homeless. However, per theLAHSA Count report, nearly 83,000 people became un-housed in 2020 from LA County’s pool of over 500,000rent-burdened residents. Of these, ∼7500 could not berehoused. Thus, if the eviction moratoria reduced even10% of last year’s inflow, extant mechanisms may havebeen able to place everyone who lost their housing undera new roof.
However, while our PIT data show a decline in un-sheltered living, at ∼10%, the implications for the pe-riod after the eviction moratoria lapse are not necessarilyrosy.
4.1.2 Project Roomkey
More information is accessible regarding ProjectRoomkey. Also according to the 2020 Count re-port, over 6000 unsheltered LA County residents be-came sheltered at some point between March and Mayof that year. Examining only CD13’s share of LACounty’s unsheltered senior population (6.5%), perhaps100 of Roomkey’s 1608 occupied rooms were filled withGreater Hollywood residents on the night of 25 Feb. Ifso, this would account for about half the inferred globalreduction.
Data from the Coordinated Entry System (CES) willconstrain this scenario.
11

4.1.3 A Bridge Home
Unrelated to COVID, at least one A Bridge Home (ABH)opened between this year’s and last year’s PIT estimatewhose catchment area spans nearly all of Greater Hol-lywood. Assuming 50% capacity due to COVID pre-cautions, the Riverside site can account for a further 50people exiting the unsheltered population.
However, COVID-related “decompression” of con-gregate living sites simultaneously reduced availablebeds in pre-existing shelters. Assuming 50% reduc-tions, we estimate that the five ABHs whose catchmentstouch Greater Hollywood—Schrader, YWCA/Lodi (re-cently expanded), Gardner, Riverside, and Lafayette—constitute a net addition of just 33 beds (398 total, 116gained, 83 lost to decompression).
Local contributions can be larger, however. Tract1927.00—which saw the largest year-on-year decline—overlaps with three ABH catchments, two of them new.As many as 89 beds may thus have become availableto that tract’s unsheltered residents, corresponding to∼70% of that tract’s inferred population change.
CES data will constrain this scenario.
4.1.4 Permanent Supportive Housing
Finally, the leasing of 120 new PATH permanent sup-portive housing units may also have contributed. Thatsite happens also to be located in tract 1927.00. We donot know how many of its rooms went to Greater Hol-lywood residents or those of its home tract, but any thatdid would help drive the declines we infer in both.
CES data will constrain this scenario.
4.2 Other Losses
4.2.1 Geographic Leakage/Edge Effects
Our PIT count covered a limited geography. As such,people exiting Greater Hollywood to nearby communi-ties is an obvious potential loss having nothing to dowith housing initiatives.
Tract 1927.00 is, again, special in this regard. Twoof its edges are borders, and there is additionally a sub-stantial community of unsheltered Angelenos oppositeits eastern flank. Indeed, since 2016, this tract’s un-sheltered population has only seen 50%–100% annualswings. Whether this variability reflects residents sim-ply crossing the street this year, we do not know. Up-coming grassroots PIT counts in Mid City and Silver
Lake—bounding Greater Hollywood to the southwestand east, respectively—may provide insights.
4.2.2 Deaths
An unfortunate but inevitable source of population lossis death. While COVID mortality rates are far higheramong people experiencing homelessness relative to thegeneral population, Dept. of Public Health statistics sug-gest that ∼200 unhoused LA County residents had suc-cumbed to the disease by the time of the PIT count, sub-ordinating its impact to other causes.
Instead, drug overdoses, particularly from metham-phetamine, likely dominate. Based on data spanningonly the first seven months of 2020, overdoses hadkilled 929 people experiencing homelessness—a rate7.6× higher than COVID to that point.
All told, deaths of people experiencing homelessnessincreased by 26% from Jan. through July 2020 com-pared to the same interval in 2019. A more rigorousanalysis is needed to determine the extent to which thosedeaths contributed qualitatively to the decline we infer,but, quantitatively, they must have.
4.3 Objective Support for Subjective Trends
The authors of this report did not anticipate a decline inGreater Hollywood’s unsheltered population. The feel-ing accumulated over the course of 2020 was one of ameaningful, if not dramatic worsening in the state ofhomelessness. The PIT data provide hints as to howthese subjective and objective conclusions may be rec-onciled.
Principally, smaller scales tell different stories thanthe community level results. Eleven tracts—28%—sawat least a doubling in their number of tents and makeshiftstructures, with a mean increase of ∼10 such dwellingsper tract.8 As such, the visual salience of unshelteredliving increased markedly in many places. Moreover,this quantitative growth was qualitatively amplified byLAPD’s suspension of LAMC 56.11 enforcement dur-ing COVID. Ordinarily, this law requires tents to be col-lapsed during the day. Without it, the impression ofhomelessness might increase even in areas where thenumber of tents declined as those that remained wouldbe newly salient. The effect in places where tents dou-bled is obvious. Tracts 1907.00 and 1912.01 are twosuch places.
8Tracts 1899.04, 1902.02, 1907.00, 1911.20, 1912.01, 1913.01,1913.02, 1914.10, 1915.00, 1916.10, 1917.20.
12

Tract 1907.00 is located in the heart of Central Hol-lywood’s commercial district.9 Not only did dwellingsdouble here, but it is one of four tracts wherein dwellingsand persons swapped shares of the unsheltered popu-lation compared to 2020. The swap was so precise in1907.00 as to nearly conserve the total number of iden-tified people+dwellings (Figure 8). This phenomenonwould enhance the impression of unsheltered living evenas the population as a whole remained unchanged.
Meanwhile, tract 1912.01’s population did not remainthe same, but more than tripled, leading to the largest ab-solute gain vs. 2020. Containing Vermont Ave betweenFountain and Hollywood Blvd, and Hollywood Blvd be-tween Vermont and Normandie (Barnsdall Park), thistract, like 1907.00, is a high-traffic area, and so one ofenhanced visibility.
Even as overall numbers declined, the above localtrends show how facts in key areas would support im-pressions that the opposite occurred. This is to say noth-ing of deteriorations in the conditions of street living forthose unable to get indoors (see next section).
Finally, the above trends also provide some evidenceof the impact of COVID-related tent distribution effortsby professional and volunteer service providers. Anec-dotally, these are reported as robust despite the globalnumber of tents remaining similar to 2020 levels. A con-centration of tents in the above tracts combined with asubstantial fraction going to replacing damaged or de-stroyed tents may have soaked up this source.
4.4 Quality of Life Degradation
If there are fewer people on the street today, their qual-ity of life has doubtless degraded. COVID has restrictedor eliminated access to restaurant and park bathrooms,libraries (so The Source service days), Dept. of PublicSocial Services (EBT, Medi-Cal), Dept. of Motor Vehi-cles (ID replacement), and Dept. of Mental Health facil-ities. Physical limitations on client access at hospitalshas also hindered caseworkers from managing success-ful discharges. These harms are reflected by said 25%increase in overdose deaths, and amplified by the simul-taneous suspension or de-scoping of city and state san-itation programs (which further increase the visual im-pact of aforementioned tent doublings).
As such, while 2021 PIT data may support the effi-cacy of programs designed to reduce street homeless-ness, they do not suggest that the state of homelessness
9Fountain to Sunset to Franklin, Vine to Seward to Highland.
in Greater Hollywood has improved. In the fight to re-build lives—as well as build homes—that fact must re-main paramount.
5 Summary
Data from February 25, 2021 show that unshelteredhomelessness has fallen in Hollywood and East Hol-lywood by 10%± 9% and 15%± 12%, respectively,compared to the 2020 LAHSA PIT Count (90% CI).Multiple internal and external cross-checks support thequality of the data—30/40 tracts counted by multipleteams; consistency between volunteer- and professional-counted tract trends; consistency with external data—which point to a 30% drop in individuals seen on thestreet driving the year-on-year change. The size of thisshift makes it difficult for updates to dwelling occupan-cies to erase the community-scale declines we infer.
We attribute the declines mainly to govern-ment initiatives—e.g., eviction moratoria, ProjectRoomkey—aimed at bringing or keeping people in-doors. The opening of at least one A Bridge Homefacility and new permanent supportive housing unitslikely also contributed. Data from the CoordinatedEntry System will test these statements.
While community-level counts declined, 28% oftracts saw at least a doubling in tents and makeshiftstructures. This phenomenon—amplified by suspensionof LAMC 56.11 enforcement and compounded by cityand state sanitation de-scopings—may have contributedto qualitative perceptions that the state of homeless-ness worsened even as the numbers went down. GivenCOVID-related disruptions to health, hygiene, and so-cial support services—these sentiments are also likelyto be accurate. Especially in light of the lifting of evic-tion moratoria, much work remains to ensure everyonehas a home in Hollywood.
LA thanks Dan Kelson for his analysis insights, andCourtney Kanagi, Guido Merkens, and The HollywoodPartnership for sharing validation data. The organiz-ers additionally thank everyone who volunteered for the2021 grassroots PIT count: Kate Adams; Albert An-drade; Rachel Andres; Eleanor Atlee; Thomas Atlee;Kate Aviv; Elvina Beck; Clarissa Boyajian; Peggi Car-bonel; Erin Casey; Chip Clements; William Clements;
13

Tract 1899.02 (Sierra Bonita–La Brea/Fountain–Sunset)
N
Figure 9: Example Hollywood tract map.
Shreyansh Daftry; Darius Derakshan; Anthony Demar-biex; Polly Estabrook; Nicole Farley; Mark Fishlowitz;Rana Ghadban; Margaret Gillespie; Kali Ghazali; JaneGibson; Charlotte Gordon; Daniel Gracey; ThomasGrogan; Kate Hammond; Lauren Hernandez; CarterHewgley; Spencer Hillman; Joan Howard; Veron-ica Huerta; Bill Kaplan; Seth Kaplan; Moira Kelly;Maryam Khoshreza; Elizabeth Larson; Kris Larson;Jennifer Levin; Marissa Levin; Erica Levine; RheaK. Mac; Aditi Mahajan; Thomas Mapp; Erica Martin;Kristian Melby; Renee Mockhatel; Mackenzie Morri-son; Robert Morrison; Chelsea Mottern; Rebecca Nash-leanas; Andoni Nava; Barbara Ngai; Henry Perez; Mar-garett Qaqish; Kelly Reilly; Elizabeth Roland; JuliaRoland; Rich Sarian; Allison Schallert; Jillian Schultz;Robert Scott; Priyanka Srivastava; Carmen Stewart;Devin Strecker; Ninoska Suarez; Giuseppe Tantino;Sierra Thomas; Leah Thompson; Dylan Tucker; BenTysch; Matt Wait; Brenna Wall; Nadia Wehbe; DelaneyWells; Marilyn Wells.
A Example Documents
Figure 9 shows an example tract map. Figure 10 showsthe PIT tally sheet. Figure 11 shows the training sum-mary provided to volunteer teams on deployment.
B Full Tract-level Results
Tables 4 and 5 present counts and population inferences,respectively, for all 40 Greater Hollywood census tracts.Professional surveying took place circa 3:00 PM on 25Feb. Volunteers counted from 7 PM to 10 PM except intract 1919.02, assessed the morning and evening of 16March.
Data Acquisition Sheet – 2021 Greater Hollywood Homeless Count
Tract:
Date:
Time:
Team members:
Adults 18--24 yr olds Unacc Minors Cars Vans/SUVs RVs Tents Makeshift Families
Comments:
Figure 10: Counter tally sheet/data collection tool.
Figure 11: Count primer. The telephone number for the on-site emergency contact has been omitted for privacy reasons.
14

Table 4: Census Tract-level Unsheltered Counts
Tract Community Counter Adults TAY Car Van RV Tent Makeshift Total
1898.00 Hollywood Vol 3.3 0.3 0.0 0.7 0.0 1.3 0.0 5.71899.02 Hollywood Vol 4.3 0.0 0.0 1.3 2.7 4.0 1.3 13.71899.03 Hollywood Vol 0.0 0.0 0.0 0.0 0.0 0.0 0.0 0.01899.04 Hollywood Vol 9.5 0.0 0.0 1.0 0.0 2.5 2.0 15.01899.05 Hollywood Vol 3.0 0.0 3.0 4.5 1.0 2.0 0.0 13.51901.00 Hollywood Vol 49.5 0.5 8.0 5.5 1.0 6.0 4.0 74.51902.01 Hollywood Vol 14.5 0.0 0.5 0.0 0.0 2.5 1.5 19.01902.02 Hollywood Vol 9.0 0.0 0.0 0.0 0.0 8.0 5.5 22.51903.01 Hollywood Pro 10.0 0.0 0.0 0.0 0.0 19.0 22.0 51.01905.10 Hollywood Pro 13.0 0.0 0.0 0.0 4.0 6.0 4.0 27.01905.20 E. Hollywood Vol 2.0 0.5 0.5 1.0 0.0 4.0 1.0 9.01907.00 Hollywood Vol 38.5 0.0 2.0 0.0 0.0 38.5 7.0 86.01908.01 Hollywood Vol 18.5 0.0 0.5 0.0 0.0 19.5 9.0 47.51908.02 Hollywood Pro 22.0 0.0 0.0 1.0 5.0 13.0 13.0 54.01909.01 Hollywood Pro 15.0 0.0 0.0 0.0 0.0 17.0 9.0 41.01909.02 Hollywood Vol 2.7 0.3 0.7 1.7 0.0 0.0 0.0 5.31910.00 Hollywood Pro 34.0 0.0 1.0 0.0 5.0 60.0 23.0 123.01911.10 E. Hollywood Vol 4.0 0.5 0.0 0.0 0.0 2.5 0.5 7.51911.20 E. Hollywood Pro 14.0 0.0 0.0 0.0 0.0 24.0 10.0 48.01912.01 E. Hollywood Vol 17.5 1.0 0.5 3.5 1.5 5.5 12.0 41.51912.03 E. Hollywood Vol 5.0 0.0 2.0 8.0 0.0 0.0 2.5 17.51912.04 E. Hollywood Vol 3.0 0.5 0.5 1.0 0.0 0.0 0.0 5.01913.01 E. Hollywood Vol 8.0 0.0 0.5 7.5 0.5 5.0 1.0 22.51913.02 E. Hollywood Vol 5.5 0.0 0.5 0.5 0.5 3.5 6.0 16.51914.10 E. Hollywood Vol 7.5 0.0 1.0 0.5 0.0 1.0 5.5 15.51914.20 E. Hollywood Vol 4.0 0.0 2.0 4.5 1.0 3.0 2.0 16.51915.00 E. Hollywood Vol 10.0 0.0 0.0 4.5 2.5 2.5 2.5 22.01916.10 E. Hollywood Pro 6.0 0.0 0.0 1.0 1.0 2.0 22.0 32.01916.20 E. Hollywood Pro 0.0 2.0 0.0 0.0 0.0 4.0 6.0 12.01917.10 Hollywood Vol 6.5 0.0 2.0 4.5 1.0 1.0 0.5 15.51917.20 Hollywood Vol 2.3 0.0 0.3 1.3 6.3 0.0 4.3 14.71918.10 Hollywood Vol 3.5 0.0 1.0 1.5 1.5 10.0 0.0 17.51918.20 Hollywood Vol 2.5 1.0 0.0 2.5 2.0 1.5 2.0 11.51919.01 Hollywood Vol 16.0 0.0 2.0 1.5 5.0 13.0 7.5 45.01919.02∗ Hollywood Vol 2.5∗ 0.0∗ 0.0∗ 1.5∗ 4.0∗ 5.5∗ 0.5∗ 14.0∗
1925.10 E. Hollywood Vol 4.0 0.0 1.5 1.0 1.5 0.0 1.5 9.51925.20 E. Hollywood Vol 1.0 0.0 1.0 6.0 1.0 0.0 0.0 9.01926.10 E. Hollywood Vol 2.0 0.0 0.0 0.0 0.0 3.5 0.5 6.01926.20 E. Hollywood Vol 1.0 0.0 0.0 0.0 0.0 11.0 0.5 12.51927.00 E. Hollywood Pro 20.0 0.0 0.0 0.0 7.0 6.0 54.0 87.0
∗Assessed 16 March. Raw counts from each tract coded as in Table 1. Fractions reflect averages over multiple counters.
15

Table 5: Census Tract-level Unsheltered Population Inferences
Tract Community Counter Adults TAY Car Van RV Tent Makeshift Total
1898.00 Hollywood Vol 3.3 (1.7) 0.0 (0.6) 0.0 (2.2) 0.0 (1.5) 0.0 (2.8) 1.9 (1.6) 0.0 (7.0) 6.9 (8.4)1899.02 Hollywood Vol 4.3 (2.0) 0.0 (0.7) 0.0 (2.3) 2.3 (2.2) 3.8 (2.5) 5.9 (2.9) 2.2 (2.0) 18.7 (5.8)1899.03 Hollywood Vol 0.0 (5.2) 0.0 (0.7) 0.0 (2.2) 0.0 (3.9) 0.0 (2.8) 0.0 (6.8) 0.0 (7.1) 0.0 (12.3)1899.04 Hollywood Vol 9.5 (3.6) 0.0 (0.7) 0.0 (2.3) 0.0 (2.2) 0.0 (2.7) 3.7 (2.7) 3.3 (3.0) 18.3 (7.0)1899.05 Hollywood Vol 3.0 (2.0) 0.0 (0.7) 4.4 (3.3) 7.7 (5.4) 0.0 (1.7) 2.9 (2.5) 0.0 (7.1) 19.9 (10.3)1901.00 Hollywood Vol 49.5 (8.2) 0.0 (0.8) 11.8 (5.9) 9.5 (6.1) 0.0 (1.8) 8.9 (4.3) 6.6 (4.5) 88.8 (13.5)1902.01 Hollywood Vol 14.5 (4.4) 0.0 (0.7) 0.0 (1.3) 0.0 (3.9) 0.0 (2.8) 3.7 (2.8) 0.0 (2.5) 21.5 (7.7)1902.02 Hollywood Vol 9.0 (3.5) 0.0 (0.7) 0.0 (2.2) 0.0 (4.0) 0.0 (2.8) 11.8 (5.0) 9.1 (5.3) 30.2 (9.9)1903.01 Hollywood Pro 10.0 (5.2) 0.0 (0.7) 0.0 (2.2) 0.0 (3.9) 0.0 (2.7) 27.8 (11.0) 36.5 (16.8) 74.8 (21.3)1905.10 Hollywood Pro 12.9 (5.9) 0.0 (0.7) 0.0 (2.2) 0.0 (4.0) 5.7 (5.1) 8.8 (6.0) 6.5 (5.9) 34.2 (12.4)1905.20 E. Hollywood Vol 2.0 (1.6) 0.0 (0.8) 0.0 (1.3) 0.0 (2.2) 0.0 (2.8) 5.9 (3.6) 0.0 (2.1) 12.7 (6.0)1907.00 Hollywood Vol 38.5 (7.2) 0.0 (0.7) 3.0 (2.6) 0.0 (3.9) 0.0 (2.8) 56.7 (12.8) 11.6 (6.3) 110.1 (16.9)1908.01 Hollywood Vol 18.5 (4.9) 0.0 (0.7) 0.0 (1.3) 0.0 (3.9) 0.0 (2.8) 28.6 (8.4) 14.9 (7.4) 63.2 (13.2)1908.02 Hollywood Pro 21.9 (7.7) 0.0 (0.7) 0.0 (2.2) 0.0 (3.1) 7.1 (5.8) 19.0 (9.1) 21.3 (11.8) 71.7 (18.1)1909.01 Hollywood Pro 15.0 (6.3) 0.0 (0.7) 0.0 (2.3) 0.0 (4.0) 0.0 (2.8) 24.9 (10.6) 14.8 (9.4) 55.3 (16.4)1909.02 Hollywood Vol 2.7 (1.5) 0.0 (0.6) 0.0 (1.2) 2.9 (2.5) 0.0 (2.7) 0.0 (6.8) 0.0 (7.2) 6.9 (10.7)1910.00 Hollywood Pro 34.0 (9.6) 0.0 (0.7) 0.0 (2.6) 0.0 (3.9) 7.0 (5.7) 88.1 (21.7) 38.1 (17.4) 169.7 (30.4)1911.10 E. Hollywood Vol 4.0 (2.3) 0.0 (0.8) 0.0 (2.2) 0.0 (3.9) 0.0 (2.7) 3.6 (2.8) 0.0 (1.4) 9.0 (6.7)1911.20 E. Hollywood Pro 13.9 (6.1) 0.0 (0.7) 0.0 (2.2) 0.0 (3.9) 0.0 (2.7) 35.3 (12.8) 16.4 (10.1) 66.2 (18.2)1912.01 E. Hollywood Vol 17.5 (4.9) 0.0 (1.1) 0.0 (1.3) 6.0 (4.6) 0.0 (2.2) 8.1 (4.2) 19.9 (9.0) 55.8 (12.4)1912.03 E. Hollywood Vol 5.0 (2.6) 0.0 (0.7) 3.0 (2.6) 13.9 (7.8) 0.0 (2.8) 0.0 (6.8) 4.2 (3.3) 26.4 (11.9)1912.04 E. Hollywood Vol 3.0 (2.0) 0.0 (0.8) 0.0 (1.3) 0.0 (2.2) 0.0 (2.8) 0.0 (6.8) 0.0 (7.0) 6.2 (10.7)1913.01 E. Hollywood Vol 8.0 (3.3) 0.0 (0.7) 0.0 (1.3) 13.0 (7.5) 0.0 (1.2) 7.3 (3.9) 0.0 (2.0) 31.8 (9.5)1913.02 E. Hollywood Vol 5.5 (2.7) 0.0 (0.7) 0.0 (1.3) 0.0 (1.5) 0.0 (1.2) 5.1 (3.2) 9.9 (5.6) 23.1 (7.5)1914.10 E. Hollywood Vol 7.5 (3.2) 0.0 (0.7) 0.0 (1.8) 0.0 (1.6) 0.0 (2.8) 0.0 (1.7) 9.0 (5.3) 20.6 (7.4)1914.20 E. Hollywood Vol 4.0 (2.3) 0.0 (0.7) 3.0 (2.7) 7.7 (5.3) 0.0 (1.8) 4.4 (3.0) 3.3 (3.0) 24.1 (8.0)1915.00 E. Hollywood Vol 10.0 (3.6) 0.0 (0.7) 0.0 (2.2) 7.8 (5.3) 3.5 (2.9) 3.7 (2.7) 4.1 (3.4) 29.6 (8.6)1916.10 E. Hollywood Pro 6.0 (4.0) 0.0 (0.7) 0.0 (2.3) 0.0 (3.1) 0.0 (2.4) 0.0 (3.4) 36.4 (16.9) 48.7 (18.3)1916.20 E. Hollywood Pro 0.0 (5.2) 0.0 (2.3) 0.0 (2.3) 0.0 (3.9) 0.0 (2.8) 5.8 (4.9) 10.0 (7.5) 17.9 (11.9)1917.10 Hollywood Vol 6.5 (3.0) 0.0 (0.7) 3.0 (2.6) 7.8 (5.4) 0.0 (1.7) 0.0 (1.8) 0.0 (1.4) 21.3 (7.4)1917.20 Hollywood Vol 2.3 (1.5) 0.0 (0.7) 0.0 (0.9) 2.3 (2.1) 9.0 (4.3) 0.0 (6.8) 7.1 (3.9) 21.7 (9.6)1918.10 Hollywood Vol 3.5 (2.2) 0.0 (0.7) 0.0 (1.8) 0.0 (2.7) 0.0 (2.2) 14.6 (5.7) 0.0 (6.9) 24.6 (10.2)1918.20 Hollywood Vol 2.5 (1.8) 0.0 (1.2) 0.0 (2.3) 4.3 (3.8) 2.9 (2.6) 2.2 (2.1) 3.3 (3.0) 16.4 (6.7)1919.01 Hollywood Vol 16.0 (4.7) 0.0 (0.7) 2.9 (2.6) 0.0 (2.7) 7.1 (4.3) 19.1 (6.6) 12.4 (6.5) 60.6 (11.9)1919.02∗ Hollywood Vol 2.5 (1.8)∗ 0.0 (0.7)∗ 0.0 (2.2)∗ 0.0 (2.8)∗ 5.7 (3.7)∗ 8.1 (4.2)∗ 0.0 (1.4)∗ 19.9 (7.1)∗
1925.10 E. Hollywood Vol 4.0 (2.3) 0.0 (0.7) 0.0 (2.2) 0.0 (2.2) 0.0 (2.2) 0.0 (6.7) 0.0 (2.6) 12.8 (8.5)1925.20 E. Hollywood Vol 0.0 (1.6) 0.0 (0.7) 0.0 (2.5) 10.5 (8.3) 0.0 (2.4) 0.0 (6.8) 0.0 (7.1) 14.8 (13.6)1926.10 E. Hollywood Vol 2.0 (1.6) 0.0 (0.7) 0.0 (2.3) 0.0 (4.0) 0.0 (2.8) 5.1 (3.3) 0.0 (1.4) 8.0 (6.7)1926.20 E. Hollywood Vol 0.0 (1.2) 0.0 (0.7) 0.0 (2.2) 0.0 (4.0) 0.0 (2.8) 16.1 (6.1) 0.0 (1.4) 18.0 (8.4)1927.00 E. Hollywood Pro 19.9 (7.4) 0.0 (0.7) 0.0 (2.3) 0.0 (3.9) 10.0 (7.0) 8.8 (6.0) 90.4 (33.2) 129.4 (35.4)
∗Assessed 16 March. Estimates reflect PDF medians with 90% CIs shown in parentheses.
16