results of the evaluation of a school-based · pdf fileschool-based program for the prevention...
TRANSCRIPT

EUropean Drug addiction prevention trial
RESULTS OF THE EVALUATION OF A
SCHOOL-BASED PROGRAM FOR THE
PREVENTION OF SUBSTANCE USE
AMONG ADOLESCENTS
Eudap Final Technical Report n.2
Author
the EU-Dap Study Group*
* EU-Dap Study Group: Fabrizio Faggiano, Roberta Siliquini, Barbara Zunino, Valeria Siliquini, Federica Vigna Taglianti, Gianluca Cuomo (Piedmont Centre for Drug Addiction Epidemiology – OED – Turin, Italy); Karl Bohrn (ISG – Wien, Austria) Peer Van Der Kreeft, Erwin Coppens (De Sleutel – Gent, Belgium); Juan Carlos Melero, Tatiana Perez , Laura Varona (EDEX – Bilbao, Spain); Gudrum Wiborg (IFT-Nord – Kiel, Germany); Manina Terzidu, Vicky Yotsidi, Clive Richardson (University Mental Health Research Institute – Athens, Greece); Maro Vassara (Pyxida – Thessaloniki, Greece); Maria Rosaria Galanti (Stockholm Centre for Public Health/ Tobacco Prevention – Stockholm, Sweden) Gregor Burkhart (EMCDDA – Lisbon, Portugal); Massimiliano Panella, Samuela Bighiani (Dept of Medical Sciences - Avogadro University – Novara, Italy); Leila Fabiani, Maria Scatigna (Dept of Internal Medicine and Public Health - University of L’Aquila).
Acknowledgment:
We thank the intervention assistants of each country who carried out the Unplugged programme within the schools involved and collected the data. Dario Gregori who collaborated in the planning of data analysis.
Edited by: Barbara Zunino – Piedmont Centre for Drug Addiction Epidemiology – OED – Italy
The project has been funded by the European Commission within the Community PublicHealth programme in 2002. The publication reflects the authors’ views and the Commissionis not liable for any use that may be made of the information contained. The project hasbeen also co-funded by local institutions stated in the local versions of this publication.
Printed by
Tipografia A.G.A.T. s.n.c. – Turin (Italy)

Eudap partnership
EU-Dap coordinating Centre Website: www.eudap.net Project coordinator: Fabrizio Faggiano Contact person: Barbara Zunino; Valeria Siliquini Analyst and database manager: G. Luca Cuomo Responsible for statistical analysis: Federica Vigna Taglianti Phone: +39 011 40188.309 / +39 011 40188.310 Email: [email protected]
Austrian Centre Website: ISG / Institut fur Sozial und Gesundheitspsychologie (www.isg.co.at) Responsible: Karl Bohrn Contact person: Elke Lantschik; Regina Fenk Phone: +431 786 18 10 Email: [email protected]
Belgium Centre Website: De Sleutel Institute (www.desleutel.be) Responsible: Peer van der Kreeft Contact person: Yannick Weyts Phone: +32 9 2315748 Email: [email protected]
German Centre Website: IFT-Nord / Institute for Therapy and Health Research (www.ift-nord.de) Responsible: Gudrum Wiborg Contact person: Gudrum Wiborg Phone: +49 431 57029 Email: [email protected]
Greek Centre Website: University Mental Health Research Institute (www.ektepn.gr) Responsible: Manina Terzidu Contact person: Maro Vassara Phone: +30 2310 202015 Email: [email protected]
Italian Centre / Turin Website: Piedmont Centre for Drug Addiction Epidemiology - OED (www.oed.piemonte.it) Responsible: Roberta Siliquini Contact person: Laura Vitale; Serena Vadrucci Phone: +39 011 40188.310 Email: [email protected]
Spanish Centre Website: Edex / Community Resources Centre (www.edex.es) Responsible: Juan Carlos Melero Contact person: Laura Varona Phone: +34 94 442 5784 Email: [email protected]
Sweden Centre Website: Centre for Public Health – Tobacco Prevention (www.sll.se) Responsible: M. Rosaria Galanti Contact person: Sara Sanchez; Lotta Jansson Phone: +46 8 7373 890/+46 8 7373 598 Email: [email protected]
Italian Collaborating Centre
Novara Website: Dept of Clinical and Experimental Medicine / Avogadro University (www.unipmn.it) Responsible: Massimiliano Panella Contact person: Samuela Bighiani Phone: +39 0321 660682 Email: [email protected]
L’Aquila Website: Dept of Internal Medicine and Public Health / University of L’Aquila (www.univaq.it) Responsible: Leila Fabiani Contact person: Maria Scatigna Phone: +39 0862 432887/1 Email: [email protected]
RESULTS OF THE EVALUATION OF A
SCHOOL-BASED PROGRAM FOR THE
PREVENTION OF SUBSTANCE USE
AMONG ADOLESCENTS
Eudap Final Technical Report n.2

INDEX
1. Introduction..................................................................................... 5
2. Reasons for the project .................................................................... 5
3. The EU-Dap intervention: the Unplugged programme ...................... 6
4. Study design of the evaluation......................................................... 7 4.1 Source populations and study population ................................................................ 7
4.2 Sample size ........................................................................................................ 7
4.3 Selection and randomisation of schools .................................................................. 8
4.4 Outcome assessment ........................................................................................... 9
4.5 Confidentiality ..................................................................................................... 9
4.6 Ethical aspects .................................................................................................... 9
4.7 Analysis ............................................................................................................ 10
5. Results ........................................................................................... 10 5.1 Enrolment and the baseline survey ...................................................................... 10
5.2 Follow-up survey and study population ................................................................. 11
5.3 Effectiveness of the prevention programme .......................................................... 11
6. Discussion...................................................................................... 11
7. References ..................................................................................... 14
8. Tables and Figures ......................................................................... 17

5
1. Introduction
EU-Dap project has been funded by the European Commission within the Community Public
Health Programme in 2002.
The aim of the project was to plan a school-based drug prevention program and to assess its
the effectiveness, through a multicentre European randomised trial. Drug prevention has been
defined in the project as a complex intervention aimed either at curbing initiation with drugs or
at delaying the transition from experimental to addicted behaviour of the following drugs:
alcohol, tobacco, cannabis and other drugs. So, effectiveness has been measured as the ability
of the program to reduce the prevalence of drug use.
EU-Dap project has been implemented by nine partners (two of them enrolled with own
funding) from seven different European countries. All the partners have been actively involved
in all project’s activities and have been responsible for intervention administration in their
country. This collaboration has produced the definition of validated programmes standardised
at an European level and, in the same time, adapted to the National context of the partners.
2. Reasons for the project
According to modern models of substance abuse prevention, the use of tobacco, alcohol, and
illicit drugs share common determinants, and show a common tendency to develop
dependency starting in adolescence (McLellan 2000, Camì 2003). Therefore, preventive
interventions should target age groups instead of specific substances (Ashton 2003, Wise
1998, Nestler 1997, Leshner 1997). For this reason, primary prevention in the school setting is
believed to be one of the most appropriate strategies to tackle substance use, as well as
because schools offer a systematic and efficient way of reaching a large number of young
persons (UNICRI 2003).
Existing school-based programmes against substance use have employed different approaches.
They can be classified into knowledge-based interventions that aim to build negative attitudes
toward drugs; affective interventions based on the assumption that psychological factors place
people at risk of use; social skills, including refusal skills and life skills programmes; a variety
of combinations of programmes (for example, knowledge plus affective interventions) or
alternative approaches, such as interventions encouraging alternative activities to drug use
(Tobler 1986).
However, the empirical evidence on effectiveness of such programmes is rather weak. A recent
Cochrane Review of school-based interventions to prevent drug use stated that only
programmes based on enhancing social skills have some chance of being effective (Faggiano
2005), a conclusion shared by other authors concerning the use of illicit drugs (Tobler 2000)
6
and, in particular, tobacco smoking (Thomas 2002) and alcohol abuse (Foxcroft 2002).
Moreover, most of the studies included in these reviews were conducted in North America: 28
out of 29 RCTs included in the Cochrane Review on drugs were carried out in the U.S.
(Faggiano 2005), as well as all 17 studies included in a review of tobacco smoking (Gorman
2005). There may be differences in effectiveness when the same programme is implemented
in different cultural contexts. A recent paper from the U.K. (Ashton 2003) underlined both
methodological and dissemination problems during the implementation of complex
interventions, such as life skills, in an European setting.
3. The EU-Dap intervention: the Unplugged programme
Tobler identified the following components as critical in increasing the effectiveness of school-
based interventions (Tobler 2000): (i) interactive curriculum; (ii) information about drugs,
including their effects; (iii) focus on personal, social and resistance skills; (iv) emphasis on
normative education and reinforcement of awareness that most adolescents do not use
substances; (v) structured broad-based skills training such as goal setting, communication
skills, and general social skills; (vi) teacher training and support from program developers or
prevention experts; (vii) active family and community involvement; (viii) cultural sensitivity -
for example by including activities tailored to the cultural experience of the classroom (Komro
2002). Starting from these premises, the EU-Dap school programme (called Unplugged), based
on a comprehensive social influence approach (Komro 2002, Tobler 2000), was especially
designed by an expert group including behavioural scientists and public health evaluators.
The Unplugged core programme consists of 12 one-hour units delivered weekly by teachers at
the participating schools, who attended a 3-day training course. It targets both experimental
and regular use of alcohol, tobacco and illicit drugs. The curriculum consists of three parts: the
first aims to improve knowledge of risks and protective factors, as well as to build attitudes
against substance use; the second focuses on interpersonal skills, beliefs, norms and realistic
information about prevalence; the third aims to develop intrapersonal skills, such as coping
competences, problem solving/decision making and goal setting. The Intervention Manual is
published as Eudap Final Technical Report n.1.
The programme is offered in three formats: class curriculum alone, class curriculum plus side
activities involving peers, and class curriculum plus activities involving parents (for details, see
www.eudap.net).

7
4. Study design of the evaluation
The effectiveness of the “Unplugged” programme has been evaluated through a cluster
randomized controlled trial utilizing schools as experimental units. In the trial, the intervention
was compared with a “usual curriculum” group.
4.1 Source populations and study population
The source population consisted of students attending junior high school classes in the
geographical areas corresponding to the centres involved in the study (Table 1).
The choice of the school grade of intervention was based mainly on the feasibility of
conducting the follow-up of the students one year or more after the baseline survey, and
therefore depended on the age at which students would move to other schools and to what
extent they would be split up or remain together.
Schools to be included were required to have at least two classes in the target grade; to be
part of mainstream educational system (schools for students with special needs and
confessional schools were excluded); to consent to participate in the study; and not to be
concurrently conducting other systematic structured interventions against substance use.
4.2 Sample size
Eu-Dap is a cluster randomized study – i.e. the entire school is randomly assigned to an
intervention arm, although the individual remains the unit of analysis. This procedure reduces
the effective sample size, since the outcome correlation within a cluster (class or school) can
be expected to be higher than the correlation between clusters. This tendency is measured by
the intraclass correlation coefficient (ICC) ρ. We estimated the ICC from some recent school
surveys of substance use among children of similar age in Sweden and Greece, and found
values of up to 0.06 for some items, down to as little as 0.015 for others. The effect on the
sample size is that we must increase the required sample size by the inflation factor of
1 + (m –1) ρ
over that required under simple random sampling, where m stands for the average size of the
cluster (Murray 2004). As the class level is assumed to be the most sensible to identify a
cluster we chose the class for estimating the required sample size. Thus, if m = 20, it is
necessary to almost double the sample size for ρ = 0.05 (inflation factor 1.95), or to increase
it by more than one third if ρ = 0.02 (inflation factor 1.38).
It was decided to take equal numbers of school in each arm, but to double the number of
controls. Thus the number of schools per centre would be a multiple of five; fifteen schools per
centre was decided upon. However, two centers, Turin and Stockholm, decided to enroll a

8
double sample of 30 schools each. Thus, with two classes per school, we expected to recruit
165 schools x 2 classes x 20 students = 6,600 students.
With sample sizes in the ratio of 3:2 between intervention and controls, and assuming a
relative risk based on the literature of 1.5 between controls and intervention, then in order to
carry out a statistical hypothesis test at significance level α = 0.05 with power 0.80, the total
“standard” sample size (that is, ignoring the clustering) needed when the incidence in the
control group is 5.0%, 7.5% or 10.0%, is 4,978, 3,250 or 2,387, respectively. Therefore, with
10% incidence in the control groups, we can allow for an inflation factor of 6600 / 2,387 =
2.765, corresponding to an ICC of up to 0.092. For 7.5% and 5.0% incidence, we can allow for
ICC’- s up to 0.054 and 0.017, respectively. Therefore, the sample size seems to be more than
adequate to allow sensitive comparisons between all interventions and controls. For comparing
a single arm against the controls (ratio 1:2), the total sample size required at 10% incidence
in the control group is 2,670. This indicates that a maximum ICC of 0.025 permits hypothesis
testing at the above significance level (although without adjustment for multiple comparisons)
and power. Hence, individual comparisons are also adequately powered, except for rare
events.
4.3 Selection and randomisation of schools
In order to achieve a balanced representation of social strata, a stratified sample was drawn
from the complete list of schools in each centre’s catchment area. The centres’ lists of schools
were divided into three socio-economic strata using the most reliable data available locally,
such as average social status of the catchment area, data from previous surveys or the type of
school (for example, vocational or other) if this represented a clear social class indicator.
Within each stratum, an equal number of schools was locally selected, until the desired
number was reached.
In order to ensure allocation concealment (Hewitt 2005), the assignment of the interventions
to the schools was carried out by the coordinating centre of the study (Turin). Computer
generated blocks of 4 digits were used to allocate schools within centres: every 5 schools, 2
were assigned to the control group, the remaining three were assigned to one of the
intervention arms. In some centres, the number of randomised schools was not a multiple of
five, because not enough schools in the area of the study agreed to participate, or because the
number of accepting schools was higher than expected (Table 2). No replacement of schools
was allowed after randomisation, i.e. after the centres had released to schools the trial arm to
which they had been assigned.
All classes belonging to the same school (at least 2 from each school) were included in the
same arm. At the individual level, only two exclusion criteria were adopted: incapability of
answering the questionnaire or parents’ refusal.

9
4.4 Outcome assessment
To evaluate the effectiveness of EU-Dap interventions compared to usual conditions,
theoretically, a before-after comparison is not essential, because homogeneity of baseline
conditions between arms would be assured by randomisation. However, because the allocation
process is done at the group level, and because selection processes at the cluster level can be
expected, imbalance of baseline prevalence cannot be excluded. Thus a baseline survey was
conducted to measure the main confounding factors and to verify the success of the
randomisation.
A self-completed questionnaire was distributed during the first month of the 2004-2005 school
year. The main sections of the questionnaire were: (i) own substance use; (ii) knowledge and
opinions about substances; (iii) substance use in the close environment; (iv) family and social
environment; (v) school environment and climate; (vi) problems and skills. In order to include
already validated questions in the questionnaire, most were derived or adapted from the
EDDRA data bank (http://eddra.emcdda.eu.org). In order to test the whole questionnaire, a
pilot study was conducted in four centres (Novara, Turin, Stockholm and Portugalete closed to
Bilbao) among 263 students.
At least three months after the end of the intervention, a second assessment was carried out
using the same questionnaire. Similar evaluations are scheduled to take place after a further
one, two and four years.
4.5 Confidentiality
In order to preserve the rigorously anonymous management of the data, yet at the same time
enabling a student’s reports at follow-up to be linked to his or her first questionnaire, a 9-digit
individual code was generated by the student according to instructions printed on the first
page of the questionnaire. The code was based on stable personal and parental data to allow
the identical code to be generated on subsequent occasions. The reliability of the code was
assessed during the pilot study, and a definite code was then built to reduce the risk of errors.
To deal with possible sample attrition at follow-up because of students changing school or
class, the names of students participating in the baseline assessment were collected separately
by each centre in order to make it possible to trace them subsequently if required.
4.6 Ethical aspects
Given the confidentiality of data collection and processing described above, a general policy on
parental informed consent was not adopted. Each centre followed the practice required locally:
three centres adopted a passive consent procedure, informing families of the administration of
10
the programme, while others asked for individual active consent. Only one centre needed a
local permission from the national educational authority.
4.7 Analysis
The effictiveness of the programme have been evaluated using the following outcomes: ALO
smoking= at least one cigarette in last 30 days; Regular Smoking= at least 6 times in last
30 days; Daily smoking= at least 20 times in last 30 days; ALO drunkenness= at least
once in last 30 days; Regular drunkenness= at least 3 times in last 30 days; ALO
cannabis= at least once in last 30 days; Regular cannabis= at least 3 times in last 30 days;
ALO drugs= at least once of any illicit drug in last 30 days.
The analysis has been fitting a Multilevel regression model (also called Random Effect Model)
to adjust for the following factors:
- MODEL 1: cluster effect (to correct the inflated precision due to the lower
intraclass variability);
• MODEL 2: cluster effect plus the difference in prevalence among centres;
• MODEL 3: cluster effect plus difference in prevalence plus the imbalance in the
baseline characteristics (controls have higher prevalences). For this purpose Daily
smoking (as fixed effect) was included in the model to control for imbalance, because
it appears to be a more stable variable.
We conducted a descriptive analysis of the baseline prevalences of selected characteristics
across study arm and centres. To test for differences in prevalences, Chi-squared tests were
performed with Bonferroni adjustments for the multiple comparisons (Westfall 1997).
5. Results
5.1 Enrolment and the baseline survey
A total of 170 schools in nine centres agreed to participate in the study (Table 2) and were
then randomised. Twenty-seven schools (15.9%) dropped out following their random
allocation to a study arm, but before the baseline survey. The rate of withdrawal from the
study varied across study arms, being higher for the intervention arms (23.5% versus 4.4%
for controls) (Table 3).
Thus, 143 schools and 345 classes (an average of 2.4 per school) were actually included in the
study (Table 2). Of the 7,409 eligible students in these classes (196 students were excluded
because of incapability or lack of parental consent), 7,079 (95.7%) participated in the baseline
survey in September-October 2004 and were, therefore, included in the study.

11
Four centres enrolled students in the 7th grade (13 years in Sweden, 12 years elsewhere), two
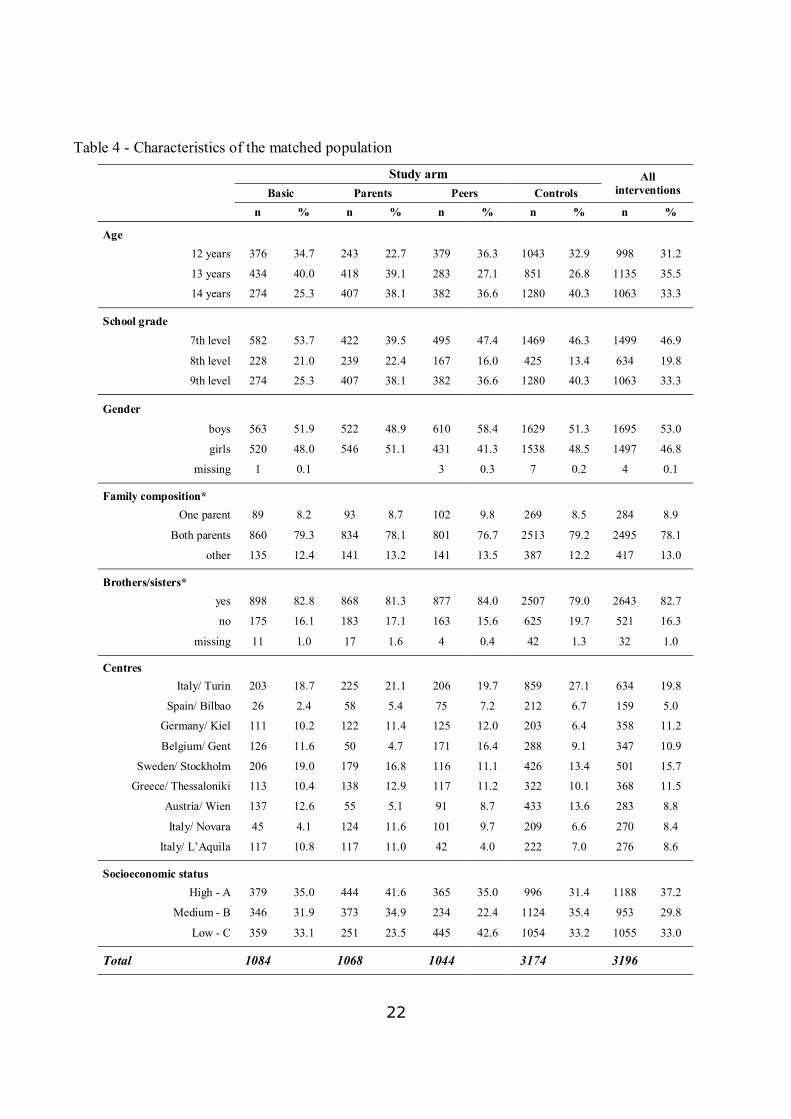
in the 8th grade and three the 9th grade. Apart from age, the only demographic characteristic
showing differences between intervention arms and controls at baseline was gender; a smaller
proportion of girls was also enrolled in the peer intervention schools compared to controls
(Table 4).
5.2 Follow-up survey and study population
6,604 students participated in the follow-up survey (May 2005), at least three months after
the completion of the program. 6,370 out of 7,079 (91.5%) baseline questionnaires matched
to the corresponding follow-up questionnaire. The matching procedure was based on the
anonymous code: it started using all the 9 digits, and followed limiting to 6 codes. A manual
linkage was also carried out independently by two researchers, at the level of class (fig 1). The
characteristics of the study population are presented in the Table 4.
5.3 Effectiveness of the prevention programme
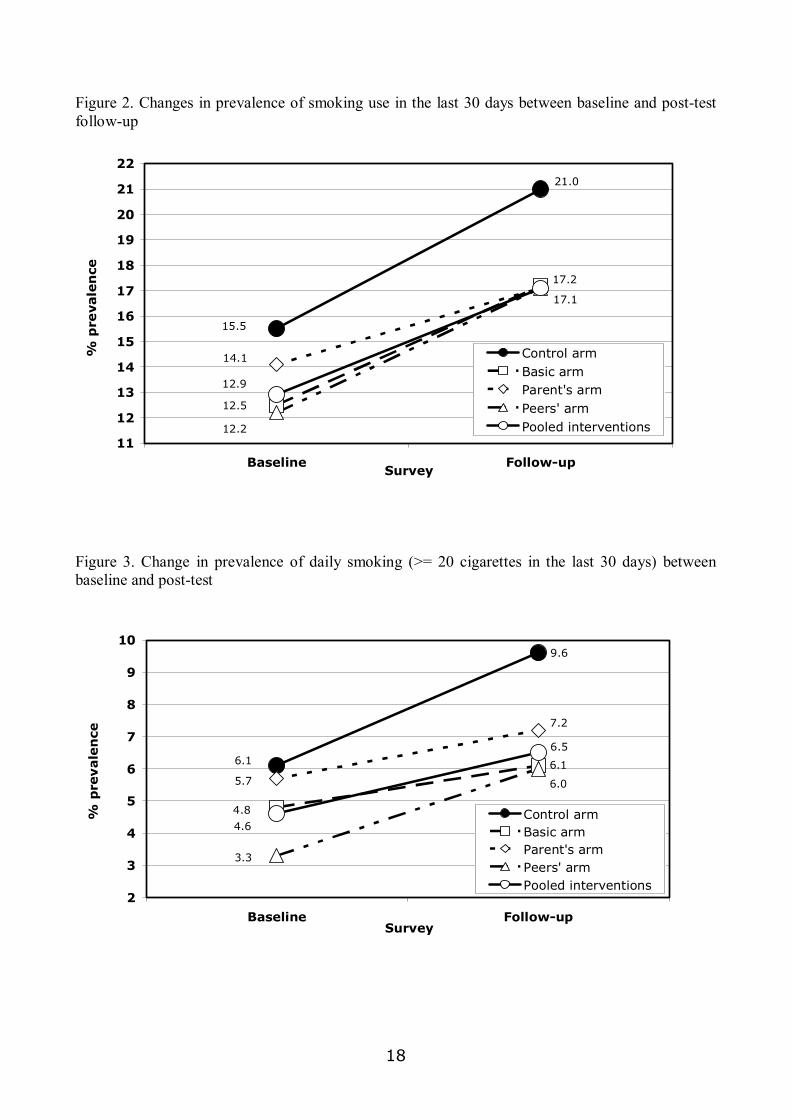
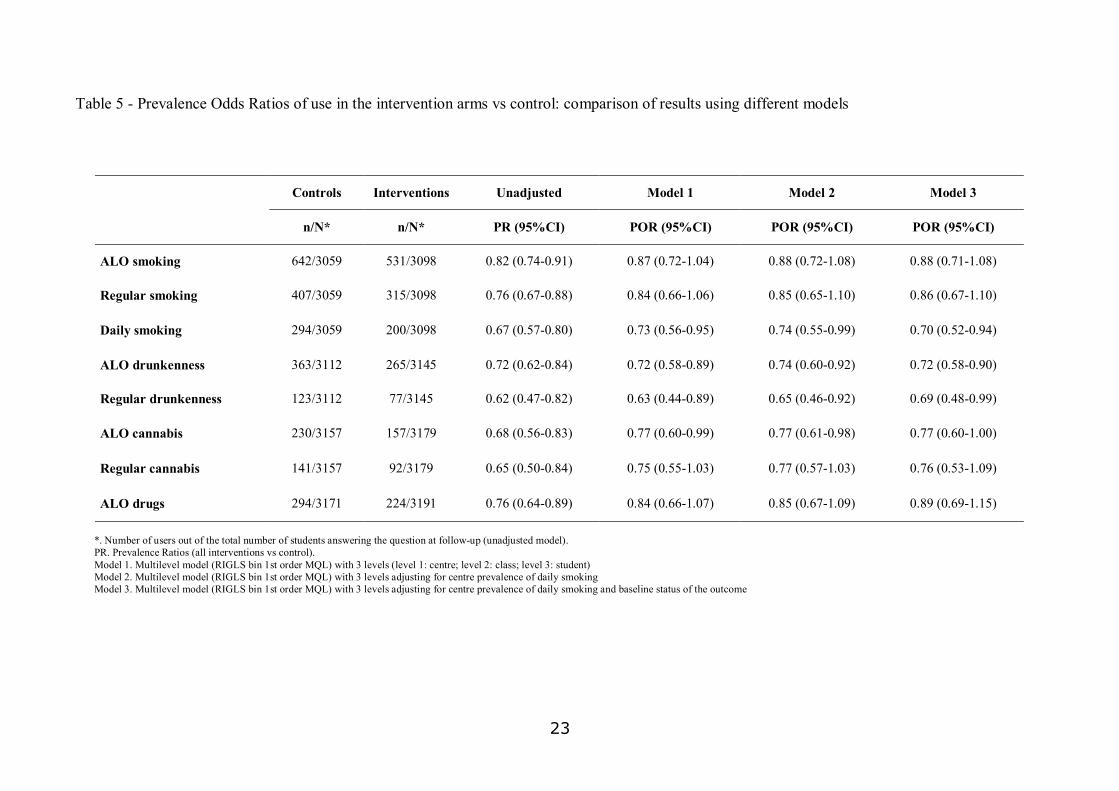
Table 5 shows the main results of the study. The definite model 3 shows a clear protection for
students in the intervention arms compared to controls. Interventions groups smoked 12%
less during past 30 days, 14% less in a regular way and 30% less daily, when compared with
controls. The frequency of drunkenness in past 30 days was also reduced by 28% and 31% for
at least once and regularly respectively, and the consumption of cannabis was reduced by 23
and 24%, ALO and regularly respectively, The use of other drugs, although rare, was reduced
by 11%.
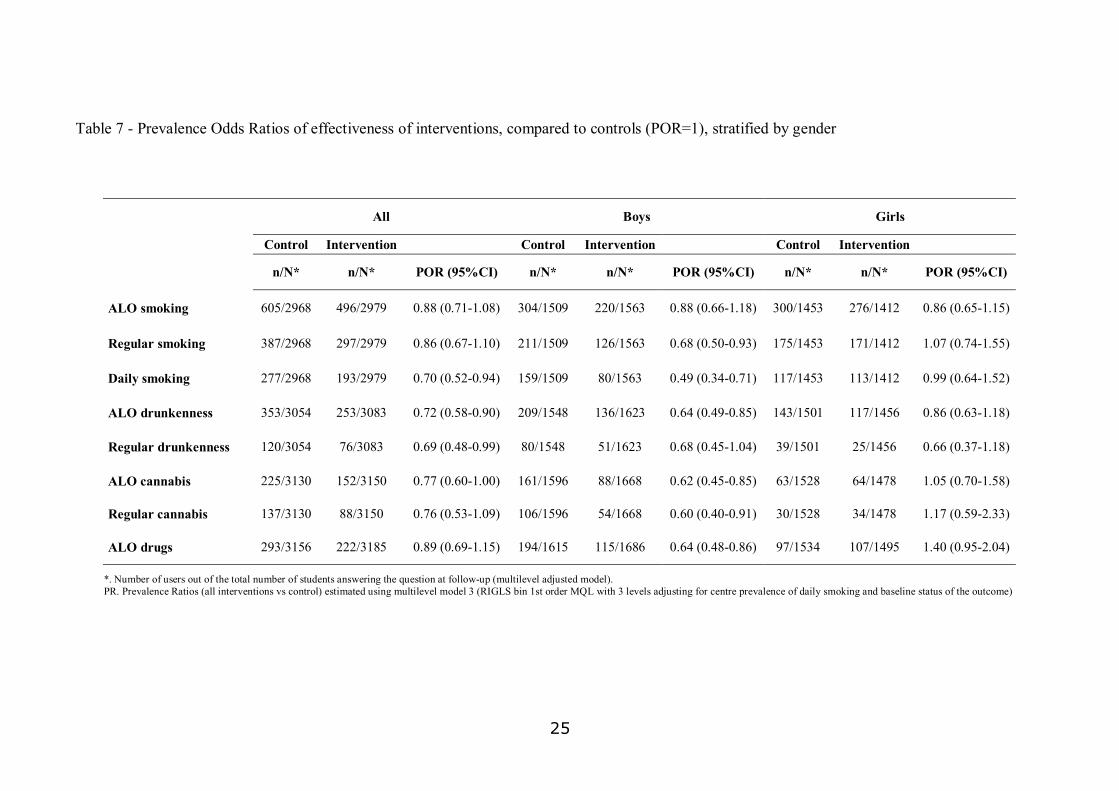
Unplugged works, a least in the short-term
• it seems to work better:
• for alcohol and cannabis than for smoking
• for higher frequent use than for sporadic users
• for boys than for girls
• there are big differences in the effectiveness of the program between centers (a north-
south gradient, data not shown) that need to be explained.
6. Discussion
This paper presents the study design and the baseline characteristics of the study population
of a European multicenter study designed to evaluate the effectiveness of a school-based
intervention to prevent the onset of the use of tobacco, alcohol and drugs. This endeavour

12
mobilized resources from nine regional centres in seven countries, and involved more than
7,000 adolescents in 143 schools.
The evaluation of the effectiveness of primary prevention is becoming a priority for public
health as well as for the scientific community. Substance abuse, including tobacco and alcohol
use, is actually the predominant health problem in developed countries, accounting for 20% of
all deaths and 22% of potential years of life lost (Single 2000). Primary prevention is probably
the most efficient way of tackling this problem, but there is still a need for evidence. Public
health programmes face different ethical challenges compared to clinical practice. If public
health or school authorities carry out an intervention aimed at preventing substance abuse,
there should be conclusive evidence that it can alter the natural history of the target condition
in a significant proportion of those to whom the intervention is delivered (Cochrane 1989).
Despite the large number of evaluations that have been carried out, evidence on the
effectiveness of school-based programmes for the prevention of substance use is still weak and
comes mainly from studies in the US (Faggiano 2005, Thomas 2002). Studies from Europe
represent a small minority: among those aimed at preventing drug use, only one small study
(Hurry 1997) was included in a recent review (Faggiano 2005), whereas among those aimed at
preventing tobacco use, some failed to detect any effect (Eveyard 2001) while others show
inconsistent results across centres (de Vries 2003).
The EU-Dap study presents some unique features. First, it is an experimental study with a
large sample size, providing more power than previous studies for detecting even small
effects. Furthermore, the involvement of seven different countries can handle [SM1] the
“context shift” from the original US -conceived skills programme. However, multicentre studies
often present particular difficulties concerning standardisation of the intervention and the data
collection (Lytle 1994). To deal with these issues, a rigorous monitoring procedure was laid
down, establishing a continuous flow of standardized information on the process of enrolment
of schools, classes and students, as well as on the implementation of the programme activities.
During the recruitment of the study population, an unequal drop-out rate was observed in the
intervention arms compared to controls (23.5% among intervention groups versus 4.4%
among controls). This was unexpected because previous studies had found the opposite
(Schofield 2004, Crone 2003). This fact, however, could easily be explained if a pool of equally
motivated schools and class teachers had been initially recruited, but having underestimated
the necessary commitment to some degree, a subsequent re-appraisal occurred during the
training course.
Whether the imbalance observed across arms in the baseline prevalence is attributable to this
process of self-selection is a matter of discussion. If so, it would imply that schools with higher
prevalence of problem behaviours and substance use differentially refused to continue
participating when assigned to active intervention rather than to controls. Although this
13
possibility cannot be excluded, it seems counter-intuitive and thus unlikely to explain the
difference in the drop-out rate. Chance is a more likely explanation, a fact that imposes the
need for some caution when inferring balanced individual characteristics after cluster
randomisation. Therefore, the importance of collecting baseline data in community
experimental studies should be repeatedly emphasized, as this allows baseline characteristics
to be taken into account when analysing intervention effects.
Above all, these preliminary data from the EU-Dap trial show that complex multicenter
experimental studies can be designed and carried out in Europe, with satisfactory
standardization of procedures for the recruitment and allocation of the study populations.
Moreover, the European Commission approved the project Implementation of EU-Dap at a
population level (Eudap 2).
The objectives of EU-Dap 2 are the following:
– to conclude the first efficacy phase of EU-Dap1 project with a longer evaluation
– to carry out an effectiveness research by planning and applying at a population
level of the prevention program in 8 EU member states for a total of 10 partners
(Italy has 3 centres).
– to produce the Intervention Manual new version based on performance analysis
and comments of teachers
– to define the procedure for the implementation and dissemination of the
Unplugged programme, giving recommendations to policy makers and school
authorities on the way to diffuse the programme.
14
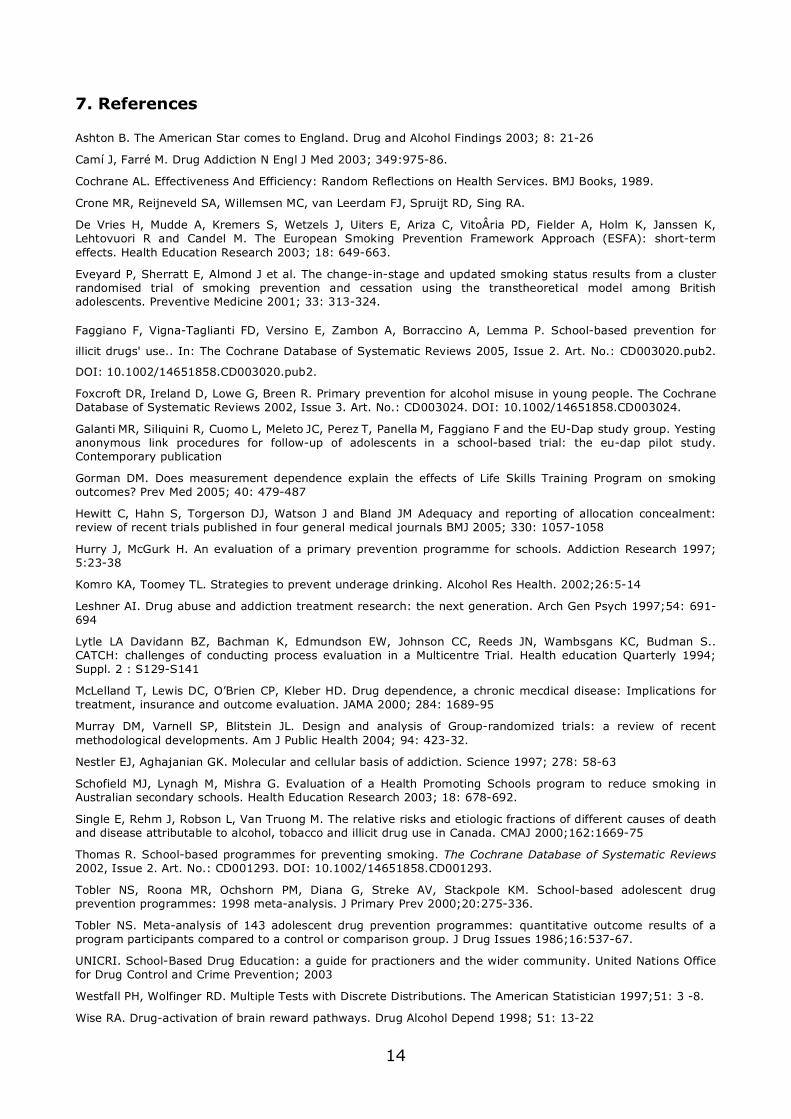
7. References
Ashton B. The American Star comes to England. Drug and Alcohol Findings 2003; 8: 21-26
Camí J, Farré M. Drug Addiction N Engl J Med 2003; 349:975-86.
Cochrane AL. Effectiveness And Efficiency: Random Reflections on Health Services. BMJ Books, 1989.
Crone MR, Reijneveld SA, Willemsen MC, van Leerdam FJ, Spruijt RD, Sing RA.
De Vries H, Mudde A, Kremers S, Wetzels J, Uiters E, Ariza C, VitoÂria PD, Fielder A, Holm K, Janssen K, Lehtovuori R and Candel M. The European Smoking Prevention Framework Approach (ESFA): short-term effects. Health Education Research 2003; 18: 649-663.
Eveyard P, Sherratt E, Almond J et al. The change-in-stage and updated smoking status results from a cluster randomised trial of smoking prevention and cessation using the transtheoretical model among British adolescents. Preventive Medicine 2001; 33: 313-324.
Faggiano F, Vigna-Taglianti FD, Versino E, Zambon A, Borraccino A, Lemma P. School-based prevention for
illicit drugs' use.. In: The Cochrane Database of Systematic Reviews 2005, Issue 2. Art. No.: CD003020.pub2.
DOI: 10.1002/14651858.CD003020.pub2.
Foxcroft DR, Ireland D, Lowe G, Breen R. Primary prevention for alcohol misuse in young people. The Cochrane Database of Systematic Reviews 2002, Issue 3. Art. No.: CD003024. DOI: 10.1002/14651858.CD003024.
Galanti MR, Siliquini R, Cuomo L, Meleto JC, Perez T, Panella M, Faggiano F and the EU-Dap study group. Yesting anonymous link procedures for follow-up of adolescents in a school-based trial: the eu-dap pilot study. Contemporary publication
Gorman DM. Does measurement dependence explain the effects of Life Skills Training Program on smoking outcomes? Prev Med 2005; 40: 479-487
Hewitt C, Hahn S, Torgerson DJ, Watson J and Bland JM Adequacy and reporting of allocation concealment: review of recent trials published in four general medical journals BMJ 2005; 330: 1057-1058
Hurry J, McGurk H. An evaluation of a primary prevention programme for schools. Addiction Research 1997; 5:23-38
Komro KA, Toomey TL. Strategies to prevent underage drinking. Alcohol Res Health. 2002;26:5-14
Leshner AI. Drug abuse and addiction treatment research: the next generation. Arch Gen Psych 1997;54: 691-694
Lytle LA Davidann BZ, Bachman K, Edmundson EW, Johnson CC, Reeds JN, Wambsgans KC, Budman S.. CATCH: challenges of conducting process evaluation in a Multicentre Trial. Health education Quarterly 1994; Suppl. 2 : S129-S141
McLelland T, Lewis DC, O’Brien CP, Kleber HD. Drug dependence, a chronic mecdical disease: Implications for treatment, insurance and outcome evaluation. JAMA 2000; 284: 1689-95
Murray DM, Varnell SP, Blitstein JL. Design and analysis of Group-randomized trials: a review of recent methodological developments. Am J Public Health 2004; 94: 423-32.
Nestler EJ, Aghajanian GK. Molecular and cellular basis of addiction. Science 1997; 278: 58-63
Schofield MJ, Lynagh M, Mishra G. Evaluation of a Health Promoting Schools program to reduce smoking in Australian secondary schools. Health Education Research 2003; 18: 678-692.
Single E, Rehm J, Robson L, Van Truong M. The relative risks and etiologic fractions of different causes of death and disease attributable to alcohol, tobacco and illicit drug use in Canada. CMAJ 2000;162:1669-75
Thomas R. School-based programmes for preventing smoking. The Cochrane Database of Systematic Reviews 2002, Issue 2. Art. No.: CD001293. DOI: 10.1002/14651858.CD001293.
Tobler NS, Roona MR, Ochshorn PM, Diana G, Streke AV, Stackpole KM. School-based adolescent drug prevention programmes: 1998 meta-analysis. J Primary Prev 2000;20:275-336.
Tobler NS. Meta-analysis of 143 adolescent drug prevention programmes: quantitative outcome results of a program participants compared to a control or comparison group. J Drug Issues 1986;16:537-67.
UNICRI. School-Based Drug Education: a guide for practioners and the wider community. United Nations Office for Drug Control and Crime Prevention; 2003
Westfall PH, Wolfinger RD. Multiple Tests with Discrete Distributions. The American Statistician 1997;51: 3 -8.
Wise RA. Drug-activation of brain reward pathways. Drug Alcohol Depend 1998; 51: 13-22

15
TABLES AND FIGURES

16
17
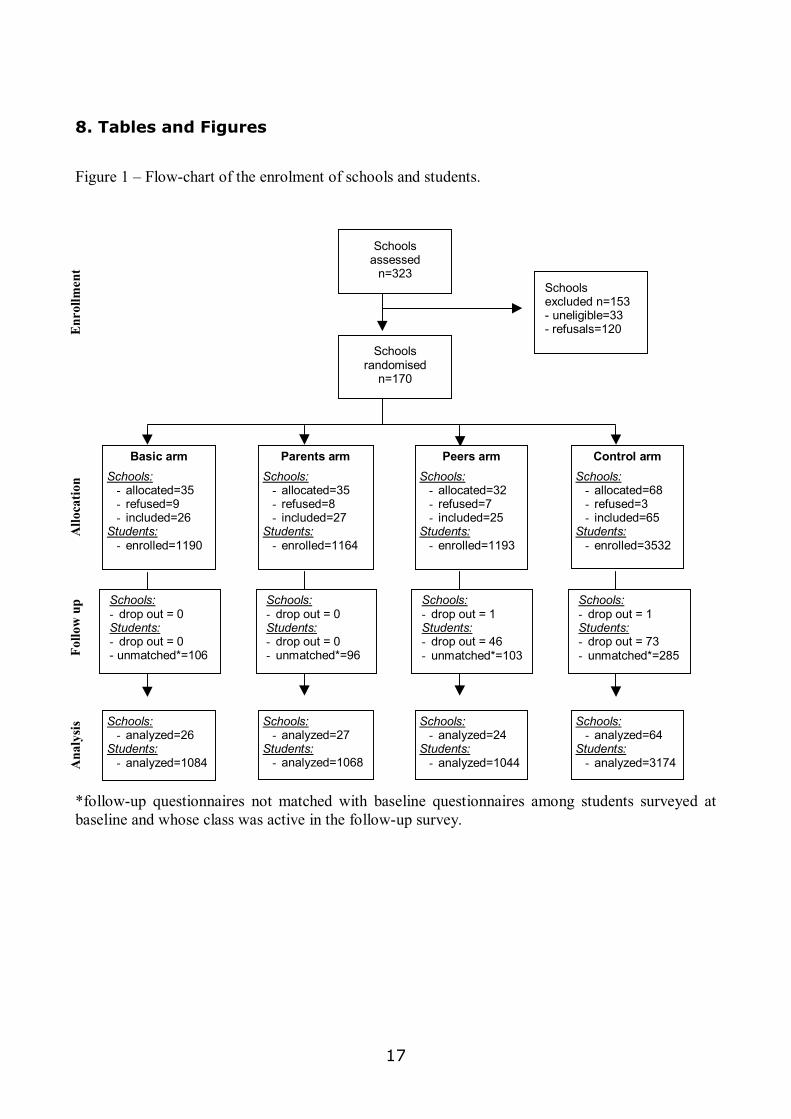
8. Tables and Figures
Figure 1 – Flow-chart of the enrolment of schools and students.
*follow-up questionnaires not matched with baseline questionnaires among students surveyed at baseline and whose class was active in the follow-up survey.
Schools randomised
n=170
Schools excluded n=153 - uneligible=33 - refusals=120
Schools assessed
n=323
Enr
ollm
ent
Control arm
Schools: - allocated=68 - refused=3 - included=65
Students: - enrolled=3532
Parents arm
Schools: - allocated=35 - refused=8 - included=27
Students: - enrolled=1164
Peers arm
Schools: - allocated=32 - refused=7 - included=25
Students: - enrolled=1193
Basic arm
Schools: - allocated=35 - refused=9 - included=26
Students: - enrolled=1190
Allo
catio
n
Schools: - drop out = 0 Students: - drop out = 0 - unmatched*=106
Schools: - drop out = 0 Students: - drop out = 0 - unmatched*=96
Schools:- drop out = 1 Students: - drop out = 46 - unmatched*=103
Schools: - drop out = 1 Students: - drop out = 73 - unmatched*=285Fo
llow
up
Schools: - analyzed=64
Students: - analyzed=3174
Schools: - analyzed=27
Students: - analyzed=1068
Schools:- analyzed=24
Students: - analyzed=1044
Schools: - analyzed=26
Students: - analyzed=1084 A
naly
sis
18
Figure 2. Changes in prevalence of smoking use in the last 30 days between baseline and post-test follow-up
15.5
21.0
12.5
17.2
14.1
12.2
17.1
12.9
11
12
13
14
15
16
17
18
19
20
21
22
Baseline Follow-up
% p
revale
nce
Control armBasic armParent's armPeers' armPooled interventions
Survey
Figure 3. Change in prevalence of daily smoking (>= 20 cigarettes in the last 30 days) between baseline and post-test
9.6
6.1
4.8
6.1
7.2
5.7
3.3
6.0
4.6
6.5
2
3
4
5
6
7
8
9
10
Baseline Follow-up
% p
revale
nce
Control armBasic armParent's armPeers' armPooled interventions
Survey

19
Table 1 – Socio-economic characteristics of the centres involved in the Eu-Dap study
Participating Centres
Number of inhabitants
Socioeconomic characteristic
Italy/ Turin 900,000 Industrial city
Spain/ Bilbao 2 million Mixed tertiary sector, agriculture and industry
Germany/ Kiel 280,000 Mixed tourism, agriculture and industry
Belgium/ Gent 231,000 Mixed tertiary sector, services, education, industry
Sweden/ Stockholm region (excl. Stockholm municipality) 1.1 million Middle size urban communities
Greece/ Thessaloniki NW region 500,000 Mixed industry and agriculture
Austria/ Wien 1.5 million Urban technology, tourism, education and administration
Italy/ Novara 100,000 Middle size urban communities
Italy/ L’Aquila 300,000 Mixed tertiary sector, agriculture and industry

20
Table 2 – Participation (%) in the EU-Dap trial among schools, classes and students (first pre test survey).
Schools selected Enrolled Students
Centres Randomised Withdrew Schools Classes Students Eligible* Participants** %
Italy/ Turin 30 2 28 78 1750 1727 1660 96.1
Spain/ Bilbao 15 5 10 23 461 456 429 94.1
Germany/ Kiel 15 0 15 29 664 606 592 97.7
Belgium/ Gent 22 9 13 48 753 730 709 97.1
Sweden/ Stockholm 28 5 23 45 1138 1086 1033 95.1
Greece/ Thessaloniki 17 0 17 34 775 775 732 94.5
Austria/ Wien 17 3 14 37 937 927 858 92.6
Italy/ Novara 13 3 10 25 544 537 516 96.1
Italy/ L’Aquila 13 0 13 26 583 565 550 97.3
Total 170 27 143 345 7605 7409 7079 95.5
* Eligible differ from Students in enrolled classes because of incapability of answering the questionnaire or parents’ refusal.
** Participants differ from Eligible because of absentees.

21
Table 3 – Numbers of schools randomised and dropping out after randomisation, by study arm and centre.
Study arm Total
Basic Parent Peer Controls
Centres Rand. Drop out Rand. Drop out Rand. Drop out Rand. Drop out Rand. Drop out %
Italy/ Turin 6 1 6 0 6 1 12 0 30 6.7
Spain/ Bilbao 3 2 3 2 3 1 6 0 15 33.3
Germany/ Kiel 3 0 3 0 3 0 6 0 15 0.0
Belgium/ Gent 5 3 5 3 4 2 8 1 22 40.9
Sweden/ Stockholm 6 1 6 1 6 2 10 1 28 17.9
Greece/ Thessaloniki 3 0 4 0 3 0 7 0 17 0.0
Austria/ Wien 3 0 3 2 3 1 8 0 17 17.6
Italy/ Novara 3 2 2 0 3 0 5 1 13 23.1
Italy/ L’Aquila 3 0 3 0 1 0 6 0 13 0.0
Total 35 9 (25.7%) 35 8 (22.9%) 32 8 (21.9%) 68 4 (4.4%) 170 27 (15.9%)
22
Table 4 - Characteristics of the matched population
Study arm Basic Parents Peers Controls
All interventions
n % n % n % n % n %
Age 12 years 376 34.7 243 22.7 379 36.3 1043 32.9 998 31.2
13 years 434 40.0 418 39.1 283 27.1 851 26.8 1135 35.5
14 years 274 25.3 407 38.1 382 36.6 1280 40.3 1063 33.3
School grade 7th level 582 53.7 422 39.5 495 47.4 1469 46.3 1499 46.9
8th level 228 21.0 239 22.4 167 16.0 425 13.4 634 19.8
9th level 274 25.3 407 38.1 382 36.6 1280 40.3 1063 33.3
Gender
boys 563 51.9 522 48.9 610 58.4 1629 51.3 1695 53.0
girls 520 48.0 546 51.1 431 41.3 1538 48.5 1497 46.8
missing 1 0.1 3 0.3 7 0.2 4 0.1
Family composition* One parent 89 8.2 93 8.7 102 9.8 269 8.5 284 8.9
Both parents 860 79.3 834 78.1 801 76.7 2513 79.2 2495 78.1
other 135 12.4 141 13.2 141 13.5 387 12.2 417 13.0
Brothers/sisters* yes 898 82.8 868 81.3 877 84.0 2507 79.0 2643 82.7
no 175 16.1 183 17.1 163 15.6 625 19.7 521 16.3
missing 11 1.0 17 1.6 4 0.4 42 1.3 32 1.0
Centres Italy/ Turin 203 18.7 225 21.1 206 19.7 859 27.1 634 19.8
Spain/ Bilbao 26 2.4 58 5.4 75 7.2 212 6.7 159 5.0
Germany/ Kiel 111 10.2 122 11.4 125 12.0 203 6.4 358 11.2
Belgium/ Gent 126 11.6 50 4.7 171 16.4 288 9.1 347 10.9
Sweden/ Stockholm 206 19.0 179 16.8 116 11.1 426 13.4 501 15.7
Greece/ Thessaloniki 113 10.4 138 12.9 117 11.2 322 10.1 368 11.5
Austria/ Wien 137 12.6 55 5.1 91 8.7 433 13.6 283 8.8
Italy/ Novara 45 4.1 124 11.6 101 9.7 209 6.6 270 8.4
Italy/ L’Aquila 117 10.8 117 11.0 42 4.0 222 7.0 276 8.6
Socioeconomic status High - A 379 35.0 444 41.6 365 35.0 996 31.4 1188 37.2
Medium - B 346 31.9 373 34.9 234 22.4 1124 35.4 953 29.8
Low - C 359 33.1 251 23.5 445 42.6 1054 33.2 1055 33.0
Total 1084 1068 1044 3174 3196
23
Table 5 - Prevalence Odds Ratios of use in the intervention arms vs control: comparison of results using different models
Controls Interventions Unadjusted Model 1 Model 2 Model 3
n/N* n/N* PR (95%CI) POR (95%CI) POR (95%CI) POR (95%CI)
ALO smoking 642/3059 531/3098 0.82 (0.74-0.91) 0.87 (0.72-1.04) 0.88 (0.72-1.08) 0.88 (0.71-1.08)
Regular smoking 407/3059 315/3098 0.76 (0.67-0.88) 0.84 (0.66-1.06) 0.85 (0.65-1.10) 0.86 (0.67-1.10)
Daily smoking 294/3059 200/3098 0.67 (0.57-0.80) 0.73 (0.56-0.95) 0.74 (0.55-0.99) 0.70 (0.52-0.94)
ALO drunkenness 363/3112 265/3145 0.72 (0.62-0.84) 0.72 (0.58-0.89) 0.74 (0.60-0.92) 0.72 (0.58-0.90)
Regular drunkenness 123/3112 77/3145 0.62 (0.47-0.82) 0.63 (0.44-0.89) 0.65 (0.46-0.92) 0.69 (0.48-0.99)
ALO cannabis 230/3157 157/3179 0.68 (0.56-0.83) 0.77 (0.60-0.99) 0.77 (0.61-0.98) 0.77 (0.60-1.00)
Regular cannabis 141/3157 92/3179 0.65 (0.50-0.84) 0.75 (0.55-1.03) 0.77 (0.57-1.03) 0.76 (0.53-1.09)
ALO drugs 294/3171 224/3191 0.76 (0.64-0.89) 0.84 (0.66-1.07) 0.85 (0.67-1.09) 0.89 (0.69-1.15)
*. Number of users out of the total number of students answering the question at follow-up (unadjusted model). PR. Prevalence Ratios (all interventions vs control). Model 1. Multilevel model (RIGLS bin 1st order MQL) with 3 levels (level 1: centre; level 2: class; level 3: student) Model 2. Multilevel model (RIGLS bin 1st order MQL) with 3 levels adjusting for centre prevalence of daily smoking Model 3. Multilevel model (RIGLS bin 1st order MQL) with 3 levels adjusting for centre prevalence of daily smoking and baseline status of the outcome

24
Table 6 - Prevalence Odds Ratios of effectiveness interventions, compared to controls, by intervention arm
Study arm
Control Basic Parents Peers
n/N* PR n/N* POR (95%CI) n/N* POR (95%CI) n/N* POR (95%CI)
ALO smoking 605/2968 1 165/996 0.97 (0.71-1.33) 171/1001 0.80 (0.59-1.09) 160/982 0.89 (0.65-1.21)
Regular smoking 387/2968 1 93/996 0.81 (0.56-1.19) 110/1001 0.85 (0.59-1.24) 94/982 0.90 (0.64-1.27)
Daily smoking 277/2968 1 61/996 0.64 (0.41-1.01) 75/1001 0.72 (0.47-1.12) 57/982 0.75 (0.49-1.16)
ALO drunkenness 353/3054 1 87/1044 0.79 (0.57-1.09) 72/1029 0.61 (0.44-0.85) 94/1010 0.82 (0.60-1.12)
Regular drunkenness 120/3054 1 22/1044 0.66 (0.37-1.19) 26/1029 0.67 (0.40-1.13) 28/1010 0.76 (0.47-1.24)
ALO cannabis 225/3130 1 43/1066 0.79 (0.54-1.16) 56/1058 0.76 (0.53-1.09) 53/1026 0.79 (0.54-1.16)
Regular cannabis 137/3130 1 26/1066 0.83 (0.47-1.45) 34/1058 0.75 (0.45-1.25) 28/1026 0.75 (0.44-1.28)
ALO drugs 293/3156 1 61/1082 0.80 (0.56-1.15) 85/1066 0.98 (0.69-1.38) 76/1037 0.89 (0.64-1.25)
*. Number of users out of the total number of students answering the question at follow-up (multilevel adjusted model). PR. Prevalence Ratios (all interventions vs control) estimated using multilevel model 3 (RIGLS bin 1st order MQL with 3 levels adjusting for centre prevalence of daily smoking and baseline status of the outcome)
25
Table 7 - Prevalence Odds Ratios of effectiveness of interventions, compared to controls (POR=1), stratified by gender
All Boys Girls
Control Intervention Control Intervention Control Intervention n/N* n/N* POR (95%CI) n/N* n/N* POR (95%CI) n/N* n/N* POR (95%CI)
ALO smoking 605/2968 496/2979 0.88 (0.71-1.08) 304/1509 220/1563 0.88 (0.66-1.18) 300/1453 276/1412 0.86 (0.65-1.15)
Regular smoking 387/2968 297/2979 0.86 (0.67-1.10) 211/1509 126/1563 0.68 (0.50-0.93) 175/1453 171/1412 1.07 (0.74-1.55)
Daily smoking 277/2968 193/2979 0.70 (0.52-0.94) 159/1509 80/1563 0.49 (0.34-0.71) 117/1453 113/1412 0.99 (0.64-1.52)
ALO drunkenness 353/3054 253/3083 0.72 (0.58-0.90) 209/1548 136/1623 0.64 (0.49-0.85) 143/1501 117/1456 0.86 (0.63-1.18)
Regular drunkenness 120/3054 76/3083 0.69 (0.48-0.99) 80/1548 51/1623 0.68 (0.45-1.04) 39/1501 25/1456 0.66 (0.37-1.18)
ALO cannabis 225/3130 152/3150 0.77 (0.60-1.00) 161/1596 88/1668 0.62 (0.45-0.85) 63/1528 64/1478 1.05 (0.70-1.58)
Regular cannabis 137/3130 88/3150 0.76 (0.53-1.09) 106/1596 54/1668 0.60 (0.40-0.91) 30/1528 34/1478 1.17 (0.59-2.33)
ALO drugs 293/3156 222/3185 0.89 (0.69-1.15) 194/1615 115/1686 0.64 (0.48-0.86) 97/1534 107/1495 1.40 (0.95-2.04)
*. Number of users out of the total number of students answering the question at follow-up (multilevel adjusted model). PR. Prevalence Ratios (all interventions vs control) estimated using multilevel model 3 (RIGLS bin 1st order MQL with 3 levels adjusting for centre prevalence of daily smoking and baseline status of the outcome)

26
27
STUDY CO-ORDINATING GROUP
Piedmont Centre for Drug Addiction Epidemiology (OED) – Italy (Coordinator)
Fabrizio Faggiano, Roberta Siliquini, Barbara Zunino, Valeria Siliquini
Institute fur Social und Gesundeits Psycologie – Austria
Karl Bohrn
De Sleutel – Belgium
Peer Van Der Kreeft
University Mental Health Research Institute – Greece
Manina Terzidu
IFT-Nord Institute for Therapy and Health Research – Germany
Gudrum Wiborg
EDEX - Spain
Juan Carlos Melero, Tatiana Perez, Laura Varona
Centre for Tobacco Prevention, Stockholm Centre of Public Health – Sweden
M. Rosaria Galanti
European Monitoring Centre for Drugs Addiction EMCDDA – Portugal
Gregor Burkhart
”A. Avogadro” University, Department of Clinical and Experimental Medicine – Italy
Massimiliano Panella
STUDY DESIGN GROUP
Centre for Tobacco Prevention, Stockholm Centre of Public Health – Sweden (Coordinator)
M. Rosaria Galanti
Piedmont Centre for Drug Addiction Epidemiology (OED) – Italy
Fabrizio Faggiano
Institute fur Social und Gesundeits Psycologie – Austria
Karl Bohrn
University Mental Health Research Institute – Greece
Clive Richardson

28
INTERVENTION PLANNING GROUP
De Sleutel – Belgium (Coordinator)
Peer Van Der Kreeft, Erwin Coppens
Centre for Tobacco Prevention, Stockholm Centre of Public Health – Sweden
Anne-Marie Lindahl
Piedmont Centre for Drug Addiction Epidemiology (OED) – Italy
Roberta Siliquini, Laura Vitale
Institute fur Social und Gesundeits Psycologie – Austria
Karl Bohrn
University Mental Health Research Institute and Thessaloniki Centre – Greece
Vicky Yosidi, Maro Vassara
IFT-Nord Institute for Therapy and Health Research – Germany
Gudrum Wiborg
EDEX – Spain
Juan Carlos Melero, Tatiana Pérez
European Monitoring Centre for Drugs Addiction EMCDDA – Portugal
Gregor Burkhart
”A. Avogadro” University, Department of Clinical and Experimental Medicine – Italy
Massimiliano Panella, Samuela Bighiani
University of L’Aquila, Department of Internal Medicine and Public Health
Leila Fabiani, Maria Scatigna
DATA MANAGEMENT ANALYSIS HAS BEEN CONDUCTED BY
”A. Avogadro” University, Department of Clinical and Experimental Medicine – Italy
Fabrizio Faggiano
Piedmont Centre for Drug Addiction Epidemiology (OED) – Italy
Gianluca Cuomo, Federica Vigna Taglianti
University of Turin, Department of Public Health – Italy
Dario Gregori
Centre for Tobacco Prevention, Stockholm Centre of Public Health – Sweden
M. Rosaria Galanti

29

30


ISG