results of tourism activity - goben).pdf · results of tourism activity mexico, february 2016 ......
TRANSCRIPT
Results of Tourism
Activity
Mexico, February 2016
Undersecretariat of Planning and
Tourism Policy
Reporting Date: April 12, 2016
Ruinas Nío Guasave, Sinaloa. Hospicio Cabañas, Guadalajara, Jalisco.
Calles de Mazatlán, Sinaloa.
Casa de Sierra Nevada, San Miguel de
Allende, Guanajuato.

Chart 1. According to Bank of Mexico, the arrival of international visitors for the first two months of
2016 was 15.4 millions, representing an increase of 1.4 million compared to the same period of 2015*,
with a growth of 10.2%.
International visitors
1
Chart 2. The number of international tourists arriving to Mexico during the first two-months of 2016 was
5.6 million, reaching 544 thousand more than January-February 2015, an increase of 10.8%.
International tourists
* NOTE: In the charts, the
sum of monthly data may
not correspond to the
cumulative period, due to
rounding .
Source: Balance of payments, Banco de México.http://www.datatur.sectur.gob.mx/SitePages/VisitantesInternacionales.aspx
Source: Balance of payments, Banco de México.http://www.datatur.sectur.gob.mx/SitePages/VisitantesInternacionales.aspx
January-February 2015: 14.0January-February 2016: 15.4
Percent Change: 10.2%
Total (Million visitors)
January-February 2015: 5.0January-February 2016: 5.6
Percent Change: 10.8%
Total (Million tourists)
7.87.6
7.2
6.8
7.7
7.2 7.1 7.1
7.5
6.86.5
7.2
7.6
8.5
5.5
6.0
6.5
7.0
7.5
8.0
8.5
9.0
Jan Feb Mar Apr May Jun Jul Aug Sep Oct Nov Dec
Mill
ion
vis
ito
rs
Chart 1. Monthly Arrival of International Visitors2016 2015
2.92.7
2.62.5
2.8
2.5 2.52.7
3.0
2.5
2.1
2.4
2.8
3.6
1.5
1.9
2.3
2.7
3.1
3.5
3.9
Ene Feb Mar Abr May Jun Jul Ago Sep Oct Nov Dic
Mill
ion
to
uri
sts
Chart 2. Monthly Arrival of International Tourists
2016 2015

Chart 4. The tourism balance by international visitors in January-February of 2016
registered 1,795.9 million dollars, an increase of 15.3% in comparison to the same period
of 2015.
2
Foreign Currency Income by International visitors
Tourism Balance by International visitors
Chart 3. Foreign currency inflows from the arrival of international visitors was 3,296.8 million
dollars in January-February 2016, reaching an increase of 211 million dollars (6.8%) in
comparison to the same period of last year.
Source: Balance of payments, Banco de México.http://www.datatur.sectur.gob.mx/SitePages/VisitantesInternacionales.aspx
Source: Balance of payments, Banco de México.http://www.datatur.sectur.gob.mx/SitePages/VisitantesInternacionales.aspx
January-February 2015: 3,086.0
January-February 2016: 3,296.8
Percent Change: 6.8%
Total (Million dollars)
January-February 2015: 1,557.3
January-February 2016: 1,795.9
Percent Change: 15.3%
Total (Million dollars)
1,5
80
.3
1,5
05
.7
1,7
35
.8
1,5
21
.0
1,3
63
.5
1,4
69
.1
1,5
45
.9
1,2
56
.0
99
7.2
1,1
76
.6
1,3
86
.0
1,9
20
.0
1,6
84
.0
1,6
12
.8
700
900
1,100
1,300
1,500
1,700
1,900
2,100
Jan Feb Mar Apr May Jun Jul Aug Sep Oct Nov Dec
Mill
on
do
llars
Chart 3. Monthly Income of Foreign Currency to Mexico from International visitors 2015 2016
721
836
1,007
657
522
681
647
327
223
319
481
937
845
951
100 200 300 400 500 600 700 800 900 1,000 1,100
Jan
Feb
Mar
Apr
May
Jun
Jul
Aug
Sep
Oct
Nov
Dec
Million dollars
Chart 4. Monthly Result of Tourism Balance from International visitors
2016
2015

Chart 5. Foreign currency income from international tourists in January-February of 2016
registered 2,962.5 million dollars, which represents an increase of 203 million of dollars
(7.3%) to the same period of 2015.
Chart 6. The tourism balance by international tourists in January-February of 2016
showed a positive result of 1,956.3 million dollars, equivalent to an increase of 13.0% in
comparison to the same period of 2015.
3
Foreign Currency Income by International tourists
Tourism Balance by International tourists
Source: Balance of payments, Banco de México.http://www.datatur.sectur.gob.mx/SitePages/VisitantesInternacionales.aspx
Source: Balance of payments, Banco de México.http://www.datatur.sectur.gob.mx/SitePages/VisitantesInternacionales.aspx
January-February 2015: 2,759.6
January-February 2016: 2,962.5
Percent Change: 7.3%
Total (Million dollars)
January-February 2015: 1,731.0
January-February 2016: 1,956.3
Percent Change: 13.0%
Total (Million dollars)
1,4
11
.4
1,3
48
.3
1,5
56
.2
1,3
53
.1
1,2
08
.6
1,3
17
.0
1,3
88
.6
1,1
09
.7
85
2.7
1,0
14
.0
1,2
22
.7
1,7
45
.2
1,5
18
.3
1,4
44
.1
700
900
1,100
1,300
1,500
1,700
1,900
Jan Feb Mar Apr May Jun Jul Aug Sep Oct Nov Dec
Mill
on
do
llars
Chart 5. Montly Income of Foreing Currency to Mexico from International Tourists 2015 2016
809
922
1,099
745
639
793
741
415
311
407
574
1,045
932
1,024
100 200 300 400 500 600 700 800 900 1,000 1,100
Jan
Feb
Mar
Apr
May
Jun
Jul
Aug
Sep
Oct
Nov
Dec
Million dollars
Chart 6. Monthly Result of Tourism Balance from International Tourists
2016
2015
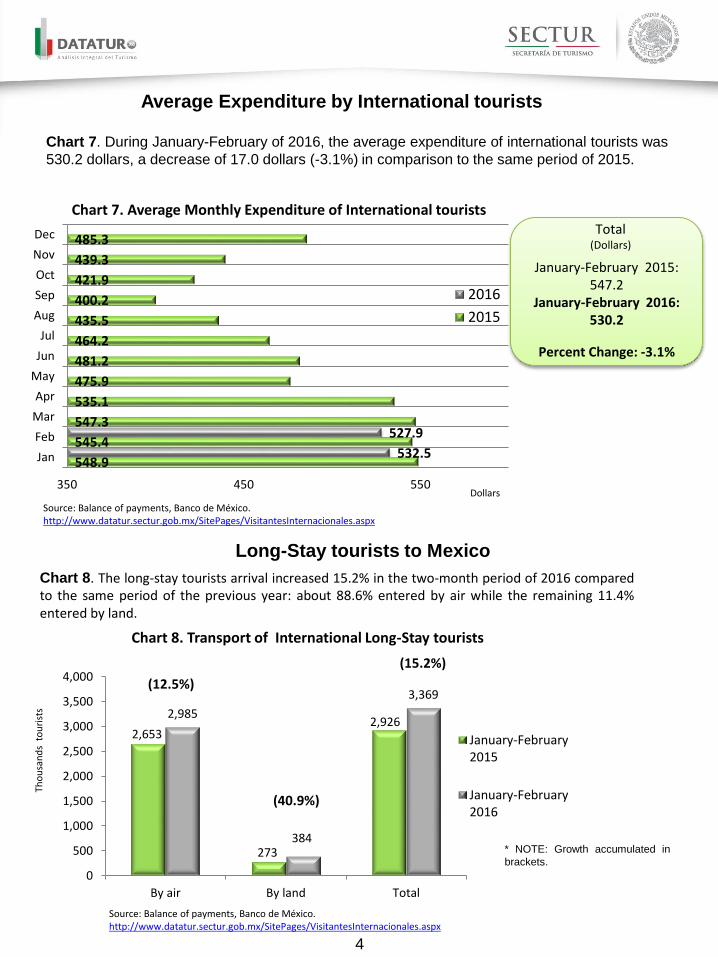
Chart 7. During January-February of 2016, the average expenditure of international tourists was
530.2 dollars, a decrease of 17.0 dollars (-3.1%) in comparison to the same period of 2015.
Chart 8. The long-stay tourists arrival increased 15.2% in the two-month period of 2016 comparedto the same period of the previous year: about 88.6% entered by air while the remaining 11.4%entered by land.
Long-Stay tourists to Mexico
4
Average Expenditure by International tourists
Source: Balance of payments, Banco de México.http://www.datatur.sectur.gob.mx/SitePages/VisitantesInternacionales.aspx
Source: Balance of payments, Banco de México.http://www.datatur.sectur.gob.mx/SitePages/VisitantesInternacionales.aspx
January-February 2015: 547.2
January-February 2016: 530.2
Percent Change: -3.1%
Total (Dollars)
* NOTE: Growth accumulated in
brackets.
548.9
545.4
547.3
535.1
475.9
481.2
464.2
435.5
400.2
421.9
439.3
485.3
532.5
527.9
350 450 550
Jan
Feb
Mar
Apr
May
Jun
Jul
Aug
Sep
Oct
Nov
Dec
Dollars
Chart 7. Average Monthly Expenditure of International tourists
2016
2015
2,653
273
2,9262,985
384
3,369
0
500
1,000
1,500
2,000
2,500
3,000
3,500
4,000
By air By land Total
Tho
usa
nd
s to
uri
sts
Chart 8. Transport of International Long-Stay tourists
January-February2015
January-February2016
(12.5%)
(40.9%)
(15.2%)

Chart 9. For the same
period, the most
meaningful expenditure of
long-stay tourists was
made by those arriving by
air, totaling 2,699.1
million dollars, this means
94.9% of all long-stay
tourists’ expenditure.
Chart 10. The average expenditure of long-stay tourists was 844.1 dollars in the first two
months of 2016, a decrease of 58 dollars (-6.4%) compared to the same period of 2015.
5
Expenditure of Long-Stay tourists
Average Expenditure of Long-Stay tourists
Source: Balance of payments, Banco de México.http://www.datatur.sectur.gob.mx/SitePages/VisitantesInternacionales.aspx
Source: Balance of payments, Banco de México.http://www.datatur.sectur.gob.mx/SitePages/VisitantesInternacionales.aspx
* NOTE: The total
amount in brackets.
January-February 2015: 901.9
January-February 2016: 844.1
Percent Change: -6.4%
Total (Dollars)
By Air(2,699.1 mdd)
94.9
By Land (144.8 mdd)
5.1%
Chart 9. Distribution of International Long-Stay Tourists' Expense during January-February 2016
91
0.5
89
3.0
87
1.6
90
2.9
83
7.1
77
9.6
76
2.7
75
7.7
74
3.9
73
4.7
74
8.7
72
1.7
86
0.1
82
7.9
700
750
800
850
900
950
Jan Feb Mar Apr May Jun Jul Aug Sep Oct Nov Dec
Do
llars
Gráfica 10. Average Monthly Expenditure of Long-Stay Tourists

Chart 12. For the same
period, the most
meaningful expenditure of
border tourists was made
by those travelling by
automobile, totaling 102.3
million dollars which
represented 86.2% of all
border tourists.
Chart 11. The border tourists arrivals increased 4.7% during January-February of 2016
compared to the same period last year; 82.0% entered by automobile while the remaining
18.0% were pedestrians*.
6
Border tourists to México
Expenditure of Border tourists
Source: Balance of payments, Banco de México.http://www.datatur.sectur.gob.mx/SitePages/VisitantesInternacionales.aspx
Source: Balance of payments, Banco de México.http://www.datatur.sectur.gob.mx/SitePages/VisitantesInternacionales.aspx
* NOTE: Growth accumulated in
brackets ().
* NOTE: The total
amount in brackets ().
357
1,760
2,118
399
1,820
2,218
0
500
1,000
1,500
2,000
2,500
Pedestrians Automobiles Total
Tho
usa
nd
s to
uri
sts
Chart 11. Transport of International Border Tourists
January-February 2015
January-February 2016
(14.6%)
(4.9%)
(6.5%)
Automobiles (102.3 mdd)
86.2%
Pedestrians(16.4 mdd)
13.8
Chart 12. Distribution of International Border Tourists' Expense during January-February 2016

7
Chart 13. The average expenditure of border tourists decreased 6.5% in January-February
of 2016 in comparison to the same month of previous year.
Chart 14. In January-February
of 2016, the arrival of foreign
air-coming visitors who reside in
the United States, representing
54.2% of all foreign arrivals by
air.
From Latin America and the
Caribbean region, the country of
residence with the highest
number of foreign arrivals into
México was Argentina with
73,999 visitors, with an
increase of 45.0%.
Average Expenditure of Border tourists
Foreign Visitors by air (main countries of residence)
Chart 14. Participation of Foreign Visitors by Air and
Country of Residence, January-February 2016
Source: Migration Policy Unit, SEGOB.http://www.datatur.sectur.gob.mx/SitePages/Visitantes%20Por%20Nacionalidad.aspx
Source: Balance of payments, Banco de México.http://www.datatur.sectur.gob.mx/SitePages/VisitantesInternacionales.aspx
Note: Figures refers to events because the sameperson may have entered the country in morethan one occasion. "Other" includes theremaining countries, the "unspecified" and the"Foreigners with residence in Mexico".
January-February 2015: 57.2
January-February 2016: 53.5
Percent Change: -6.5%
Total (Dollars)
54.2%
18.6%
2.6%2.1%
1.7%
20.8%
U.S.
Canada
Argentina
United Kingdom
Colombia
Other
56
.5
58
.0
57
.9
60
.9
62
.2
61
.1
55
.3
54
.1
58
.1
55
.4
53
.2
56
.154
.4
52
.5
45
50
55
60
65
70
Jan Feb Mar Apr May Jun Jul Aug Sep Oct Nov Dec
Do
llars
Gráfica 13. Average Monthly Expenditure of Border Turists
2015 2016

Chart 15. The American residents who arrived by air to Mexico increased 15.6% in January-
February of 2016 in comparison to the same period of 2015, accumulating 1.5 million
passengers who arrived mainly by Cancun Airport, followed by Los Cabos Airport.
Chart 16. The Canadian residents who arrived by air to México were 1.5% higher during
January-February of 2016 in comparison with the same period of 2015, exceeding 7.9
thousand passengers who arrived mainly by Cancun Airport, followed by Puerto Vallarta
Airport.
8
Foreign passengers arriving by Air (American)
Foreign passengers arriving by Air (Canadian)
Source: Migration Policy Unit, SEGOB.http://www.datatur.sectur.gob.mx/SitePages/Visitantes%20Por%20Nacionalidad.aspx
Source: Migration Policy Unit, SEGOB.http://www.datatur.sectur.gob.mx/SitePages/Visitantes%20Por%20Nacionalidad.aspx
Total of American passengers
January-February 2015: 1,352,192January-February 2016: 1,563,151
Percent Change: 15.6%
Total of Canadian passengers
January-February 2015: 529,291January-February 2016: 537,237
Percent Change: 1.5%
58
5,3
10
15
9,1
75
16
1,8
42
16
5,1
30
91
,00
7
18
9,7
28
65
4,3
88
20
2,9
73
20
2,3
91
19
6,2
11
11
2,6
15
19
4,5
73
0
100,000
200,000
300,000
400,000
500,000
600,000
700,000
Cancún, Q. Roo Los Cabos, B.C.S. Ciudad de México(AICM)
Puerto Vallarta,Jal.
Guadalajara, Jal. Others
Pas
sen
gers
Chart 15. American Residents by Airport
2015 2016
27
8,8
41
11
6,4
20
36
,58
4
21
,25
9
16
,30
5
59
,88
2
26
9,0
28
11
6,8
93
39
,22
6
29
,74
5
20
,44
4
61
,90
1
0
50,000
100,000
150,000
200,000
250,000
300,000
Cancún, Q. Roo Puerto Vallarta,Jal.
Los Cabos, B.C.S. Ciudad deMéxico (AICM)
Huatulco, Oax. Others
Pas
sen
gers
Chart 16. Canadian Residents per Airport
2015 2016
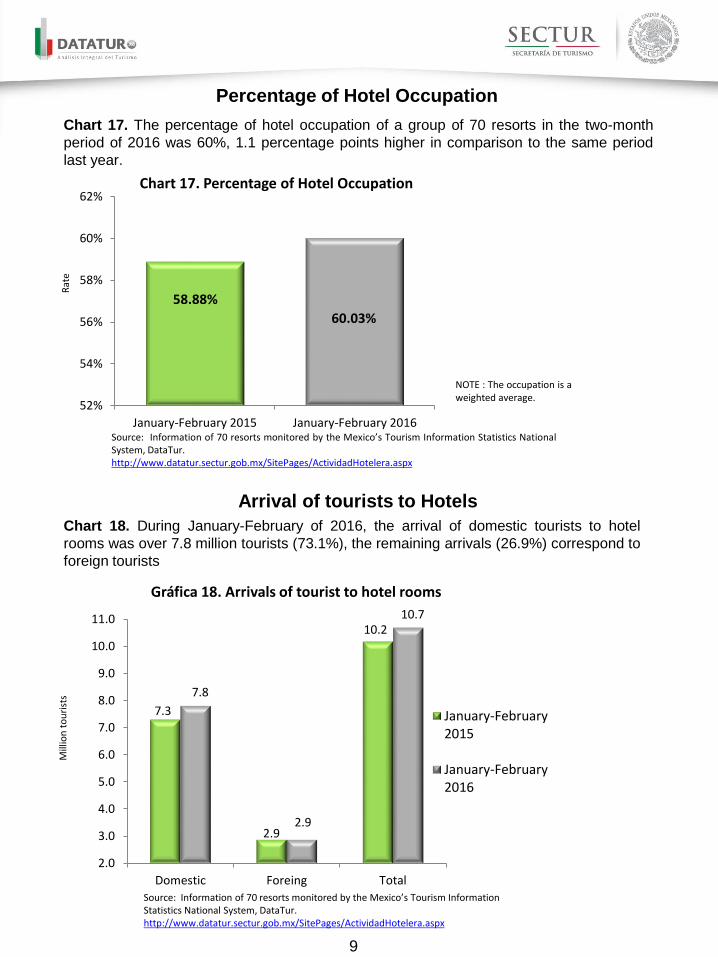
Percentage of Hotel Occupation
Chart 17. The percentage of hotel occupation of a group of 70 resorts in the two-month
period of 2016 was 60%, 1.1 percentage points higher in comparison to the same period
last year.
NOTE : The occupation is aweighted average.
9
Arrival of tourists to Hotels
Chart 18. During January-February of 2016, the arrival of domestic tourists to hotel
rooms was over 7.8 million tourists (73.1%), the remaining arrivals (26.9%) correspond to
foreign tourists
Source: Information of 70 resorts monitored by the Mexico’s Tourism InformationStatistics National System, DataTur.http://www.datatur.sectur.gob.mx/SitePages/ActividadHotelera.aspx
Source: Information of 70 resorts monitored by the Mexico’s Tourism Information Statistics NationalSystem, DataTur.http://www.datatur.sectur.gob.mx/SitePages/ActividadHotelera.aspx
58.88%
60.03%
52%
54%
56%
58%
60%
62%
January-February 2015 January-February 2016
Rat
e
Chart 17. Percentage of Hotel Occupation
7.3
2.9
10.2
7.8
2.9
10.7
2.0
3.0
4.0
5.0
6.0
7.0
8.0
9.0
10.0
11.0
Domestic Foreing Total
Mill
ion
to
uri
sts
Gráfica 18. Arrivals of tourist to hotel rooms
January-February2015
January-February2016
10
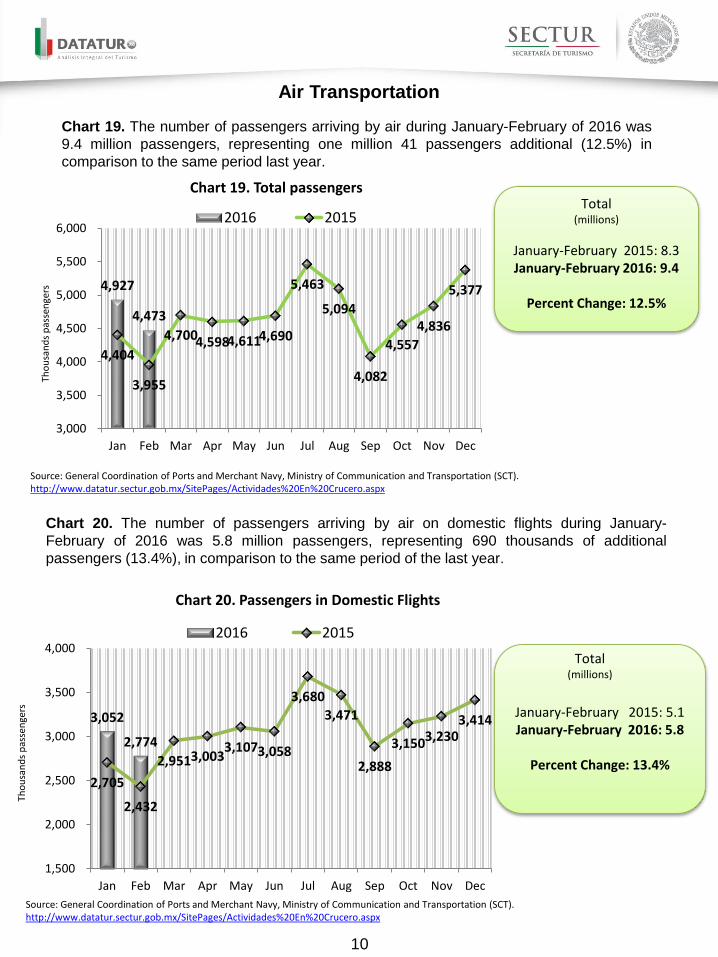
Air Transportation
Chart 19. The number of passengers arriving by air during January-February of 2016 was
9.4 million passengers, representing one million 41 passengers additional (12.5%) in
comparison to the same period last year.
Chart 20. The number of passengers arriving by air on domestic flights during January-
February of 2016 was 5.8 million passengers, representing 690 thousands of additional
passengers (13.4%), in comparison to the same period of the last year.
Source: General Coordination of Ports and Merchant Navy, Ministry of Communication and Transportation (SCT).http://www.datatur.sectur.gob.mx/SitePages/Actividades%20En%20Crucero.aspx
Source: General Coordination of Ports and Merchant Navy, Ministry of Communication and Transportation (SCT).http://www.datatur.sectur.gob.mx/SitePages/Actividades%20En%20Crucero.aspx
January-February 2015: 8.3January-February 2016: 9.4
Percent Change: 12.5%
Total (millions)
January-February 2015: 5.1January-February 2016: 5.8
Percent Change: 13.4%
Total (millions)
4,927
4,473
4,404
3,955
4,7004,5984,6114,690
5,463
5,094
4,082
4,557
4,836
5,377
3,000
3,500
4,000
4,500
5,000
5,500
6,000
Jan Feb Mar Apr May Jun Jul Aug Sep Oct Nov Dec
Tho
usa
nd
s p
asse
nge
rs
Chart 19. Total passengers
2016 2015
3,052
2,774
2,705
2,432
2,9513,0033,1073,058
3,680
3,471
2,888
3,1503,2303,414
1,500
2,000
2,500
3,000
3,500
4,000
Jan Feb Mar Apr May Jun Jul Aug Sep Oct Nov Dec
Tho
usa
nd
sp
asse
nge
rs
Chart 20. Passengers in Domestic Flights
2016 2015

11
Chart 21. In January-February of 2016, the number of passengers arriving by air on
international flights increased 10.9%, with 3.6 million passengers, exceeding for 351
thousands passengers the amount of January-February of 2015.
Preliminary figures.Source: Airports and Auxiliary Services.http://www.datatur.sectur.gob.mx/SitePages/TrasnAerea.aspx
January–February 2015: 3.2
January-February 2016: 3.6
Percent Change: 10.9%
Total (millions)
1,874
1,699
1,699
1,523
1,749
1,5951,505
1,632
1,782
1,623
1,194
1,408
1,607
1,962
900
1,150
1,400
1,650
1,900
Jan Feb Mar Apr May Jun Jul Aug Sep Oct Nov Dec
Tho
usa
nd
s p
asse
nge
rs
Chart 21. Passengers on International Flights
2016 2015

12
Main airports
Figure 1. In January-February 2016 the airports with the highest number of foreign passengers
were: Cancún (1,279,189), Ciudad de México (586,288), Puerto Vallarta (324,618), Los Cabos
(248,592) and Guadalajara (125,996); which represents 88.9% of all foreign passengers.
Source: Migration Policy Unit, SEGOB.http://www.datatur.sectur.gob.mx/SitePages/Visitantes%20Por%20Nacionalidad.aspx
Note: Figures refers to events because the same person may have entered the country in more than one occasion. From this date only the residenceof international passengers is considered and the nationality of the passengers is not longer used.
Airports on Jalisco StateInternational Passengers
January-February
2015 2016 var %
Puerto Vallarta 294,185 324,618 10.3%
Guadalajara 101,720 125,996 23.9%
Airport on Mexico CityInternational Passengers
January-February
2015 2016 var %
Cd. México 492,854 586,288 19.0%
Airport on Quintana Roo StateInternational Passengers
January-February
2015 2016 var %
Cancún 1,206,408 1,279,189 6.0%
Airport on Baja California Sur StateInternational Passengers
January-February
Los 2015 2016 var %
Cabos 201,906 248,592 23.1%

January-February 2015: 1,257.0
January-February 2016: 1,220.3
Percent Change: -2.9%
Total (Thousand passengers)
13
Maritime transportation
Chart 22. During January-February of 2016, the number of cruise passengers was 1.2 million
passengers; this is a decrease of 2.9% in comparison to the same period of last year, reaching
1,220,344 passengers.
Chart 23. The number of cruise’s arrivals in January-February of 2016 decreased by 11,
reaching 484, a decrease of 2.1% with respect to the same period of previous year.
Source: General Coordination of Ports and Merchant Navy, Ministry of Communication and Transportation (SCT).http://www.datatur.sectur.gob.mx/SitePages/Actividades%20En%20Crucero.aspx
Source: General Coordination of Ports and Merchant Navy, Ministry of Communication and Transportation (SCT).http://www.datatur.sectur.gob.mx/SitePages/Actividades%20En%20Crucero.aspx
January-February2015: 495
January-February2016: 484
Percent Change: -2.1%
Total (Arrivals)
61
3
60
8
669
588 643
604
341 330 343 344 328
442
568
720
-
100
200
300
400
500
600
700
800
Jan Feb Mar Apr May Jun Jul Aug Sep Oct Nov Dec
Tho
usa
nd
sp
asse
nge
rs
Chart 22. Monthly Arrival of Passengers by Cruise
2016 2015
24
2
24
2
266
229 240 229
125 106 106 105 115
171
210
273
-
50
100
150
200
250
300
Jan Feb Mar Apr May Jun Jul Aug Sep Oct Nov Dec
Arr
ival
s
Chart 23. Monthly Cruise's Arrivals
2016 2015

14
Main ports
Figure 2. In January-February of 2016 the ports that received the highest number of passengers
were the following: Cozumel, Majahual and Ensenada; representing 76.0% of total arrivals in the
two months. On the other hand, according to Banco de México, foreign currency income from
cruise visitors contributed with 2.6% of the total income.
Source: General Coordination of Ports and Merchant Navy, Ministry of Communication and Transportation (SCT).http://www.datatur.sectur.gob.mx/SitePages/Actividades%20En%20Crucero.aspx
EnsenadaJanuary-February
2015 2016 var %
Passengers 116,388 105,613 -9.3%
Arrivals 50 42 -16.0%
CozumelJanuary-February
2015 2016 var %
Passengers 729,867 696,095 -4.6%
Arrivals 255 238 -6.7%
MajahualJanuary-February
2015 2016 var %
Passengers 158,417 126,220 -20.3%
Arrivals 66 54 -18.2%
Puerto VallartaJanuary-February
2015 2016 var %
Passengers 59,491 66,440 11.7%
Arrivals 24 27 12.5%
Cabo San LucasJanuary-February
2015 2016 var %
Passengers 66,808 75,746 13.4%
Arrivals 29 32 10.3%
15
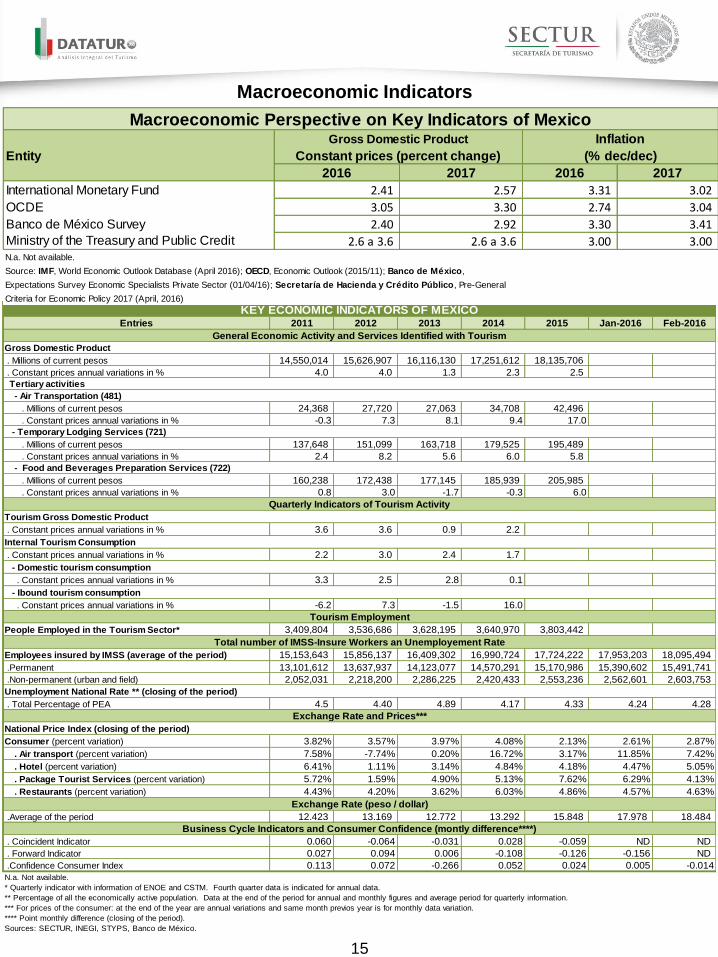
Macroeconomic Indicators
2011 2012 2013 2014 2015 Jan-2016 Feb-2016
Gross Domestic Product
. Millions of current pesos 14,550,014 15,626,907 16,116,130 17,251,612 18,135,706
. Constant prices annual variations in % 4.0 4.0 1.3 2.3 2.5
Tertiary activities
- Air Transportation (481)
. Millions of current pesos 24,368 27,720 27,063 34,708 42,496
. Constant prices annual variations in % -0.3 7.3 8.1 9.4 17.0
- Temporary Lodging Services (721)
. Millions of current pesos 137,648 151,099 163,718 179,525 195,489
. Constant prices annual variations in % 2.4 8.2 5.6 6.0 5.8
- Food and Beverages Preparation Services (722)
. Millions of current pesos 160,238 172,438 177,145 185,939 205,985
. Constant prices annual variations in % 0.8 3.0 -1.7 -0.3 6.0
Tourism Gross Domestic Product
. Constant prices annual variations in % 3.6 3.6 0.9 2.2
Internal Tourism Consumption
. Constant prices annual variations in % 2.2 3.0 2.4 1.7
- Domestic tourism consumption
. Constant prices annual variations in % 3.3 2.5 2.8 0.1
- Ibound tourism consumption
. Constant prices annual variations in % -6.2 7.3 -1.5 16.0
People Employed in the Tourism Sector* 3,409,804 3,536,686 3,628,195 3,640,970 3,803,442
Employees insured by IMSS (average of the period) 15,153,643 15,856,137 16,409,302 16,990,724 17,724,222 17,953,203 18,095,494
.Permanent 13,101,612 13,637,937 14,123,077 14,570,291 15,170,986 15,390,602 15,491,741
.Non-permanent (urban and field) 2,052,031 2,218,200 2,286,225 2,420,433 2,553,236 2,562,601 2,603,753
Unemployment National Rate ** (closing of the period)
. Total Percentage of PEA 4.5 4.40 4.89 4.17 4.33 4.24 4.28
National Price Index (closing of the period)
Consumer (percent variation) 3.82% 3.57% 3.97% 4.08% 2.13% 2.61% 2.87%
. Air transport (percent variation) 7.58% -7.74% 0.20% 16.72% 3.17% 11.85% 7.42%
. Hotel (percent variation) 6.41% 1.11% 3.14% 4.84% 4.18% 4.47% 5.05%
. Package Tourist Services (percent variation) 5.72% 1.59% 4.90% 5.13% 7.62% 6.29% 4.13%
. Restaurants (percent variation) 4.43% 4.20% 3.62% 6.03% 4.86% 4.57% 4.63%
.Average of the period 12.423 13.169 12.772 13.292 15.848 17.978 18.484
. Coincident Indicator 0.060 -0.064 -0.031 0.028 -0.059 ND ND
. Forward Indicator 0.027 0.094 0.006 -0.108 -0.126 -0.156 ND
.Confidence Consumer Index 0.113 0.072 -0.266 0.052 0.024 0.005 -0.014
N.a. Not available.
* Quarterly indicator with information of ENOE and CSTM. Fourth quarter data is indicated for annual data.
** Percentage of all the economically active population. Data at the end of the period for annual and monthly figures and average period for quarterly information.
*** For prices of the consumer: at the end of the year are annual variations and same month previos year is for monthly data variation.
**** Point monthly difference (closing of the period).
Sources: SECTUR, INEGI, STYPS, Banco de México.
Entries
KEY ECONOMIC INDICATORS OF MEXICO
Business Cycle Indicators and Consumer Confidence (montly difference****)
General Economic Activity and Services Identified with Tourism
Quarterly Indicators of Tourism Activity
Tourism Employment
Total number of IMSS-Insure Workers an Unemployement Rate
Exchange Rate and Prices***
Exchange Rate (peso / dollar)
Entity
2016 2017 2016 2017
International Monetary Fund 2.41 2.57 3.31 3.02
OCDE 3.05 3.30 2.74 3.04
Banco de México Survey 2.40 2.92 3.30 3.41 Ministry of the Treasury and Public Credit 2.6 a 3.6 2.6 a 3.6 3.00 3.00 N.a. Not available.
Source: IMF, World Economic Outlook Database (April 2016); OECD, Economic Outlook (2015/11); Banco de México,
Expectations Survey Economic Specialists Private Sector (01/04/16); Secretaría de Hacienda y Crédito Público, Pre-General
Criteria for Economic Policy 2017 (April, 2016)
Macroeconomic Perspective on Key Indicators of MexicoGross Domestic Product Inflation
Constant prices (percent change) (% dec/dec)