results presentation for personal use only
TRANSCRIPT
Commonwealth Bank of Australia ACN 123 123 124
Results Presentation For the half year ended 31 December 2009
10 February 2010
Results Presentation FOR THE FULL YEAR ENDED 30 JUNE 2012
Ian Narev Chief Executive Officer
David Craig Chief Financial Officer
15 AUGUST 2012 | COMMONWEALTH BANK OF AUSTRALIA | ACN 123 123 124
For
per
sona
l use
onl
y

2
Notes
Disclaimer
The material that follows is a presentation of general background information about the Group’s activities
current at the date of the presentation, 15 August 2012. It is information given in summary form and does
not purport to be complete. It is not intended to be relied upon as advice to investors or potential investors
and does not take into account the investment objectives, financial situation or needs of any particular
investor. These should be considered, with or without professional advice when deciding if an investment
is appropriate.
Cash Profit
The Management Discussion and Analysis discloses the net profit after tax on both a ‘Statutory basis’ and
a ‘Cash basis’. The Statutory basis is prepared in accordance with the Corporations Act 2001 and the
Australian Accounting Standards, which comply with International Financial Reporting Standards
(IFRS). The Cash basis is used by management to present a clear view of the Group’s underlying
operating results, excluding a number of items that introduce volatility and/ or one off distortions of the
Group’s current period performance. These items, such as hedging and IFRS volatility, are calculated
consistently year on year and do not discriminate between positive and negative adjustments. A list of
items excluded from statutory profit is provided in the reconciliation of the Net profit after tax (“Cash
basis”) on page 3 of the Profit Announcement (PA) and described in greater detail on page 11 of the PA
and can be accessed at our website http://www.commbank.com.au/about-us/shareholders/financial-
information/results/
For
per
sona
l use
onl
y

3
Agenda
Ian Narev, CEO – Company Update
David Craig, CFO – Financial Overview
Ian Narev, CEO – Summary and Outlook
Questions and Answers For
per
sona
l use
onl
y

4
Notes
For
per
sona
l use
onl
y
5
Jun 12 vs
Jun 11
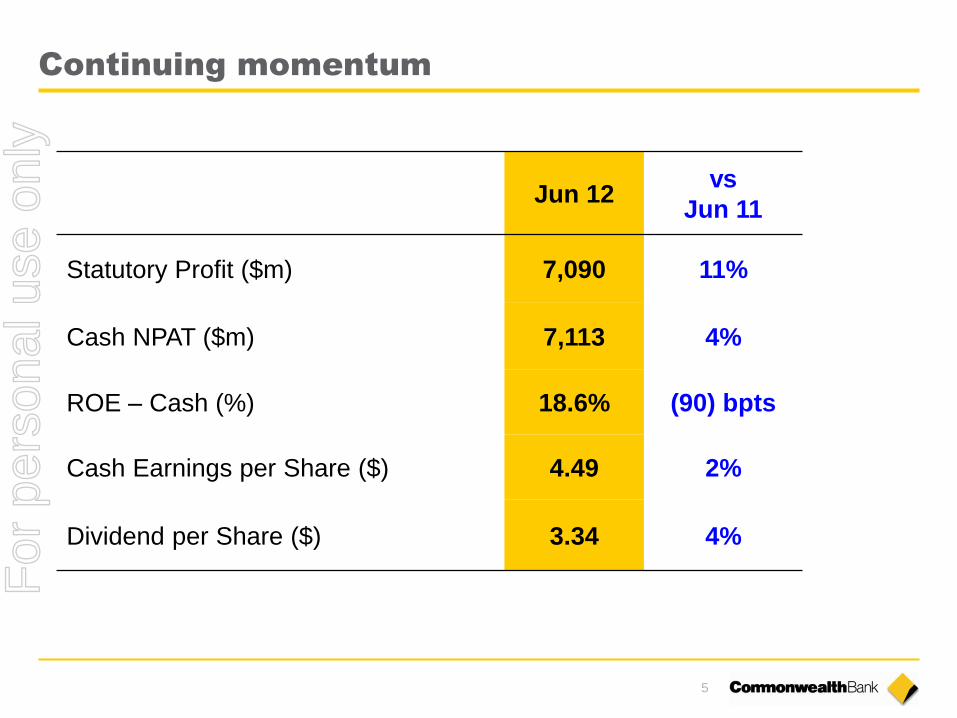
Statutory Profit ($m) 7,090 11%
Cash NPAT ($m) 7,113 4%
ROE – Cash (%) 18.6% (90) bpts
Cash Earnings per Share ($) 4.49 2%
Dividend per Share ($) 3.34 4%
Continuing momentum
For
per
sona
l use
onl
y
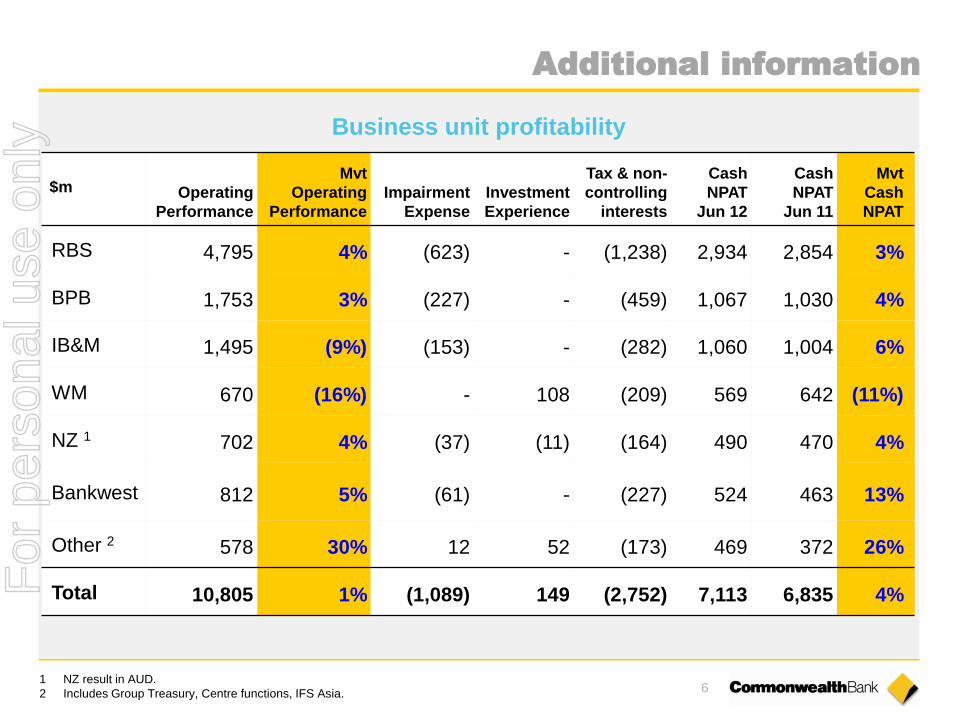
6 1 NZ result in AUD.
2 Includes Group Treasury, Centre functions, IFS Asia.
Additional information
Business unit profitability
$m Operating
Performance
Mvt
Operating
Performance
Impairment
Expense
Investment
Experience
Tax & non-
controlling
interests
Cash
NPAT
Jun 12
Cash
NPAT
Jun 11
Mvt
Cash
NPAT
RBS 4,795 4% (623) - (1,238) 2,934 2,854 3%
BPB 1,753 3% (227) - (459) 1,067 1,030 4%
IB&M 1,495 (9%) (153) - (282) 1,060 1,004 6%
WM 670 (16%) - 108 (209) 569 642 (11%)
NZ 1 702 4% (37) (11) (164) 490 470 4%
Bankwest 812 5% (61) - (227) 524 463 13%
Other 2 578 30% 12 52 (173) 469 372 26%
Total 10,805 1% (1,089) 149 (2,752) 7,113 6,835 4% For
per
sona
l use
onl
y
7
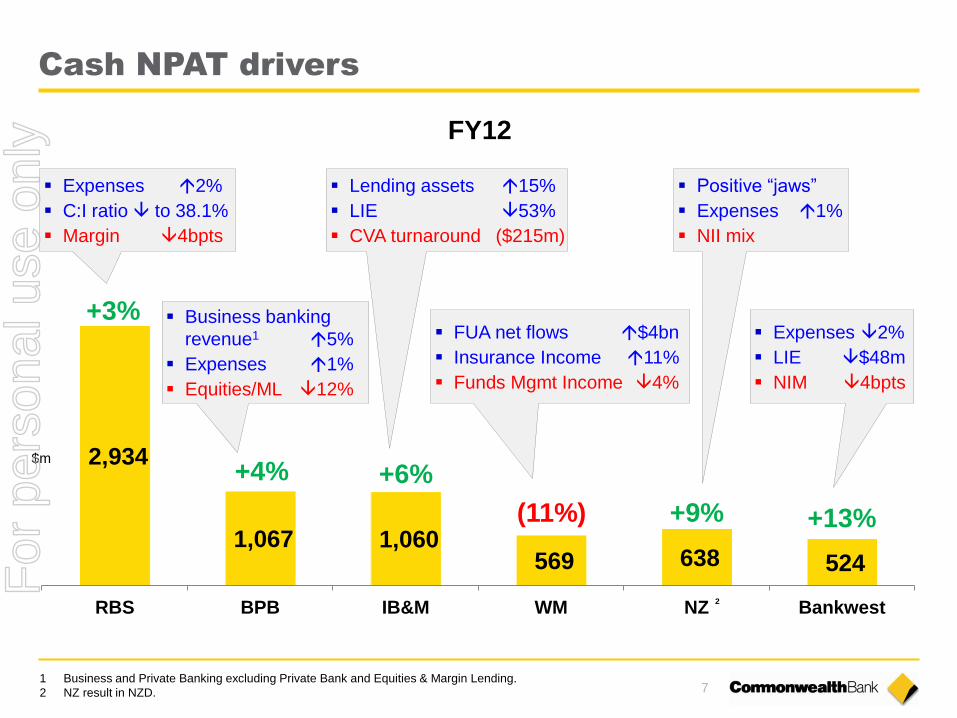
2,934
1,067 1,060 569 638 524
RBS BPB IB&M WM NZ Bankwest
+9%
Cash NPAT drivers
1 Business and Private Banking excluding Private Bank and Equities & Margin Lending.
2 NZ result in NZD.
Expenses 2%
C:I ratio to 38.1%
Margin 4bpts
Lending assets 15%
LIE 53%
CVA turnaround ($215m)
+3%
+4%
(11%) +13%
+6%
Business banking
revenue1 5%
Expenses 1%
Equities/ML 12%
Expenses 2%
LIE $48m
NIM 4bpts
Positive “jaws”
Expenses 1%
NII mix
FUA net flows $4bn
Insurance Income 11%
Funds Mgmt Income 4%
2
FY12
$m
For
per
sona
l use
onl
y

8
Notes
For
per
sona
l use
onl
y
9
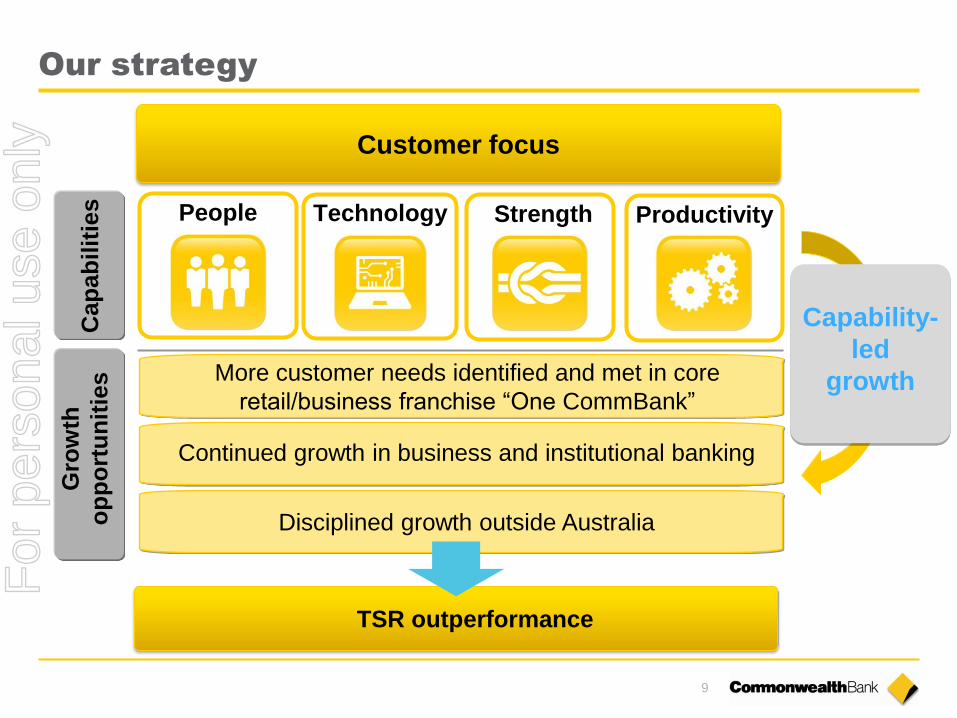
Our strategy G
row
th
op
po
rtu
nit
ies
Customer focus
Continued growth in business and institutional banking
Cap
ab
ilit
ies
Capability-
led
growth More customer needs identified and met in core
retail/business franchise “One CommBank”
Disciplined growth outside Australia
TSR outperformance
People Strength Technology Productivity
For
per
sona
l use
onl
y

10
#1 Online
banking
#1 In the youth
segment
>40% of all payment
transactions
#1 itunes
app*
#1 Social &
1st Real-time
banking
4.25m active online
customers
>2.0m customers on
mobile
#1 Contactless
acceptance points
MFI for
1 in 3 Australians
460k
Kaching
downloads
#1 Contactless (7m PayPass
enabled cards)
Additional information
Australia’s leading technology bank
* CommBank Kaching. Finance category as at 13 August 2012.
For
per
sona
l use
onl
y
11
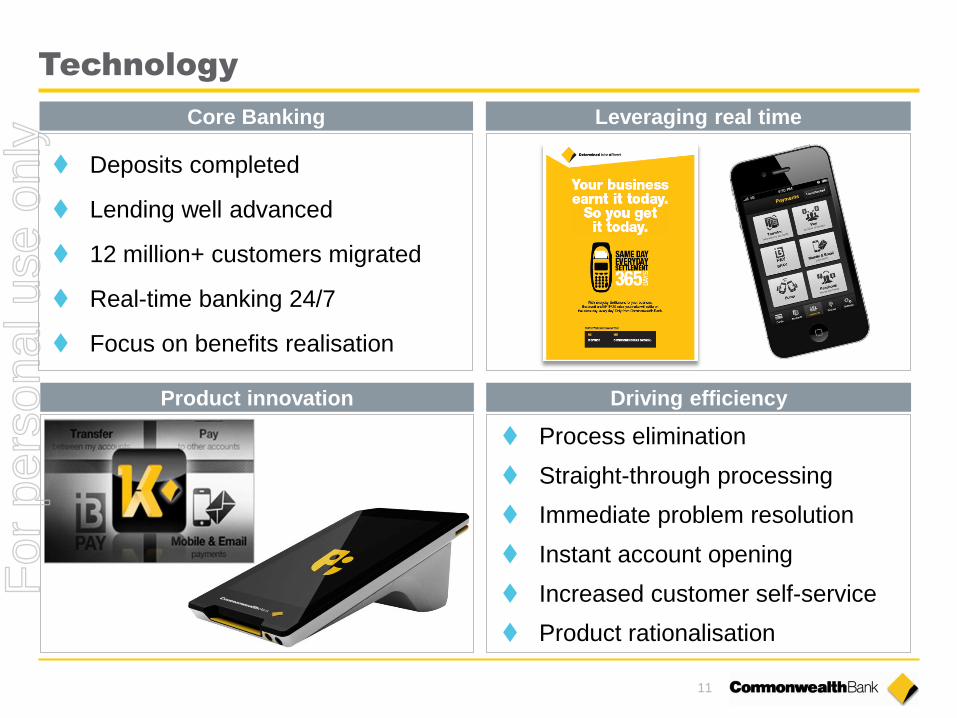
Technology
Core Banking Leveraging real time
Product innovation Driving efficiency
Deposits completed
Lending well advanced
12 million+ customers migrated
Real-time banking 24/7
Focus on benefits realisation
Process elimination
Straight-through processing
Immediate problem resolution
Instant account opening
Increased customer self-service
Product rationalisation
For
per
sona
l use
onl
y
12
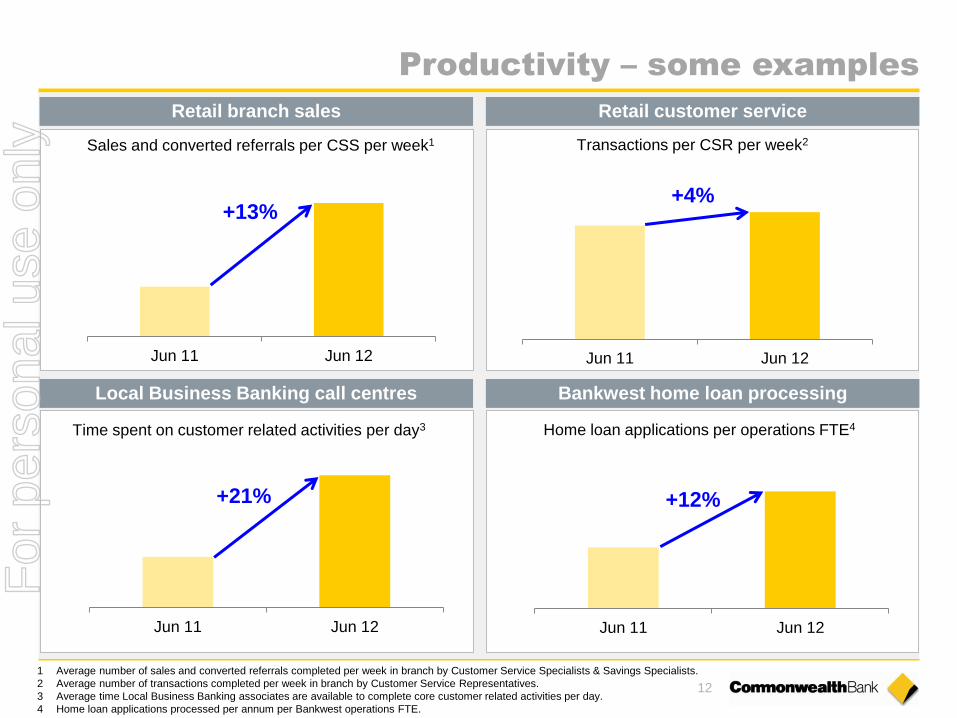
Productivity – some examples
Retail branch sales Retail customer service
Jun 11 Jun 12 Jun 11 Jun 12
Jun 11 Jun 12
Sales and converted referrals per CSS per week1
Transactions per CSR per week2
Time spent on customer related activities per day3
+13% +4%
+21%
1 Average number of sales and converted referrals completed per week in branch by Customer Service Specialists & Savings Specialists.
2 Average number of transactions completed per week in branch by Customer Service Representatives.
3 Average time Local Business Banking associates are available to complete core customer related activities per day.
4 Home loan applications processed per annum per Bankwest operations FTE.
Jun 11 Jun 12
Home loan applications per operations FTE4
+12%
Local Business Banking call centres Bankwest home loan processing
For
per
sona
l use
onl
y
13
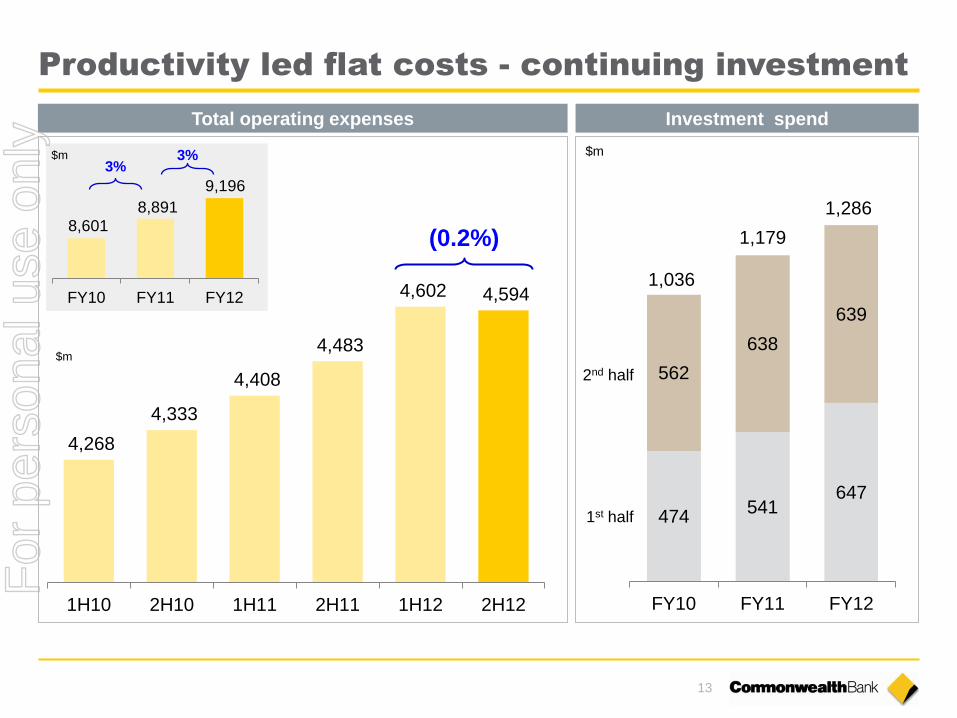
Productivity led flat costs - continuing investment
4,268
4,333
4,408
4,483
4,602 4,594
1H10 2H10 1H11 2H11 1H12 2H12
474 541
647
562
638
639
FY10 FY11 FY12
1st half
2nd half
Total operating expenses Investment spend
1,036
1,179
1,286
FY10 FY11 FY12
8,601 8,891
9,196
3% 3%
(0.2%)
$m $m
$m
For
per
sona
l use
onl
y

14
Notes
For
per
sona
l use
onl
y
15
60.0%
65.0%
70.0%
75.0%
80.0%
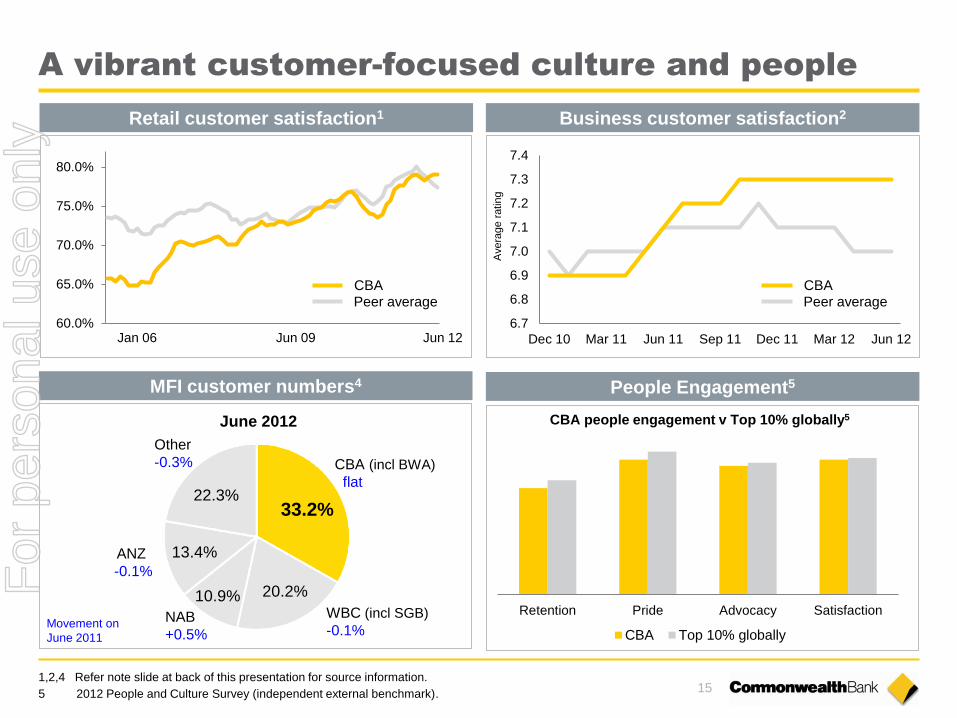
A vibrant customer-focused culture and people
Retail customer satisfaction1
Jan 06 Jun 09 Jun 12
CBA Peer average
1,2,4 Refer note slide at back of this presentation for source information.
33.2%
20.2% 10.9%
13.4%
22.3%
CBA (incl BWA)
flat
ANZ
-0.1%
Other
-0.3%
WBC (incl SGB)
-0.1% NAB
+0.5%
June 2012
Movement on
June 2011
MFI customer numbers4
5 2012 People and Culture Survey (independent external benchmark).
Business customer satisfaction2
CBA Peer average
6.7
6.8
6.9
7.0
7.1
7.2
7.3
7.4
Dec 10 Mar 11 Jun 11 Sep 11 Dec 11 Mar 12 Jun 12
Avera
ge r
atin
g
People Engagement5
Retention Pride Advocacy Satisfaction
CBA Top 10% globally
CBA people engagement v Top 10% globally5
For
per
sona
l use
onl
y

16
Cash earnings ($m) 7,113 4%
ROE (Cash) 18.6% (90) bpts
Cash EPS ($) 4.49 2%
DPS ($) 3.34 4%
Cost-to-Income (Cash) 46.0% 50 bpts
NIM (bpts) 209 (3) bpts
Retail Banking Services ($m) 4,795 4%
Business and Private Banking ($m) 1,753 3%
Institutional Banking & Markets ($m) 1,495 (9%)
Bankwest ($m) 812 5%
Wealth Management ($m) 670 (16%)
NZ (NZD $m) 914 8%
Tier 1 Capital – Basel II 10.0% -
Tier 1 – UK FSA 13.6% (0.1%)
LT Wholesale Funding WAM (yrs) 3.7 +0.1
Deposit Funding 62% +1%
Liquids2 ($bn) 135 +34%
1 All movements on prior comparative period.
2 Liquids as at 30 June 2012.
Additional information
Snapshot – FY12 Results1
Total Assets ($bn) 718 8%
Total Liabilities ($bn) 677 7%
FUA ($bn, spot) 202 3%
RWA ($bn) 303 7%
Provision to Credit RWAs (bpts) 185 (24) bpts
Financial Operating performance by division
Balance sheet Capital & funding
For
per
sona
l use
onl
y
17
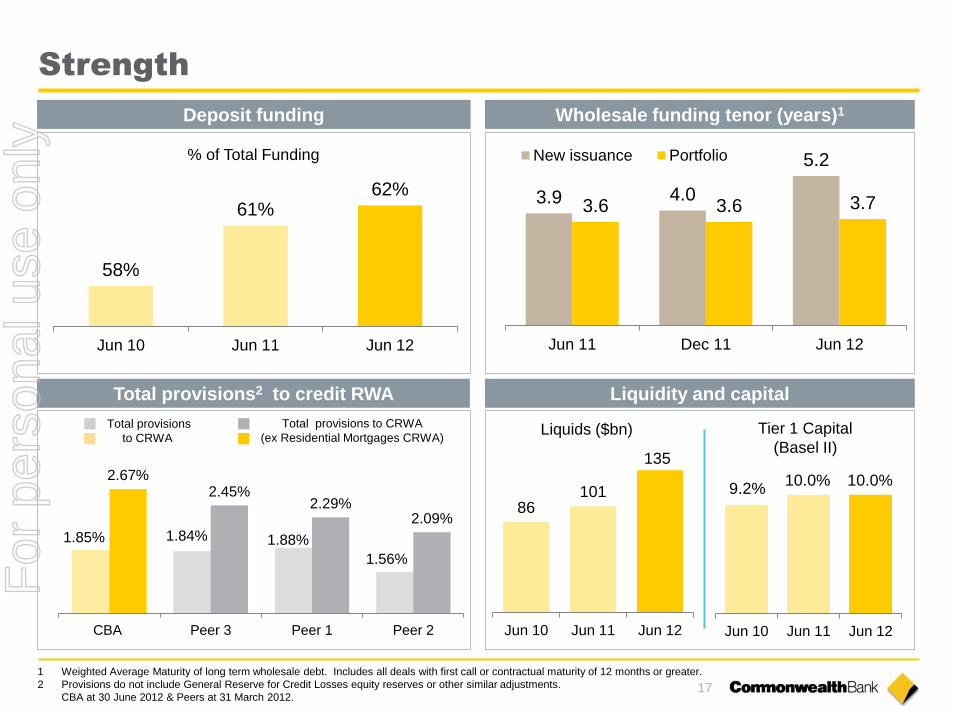
Strength
Total provisions2 to credit RWA
Wholesale funding tenor (years)1
Liquidity and capital
1.85% 1.84% 1.88%
1.56%
2.67% 2.45%
2.29% 2.09%
CBA Peer 3 Peer 1 Peer 2
Total provisions
to CRWA
Total provisions to CRWA
(ex Residential Mortgages CRWA)
1 Weighted Average Maturity of long term wholesale debt. Includes all deals with first call or contractual maturity of 12 months or greater.
2 Provisions do not include General Reserve for Credit Losses equity reserves or other similar adjustments.
CBA at 30 June 2012 & Peers at 31 March 2012.
Deposit funding
% of Total Funding
58%
61% 62%
Jun 10 Jun 11 Jun 12
3.9 4.0
5.2
3.6 3.6 3.7
Jun 11 Dec 11 Jun 12
New issuance Portfolio
86 101
135
Jun 10 Jun 11 Jun 12
Liquids ($bn)
Jun 10 Jun 11 Jun 12
Tier 1 Capital
(Basel II)
9.2% 10.0% 10.0%
For
per
sona
l use
onl
y

18
Notes
For
per
sona
l use
onl
y

Results Presentation FOR THE FULL YEAR ENDED 30 JUNE 2012
15 AUGUST 2012 | COMMONWEALTH BANK OF AUSTRALIA | ACN 123 123 124
David Craig Chief Financial Officer
For
per
sona
l use
onl
y

20
Notes
For
per
sona
l use
onl
y

21
Solid profit growth
Jun 12
$m
Jun 11
$m
Jun 12 vs
Jun 11
Operating income 20,001 19,538 2%
Operating expenses (9,196) (8,891) 3%
Operating performance 10,805 10,647 1%
Investment experience 149 121 23%
Loan impairment expense (1,089) (1,280) (15%)
Tax and non-controlling interest (2,752) (2,653) 4%
Cash NPAT 7,113 6,835 4% For
per
sona
l use
onl
y
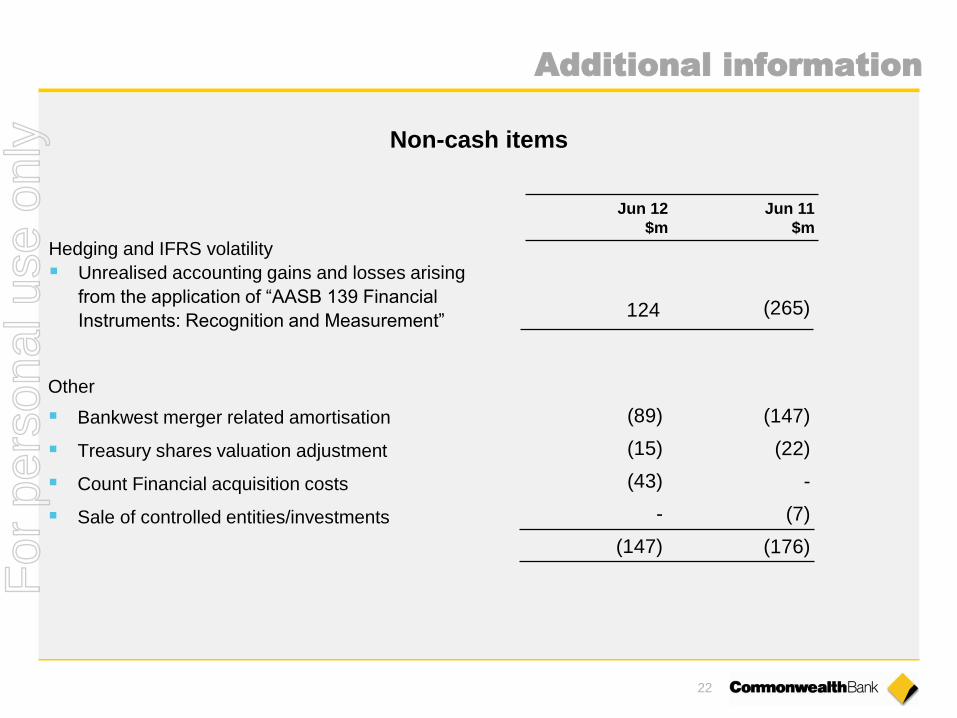
22
Hedging and IFRS volatility
Unrealised accounting gains and losses arising
from the application of “AASB 139 Financial
Instruments: Recognition and Measurement”
Jun 12
$m
Jun 11
$m
Other
Bankwest merger related amortisation
Treasury shares valuation adjustment
Count Financial acquisition costs
Sale of controlled entities/investments
124 (265)
Additional information
Non-cash items
(89) (147)
(15) (22)
(43) -
- (7)
(147) (176)
For
per
sona
l use
onl
y
23
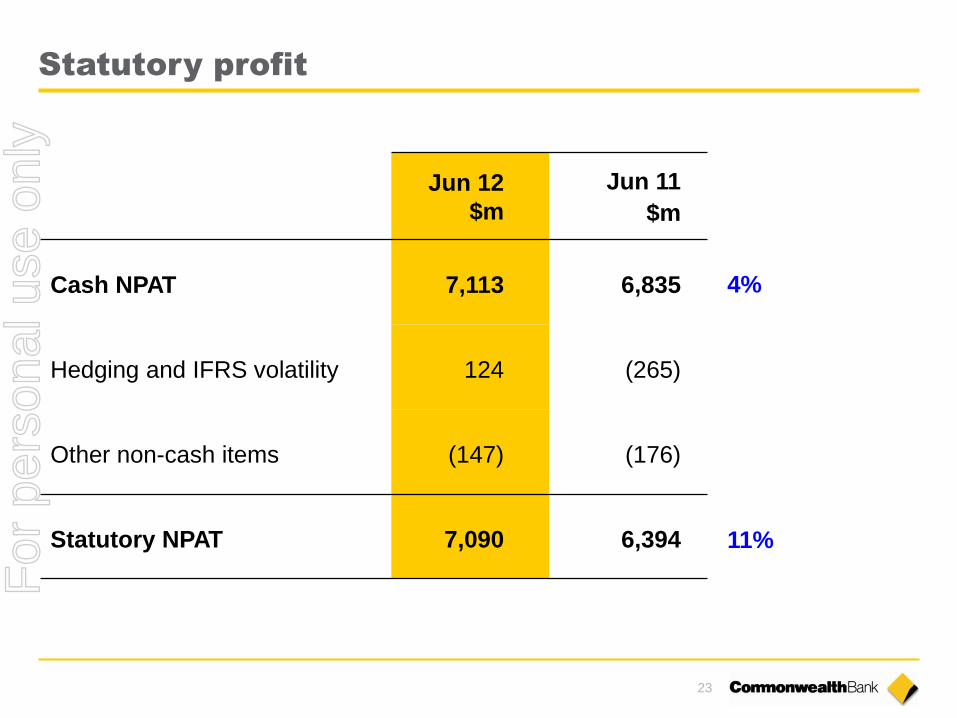
Statutory profit
Jun 12
$m
Jun 11
$m
Cash NPAT 7,113 6,835
Hedging and IFRS volatility 124 (265)
Other non-cash items (147) (176)
Statutory NPAT 7,090 6,394
4%
11%
For
per
sona
l use
onl
y
24
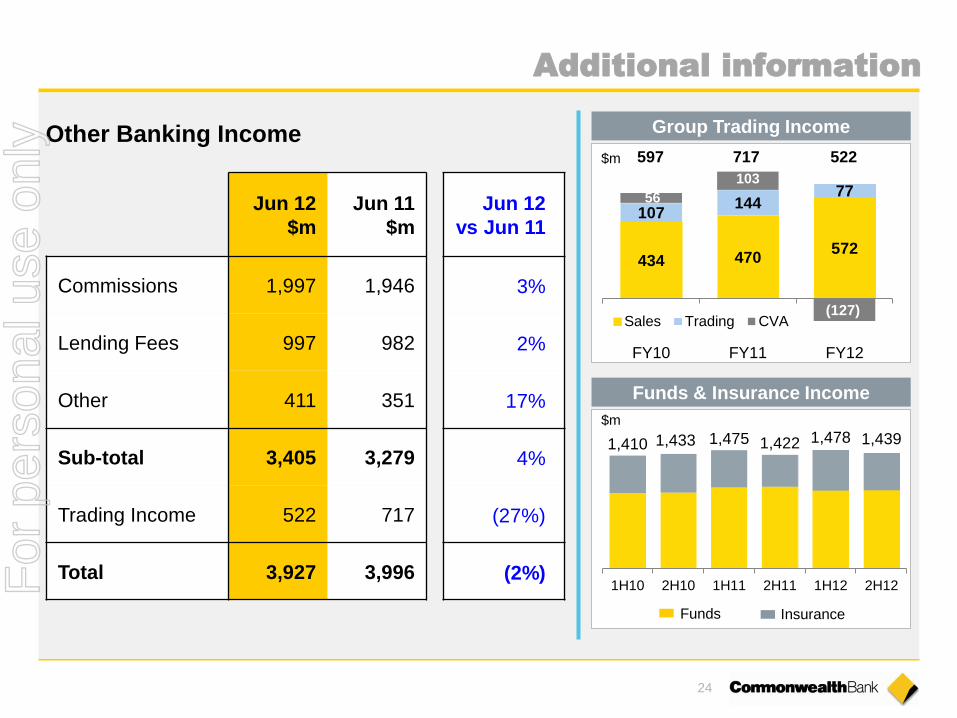
Jun 12
$m
Jun 11
$m
Jun 12
vs Jun 11
Commissions 1,997 1,946 3%
Lending Fees 997 982 2%
Other 411 351 17%
Sub-total 3,405 3,279 4%
Trading Income 522 717 (27%)
Total 3,927 3,996 (2%)
Additional information
Other Banking Income
1,410 1,433 1,475 1,422 1,478 1,439
1H10 2H10 1H11 2H11 1H12 2H12
$m
Funds Insurance
Funds & Insurance Income
Group Trading Income
434 470 572
107 144
77 56
103
(127)
FY10 FY11 FY12
Sales Trading CVA
597 717 522 $m
For
per
sona
l use
onl
y

25
FY11 FY12
Operating income
Funds &
Insurance
Other
Banking
Income
Net Interest
Income
+2%
Average FUM 2%
Insurance Income 12%
Commissions, Fees, Other $126m 4%
Trading Income (ex CVA) $35m 6%
CVA1 ($230m) lge
Volume $679m 5%
Margin ($167m) 1%
+4%
(2%)
+1%
FY12 vs FY11
1 Group CVA including Bankwest and NZ.
For
per
sona
l use
onl
y
26
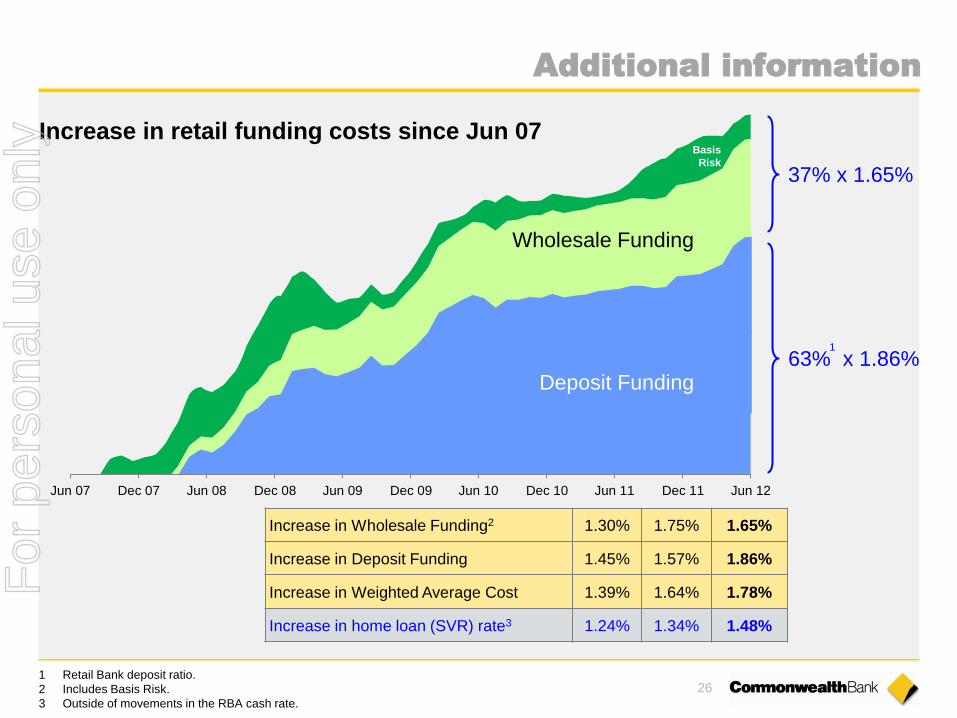
Jun 07 Dec 07 Jun 08 Dec 08 Jun 09 Dec 09 Jun 10 Dec 10 Jun 11 Dec 11 Jun 12
Basis
Risk
Wholesale Funding
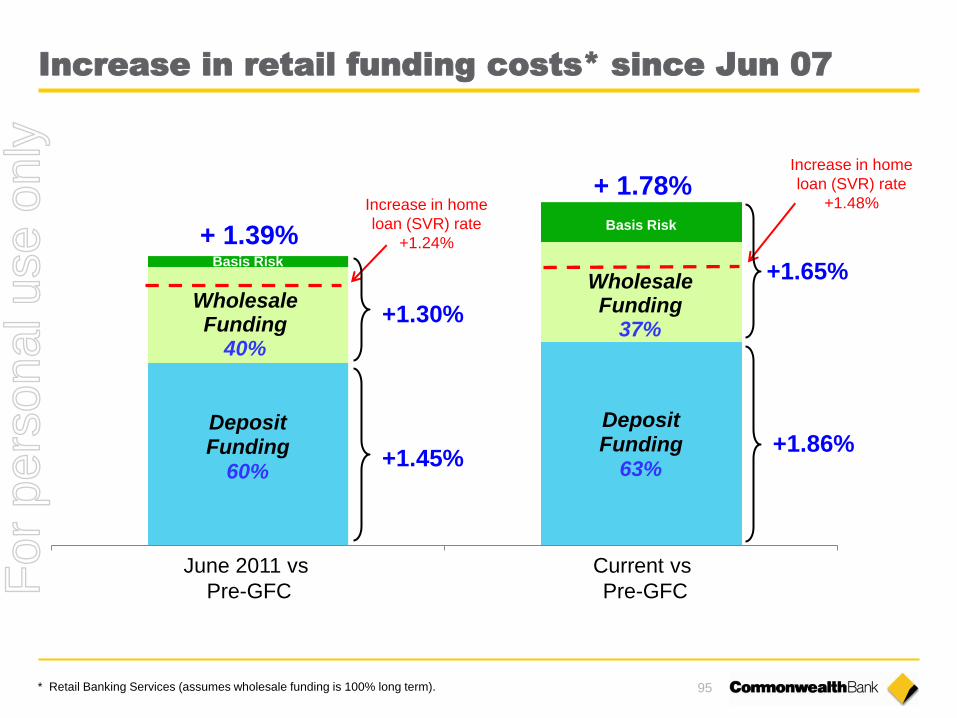
Increase in retail funding costs since Jun 07
Increase in Wholesale Funding2 1.30% 1.75% 1.65%
Increase in Deposit Funding 1.45% 1.57% 1.86%
Increase in Weighted Average Cost 1.39% 1.64% 1.78%
Increase in home loan (SVR) rate3 1.24% 1.34% 1.48%
37% x 1.65%
Deposit Funding
1 Retail Bank deposit ratio.
2 Includes Basis Risk.
3 Outside of movements in the RBA cash rate.
63% x 1.86%
Additional information
1
For
per
sona
l use
onl
y
27
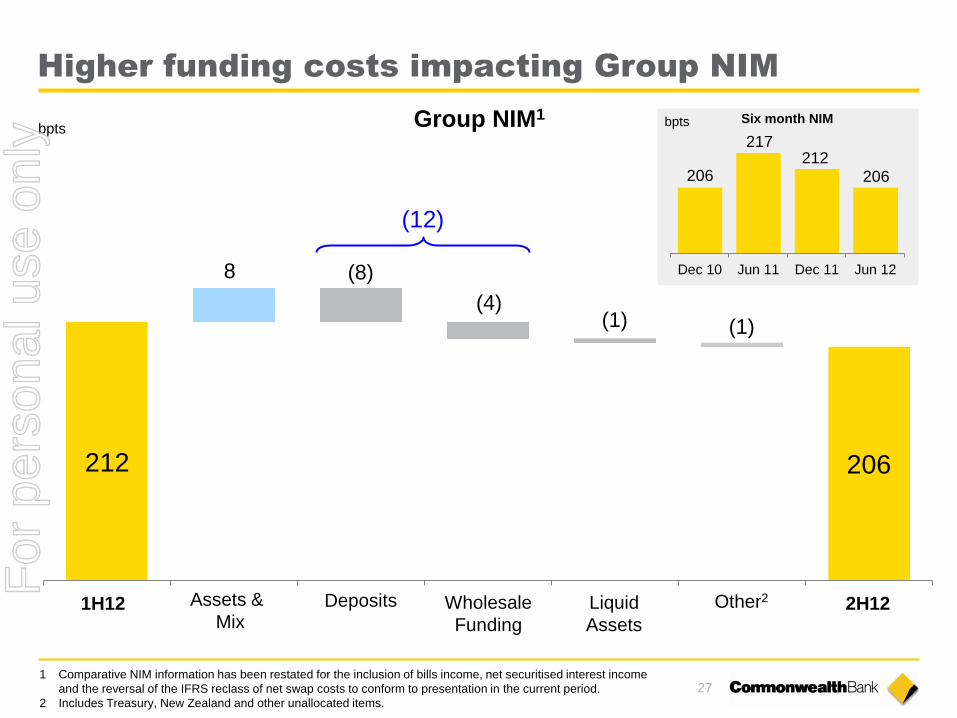
Higher funding costs impacting Group NIM
bpts
8 (8)
(4) (1) (1)
212 206
Group NIM1
1H12 2H12 Assets &
Mix Liquid
Assets
Other2 Deposits Wholesale
Funding
1 Comparative NIM information has been restated for the inclusion of bills income, net securitised interest income
and the reversal of the IFRS reclass of net swap costs to conform to presentation in the current period.
2 Includes Treasury, New Zealand and other unallocated items.
(12)
Dec 10 Jun 11 Dec 11 Jun 12
206
217 212
206
bpts Six month NIM
For
per
sona
l use
onl
y
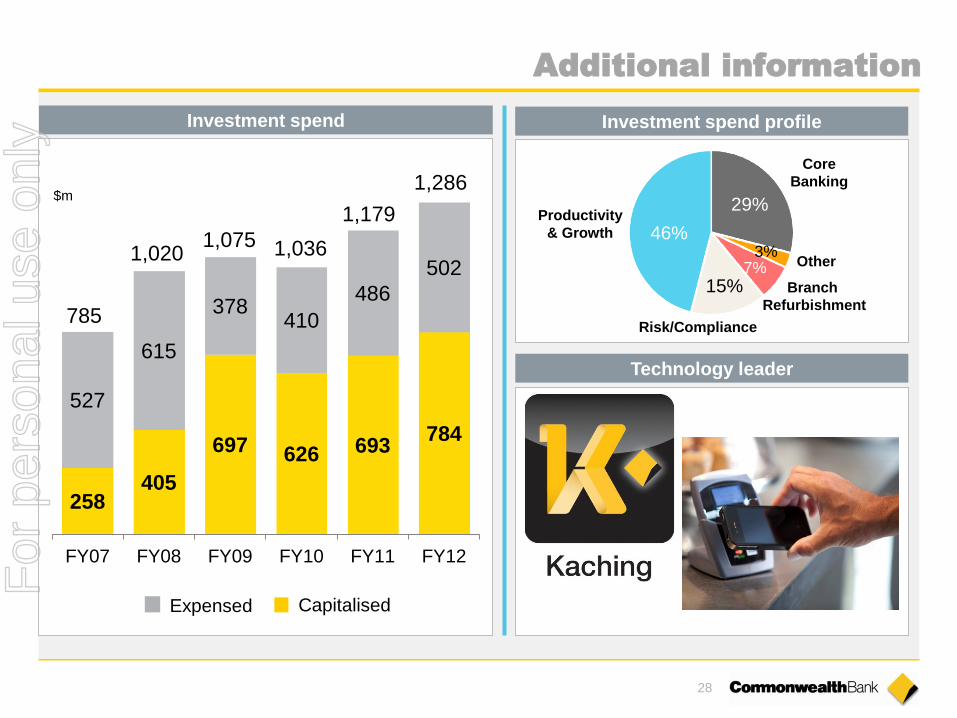
28
258 405
697 626 693 784
527
615
378 410
486
502
FY07 FY08 FY09 FY10 FY11 FY12
785
1,020 1,075 1,036
$m
1,179
Capitalised Expensed
Investment spend
1,286
Additional information
3% 46%
29%
Risk/Compliance
Branch
Refurbishment
Core
Banking
Other 7%
15%
Productivity
& Growth
Investment spend profile
Technology leader
For
per
sona
l use
onl
y
29
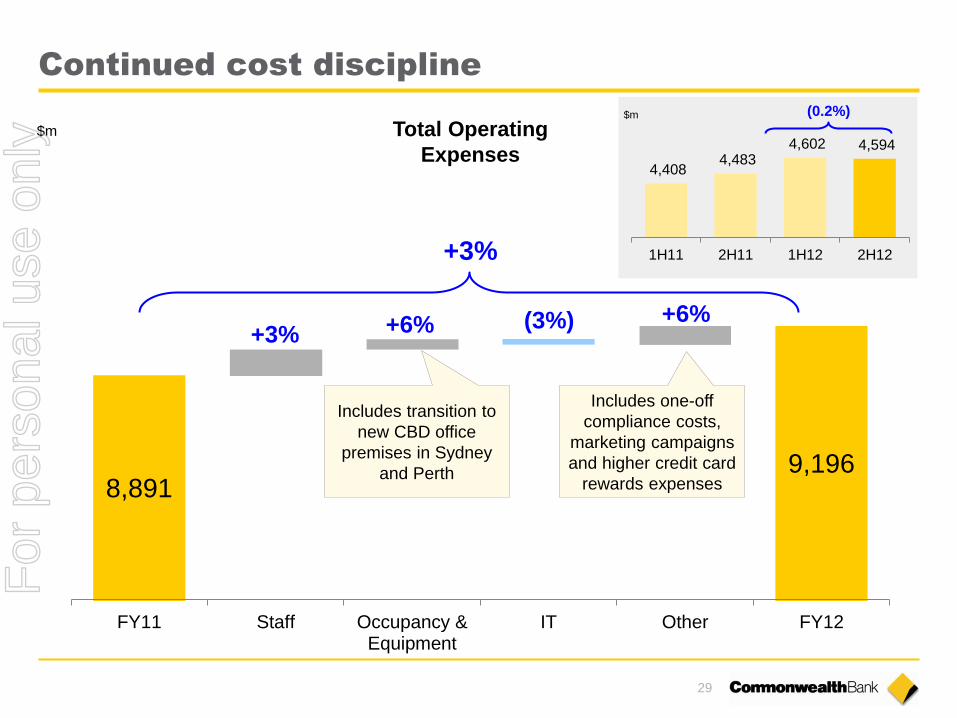
Continued cost discipline
8,891 9,196
FY11 Staff Occupancy &Equipment
IT Other FY12
$m
+6% (3%) +6%
+3%
Includes transition to
new CBD office
premises in Sydney
and Perth
Includes one-off
compliance costs,
marketing campaigns
and higher credit card
rewards expenses
+3%
4,408 4,483
4,602 4,594
1H11 2H11 1H12 2H12
(0.2%) $m
Total Operating
Expenses
For
per
sona
l use
onl
y
30
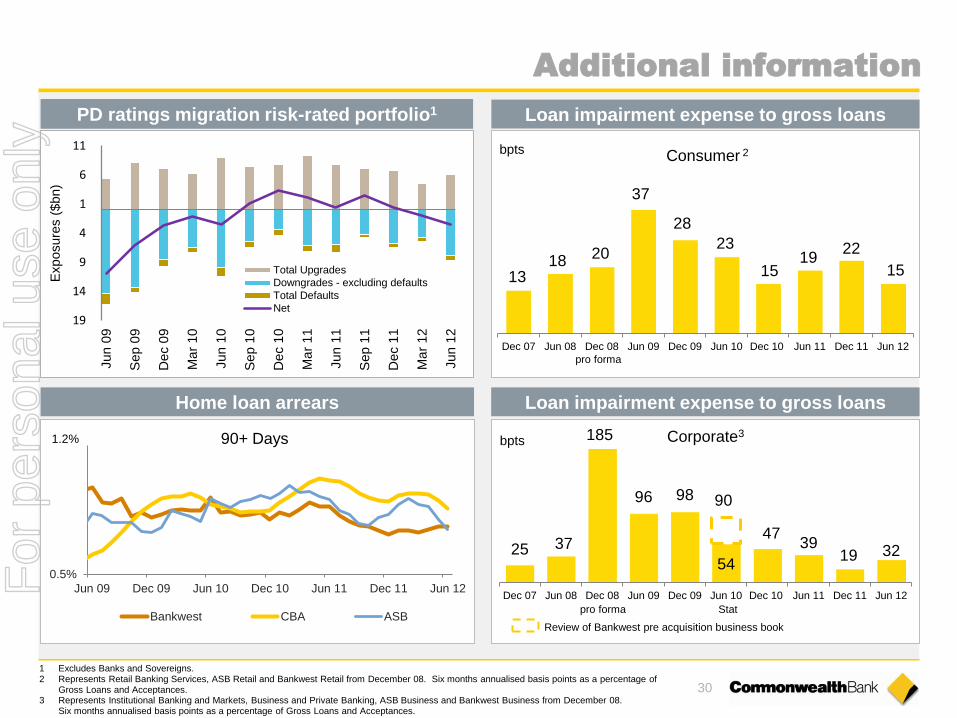
1 Excludes Banks and Sovereigns. 2 Represents Retail Banking Services, ASB Retail and Bankwest Retail from December 08. Six months annualised basis points as a percentage of
Gross Loans and Acceptances. 3 Represents Institutional Banking and Markets, Business and Private Banking, ASB Business and Bankwest Business from December 08.
Six months annualised basis points as a percentage of Gross Loans and Acceptances.
Home loan arrears
PD ratings migration risk-rated portfolio1
0.5%
Jun 09 Dec 09 Jun 10 Dec 10 Jun 11 Dec 11 Jun 12
90+ Days
Bankwest CBA ASB
Additional information
Loan impairment expense to gross loans
Loan impairment expense to gross loans
13 18 20
37
28
23
15 19
22
15
Dec 07 Jun 08 Dec 08 Jun 09 Dec 09 Jun 10 Dec 10 Jun 11 Dec 11 Jun 12
bpts
pro forma
Consumer 2
25 37
185
96 98
54
47 39
19 32
Dec 07 Jun 08 Dec 08 Jun 09 Dec 09 Jun 10 Dec 10 Jun 11 Dec 11 Jun 12
bpts Corporate3
Review of Bankwest pre acquisition business book
pro forma Stat
90
19
14
9
4
1
6
11
Jun 0
9
Sep 0
9
De
c 0
9
Ma
r 10
Jun 1
0
Sep 1
0
De
c 1
0
Ma
r 11
Jun 1
1
Sep 1
1
De
c 1
1
Ma
r 12
Jun 1
2
Exposure
s (
$bn)
Total Upgrades
Downgrades - excluding defaults
Total Defaults
Net
1.2%
For
per
sona
l use
onl
y
31
0.0%
1.0%
2.0%
3.0%
4.0%
5.0%
Jun 09 Dec 09 Jun 10 Dec 10 Jun 11 Dec 11 Jun 12
30+ Days
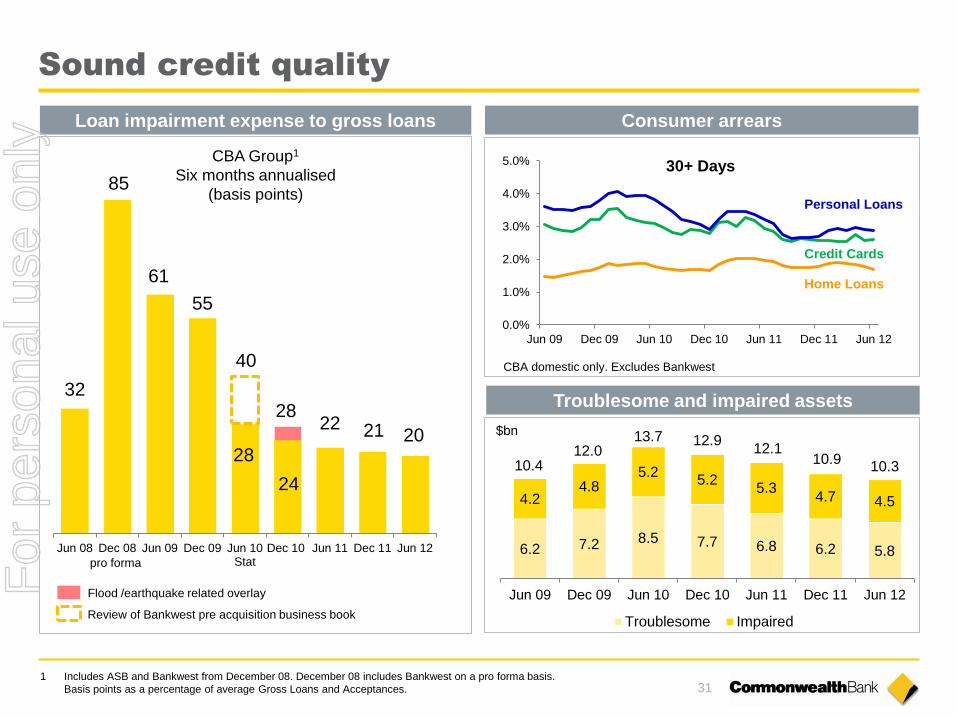
1 Includes ASB and Bankwest from December 08. December 08 includes Bankwest on a pro forma basis.
Basis points as a percentage of average Gross Loans and Acceptances.
Home Loans
Credit Cards
Personal Loans
CBA domestic only. Excludes Bankwest
Sound credit quality
Consumer arrears
Troublesome and impaired assets
6.2 7.2 8.5 7.7 6.8 6.2 5.8
4.2 4.8
5.2 5.2
5.3 4.7 4.5
10.4 12.0
13.7 12.9 12.1
10.9 10.3
Jun 09 Dec 09 Jun 10 Dec 10 Jun 11 Dec 11 Jun 12
Troublesome Impaired
$bn
Loan impairment expense to gross loans
32
85
61
55
28
24
22 21 20
Jun 08 Dec 08 Jun 09 Dec 09 Jun 10Stat
Dec 10 Jun 11 Dec 11 Jun 12
40
28
pro forma
Review of Bankwest pre acquisition business book
Flood /earthquake related overlay
CBA Group1
Six months annualised
(basis points)
For
per
sona
l use
onl
y
32
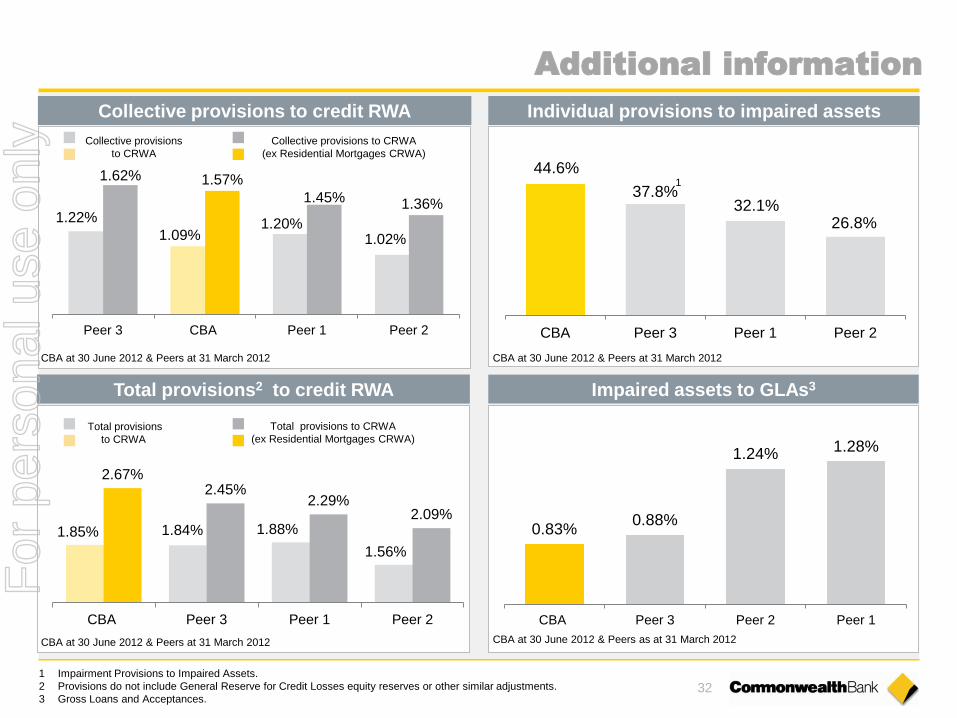
Additional information
1.22%
1.09% 1.20%
1.02%
1.62% 1.57%
1.45% 1.36%
Peer 3 CBA Peer 1 Peer 2
44.6%
37.8% 32.1%
26.8%
CBA Peer 3 Peer 1 Peer 2
1 Impairment Provisions to Impaired Assets.
2 Provisions do not include General Reserve for Credit Losses equity reserves or other similar adjustments.
3 Gross Loans and Acceptances.
1
Collective provisions to credit RWA Individual provisions to impaired assets
Collective provisions
to CRWA
Collective provisions to CRWA
(ex Residential Mortgages CRWA)
CBA at 30 June 2012 & Peers at 31 March 2012 CBA at 30 June 2012 & Peers at 31 March 2012
Total provisions2 to credit RWA
1.85% 1.84% 1.88%
1.56%
2.67% 2.45%
2.29% 2.09%
CBA Peer 3 Peer 1 Peer 2
Total provisions
to CRWA
Total provisions to CRWA
(ex Residential Mortgages CRWA)
CBA at 30 June 2012 & Peers at 31 March 2012
Impaired assets to GLAs3
0.83% 0.88%
1.24% 1.28%
CBA Peer 3 Peer 2 Peer 1
CBA at 30 June 2012 & Peers as at 31 March 2012
For
per
sona
l use
onl
y

33
Provisioning
588 596 619
808 890 898
598 528 473
970 847
Jun 11 Dec 11
3,043 2,984
969 880 847
177 218 227
979 999 934
Jun 12 Jun 11
2,125
Bankwest
Consumer
Commercial
Dec 11
2,008
Overlay
$m $m
Individual provisions Collective provisions
2,097
2,837
1,049
Jun 12
Overlay
movement
Jun 12
vs Dec 11
$m
Economic
overlay
unchanged -
Amortisation of
BWA fair value
provision (22)
Runoff of higher
risk Bankwest
Loans (56)
Utilised in
Individual and
Collective
Provisions
(27)
Other issues
resolved (18)
Total (123) For
per
sona
l use
onl
y
34
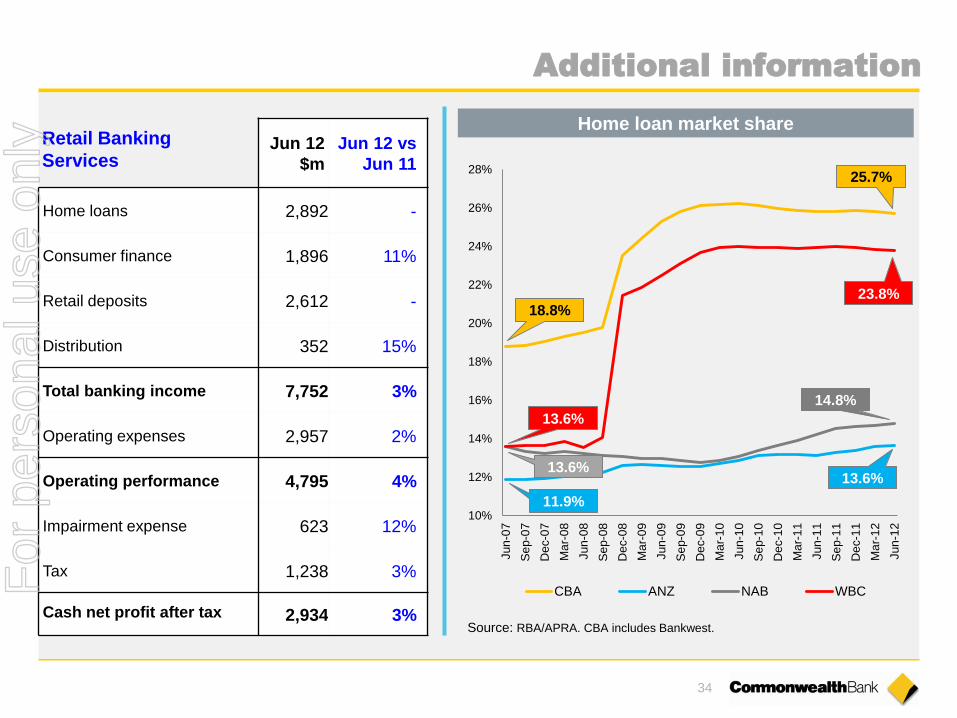
Retail Banking
Services Jun 12
$m
Jun 12 vs
Jun 11
Home loans 2,892 -
Consumer finance 1,896 11%
Retail deposits 2,612 -
Distribution 352 15%
Total banking income 7,752 3%
Operating expenses 2,957 2%
Operating performance 4,795 4%
Impairment expense 623 12%
Tax 1,238 3%
Cash net profit after tax 2,934 3%
Additional information
Source: RBA/APRA. CBA includes Bankwest.
Home loan market share
10%
12%
14%
16%
18%
20%
22%
24%
26%
28%
Jun
-07
Se
p-0
7
Dec-0
7
Ma
r-0
8
Jun
-08
Se
p-0
8
Dec-0
8
Ma
r-0
9
Jun
-09
Se
p-0
9
Dec-0
9
Ma
r-1
0
Jun
-10
Se
p-1
0
Dec-1
0
Ma
r-1
1
Jun
-11
Se
p-1
1
Dec-1
1
Ma
r-1
2
Jun
-12
CBA ANZ NAB WBC
18.8%
13.6%
13.6%
11.9%
25.7%
23.8%
14.8%
13.6%
For
per
sona
l use
onl
y

35
12.5%
3.6%
1.4%
Jun 06 Jun 11 Jun 12
Retail Banking Services
269 256
239 234 233 223
239 230 225
1H06 1H07 1H08 1H09 1H10 1H11 2H11 1H12 2H12
bpts
(0%)
11%
0%
Home
Loans
Consumer
Finance
Retail
Deposits
3% 2%
4%
Income Costs Operating
Performance
$bn
NBS & Goal Saver Investment accounts Savings deposits
Business Online Saver Transaction accounts
32 62
$bn
30
97
33
3 20 28
84
32
3 19
Jun 11 Jun 12
FY12 vs FY11 operating performance
Retail deposit mix
RBS margin
Customer satisfaction – Gap to No 1
Gap to Number 1
Major Bank Peer
1
1 Refer note slide at back of this presentation for source information.
FY12 vs FY11 Segment Income
+10%
For
per
sona
l use
onl
y
36
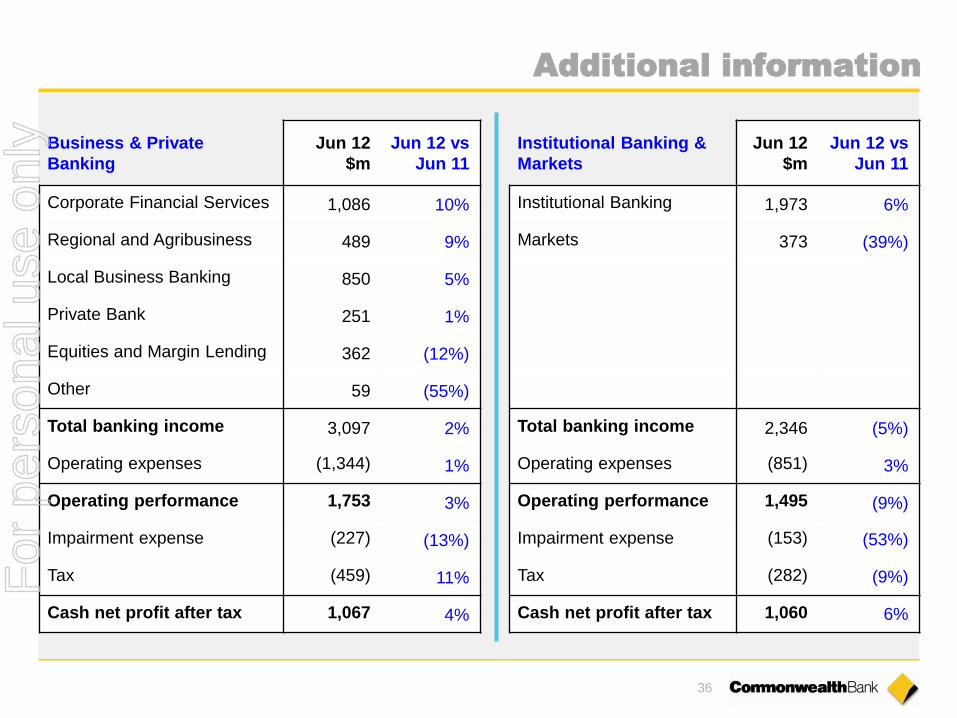
Business & Private
Banking
Jun 12
$m
Jun 12 vs
Jun 11
Corporate Financial Services 1,086 10%
Regional and Agribusiness 489 9%
Local Business Banking 850 5%
Private Bank 251 1%
Equities and Margin Lending 362 (12%)
Other 59 (55%)
Total banking income 3,097 2%
Operating expenses (1,344) 1%
Operating performance 1,753 3%
Impairment expense (227) (13%)
Tax (459) 11%
Cash net profit after tax 1,067 4%
Institutional Banking &
Markets
Jun 12
$m
Jun 12 vs
Jun 11
Institutional Banking 1,973 6%
Markets 373 (39%)
Total banking income 2,346 (5%)
Operating expenses (851) 3%
Operating performance 1,495 (9%)
Impairment expense (153) (53%)
Tax (282) (9%)
Cash net profit after tax 1,060 6%
Additional information
For
per
sona
l use
onl
y
37
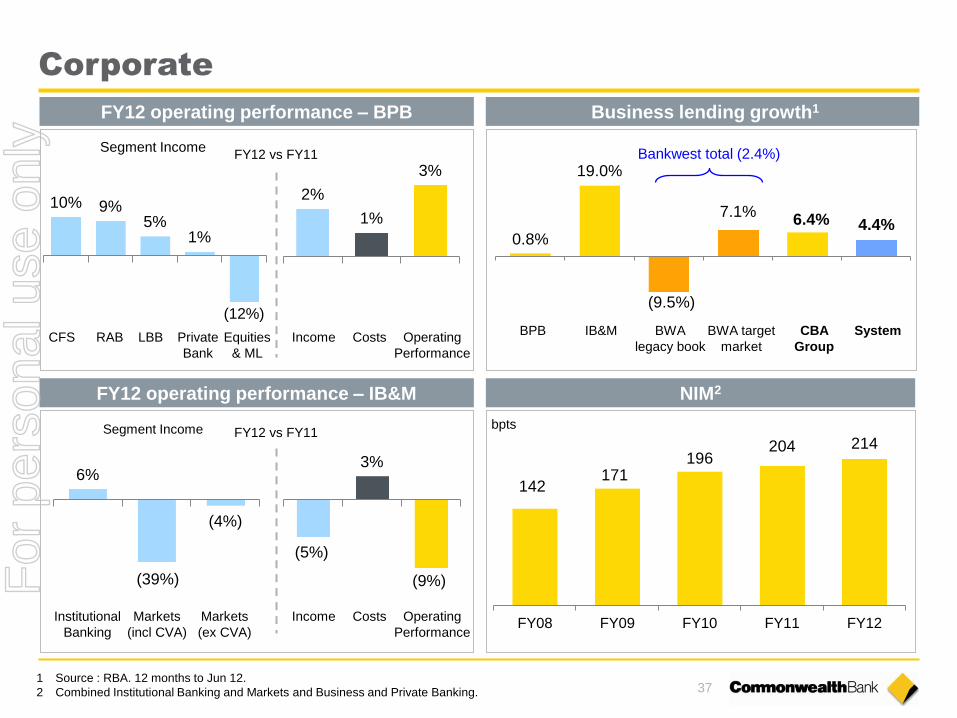
0.8%
19.0%
(9.5%)
7.1% 6.4% 4.4%
2%
1%
3%
Corporate
2
10% 9% 5%
1%
(12%)
CFS RAB LBB Private
Bank
Equities
& ML
Income Costs Operating
Performance
Segment Income
FY12 operating performance – BPB
NIM2
2
Segment Income FY12 vs FY11
6%
(4%)
(39%)
Institutional
Banking
Markets
(ex CVA)
Income Costs Operating
Performance
FY12 operating performance – IB&M
(5%)
3%
(9%)
2
Bankwest total (2.4%)
BPB IB&M BWA
legacy book
BWA target
market
CBA
Group
System
Business lending growth1
1 Source : RBA. 12 months to Jun 12.
2 Combined Institutional Banking and Markets and Business and Private Banking.
142 171
196 204 214
FY08 FY09 FY10 FY11 FY12
bpts
Markets
(incl CVA)
FY12 vs FY11
For
per
sona
l use
onl
y
38
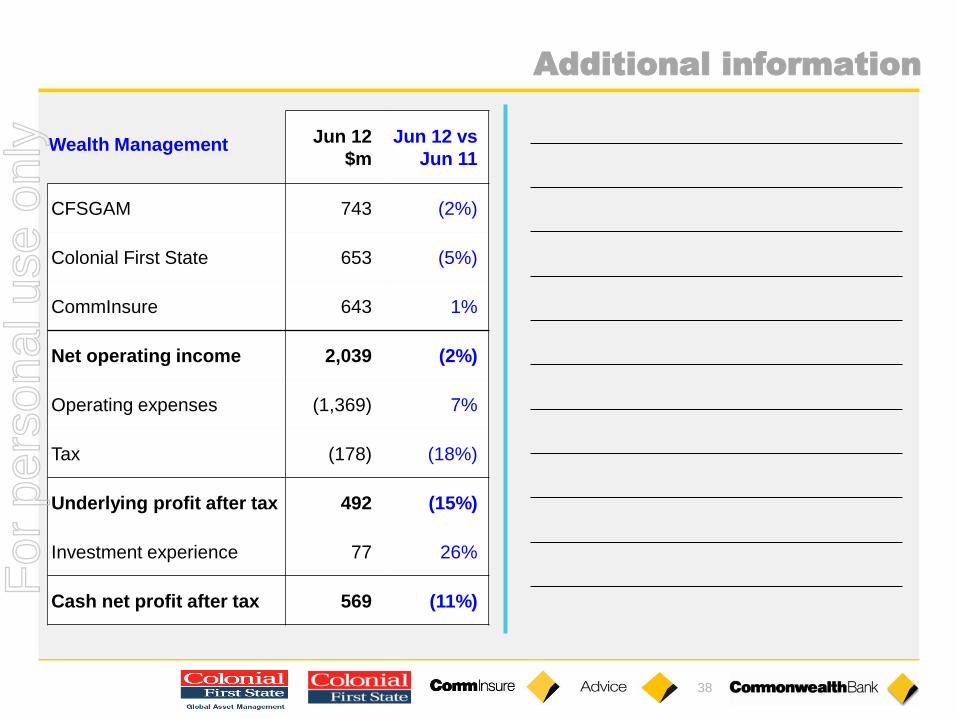
Additional information
Wealth Management Jun 12
$m
Jun 12 vs
Jun 11
CFSGAM 743 (2%)
Colonial First State 653 (5%)
CommInsure 643 1%
Net operating income 2,039 (2%)
Operating expenses (1,369) 7%
Tax (178) (18%)
Underlying profit after tax 492 (15%)
Investment experience 77 26%
Cash net profit after tax 569 (11%)
For
per
sona
l use
onl
y

39
1,220
729
919
626
1,079
1,640 1,971
72 190 69
Jun 11 RetailLife
WholesaleLife
GeneralInsurance
Jun 12
(2%)
(5%)
1%
89%
50%
20% 30%
88%
67%
100%
60%
33%
100%
50%
67%
DomesticEquities
GlobalRes
PropertySecurities
FixedInterest
Cash InfraStructure
InfraStructureSecurities
DirectProperty
ListedProperty
GEM/AP GlobalEquities
Total
Wealth Management
$m
Percentage of funds in each asset class outperforming benchmark
CFSGAM CFS CommInsure Income Costs Operating
Performance
+20% $m
* FirstChoice & Custom Solutions
(2%)
7%
(16%)
FY12 operating performance Platform* quarterly net flows
Strong investment performance – 3 years Inforce premiums
Jun 11 Sep 11 Dec 11 Mar 12 Jun 12
Segment Income FY12 vs FY11
For
per
sona
l use
onl
y
40
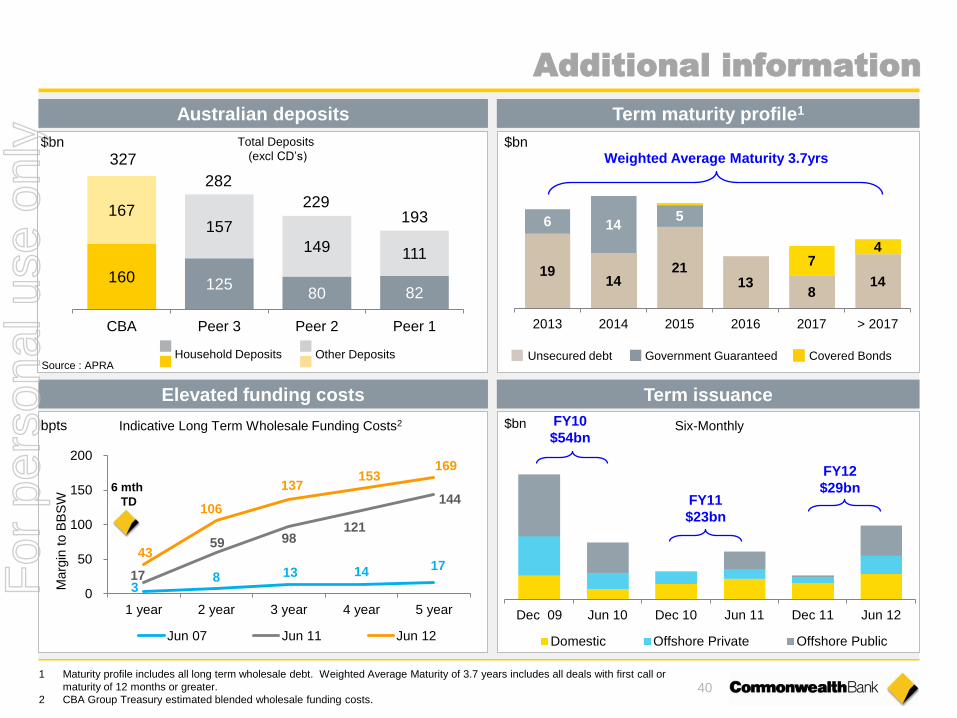
3 8 13 14 17
17
59 98 121
144
43
106
137 153
169
0
50
100
150
200
1 year 2 year 3 year 4 year 5 year
Marg
in t
o B
BS
W
Jun 07 Jun 11 Jun 12
$bn Six-Monthly
Dec 09 Jun 10 Dec 10 Jun 11 Dec 11 Jun 12
Domestic Offshore Private Offshore Public
FY10
$54bn
FY11
$23bn
FY12
$29bn
Additional information
$bn
19 14
21 13
8 14
6 14 5
7 4
2013 2014 2015 2016 2017 > 2017
Weighted Average Maturity 3.7yrs
Australian deposits Term maturity profile1
Term issuance
1 Maturity profile includes all long term wholesale debt. Weighted Average Maturity of 3.7 years includes all deals with first call or
maturity of 12 months or greater.
2 CBA Group Treasury estimated blended wholesale funding costs.
bpts
Elevated funding costs
6 mth
TD
Indicative Long Term Wholesale Funding Costs2
160 125 80 82
167 157
149 111
CBA Peer 3 Peer 2 Peer 1
193 229
282
327
Source : APRA
Total Deposits
(excl CD’s) $bn
Unsecured debt Government Guaranteed Covered Bonds Household Deposits Other Deposits
For
per
sona
l use
onl
y

41
Funding & Liquidity
$bn
62%
Deposit
Funded
Source of funds Use of funds
44
33
58
30 June 2012
135
Bank, NCD,
Bills, RMBS,
Supra
Cash, Govt,
Semi-Govt
Internal
RMBS
$bn
Regulatory
Minimum
$62bn
1
Funding Liquidity2
12 Months to June 2012
6 4
30
29 4 (16)
(26)
(25)
(6)
IFRS & FX Equity Customerdeposits
New longterm
funding
Net shortterm
funding
Liquidassets
Long termmaturities
Lending Otherassets
1 Includes trading assets, net derivatives, due from other financial institutions, bills payable, other assets.
2 Group liquid holdings as at 30 June 2012. Liquids reported post applicable haircuts.
For
per
sona
l use
onl
y

42
Notes
For
per
sona
l use
onl
y
43
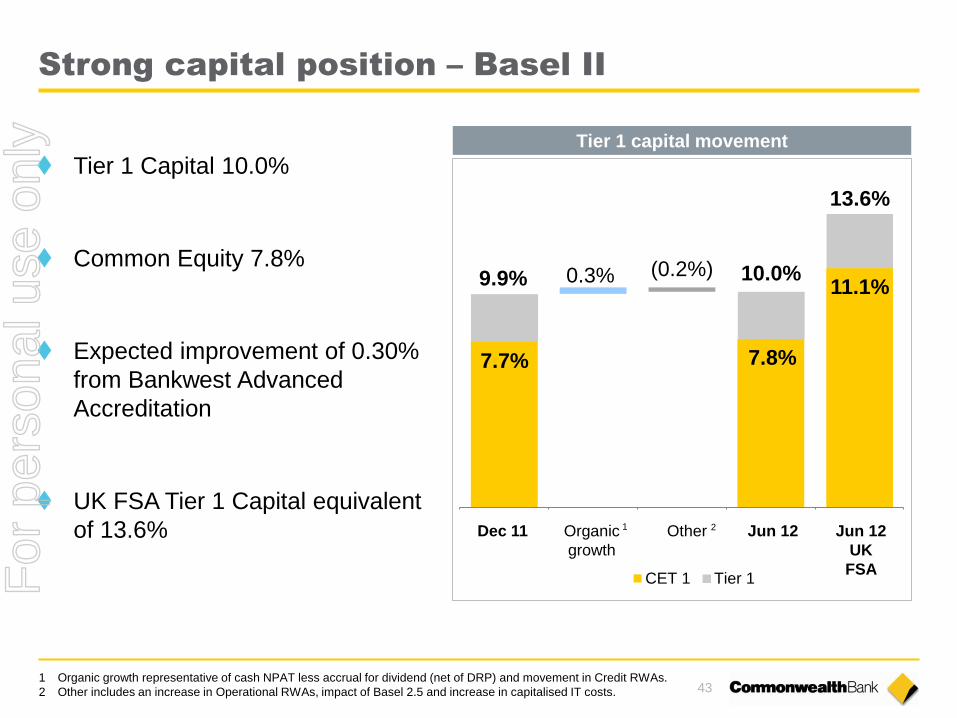
Tier 1 Capital 10.0%
Common Equity 7.8%
Expected improvement of 0.30%
from Bankwest Advanced
Accreditation
UK FSA Tier 1 Capital equivalent
of 13.6%
Strong capital position – Basel II
Tier 1 capital movement
7.7% 7.8%
11.1% 0.3% (0.2%) 9.9% 10.0%
13.6%
CET 1 Tier 1
Organic
growth
Jun 12 Jun 12
UK
FSA
Other 1 2 Dec 11
1 Organic growth representative of cash NPAT less accrual for dividend (net of DRP) and movement in Credit RWAs.
2 Other includes an increase in Operational RWAs, impact of Basel 2.5 and increase in capitalised IT costs.
For
per
sona
l use
onl
y
44
Notes
For
per
sona
l use
onl
y
45
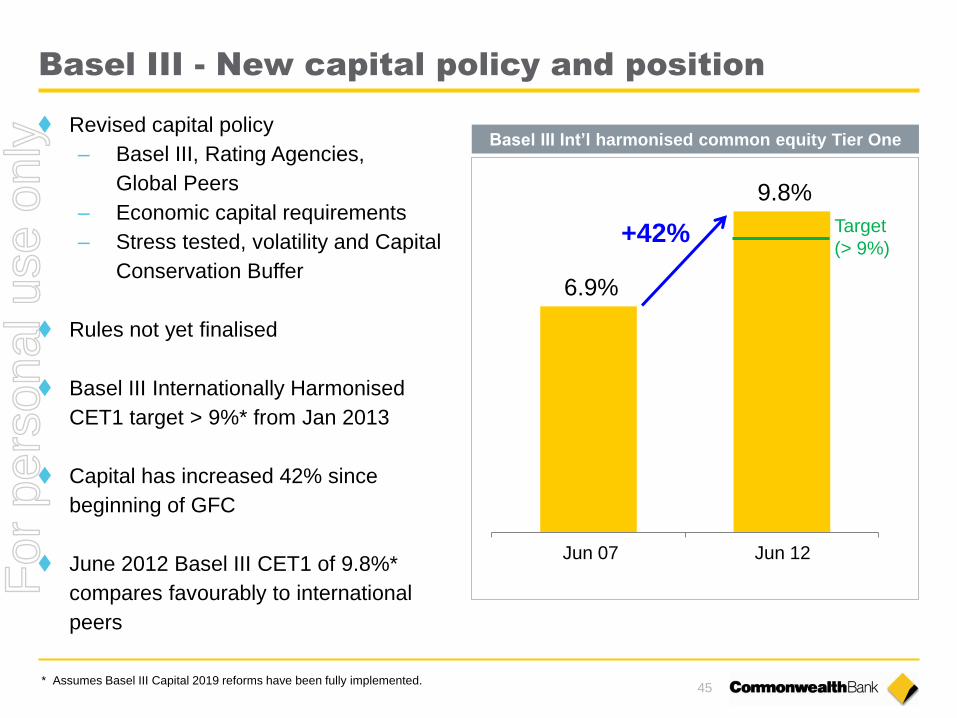
Basel III - New capital policy and position
Revised capital policy
– Basel III, Rating Agencies,
Global Peers
– Economic capital requirements
– Stress tested, volatility and Capital
Conservation Buffer
Rules not yet finalised
Basel III Internationally Harmonised
CET1 target > 9%* from Jan 2013
Capital has increased 42% since
beginning of GFC
June 2012 Basel III CET1 of 9.8%*
compares favourably to international
peers
Basel III Int’l harmonised common equity Tier One
* Assumes Basel III Capital 2019 reforms have been fully implemented.
6.9%
9.8%
Target
(> 9%)
Jun 07 Jun 12
+42%
For
per
sona
l use
onl
y

46
Notes
For
per
sona
l use
onl
y

47
Peer Basel III Common Equity
11.0 10.6
10.3 10.3 9.8 9.8
9.4 9.4 9.3 9.3 9.3 9.0 8.9 8.8
8.5 8.3 8.2 8.1 8.0
7.9 7.9 7.8 7.8 7.7 7.6 7.5 7.4
7.0 6.9 6.3
No
rde
a
Sta
n C
h
HS
BC
We
stp
ac
CB
A
AN
Z
ING
BB
VA
Un
iCre
dit
NA
B
Inte
sa
Sa
np
ao
lo
Mitsu
bis
hi U
FJ
BN
P P
ariba
s
UB
S
Sa
nta
nd
er
RB
C
So
cG
en
Ba
nk o
f A
me
rica
Ba
rcla
ys
JP
Mo
rgan
Citi
RB
S
We
lls F
arg
o
Llo
yd
s
Ba
nk o
f M
ontr
eal
Su
mito
mo
Mitsu
i
Toro
nto
Do
min
ion
Sco
tia
ba
nk
De
uts
ch
e
Cre
dit S
uis
se
Peer bank average CE ratio
(ex. Australian banks): 8.4%
Source: Morgan Stanley. Based on last reported Common Equity ratios up to 13 August 2012 assuming Basel III capital reforms fully implemented.
Peer group comprises listed commercial banks with total assets in excess of A$400 billion and who have disclosed fully implemented Basel III ratios or provided sufficient disclosure
for a Morgan Stanley Equity Research estimate.
2 2
2
1 Based on Morgan Stanley Equity Research estimates. For all other banks the ratios have been derived directly from company
disclosures.
2 Domestic peer figures as at March 2012.
1
1
1
1 1
1
For
per
sona
l use
onl
y

48
Notes
For
per
sona
l use
onl
y
49
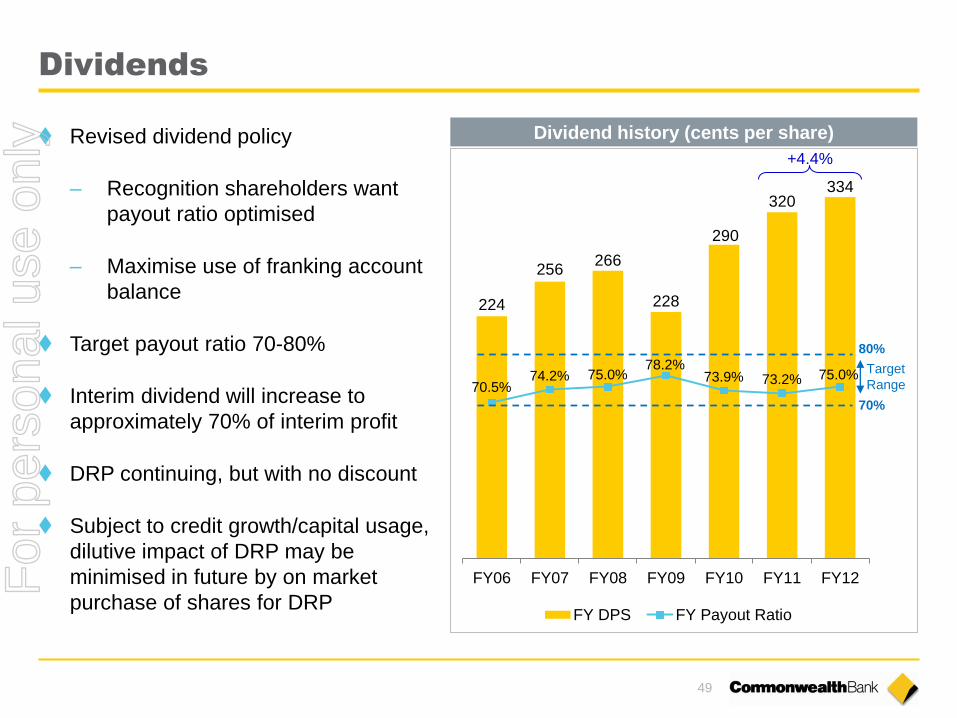
Dividends
224
256 266
228
290
320 334
70.5% 74.2% 75.0%
78.2% 73.9% 73.2% 75.0%
10%
30%
50%
70%
90%
110%
130%
150%
-50
0
50
100
150
200
250
300
350
400
FY06 FY07 FY08 FY09 FY10 FY11 FY12
FY DPS FY Payout Ratio
Revised dividend policy
– Recognition shareholders want
payout ratio optimised
– Maximise use of franking account
balance
Target payout ratio 70-80%
Interim dividend will increase to
approximately 70% of interim profit
DRP continuing, but with no discount
Subject to credit growth/capital usage,
dilutive impact of DRP may be
minimised in future by on market
purchase of shares for DRP
Dividend history (cents per share)
80%
70%
Target
Range
+4.4%
For
per
sona
l use
onl
y

50
Notes
For
per
sona
l use
onl
y

51
A strong and sustainable business model
Revenue challenges
Strong funding & liquidity Strong capital position
Group NIM
217
212
206
Jun 11 Dec 11 Jun 12
3.1% 2.8%
4.4%
2010 2011 2012
System Credit
Growth
Deposit Funding
(% of total)
58%
61% 62%
Jun 10 Jun 11 Jun 12
Liquids
$bn
86 101
135
Jun 10 Jun 11 Jun 12
Tier 1 Capital
(Basel II)
9.2%
10.0% 10.0%
Jun 10 Jun 11 Jun 12
bpts
Managing costs
4,408 4,483
4,602 4,594
1H11 2H11 1H12 2H12
(0.2%)
$m Total Operating
Expenses
For
per
sona
l use
onl
y

52
Notes
For
per
sona
l use
onl
y

Results Presentation FOR THE FULL YEAR ENDED 30 JUNE 2012
15 AUGUST 2012 | COMMONWEALTH BANK OF AUSTRALIA | ACN 123 123 124
Ian Narev Chief Executive Officer
For
per
sona
l use
onl
y
54
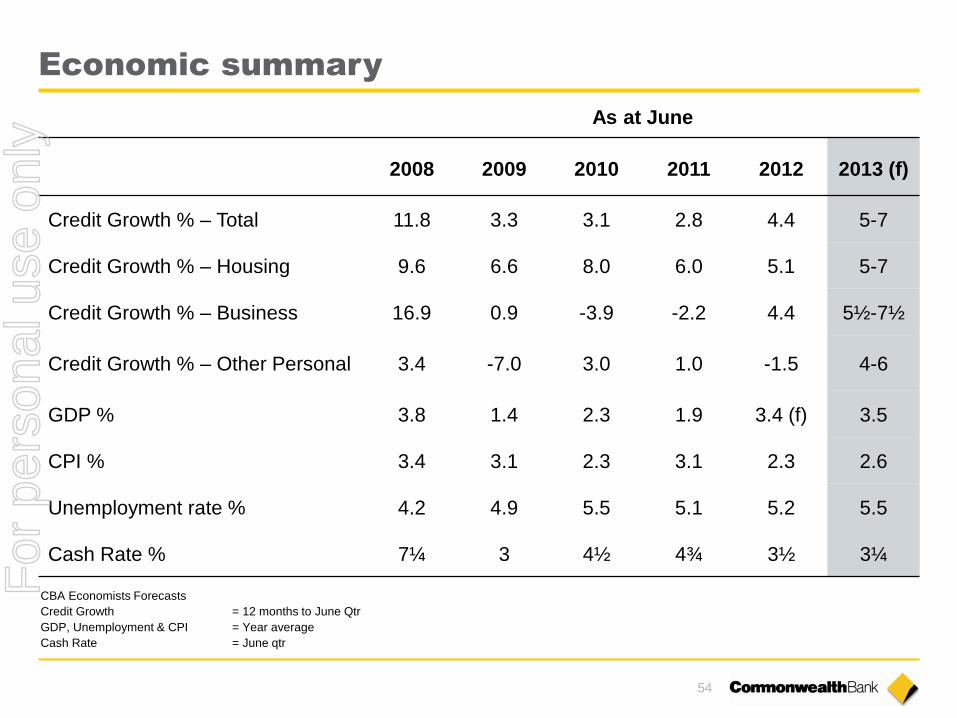
Economic summary
As at June
2008 2009 2010 2011 2012 2013 (f)
Credit Growth % – Total 11.8 3.3 3.1 2.8 4.4 5-7
Credit Growth % – Housing 9.6 6.6 8.0 6.0 5.1 5-7
Credit Growth % – Business 16.9 0.9 -3.9 -2.2 4.4 5½-7½
Credit Growth % – Other Personal 3.4 -7.0 3.0 1.0 -1.5 4-6
GDP % 3.8 1.4 2.3 1.9 3.4 (f) 3.5
CPI % 3.4 3.1 2.3 3.1 2.3 2.6
Unemployment rate % 4.2 4.9 5.5 5.1 5.2 5.5
Cash Rate % 7¼ 3 4½ 4¾ 3½ 3¼
CBA Economists Forecasts
Credit Growth = 12 months to June Qtr
GDP, Unemployment & CPI = Year average
Cash Rate = June qtr
For
per
sona
l use
onl
y
55
Outlook
Operating environment
– Australian economic fundamentals remain strong
– Continued global volatility
– Low credit growth
– Deposit cost pressures
– Evolution to new regulatory regimes
Our approach
– Scenario based with conservative settings
– Long term focus without compromising momentum
– Productivity and technology driven cost management
For
per
sona
l use
onl
y

56
Notes
For
per
sona
l use
onl
y
57
Summary
A predictable result
Revenue consistent with the environment
– Subdued Retail
– Relative strength in Commercial
– Focus on volume/margin trade-off
– Ongoing weakness in markets related businesses
Strong cost discipline
Credit quality a strength
Maintenance of strong balance sheet settings
Focus on the long term ROE & TSR
For
per
sona
l use
onl
y

58
Notes
For
per
sona
l use
onl
y
Results Presentation FOR THE FULL YEAR ENDED 30 JUNE 2012
15 AUGUST 2012 | COMMONWEALTH BANK OF AUSTRALIA | ACN 123 123 124
Supplementary Slides
For
per
sona
l use
onl
y
Index
Strategy 60
Business Performance 81
Risk and Credit Quality 100
Capital, Funding & Liquidity 116
Economic Indicators 129 For
per
sona
l use
onl
y
61
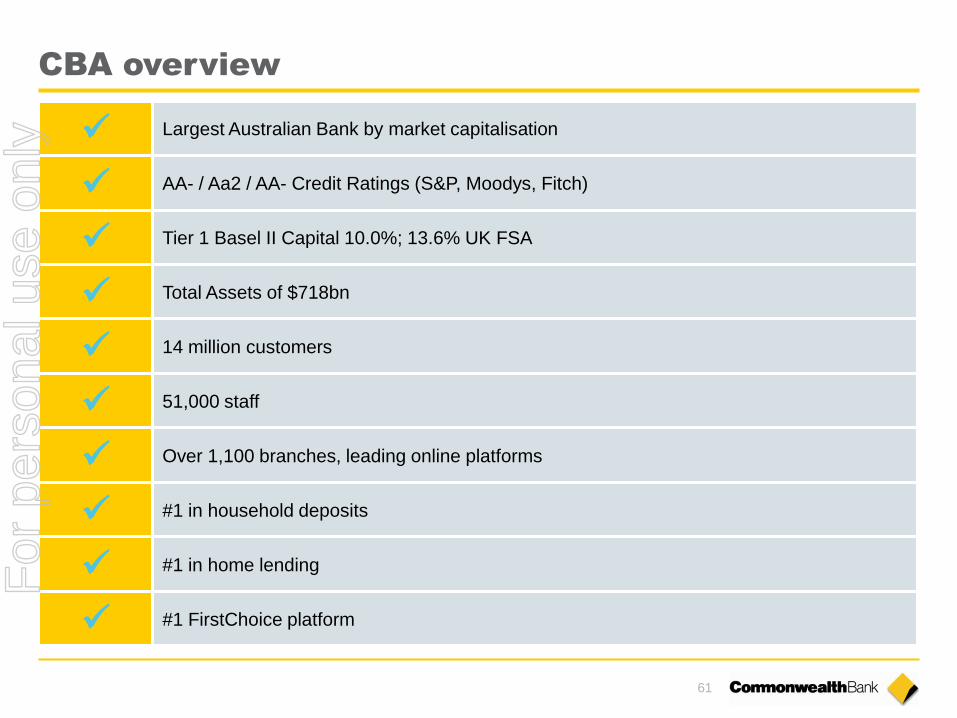
CBA overview
Largest Australian Bank by market capitalisation
AA- / Aa2 / AA- Credit Ratings (S&P, Moodys, Fitch)
Tier 1 Basel II Capital 10.0%; 13.6% UK FSA
Total Assets of $718bn
14 million customers
51,000 staff
Over 1,100 branches, leading online platforms
#1 in household deposits
#1 in home lending
#1 FirstChoice platform
For
per
sona
l use
onl
y
62
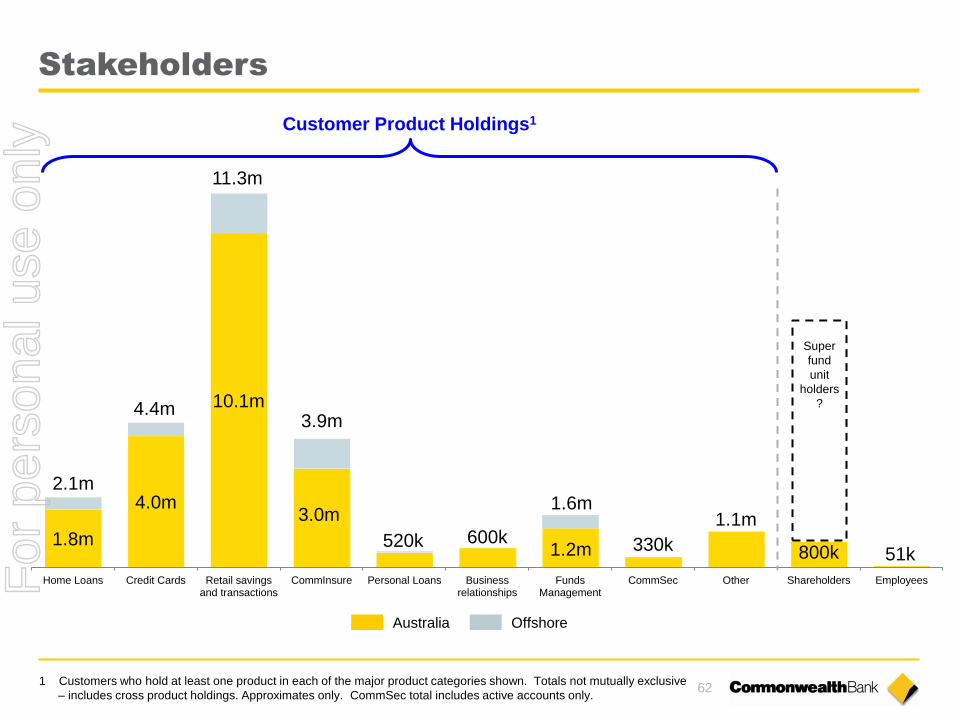
1.8m
4.0m
10.1m
3.0m
520k 600k
1.6m
330k
1.1m
800k 51k
Home Loans Credit Cards Retail savingsand transactions
CommInsure Personal Loans Businessrelationships
FundsManagement
CommSec Other Shareholders Employees
Customer Product Holdings1
Super
fund
unit
holders
?
1 Customers who hold at least one product in each of the major product categories shown. Totals not mutually exclusive
– includes cross product holdings. Approximates only. CommSec total includes active accounts only.
Australia Offshore
2.1m
4.4m
11.3m
Stakeholders
3.9m
1.2m
For
per
sona
l use
onl
y
63
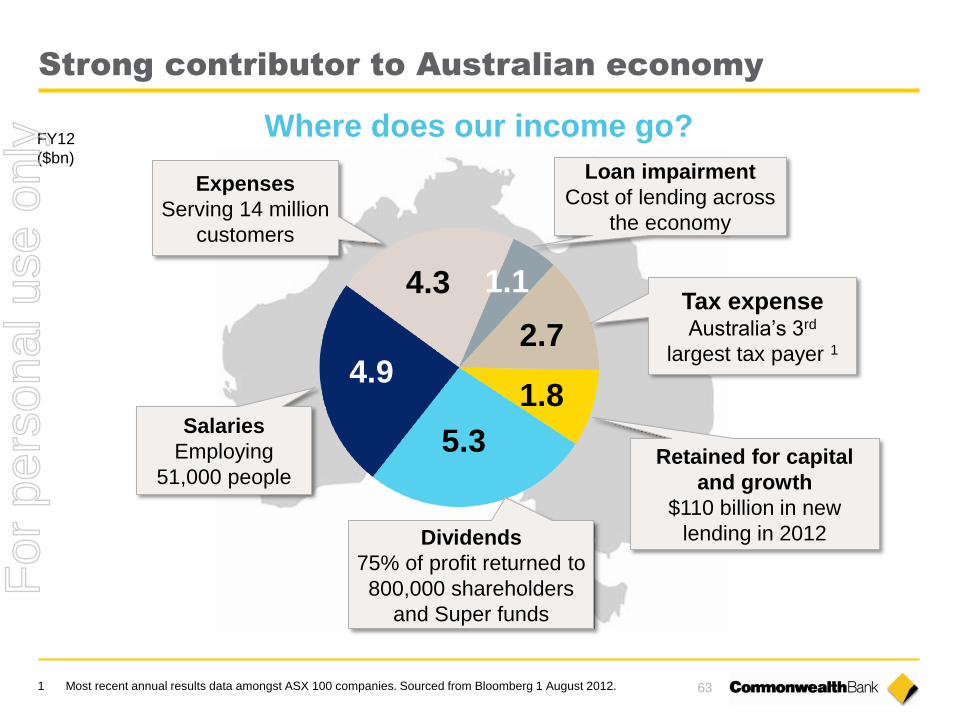
Where does our income go?
4.9
5.3
2.7
Salaries
Employing
51,000 people
Expenses
Serving 14 million
customers
Tax expense Australia’s 3rd
largest tax payer 1
Dividends
75% of profit returned to
800,000 shareholders
and Super funds
FY12
($bn) Loan impairment
Cost of lending across
the economy
1.8
Retained for capital
and growth
$110 billion in new
lending in 2012
4.3 1.1
1 Most recent annual results data amongst ASX 100 companies. Sourced from Bloomberg 1 August 2012.
Strong contributor to Australian economy
For
per
sona
l use
onl
y
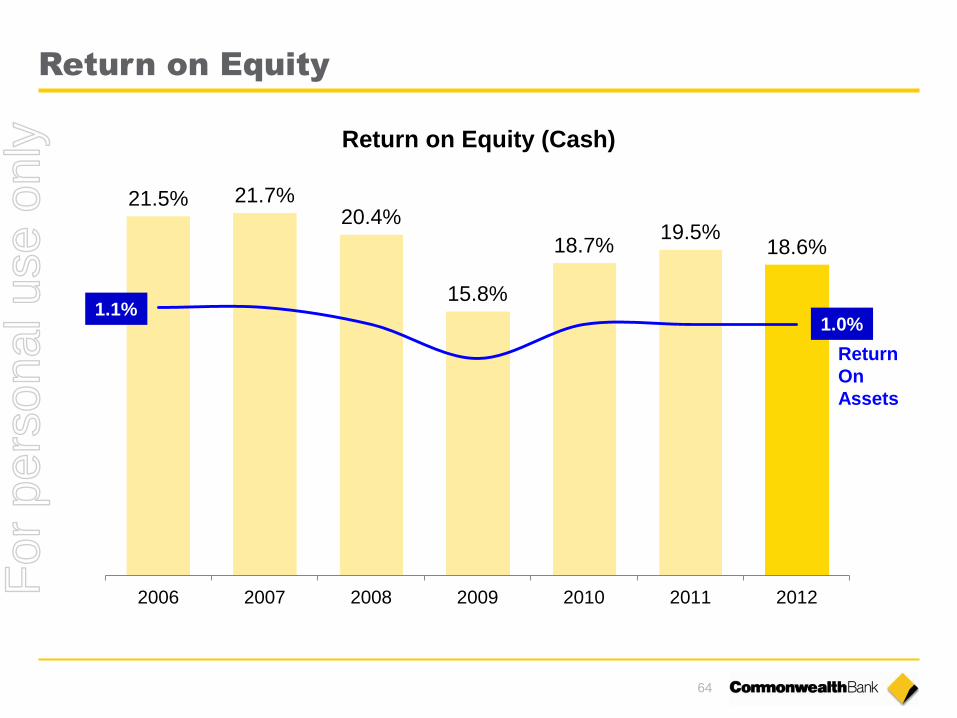
64
Return on Equity (Cash)
21.5% 21.7% 20.4%
15.8%
18.7% 19.5%
18.6%
100
150
200
250
300
350
400
450
500
550
600
2006 2007 2008 2009 2010 2011 2012
1.1% 1.0%
Return
On
Assets
Return on Equity
For
per
sona
l use
onl
y
65
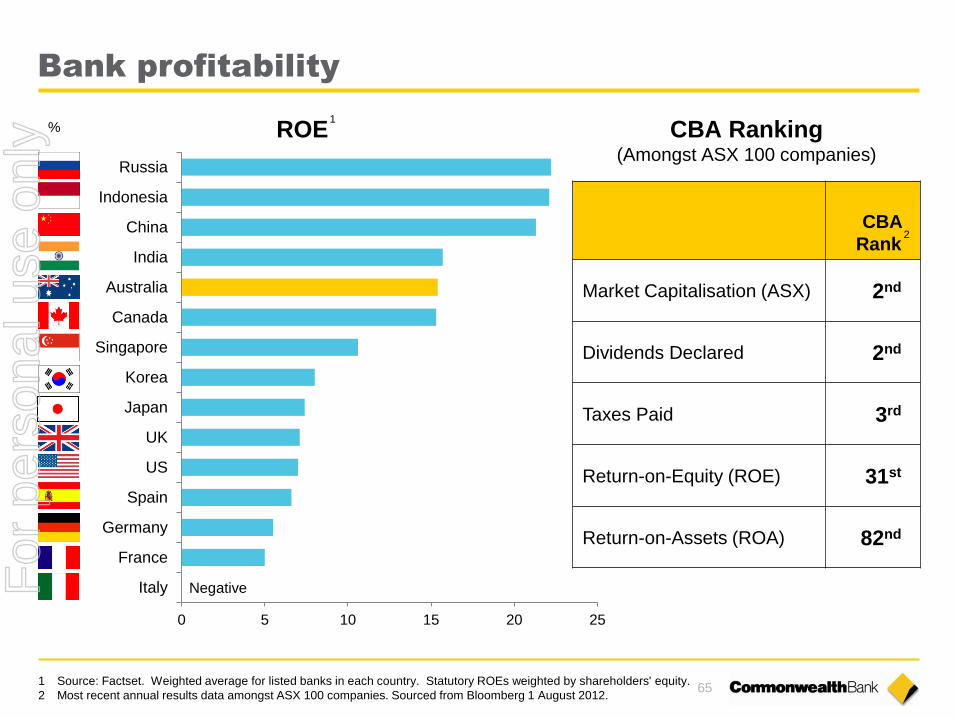
Bank profitability
1 Source: Factset. Weighted average for listed banks in each country. Statutory ROEs weighted by shareholders' equity.
2 Most recent annual results data amongst ASX 100 companies. Sourced from Bloomberg 1 August 2012.
0 5 10 15 20 25
Italy
France
Germany
Spain
US
UK
Japan
Korea
Singapore
Canada
Australia
India
China
Indonesia
Russia
ROE 1
%
Negative
CBA
Rank
Market Capitalisation (ASX) 2nd
Dividends Declared 2nd
Taxes Paid 3rd
Return-on-Equity (ROE) 31st
Return-on-Assets (ROA) 82nd
CBA Ranking (Amongst ASX 100 companies)
2
For
per
sona
l use
onl
y

66
Products per customer
CBA
Peer 3
Peer 1
Peer 2
3 Refer note slide at back of this presentation for source information
2.83
2.80
2.71
2.61
2.00
2.10
2.20
2.30
2.40
2.50
2.60
2.70
2.80
2.90
Sep
-07
Dec
-07
Mar
-08
Jun
-08
Sep
-08
Dec
-08
Ma
r-0
9
Jun
-09
Sep
-09
Dec
-09
Ma
r-1
0
Jun
-10
Sep
-10
Dec
-10
Mar
-11
Jun
-11
Sep
-11
Dec
-11
Ma
r-1
2
Jun
-12
Ave
rage
Pro
du
cts
He
ld a
t Fi
nan
cial
Inst
itu
tio
n
Average Number of Banking and Finance Products held by Customers 18+ (at the Financial Institution)
CBA Group
Westpac Group
ANZ Group
NAB Group
3
For
per
sona
l use
onl
y
67
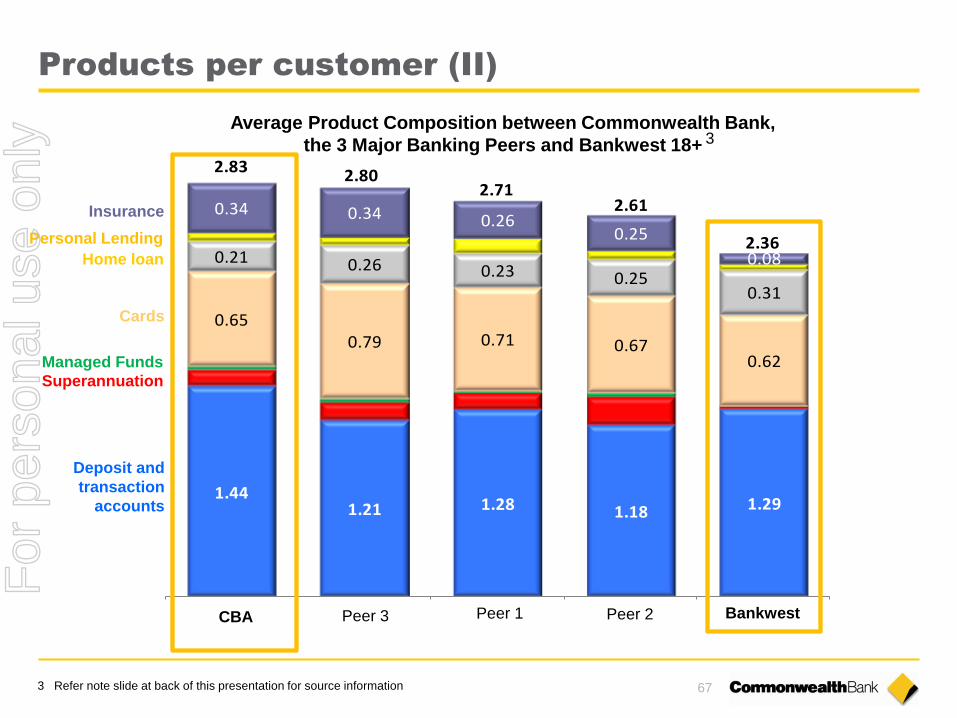
Products per customer (II)
1.441.21 1.28 1.18 1.29
0.650.79 0.71 0.67
0.62
0.21 0.26 0.23 0.250.31
0.34 0.34 0.260.25
0.08
2.832.80
2.712.61
2.36
Average Product Composition between Commonwealth Bank,
the 3 Major Banking Peers and Bankwest 18+
Peer 3 Peer 1 Bankwest CBA Peer 2
Insurance
Personal Lending
Home loan
Cards
Managed Funds
Superannuation
Deposit and
transaction
accounts
3
3 Refer note slide at back of this presentation for source information
For
per
sona
l use
onl
y
68
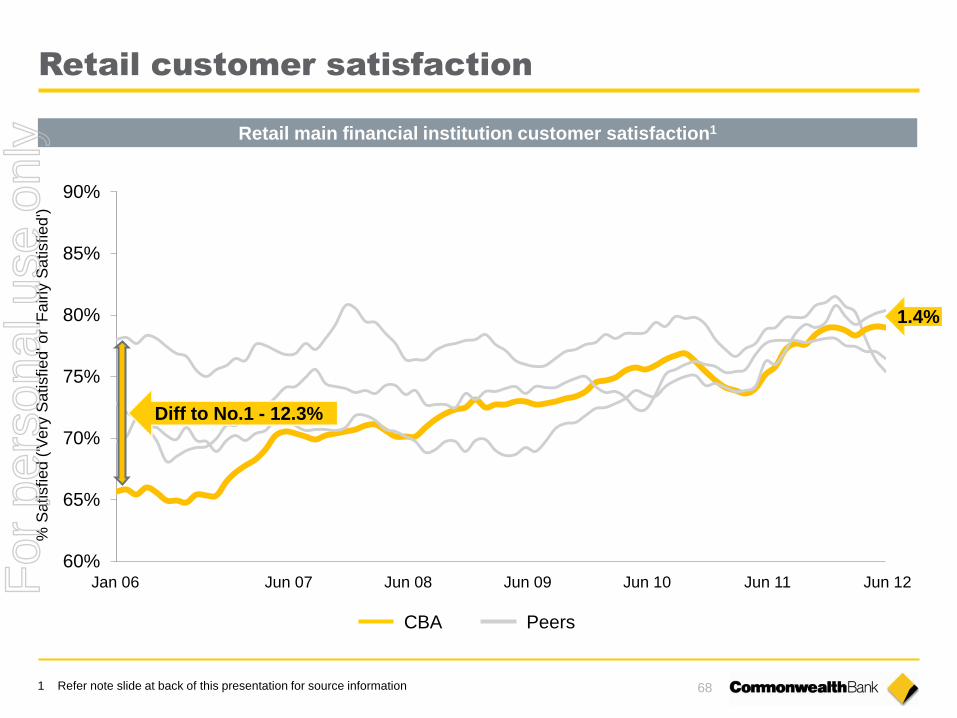
Retail customer satisfaction
60%
65%
70%
75%
80%
85%
90%
% S
atisfied
('V
ery
Sa
tisfied
' or
'Fairly
Sa
tisfied
')
Diff to No.1 - 12.3%
Jun 07 Jan 06 Jun 08 Jun 09 Jun 10 Jun 11 Jun 12
1.4%
1 Refer note slide at back of this presentation for source information
Retail main financial institution customer satisfaction1
CBA Peers
For
per
sona
l use
onl
y
69
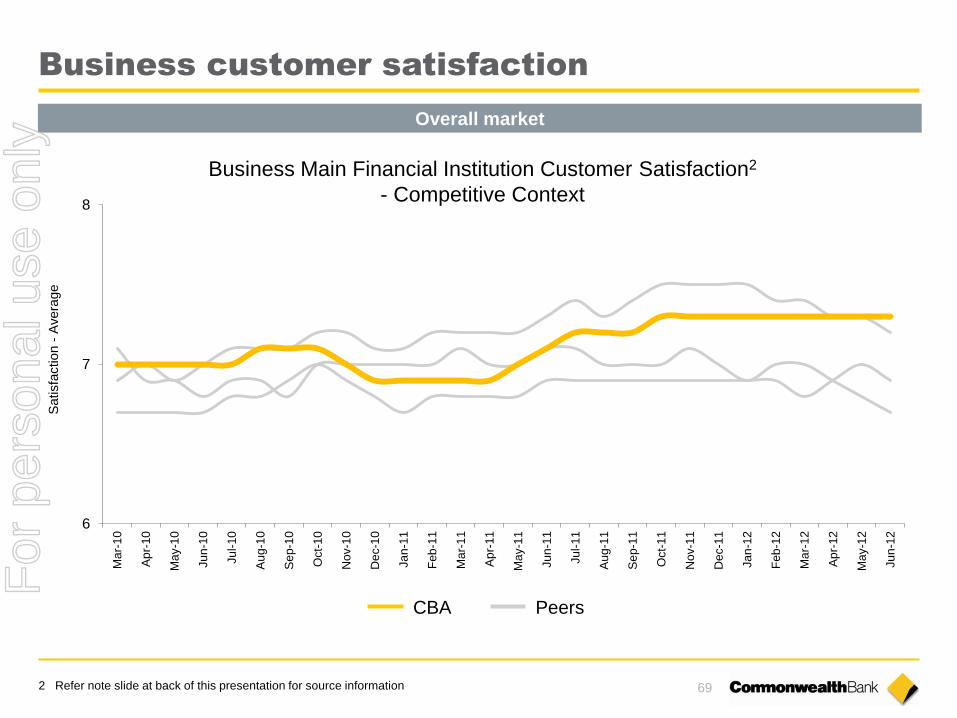
Business customer satisfaction
Overall market
6
7
8
Ma
r-1
0
Ap
r-10
Ma
y-1
0
Ju
n-1
0
Ju
l-10
Au
g-1
0
Se
p-1
0
Oct-
10
No
v-1
0
De
c-1
0
Ja
n-1
1
Feb
-11
Ma
r-1
1
Ap
r-11
Ma
y-1
1
Ju
n-1
1
Ju
l-11
Au
g-1
1
Se
p-1
1
Oct-
11
No
v-1
1
De
c-1
1
Ja
n-1
2
Feb
-12
Ma
r-1
2
Ap
r-12
Ma
y-1
2
Ju
n-1
2
Satisfa
ction -
Avera
ge
Business Main Financial Institution Customer Satisfaction2
- Competitive Context
2 Refer note slide at back of this presentation for source information
CBA Peers
For
per
sona
l use
onl
y
70
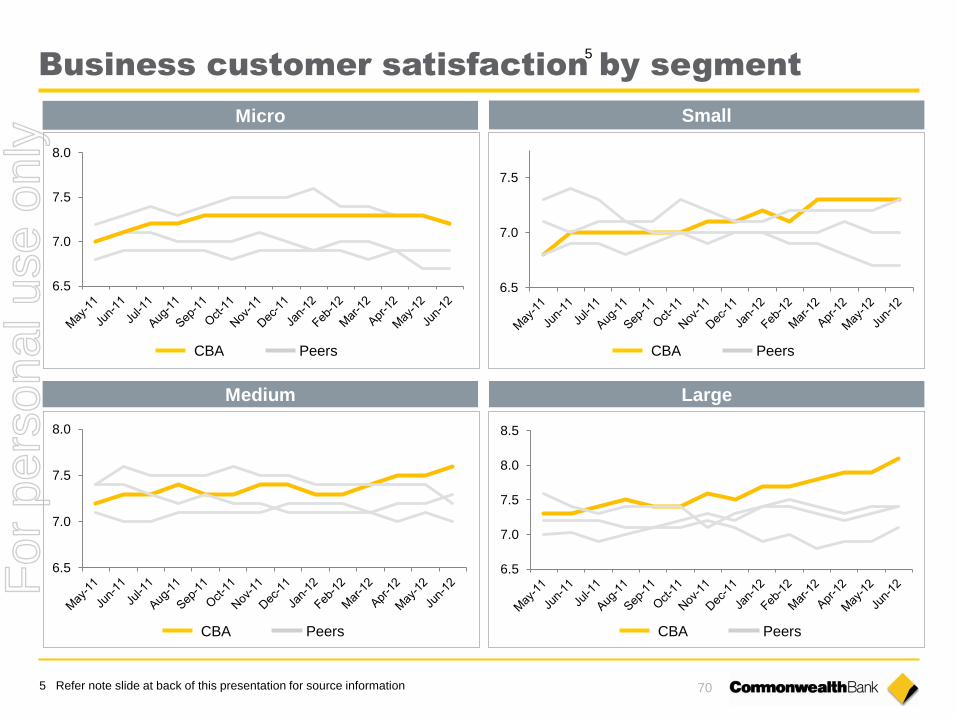
Business customer satisfaction by segment
Micro Small
Medium Large
6.5
7.0
7.5
8.0
6.5
7.0
7.5
6.5
7.0
7.5
8.0
6.5
7.0
7.5
8.0
8.5
5 Refer note slide at back of this presentation for source information
5
CBA Peers CBA Peers
CBA Peers CBA Peers
For
per
sona
l use
onl
y

71
Revitalised
front-line customer
interface
Single view of customer
across channels
CommSee
Revitalised Sales &
Service processes
NetBank
CommBiz
CommSec
FirstChoice
Legacy system replacement
Real-time banking
Straight-through processing
Concurrent process redesign
Best-in-class
online platforms
Core
Banking
Modernisation
Customer Strategic Advantage Core
A track record in technology delivery
For
per
sona
l use
onl
y
72
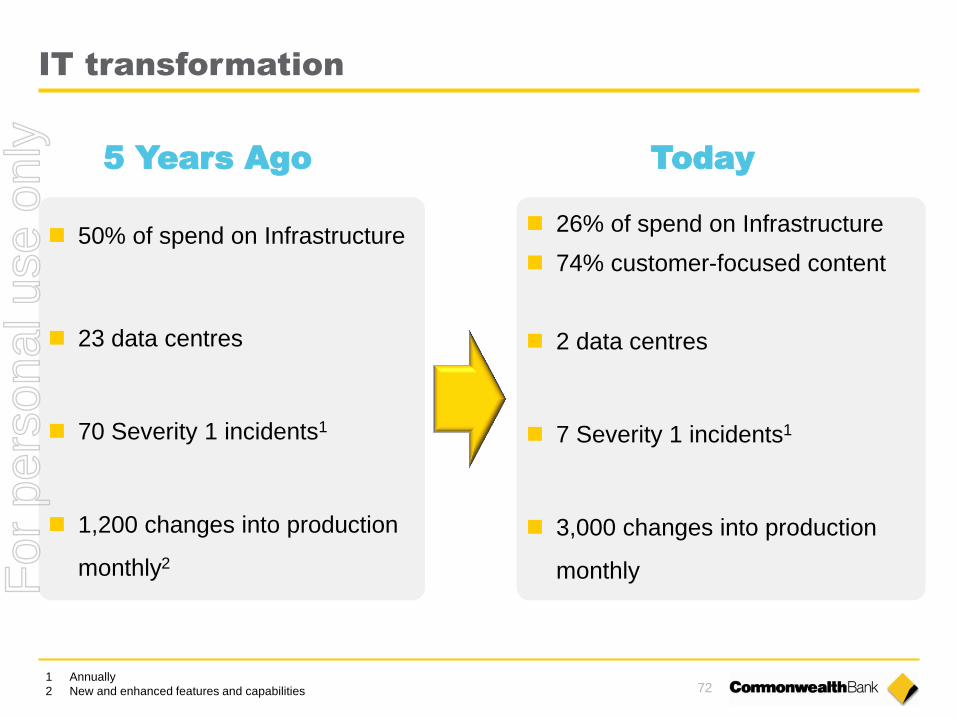
50% of spend on Infrastructure
23 data centres
70 Severity 1 incidents1
1,200 changes into production
monthly2
IT transformation
26% of spend on Infrastructure
74% customer-focused content
2 data centres
7 Severity 1 incidents1
3,000 changes into production
monthly
5 Years Ago Today
1 Annually
2 New and enhanced features and capabilities
For
per
sona
l use
onl
y
73
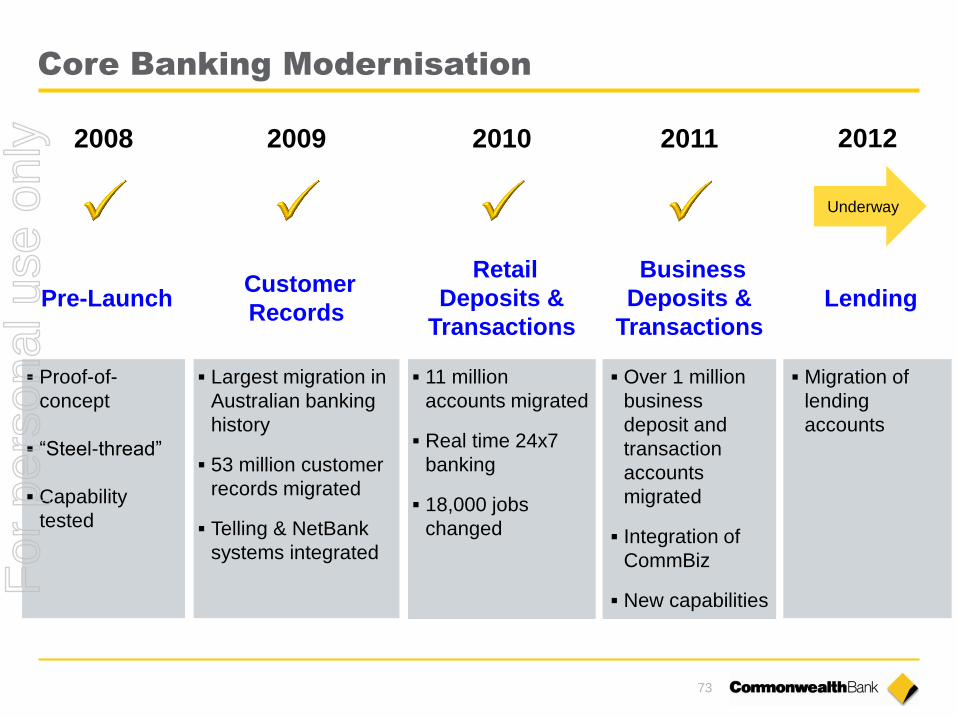
Core Banking Modernisation
Proof-of-
concept
“Steel-thread”
Capability
tested
Largest migration in
Australian banking
history
53 million customer
records migrated
Telling & NetBank
systems integrated
11 million
accounts migrated
Real time 24x7
banking
18,000 jobs
changed
Over 1 million
business
deposit and
transaction
accounts
migrated
Integration of
CommBiz
New capabilities
Migration of
lending
accounts
2008 2009 2010 2011 2012
Pre-Launch Customer
Records
Retail
Deposits &
Transactions
Business
Deposits &
Transactions
Lending
Underway
For
per
sona
l use
onl
y
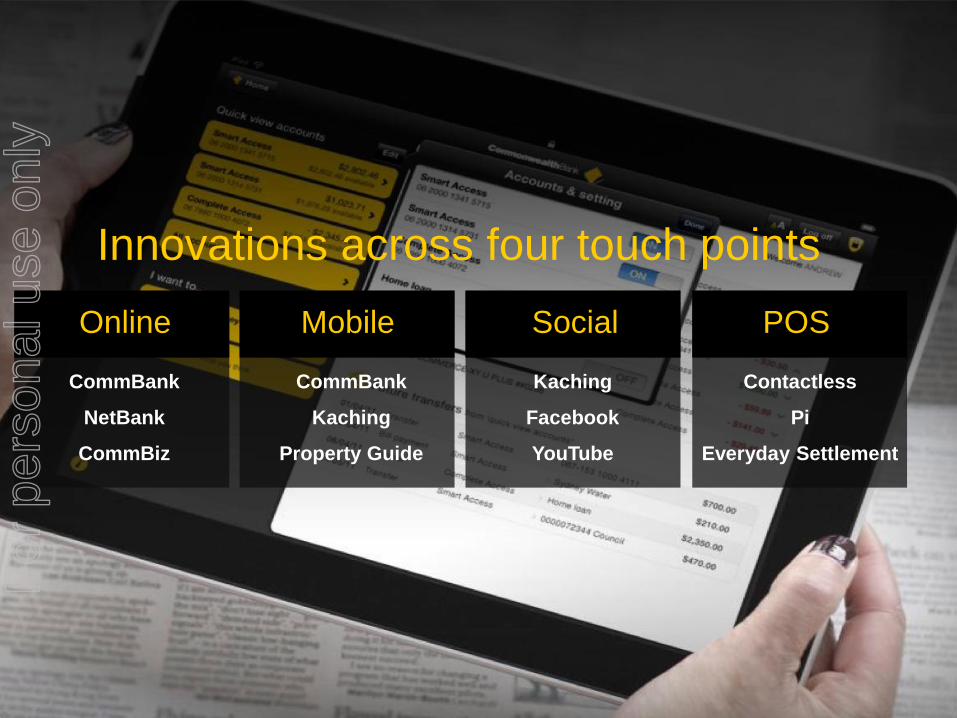
Innovations across four touch points
CommBank
NetBank
CommBiz
CommBank
Kaching
Property Guide
Kaching
YouTube
Contactless
Pi
Everyday Settlement
Online Mobile Social POS
For
per
sona
l use
onl
y
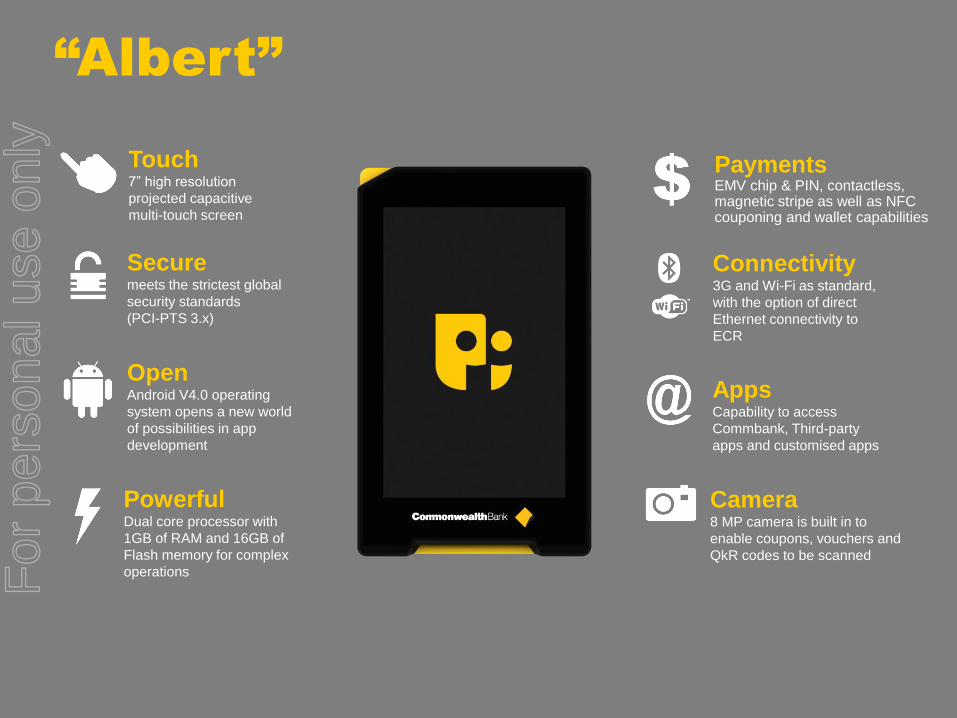
Secure meets the strictest global
security standards
(PCI-PTS 3.x)
Open Android V4.0 operating
system opens a new world
of possibilities in app
development
Touch 7” high resolution
projected capacitive
multi-touch screen
Powerful Dual core processor with
1GB of RAM and 16GB of
Flash memory for complex
operations
Apps Capability to access
Commbank, Third-party
apps and customised apps
Connectivity 3G and Wi-Fi as standard,
with the option of direct
Ethernet connectivity to
ECR
Camera 8 MP camera is built in to
enable coupons, vouchers and
QkR codes to be scanned
Payments EMV chip & PIN, contactless, magnetic stripe as well as NFC couponing and wallet capabilities
“Albert”
For
per
sona
l use
onl
y
76
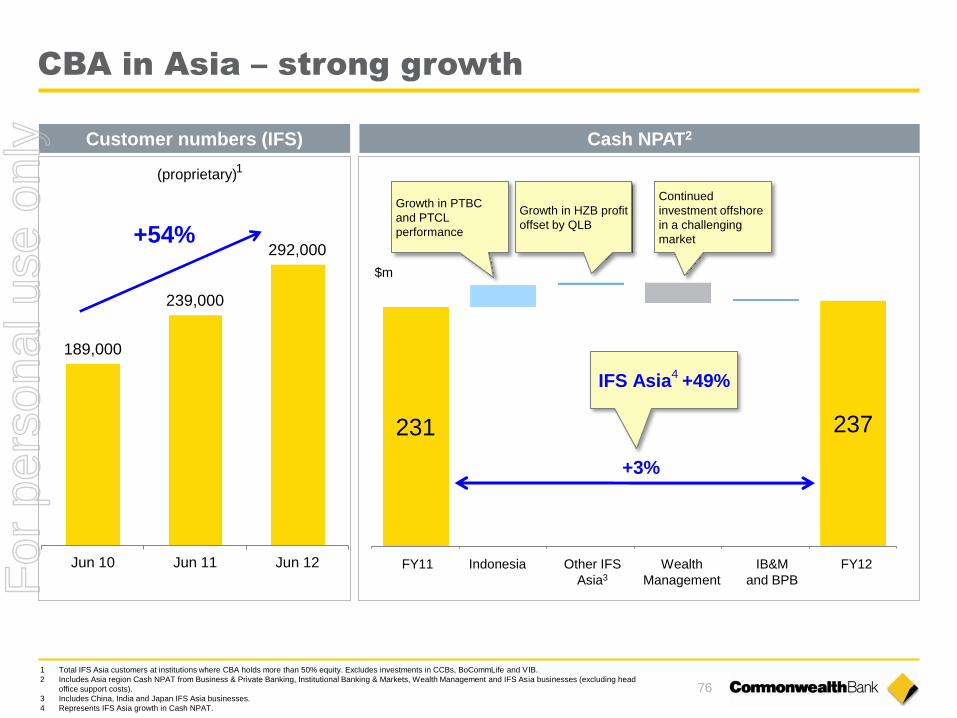
CBA in Asia – strong growth
189,000
239,000
292,000
Jun 10 Jun 11 Jun 12
+54%
(proprietary) 1
Customer numbers (IFS) Cash NPAT2
231 237
Growth in PTBC
and PTCL
performance
Indonesia Wealth
Management
IB&M
and BPB
+3%
$m
Continued
investment offshore
in a challenging
market
IFS Asia +49%
Growth in HZB profit
offset by QLB
Other IFS
Asia3
4
FY11 FY12
1 Total IFS Asia customers at institutions where CBA holds more than 50% equity. Excludes investments in CCBs, BoCommLife and VIB.
2 Includes Asia region Cash NPAT from Business & Private Banking, Institutional Banking & Markets, Wealth Management and IFS Asia businesses (excluding head
office support costs).
3 Includes China, India and Japan IFS Asia businesses.
4 Represents IFS Asia growth in Cash NPAT.
For
per
sona
l use
onl
y

77
CBA in Asia
Mumbai
Ho Chi Minh City
Hanoi
Hong Kong
Hangzhou
Henan Province
Jinan
Beijing
Shanghai Tokyo
Singapore
Jakarta
Country Representation as at June 2012
China Bank of Hangzhou (20%) – 117 branches
Qilu Bank (20%) – 84 branches
County Banking (84%) –
5 Banks in Henan Province
Beijing Representative Office
BoCommLife JV (37.5%) –
operating in 3 provinces
Shanghai (China Head Office)
First State Cinda JV, FSI Hong Kong
Hong Kong and Shanghai branches
Indonesia PTBC (97.86%) – 92 branches and 141
ATMs
PT Commonwealth Life (80%) –
28 life offices
First State Investments
Vietnam VIB (20%) – 162 branches
CBA Branch Ho Chi Minh City and 24 ATMs
Hanoi Representative Office
India CBA branch, Mumbai
Japan CBA branch, Tokyo, FSI Tokyo
Singapore CBA branch, First State Investments
For
per
sona
l use
onl
y
78
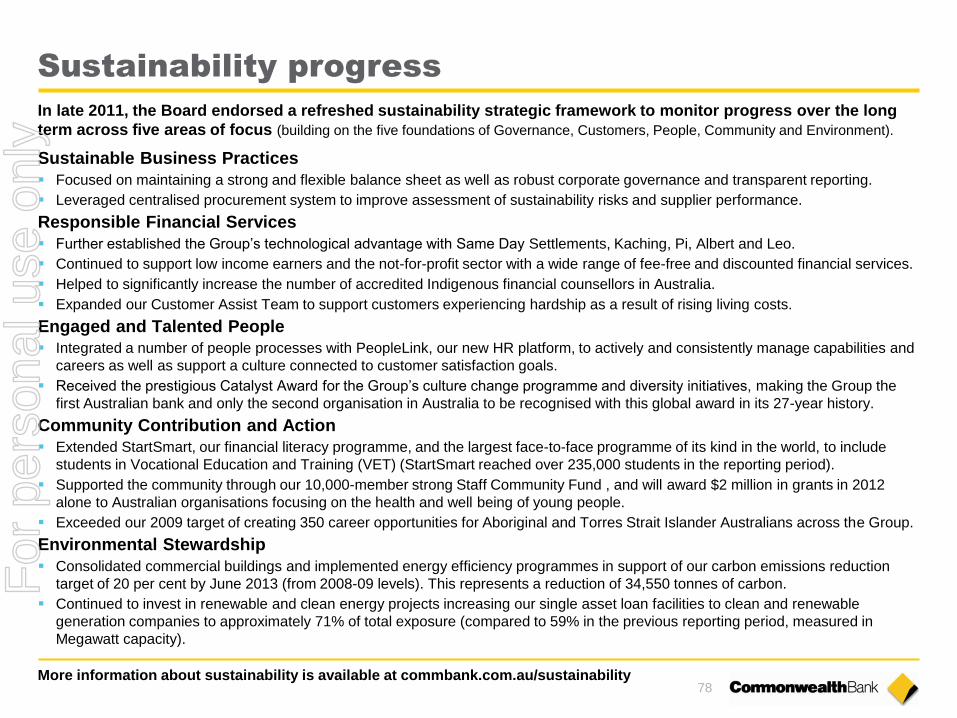
Sustainability progress
More information about sustainability is available at commbank.com.au/sustainability
Sustainable Business Practices
Focused on maintaining a strong and flexible balance sheet as well as robust corporate governance and transparent reporting.
Leveraged centralised procurement system to improve assessment of sustainability risks and supplier performance.
Responsible Financial Services
Further established the Group’s technological advantage with Same Day Settlements, Kaching, Pi, Albert and Leo.
Continued to support low income earners and the not-for-profit sector with a wide range of fee-free and discounted financial services.
Helped to significantly increase the number of accredited Indigenous financial counsellors in Australia.
Expanded our Customer Assist Team to support customers experiencing hardship as a result of rising living costs.
Engaged and Talented People
Integrated a number of people processes with PeopleLink, our new HR platform, to actively and consistently manage capabilities and
careers as well as support a culture connected to customer satisfaction goals.
Received the prestigious Catalyst Award for the Group’s culture change programme and diversity initiatives, making the Group the
first Australian bank and only the second organisation in Australia to be recognised with this global award in its 27-year history.
Community Contribution and Action
Extended StartSmart, our financial literacy programme, and the largest face-to-face programme of its kind in the world, to include
students in Vocational Education and Training (VET) (StartSmart reached over 235,000 students in the reporting period).
Supported the community through our 10,000-member strong Staff Community Fund , and will award $2 million in grants in 2012
alone to Australian organisations focusing on the health and well being of young people.
Exceeded our 2009 target of creating 350 career opportunities for Aboriginal and Torres Strait Islander Australians across the Group.
Environmental Stewardship
Consolidated commercial buildings and implemented energy efficiency programmes in support of our carbon emissions reduction
target of 20 per cent by June 2013 (from 2008-09 levels). This represents a reduction of 34,550 tonnes of carbon.
Continued to invest in renewable and clean energy projects increasing our single asset loan facilities to clean and renewable
generation companies to approximately 71% of total exposure (compared to 59% in the previous reporting period, measured in
Megawatt capacity).
In late 2011, the Board endorsed a refreshed sustainability strategic framework to monitor progress over the long
term across five areas of focus (building on the five foundations of Governance, Customers, People, Community and Environment).
For
per
sona
l use
onl
y
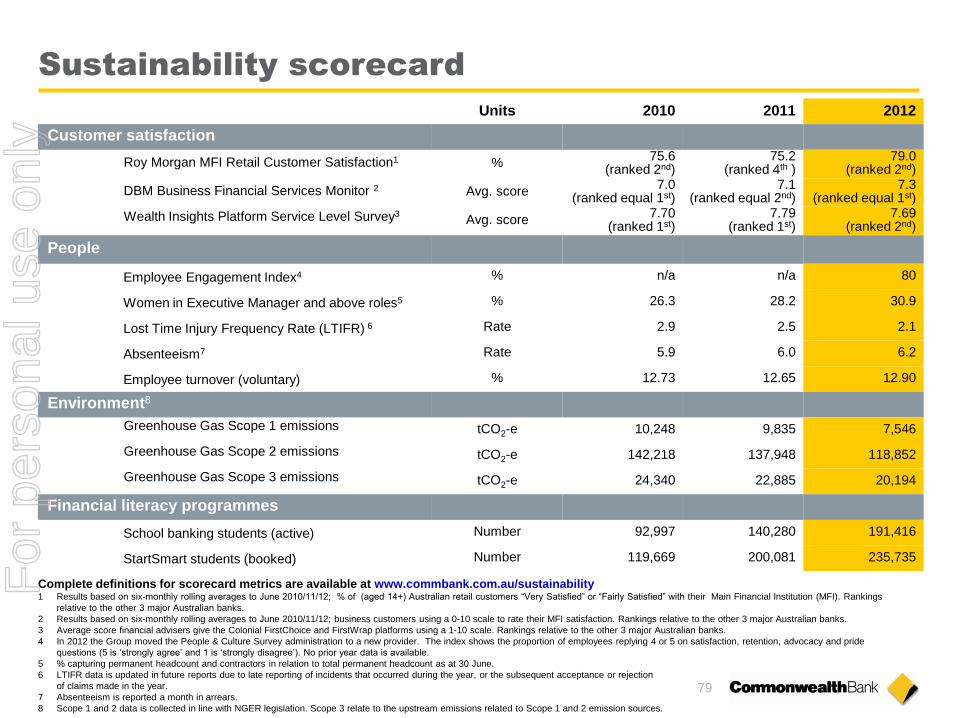
Sustainability scorecard
Units 2010 2011 2012
Customer satisfaction
Roy Morgan MFI Retail Customer Satisfaction1 % 75.6
(ranked 2nd) 75.2
(ranked 4th ) 79.0
(ranked 2nd)
DBM Business Financial Services Monitor 2 Avg. score 7.0
(ranked equal 1st) 7.1
(ranked equal 2nd) 7.3
(ranked equal 1st)
Wealth Insights Platform Service Level Survey3 Avg. score 7.70
(ranked 1st) 7.79
(ranked 1st) 7.69
(ranked 2nd)
People
Employee Engagement Index4 % n/a n/a 80
Women in Executive Manager and above roles5 % 26.3 28.2 30.9
Lost Time Injury Frequency Rate (LTIFR) 6 Rate 2.9 2.5 2.1
Absenteeism7 Rate 5.9 6.0 6.2
Employee turnover (voluntary) % 12.73 12.65 12.90
Environment8
Greenhouse Gas Scope 1 emissions tCO2-e 10,248 9,835 7,546
Greenhouse Gas Scope 2 emissions tCO2-e 142,218 137,948 118,852
Greenhouse Gas Scope 3 emissions tCO2-e 24,340 22,885 20,194
Financial literacy programmes
School banking students (active) Number 92,997 140,280 191,416
StartSmart students (booked) Number 119,669 200,081 235,735
Complete definitions for scorecard metrics are available at www.commbank.com.au/sustainability 1 Results based on six-monthly rolling averages to June 2010/11/12; % of (aged 14+) Australian retail customers “Very Satisfied” or “Fairly Satisfied” with their Main Financial Institution (MFI). Rankings
relative to the other 3 major Australian banks.
2 Results based on six-monthly rolling averages to June 2010/11/12; business customers using a 0-10 scale to rate their MFI satisfaction. Rankings relative to the other 3 major Australian banks.
3 Average score financial advisers give the Colonial FirstChoice and FirstWrap platforms using a 1-10 scale. Rankings relative to the other 3 major Australian banks.
4 In 2012 the Group moved the People & Culture Survey administration to a new provider. The index shows the proportion of employees replying 4 or 5 on satisfaction, retention, advocacy and pride
questions (5 is ‘strongly agree’ and 1 is ‘strongly disagree’). No prior year data is available.
5 % capturing permanent headcount and contractors in relation to total permanent headcount as at 30 June.
6 LTIFR data is updated in future reports due to late reporting of incidents that occurred during the year, or the subsequent acceptance or rejection
of claims made in the year.
7 Absenteeism is reported a month in arrears.
8 Scope 1 and 2 data is collected in line with NGER legislation. Scope 3 relate to the upstream emissions related to Scope 1 and 2 emission sources.
79
For
per
sona
l use
onl
y

80
2003 2004 2005 2006 2007 2008 2009 2010 2011 2012
ATMs (all transactions*)
EFTPOS (all transactions, including credit cards)
Internet (value transactions)
40
345
m m
700
1,110
325 325
m
Transaction volumes
NetBank logins via
Mobile Device*
* Tablet and mobile
2003 2004 2005 2006 2007 2008 2009 2010 2011 2012
* All cardholder transactions at Australian-located CBA ATMs
2003 2004 2005 2006 2007 2008 2009 2010 2011 2012
Jun 11 26%
Jun 12 45%
Calendar years to 2006; financial years thereafter Calendar years to 2007; financial years thereafter
2003 2004 2005 2006 2007 2008 2009 2010 2011 2012
130
90
Branch (deposits & withdrawals)
m
All figures are approximates.
For
per
sona
l use
onl
y
Index
Strategy 60
Business Performance 81
Risk and Credit Quality 100
Capital, Funding & Liquidity 116
Economic Indicators 129 For
per
sona
l use
onl
y
82
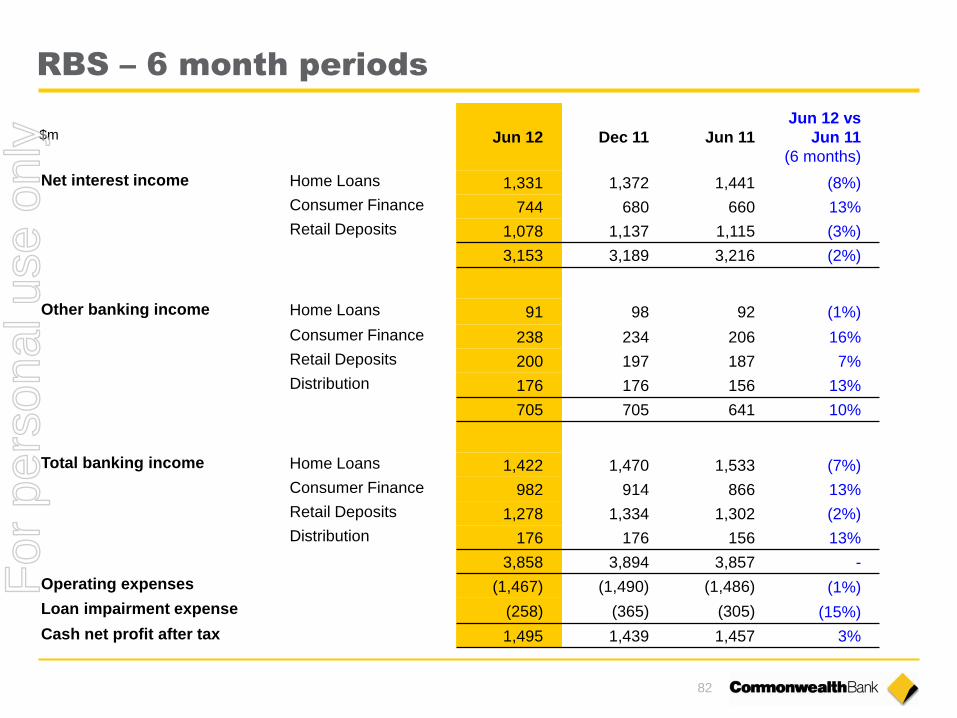
RBS – 6 month periods
Jun 12 Dec 11 Jun 11
Jun 12 vs
Jun 11
(6 months)
Net interest income Home Loans 1,331 1,372 1,441 (8%)
Consumer Finance 744 680 660 13%
Retail Deposits 1,078 1,137 1,115 (3%)
3,153 3,189 3,216 (2%)
Other banking income Home Loans 91 98 92 (1%)
Consumer Finance 238 234 206 16%
Retail Deposits 200 197 187 7%
Distribution 176 176 156 13%
705 705 641 10%
Total banking income Home Loans 1,422 1,470 1,533 (7%)
Consumer Finance 982 914 866 13%
Retail Deposits 1,278 1,334 1,302 (2%)
Distribution 176 176 156 13%
3,858 3,894 3,857 -
Operating expenses (1,467) (1,490) (1,486) (1%)
Loan impairment expense (258) (365) (305) (15%)
Cash net profit after tax 1,495 1,439 1,457 3%
$m
For
per
sona
l use
onl
y
83
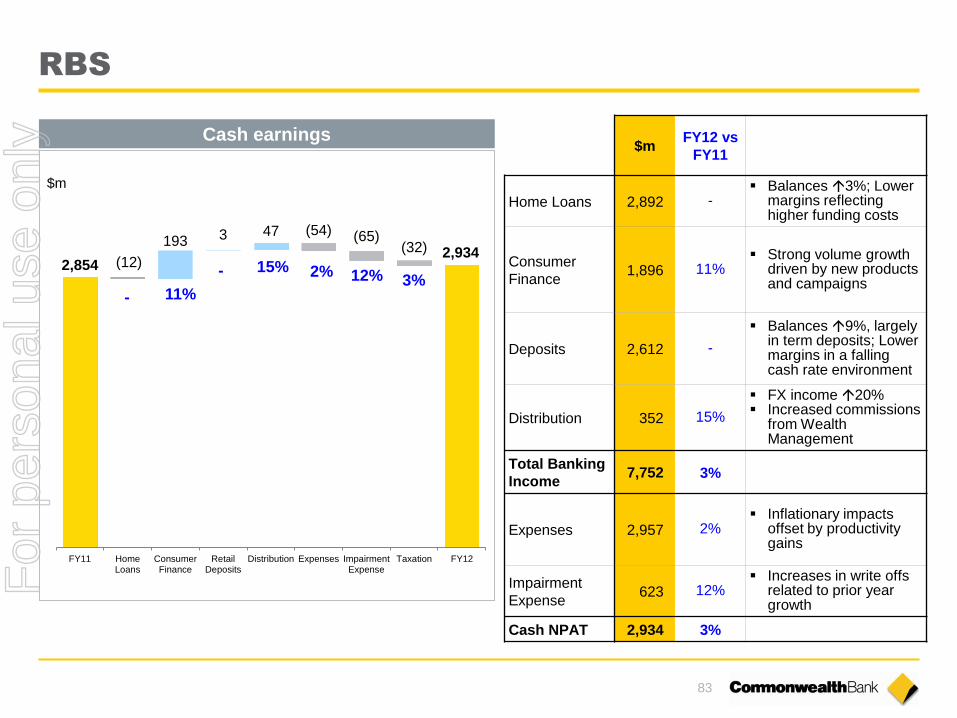
RBS
2,854 2,934
(12)
193 3 47 (54) (65) (32)
FY11 HomeLoans
ConsumerFinance
RetailDeposits
Distribution Expenses ImpairmentExpense
Taxation FY12
3%
$m
- 11%
- 15% 2% 12%
$m FY12 vs
FY11
Home Loans 2,892 - Balances 3%; Lower
margins reflecting higher funding costs
Consumer
Finance 1,896 11%
Strong volume growth driven by new products and campaigns
Deposits 2,612 -
Balances 9%, largely in term deposits; Lower margins in a falling cash rate environment
Distribution 352 15%
FX income 20% Increased commissions
from Wealth Management
Total Banking
Income 7,752 3%
Expenses 2,957 2% Inflationary impacts
offset by productivity gains
Impairment
Expense 623 12%
Increases in write offs related to prior year growth
Cash NPAT 2,934 3%
Cash earnings
For
per
sona
l use
onl
y
84
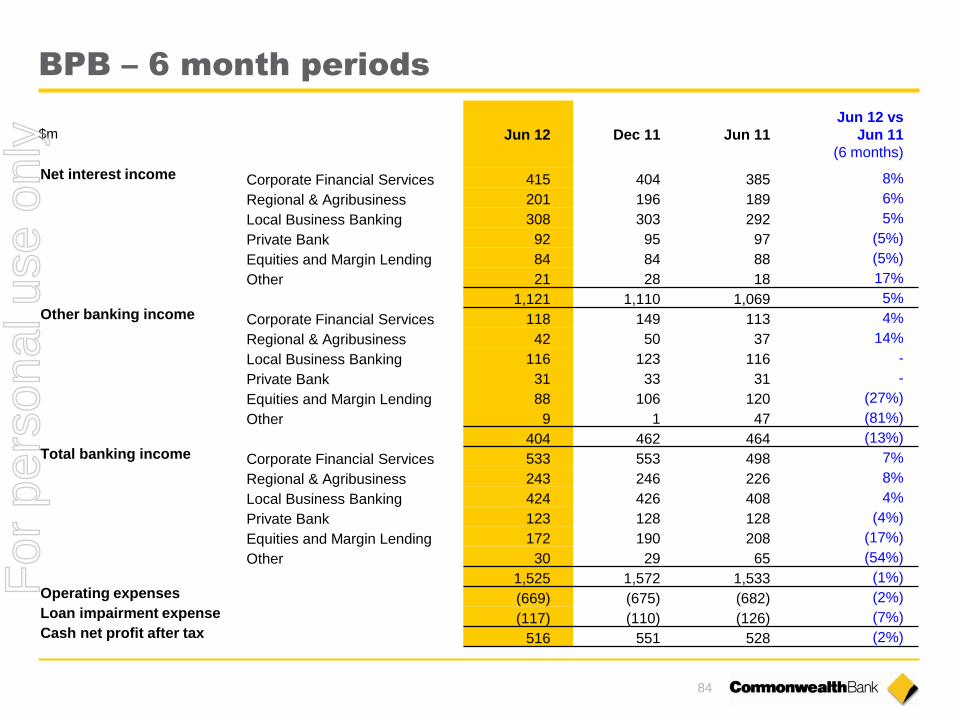
BPB – 6 month periods
Jun 12 Dec 11 Jun 11
Jun 12 vs
Jun 11
(6 months)
Net interest income Corporate Financial Services 415 404 385 8%
Regional & Agribusiness 201 196 189 6%
Local Business Banking 308 303 292 5%
Private Bank 92 95 97 (5%)
Equities and Margin Lending 84 84 88 (5%)
Other 21 28 18 17%
1,121 1,110 1,069 5% Other banking income Corporate Financial Services 118 149 113 4%
Regional & Agribusiness 42 50 37 14%
Local Business Banking 116 123 116 -
Private Bank 31 33 31 -
Equities and Margin Lending 88 106 120 (27%)
Other 9 1 47 (81%)
404 462 464 (13%) Total banking income Corporate Financial Services 533 553 498 7%
Regional & Agribusiness 243 246 226 8%
Local Business Banking 424 426 408 4%
Private Bank 123 128 128 (4%)
Equities and Margin Lending 172 190 208 (17%)
Other 30 29 65 (54%)
1,525 1,572 1,533 (1%) Operating expenses (669) (675) (682) (2%) Loan impairment expense (117) (110) (126) (7%) Cash net profit after tax 516 551 528 (2%)
$m
For
per
sona
l use
onl
y

85
BPB
1,030 1,067 58 (9)
34 (46)
FY11 Total BankingIncome
Expenses ImpairmentExpense
Taxation FY12
2%
1% (13%) 11%
$m FY12 vs
FY11
Corporate Financial
Services 1,086 10%
Lending balances 10% and higher demand for risk management products.
Regional &
Agribusiness 489 9%
Higher demand for risk management products and prudent lending margin management
Local Business
Banking 850 5%
Deposit balances 13%.
Asset Finance income 24% on higher balances and improved new business margins.
Private Banking 251 1%
Advisory income 10%, offset by higher funding costs impacting margins.
Equities & Margin
Lending 362 (12%)
Equities trading volumes 24%
Total Banking
Income 3,097 2%
Expenses (1,344) 1% Salary increases partly
offset by productivity initiatives.
Impairment Expense (227) (13%) Reflects underlying
quality of the business lending portfolio.
Cash NPAT 1,067 4%
Key segments Cash earnings
$m
For
per
sona
l use
onl
y

86
IB&M – 6 month periods
Jun 12 Dec 11 Jun 11
Jun 12 vs
Jun 11
(6 months)
Net interest income Institutional Banking 589 583 545 8%
Markets 116 121 115 1%
705 704 660 7%
Other banking income Institutional Banking 414 387 410 1%
Markets 63 73 137 (54%)
477 460 547 (13%)
Total banking income Institutional Banking 1,003 970 955 5%
Markets 179 194 252 (29%)
1,182 1,164 1,207 (2%)
Operating expenses (426) (425) (413) 3%
Operating performance 756 739 794 (5%)
Loan impairment expense (120) (33) (131) (8%)
Cash net profit after tax 513 547 506 1%
$m
For
per
sona
l use
onl
y

87
IB&M
$m
FY12
vs
FY11
Institutional
Banking 1,973 6%
Strong balance
growth and higher
leasing income
Markets 373 (39%)
Challenging market
conditions and
unfavourable CVA*
Total Banking
Income 2,346 (5%)
Expenses (851) 3%
Higher depreciation
and investment in
technology
Impairment
Expense (153) (53%)
Decrease in new
single name
exposures
Cash NPAT 1,060 6%
* Counterparty fair value adjustment.
Cash earnings
1,004 1,060
113 (215)
(19) (23)
171 29
FY11 InstitutionalBanking
CVA Markets Expenses ImpairmentExpense
Taxation FY12
6%
(Lge) (53%) 3%
(9%)
(4%)
$m
For
per
sona
l use
onl
y
88
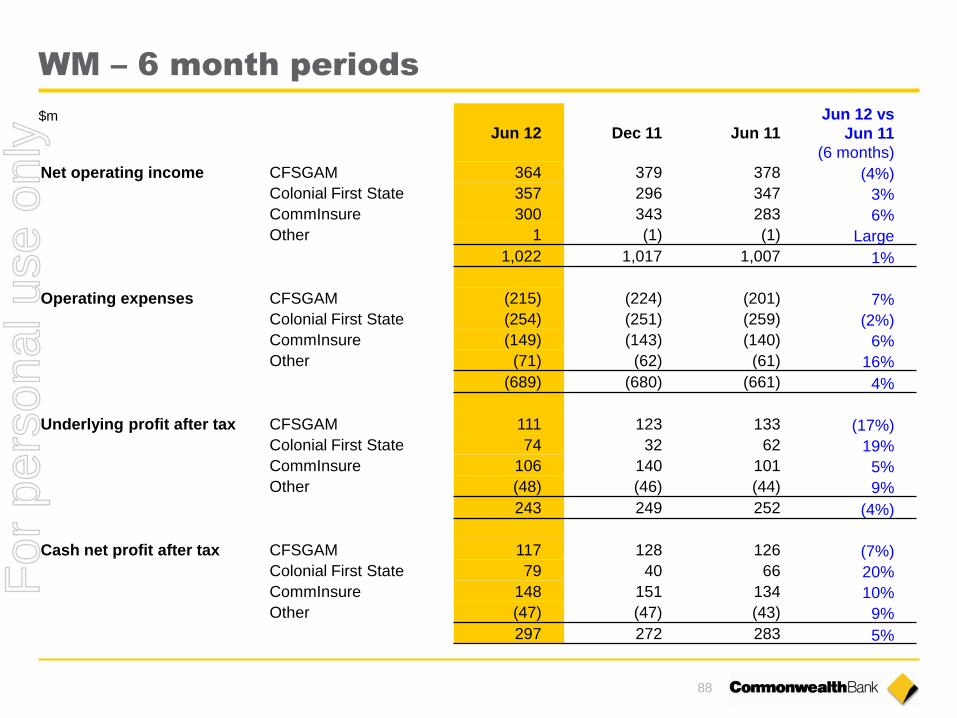
WM – 6 month periods
Jun 12 Dec 11 Jun 11
Jun 12 vs
Jun 11
(6 months)
Net operating income CFSGAM 364 379 378 (4%)
Colonial First State 357 296 347 3%
CommInsure 300 343 283 6%
Other 1 (1) (1) Large
1,022 1,017 1,007 1%
Operating expenses CFSGAM (215) (224) (201) 7%
Colonial First State (254) (251) (259) (2%)
CommInsure (149) (143) (140) 6%
Other (71) (62) (61) 16%
(689) (680) (661) 4%
Underlying profit after tax CFSGAM 111 123 133 (17%)
Colonial First State 74 32 62 19%
CommInsure 106 140 101 5%
Other (48) (46) (44) 9%
243 249 252 (4%)
Cash net profit after tax CFSGAM 117 128 126 (7%)
Colonial First State 79 40 66 20%
CommInsure 148 151 134 10%
Other (47) (47) (43) 9%
297 272 283 5%
$m
For
per
sona
l use
onl
y
89
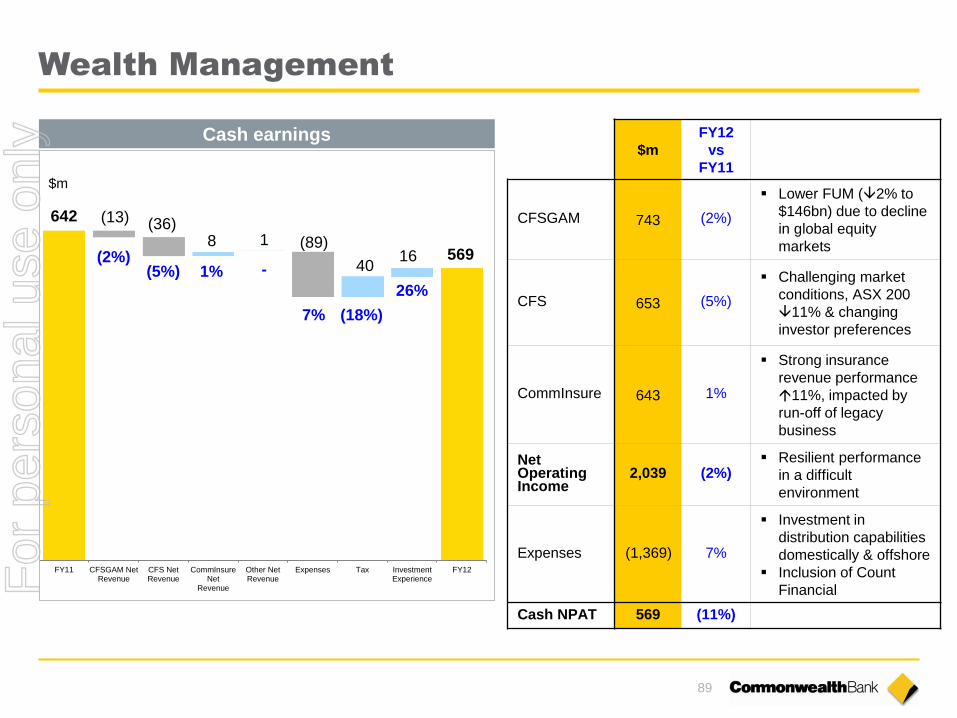
642
569
(13) (36) 8 1 (89)
40 16
FY11 CFSGAM NetRevenue
CFS NetRevenue
CommInsureNet
Revenue
Other NetRevenue
Expenses Tax InvestmentExperience
FY12
Wealth Management
(2%) (5%) 1% -
7% (18%)
26%
$m
$m
FY12
vs
FY11
CFSGAM 743 (2%)
Lower FUM (2% to
$146bn) due to decline
in global equity
markets
CFS 653 (5%)
Challenging market
conditions, ASX 200
11% & changing
investor preferences
CommInsure 643 1%
Strong insurance
revenue performance
11%, impacted by
run-off of legacy
business
Net Operating Income
2,039 (2%) Resilient performance
in a difficult
environment
Expenses (1,369) 7%
Investment in
distribution capabilities
domestically & offshore
Inclusion of Count
Financial
Cash NPAT 569 (11%)
Cash earnings
For
per
sona
l use
onl
y
90
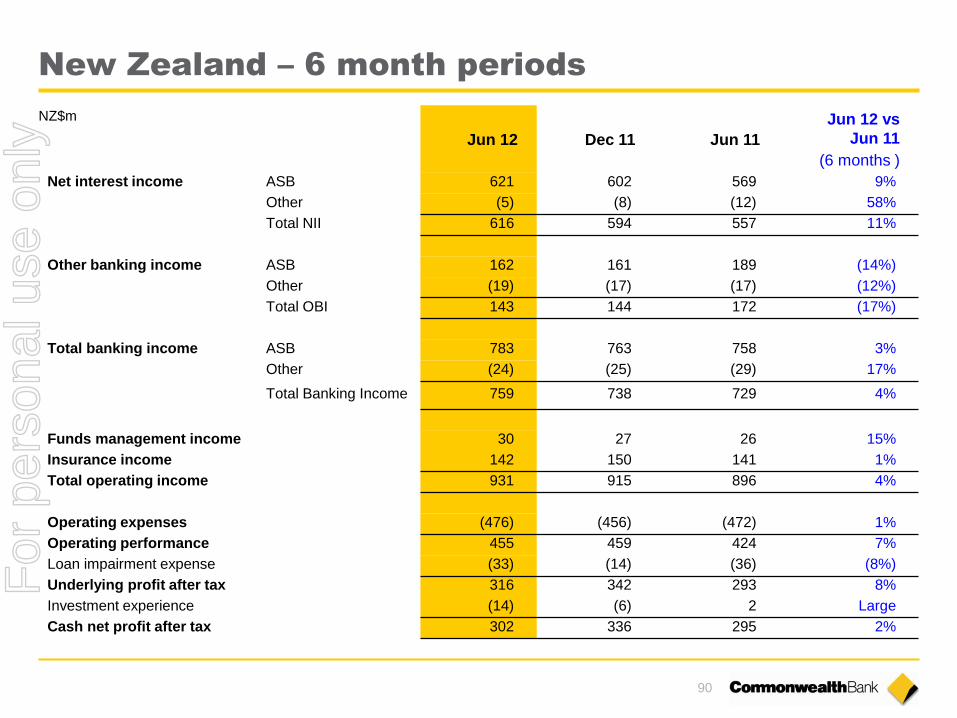
New Zealand – 6 month periods
Jun 12 Dec 11 Jun 11
Jun 12 vs
Jun 11
(6 months )
Net interest income ASB 621 602 569 9%
Other (5) (8) (12) 58%
Total NII 616 594 557 11%
Other banking income ASB 162 161 189 (14%)
Other (19) (17) (17) (12%)
Total OBI 143 144 172 (17%)
Total banking income ASB 783 763 758 3%
Other (24) (25) (29) 17%
Total Banking Income 759 738 729 4%
Funds management income 30 27 26 15%
Insurance income 142 150 141 1%
Total operating income 931 915 896 4%
Operating expenses (476) (456) (472) 1%
Operating performance 455 459 424 7%
Loan impairment expense (33) (14) (36) (8%)
Underlying profit after tax 316 342 293 8%
Investment experience (14) (6) 2 Large
Cash net profit after tax 302 336 295 2%
NZ$m
For
per
sona
l use
onl
y
91
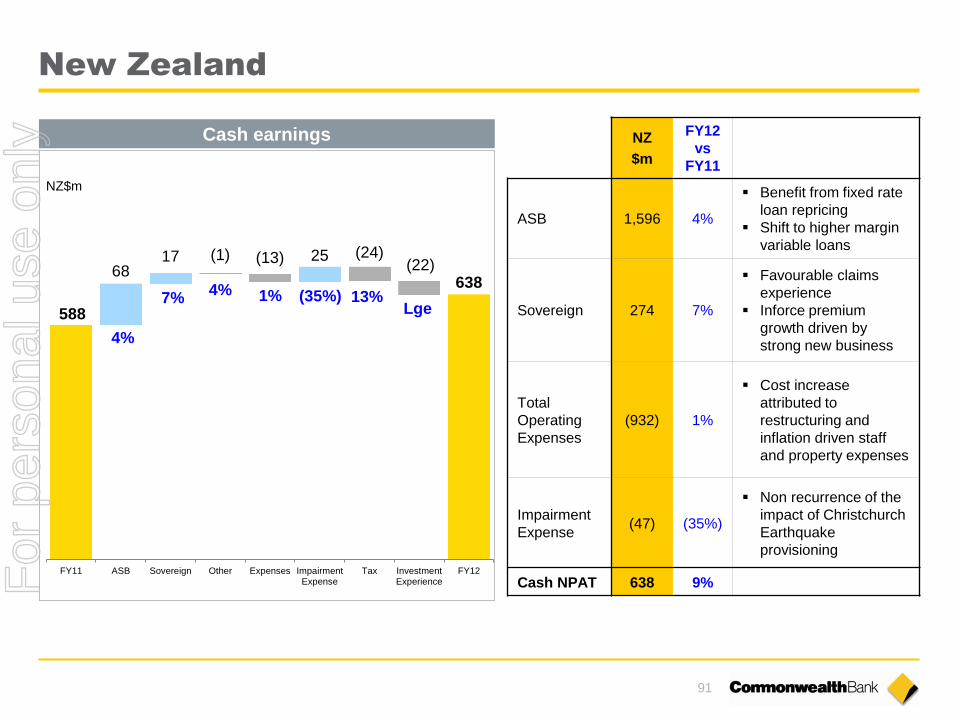
New Zealand
588
638 68
17 (1) (13) 25 (24) (22)
FY11 ASB Sovereign Other Expenses ImpairmentExpense
Tax InvestmentExperience
FY12
(35%) 13% Lge
4%
1% 4% 7%
NZ$m
NZ
$m
FY12
vs
FY11
ASB 1,596 4%
Benefit from fixed rate
loan repricing
Shift to higher margin
variable loans
Sovereign 274 7%
Favourable claims
experience
Inforce premium
growth driven by
strong new business
Total
Operating
Expenses
(932) 1%
Cost increase
attributed to
restructuring and
inflation driven staff
and property expenses
Impairment
Expense (47) (35%)
Non recurrence of the
impact of Christchurch
Earthquake
provisioning
Cash NPAT 638 9%
Cash earnings
For
per
sona
l use
onl
y

92
Bankwest – 6 month periods
Jun 12 Dec 11 Jun 11
Jun 12 vs
Jun 11
(6 months)
Net interest income 709 748 741 (4%)
Other banking income 104 103 102 2%
Total banking income 813 851 843 (4%)
Operating expenses (422) (430) (441) (4%)
Loan impairment expense (23) (38) (60) (62%)
Net profit before tax 368 383 342 8%
Corporate tax expense (112) (115) (103) 9%
Cash net profit after tax 256 268 239 7%
$m
For
per
sona
l use
onl
y
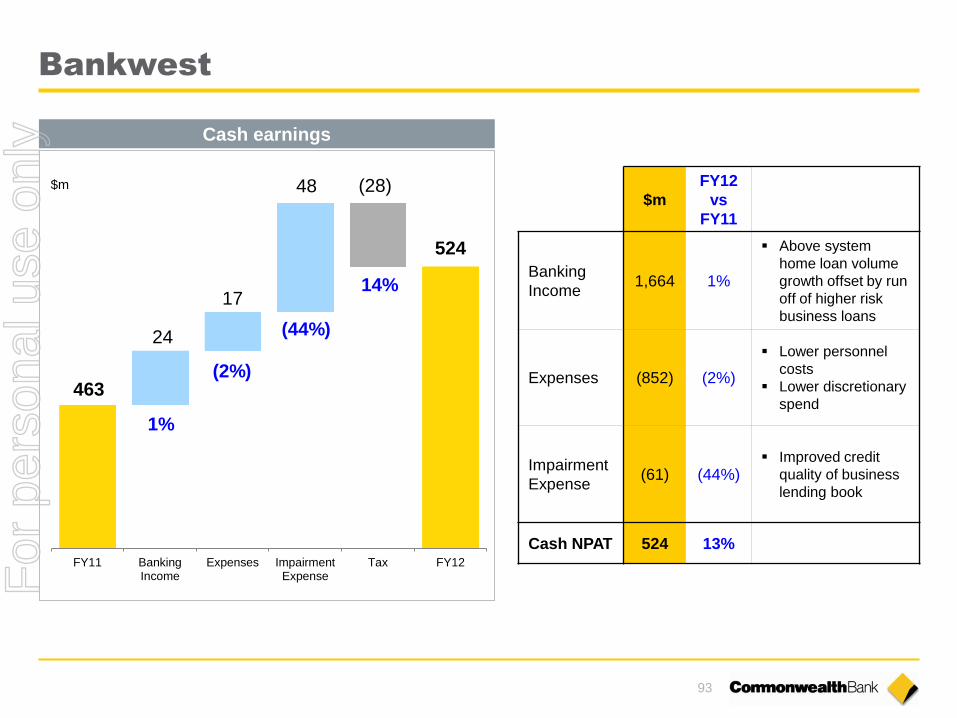
93
463
524
24
17
48 (28)
FY11 BankingIncome
Expenses ImpairmentExpense
Tax FY12
Bankwest
1%
(44%)
14%
$m
$m
FY12
vs
FY11
Banking
Income 1,664 1%
Above system
home loan volume
growth offset by run
off of higher risk
business loans
Expenses (852) (2%)
Lower personnel
costs
Lower discretionary
spend
Impairment
Expense (61) (44%)
Improved credit
quality of business
lending book
Cash NPAT 524 13%
(2%)
Cash earnings
For
per
sona
l use
onl
y
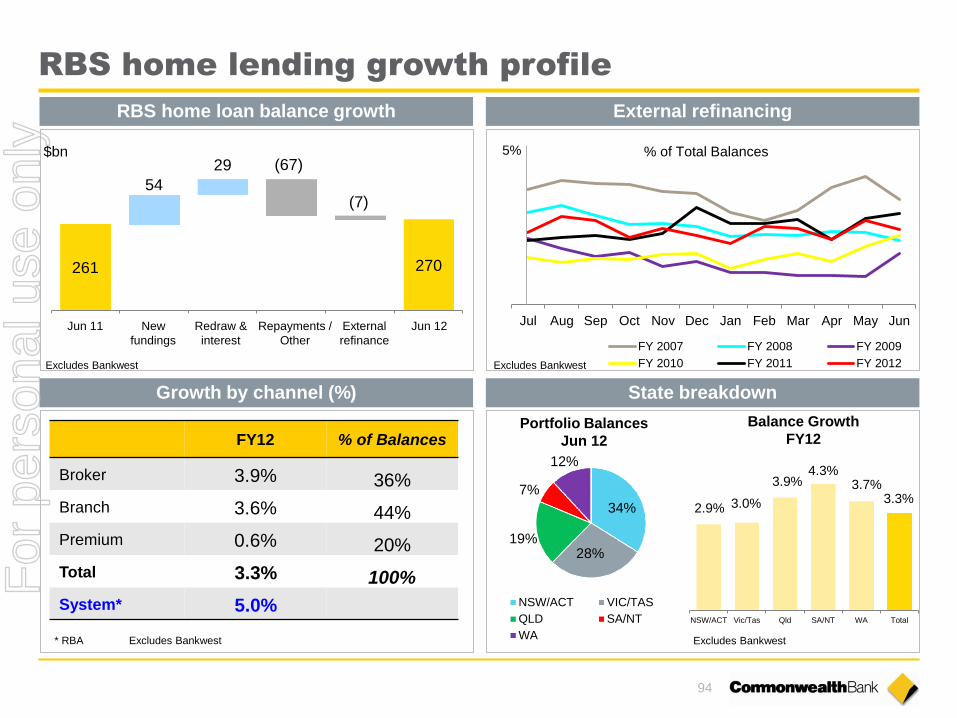
94
RBS home lending growth profile
Jul Aug Sep Oct Nov Dec Jan Feb Mar Apr May Jun
FY 2007 FY 2008 FY 2009
FY 2010 FY 2011 FY 2012
5% % of Total Balances
Excludes Bankwest
Growth by channel (%)
External refinancing
FY12 % of Balances
Broker 3.9% 36%
Branch 3.6% 44%
Premium 0.6% 20%
Total 3.3% 100%
System* 5.0%
Excludes Bankwest
2.9% 3.0%
3.9% 4.3%
3.7% 3.3%
NSW/ACT Vic/Tas Qld SA/NT WA Total
Excludes Bankwest
State breakdown
34%
28% 19%
7%
12%
NSW/ACT VIC/TAS
QLD SA/NT
WA
Balance Growth
FY12 Portfolio Balances
Jun 12
* RBA
261 270
54
29 (67)
(7)
$bn
Jun 11 New
fundings
Redraw &
interest
Repayments /
Other
External
refinance
Jun 12
Excludes Bankwest
RBS home loan balance growth
For
per
sona
l use
onl
y
95
Deposit Funding
60%
Deposit Funding
63%
Basis Risk
Basis Risk + 1.39%
+ 1.78%
Wholesale Funding
40%
Wholesale Funding
37%
Increase in home
loan (SVR) rate
+1.24%
+1.45%
+1.30%
+1.65%
+1.86%
June 2011 vs
Pre-GFC
Current vs
Pre-GFC
Increase in home
loan (SVR) rate
+1.48%
Increase in retail funding costs* since Jun 07
* Retail Banking Services (assumes wholesale funding is 100% long term).
For
per
sona
l use
onl
y

96
Market shares
Jun 12 Dec 11 Jun 11
CBA BWA Combined CBA + BWA CBA + BWA
Home loans 21.7% 4.0% 25.7% 25.9% 25.8%
Credit cards1 20.8% 2.7% 23.4% 23.7% 23.0%
Personal lending 13.8% 1.0% 14.8% 14.6% 14.8%
Household deposits 26.0% 2.9% 28.9% 29.4% 30.0%
Retail deposits 22.5% 3.5% 26.0% 26.4% 26.9%
Business lending – APRA 13.2% 4.3% 17.5% 17.6% 18.0%
Business lending – RBA 14.2% 2.8% 17.0% 16.9% 16.7%
Business deposits – APRA 17.1% 3.3% 20.4% 20.5% 20.8%
Asset Finance 13.6% n/a 13.6% 13.7% 13.9%
Equities trading 5.5% n/a 5.5% 5.8% 5.9%
Australian retail funds – administrator view 15.1% 15.0% 15.1%
FirstChoice platform 11.6% 11.6% 11.5%
Australia life insurance (total risk) 13.4% 13.2% 12.5%
Australia life insurance (individual risk) 13.3% 13.3% 13.4%
NZ Lending for housing 21.6% 22.0% 22.1%
NZ Retail deposits 20.6% 21.0% 21.3%
NZ Lending to business 9.0% 9.0% 8.8%
NZ Retail FUM 18.8% 15.1% 14.5%
NZ Annual inforce premiums 30.3% 30.2% 30.1%
1 As at 31 May 2012.
2 As at 31 March 2012.
2
2
2
2
For
per
sona
l use
onl
y
97
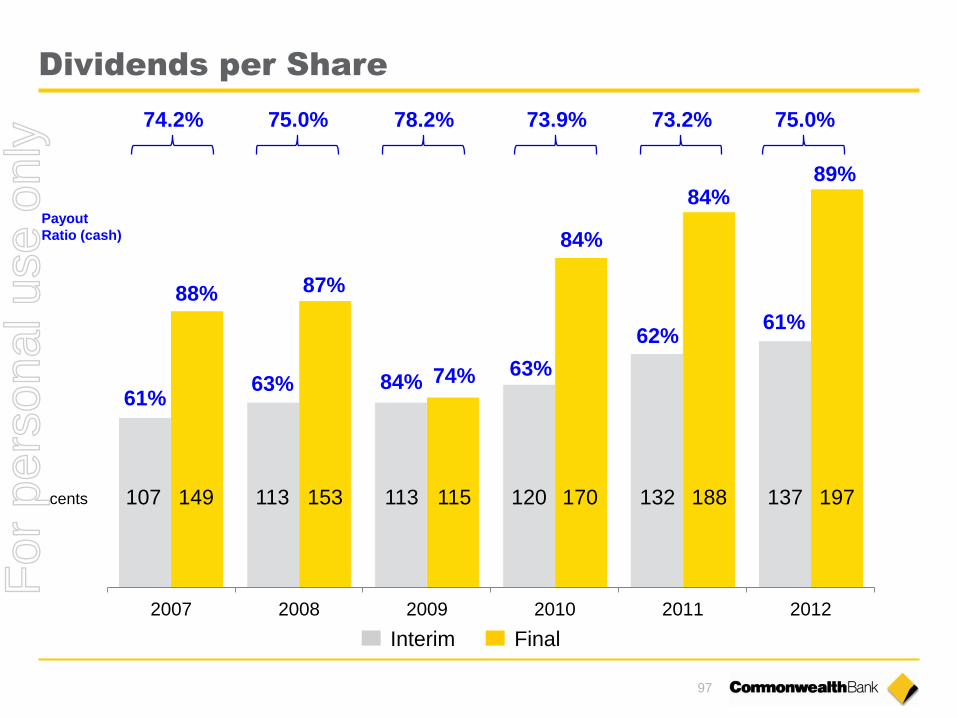
Dividends per Share
2007 2008 2009 2010 2011 2012
62%
63% 84% 63%
84%
74%
87%
Payout
Ratio (cash)
61%
Interim Final
88%
cents
84%
61%
89%
74.2% 75.0% 78.2% 73.9% 73.2% 75.0%
107 149 113 153 113 115 120 170 132 188 137 197
For
per
sona
l use
onl
y
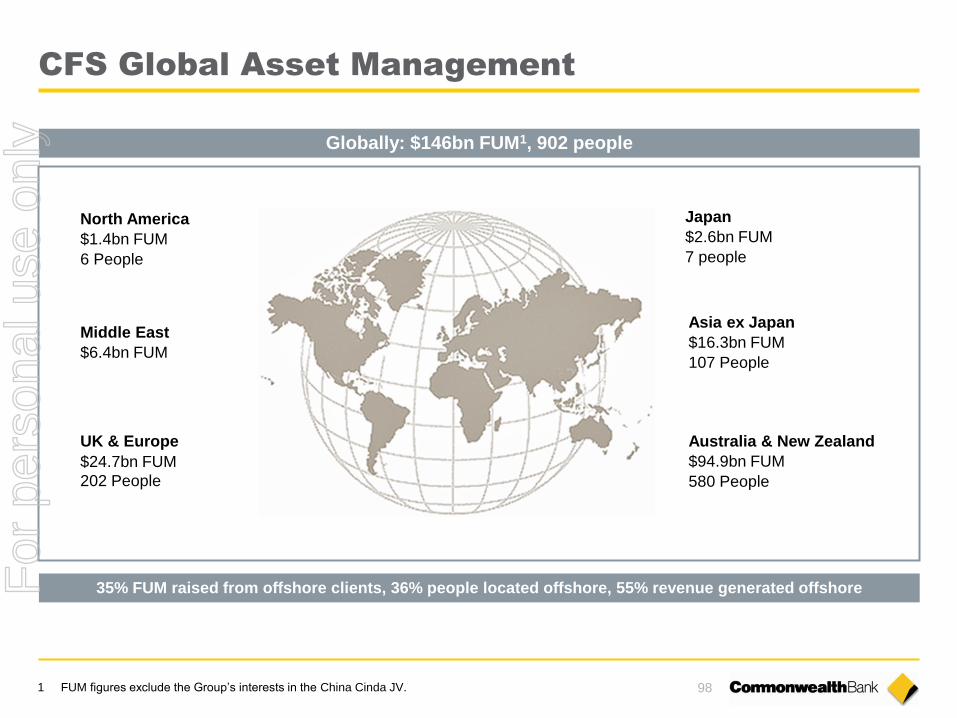
98 1 FUM figures exclude the Group’s interests in the China Cinda JV.
North America
$1.4bn FUM
6 People
Middle East
$6.4bn FUM
UK & Europe
$24.7bn FUM
202 People
Japan
$2.6bn FUM
7 people
Asia ex Japan
$16.3bn FUM
107 People
Australia & New Zealand
$94.9bn FUM
580 People
CFS Global Asset Management
Globally: $146bn FUM1, 902 people
35% FUM raised from offshore clients, 36% people located offshore, 55% revenue generated offshore For
per
sona
l use
onl
y
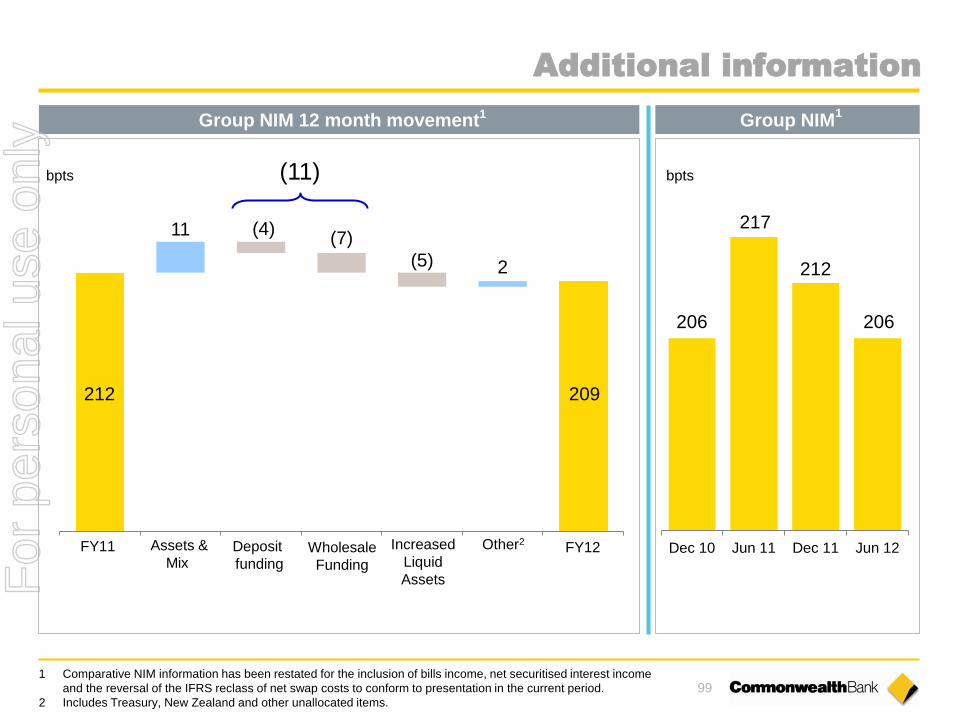
99
11 (4) (7)
(5) 2
bpts
212 209
FY11 FY12 Assets &
Mix Wholesale
Funding
Increased
Liquid
Assets
206
217
212
206
Dec 10 Jun 11 Dec 11 Jun 12
bpts
Group NIM 12 month movement Group NIM
Other2
Additional information
1 Comparative NIM information has been restated for the inclusion of bills income, net securitised interest income
and the reversal of the IFRS reclass of net swap costs to conform to presentation in the current period.
2 Includes Treasury, New Zealand and other unallocated items.
Deposit
funding
1 1
(11)
For
per
sona
l use
onl
y
Index
Strategy 60
Business Performance 81
Risk and Credit Quality 100
Capital, Funding & Liquidity 116
Economic Indicators 129 For
per
sona
l use
onl
y
101
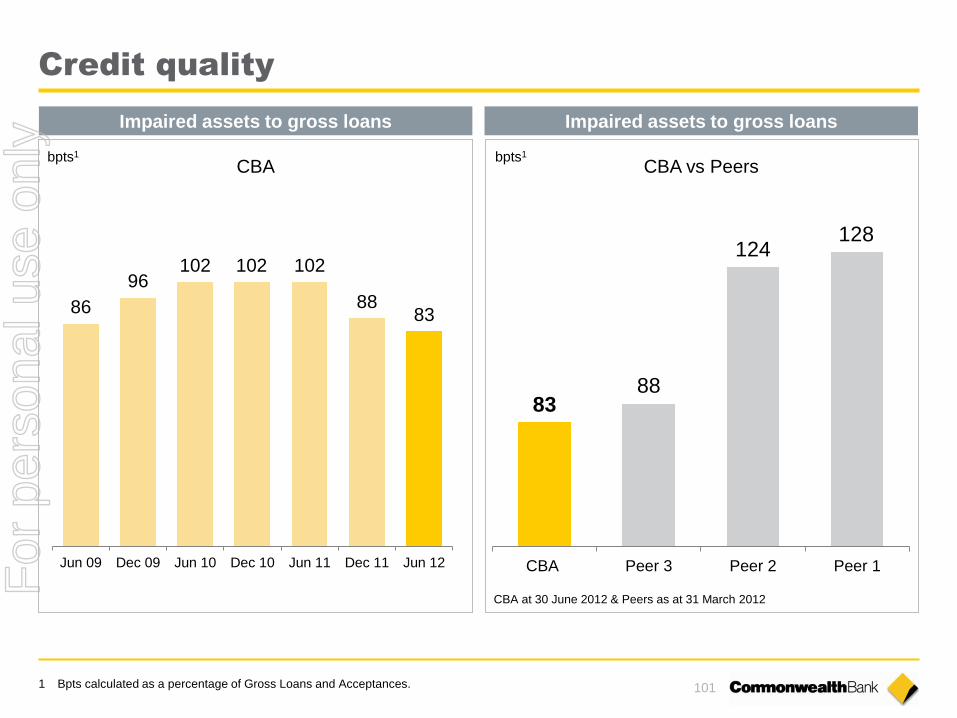
Credit quality
1 Bpts calculated as a percentage of Gross Loans and Acceptances.
83 88
124 128
CBA Peer 3 Peer 2 Peer 1
Impaired assets to gross loans
86
96 102 102 102
88 83
Jun 09 Dec 09 Jun 10 Dec 10 Jun 11 Dec 11 Jun 12
Impaired assets to gross loans
bpts1 CBA CBA vs Peers
CBA at 30 June 2012 & Peers as at 31 March 2012
bpts1
For
per
sona
l use
onl
y
102
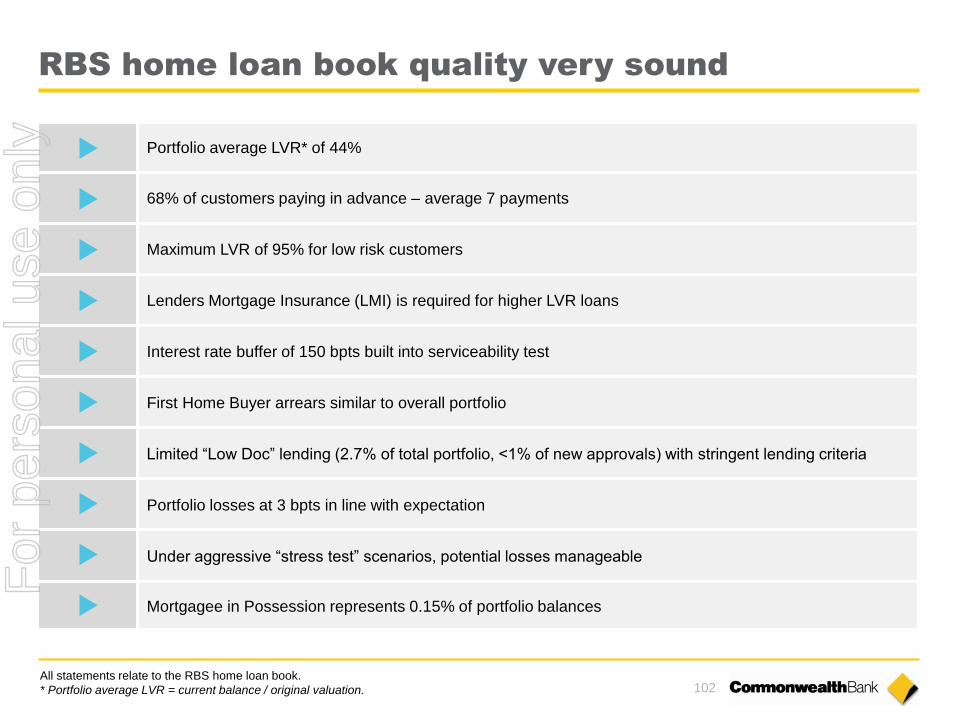
RBS home loan book quality very sound
Portfolio average LVR* of 44%
68% of customers paying in advance – average 7 payments
Maximum LVR of 95% for low risk customers
Lenders Mortgage Insurance (LMI) is required for higher LVR loans
Interest rate buffer of 150 bpts built into serviceability test
First Home Buyer arrears similar to overall portfolio
Limited “Low Doc” lending (2.7% of total portfolio, <1% of new approvals) with stringent lending criteria
Portfolio losses at 3 bpts in line with expectation
Under aggressive “stress test” scenarios, potential losses manageable
Mortgagee in Possession represents 0.15% of portfolio balances
All statements relate to the RBS home loan book.
* Portfolio average LVR = current balance / original valuation.
For
per
sona
l use
onl
y

103
Portfolio Jun 12
Total Balances - Spot ($bn) 1 351
Total Accounts (m) 1.4
Fundings ($bn) 2 54
Variable Rate (%) 87
Owner-Occupied (%) 58
Investment (%) 33
Line of Credit (%) 9
Proprietary (%) 62
Broker (%) 38
Average Loan Size ($’000) 221
Annual Run-Off (%) 2 17
Home loan portfolio profile
Quality Jun 12
Total Balances – Avg YTD ($bn) 1 343
Actual Losses YTD ($m) 1,3 107
Loss Rate (%)1,2 0.03
LVR – Portfolio Avg (%) 4 44
Customers in advance (%) 68
Payments in advance (#) 7
Low Doc % of Book 2.7
FHB - % of new fundings 2 14
FHB - % of balances 15
LMI - % of Book 25
Serviceability buffer (bpts) 150
All figures relate to the RBS home loan portfolio (excluding recent acquisition of a tranche of Aussie Home Loans) except where noted. 1 Numbers are for the Group (including BW, ASB and securitised loans). 2 12 months to June 2012. 3 Actual YTD losses includes write-offs from collective provisions and individual provisions, net of any recoveries. 4 Portfolio average LVR = current balance / original valuation.
For
per
sona
l use
onl
y
104
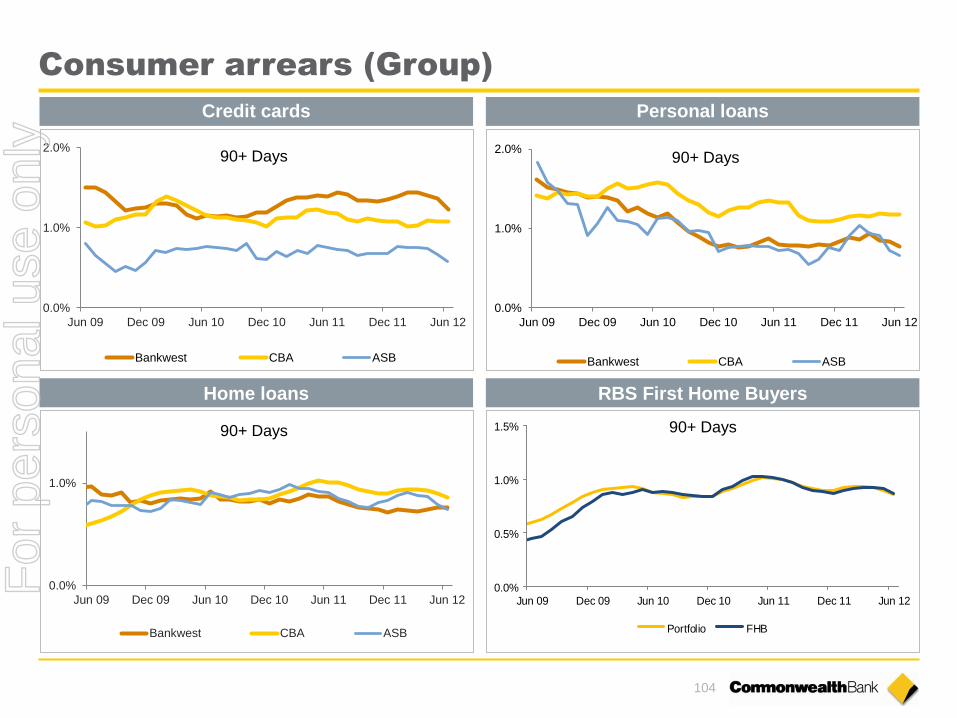
Consumer arrears (Group)
0.0%
1.0%
Jun 09 Dec 09 Jun 10 Dec 10 Jun 11 Dec 11 Jun 12
90+ Days
Bankwest CBA ASB
0.0%
1.0%
2.0%
Jun 09 Dec 09 Jun 10 Dec 10 Jun 11 Dec 11 Jun 12
90+ Days
Bankwest CBA ASB
0.0%
1.0%
2.0%
Jun 09 Dec 09 Jun 10 Dec 10 Jun 11 Dec 11 Jun 12
90+ Days
Bankwest CBA ASB
0.0%
0.5%
1.0%
1.5%
Jun 09 Dec 09 Jun 10 Dec 10 Jun 11 Dec 11 Jun 12
Portfolio FHB
Credit cards
Home loans
Personal loans
RBS First Home Buyers
90+ Days
For
per
sona
l use
onl
y

105
Consumer arrears (RBS)
2.0%
2.5%
3.0%
3.5%
4.0%
4.5%
Jun Jul Aug Sep Oct Nov Dec Jan Feb Mar Apr May Jun
07/08 08/09 09/10 10/11 11/12
2.0%
2.4%
2.8%
3.2%
3.6%
4.0%
Jun Jul Aug Sep Oct Nov Dec Jan Feb Mar Apr May Jun
07/08 08/09 09/10 10/11 11/12
0.6%
1.0%
1.4%
1.8%
2.2%
Jun Jul Aug Sep Oct Nov Dec Jan Feb Mar Apr May Jun
07/08 08/09 09/10 10/11 11/12
30+ Days 30+ Days
30+ Days
0.0%
0.5%
1.0%
1.5%
2.0%
Jun 09 Dec 09 Jun 10 Dec 10 Jun 11 Dec 11 Jun 12
NSW/ACT SA/NT QLD VIC/TAS WA National
90+ Days
Home loans
Personal loans
Home loans by state
Credit cards
For
per
sona
l use
onl
y

106
RBS home loans – LVR and arrears by vintage
Home Loan Dynamic LVR1 Profile
0%
10%
20%
30%
40%
50%
60%
70%
80%
0-60% 61-75% 76-80% 81-90% 91+%
Pro
port
ion o
f T
ota
l P
ort
folio
Dec 10 Jun 11 Dec 11 Jun 12
30+ Days Home Loan Arrears Rates by Vintage
CBA domestic only. Excludes Bankwest
1 Dynamic LVR is Current balance / Original valuation.
0.0%
0.5%
1.0%
1.5%
2.0%
2.5%
3.0%
3.5%
4.0%
0 6 12 18 24 30 36 42 48 54 60 66 72 78
30+
Arr
ears
Rate
Months on Book
FY09
FY08
FY07
FY06
FY10
FY11
FY12
For
per
sona
l use
onl
y
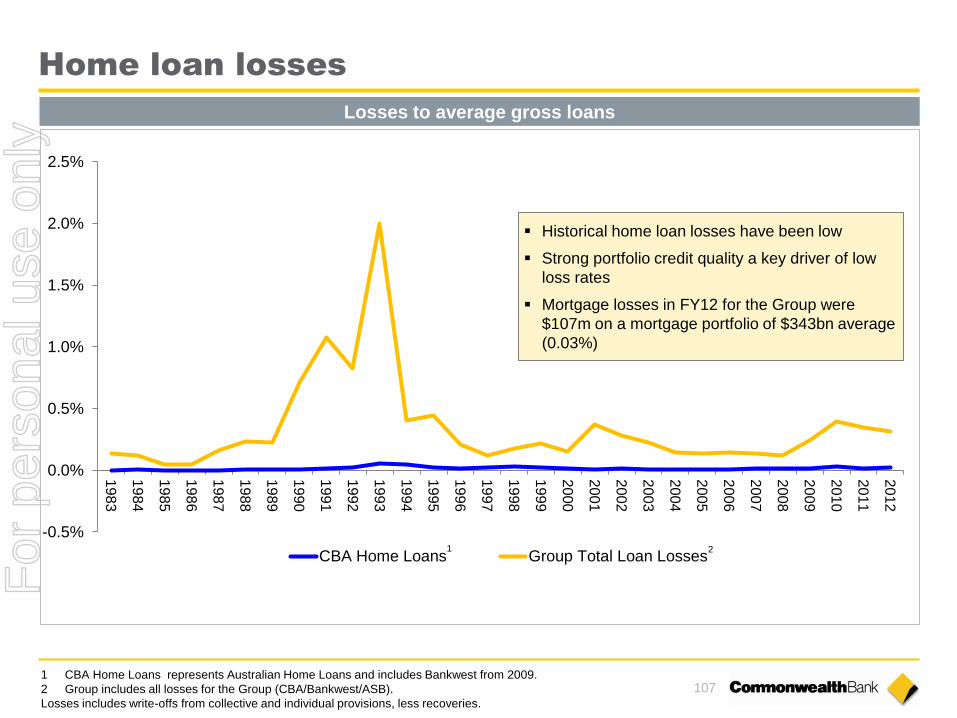
107
Home loan losses
-0.5%
0.0%
0.5%
1.0%
1.5%
2.0%
2.5%
1983
1984
1985
1986
1987
1988
1989
1990
1991
1992
1993
1994
1995
1996
1997
1998
1999
2000
2001
2002
2003
2004
2005
2006
2007
2008
2009
2010
2011
2012
CBA Home Loans Group Total Loan Losses
Historical home loan losses have been low
Strong portfolio credit quality a key driver of low
loss rates
Mortgage losses in FY12 for the Group were
$107m on a mortgage portfolio of $343bn average
(0.03%)
1 CBA Home Loans represents Australian Home Loans and includes Bankwest from 2009.
2 Group includes all losses for the Group (CBA/Bankwest/ASB).
Losses includes write-offs from collective and individual provisions, less recoveries.
Losses to average gross loans
1 2
For
per
sona
l use
onl
y

108
RBS home loans – enhanced stress test
Potential losses of $1.7bn for the
uninsured portfolio only over 3 years.
House prices and PDs are stressed at
regional level.
Potential claims on LMI of $2bn1 over 3
years.
Increase in potential losses for existing
accounts ($221m) consistent with
continued challenging economic
environment including decreased
residential property valuations.
Year 1 Year 2 Year 3
Unemployment 7.0% 10.5% 11.5%
Hours under-employed 11.4% 15.8% 18.4%
Cumulative House Prices -15% -32% -32%
Cash Rate 3.00% 1.00% 1.00%
* The total number of hours not worked relative to the size of the workforce.
Year 1 Year 2 Year 3
Stressed Losses $297m $570m $827m
Probability of Default (PD) 1.03% 1.85% 2.72%
Results based on December 2011.
Total losses of $1,694m predicted over 3 years.
*
Observations Key assumptions
Key outcomes
Key drivers of movements
**More conservative method which includes undrawn limits.
1,331 1,613 1,694
61 221 81
Potential
losses
at Dec 10
Net Account
Growth
Jan 11 –
Dec 11
Existing
Accounts
Potential
Losses at
Dec 11
(EAD basis)
Potential
Losses at
Dec 11 (Old
exposure
basis)
Change
from
Exposure
basis to
EAD**
1 Conservative in that it assumes all loans that become 90 days in arrears will result in a claim.
$m
For
per
sona
l use
onl
y

109
Regulatory exposure mix
Regulatory Credit Exposure Mix1
CBA Peer 1 Peer 2 Peer 3
Residential Mortgages 55% 41% 40% 57%
Corporate, SME & Spec Lending 28% 34% 39% 31%
Bank 7% 7% 12% 3%
Sovereign 6% 9% 6% 5%
Qualifying Revolving 3% 4% 2% 3%
Other Retail 1% 5% 1% 1%
Total Advanced2 100% 100% 100% 100%
1 Source: Pillar 3 disclosures for CBA as at June 2012 and Peers as at March 2012.
2 Includes Specialised Lending exposures. Excludes Standardised exposures, Other Assets and Securitisation
(representing 15% of CBA, 7% of Peer 1, 13% of Peer 2 and 4% of Peer 3). Exposure mix is re-baselined to total 100% for
comparison.
For
per
sona
l use
onl
y
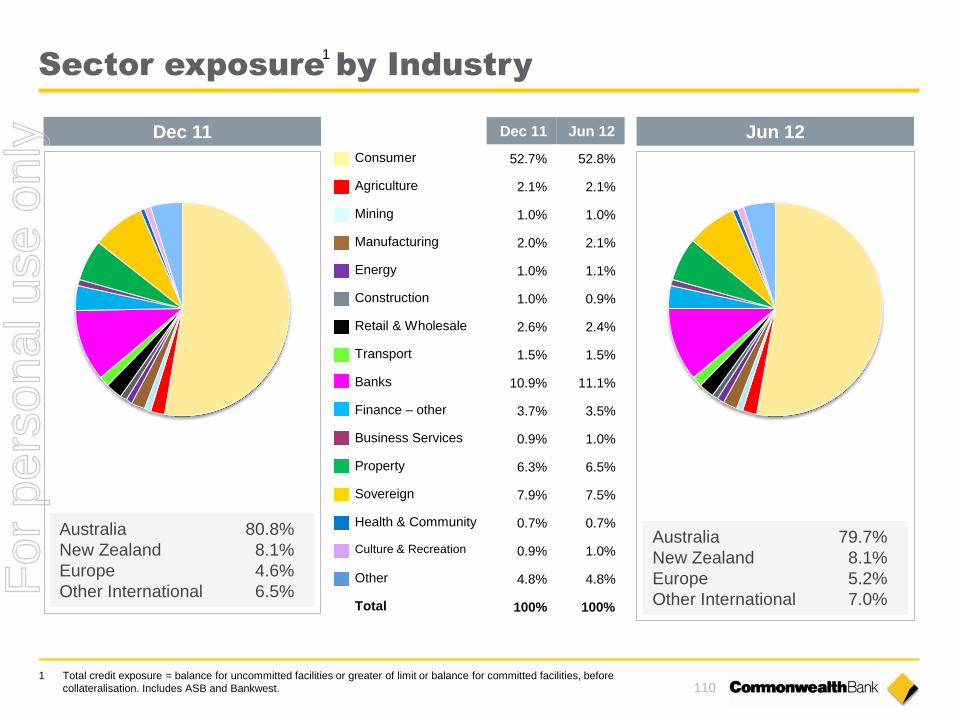
110
Sector exposure by Industry 1
1 Total credit exposure = balance for uncommitted facilities or greater of limit or balance for committed facilities, before
collateralisation. Includes ASB and Bankwest.
Dec 11 Jun 12
Consumer 52.7% 52.8%
Agriculture 2.1% 2.1%
Mining 1.0% 1.0%
Manufacturing 2.0% 2.1%
Energy 1.0% 1.1%
Construction 1.0% 0.9%
Retail & Wholesale 2.6% 2.4%
Transport 1.5% 1.5%
Banks 10.9% 11.1%
Finance – other 3.7% 3.5%
Business Services 0.9% 1.0%
Property 6.3% 6.5%
Sovereign 7.9% 7.5%
Health & Community 0.7% 0.7%
Culture & Recreation 0.9% 1.0%
Other 4.8% 4.8%
Total 100% 100%
Australia 80.8%
New Zealand 8.1%
Europe 4.6%
Other International 6.5%
Australia 79.7%
New Zealand 8.1%
Europe 5.2%
Other International 7.0%
Dec 11 Jun 12
For
per
sona
l use
onl
y
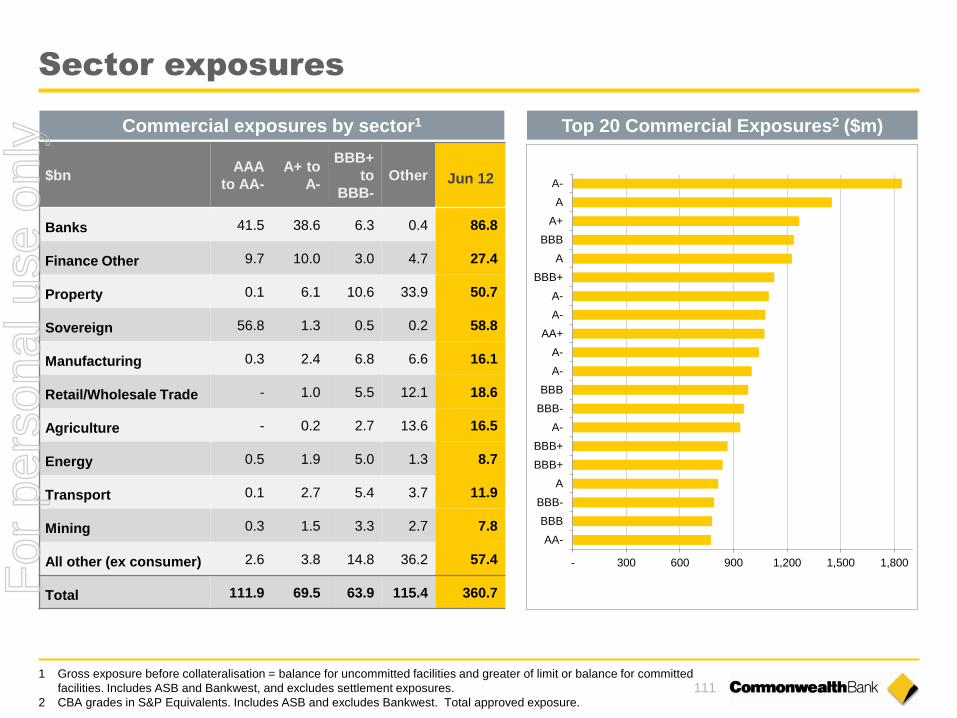
111
Sector exposures
1 Gross exposure before collateralisation = balance for uncommitted facilities and greater of limit or balance for committed
facilities. Includes ASB and Bankwest, and excludes settlement exposures.
2 CBA grades in S&P Equivalents. Includes ASB and excludes Bankwest. Total approved exposure.
Commercial exposures by sector1 Top 20 Commercial Exposures2 ($m)
$bn AAA
to AA-
A+ to
A-
BBB+
to
BBB-
Other Jun 12
Banks 41.5 38.6 6.3 0.4 86.8
Finance Other 9.7 10.0 3.0 4.7 27.4
Property 0.1 6.1 10.6 33.9 50.7
Sovereign 56.8 1.3 0.5 0.2 58.8
Manufacturing 0.3 2.4 6.8 6.6 16.1
Retail/Wholesale Trade - 1.0 5.5 12.1 18.6
Agriculture - 0.2 2.7 13.6 16.5
Energy 0.5 1.9 5.0 1.3 8.7
Transport 0.1 2.7 5.4 3.7 11.9
Mining 0.3 1.5 3.3 2.7 7.8
All other (ex consumer) 2.6 3.8 14.8 36.2 57.4
Total 111.9 69.5 63.9 115.4 360.7
- 300 600 900 1,200 1,500 1,800
A-
A
A+
BBB
A
BBB+
A-
A-
AA+
A-
A-
BBB
BBB-
A-
BBB+
BBB+
A
BBB-
BBB
AA-
For
per
sona
l use
onl
y

112
Group PD Rating Migration
Group Ratings Migration (Ex. Banks & Sovereigns)
Group Ratings Migration (Inc. Banks & Sovereigns)
19
14
9
4
1
6
11
Jun
09
Sep
09
De
c 0
9
Mar
10
Jun
10
Sep
10
De
c 1
0
Mar
11
Jun
11
Sep
11
De
c 1
1
Mar
12
Jun
12
Exp
osu
res
($b
n)
Total UpgradesDowngrades - excluding defaultsTotal DefaultsNet
19
14
9
4
1
6
11
Jun
09
Sep
09
De
c 0
9
Mar
10
Jun
10
Sep
10
De
c 1
0
Mar
11
Jun
11
Sep
11
De
c 1
1
Mar
12
Jun
12
Exp
osu
res
($b
n)
Total UpgradesDowngrades - excluding defaultsTotal DefaultsNetF
or p
erso
nal u
se o
nly

113
Commercial property market
0%
5%
10%
15%
20%
25%
30%
35%
40%
Sydney Melbourne Brisbane Perth Adelaide
1991 Recession Current Previous
Source : Jones Lang LaSalle Research
% of Total Stock
54%
17%
9% 12% 5% 3%
NSW VIC QLD WA SA Other
Source : Jones Lang LaSalle Research
Includes Bankwest
Exposure by state (Jun 12)
1 The development pipeline includes all projects currently under construction.
(2nd Half FY12) (1st Half FY12)
CBD office supply pipeline1 CBD vacancy rates
CBA commercial property
Market
Peak
1990s
Current 2nd Half
FY12
Previous 1st Half
FY12
Sydney 22.4% 8.6% 8.5%
Perth 31.8% 2.9% 2.5%
Melbourne 25.8% 7.4% 5.8%
Brisbane 14.3% 8.8% 6.3%
Adelaide 19.8% 7.7% 7.6%
For
per
sona
l use
onl
y

114
Risk Weighted Assets 2H12
Total
Tier 1 ratio
impact (bpts)
Credit Risk 1 % (10)
Traded Market Risk 56 % (6)
Operational Risk 9 % (7)
IRRBB (15%) 6
Total1 2 % -(17)
On
Balance
Sheet
Off
Balance
Sheet
Total
% Change - Consumer Retail 2 % (1%) 2 %
% Change - Non-retail 2 % (2%) 1 %
Tier 1 impact – Retail (bpts) (4) - (4)
Tier 1 impact – Non-Retail (bpts) (9) 3 (6)
Tier 1 impact – Other 1,2 (bpts) - - -
Total Tier 1 impact (bpts) (13) 3 (10)
1 Includes impact of Basel 2.5.
2 Other includes credit RWAs for Basel Standardised asset classes including Bankwest assets, margin
lending, equities and other assets as well as securitisation exposures.
Credit risk RWA increased over the half by $3bn to $261bn primarily due to;
Growth in Corporate, Residential Mortgage and Standardised portfolio
exposures; and re-grading of credit ratings for some Bank counterparts;
These increases were partially offset by; RWA reductions due to a focus on
data improvement and methodology enhancement; reductions in Bank
exposures and SME Retail exposures; improved credit quality of sovereign
exposures; and implementation of updated risk estimates for the non-retail
portfolio.
Traded Market Risk RWA increased by $1.7bn or 55.9% to $4.8bn. The increase
was due to the introduction of Stressed Value-at-Risk under Basel 2.5.
The increase in Operational Risk RWA reflects a more conservative assessment
of the operational risk profile of the Group including the impact of the external
environment.
IRRBB RWA reduced by $1.8bn during the half year as a result of treasury risk
management activities and offsets by higher embedded gains from lower interest
rates.
RWA Movement
Composition of Movement Credit RWA Movement
Data and
Methodology Volume FX
CRFs and
Treatments Quality Total
- 2 % 1 % 1 % (2%) 2 %
(3%) 4 % - (1%) - 1 %
- (4) (1) (2) 3 (4)
12 (18) (1) 4 (3) (6)
6 (6) - (1) 1 -
18 (28) (2) 1 1 (10)
For
per
sona
l use
onl
y
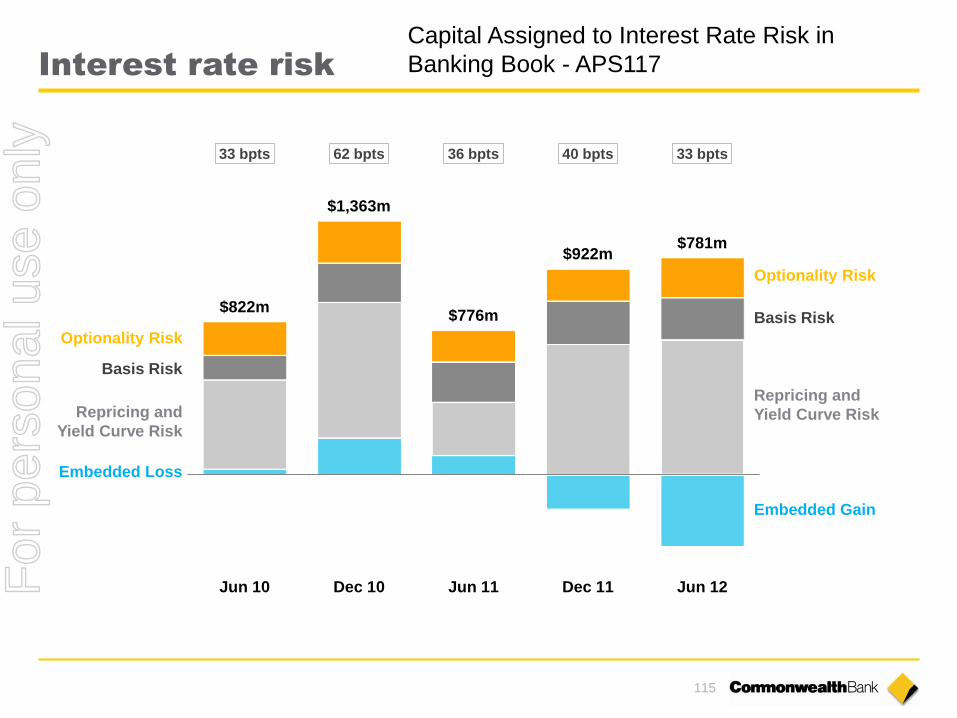
115
Interest rate risk
Capital Assigned to Interest Rate Risk in
Banking Book - APS117
$822m
$1,363m
$776m
$922m $781m
33 bpts 62 bpts 36 bpts 40 bpts 33 bpts
Jun 10 Dec 10 Jun 11 Dec 11 Jun 12
Embedded Loss
Repricing and
Yield Curve Risk
Basis Risk
Optionality Risk
Embedded Gain
Repricing and
Yield Curve Risk
Basis Risk
Optionality Risk
For
per
sona
l use
onl
y
Index
Strategy 60
Business Performance 81
Risk and Credit Quality 100
Capital, Funding & Liquidity 116
Economic Indicators 129 For
per
sona
l use
onl
y

117
Min(4.5%)
January 2013
Min incl. Capital
Conservation Buffer
(7%)
January 2016
Board target (> 9%)
January 2013
4.5% 5.0%
5.6%
6.6%
7.3% 7.5% 6.9%
7.4% 7.7%
8.7%
9.6% 9.8%
0%
1%
2%
3%
4%
5%
6%
7%
8%
9%
10%
Jun 07 Jun 08 Jun 09 Jun 10 Jun 11 Jun 12
BIII CET1 (APRA) BIII CET1 (Int)
Common Equity Tier 1 (“CET1”) – Basel III
1 Includes acquisition of Bankwest in December 2008.
1 For
per
sona
l use
onl
y
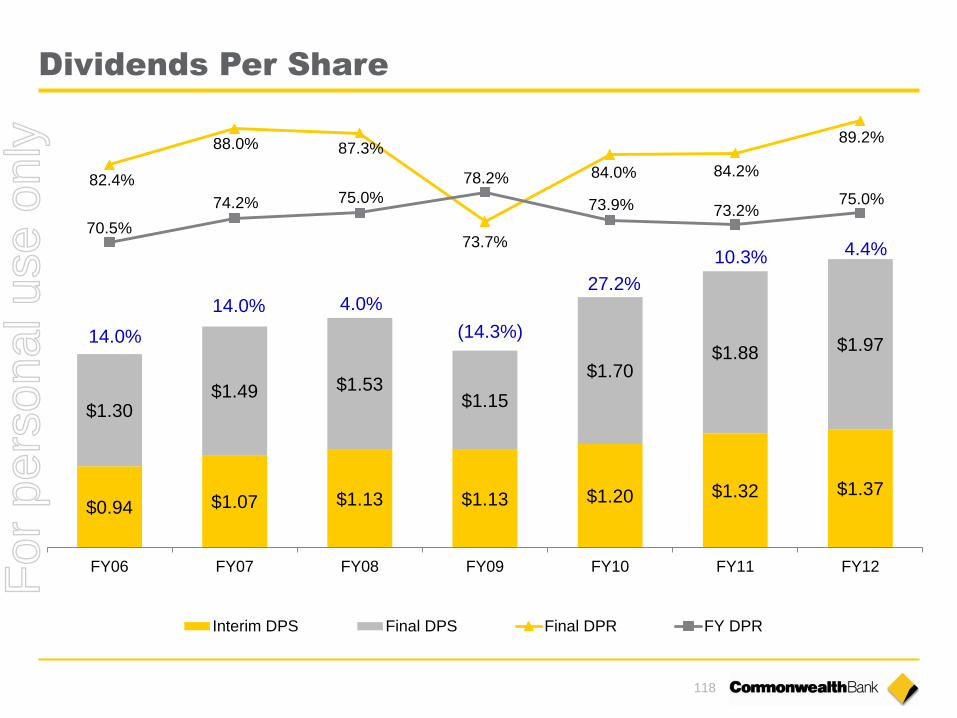
118
Dividends Per Share
$0.94 $1.07 $1.13 $1.13 $1.20 $1.32 $1.37
$1.30 $1.49 $1.53
$1.15
$1.70 $1.88 $1.97 14.0%
14.0% 4.0%
(14.3%)
27.2%
10.3% 4.4%
82.4%
88.0% 87.3%
73.7%
84.0% 84.2%
89.2%
70.5%
74.2% 75.0%
78.2%
73.9% 73.2% 75.0%
FY06 FY07 FY08 FY09 FY10 FY11 FY12
Interim DPS Final DPS Final DPR FY DPR
For
per
sona
l use
onl
y
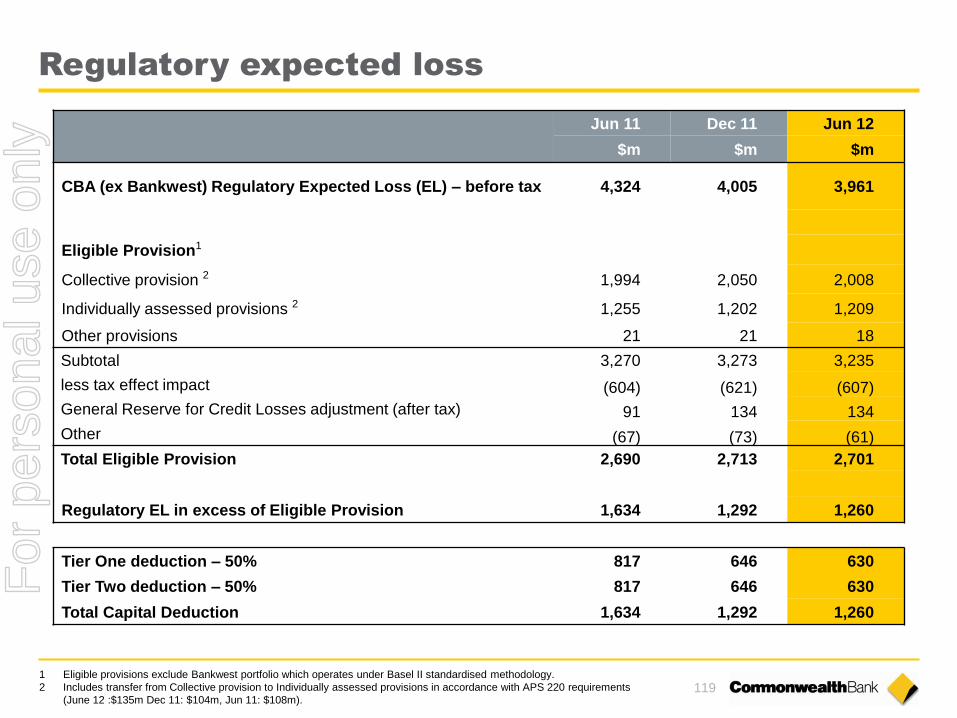
119
Regulatory expected loss
Jun 11 Dec 11 Jun 12
$m $m $m
CBA (ex Bankwest) Regulatory Expected Loss (EL) – before tax 4,324 4,005 3,961
Eligible Provision1
Collective provision 2 1,994 2,050 2,008
Individually assessed provisions 2 1,255 1,202 1,209
Other provisions 21 21 18
Subtotal 3,270 3,273 3,235
less tax effect impact (604) (621) (607)
General Reserve for Credit Losses adjustment (after tax) 91 134 134
Other (67) (73) (61)
Total Eligible Provision 2,690 2,713 2,701
Regulatory EL in excess of Eligible Provision 1,634 1,292 1,260
Tier One deduction – 50% 817 646 630
Tier Two deduction – 50% 817 646 630
Total Capital Deduction 1,634 1,292 1,260
1 Eligible provisions exclude Bankwest portfolio which operates under Basel II standardised methodology.
2 Includes transfer from Collective provision to Individually assessed provisions in accordance with APS 220 requirements
(June 12 :$135m Dec 11: $104m, Jun 11: $108m).
For
per
sona
l use
onl
y
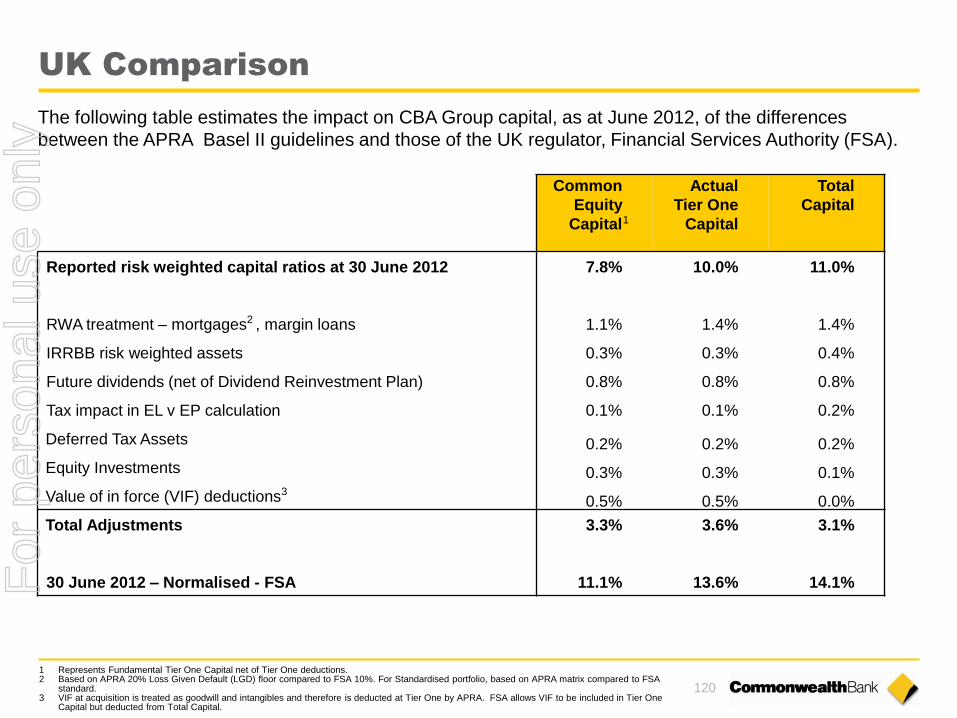
120
UK Comparison
Common
Equity
Capital
Actual
Tier One
Capital
Total
Capital
Reported risk weighted capital ratios at 30 June 2012 7.8% 10.0% 11.0%
RWA treatment – mortgages2 , margin loans 1.1% 1.4% 1.4%
IRRBB risk weighted assets 0.3% 0.3% 0.4%
Future dividends (net of Dividend Reinvestment Plan) 0.8% 0.8% 0.8%
Tax impact in EL v EP calculation 0.1% 0.1% 0.2%
Deferred Tax Assets 0.2% 0.2% 0.2%
Equity Investments 0.3% 0.3% 0.1%
Value of in force (VIF) deductions3 0.5% 0.5% 0.0%
Total Adjustments 3.3% 3.6% 3.1%
30 June 2012 – Normalised - FSA 11.1% 13.6% 14.1%
The following table estimates the impact on CBA Group capital, as at June 2012, of the differences
between the APRA Basel II guidelines and those of the UK regulator, Financial Services Authority (FSA).
1 Represents Fundamental Tier One Capital net of Tier One deductions. 2 Based on APRA 20% Loss Given Default (LGD) floor compared to FSA 10%. For Standardised portfolio, based on APRA matrix compared to FSA
standard. 3 VIF at acquisition is treated as goodwill and intangibles and therefore is deducted at Tier One by APRA. FSA allows VIF to be included in Tier One
Capital but deducted from Total Capital.
1
For
per
sona
l use
onl
y
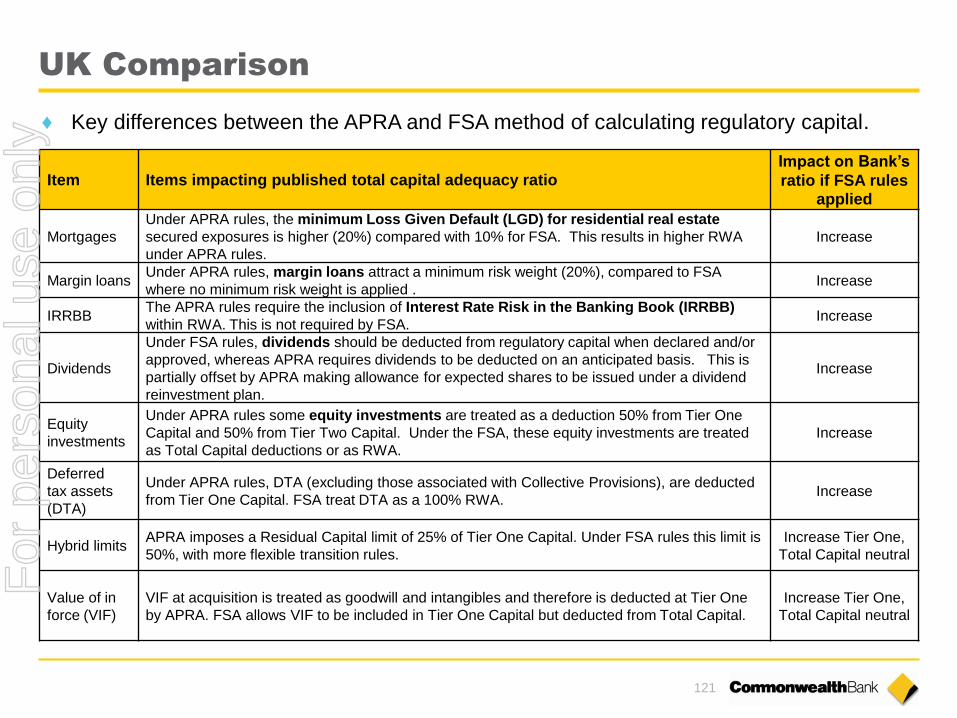
121
♦ Key differences between the APRA and FSA method of calculating regulatory capital.
Item Items impacting published total capital adequacy ratio Impact on Bank’s
ratio if FSA rules applied
Mortgages
Under APRA rules, the minimum Loss Given Default (LGD) for residential real estate
secured exposures is higher (20%) compared with 10% for FSA. This results in higher RWA
under APRA rules.
Increase
Margin loans Under APRA rules, margin loans attract a minimum risk weight (20%), compared to FSA
where no minimum risk weight is applied . Increase
IRRBB The APRA rules require the inclusion of Interest Rate Risk in the Banking Book (IRRBB)
within RWA. This is not required by FSA. Increase
Dividends
Under FSA rules, dividends should be deducted from regulatory capital when declared and/or
approved, whereas APRA requires dividends to be deducted on an anticipated basis. This is
partially offset by APRA making allowance for expected shares to be issued under a dividend
reinvestment plan.
Increase
Equity
investments
Under APRA rules some equity investments are treated as a deduction 50% from Tier One
Capital and 50% from Tier Two Capital. Under the FSA, these equity investments are treated
as Total Capital deductions or as RWA.
Increase
Deferred
tax assets
(DTA)
Under APRA rules, DTA (excluding those associated with Collective Provisions), are deducted
from Tier One Capital. FSA treat DTA as a 100% RWA. Increase
Hybrid limits APRA imposes a Residual Capital limit of 25% of Tier One Capital. Under FSA rules this limit is
50%, with more flexible transition rules.
Increase Tier One,
Total Capital neutral
Value of in
force (VIF)
VIF at acquisition is treated as goodwill and intangibles and therefore is deducted at Tier One
by APRA. FSA allows VIF to be included in Tier One Capital but deducted from Total Capital.
Increase Tier One,
Total Capital neutral
UK Comparison
For
per
sona
l use
onl
y

122
100
150
200
250
300
350
BBSW(bpts)
AUD 5yrs AUD CB 5yrs USD 5yrs
USD CB 5yrs EUR 5yrs EUR CB 5yrs
CBA Group Treasury estimates – indicative pricing for new issuance v BBSW
Funding
Wholesale funding by product 62% Deposit funded
Wholesale funding by currency Indicative 5 year senior benchmark pricing
44%
4% 10%
27%
5%
6% 1% 3%
Australia
Other Asia
Europe
United States
Japan
United Kingdom
Hong Kong
Misc
5%
36%
15% 5%
13%
4%
5%
4%
9% 4% Structured MTN
Vanilla MTN
Commercial Paper
Structured Finance
Debt Capital
CDs
Securitisation
Covered Bonds
Bank Acceptance
FI Deposits
Other
62% 18%
4%
12% 2% 1% 1%
Customer Deposits
ST Wholesale Funding
LT Wholesale Funding maturing < 12 months
LT Wholesale Funding maturing >= 12 months
Covered Bonds
RMBS
Hybrids
For
per
sona
l use
onl
y
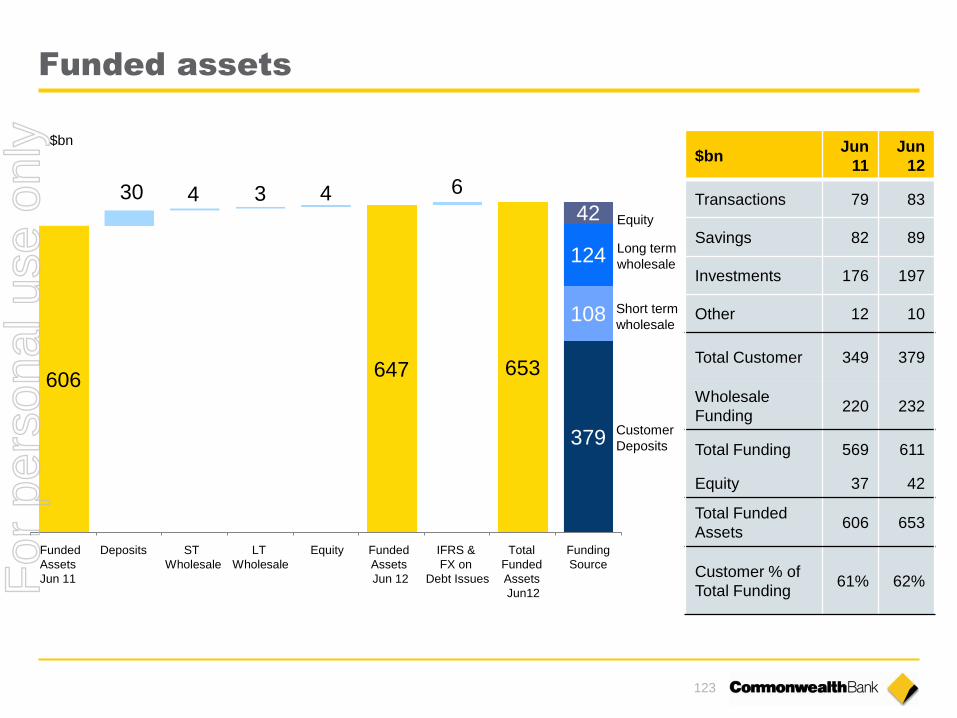
123
Funded assets
$bn Jun
11
Jun
12
Transactions 79 83
Savings 82 89
Investments 176 197
Other 12 10
Total Customer 349 379
Wholesale
Funding 220 232
Total Funding 569 611
Equity 37 42
Total Funded
Assets 606 653
Customer % of
Total Funding 61% 62%
606 647 653
379
30 4 3 4 6
108
124
42
Funded
Assets
Jun 11
Deposits ST
Wholesale
LT
Wholesale
Equity Funded
Assets
Jun 12
IFRS &
FX on
Debt Issues
Total
Funded
Assets
Jun12
Funding
Source
Equity
Long term
wholesale
Customer
Deposits
Short term
wholesale
$bn
For
per
sona
l use
onl
y

124
UK and US balance sheet comparison
United Kingdom USA
5% 4%
12% 10%
12% 19%
43%
10%
19%
50%
9% 7%
Other Assets
Other Fair
Value Assets
Other Lending
Home Loans
Trading Securities
Cash Capital
Deposits
Long Term
Short Term
Other Liabilities
Trading Liabilities
Assets Liab + Equity
Based on analysis of Lloyds, RBS, HSBC and Barclays as at 30 June 2012.
Average of four banks.
11% 5%
14%
7%
16%
15%
38%
11%
13%
52%
8% 10%
Other Assets
Other Lending
Home Loans
Trading Securities
Cash Capital
Deposits
Long Term
Short Term
Other Liabilities
Trading Liabilities
Assets Liab + Equity
Based on analysis of Citigroup, JP Morgan, Bank of America and Wells Fargo as at
31 March 2012.
Average of four banks.
Other Fair
Value Assets
Balance sheets do not include derivative assets and liabilities.
Based on statutory balance sheets.
For
per
sona
l use
onl
y
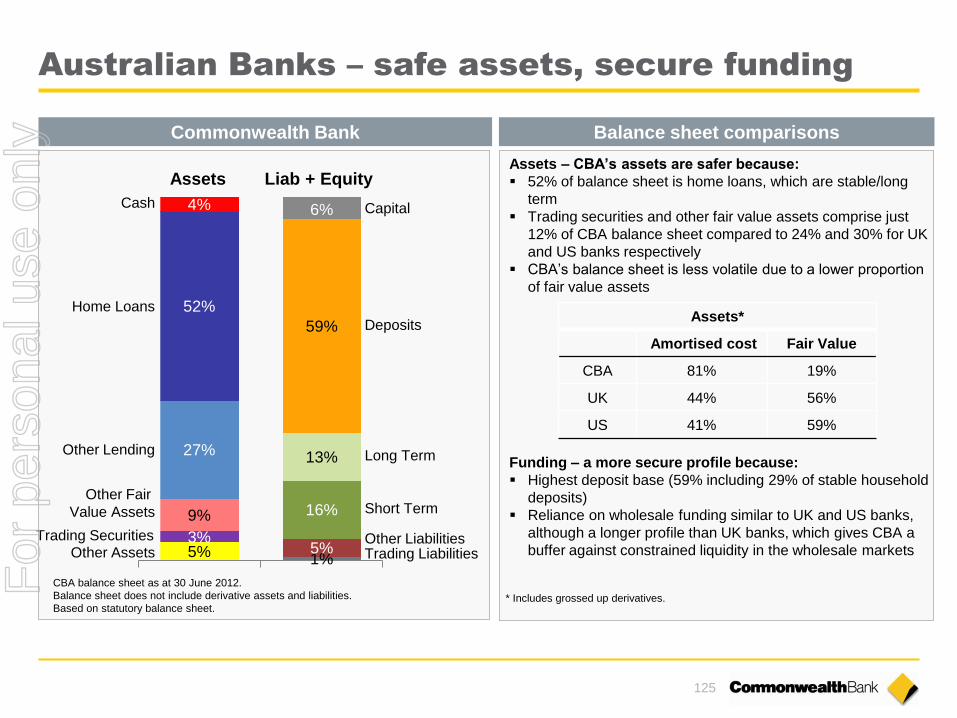
125
Australian Banks – safe assets, secure funding
Other Assets
Other Lending
Home Loans
Trading Securities
Cash Capital
Deposits
Long Term
Short Term
Other Liabilities Trading Liabilities
CBA balance sheet as at 30 June 2012.
Balance sheet does not include derivative assets and liabilities.
Based on statutory balance sheet.
Assets Liab + Equity
Other Fair
Value Assets
5% 1%
3% 5%
9% 16%
27% 13%
52%
59%
4% 6%
Assets – CBA’s assets are safer because:
52% of balance sheet is home loans, which are stable/long
term
Trading securities and other fair value assets comprise just
12% of CBA balance sheet compared to 24% and 30% for UK
and US banks respectively
CBA’s balance sheet is less volatile due to a lower proportion
of fair value assets
Funding – a more secure profile because:
Highest deposit base (59% including 29% of stable household
deposits)
Reliance on wholesale funding similar to UK and US banks,
although a longer profile than UK banks, which gives CBA a
buffer against constrained liquidity in the wholesale markets
Assets*
Amortised cost Fair Value
CBA 81% 19%
UK 44% 56%
US 41% 59%
* Includes grossed up derivatives.
Commonwealth Bank Balance sheet comparisons
For
per
sona
l use
onl
y

126
Replicating portfolio
Actual and Forecast Scenario
Official Cash Rate
Replicating Portfolio Yield
Current 2013 2001
Forecast*
* Indicative forecast of the replicating portfolio in relation to hypothetical movements in the official cash rate
For
per
sona
l use
onl
y
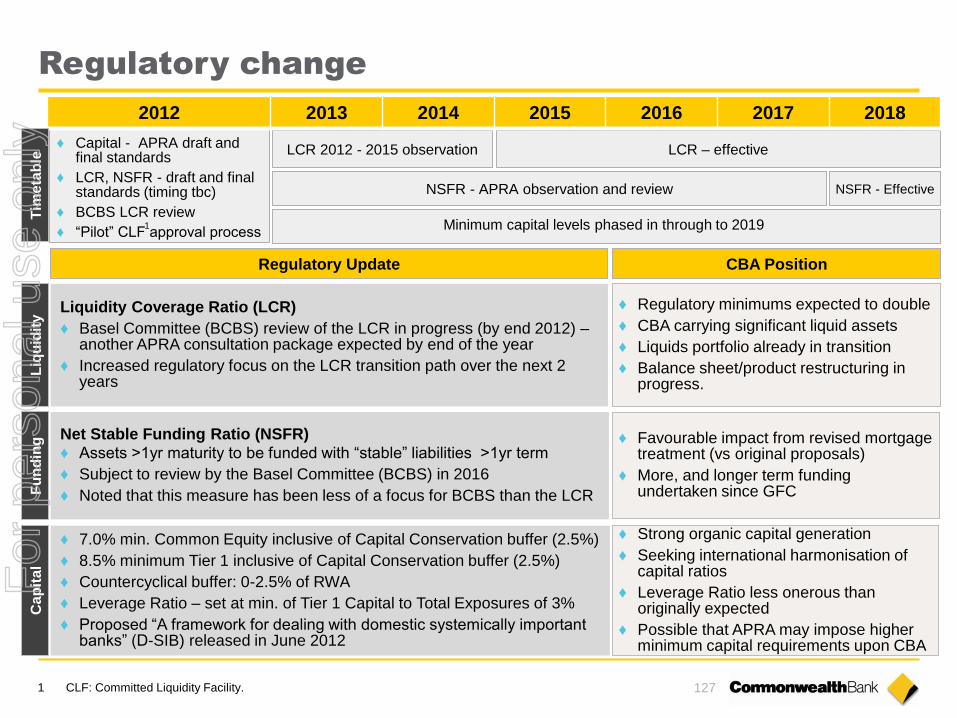
127
Regulatory change
NSFR - APRA observation and review NSFR - Effective
LCR 2012 - 2015 observation LCR – effective
Regulatory Update
Liq
uid
ity
Fu
nd
ing
C
ap
ita
l
Liquidity Coverage Ratio (LCR)
♦ Basel Committee (BCBS) review of the LCR in progress (by end 2012) – another APRA consultation package expected by end of the year
♦ Increased regulatory focus on the LCR transition path over the next 2 years
Net Stable Funding Ratio (NSFR)
♦ Assets >1yr maturity to be funded with “stable” liabilities >1yr term
♦ Subject to review by the Basel Committee (BCBS) in 2016
♦ Noted that this measure has been less of a focus for BCBS than the LCR
CBA Position
♦ Favourable impact from revised mortgage treatment (vs original proposals)
♦ More, and longer term funding undertaken since GFC
♦ Regulatory minimums expected to double
♦ CBA carrying significant liquid assets
♦ Liquids portfolio already in transition
♦ Balance sheet/product restructuring in progress.
♦ 7.0% min. Common Equity inclusive of Capital Conservation buffer (2.5%)
♦ 8.5% minimum Tier 1 inclusive of Capital Conservation buffer (2.5%)
♦ Countercyclical buffer: 0-2.5% of RWA
♦ Leverage Ratio – set at min. of Tier 1 Capital to Total Exposures of 3%
♦ Proposed “A framework for dealing with domestic systemically important banks” (D-SIB) released in June 2012
♦ Strong organic capital generation
♦ Seeking international harmonisation of capital ratios
♦ Leverage Ratio less onerous than originally expected
♦ Possible that APRA may impose higher minimum capital requirements upon CBA
2012 2013 2014 2015 2016 2017 2018
Minimum capital levels phased in through to 2019
Tim
eta
ble
♦ Capital - APRA draft and final standards
♦ LCR, NSFR - draft and final standards (timing tbc)
♦ BCBS LCR review
♦ “Pilot” CLF approval process
1 CLF: Committed Liquidity Facility.
1
For
per
sona
l use
onl
y

128
Funding overview
Overview
Well diversified
Over 62% deposit funded
Weighted average maturity of 3.7 years
Responsible and responsive issuer with commitment to ongoing direct investor engagement
Ratings across agencies and markets declining – CBA remains in upper echelon
– Standard & Poors: AA- (stable)
– Moodys: Aa2 (stable)
– Fitch: AA- (stable)
Covered bonds
– Provide additional market and investor diversification
– A relative saving vs senior debt however absolute cost remains high
– Capacity approximately $35-40bn given 8% (of total Australian assets) cap
– Issued $13bn in FY12
Remain active in senior unsecured and RMBS
For
per
sona
l use
onl
y

Index
Strategy 60
Business Performance 81
Risk and Credit Quality 100
Capital, Funding & Liquidity 116
Economic Indicators 129 For
per
sona
l use
onl
y
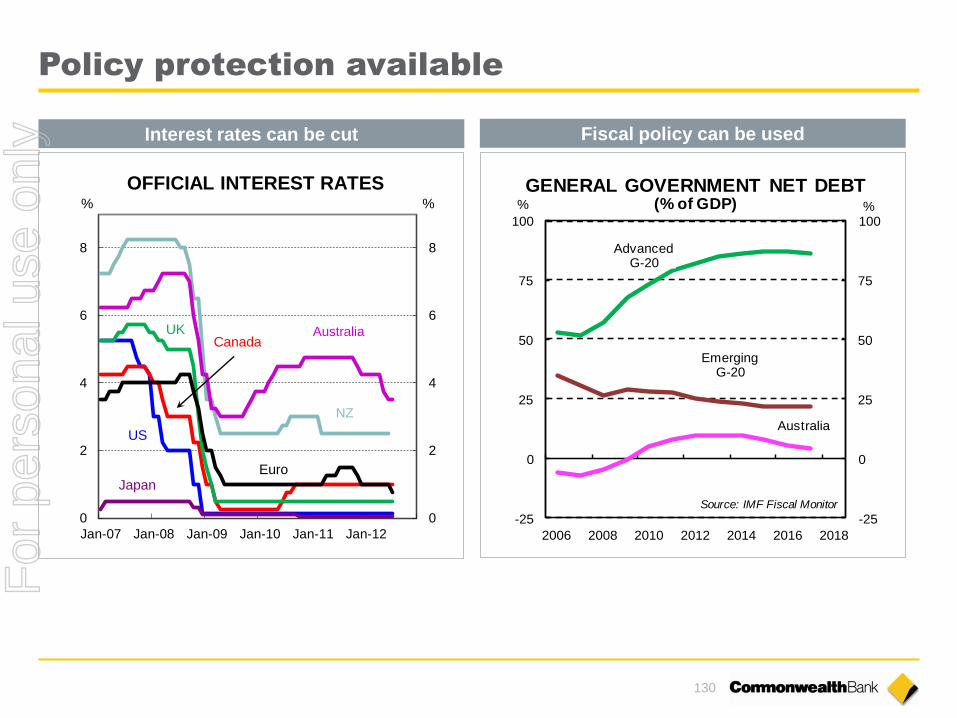
130
Policy protection available
Interest rates can be cut Fiscal policy can be used
-25
0
25
50
75
100
-25
0
25
50
75
100
2006 2008 2010 2012 2014 2016 2018
%%
Australia
Source: IMF Fiscal Monitor
GENERAL GOVERNMENT NET DEBT(% of GDP)
EmergingG-20
AdvancedG-20
0
2
4
6
8
0
2
4
6
8
Jan-07 Jan-08 Jan-09 Jan-10 Jan-11 Jan-12
OFFICIAL INTEREST RATES% %
Canada
US
UK
EuroJapan
NZ
Australia
For
per
sona
l use
onl
y
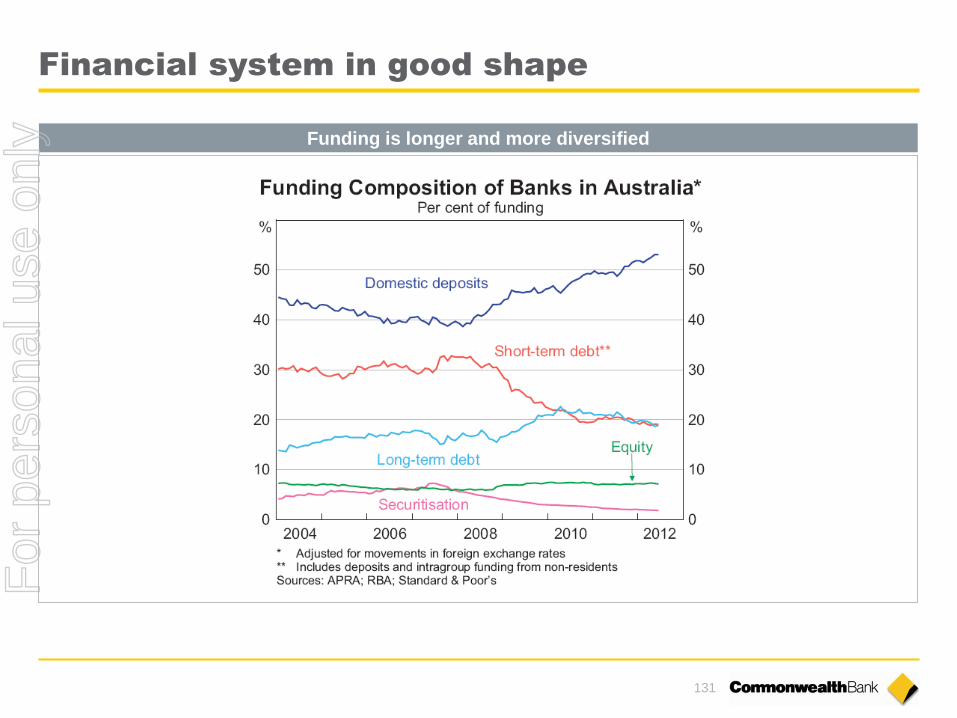
131
Financial system in good shape
Funding is longer and more diversified
For
per
sona
l use
onl
y
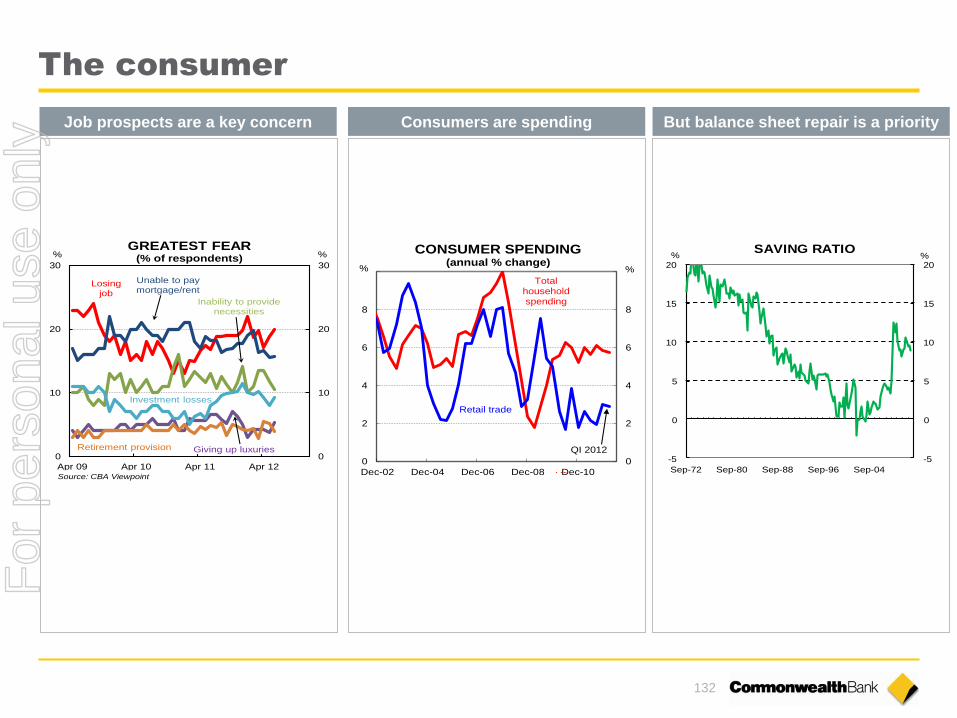
132
The consumer
0
2
4
6
8
10
0
2
4
6
8
10
Dec-02 Dec-04 Dec-06 Dec-08 Dec-10
CONSUMER SPENDING(annual % change)
%%
US
Total household spending
Retail trade
QI 20120
10
20
30
0
10
20
30
Apr 09 Apr 10 Apr 11 Apr 12
%%
Unable to pay mortgage/rent
Source: CBA Viewpoint
GREATEST FEAR(% of respondents)
Losingjob
Inability to provide necessities
Investment losses
Retirement provision Giving up luxuries-5
0
5
10
15
20
-5
0
5
10
15
20
Sep-72 Sep-80 Sep-88 Sep-96 Sep-04
SAVING RATIO% %
Job prospects are a key concern Consumers are spending But balance sheet repair is a priority
For
per
sona
l use
onl
y

133
Labour market
The labour market is holding up Some indicators suggest stronger jobs growth
-8
0
8
16
-1
1
3
5
Jan-04 Jan-06 Jan-08 Jan-10 Jan-12
TAXES & JOBS% %
Gross PAYGrevenue
(smoothed %pa)(rhs) Employment
(lhs)
-60
-30
0
30
60
90
3.5
4.0
4.5
5.0
5.5
6.0
Jan-08 Nov-08 Sep-09 Jul-10 May-11 Mar-12
LABOUR MARKET
Employmentgrowth
(3mnth average, rhs)
Unemployment rate(lhs)
% '000
For
per
sona
l use
onl
y

134
Business
The mining construction boom will support
economic growth
But structural change weighing on the non-
mining economy
For
per
sona
l use
onl
y
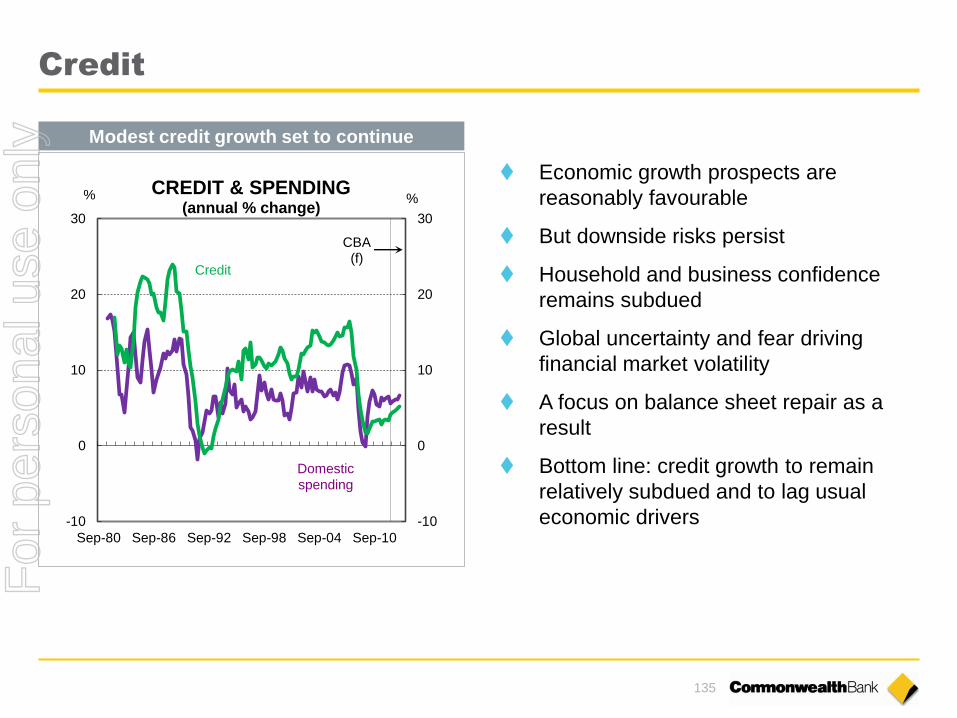
135
Credit
Economic growth prospects are
reasonably favourable
But downside risks persist
Household and business confidence
remains subdued
Global uncertainty and fear driving
financial market volatility
A focus on balance sheet repair as a
result
Bottom line: credit growth to remain
relatively subdued and to lag usual
economic drivers -10
0
10
20
30
-10
0
10
20
30
Sep-80 Sep-86 Sep-92 Sep-98 Sep-04 Sep-10
CREDIT & SPENDING (annual % change)
% %
Credit
Domesticspending
CBA(f)
Modest credit growth set to continue
For
per
sona
l use
onl
y
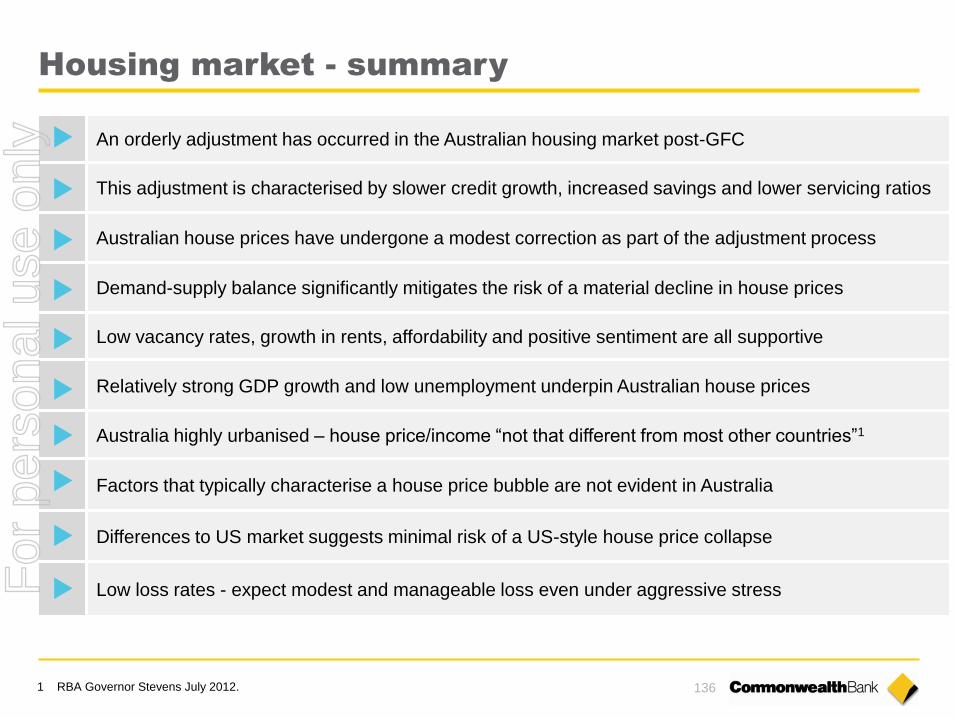
136
Housing market - summary
An orderly adjustment has occurred in the Australian housing market post-GFC
This adjustment is characterised by slower credit growth, increased savings and lower servicing ratios
Australian house prices have undergone a modest correction as part of the adjustment process
Demand-supply balance significantly mitigates the risk of a material decline in house prices
Low vacancy rates, growth in rents, affordability and positive sentiment are all supportive
Relatively strong GDP growth and low unemployment underpin Australian house prices
Australia highly urbanised – house price/income “not that different from most other countries”1
Factors that typically characterise a house price bubble are not evident in Australia
Differences to US market suggests minimal risk of a US-style house price collapse
Low loss rates - expect modest and manageable loss even under aggressive stress
1 RBA Governor Stevens July 2012.
For
per
sona
l use
onl
y
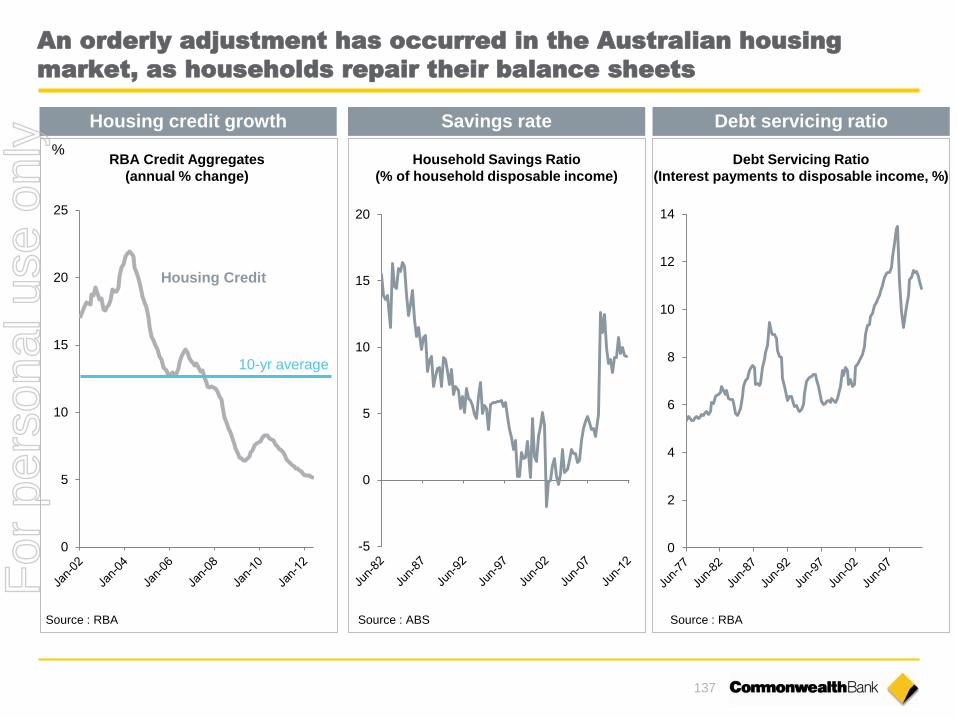
137
An orderly adjustment has occurred in the Australian housing
market, as households repair their balance sheets
0
5
10
15
20
25
Housing credit growth Savings rate
RBA Credit Aggregates
(annual % change)
Housing Credit
10-yr average
%
-5
0
5
10
15
20
Household Savings Ratio
(% of household disposable income)
Source : ABS
0
2
4
6
8
10
12
14
Source : RBA
Debt Servicing Ratio
(Interest payments to disposable income, %)
Source : RBA
Debt servicing ratio
For
per
sona
l use
onl
y
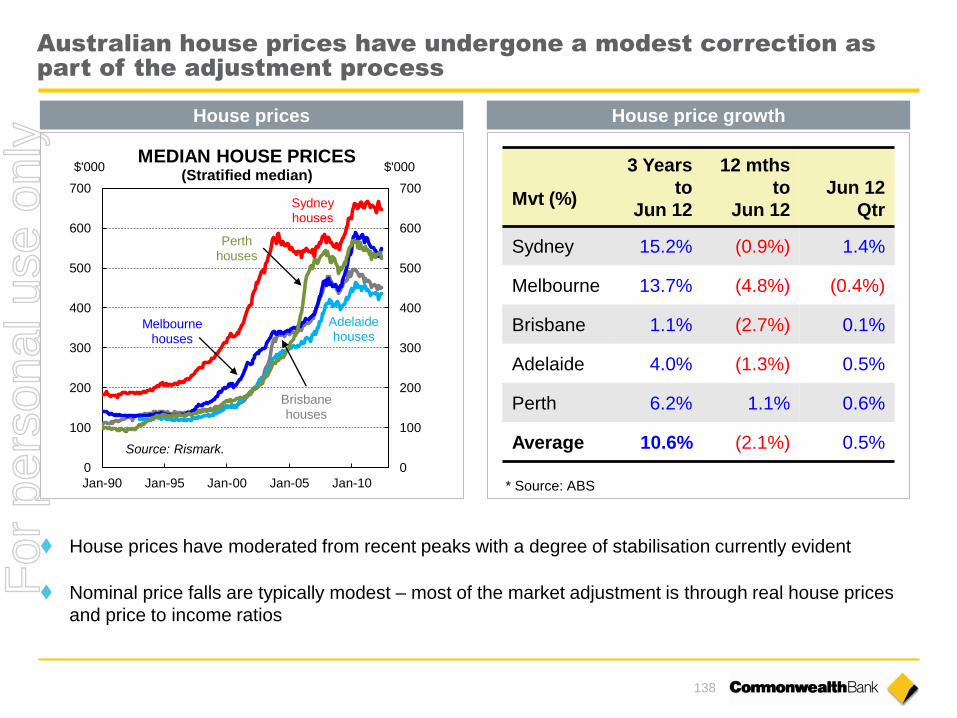
138
Australian house prices have undergone a modest correction as
part of the adjustment process
House prices have moderated from recent peaks with a degree of stabilisation currently evident
Nominal price falls are typically modest – most of the market adjustment is through real house prices
and price to income ratios
House prices House price growth
Mvt (%)
3 Years
to
Jun 12
12 mths
to
Jun 12
Jun 12
Qtr
Sydney 15.2% (0.9%) 1.4%
Melbourne 13.7% (4.8%) (0.4%)
Brisbane 1.1% (2.7%) 0.1%
Adelaide 4.0% (1.3%) 0.5%
Perth 6.2% 1.1% 0.6%
Average 10.6% (2.1%) 0.5%
* Source: ABS
0
100
200
300
400
500
600
700
0
100
200
300
400
500
600
700
Jan-90 Jan-95 Jan-00 Jan-05 Jan-10
MEDIAN HOUSE PRICES(Stratified median)
Sydneyhouses
Melbournehouses
$'000$'000
Source: Rismark.
Brisbanehouses
Adelaidehouses
Perthhouses
For
per
sona
l use
onl
y
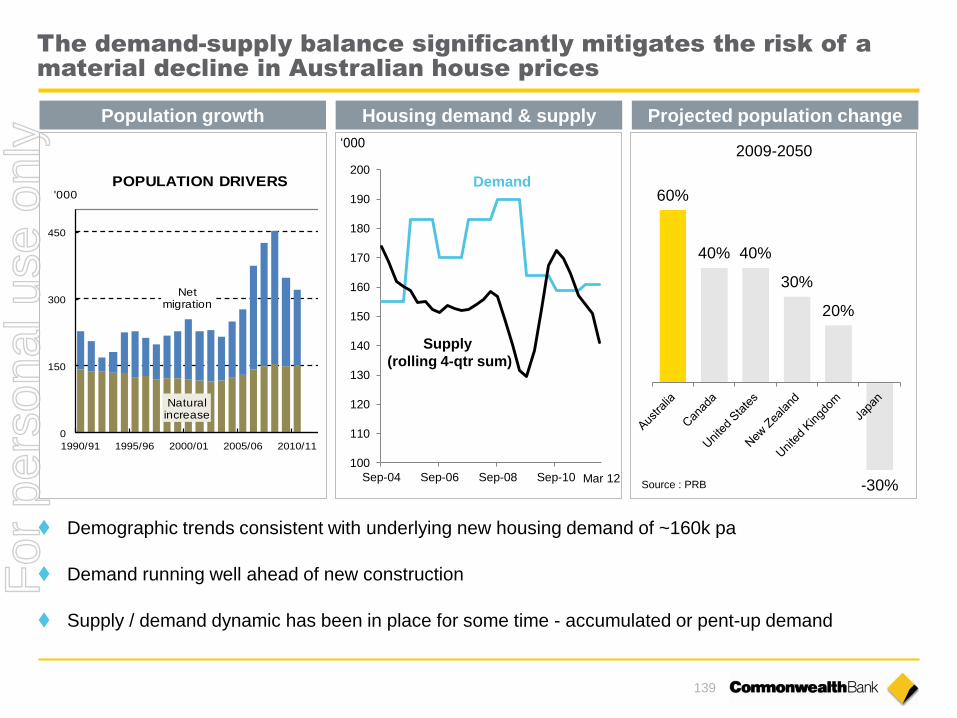
139
The demand-supply balance significantly mitigates the risk of a
material decline in Australian house prices
Demographic trends consistent with underlying new housing demand of ~160k pa
Demand running well ahead of new construction
Supply / demand dynamic has been in place for some time - accumulated or pent-up demand
0
150
300
450
0
150
300
450
1990/91 1995/96 2000/01 2005/06 2010/11
POPULATION DRIVERS'000 '000
Netmigration
Naturalincrease
Population growth Housing demand & supply
100
110
120
130
140
150
160
170
180
190
200
Sep-04 Sep-06 Sep-08 Sep-10
Supply
(rolling 4-qtr sum)
Demand
‘000
Mar 12
Projected population change
60%
40% 40%
30%
20%
-30%
2009-2050
Source : PRB
For
per
sona
l use
onl
y
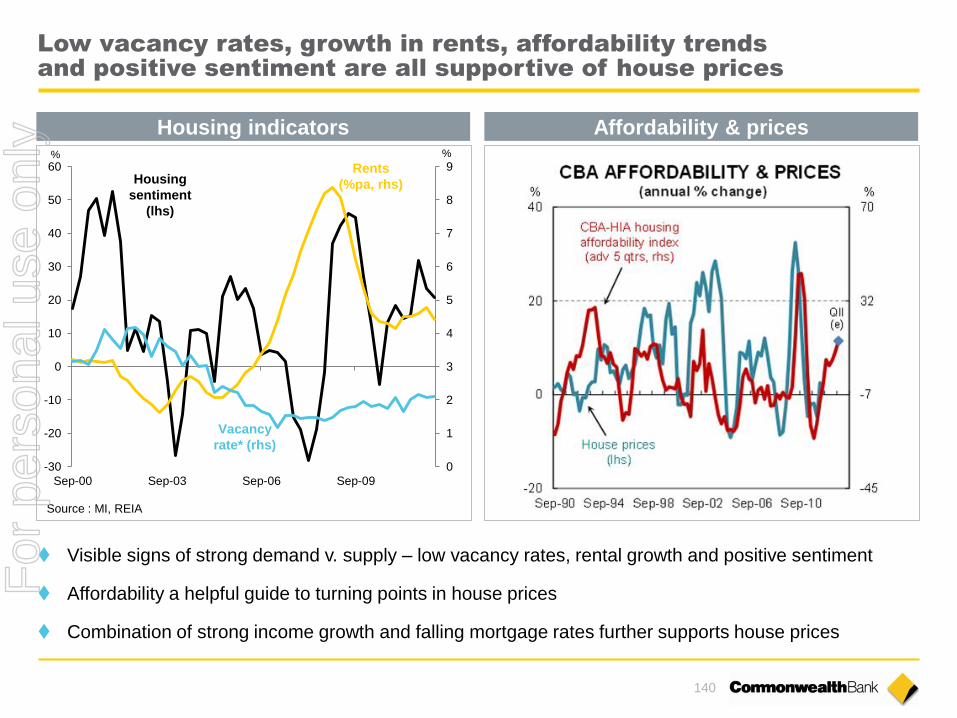
140
Low vacancy rates, growth in rents, affordability trends
and positive sentiment are all supportive of house prices
Housing indicators Affordability & prices
Visible signs of strong demand v. supply – low vacancy rates, rental growth and positive sentiment
Affordability a helpful guide to turning points in house prices
Combination of strong income growth and falling mortgage rates further supports house prices
0
1
2
3
4
5
6
7
8
9
-30
-20
-10
0
10
20
30
40
50
60
Sep-00 Sep-03 Sep-06 Sep-09
Housing
sentiment
(lhs)
Rents
(%pa, rhs)
Vacancy
rate* (rhs)
Source : MI, REIA
% %
For
per
sona
l use
onl
y

141
Strong economic fundamentals underpin Australian house prices
GDP growth Stronger labour market
Australian economic performance continues to be strong in global context
Unemployment, a key determinant of mortgage loss, remains at low levels
90
92
94
96
98
100
102
104
106
108
110
Mar-08 Mar-09 Mar-10 Mar-11 Mar-12
Australia
NZ
US
Japan
Europe UK
0
2
4
6
8
10
12
Jan-05 Jan-07 Jan-09 Jan-11
Euro Zone
US
Japan
Australia
UK
Source : National statistical agencies.
% Unemployment
For
per
sona
l use
onl
y
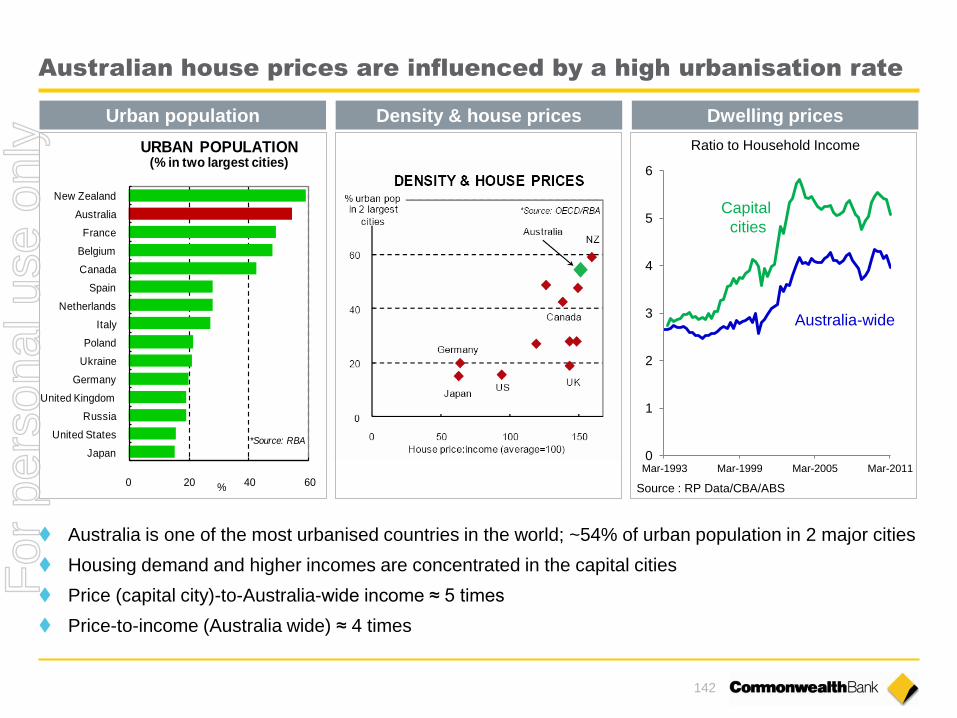
142
Australian house prices are influenced by a high urbanisation rate
Australia is one of the most urbanised countries in the world; ~54% of urban population in 2 major cities
Housing demand and higher incomes are concentrated in the capital cities
Price (capital city)-to-Australia-wide income ≈ 5 times
Price-to-income (Australia wide) ≈ 4 times
0 20 40 60
Japan
United States
Russia
United Kingdom
Germany
Ukraine
Poland
Italy
Netherlands
Spain
Canada
Belgium
France
Australia
New Zealand
URBAN POPULATION(% in two largest cities)
%
*Source: RBA
0
1
2
3
4
5
6
Mar-1993 Mar-1999 Mar-2005 Mar-2011
Australia-wide
Capital
cities
Source : RP Data/CBA/ABS
Ratio to Household Income
Urban population Density & house prices Dwelling prices
For
per
sona
l use
onl
y
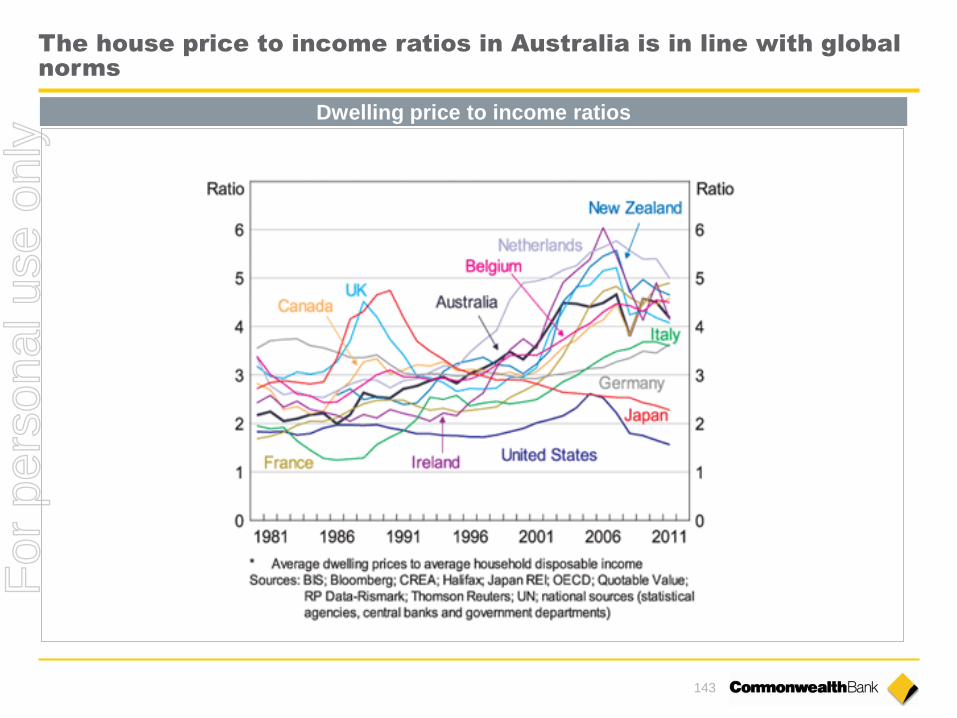
143
The house price to income ratios in Australia is in line with global
norms
Dwelling price to income ratios
For
per
sona
l use
onl
y

144
Housing “Bubble” –
typical characteristics Current position in Australia
Unsustainable asset prices Prices supported by the excess of demand over supply
Australia’s population continues to grow at above average rates
Supply-side restraints - limited new land releases, low construction
Low residential vacancy rates and rising rents
Speculative investment
artificially inflates asset prices
Investment lending has remained steady
Strong volume growth driven
by relaxed lending standards
Already stringent standards tightened through GFC
Minimal “low doc” lending
Mortgage insurance for higher LVR loans
Full recourse lending
Interaction of high debt levels
and interest rates
A high proportion of borrowers ahead of required repayment levels
Interest rate buffers built into loan serviceability tests at application
CBA home loan losses remain low
Domestic economic shock –
trigger for price correction
Australian economy well placed
Close to full employment
Factors that typically characterise a house price bubble
are not evident in Australia
For
per
sona
l use
onl
y

145 1 Source: Federal Reserve Bank of San Francisco.
2 Source: Mortgage Bankers Association.
Significant differences between Australian and US housing
markets minimise risk of a US style house price collapse
CBA / Aust US
Unemployment ~5% ~8%
No-Recourse Lending No Yes
Variable vs Fixed ~85%/15% ~15%/85%
Sub-Prime (% of mkt) Minimal ~14%1
Securitisation % Minimal ~55%1
Account ownership Retained by
bank
Extensively on-
sold
Arrears/Delinquencies ~1-2% ~7.4%/11.79%2
Principal and interest amortising 25/30
year loan
Variable interest rate set at bank’s
discretion
Limited pre-payment penalty
Full recourse to borrower
No tax deduction for owner occupied
housing
Higher risk loans are subject to Lenders
Mortgage Insurance (LMI)
Minimal “low documentation” (ie self
certified) market with tighter lending criteria
Tight consumer credit regulations
Major banks account for majority of new
originations and “originate-to-hold”
Australian mortgage product
For
per
sona
l use
onl
y
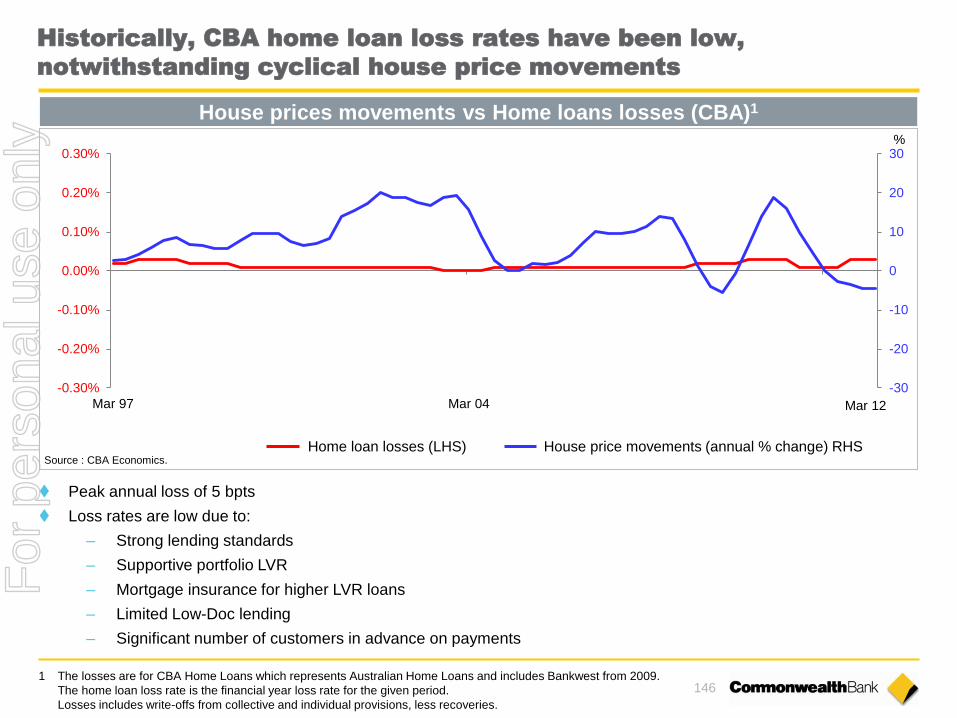
146
-30
-20
-10
0
10
20
30
-0.30%
-0.20%
-0.10%
0.00%
0.10%
0.20%
0.30%
Mar 97 Mar 04 Mar 11
Historically, CBA home loan loss rates have been low,
notwithstanding cyclical house price movements
%
Source : CBA Economics.
Peak annual loss of 5 bpts
Loss rates are low due to:
– Strong lending standards
– Supportive portfolio LVR
– Mortgage insurance for higher LVR loans
– Limited Low-Doc lending
– Significant number of customers in advance on payments
House prices movements vs Home loans losses (CBA)1
Home loan losses (LHS) House price movements (annual % change) RHS
1 The losses are for CBA Home Loans which represents Australian Home Loans and includes Bankwest from 2009.
The home loan loss rate is the financial year loss rate for the given period.
Losses includes write-offs from collective and individual provisions, less recoveries.
Mar 12
For
per
sona
l use
onl
y

147
High stress loss = $1.7bn over 3 yrs
(~0.5% of book)
Even under a high stress scenario, CBA home loan losses would be
modest/manageable – ($1.7bn over 3 years, or ~0.5% of book)
1%
11.5%
-32%
Interest
Rates Unemployment
Property
Values
Factors Mitigating Against Potential
Losses
Full recourse to borrower
Portfolio average LVR 44%1
Higher risk loans are mortgage
insured
68% of customers paying in advance
(average of 7 payments)
Interest rate buffer of 150 bpts in
serviceability tests since 2009
1 Portfolio average LVR = current balance / original valuation.
For
per
sona
l use
onl
y

148
Notes
1 Roy Morgan Research Main Financial Institution (MFI) Retail Customer Satisfaction. Australian population 14+, %
“Very Satisfied” or “Fairly Satisfied” with relationship with that MFI. 6-month rolling average. Note the institution
definitions were updated in March 2012. CBA excludes Bankwest.
2 DBM Business Financial Services Monitor (June 2012), average satisfaction rating of each financial institution’s MFI
business customers across all Australian businesses, 6 month rolling average.
3 Products per Customer – Roy Morgan Research. Australian Population 18+ , Banking and Finance products per
Banking and Finance customer at financial institution. 6 month moving average. CBA excludes Bankwest.
4 Roy Morgan Research, Australians 14+, Proportion of Banking and Finance MFI Customers that nominated each
bank as their Main Financial Institution, 12 month rolling data to reporting month.
5 DBM Business Financial Services Monitor, measured micro business with turnover up to $1 million, small business
with turnover of $1 million up to $5 million, medium business with turnover of $5 million up to $50 million and large
business with turnover of over $50 million, 6 month rolling average.
Sources for results outlined in this pack
For
per
sona
l use
onl
y

Commonwealth Bank of Australia ACN 123 123 124
Results Presentation For the half year ended 31 December 2009
10 February 2010
Results Presentation FOR THE FULL YEAR ENDED 30 JUNE 2012
Ian Narev Chief Executive Officer
David Craig Chief Financial Officer
15 AUGUST 2012 | COMMONWEALTH BANK OF AUSTRALIA | ACN 123 123 124
For
per
sona
l use
onl
y