results readiness in social protection & labor operations: social service delivery
DESCRIPTION
The social protection (SP) portfolio includes a number of operations that are focused on improving service delivery across a broad range of social services.TRANSCRIPT
Abstract
The Results Readiness Review assessed progress to date on results-based management in the Social Protection & Labor (SP&L) portfolio and generated operationally relevant knowledge on how to strengthen Monitoring & Ev aluation (M&E). Specifi cally, the Review took stoc k of the status and quality of M&E in the SP&L portfolio, including both investment and polic y-based lending. The Review identifi ed trends, strengths and weaknesses, and good pr actice M&E approac hes and indicators to incorpor ate a better results focus in project design and implementation. This related Note pro vides guidance for World Bank Task Teams working on Social Service Delivery Projects.
HUMAN DEVELOPMENT NETWORK
About this series...Social Protection Discussion Papers are published to communicate the results of The World Bank’s work to the development community with the least possible delay. The typescript manuscript of this paper therefore has not been prepared in accordance with the procedures appropriate to formally edited texts. The fi ndings, interpretations, and conclusions expressed herein are those of the author(s), and do not necessarily refl ect the views of the International Bank for Reconstruction and Development / The World Bank and its affi liated organizations, or those of the Executive Directors of The World Bank or the governments they represent. The World Bank does not guarantee the accuracy of the data included in this work.
For free copies of this paper, please contact the Social Protection Advisory Service, The World Bank, 1818 H Street, N.W., Room G7-703, Washington, D.C. 20433 USA. Telephone: (202) 458-5267, Fax: (202) 614-0471, E-mail: [email protected] or visit the Social Protection website at www.worldbank.org/sp.
Results Readiness in Social Protection & Labor Operations: Technical Guidance Notes for Social Service Delivery Projects
Julie Van Domelen
S P D I S C U S S I O N P A P E R
February 2011
NO. 1106

1
Results Readiness in Social Protection and Labor Operations
Technical Guidance Notes for Social Service Delivery Projects1
1. Introduction
The social protection (SP) portfolio includes a number of operations that are focused on improving service delivery across a broad range of social services. These service delivery goals are typically oriented to improving access to and quality of social services, usually as part of broader government reform and decentralization strategies. There is one case of this type of a project in an emergency context, ensuring access to basic services as an important complement to a safety net strategy. There are other complementarities between safety nets and service delivery projects, for example many safety net programs like CCTs rely on the basic functioning of health and education services in the vicinity of program beneficiaries.
The cohort includes 12 social service delivery‐oriented SP projects representing about 15 percent of the cohort with an average of 2 operations approved per year in the period FY05‐09.2 Despite the relatively lower frequency of this type of SP operation, there was broad regional representation with 5 in AFR, 4 in LAC and one each in MENA, SAR and ECA. The group is evenly divided between policy‐based and investment lending, with six policy‐based DPL/PSC projects, four specific investment projects, one technical assistance and one emergency recovery project. The prominence of DPLs underscores the policy type of objectives often found in these projects. The DPLs range from PRSCs and DPLs with broader country focus, like Madagascar and Niger, to DPLs more narrowly focused on social services, as is the case of a series of DPLs in Peru. Investment lending ranges from stabilization of social services in response to crisis in the West Bank and Gaza, to longer‐term institutional objectives of decentralizing social service delivery and financing in Serbia and Ethiopia. In terms of institutional objectives, these projects most typically focus on sector institutions and decentralization strategies. There is less of a focus on the community level than on subnational government roles and responsibilities.
2. Project Development Objectives (PDOs)
i. Description of General Practice
PDOs are mapped against the main SP focus areas in Table 1. PDOs for these type of SP projects tend to focus most prominently on improving the quality of service delivery more broadly (see Appendix A for list of PDOs in this cohort). This more typical core objective is often accompanied by national and sectoral institutional objectives and a search for improved human development outcomes. These projects are most often attempting to improve the policy framework, quality and impact of existing services above expanding access to social services, which appears as a goal in only 42 percent of the cohort projects. One‐third of projects have decentralization and improved fiscal efficiency as a main goal. However, even when not clearly stated as part of the PDO, decentralization and efficiency are often seen as ways of improving quality or impact. See Appendix for a list of the PDOs of these projects.
1 This Note has been prepared by Julie Van Domelen. 2 Description of methodology and cohort selection can be found in the main paper.

2
Table 1: PDOs by SP Focus Area
Expressed as part of the PDOs: Frequency % of Projects
Quality of services/service delivery 9 75%
National/sectoral government institutional capacity building (benefits
administration, management and operation of programs, targeting system)
7 58%
Human development outcomes (improved education, health and nutrition,
HIV status)
6 50%
Access to public services and infrastructure (schools, health centers, roads
etc.) – local public goods
5 42%
Local government institutional capacity building (anything sub‐national) 4 33%
Fiscal objectives/efficiency 4 33%
Community empowerment and capacity building (non‐government) 2 17%
Reaching specific vulnerable groups/poverty targeted groups 1 8%
Access to economic opportunities (microcredit, active labor market
programs, skills development, etc.)
0 0%
Temporary income support (unconditional transfers, public works and
temporary employment, CCTs, wage subsidies, etc.)
0 0%
A minority (17 percent) of these projects seek to use community‐based channels to improve social service delivery, with more of a top‐down institutional strengthening and policy development approach within this cohort. There was little attention on targeting specific vulnerable groups since such projects were more often categorized as explicit safety net operations nor was there inclusion of economic concerns.
ii. Assessment of Performance
Table 2: PDO Ratings
Rating Is the PDO outcome‐driven
by expressing clearly the
targeted outcome for the
intended beneficiaries?
(frequency)
Is the PDO focusing on
outcomes for which the
project can be reasonably
held accountable for
(frequency)
Summary rating of PDO
(frequency)
Highly satisfactory ‐ ‐ ‐
Satisfactory 2 2 1
Moderately satisfactory 7 7 9
Moderately unsatisfactory 3 3 2
Unsatisfactory ‐ ‐ ‐
Highly unsatisfactory ‐ ‐ ‐
Average Score 3.1 3.1 3.1
Ratings determined by external reviewer based on a scale of 1 (highly satisfactory) – 6 (highly unsatisfactory).
3
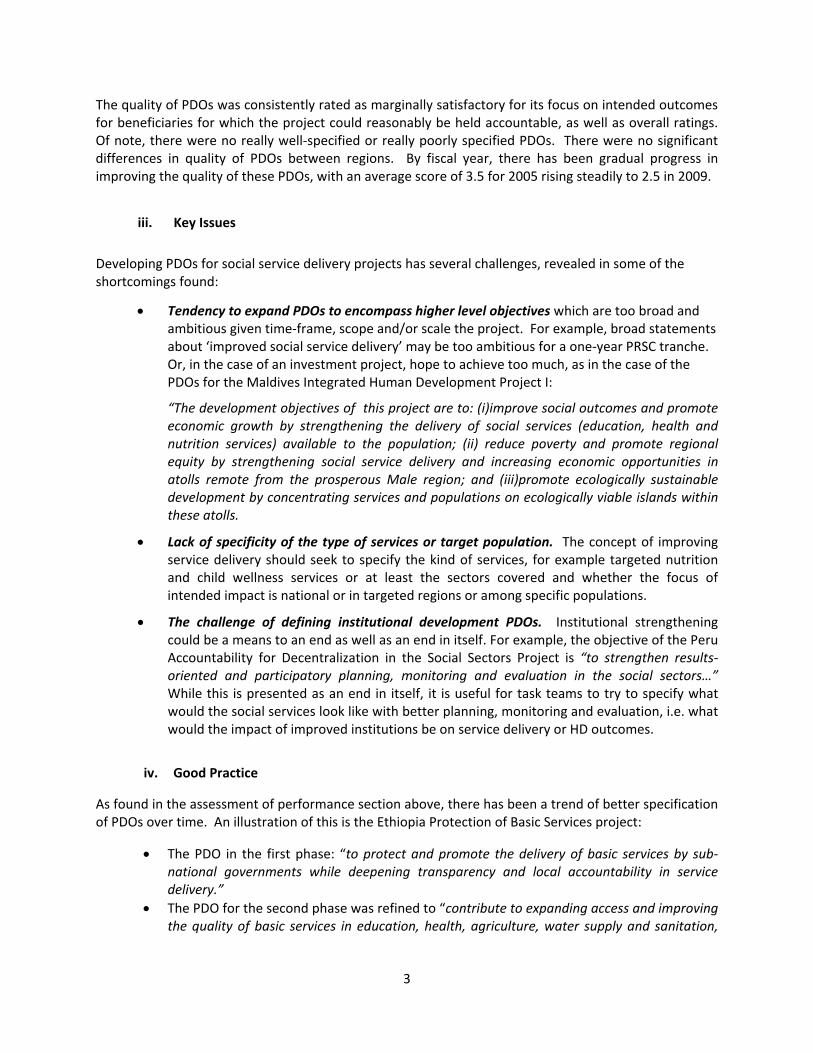
The quality of PDOs was consistently rated as marginally satisfactory for its focus on intended outcomes for beneficiaries for which the project could reasonably be held accountable, as well as overall ratings. Of note, there were no really well‐specified or really poorly specified PDOs. There were no significant differences in quality of PDOs between regions. By fiscal year, there has been gradual progress in improving the quality of these PDOs, with an average score of 3.5 for 2005 rising steadily to 2.5 in 2009.
iii. Key Issues
Developing PDOs for social service delivery projects has several challenges, revealed in some of the shortcomings found:
Tendency to expand PDOs to encompass higher level objectives which are too broad and ambitious given time‐frame, scope and/or scale the project. For example, broad statements about ‘improved social service delivery’ may be too ambitious for a one‐year PRSC tranche. Or, in the case of an investment project, hope to achieve too much, as in the case of the PDOs for the Maldives Integrated Human Development Project I:
“The development objectives of this project are to: (i)improve social outcomes and promote economic growth by strengthening the delivery of social services (education, health and nutrition services) available to the population; (ii) reduce poverty and promote regional equity by strengthening social service delivery and increasing economic opportunities in atolls remote from the prosperous Male region; and (iii)promote ecologically sustainable development by concentrating services and populations on ecologically viable islands within these atolls.
Lack of specificity of the type of services or target population. The concept of improving service delivery should seek to specify the kind of services, for example targeted nutrition and child wellness services or at least the sectors covered and whether the focus of intended impact is national or in targeted regions or among specific populations.
The challenge of defining institutional development PDOs. Institutional strengthening could be a means to an end as well as an end in itself. For example, the objective of the Peru Accountability for Decentralization in the Social Sectors Project is “to strengthen results‐oriented and participatory planning, monitoring and evaluation in the social sectors…” While this is presented as an end in itself, it is useful for task teams to try to specify what would the social services look like with better planning, monitoring and evaluation, i.e. what would the impact of improved institutions be on service delivery or HD outcomes.
iv. Good Practice
As found in the assessment of performance section above, there has been a trend of better specification of PDOs over time. An illustration of this is the Ethiopia Protection of Basic Services project:
The PDO in the first phase: “to protect and promote the delivery of basic services by sub‐national governments while deepening transparency and local accountability in service delivery.”
The PDO for the second phase was refined to “contribute to expanding access and improving the quality of basic services in education, health, agriculture, water supply and sanitation,

4
and rural roads delivered by subnational governments, while continuing to deepen transparency and local accountability in service delivery.” The second formulation better specifies that the goal is to ‘expand access and improve quality’, rather than the vaguer ‘promote and protect’, as well as the sectors covered in basic services.
Another example of better specification, this time through simplification, is the Maldives Integrated Human Development Project. The original PDOs were to: (i) improve social outcomes and promote economic growth by strengthening the delivery of social services (education, health and nutrition services) available to the population; (ii)reduce poverty and promote regional equity by strengthening social service delivery and increasing economic opportunities in atolls remote from the prosperous Male region; and (iii) promote ecologically sustainable development by concentrating services and populations on ecologically viable islands within these atolls. The PDOs were restructured to focus on the measurable outcomes which can be monitored, in line with the IDA‐14 requirements. The original objectives are promoted by the project but may not be achieved in a measurable manner during the project life time which lasts till 2010. The revised PDOs were: “to assist the Borrower in improving the delivery of social services on Focus Islands”.
3. Key Performance Indicators
i. Description of General Practice
Among the 12 social service delivery projects, there were 88 outcome indicators and 101 intermediate outcome/output indicators, or about seven and eight per project, respectively (Table 3). While SP projects typically have a much larger group of intermediate outcome indicators versus outcome indicators, this is less the case in this cohort, which may be due to the preponderance of policy‐based lending (DPLs, PRSCs, etc.) which focus on outcomes rather than tracking investment outputs.
While PDOs tended to be concentrated in quality of services and institutional development, this was not reflected in KPIs. Outcome KPIS were largely concentrated on measuring human development outcomes (Table 3). This predominance of human development outcomes to assess achievement of project objectives shows that these projects are ultimately seeking to improve the lives of people, not just improve the quality of services and institutions. Quality and access to service were the next most frequent area of outcome KPIs. Despite its prominence within PDOs, capacity of national and sectoral institutions was infrequently measured as a project outcome.
For intermediate outcomes, the majority of the focus was on institutional indicators to measure national, sectoral and local government capacities and policies. The focus of this is in tracking the ‘how’ of improving social service delivery, i.e. through improvements in institutional performance. There was significant attention to local government indicators in the projects where decentralization of service delivery was part of the goals.
Appendix 2 provides examples of KPIs by objective area for these social service delivery‐type SP operations. These projects tend to use standard sectoral indicators, but a reduced subset from the lists more typically found in sectoral reform programs. They also have a strong focus on quality and institutional issues. There is a lack of consistency between what is considered an outcome indicator versus an intermediate outcome indicator, which is made more difficult by the confusing terminology of the Bank guidelines in this area. Appendix 2 provides lists of KPIs along a continuum of project outputs to outcomes for Task Teams.

5
Ratings determined by external reviewer based on a scale of 1 (highly satisfactory) – 6 (highly unsatisfactory).
ii. Assessment of Performance
Table 3 provides ratings and performance information by focus area both for outcome and intermediate KPIs. The overall quality of KPIs for social service delivery projects is satisfactory (2.75), though bordering on marginally satisfactory. The overall quality of outcome indicators is better than intermediate indicators.
Looking at the group of outcome indicators:
Linkages to PDOs are strong. Performance is slightly weaker in terms of linkages of institutional indicators at the national and local government levels, though this is mainly due to limitations in the specifications of these institutional goals within PDOs.
Table 3:Performance on KPIs
Outcomes
(by frequency ranking of inclusion in PDOs)
Frequency
(#)
Clear Link
with PDO
Rating
SMART
Rating
Data Source
Specified
Rating
% of KPIs
w/ targets
% KPIs reported
in ISRs
Overall 88 2.2 3.0 3.2 80% 74%
Quality of services/service delivery 15 2.4 3.1 3.7 80% 80%
National/sectoral government institutional
capacity building
11 2.7 3.6 4.3 40% 93%
Human development outcomes 38 2.0 2.7 2.9 84% 68%
Access to public services and infrastructure –
local public goods
14 2.0 2.5 2.8 93% 79%
Local government institutional capacity building 7 2.7 3.6 4.7 43% 86%
Fiscal objectives/efficiency 10 2.6 3.2 4.0 70% 90%
Community empowerment and capacity building 10 2.5 3.7 3.9 50% 70%
Reaching specific vulnerable groups/poverty
targeted groups
9 2.1 2.8 3.4 56% 56%
Access to economic opportunities 3 2.0 2.7 2.0 33% 67%
Temporary income support ‐‐ ‐‐ ‐‐ ‐‐
Intermediate Outcomes/Outputs Frequency Clear Link
with PDO
SMART Data Source
Specified
% of KPIs
w/ targets
% KPIs reported
in ISRs
Overall 101 2.7 3.2 3.0 90% 82%
Quality of services/service delivery 19 2.8 3.1 3.4 84% 95%
National/sectoral government institutional
capacity building
27 2.9 3.7 3.0 93% 67%
Human development outcomes 7 2.6 2.6 3.3 100% 100%
Access to public services and infrastructure –
local public goods
15 2.6 2.6 2.4 80% 87%
Local government institutional capacity building 28 2.4 3.0 3.2 82% 79%
Fiscal objectives/efficiency 14 2.4 3.2 3.6 100% 93%
Community empowerment and capacity building 12 2.8 4.0 3.4 67% 83%
Reaching specific vulnerable groups/poverty
targeted groups
3 3.0 4.0 3.5 100% 67%
Access to economic opportunities ‐‐‐ ‐‐ ‐‐ ‐‐ ‐‐ ‐‐
Temporary income support ‐‐ ‐‐ ‐‐ ‐‐ ‐‐ ‐‐

6
The quality (SMART ratings) of the outcome indicators are highest in human development outcomes and access to services. These are also areas where measurement is pretty common.
Outcome indicators around were less well‐specified for institutional objectives at all levels (national, local government, community).
Not only were institutional outcome indicators difficult to specify, they often lacked clear data sources. In particular, data for outcomes at the local government level were poorly identified at project design stage.
Overall, 80% of outcome KPIs had targets established. But again, targets were more likely to be set for service delivery and human development outcomes than for institutional ones.
Three‐quarters of outcome KPIs were tracked in ISRs (or at least entered into ISRs for eventual tracking). Interestingly, although human development outcomes were the most frequent outcome indicator for social service delivery projects, they were among the least likely to be reported in KPIs. In part, this is due to the fact that indicators of household outcomes are expensive to collect. Conversely, although they were difficult to specify, institutional indicators were more likely to actually be tracked in KPIs.
Findings for intermediate indicators were similar, with some key differences:
Intermediate indicators to track institutional issues were better specified. These indicators were largely related to project‐level outputs in those areas.
Community empowerment and targeting‐related intermediate indicators were generally not well‐specified. The main problems were issues with vaguenesss and measurability (like ‘increased dialogue between Government and communities’).
Targets were routinely set and indicators consistently reported. Ninety percent of these indicators had targets set and 82 percent were entered into ISRs for tracking.
iii. Key Issues
Key issues in developing and using KPIs for social service delivery projects include:
Linking PDOs that seek improved quality of service delivery with high‐quality, measurable indicators of service quality. Improving the quality of service delivery was the most common PDO area but not a very prevalent area of KPIs. Those KPIs that focused on quality of social service delivery.
Developing better indicators of institutional impact. This is one of the weaker areas of KPIs. For instance, there is a tendency to focus on outputs, like adoption of social service norms, standards or policies rather than the reflection of these in actual service delivery.

7
Identifying ex‐ante sources of data for most indicators, particularly those related to institutional development. Even where the indicator itself is very clear, like new malaria cases, the national health information systems may not be in place to adequately capture this indicator in a timely fashion or under‐reporting to clinics may make official measures meaningless.
Differentiation between intermediate and outcome indicators. For examples, indicators of increased access to health posts or school attendance or funding allocations could be found as both outcome and intermediate indicators.
Frequent changing of KPIs during execution. Half of the investment type social service delivery projects experienced substantial restricting of KPIs during execution. This occurred only one out of six of the DPLs, though the DPL format and short length makes this less likely. The high level of churn on indicators is attributable to a number of factors: (a) a lack of complete preparation up front, for example finding out an indicator in fact cannot be collected, (b) a disconnect during implementation (like when an evaluation fails to collect a KPI), (c) changes in the availability of national indicators (for example due to delays in national household survey processing, which is common), or (d) a desire of project teams to report on what can actually be reported so the project can show outcomes, leading to the introduction of new indicators.
iv. Identification of good practice
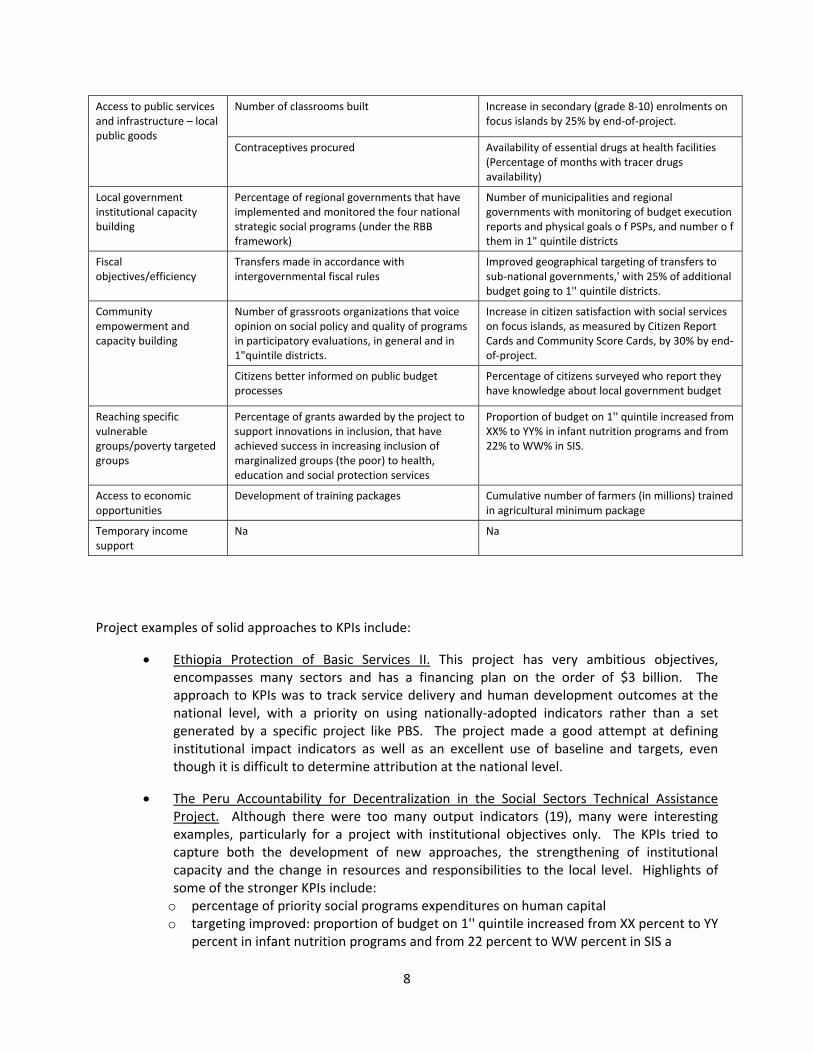
KPIs used in this cohort provide guidance on how to better specify outcome and intermediate indicators. Table 4 presents examples taken from the actual indicators used in this cohort. The general profile of best practice indicators are that they are more specific, they are more closely linked to the PDOs, they identify the target population, and the measurement is related directly to the intended outcome.
Table 4: Examples of Better Practice in KPIs
Focus area Weaker Stronger
Quality of services/service delivery: e.g.
Health
Education
Rural Institutional birth coverage
Percentage of health posts without shortages of injectable contraceptives in last three months
Share of education in national budget
Teachers recruited into education
Average student/teacher ratio in project regions
80% of secondary school teachers receive in‐service training
National/sectoral government institutional capacity building
Number of national strategic social programs with an increased budget (under the RBB framework)
Percentage o f budget linked to performance agreements reached
40% in food programs and 40% in rural infrastructure programs
Monitoring and evaluation system for prioritized national strategic social programs operating
Number of external evaluations of social programs# performance conducted and discussed (with social sectors)
Human development outcomes
New malaria cases Percentage of children under 1 vaccinated against DPT3 and measles
Improved second grade literacy outcomes Reduction in the gender gap in 0‐level pass rates on focus islands by 25% by end‐of‐project.
8
Project examples of solid approaches to KPIs include:
Ethiopia Protection of Basic Services II. This project has very ambitious objectives, encompasses many sectors and has a financing plan on the order of $3 billion. The approach to KPIs was to track service delivery and human development outcomes at the national level, with a priority on using nationally‐adopted indicators rather than a set generated by a specific project like PBS. The project made a good attempt at defining institutional impact indicators as well as an excellent use of baseline and targets, even though it is difficult to determine attribution at the national level.
The Peru Accountability for Decentralization in the Social Sectors Technical Assistance Project. Although there were too many output indicators (19), many were interesting examples, particularly for a project with institutional objectives only. The KPIs tried to capture both the development of new approaches, the strengthening of institutional capacity and the change in resources and responsibilities to the local level. Highlights of some of the stronger KPIs include:
o percentage of priority social programs expenditures on human capital o targeting improved: proportion of budget on 1'' quintile increased from XX percent to YY
percent in infant nutrition programs and from 22 percent to WW percent in SIS a
Access to public services and infrastructure – local public goods
Number of classrooms built Increase in secondary (grade 8‐10) enrolments on focus islands by 25% by end‐of‐project.
Contraceptives procured Availability of essential drugs at health facilities (Percentage of months with tracer drugs availability)
Local government institutional capacity building
Percentage of regional governments that have implemented and monitored the four national strategic social programs (under the RBB framework)
Number of municipalities and regional governments with monitoring of budget execution reports and physical goals o f PSPs, and number o f them in 1" quintile districts
Fiscal objectives/efficiency
Transfers made in accordance with intergovernmental fiscal rules
Improved geographical targeting of transfers to sub‐national governments,' with 25% of additional budget going to 1'' quintile districts.
Community empowerment and capacity building
Number of grassroots organizations that voice opinion on social policy and quality of programs in participatory evaluations, in general and in 1"quintile districts.
Increase in citizen satisfaction with social services on focus islands, as measured by Citizen Report Cards and Community Score Cards, by 30% by end‐of‐project.
Citizens better informed on public budget processes
Percentage of citizens surveyed who report they have knowledge about local government budget
Reaching specific vulnerable groups/poverty targeted groups
Percentage of grants awarded by the project to support innovations in inclusion, that have achieved success in increasing inclusion of marginalized groups (the poor) to health, education and social protection services
Proportion of budget on 1'' quintile increased from XX% to YY% in infant nutrition programs and from 22% to WW% in SIS.
Access to economic opportunities
Development of training packages Cumulative number of farmers (in millions) trained in agricultural minimum package
Temporary income support
Na Na

9
o number of performance agreements signed between MIMDES and municipalities including participation benchmarks,
o Number of applications submitted by municipalities for accreditation o percentage increase in the social sectors’ budget allocation to results based budgeting o number of municipalities with improved monitoring indicators, including: (ii) targeting
indicators for nutritional programs; (ii)knowledge, attitudes and practices of mothers for infant nutrition programs; and (iii) maintenance and management capacities for rural infrastructure programs.
4. Design and Implementation of M&E
i. Description of General Practice
As presented in Table 5, MIS systems and impact evaluations were the most common elements of M & E frameworks in social service delivery projects, although these were applied in only one‐third of the projects. Participatory mechanisms and beneficiary assessments were only used in three of the 12 cases. This is lower than might be expected given the overarching objectives of improving quality of service delivery, which would benefit from direct feedback from those receiving services. The most frequent element of M & E frameworks was “other” denoting that these types of projects tend to use varied approaches not typically found in SP projects. In the case of Ethiopia’s Protection of Basic Services Projects this included data quality assessments, staff tracking surveys, service facility survey. Peru’s Programmatic Social Reform Loan IV employed social auditing committees, transparency portals, sectoral monitoring systems, and use surveys as part of household surveys, among others. Only one‐third of social service delivery projects specified collaboration with other donors on the M & E framework and activities during the design stage.
ii. Assessment of Performance
Table 6: Ratings of M&E arrangements readiness by lending instrument
Average quality Project M&E PAD analysis Plan to Summary
Table 5: Monitoring and Evaluation Approaches
Frequency
Management Information Systems 4
Process evaluation 2
Beneficiary assessment 2
Impact evaluation 4
Technical audits 0
Participatory M & E/Score cards 1
Expenditure tracking studies 1
Spot checks 1
Other 8

10
of M&E
institutional
arrangements
beyond indicators
integration with
the
national/sectoral
M&E system
of M&E client
capacity
strengthen
client capacity
rating of M&E
arrangements
in PAD
Highly Satisfactory 0 1 0 3 1
Satisfactory 4 4 5 3 7
Moderately
Satisfactory 8 6 5 4 4
Moderately
Unsatisfactory 0 1 1 2 0
Unsatisfactory 0 0 1 0 0
Highly Unsatisfactory 0 0 0 0 0
Average rating (1‐6) 2.7 2.6 2.8 2.4 2.3
Ratings on the quality of M&E arrangements at appraisal for social service delivery projects was satisfactory. The strongest aspect was attention to plans to strengthen client capacity in M & E, which reflects the fact that many of these projects had overarching institutional objectives and hence paid attention to institutional capacity. However, the weakest area was PAD analysis of M & E client capacity, largely due a lack of description of existing systems’ strengths and weaknesses. Institutional arrangements beyond indicators were largely satisfactory, with no cases of weak performance. Integration with national/sectoral M & E systems was relatively good overall. DPLs had a slightly better score (2.5) than investment projects (2.7) largely due to their broader links with PRSP and national systems overall.
Table 7: M&E arrangements performance at implementation
Was the data collection plan
described in the PAD actually
implemented?
Are KPIs
updated
regularly?
Are the KPIs used to measure
progress and to inform decisions to
correct any problem identified?
Highly Satisfactory 0 0 0
Satisfactory 2 3 1
Moderately
Satisfactory 5 7 4
Moderately
Unsatisfactory 2 0 4
Unsatisfactory 1 0 2
Highly Unsatisfactory 0 0 0
NA 2 2 1
Average rating 3.2 2.7 3.6
The quality of implementation performance was rated as slightly weaker than design. A little more than half of the cohort implemented the data collection plan as expected at appraisal. Even though KPIs in general were collected, there were limitations in using them to correct problems identified. This is one

11
of the drawbacks of using broad national health and education indicators, for instance. Since attribution of a specific project to lowering national infant mortality or raising female primary school enrollments is questionable, these projects tend to be less responsive to changing their approach or activities in light of indicator reports. The significant level of KPI restructuring was due to a variety of factors, including availability of data, improvements in specification of indicators, and in some cases a tendency to change to indicators that are available and show progress.
Impact evaluations
Project design in three of the cases included plans for a robust impact evaluation of at least one of the components if not the full project. Two of the three reported the baseline data had been collected. However, in no case was there detailed information on methodology or costs presented as part of project appraisal documentation.
One of the key challenges to impact evaluations in the area of social service delivery is attribution, particularly since most of these projects, whether investment or policy‐based, tend to focus on broad national and sectoral outcomes. When a project focuses on national institutional reforms with no pilot, it is difficult to have the classic design of an impact evaluation duet o the difficulty of specifying the counterfactural or distinguishing control and comparison groups.
iii. Key Issues
Key issues identified with the M & E frameworks for social service delivery projects include:
Integration with national and sectoral monitoring and evaluation systems. Most of these projects seek to root their M & E systems within national and sectoral systems. Indicators are most often country or sectoral indicators not project‐specific indicators. This fits well within the broader institutional development goals of these projects, but it causes a few drawbacks. First, these projects are dependent on the ability of other agencies to carry out timely reporting of data, which is often quite problematic. And second, attribution of impacts to specific policy or investment decisions is difficult to draw.
Measuring progress toward sectoral goals. In almost all cases, the links between project activities and sectoral outcomes appears tenuous. In part this is because most of these projects really focus on either budget support or transfers to sub‐national governments.
Preparation of evaluation instruments as part of project design. These social service delivery projects used a wide array of evaluation instruments with little detail provided upfront as to coverage and approach. In particular, there was a lack of specification of impact evaluation methodologies, costs and institutional responsibilities up front which puts at risk the carrying out of such evaluations. In particular, baselines tend to lag.
iv. Identification of good practice
The best examples of M & E framework design and implementation had the following characteristics:

12
Utilization of multiple evaluation instruments. For example, an impact evaluation of household outcomes alone would be insufficient to capture results in terms of the institutional and service delivery goals of these projects. This implies using mixed methods (see Box 1) to capture administrative and institutional information as well as participatory tools to get client and use feedback.
Attention to providing technical support to national and sectoral systems. To be successful, not only did these projects have to use existing systems they had to develop concrete ways of improving these systems (see Box 2). In no case, was existing capacity really adequate to underpin an M & E framework.
Inclusion of sufficient intermediate outcome indicators. Because proving causality of impacts on household level wellbeing is difficult, it is important that these project include sufficient indicators that track service delivery‐type outcomes in order to make sure the ‘missing middle’ is filled in.
There are several specific examples of good practice among this cohort. In addition to detailed information on the two programs described in the following boxes, of note:
West Bank and Gaza Emergency Services Support Project III which provides an interesting example of using quarterly random spot checks to support M & E in emergency situations.
Peru 2nd Results & Accountability (REACT) DPL/DDO provides a clear description of how some key monitoring indicators will be supporting the PDO. Even though it is not a comprehensive monitoring system, this project places a great deal of emphasis on disseminating monitoring results and linking them with budget allocations to create a results‐based budget.

13
Box 1: Mixed‐Method and Multiple Instruments Used to Evaluate Results of Ethiopia’s Protection of Basic Services Projects
The Protection of Basic Services (PBS) Program was launched in June 2006 by the Government of Ethiopia and international development partners. The goal of PBS is to protect and promote the delivery of basic services in health, education, agriculture, water and sanitation sectors by sub‐national governments while deepening transparency and local accountability. The monitoring and evaluation framework for PBS is complex and multifaceted, comprised of quantitative and qualitative assessments/studies which seek to measure not only changes in household welfare and access to services but the quality of those services, citizen’s perceptions and administrative efficiency and capacity to deliver those services. While this includes a series of external evaluations, much of the service delivery information is to be generated through national and sectoral systems. The sector‐specific indicators in the Results Monitoring Framework are consistent with those in national poverty reduction strategy and the relevant national sector development plans, and also with indicators tracked at local levels as part of Ethiopia’s results‐oriented approach to decentralized service delivery. The cost of this M & E averages $500,000 per year (2008‐2009) and receive the support from multiple donors. The core elements of the M & E framework include:
Baseline surveys and impact evaluation in the health sector: to provide robust measurement of changes in health status and services.
Joint Budget and Aid Reviews (JBAR): to review performance on budgeting and transfer of local level block grants and financial reporting
Public expenditure and commodity tracking surveys (PETS/QSDS) designed to provide an independent view on the flow of funds and commodities down the administrative ladder,
Social accountability Tools: including a Community Score Card (CSC), a Citizen Report Card (CRC) and Participatory Budgeting (PB involves stakeholders and/or independent individuals to examine and assess public budgets in relation to policy, preparation processes, implementation and outputs).
System Quality Assessments: to conduct sectoral M&E system assessments on data quality and management issues to identify strengths and challenges in collection, reporting and timely submission of administrative and financial data.
Support to the Central Statistics Agency (CSA): The Central Statistics Agency is the key government institution responsible for all economic, social and demographic data collection, compilation and dissemination
Other Studies: A socioeconomic study will be undertaken to better understand key bottlenecks to the achievement of relevant MDGs. The study will also identify barriers of access to basic
A joint comprehensive review of the Project’s Results Framework was carried out during the Mid‐Term Review
completed in May 2007. The review o f Project outcome indicators showed good progress towards the initially set
targets but also the need to review some of the indicators in order to be able to assess performance on an annual
basis by using administrative data. The M & E framework although complex has been carried out generally as
planned. The strengths of this M & E approach are the triangulation that is developed between reporting on
inputs, outputs and outcomes. Since the entire results chain is well captured within the M & E framework,
causality and other linkages are more clearly developed.

14
Box 2: Monitoring Social Service Delivery and Human Development Outcomes through a DPL: Niger’s First and Second Rural and Social Policy Reform Credit and Grant
The First and Second Rural and Social Policy Credit/Grant series (RSRC‐1 and RSRC‐2) ‐ 2006 and 2007 ‐ were designed as part of a series of DPLs to support the Government of Niger in improving service delivery to the poor and in implementing reforms in public sector management to secure adequate financing in critical sectors of the economy. In the human development area, the two operations aimed at improving service delivery in social sectors by: (i) enhancing human resource management; (ii) improving budget preparation and execution; (iii) enhancing accountability and governance at the school level; (iv) providing publicly financed basic health services to the poor and vulnerable groups; and (v) addressing demographic and gender dimensions. The two operations were designed to provide annual budget support. Mandatory prior actions focused on government policies and procedures, like improving the teacher payment system or granting full subsidization of certain elements of primary health care.
The project relied on tracking of key service delivery and human development outcomes to judge whether its objectives were achieved. The source of information for verifying indicators was clearly defined for each of them. The M & E framework was based on and sought to strengthen national systems, both those within the sectoral agencies as well as the national Statistical Office, including determining baseline data for 2005 and launching a national household survey in 2006.
Substantial progress was made during implementation to strengthen capacity and produce the information expected. For example, the Statistics Office moved further towards building up a modern data collection and analysis apparatus. Based on a medium‐term plan in close coordination with external partners, it completed a Core Welfare Indicators Questionnaire (CWIQ) survey in May 2006, a Participatory Survey on Poverty, which gives qualitative data on people’s perceptions of poverty, and a full‐fledged household budget survey in 2008. During supervision missions, the indicator table (below) was updated regularly. The indicators were a mix of outputs, processes and outcomes. However, it was difficult to trace actual or expected results on the ground to changes in the indicators. The ICR noted that some intermediate outcome indicators give a better sense on whether the objectives have been achieved. This is the case of the share of pro‐poor spending, which is close to target, and the number of contractual teachers, as well as the share of health budget allocated to regions and districts, which are both above targets. Nonetheless, the ability to support a relatively effective monitoring and evaluation framework in country noted for weak institutional capacity using a DPL instrument is noteworthy.
Outcome Indicators Baseline Expected Actual
Share in public expenditure in: ‐ education ‐ health ‐ rural development
17.7% 7.3% 25.3%
20.0% 10.0% 20.3%
18.8% 9.8%
22.5%
Share of girls in primary enrollment 41.0% 44.0% 43.0%
Share of qualified health staff in rural areas 48.0% 56.0% 52.0%
Intermediate outcome indicators
Percentage of pro‐poor expenditure 48.7% 53.0% 52.0%
Percentage of non wage executed budget• Education • Health • Rural development
85.0% 73.0% 69.0%
90.0% 90.0% 90.0%
91.0% 73.0% 72.0%
Number of contractual teachers 18,825 27,825 28,050
Percentage of health budget allocated to regions and districts 39.0% 60.0% 77.3%
Modern contraceptive rate 4.0% 13.0% 10.0%
Actual end values were for 2007, while indicators were set for end‐2008, when three operations were expected to be completed (only the first two in the series were carried out.
15
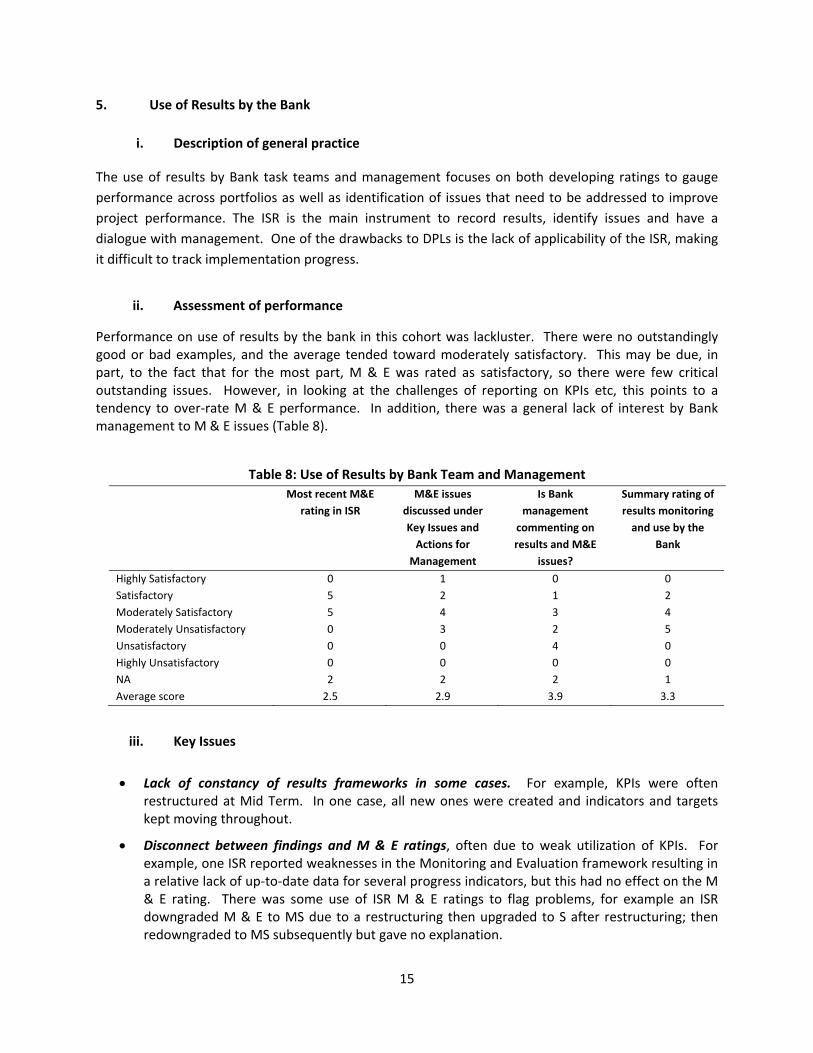
5. Use of Results by the Bank
i. Description of general practice
The use of results by Bank task teams and management focuses on both developing ratings to gauge
performance across portfolios as well as identification of issues that need to be addressed to improve
project performance. The ISR is the main instrument to record results, identify issues and have a
dialogue with management. One of the drawbacks to DPLs is the lack of applicability of the ISR, making
it difficult to track implementation progress.
ii. Assessment of performance
Performance on use of results by the bank in this cohort was lackluster. There were no outstandingly good or bad examples, and the average tended toward moderately satisfactory. This may be due, in part, to the fact that for the most part, M & E was rated as satisfactory, so there were few critical outstanding issues. However, in looking at the challenges of reporting on KPIs etc, this points to a tendency to over‐rate M & E performance. In addition, there was a general lack of interest by Bank management to M & E issues (Table 8).
iii. Key Issues
Lack of constancy of results frameworks in some cases. For example, KPIs were often restructured at Mid Term. In one case, all new ones were created and indicators and targets kept moving throughout.
Disconnect between findings and M & E ratings, often due to weak utilization of KPIs. For example, one ISR reported weaknesses in the Monitoring and Evaluation framework resulting in a relative lack of up‐to‐date data for several progress indicators, but this had no effect on the M & E rating. There was some use of ISR M & E ratings to flag problems, for example an ISR downgraded M & E to MS due to a restructuring then upgraded to S after restructuring; then redowngraded to MS subsequently but gave no explanation.
Table 8: Use of Results by Bank Team and Management
Most recent M&E
rating in ISR
M&E issues
discussed under
Key Issues and
Actions for
Management
Is Bank
management
commenting on
results and M&E
issues?
Summary rating of
results monitoring
and use by the
Bank
Highly Satisfactory 0 1 0 0
Satisfactory 5 2 1 2
Moderately Satisfactory 5 4 3 4
Moderately Unsatisfactory 0 3 2 5
Unsatisfactory 0 0 4 0
Highly Unsatisfactory 0 0 0 0
NA 2 2 2 1
Average score 2.5 2.9 3.9 3.3
16
General lack of information on issues regarding implementation of M & E framework. Implementation of capacity building plans in M & E were rarely mentioned and there was often little discussion about bottlenecks to contracting of key evaluations and studies, for examples with baseline data slipping into the implementation period.
iv. Identification of Good Practice
The only project designated as good practice for use of results was the West Bank Emergency Services Support Project III. Task teams displayed a remarkable le use of KPI information to justify PDO ratings compared to other projects. Despite some measurability issues, the Task Team clearly used results to monitor progress towards project goals even within a very challenging country context. This could be due in part to the fact that the first phase of this project began in 2002, so there has been sufficient time and resources to develop a solid results framework and implementation approaches, as well as to have a good idea of what data is reasonable to collect and report. In addition, the Bank task team is based in the field, with backup at Headquarters. In addition, the ICR from the first phase highlighted that it had been anticipated that performance indicators would be monitored during implementation, but this did not happen. This was addressed in subsequent phases.
6. Main Messages/Conclusions
Social service delivery projects pose a particular challenge to design and use of results. They are typically multi‐sectoral and work through different levels of government. Their scope is often national and they typically have institutional development objectives and often use policy‐based lending instruments. Despite these challenges, performance on developing appropriate PDOs and KPIs, designing and implementing M & E systems and using results was generally satisfactory.
Recommendations for ways to improve results readiness and performance entail:
PDOs:
Better specification of PDOs in terms of target populations or achievable changes in service delivery within the project timeframe.
KPIs:
Development of improved institutional development indicators that measure intended outcomes, i.e., changes in capacity/behavior of institutions, and not just institutional outputs. To back this up, different evaluation instruments may be needed, like expenditure tracking surveys and citizen report cards, since household level impact evaluations or MIS systems are limited in their ability to measure institutional changes. However, it should be recognized that institutional development outcomes as opposed to outputs are more expensive to collect and may require a longer period of time to be observed.
More rigorous and selective identification of KPIs would strengthen results frameworks. The high level of ‘indicator’ churn makes tracking of actual progress difficult.
Teams should seek the right mix of indicators. While this message applies to any type of project, in the specific case of service delivery projects it is important to capture measures
17
across the full results chain, from outputs to intermediate outcomes to final outcomes. These final outcomes, particularly those related to human development indictors, are expensive to collect and are collected infrequently and so would reasonably be expected only once or twice during the timeframe of a project while outputs and service delivery indicators will be collected more frequently. In addition, there are three main levels of focus, on households, on facilities or services themselves and on institutions, all of which should be captured in KPIs.
M & E Frameworks:
Alignment or integration of M & E should be accompanied by solid institutional assessment and capacity building. Social service delivery projects should identify capacity building needs not only within the sectors addressed but also at the national level (like the national statistics offices) to ensure that the data collection plans can be implemented.
Beneficiary assessments and facility surveys should be used more frequently to capture program performance. The tendency to rely on national household surveys and more aggregate indicators of sectoral outcomes makes attribution difficult and these types of measures are usually captured relatively infrequently. Social service delivery projects should adopt a broader range of M & E instruments, particularly those that provide insights into the ‘missing middle’ of service delivery. Technical audits, facility surveys, community score cards, beneficiary assessments can all provide rapid insights into quality of service delivery and the overall performance of institutions at the national and local levels.
Use of results:
Greater attention to M & E issues by Bank Managers of these projects is needed. Ratings were low in this regard.

18
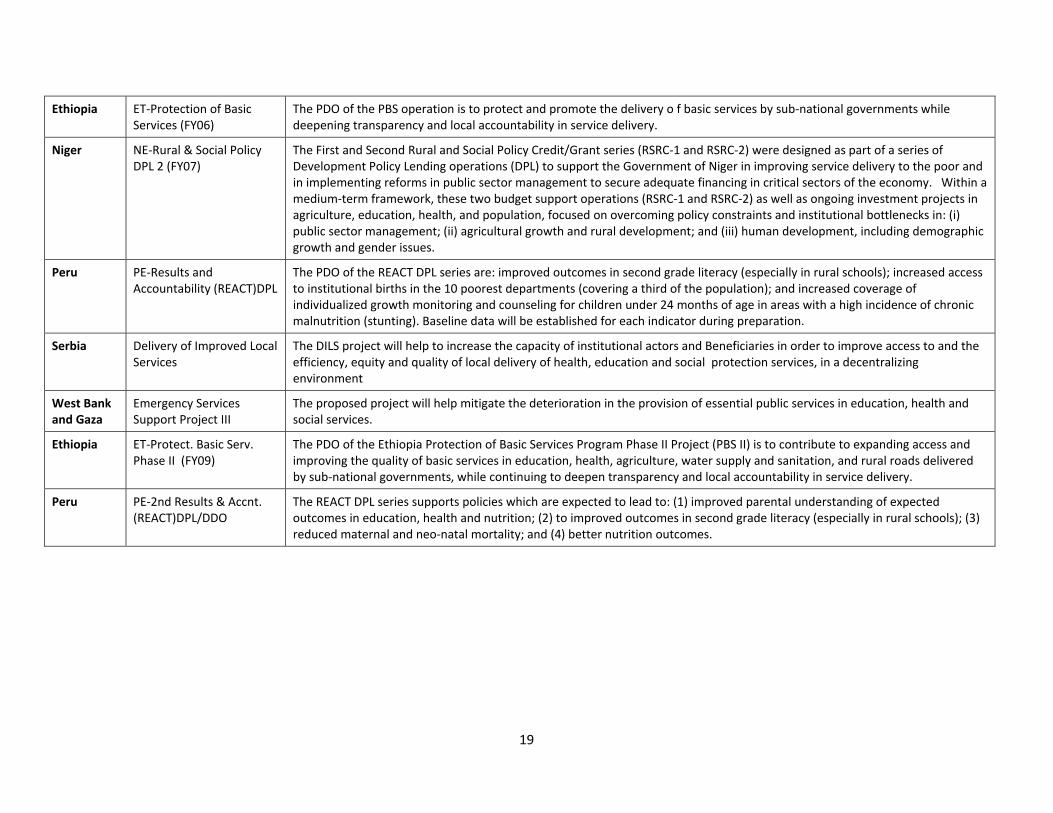
Appendix 1: PDOs of Social Service Delivery Projects
Madagascar MG‐PRSC 1 DPL The PRSC series support the implementation of two of the three pillars of the PRSP to improve governance and provide human and material security. It also supports a crosscutting monitoring and evaluation pillar.
Peru PE‐Programmatic Social Reform Loan IV
The main goals of the program are to: (i) improve the antipoverty focus of public expenditures; (ii) increase access of the poor to quality health and education services; and (iii) enhance the transparency of social programs, while empowering their beneficiaries in their design and implementation.
Peru PE‐(CRL1)ACCOUNT. F/ DECENT. SOC.SCTR
The objective of the Project is to strengthen results‐oriented and participatory planning, monitoring and evaluation in the social sectors, with an emphasis on decentralized social programs of the Ministry of Women and Social Development (MIMDES). Specific objectives for the project are to: (i) improve the quality of social policies and programs in the context of decentralization; (ii) implement the performance agreements and accreditation systems for social programs to improve service delivery outcomes (this would involve mainly the two decentralized social protection programs under MIMDES: food aid and targeted small scale infrastructure); and (iii) improve the M&E system in a decentralized context. VERSION IN ISR: The objective of the Project is to support the Government in developing institutional capacities for strengthening results‐oriented and participatory planning, monitoring and evaluation with emphasis on decentralized social programs. Specifically, the Project aims to support improvement in: (i) the quality of social policies and programs, and (ii) monitoring and evaluation systems in the social sectors
Maldives Integrated Human Development Project
The PDOs are to: (i) improve social outcomes and promote economic growth by strengthening the delivery of social services (education, health and nutrition services) available to the population; (ii) reduce poverty and promote regional equity by strengthening social service delivery and increasing economic opportunities in atolls remote from the prosperous Male region; and (iii) promote ecologically sustainable development by concentrating services and populations on ecologically viable islands within these atolls. CHANGED BY ISR 6: The project objectives have been restructured to focus on the measurable outcomes which can be monitored. This is in line with the IDA‐14 requirements. The original objectives are promoted by the project but may not be achieved in a measurable manner during the project life time which lasts till 2010. The change of objectives has been approved by the Board on a no‐objection basis. REVISED PDOs: The objectives of the Project are to assist the Borrower in improving the delivery of social services on Focus Islands
Niger NE‐Rural & Social Policy Reform I (FY06)
The First and Second Rural and Social Policy Credit/Grant series (RSRC‐1 and RSRC‐2) were designed as part of a series of Development Policy Lending operations (DPLs) to support the Government of Niger in improving service delivery to the poor and in implementing reforms in public sector management to secure adequate financing in critical sectors of the economy. Within a medium‐term framework, these two budget support operations (RSRC‐1 and RSRC‐2) as well as ongoing investment projects in agriculture, education, health, and population, focused on overcoming policy constraints and institutional bottlenecks in: (i) public sector management; (ii) agricultural growth and rural development; and (iii) human development, including demographic growth and gender issues.
19
Ethiopia ET‐Protection of Basic Services (FY06)
The PDO of the PBS operation is to protect and promote the delivery o f basic services by sub‐national governments while deepening transparency and local accountability in service delivery.
Niger NE‐Rural & Social Policy DPL 2 (FY07)
The First and Second Rural and Social Policy Credit/Grant series (RSRC‐1 and RSRC‐2) were designed as part of a series of Development Policy Lending operations (DPL) to support the Government of Niger in improving service delivery to the poor and in implementing reforms in public sector management to secure adequate financing in critical sectors of the economy. Within a medium‐term framework, these two budget support operations (RSRC‐1 and RSRC‐2) as well as ongoing investment projects in agriculture, education, health, and population, focused on overcoming policy constraints and institutional bottlenecks in: (i) public sector management; (ii) agricultural growth and rural development; and (iii) human development, including demographic growth and gender issues.
Peru PE‐Results and Accountability (REACT)DPL
The PDO of the REACT DPL series are: improved outcomes in second grade literacy (especially in rural schools); increased access to institutional births in the 10 poorest departments (covering a third of the population); and increased coverage of individualized growth monitoring and counseling for children under 24 months of age in areas with a high incidence of chronic malnutrition (stunting). Baseline data will be established for each indicator during preparation.
Serbia Delivery of Improved Local Services
The DILS project will help to increase the capacity of institutional actors and Beneficiaries in order to improve access to and the efficiency, equity and quality of local delivery of health, education and social protection services, in a decentralizing environment
West Bank and Gaza
Emergency Services Support Project III
The proposed project will help mitigate the deterioration in the provision of essential public services in education, health and social services.
Ethiopia ET‐Protect. Basic Serv. Phase II (FY09)
The PDO of the Ethiopia Protection of Basic Services Program Phase II Project (PBS II) is to contribute to expanding access and improving the quality of basic services in education, health, agriculture, water supply and sanitation, and rural roads delivered by sub‐national governments, while continuing to deepen transparency and local accountability in service delivery.
Peru PE‐2nd Results & Accnt. (REACT)DPL/DDO
The REACT DPL series supports policies which are expected to lead to: (1) improved parental understanding of expected outcomes in education, health and nutrition; (2) to improved outcomes in second grade literacy (especially in rural schools); (3) reduced maternal and neo‐natal mortality; and (4) better nutrition outcomes.
20
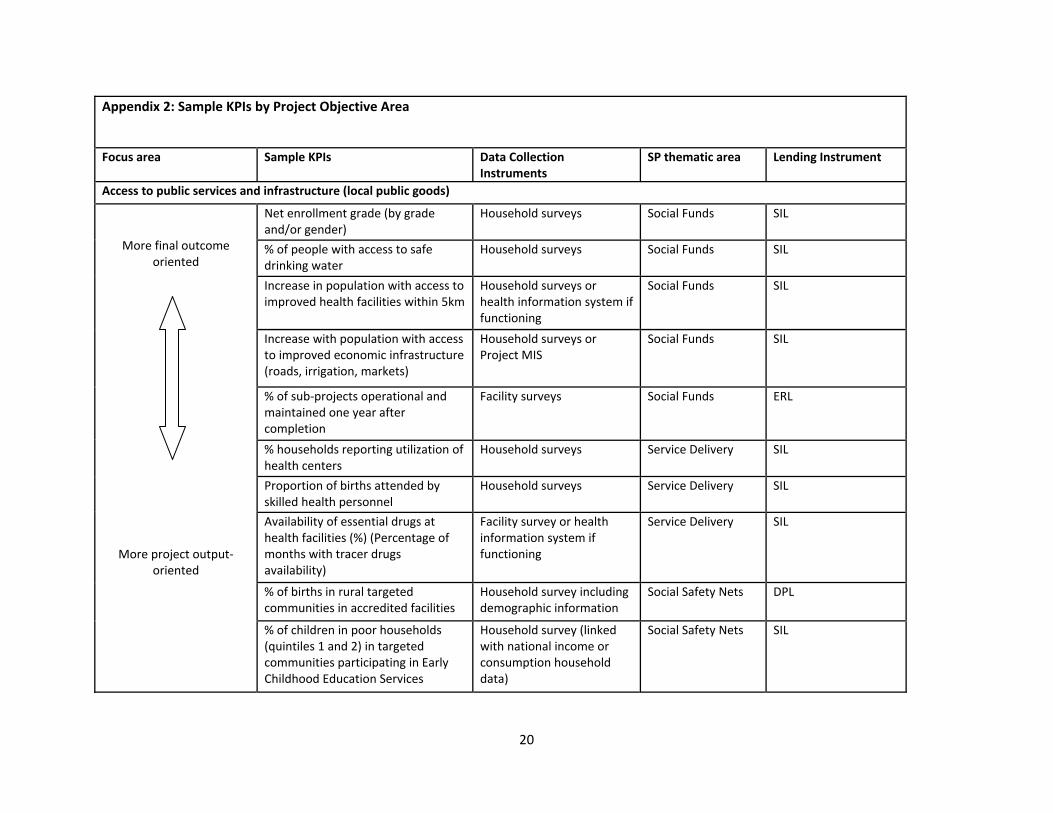
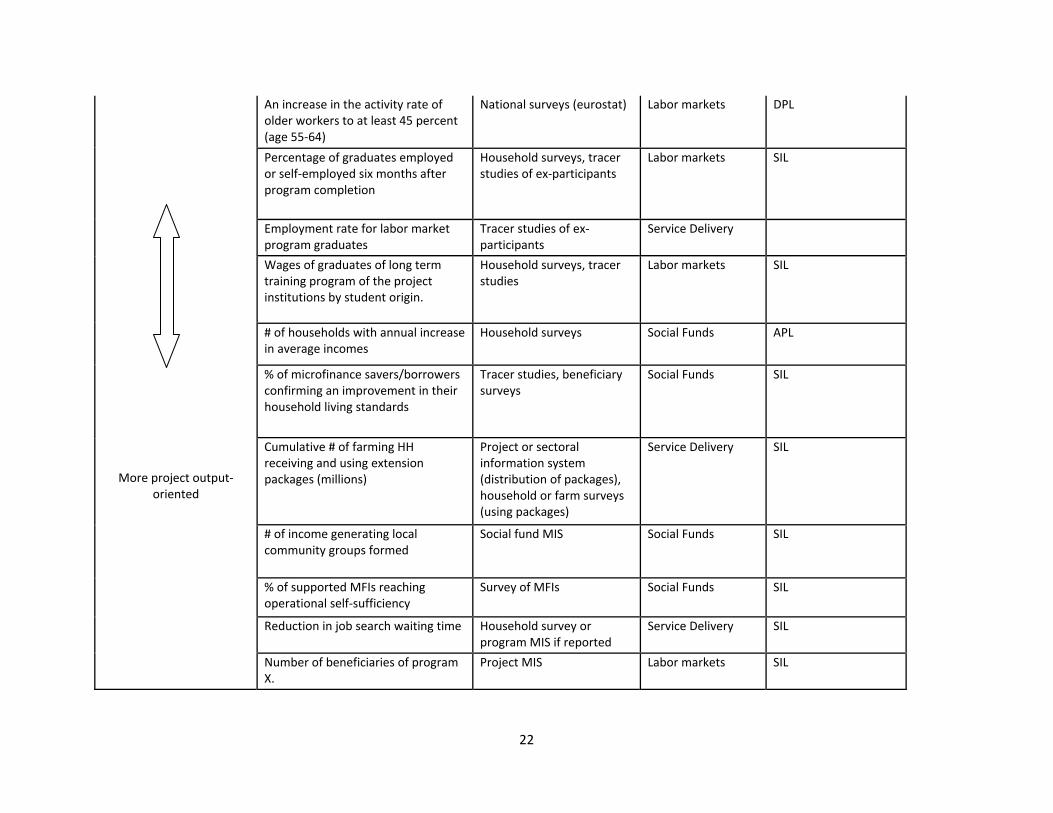
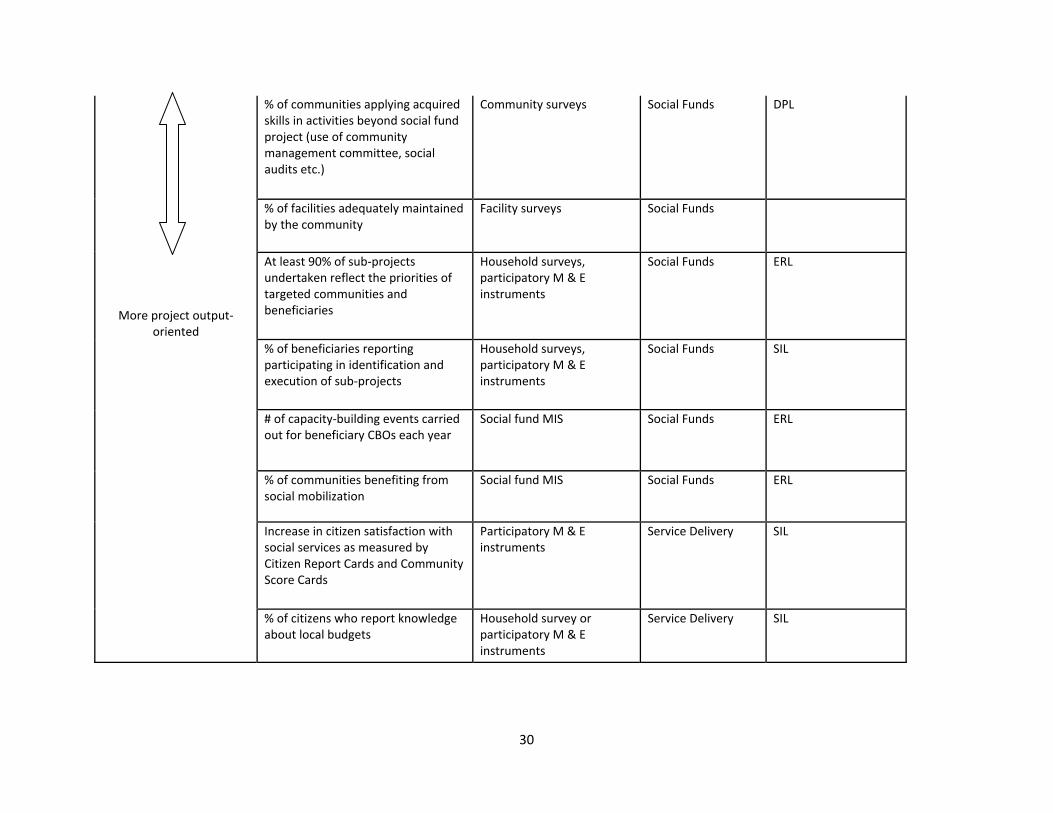
Appendix 2: Sample KPIs by Project Objective Area
Focus area Sample KPIs Data Collection Instruments
SP thematic area Lending Instrument
Access to public services and infrastructure (local public goods)
More final outcome oriented
More project output‐oriented
Net enrollment grade (by grade and/or gender)
Household surveys Social Funds SIL
% of people with access to safe drinking water
Household surveys Social Funds SIL
Increase in population with access to improved health facilities within 5km
Household surveys or health information system if functioning
Social Funds SIL
Increase with population with access to improved economic infrastructure (roads, irrigation, markets)
Household surveys or Project MIS
Social Funds SIL
% of sub‐projects operational and maintained one year after completion
Facility surveys Social Funds ERL
% households reporting utilization of health centers
Household surveys Service Delivery SIL
Proportion of births attended by skilled health personnel
Household surveys Service Delivery SIL
Availability of essential drugs at health facilities (%) (Percentage of months with tracer drugs availability)
Facility survey or health information system if functioning
Service Delivery SIL
% of births in rural targeted communities in accredited facilities
Household survey including demographic information
Social Safety Nets DPL
% of children in poor households (quintiles 1 and 2) in targeted communities participating in Early Childhood Education Services
Household survey (linked with national income or consumption household data)
Social Safety Nets SIL

21
% of public works assessed to be satisfactory (using PW Review performance criteria ‐ eligibility, appropriateness, effectiveness, quality and sustainability)
Technical audits Social Safety Nets ERL
Number of communities benefiting from at least one sub‐project
Social Fund MIS Social Funds ERL
% of targeted Roma settlements water points constructed or rehabilitated
Administrative data Social Safety Nets SIL
# of classrooms/health centers constructed
Social Fund MIS Social Funds ERL
% of classrooms replaced in 40 schools damaged by the Tsunami
Administrative data Social Safety Nets ERL
% of kilometers of rural roads rehabilitated
Administrative data Social Safety Nets ERL
# of bednets, contraceptives etc. distributed
Administrative data from sector
Service Delivery SIL
# of service workers deployed (teachers, health workers, etc.)
Administrative data from sector
Service Delivery SIL
Access to economic opportunities
More final outcome oriented
Number of participants exiting the program into formal employment (Annual).
Household surveys Labor markets SIL
An increase in the employment rate of younger workers to at least 23 percent (age 15‐24)
National surveys (eurostat) Labor markets DPL
% increase of the rate of employment of youth benefiting from multifunctional centers services
Household survey or national labor force survey with beneficiary oversampling
Social Safety Nets SIL
22
More project output‐oriented
An increase in the activity rate of older workers to at least 45 percent (age 55‐64)
National surveys (eurostat) Labor markets DPL
Percentage of graduates employed or self‐employed six months after program completion
Household surveys, tracer studies of ex‐participants
Labor markets SIL
Employment rate for labor market program graduates
Tracer studies of ex‐participants
Service Delivery
Wages of graduates of long term training program of the project institutions by student origin.
Household surveys, tracer studies
Labor markets SIL
# of households with annual increase in average incomes
Household surveys Social Funds APL
% of microfinance savers/borrowers confirming an improvement in their household living standards
Tracer studies, beneficiary surveys
Social Funds SIL
Cumulative # of farming HH receiving and using extension packages (millions)
Project or sectoral information system (distribution of packages), household or farm surveys (using packages)
Service Delivery SIL
# of income generating local community groups formed
Social fund MIS Social Funds SIL
% of supported MFIs reaching operational self‐sufficiency
Survey of MFIs Social Funds SIL
Reduction in job search waiting time Household survey or program MIS if reported
Service Delivery SIL
Number of beneficiaries of program X.
Project MIS Labor markets SIL

23
Number of Employment Offices providing Program X Services
Administrative information systems
Labor markets SIL
Number of firms registered in program X
Project MIS Labor markets SIL
# of clients of supported MFIs Social Fund MIS Social Funds SIL
# of beneficiaries trained in income generating activities
Social Fund MIS Social Funds SIL
Cumulative # of people trained (farmers, micro‐entrepreneurs etc.)
Project or sectoralinformation systems
Service Delivery SIL
Temporary income support (unconditional transfers, public works CCTs, etc.)
More final outcome oriented
Increased income from wages (income transfers) from PWP works
Household surveys Social Funds SIL
% of beneficiaries of grants for productive projects engaged in activities generating income at least equal to AR$150/mo after 18 months of operation
Household survey Social Safety Nets
% of beneficiary households that receive PSNP resources reporting no distress sales of assets to meet food needs
Beneficiary survey Social Safety Nets SIL
Net improvement in household total, food (including fruits and vegetables) and protein consumption in large municipalities.
Household surveys including consumption module for treatment and comparison groups
Social Safety Nets SIL
Average number of months that PSNP households report being food insecure
Beneficiary survey Social Safety Nets SIL
% of labor intensity of public works sub‐projects
Social fund MIS Social Funds

24
More project output‐oriented
Proportion of bi‐monthly payments based on a complete cycle of co‐responsibilities verification and application of sanctions
Administrative data Social Safety Nets SIL
Person‐days provided in labor intensive public works program (number)
Social fund MIS Social Funds SIL
Percentage of farmers who have been affected by the Tsunami receiving compensation grants.
Administrative data Social Safety Nets ERL
# of communities benefitting from public works sub‐projects
Social fund MIS Social Funds
% of transfer payments delivered to beneficiaries by the 13th of the payment month
Administrative data Social Safety Nets SIL
Human development outcomes
More final outcome oriented
Increased primary school enrollment and completion rates in SF‐supported communities
Household surveys Social Funds SIL
Net change in chronic malnutrition amongst children under 5 in large municipalities.
Household survey with anthropometric module applied to treatment and comparison groups; possibly, Health MIS if available and feasible to distinguish treatment and comparison groups
Social Safety Nets SIL

25
More project output‐oriented
Net change in secondary school completion rate of PATH students‐boys and girls
Household survey applied to treatment and comparison groups; possibly, Education MIS if available and feasible to distinguish treatment and comparison groups
Social Safety Nets SIL
Increase DPT, Triple Viral, and polio vaccination of the population age 0‐5 resulting in 3.6 million new children vaccinated.
Sectoral information systems, Health surveillance system
Labor markets SAL
Increase in primary completion rate Household surveys or sectoral information systems
Service Delivery PRSC
Increase basic and secondary school enrollment rates by creating 1.4 million new spaces, in addition to the existing 7.8 million spaces.
Household surveys , Sectoral information systems
Labor markets SAL
Annual dropout rate (%) of students in primary and secondary schools
Facility or household surveys
Social Funds SIL
Reduction in child underweight rate Household survey (with anthropometric module) or health information system
Service Delivery PRSC
% of under‐fives malnutrition using weight for age method
Household surveys Social Funds SIL
Incidence of diarrhea in communities implementing water and sanitation subprojects
Household surveys Social Funds SIL
% of children vaccinated Household surveys and health information system
Social Funds SIL
% of women receiving prenatal care in project communities
Household and facility surveys
Social Funds SIL
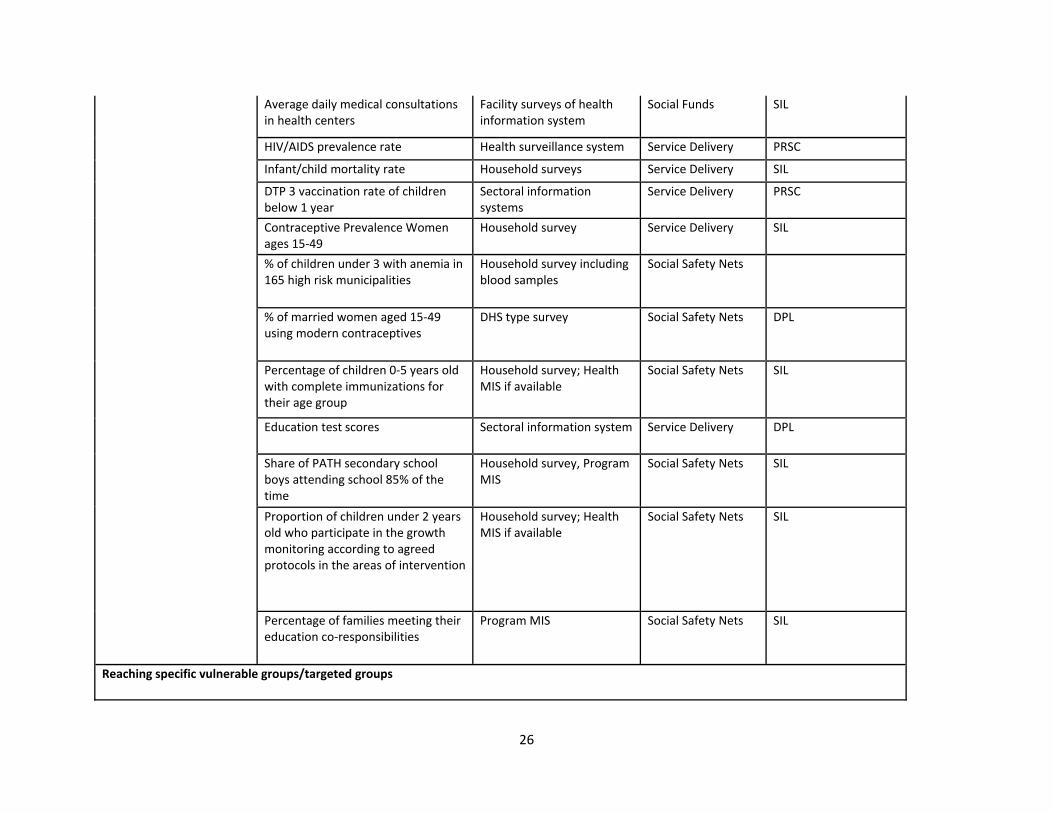
26
Average daily medical consultations in health centers
Facility surveys of health information system
Social Funds SIL
HIV/AIDS prevalence rate Health surveillance system Service Delivery PRSC
Infant/child mortality rate Household surveys Service Delivery SIL
DTP 3 vaccination rate of children below 1 year
Sectoral information systems
Service Delivery PRSC
Contraceptive Prevalence Women ages 15‐49
Household survey Service Delivery SIL
% of children under 3 with anemia in 165 high risk municipalities
Household survey including blood samples
Social Safety Nets
% of married women aged 15‐49 using modern contraceptives
DHS type survey Social Safety Nets DPL
Percentage of children 0‐5 years old with complete immunizations for their age group
Household survey; Health MIS if available
Social Safety Nets SIL
Education test scores Sectoral information system Service Delivery DPL
Share of PATH secondary school boys attending school 85% of the time
Household survey, Program MIS
Social Safety Nets SIL
Proportion of children under 2 years old who participate in the growth monitoring according to agreed protocols in the areas of intervention
Household survey; Health MIS if available
Social Safety Nets SIL
Percentage of families meeting their education co‐responsibilities
Program MIS Social Safety Nets SIL
Reaching specific vulnerable groups/targeted groups

27
More final outcome oriented
More project output‐oriented
Number of workers that receive severance pay (job loss compensation)
Specific assessment and surveys
Labor markets SAL
Increase the number of poor children age 0‐5 affiliated with the nutrition program
Project MIS/Beneficiary registry
Labor markets SIL
Percentage of program beneficiaries women
Project MIS Labor markets SIL
Number of workers receiving labor redeployment services.
Project MIS Labor markets SAL
Percentage of beneficiaries that come from priority areas as identified in the poverty map.
Administrative information system
Labor markets SIL
% of project resources (or beneficiaries) from the lowest 20% of poverty deciles
Household surveys (linked with national household surveys for national poverty rankings)
Social Funds SIL
Increased number of poor people with access to social services.
Household surveys Social Funds ERL
Number of kindergarten children with disability benefiting from the kindergarten centers
Facility survey Social Funds SIL
Community Management Committees have at least 50% of elected women
Social Fund MIS Social Funds SIL
% of project resources disbursed to the poorest districts/municipalities
Social Fund MIS Social Funds SIL
Number of communities mapped and profiled (with participatory poverty assessments)
Social Fund MIS Social Funds SIL
% of citizens with access to services by poverty quintile
Household survey Service Delivery

28
Increased access to services (e.g. institutional births, school enrollment etc.) in poorest geographical areas
Sectoral data crossed with poverty mapping information
Service Delivery DPL
% of vulnerable groups (e.g orphans, elderly) using health and education services
Household survey Service Delivery
% of program expenditures (or % of beneficiaries) on poorest household quintile
Household survey Service Delivery TA
At least X percent of grants provided for inclusion activities to marginalized groups in project municipalities are disbursed
Project MIS Service Delivery SIL
% of programs utilizing proxy means test and other targeting criteria
Administrative data Service Delivery TA
Percentage of disbursed cash transfers received by households in quintiles 1 and 2
Household surveys (linked with national income or consumption household data) including social programs module
Social Safety Nets SIL
Share of program participants in lower half of income distribution
Household surveys (linked with national income or consumption household data) including social programs module
Social Safety Nets SIL
% of children in Q1 registered for PATH
Household surveys (linked with national income or consumption household data) including social programs module
Social Safety Nets SIL

29
% reduction in the gap between targeted poor Roma settlements and neighboring communities as measured by the living conditions index
Depending on exact definition of living conditions index may need census data, community surveys or household survey representative at the community level
Social Safety Nets SIL
% of revised SISBEN 1 families in newly entered municipalities registered in the program
Administrative data Social Safety Nets SIL
% of ECE interventions in communities with more than 50% Roma population
Census data to identify target communities and administrative data
Social Safety Nets SIL
% of districts with at least 85% of households with completed needs assessment
Administrative data Social Safety Nets SIL
% recertification of PATH families with children due to be recertified after 4 years enrollment
Administrative data Social Safety Nets SIL
Community empowerment and capacity building (non‐government)
More final outcome oriented
% of participating communities have improved their capacity to implement the CDD approach, and comply with at least 10 CDD capacity indicators
Social Fund MIS, Community surveys
Social Funds SIL
# of local executing agencies with improved capacity for planning and implementing community development projects
Community surveys Social Funds ERL
30
More project output‐oriented
% of communities applying acquired skills in activities beyond social fund project (use of community management committee, social audits etc.)
Community surveys Social Funds DPL
% of facilities adequately maintained by the community
Facility surveys Social Funds
At least 90% of sub‐projects undertaken reflect the priorities of targeted communities and beneficiaries
Household surveys, participatory M & E instruments
Social Funds ERL
% of beneficiaries reporting participating in identification and execution of sub‐projects
Household surveys, participatory M & E instruments
Social Funds SIL
# of capacity‐building events carried out for beneficiary CBOs each year
Social fund MIS Social Funds ERL
% of communities benefiting from social mobilization
Social fund MIS Social Funds ERL
Increase in citizen satisfaction with social services as measured by Citizen Report Cards and Community Score Cards
Participatory M & E instruments
Service Delivery SIL
% of citizens who report knowledge about local budgets
Household survey or participatory M & E instruments
Service Delivery SIL

31
Improved women's understanding of their right to an institutional birth and the standards for a good‐quality birth
Household survey or participatory M & E instruments
Service Delivery DPL
Increased connectivity to and usage of national information management networks, by local service providers
Administrative information, service provider surveys
Service Delivery SIL
# of local management committees established for social services
Project (or sectoral) information system
Service Delivery TA
Share of coverage in community services by NGOs and community groups
Sectoral information systems
Service Delivery
% of Roma population from targeted poor settlements agreeing that subprojects reflect community priorities
Household surveys, participatory M&E instruments
Social Safety Nets SIL
Proportion of OVC households aware of program information, such as objectives, eligibility criteria and use of funds
Beneficiary surveys, participatory M&E instruments
Social Safety Nets SIL
% of kebeles that have developed and approved safety net plans, taking into‐account community preferences
Administrative data, performance audits
Social Safety Nets APL

32
% of public sector organizations that hold partner forums on a regular basis to report on planning decision and progress.
Administrative data Social Safety Nets SIL
Local government institutional capacity building
More final outcome oriented
Household perceptions of local government transparency, capacity and responsiveness
Household surveys, participatory M & E instruments
Social Funds SIL
% of local governments able to set objectives and achieve at least X% of their annual targets
Local government surveys Social Funds APL
% of local government annual investments consistent with Community Development Plans
Local government surveys Social Funds SIL
Beneficiary satisfaction with training received at the local government level
Community and local government surveys, participatory M & E instruments
Social Funds SIL
Legal and administrative texts have been adopted allowing local governments to pass through funds to community groups
Administrative information Social Funds SIL
% of social fund projects executed by local governments
Social fund MIS Social Funds SIL
# of local government officials trained
Social fund MIS Social Funds SIL

33
More project output‐oriented
Citizens reports of quality of basic services delivered by local government
Participatory M & E instruments or household surveys
Service Delivery
Subnational governments expenditures on basic services
Sectoral budget information Service Delivery SIL
Allocation of financing from State government to local self governments for health and education services
National and sectoral budget information
Service Delivery SIL
Share of local government budgets spent of social services
Local government budget information (systematized or via sample surveys where systems lacking)
Service Delivery DPL
Number of local service providers (PHCs, schools, CSWs and NGOs) accredited by the relevant institution in their sector
Sectoral information systems
Service Delivery SIL
# of local government units trained in sectoral service programs
Administrative information systems
Service Delivery TA
National/sectoral government institutional capacity building
More final outcome
oriented
Number of job seekers, as reported by the LFS, served by the National Employment Service
Administrative information system
Labor markets SIL
Formulation of a viable Pension System Development Strategy and progress in its implementation
Administrative data Labor markets SIL

34
More project output‐oriented
Labor market information (LMI) system in place and two reports on labor market situation and trends published
Sectoral information systems
Labor markets SIL
Number of new small business incubators established.
Project MIS Labor markets SIL
Number of new module training programs developed and in use and number of new module training centers fully functional
Project MIS Labor markets SIL
Operations guidelines and manuals for a new menu of ALMPs prepared and in use
Administrative information system
Labor markets SIL
Central and regional Career Counseling Centers operational
Administrative information system
Labor markets SIL
Citizen knowledgeable about basic services (availability, eligibility, transparency)
Participatory M & E instruments
Service Delivery
% of social program budget distributed based on new program‐based model of allocation
Sectoral budget information system
Service Delivery TA
Number of external evaluations of social program performance conducted
Administrative data Service Delivery TA
Monitoring and evaluation system for prioritized national strategic social programs operating as evidenced by timely monthly MIS reports
Administrative data Service Delivery TA
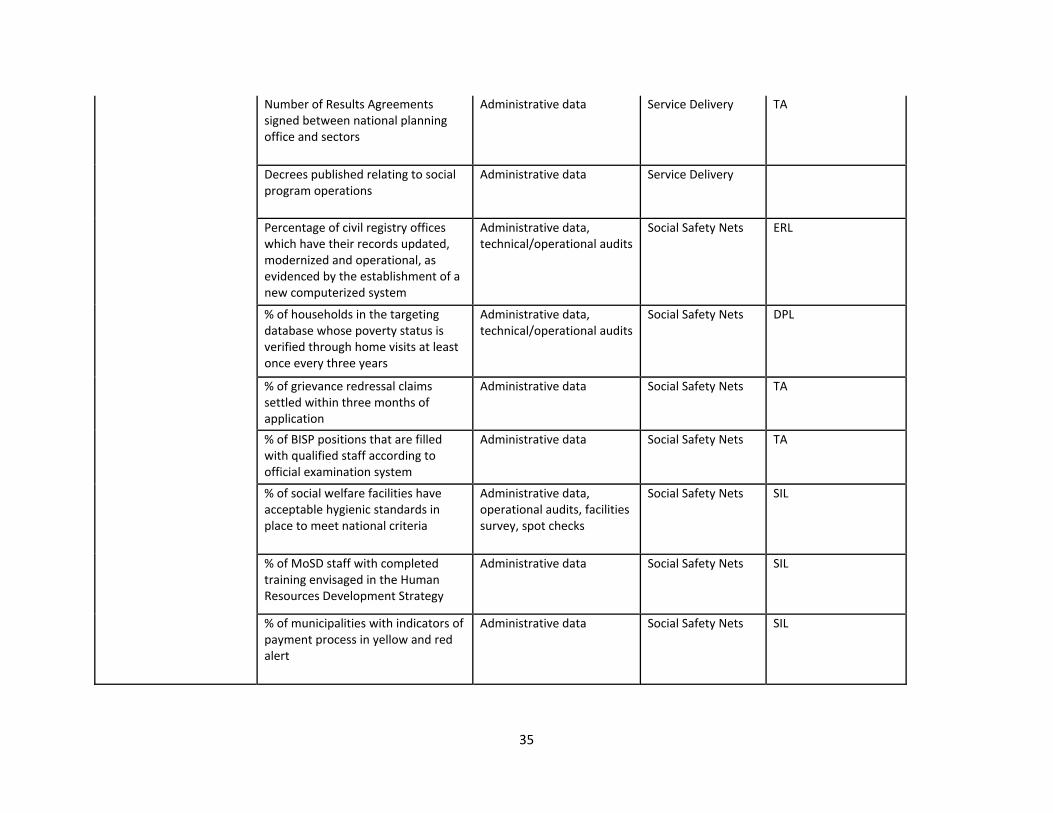
35
Number of Results Agreements signed between national planning office and sectors
Administrative data Service Delivery TA
Decrees published relating to social program operations
Administrative data Service Delivery
Percentage of civil registry offices which have their records updated, modernized and operational, as evidenced by the establishment of a new computerized system
Administrative data, technical/operational audits
Social Safety Nets ERL
% of households in the targeting database whose poverty status is verified through home visits at least once every three years
Administrative data, technical/operational audits
Social Safety Nets DPL
% of grievance redressal claims settled within three months of application
Administrative data Social Safety Nets TA
% of BISP positions that are filled with qualified staff according to official examination system
Administrative data Social Safety Nets TA
% of social welfare facilities have acceptable hygienic standards in place to meet national criteria
Administrative data, operational audits, facilities survey, spot checks
Social Safety Nets SIL
% of MoSD staff with completed training envisaged in the Human Resources Development Strategy
Administrative data Social Safety Nets SIL
% of municipalities with indicators of payment process in yellow and red alert
Administrative data Social Safety Nets SIL
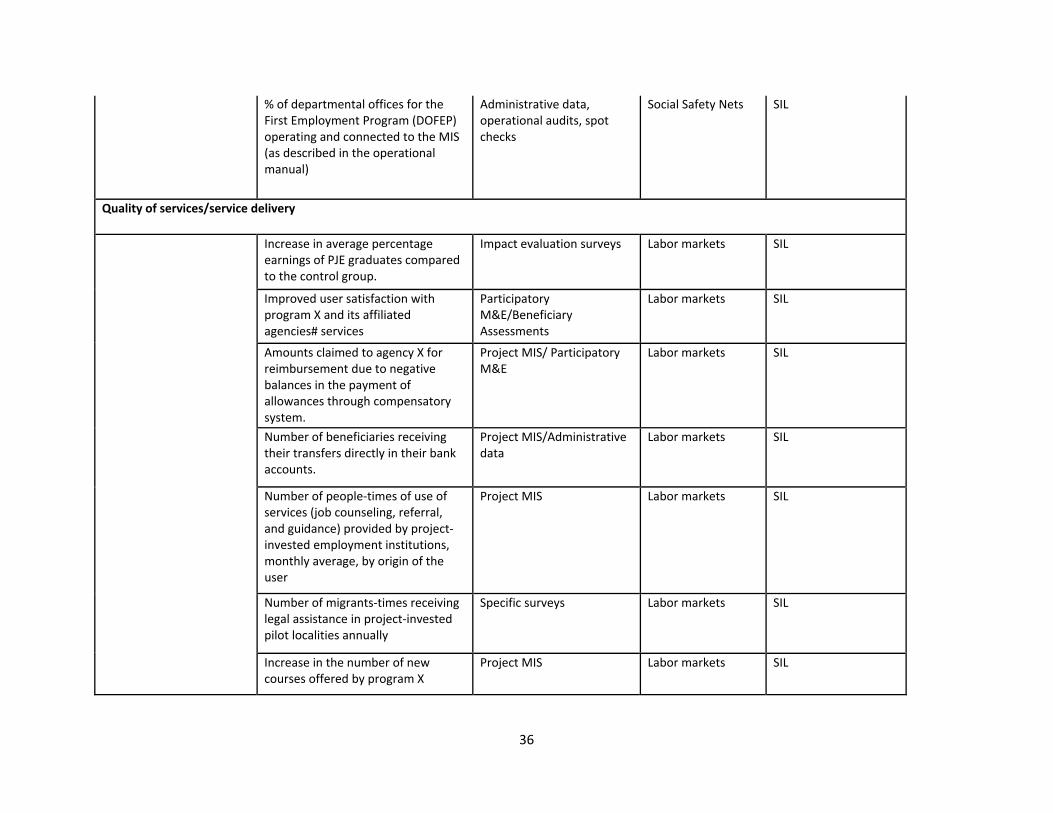
36
% of departmental offices for the First Employment Program (DOFEP) operating and connected to the MIS (as described in the operational manual)
Administrative data, operational audits, spot checks
Social Safety Nets SIL
Quality of services/service delivery
Increase in average percentage earnings of PJE graduates compared to the control group.
Impact evaluation surveys Labor markets SIL
Improved user satisfaction with program X and its affiliated agencies# services
Participatory M&E/Beneficiary Assessments
Labor markets SIL
Amounts claimed to agency X for reimbursement due to negative balances in the payment of allowances through compensatory system.
Project MIS/ Participatory M&E
Labor markets SIL
Number of beneficiaries receiving their transfers directly in their bank accounts.
Project MIS/Administrative data
Labor markets SIL
Number of people‐times of use of services (job counseling, referral, and guidance) provided by project‐invested employment institutions, monthly average, by origin of the user
Project MIS Labor markets SIL
Number of migrants‐times receiving legal assistance in project‐invested pilot localities annually
Specific surveys Labor markets SIL
Increase in the number of new courses offered by program X
Project MIS Labor markets SIL
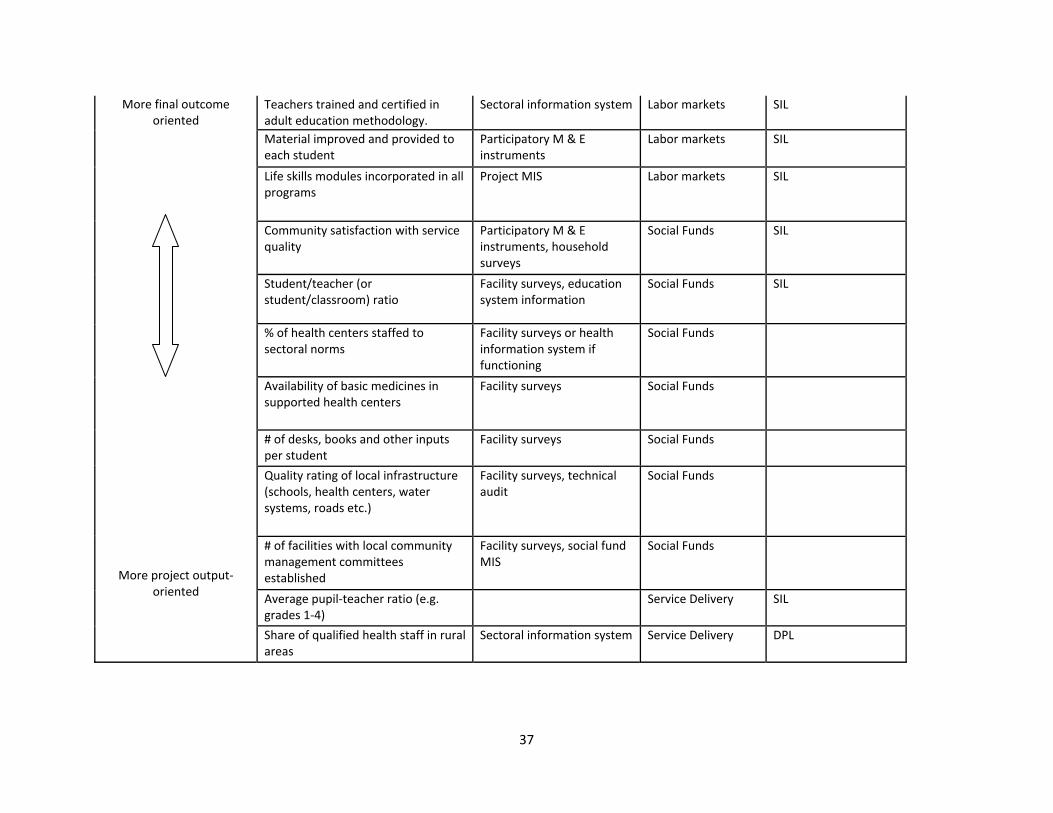
37
More final outcome oriented
More project output‐oriented
Teachers trained and certified in adult education methodology.
Sectoral information system Labor markets SIL
Material improved and provided to each student
Participatory M & E instruments
Labor markets SIL
Life skills modules incorporated in all programs
Project MIS Labor markets SIL
Community satisfaction with service quality
Participatory M & E instruments, household surveys
Social Funds SIL
Student/teacher (or student/classroom) ratio
Facility surveys, education system information
Social Funds SIL
% of health centers staffed to sectoral norms
Facility surveys or health information system if functioning
Social Funds
Availability of basic medicines in supported health centers
Facility surveys Social Funds
# of desks, books and other inputs per student
Facility surveys Social Funds
Quality rating of local infrastructure (schools, health centers, water systems, roads etc.)
Facility surveys, technical audit
Social Funds
# of facilities with local community management committees established
Facility surveys, social fund MIS
Social Funds
Average pupil‐teacher ratio (e.g. grades 1‐4)
Service Delivery SIL
Share of qualified health staff in rural areas
Sectoral information system Service Delivery DPL
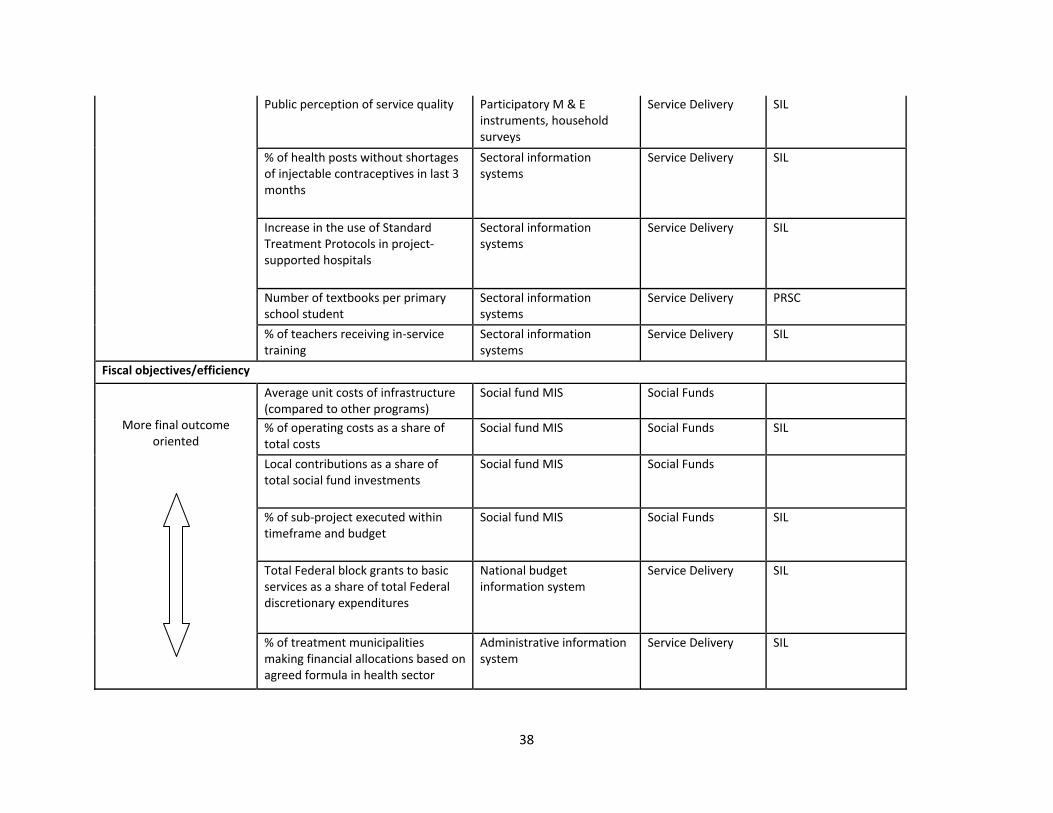
38
Public perception of service quality Participatory M & E instruments, household surveys
Service Delivery SIL
% of health posts without shortages of injectable contraceptives in last 3 months
Sectoral information systems
Service Delivery SIL
Increase in the use of Standard Treatment Protocols in project‐supported hospitals
Sectoral information systems
Service Delivery SIL
Number of textbooks per primary school student
Sectoral information systems
Service Delivery PRSC
% of teachers receiving in‐service training
Sectoral information systems
Service Delivery SIL
Fiscal objectives/efficiency
More final outcome oriented
Average unit costs of infrastructure (compared to other programs)
Social fund MIS Social Funds
% of operating costs as a share of total costs
Social fund MIS Social Funds SIL
Local contributions as a share of total social fund investments
Social fund MIS Social Funds
% of sub‐project executed within timeframe and budget
Social fund MIS Social Funds SIL
Total Federal block grants to basic services as a share of total Federal discretionary expenditures
National budget information system
Service Delivery SIL
% of treatment municipalities making financial allocations based on agreed formula in health sector
Administrative information system
Service Delivery SIL

39
More project output‐oriented
% of non wage executed budget Sectoral budget information system
Service Delivery DPL
Annual budget of national strategic social programs
National budget information system
Service Delivery TA
% of priority social program expenditures on administrative overhead
Program or sectoral information systems
Service Delivery

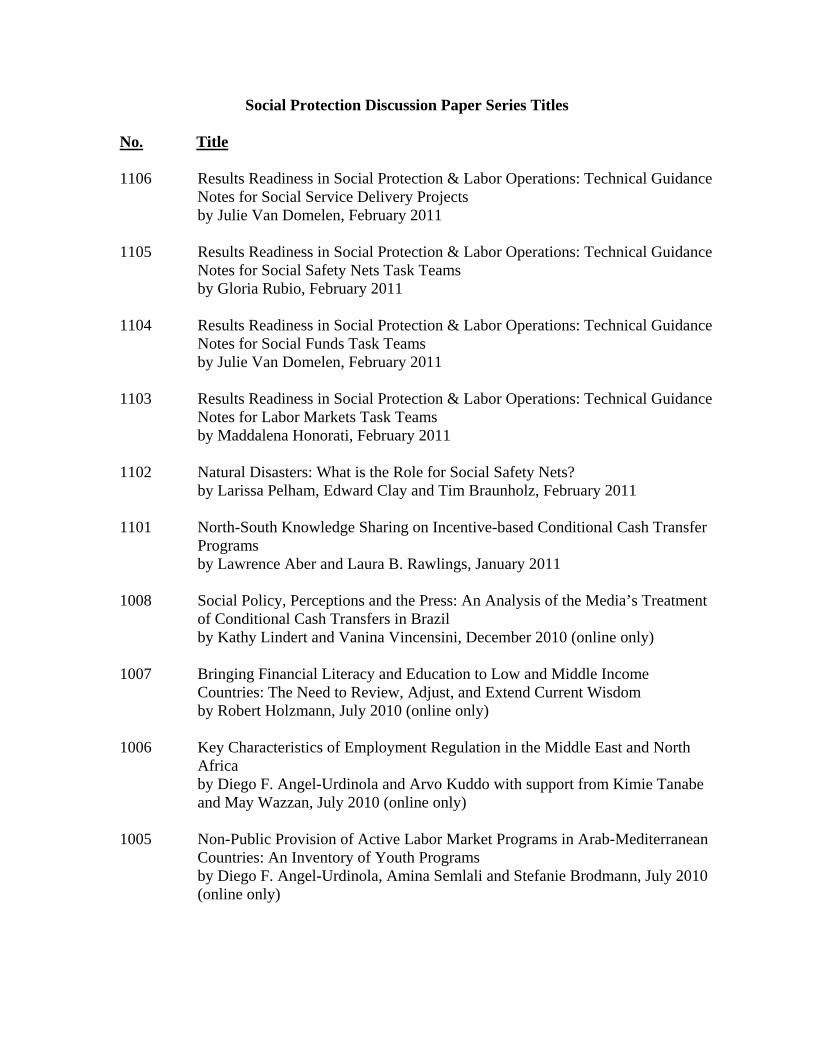
Social Protection Discussion Paper Series Titles No. Title 1106 Results Readiness in Social Protection & Labor Operations: Technical Guidance
Notes for Social Service Delivery Projects by Julie Van Domelen, February 2011 1105 Results Readiness in Social Protection & Labor Operations: Technical Guidance
Notes for Social Safety Nets Task Teams by Gloria Rubio, February 2011 1104 Results Readiness in Social Protection & Labor Operations: Technical Guidance
Notes for Social Funds Task Teams by Julie Van Domelen, February 2011 1103 Results Readiness in Social Protection & Labor Operations: Technical Guidance
Notes for Labor Markets Task Teams by Maddalena Honorati, February 2011 1102 Natural Disasters: What is the Role for Social Safety Nets? by Larissa Pelham, Edward Clay and Tim Braunholz, February 2011 1101 North-South Knowledge Sharing on Incentive-based Conditional Cash Transfer
Programs by Lawrence Aber and Laura B. Rawlings, January 2011 1008 Social Policy, Perceptions and the Press: An Analysis of the Media’s Treatment
of Conditional Cash Transfers in Brazil by Kathy Lindert and Vanina Vincensini, December 2010 (online only) 1007 Bringing Financial Literacy and Education to Low and Middle Income
Countries: The Need to Review, Adjust, and Extend Current Wisdom by Robert Holzmann, July 2010 (online only) 1006 Key Characteristics of Employment Regulation in the Middle East and North
Africa by Diego F. Angel-Urdinola and Arvo Kuddo with support from Kimie Tanabe
and May Wazzan, July 2010 (online only) 1005 Non-Public Provision of Active Labor Market Programs in Arab-Mediterranean
Countries: An Inventory of Youth Programs by Diego F. Angel-Urdinola, Amina Semlali and Stefanie Brodmann, July 2010
(online only)

1004 The Investment in Job Training: Why Are SMEs Lagging So Much Behind? by Rita K. Almeida and Reyes Aterido, May 2010 (online only) 1003 Disability and International Cooperation and Development: A Review of Policies
and Practices by Janet Lord, Aleksandra Posarac, Marco Nicoli, Karen Peffley, Charlotte
McClain-Nhlapo and Mary Keogh, May 2010 1002 Toolkit on Tackling Error, Fraud and Corruption in Social Protection Programs by Christian van Stolk and Emil D. Tesliuc, March 2010 (online only) 1001 Labor Market Policy Research for Developing Countries: Recent Examples from
the Literature - What do We Know and What should We Know? by Maria Laura Sanchez Puerta, January 2010 (online only)
0931 The Korean Case Study: Past Experience and New Trends in Training Policies by Young-Sun Ra and Kyung Woo Shim, December 2009 (online only) 0930 Migration Pressures and Immigration Policies: New Evidence on the Selection of
Migrants by Johanna Avato, December 2009 (online only) 0929 Ex-Ante Methods to Assess the Impact of Social Insurance Policies on Labor
Supply with an Application to Brazil by David A. Robalino, Eduardo Zylberstajn, Helio Zylberstajn and
Luis Eduardo Afonso, December 2009 (online only) 0928 Rethinking Survivor Benefits by Estelle James, December 2009 (online only) 0927 How Much Do Latin American Pension Programs Promise to Pay Back? by Alvaro Forteza and Guzmán Ourens, December 2009 (online only) 0926 Work Histories and Pension Entitlements in Argentina, Chile and Uruguay by Alvaro Forteza, Ignacio Apella, Eduardo Fajnzylber, Carlos Grushka, Ianina
Rossi and Graciela Sanroman, December 2009 (online only) 0925 Indexing Pensions
by John Piggott and Renuka Sane, December 2009 (online only) 0924 Towards Comprehensive Training by Jean Fares and Olga Susana Puerto, November 2009 0923 Pre-Employment Skills Development Strategies in the OECD by Yoo Jeung Joy Nam, November 2009
0922 A Review of National Training Funds by Richard Johanson, November 2009 0921 Pre-Employment Vocational Education and Training in Korea by ChangKyun Chae and Jaeho Chung, November 2009 0920 Labor Laws in Eastern European and Central Asian Countries: Minimum Norms
and Practices by Arvo Kuddo, November 2009 (online only) 0919 Openness and Technological Innovation in East Asia: Have They Increased the
Demand for Skills? by Rita K. Almeida, October 2009 (online only) 0918 Employment Services and Active Labor Market Programs in Eastern European
and Central Asian Countries by Arvo Kuddo, October 2009 (online only) 0917 Productivity Increases in SMEs: With Special Emphasis on In-Service Training
of Workers in Korea by Kye Woo Lee, October 2009 (online only)
0916 Firing Cost and Firm Size: A Study of Sri Lanka's Severance Pay System
by Babatunde Abidoye, Peter F. Orazem and Milan Vodopivec, September 2009 (online only)
0915 Personal Opinions about the Social Security System and Informal Employment:
Evidence from Bulgaria by Valeria Perotti and Maria Laura Sánchez Puerta, September 2009
0914 Building a Targeting System for Bangladesh based on Proxy Means Testing by Iffath A. Sharif, August 2009 (online only) 0913 Savings for Unemployment in Good or Bad Times: Options for Developing
Countries by David Robalino, Milan Vodopivec and András Bodor, August 2009 (online
only) 0912 Social Protection for Migrants from the Pacific Islands in Australia and New
Zealand by Geoff Woolford, May 2009 (online only) 0911 Human Trafficking, Modern Day Slavery, and Economic Exploitation
by Johannes Koettl, May 2009
0910 Unemployment Insurance Savings Accounts in Latin America: Overview and Assessment
by Ana M. Ferrer and W. Craig Riddell, June 2009 (online only) 0909 Definitions, Good Practices, and Global Estimates on the Status of Social
Protection for International Migrants by Johanna Avato, Johannes Koettl, and Rachel Sabates-Wheeler, May 2009
(online only) 0908 Regional Overview of Social Protection for Non-Citizens in the Southern
African Development Community (SADC) by Marius Olivier, May 2009 (online only)
0907 Introducing Unemployment Insurance to Developing Countries by Milan Vodopivec, May 2009 (online only) 0906 Social Protection for Refugees and Asylum Seekers in the Southern Africa
Development Community (SADC) by Mpho Makhema, April 2009 (online only) 0905 How to Make Public Works Work: A Review of the Experiences by Carlo del Ninno, Kalanidhi Subbarao and Annamaria Milazzo, May 2009
(online only) 0904 Slavery and Human Trafficking: International Law and the Role of the World
Bank by María Fernanda Perez Solla, April 2009 (online only) 0903 Pension Systems for the Informal Sector in Asia edited by Landis MacKellar, March 2009 (online only) 0902 Structural Educational Reform: Evidence from a Teacher’s Displacement
Program in Armenia by Arvo Kuddo, January 2009 (online only) 0901 Non-performance of the Severance Pay Program in Slovenia by Milan Vodopivec, Lilijana Madzar, Primož Dolenc, January 2009 (online
only)
To view Social Protection Discussion papers published prior to 2009, please visit www.worldbank.org/sp.

Abstract
The Results Readiness Review assessed progress to date on results-based management in the Social Protection & Labor (SP&L) portfolio and generated operationally relevant knowledge on how to strengthen Monitoring & Ev aluation (M&E). Specifi cally, the Review took stoc k of the status and quality of M&E in the SP&L portfolio, including both investment and polic y-based lending. The Review identifi ed trends, strengths and weaknesses, and good pr actice M&E approac hes and indicators to incorpor ate a better results focus in project design and implementation. This related Note pro vides guidance for World Bank Task Teams working on Social Service Delivery Projects.
HUMAN DEVELOPMENT NETWORK
About this series...Social Protection Discussion Papers are published to communicate the results of The World Bank’s work to the development community with the least possible delay. The typescript manuscript of this paper therefore has not been prepared in accordance with the procedures appropriate to formally edited texts. The fi ndings, interpretations, and conclusions expressed herein are those of the author(s), and do not necessarily refl ect the views of the International Bank for Reconstruction and Development / The World Bank and its affi liated organizations, or those of the Executive Directors of The World Bank or the governments they represent. The World Bank does not guarantee the accuracy of the data included in this work.
For free copies of this paper, please contact the Social Protection Advisory Service, The World Bank, 1818 H Street, N.W., Room G7-703, Washington, D.C. 20433 USA. Telephone: (202) 458-5267, Fax: (202) 614-0471, E-mail: [email protected] or visit the Social Protection website at www.worldbank.org/sp.
Results Readiness in Social Protection & Labor Operations: Technical Guidance Notes for Social Service Delivery Projects
Julie Van Domelen
S P D I S C U S S I O N P A P E R
February 2011
NO. 1106