retail and town centre study update 2020
TRANSCRIPT

Retail and Town Centre
Study Update 2020
prepared for
Colchester Borough Council
November 2020

2
Contents
1. Introduction 3
2. National Retail Context and Trends 4
3. Centre Hierarchy and Healthcheck Assessments 13
4. Retail Capacity Update: Approach and Baseline Evidence 19
5. Retail Capacity Update: Forecasts 27
6. Commercial Leisure Audit 30
7. Opportunities for Growth and Change 34
8. Policy Recommendations 37
9. Conclusions 42
Appendices:
Appendix A (Updated Healthcheck Audits)
Appendix B (Updated Retail Capacity Tables)
Appendix C (Catchment Area Plan)

3
1. Introduction
1.1 CPW Planning has been commissioned by Colchester Borough Council to prepare a Retail and
Town Centre Study Update (‘Update’) for the Borough. It updates and supersedes the Retail
and Town Centre Study 2016 prepared by Cushman & Wakefield (‘2016 Study’).
1.2 The Update provides the evidence base to assist the Council with its work on the retail and
town centre policies of the emerging Local Plan, and to support the Council’s development
management function. Because the Local Plan was submitted to the Secretary of State for
independent examination before 24 January 2019, it is being examined against the National
Planning Policy Framework (NPPF) of March 20121. The updated evidence base set out in this
report therefore reflects the requirements of and is compliant with the NPPF 2012.
1.3 The Update has been prepared in the context of the latest available information and recent
events, including the Covid-19 pandemic and changes to the Use Classes Order2. A further
notable change since the 2016 Study has been the grant of planning permissions for new retail
and leisure floorspace in the Borough, in particular the major development proposals at
Tollgate (Stanway) and North Colchester.
1.4 The main objectives of this Update, as identified in the brief issued by the Council, can be
summarised as follows:
a) review national trends in the retail sector (particularly in response to Covid-19);
b) updated healthcheck audits of the Borough’s centres;
c) updated retail capacity forecasts in the light of committed developments and the latest
population and expenditure projections;
d) updated commercial leisure audit;
e) assess the potential to meet identified needs (as required by the NPPF 2012); and
f) identify any policy revisions in response to the updated evidence base.
1.5 It is relevant to note that the Council has recently submitted its bid for Town Deal grant funding
from the Government. If successful, up to £25m would be awarded to support a variety of
projects – including public realm improvements in Colchester Town Centre. It would follow
the September 2020 accelerated Towns Fund investment (£1m) focused on improvements at
St Nicholas Square and Balkerne Gate.
Report Structure
1.6 This Update is structured as follows:
▪ Section 2 – National Retail Context and Trends
▪ Section 3 – Centre Hierarchy and Healthcheck Assessments
▪ Section 4 – Retail Capacity Update: Approach and Baseline Evidence
▪ Section 5 – Retail Capacity Update: Forecasts
▪ Section 6 – Commercial Leisure Audit
▪ Section 7 – Opportunities for Growth and Change
▪ Section 8 – Policy Recommendations
▪ Section 9 – Conclusions
1 Notwithstanding that a revised version was published in July 2018 and updated in February 2019. 2 The claim for Judicial Review of the Government’s changes to the Use Classes Order (inter alia) was dismissed by the High Court on 17 November 2020.

4
2. National Retail Context and Trends
Introduction
2.1 It is important when assessing future retail and town centre development needs in Colchester
Borough to consider the current retail market in the UK. This is particularly pertinent amid
the Covid-19 public health emergency, which is having a deep and potentially long-lasting
impact on the retail, leisure and hospitality industries.
2.2 The structure of the retail sector has been changing at pace over the past decade, with the rise
of online shopping and the scale of retailer closures having significant implications for town
centres in particular. The Government-enforced closure of all but ‘essential’ shops and stores
during the national lockdown(s) of 2020 has further resulted in new shopping habits, forcing
the sector to respond to digital demands and re-evaluate its space requirements.
2.3 The rate of shop closures in the UK increased over 70% during H1 2020 (a net decline of 6,001
shops) compared to H1 20193 and some analysts are predicting that one-in-four ‘non-essential’
shops may permanently close4. Leisure and hospitality businesses are also facing significant
impacts and closures.
2.4 Against this background, we outline below the national trends in the retail sector and the
potential implications for the Borough’s centres.
Key Trends
Consumer confidence and spending
2.5 Per capita expenditure on comparison (non-food) goods has achieved average annual growth
of 3.6% since the 2009 economic recession, with per capita spending in 2019 growing by 4.6%
due to strong performance in spending on clothing and footwear, audio-visual equipment, and
personal and recreational items. In contrast, per capita expenditure on convenience goods
contracted between 2006 and 2015; grew by 3.9% in 2016 and 2.1% in 2017; and has since
moderated with the latest data indicating that spending slowed to 1.1% in 2018 and declined
by 0.7% in 20195.
2.6 The Covid-19 outbreak at the beginning of 2020 has deepened the economic uncertainty facing
the UK. According to Precisely’s Retail Expenditure Guide 2020/21, which includes Oxford
Economics’ forecasts from the consumer spending model6, the Covid-19 pandemic and the
resulting recession will end the UK’s recent run of spending growth. It states:
Large-scale fiscal support, such as the government's job retention scheme, should help mitigate impact on household incomes, but the temporary closure of non-essential retail and the introduction of social distancing measures mean that consumer spending will fall substantially in 2020… We forecast per-capita expenditure on all goods to decline by 11% in 2020 – a considerably larger contraction than was experienced during the global financial crisis of 2008-2009. This is largely the result of a sharp decline in expenditure on comparison goods...
3 Property Week, 19 October 2020 (Shop closures surge over 70%). 4 Essential Retail, 23 June 2020 (Why retailers must use tech to dramatically cut costs). 5 Retail Expenditure Guide 2020/21: 2019-Based Expenditure Release, Precisely. 6 The forecasts take into account the impact of the recession and the subsequent period of austerity, as well as the UK's vote to leave the European Union, which will contribute to a period of more restrained spending growth (Retail Expenditure Guide 2020/21).

5
2.7 It adds that, with per capita expenditure on comparison goods expected to fall by 16.4% in
2020, the outlook for comparison goods spending has been downgraded over the medium term
to 2024:
We forecast per-capita expenditure on comparison goods to grow by 1.8% per year, down from the strong growth seen in the last decade. This forecast is heavily influenced by the sharp fall in 2020, and 2021-2022 should see stronger results [although the reintroduction of lockdown measures in late 2020 or early 2021 could potentially push the recovery further back].
2.8 The outlook for convenience goods is more stable, with the Retail Expenditure Guide
commenting that:
We forecast per-capita expenditures to fall by just 0.5% - broadly similar to the 2019 decline. Retail outlets for many convenience goods remain open during the lockdown, therefore spending opportunities are less disrupted than for comparison goods. In fact, we expect spending on food in particular to receive a boost in 2020, as consumers have been forced to substitute meals out with eating at home… However, as people begin eating out again [subject to pandemic-induced restrictions], we expect most of the boost to in-store food and drink spending to fade away, and subsequently forecast per-capita spending on convenience goods to fall by 2.3% in 2021.
2.9 It anticipates that convenience goods spending will decline by an average of 0.2% per year
between 2019 and 2024, before growing by 0.5% per year in the longer term to 2040.
2.10 Although it is reported that total retail sales have risen for five consecutive months as of
September 2020, with sales 5.5% higher than the pre-pandemic levels achieved in February
20207, slower expenditure growth (particularly on comparison goods) due to the change in
macro-economic conditions is likely to have implications for retailers and the expenditure-
based capacity for new retail floorspace in Colchester Borough.
The continued growth of online shopping
2.11 The rapid growth in online shopping since the late 1990s has increased the market share of
non-store retail sales with visible consequences for high streets and other shopping
destinations. Yet the degree of impact is uncertain in the context of multi-channel retailing:
stores are often a source of stock for online retail sales, while the internet can even direct
customers to stores (e.g. use internet to research but make purchase in store).
2.12 In 2019, online shopping accounted for around 20% of total retail sales with significant
variations by sector. Only around 5% of food sales were internet-based, whereas almost 20%
of clothing and footwear sales (a key sector for many larger town centres) were attributable to
online shopping. Some 60% of sales on DVDs, music and books were made online.
2.13 The Covid-19 outbreak and the national lockdown(s) that followed, resulting in the temporary
closure of many shops, accelerated the significant growth in online shopping. According to
figures published by ONS, online retail sales as a proportion of total retail sales hit a record
high of more than 30% in May 2020, before falling back to 26.6% in August 2020. The latest
figures for food sales show that online spending reached 13.5% as a proportion of total food
sales in the four weeks to 9 August 2020, which is a new record8.
2.14 Whilst online shopping has benefitted from this lockdown-induced shift, many conventional
non-food shops and stores are still struggling to attract consumers – but the recovery is mixed.
7 BBC News, 23 October 2020 (Shoppers defy economic gloom in September). 8 Essential Retail, 18 August 2020 (Online grocery sales reach record levels although overall spend slows).

6
Retailers reported a 9.9% jump in sales of DIY/homeware products in August 2020 compared
with pre-pandemic levels, whereas the volume of clothing items sold was down 15.9% over the
same period9.
2.15 To that end, Primark sales slumped 75% in the period March-June 2020 with the retailer
having no online business to fall back on during the Covid-19 lockdown(s)10. Since reopening
its stores, however, Primark’s parent company has announced it expects sales to year-end to
reach £2 billion, with sales at regional high street stores broadly in line with 2019 (whereas its
retail park stores are achieving higher year-on-year sales)11.
2.16 A significant recent change in the grocery sector has been Ocado’s partnership switch from
Waitrose to M&S, a joint venture which will see the online retailer selling 6,000 M&S-branded
food items. Meanwhile, Waitrose has partnered with Deliveroo as part of a 12-week trial to
offer an online service platform for rapid food deliveries in under 30 minutes12.
Improved digital capability
2.17 Consumers are demanding (only 32% of UK consumers are willing to wait 2-3 days for
deliveries13) and increasingly dependent on technology to fulfil one’s shopping needs. Covid-
19 has changed or reinforced pre-lockdown behaviours, with more consumers willing to try –
and switch to – digital forms of shopping.
2.18 Modern retailers are therefore investing more and more in digital platforms. Burberry, the
luxury fashion brand, has invested significantly to encourage a shift from offline (i.e. physical
stores) to online behaviour, utilising virtual appointments and a direct messaging platform
between sales associates and the consumer. Digital is now Burberry’s fastest-growing channel
(up 22% on 2019) and has served to retain consumer’s affection for the brand and the
propensity to purchase, notwithstanding the lockdown-enforced store closures14. Meanwhile,
it is reported that international online sales of luxury goods increased by 170% year-on-year
in August and September 2020, as Covid-19 and other changing consumer demographics have
prompted the premium brands to prioritise their digital capability15.
2.19 Other retailers are closing their bricks-and-mortar stores and transforming into online-only
brands. Examples include Maplin, Cath Kidston, and TM Lewin; and the trend is not limited
to retail, with Thomas Cook (travel agent) also relaunching as an online-only business.
2.20 M&S, which integrated its online food business with Ocado in September 2020, has developed
its digital capabilities in response to the changing consumer landscape as part of its ‘Never the
Same Again’ programme. The retailer has digitised its Sparks loyalty scheme, in which
members can receive rewards for frequently shopping at M&S, such as fast-track access to the
latest products and trends16. It is also rolling out ‘Mobile Pay Go’ payment options17 whereby
consumers scan a product’s barcode as they shop and then pay from a mobile device via the
retailer’s App18.
2.21 While many larger retailers are investing in digital channels, this is not necessarily the case
with smaller independents and high street businesses (although Covid-19 related impacts have
forced some businesses to establish or develop online interest in order to generate sales). For
9 BBC News, 18 September 2020 (UK DIY sales soar but clothing stores fall behind). 10 Essential Retail, 6 July 2020 (Covid-19: Primark reveals 75% drop in sales due to lockdown). 11 Retail Gazette, 7 September 2020 (Primark sales beat expectations since exiting lockdown). 12 Essential Retail, 1 September 2020 (M&S and Ocado joint venture goes live). 13 Oxford Economics, 2019. 14 Essential Retail, 1 July 2020 (Covid-19: How the pandemic has transformed Burberry’s digital business). 15 Essential Retail, 5 October 2020 (Cross-border online luxury sales on the rise). 16 Essential Retail, 2 July 2020 (Covid-19: M&S digitises loyalty scheme as part of transformation plan). 17 So too are other grocery retailers such as Co-op, Sainsbury’s and Spar. 18 Essential Retail, 17 June 2020 (The post-Covid customer experience: the reawakening of digital).

7
most retailers, however, successfully combining physical and digital propositions will be
necessary in the face of an increasingly competitive marketplace.
2.22 Moreover, technologies that make shopping trips fast, efficient and contactless (like self-
checkout) were already on a growing trajectory pre-lockdown and are likely to become even
more important as retailers tackle the issue of consumer confidence and anxiety about
returning to stores19. The M&S ‘Mobile Pay Go’ initiative (cited above) will serve this trend,
while Amazon plans to open at least 30 ‘physical’ convenience stores across the UK as part of
its ‘Amazon Go’ rollout20 which, significantly, involve no queueing and no checkout.
Right-sizing store portfolios
2.23 Prior to Covid-19, the shift towards online shopping resulted in a period of significant change
and quite considerable consolidation from long-standing UK retailers. Large retailers
increasingly focused on a smaller number of prime locations for their store portfolios (often
referred to as polarisation) where they can have flagship-type stores and serve wide
catchments. Others relaunched as online-only retailers, as commented before.
2.24 Much of this change can be attributed to a large number of loss-making stores, particularly in
the context of reducing footfall and a highly competitive pricing environment. Company
voluntary arrangements (CVAs) have been a preferred restructuring method for many retailers
such as Mothercare, Homebase, New Look, Debenhams, Monsoon and Accessorize.
2.25 However, according to Deloitte, 2019 saw a 24% year-on-year decrease in CVAs which in turn resulted in an increase in the number of administrations. This is in part due to push back from the landlord community which has made CVAs harder and less attractive to implement21.
2.26 With consumer behaviour changing in response to the Covid-19 pandemic – many consumers
have adapted to new ways of shopping that are convenient and safe – retailers are continuing
to ‘right-size’ or even abandon their store portfolios (e.g. TM Lewin). It is reported that French
Connection, Clarks and GAP are some of the latest retailers to consider closing some (French
Connection22 and Clarks23) or all (GAP24) of their UK stores.
2.27 Like many retailers Poundland temporarily closed some (15%) of its stores during the national
lockdown(s), which has significantly impacted year-on-year revenues despite revenue now
returning to pre-lockdown levels25. The retailer has consolidated its offer in Colchester Town
Centre into a single store on Culver Street East, adjacent to Lion Walk26.
2.28 Not all retailers are downsizing, however. Other discounters such as B&M, Home Bargains,
Wilko and Poundstretcher have out-performed many high street chains during the Covid-19
crisis, with B&M increasing its UK sales by almost 20% in the period July-September 2020
despite the absence of an online sales platform. The retailer is benefitting from the shift in
spending to out-of-town retail parks and plans to open 45 new stores by March 202127.
2.29 In the grocery sector, Lidl and particularly Aldi28 continue to expand throughout the UK while
Co-op recently announced plans to open 50 new convenience stores in response to increased
19 Essential Retail, 15 June 2020 (Covid-19: Stores reopen today – industry reacts). 20 The Independent, 3 August 2020 (Amazon ‘plans to open at least 30 physical shops in the UK’). 21 Deloitte, 8 January 2020 (Retail sector ends decade with fall in the number of CVAs). 22 Property Week, 13 October 2020 (French Connection warns of store closures). 23 Property Week, 7 October 2020 (Clarks to axe stores as it nears CVA). 24 BBC News, 23 October 2020 (GAP considers closing all its UK stores). 25 The Grocer, 9 July 2020 (Poundland revenues flat as rivals open in former Poundworld sites). 26 Poundland previously occupied stores on Long Wyre Street and at St John’s Walk Shopping Centre. 27 The Guardian, 29 September 2020 (B&M steps up expansion after lockdown sales boom). 28 Property Week, 28 September 2020 (Aldi to open 100 more stores as part of £1.3bn UK investment drive).

8
demand and online ordering in the light of Covid-1929. However, Waitrose is closing four
supermarkets30.
2.30 Covid-19 has also had a major impact on the ‘grab-and-go’ food market, which relies heavily
on office workers and commuters. The shift in work patterns and the reduction in footfall has
made some outlets unviable, with Pret announcing that it will close 30 branches across the
UK31 while Costa Coffee is cutting more than 10% of its café workforce.
2.31 Service-based retail uses (i.e. financial services, travel agents) have seen a gradual contraction
in store numbers in recent years, due to the continued growth of internet alternatives which
provide convenient access to online banking32 and holiday price-comparison websites. This
form of structural change has consequences for footfall and consumer spending, most notably
in secondary town centres which are more dependent on such uses.
Changing store formats
2.32 It remains to be seen whether the social-distancing measures introduced in response to Covid-
19 (which have been more problematic for smaller shops and stores) are likely to influence
retailers’ store format requirements in the short to medium term.
2.33 Notwithstanding, modern consumers have high expectations for convenience, experience and
personalisation; largely driven by smart phone technology (i.e. Apps) and social media (i.e.
Facebook, Instagram, TikTok). Shopping is becoming more leisure focused and activity-based,
which is reflected in new, often extensive store formats.
2.34 The large Next / Next Home ‘flagship’ stores are a well-known example of a major retailer
developing out-of-town showrooms to provide a substantially expanded range of comparison
goods and lifestyle experiences.
2.35 Some retailers, on the other hand, require (or are experimenting with) smaller and more
efficient store formats. Homebase has launched a new split-level, small format showroom
dedicated to kitchens (at ground floor level) and bathroom displays (first floor). The concept
represents the second trial Homebase has undertaken since the Covid-19 outbreak, coinciding
with more home-working and greater levels of spending on home improvements, and follows
the launch of two ‘DECORATE by Homebase’ stores in May 202033.
2.36 The grocery sector has been reacting to changing shopping habits in recent years with
implications for store formats. The underlying trend prior to Covid-19 was the decline of ‘bulk’
food shopping as consumers shopped around for best value and/or undertook more frequent
top-up (or ‘basket’) food shopping trips. This trend coincided with the discounters (i.e. Aldi
and Lidl) expanding their market share over the ‘big four’ supermarkets and is likely to
continue, although there are indications that consumers are visiting convenience stores less
often but spending more per visit.
Shared space
2.37 The adaptability of retail space is increasingly important in a fast-moving sector. There is
greater collaboration between retailers in terms of sharing space; and between shopping centre
landlords and their tenants in the provision of collection points and/or lockers.
29 The Guardian, 4 September 2020 (Co-op creates 1,000 jobs and opens 50 new stores in UK). 30 Property Week, 17 September 2020 (Waitrose to close four supermarkets). 31 The Guardian, 27 August 2020 (Pret a Manger cuts almost 2,900 UK jobs as sales plummet). 32 Metro Bank slashed its expansion plans in February 2020 due (in part) to competition in the online banking market. 33 Essential Retail, 25 September 2020 (Homebase launches new dual purpose concept store).

9
2.38 Innovative collection arrangements are also being introduced at public transport hubs and
other public places (i.e. not on the traditional high street), in response to the convenience-
based demands of consumers.
2.39 One of the most successful retailer tie-ups has been Sainsbury’s and Argos34, while Laura
Ashley will be returning to the UK high street in a new partnership with Next35.
2.40 The sharing of space is likely to increase as retailers look to reposition themselves and offset
rising occupancy/operational costs and thus falling profitability, which is a significant
challenge for many retailers during the Covid-19 pandemic. Department stores comprising
large floorplates, often over multiple levels, are particularly well-suited to accommodating
other uses such as offices36 and cafes/restaurants (e.g. Caffe Nero and Carluccio’s occupy space
within the Fenwick department store in Colchester Town Centre).
2.41 Trinity Works (Trinity Street) in Colchester Town Centre is an excellent example of a creative
shared space. Managed by HAT Projects, the repurposed 1970s church includes a café offering
wi-fi and ‘touch down’ space. It also comprises a maker-space facility with shared access to
workspace and tools for ceramics, textiles and printmaking.
2.42 The recently introduced changes to the Use Classes Order – with the new Class E encompassing
retail, commercial, business and service uses – provide greater flexibility and will make it
easier to co-locate two or more asset classes within the same premises.
The click-and-collect market
2.43 Retailers are increasingly incorporating click-and-collect services into their stores or within
adjacent customer car parks (such as the facilities provided by Currys & PC World at Tollgate,
Asda at Turner Rise, and the Tesco Express in West Mersea).
2.44 As well as often accounting for a substantial proportion of retailers’ online sales, click-and-
collect reduces ‘last mile delivery’ costs and can create additional sales volumes. Covid-19 has
led to a rise in click-and-collect options as retailers have been forced to adapt to the growing
demands and expectations of consumers.
2.45 M&S is trialling new click-and-collect technology in a small number of stores as part of its plan
to integrate in-store and online services for customers. One concept currently being tested
allows customers to collect items contactless in-store, with a text / WhatsApp / Facebook
Messenger informing them of their allocated shelf; while the other involves vehicle number-
plate recognition and drive-up collection from a pre-allocated ‘pick up’ location37. Aldi is also
piloting its first UK click-and-collect services38.
2.46 The click-and-collect market is likely to continue its upward trend in the light of the ongoing
Covid-19 restrictions.
Pop-up (or meanwhile) uses
2.47 The UK’s high streets have seen an increase in the number of pop-up shops and other uses in
recent years. As well as addressing vacant or under-utilised space and tapping into local
entrepreneurialism, they help to deliver a creative and bespoke retail experience.
34 It has been announced that all 240 ‘standalone’ Argos stores will close by 2024, although Sainsbury’s plan to open 150 Argos outlets in its supermarkets. 35 The Guardian, 31 October 2020 (British firm’s homeware will be available via Next’s UK stores and website from spring 2021). 36 The John Lewis Partnership has recently secured planning permission to convert almost half of its Oxford Street (London) department store into offices. 37 Essential Retail, 24 August 2020 (M&S trials new click & collect technology). 38 Essential Retail, 14 September 2020 (Aldi trials click & collect in UK for first time).

10
2.48 The ‘meanwhile’ concept enables retail businesses, usually independents but increasingly
multiples (e.g. Costa Coffee at CRATE Loughton), to lease space on a short-term basis. Markets
and seasonal events are particularly popular and, by their nature, bring the animation and
vibrancy that traditional high streets often lack.
2.49 Colchester Town Centre has seen the installation of the Caribbean-themed ‘Summer Drinks
Terrace’ at Lion Walk, offering an outdoor bar and live music at a time when Covid-19 is
resulting in restrictions on indoor entertainment.
The role of leisure and all-round experiences
2.50 Retail space alone is not enough to attract consumers to a town centre, with the importance of
strong leisure-based ‘anchors’ increasingly evident. This reflects changing consumer habits
and the demand for alternative, non-retail attractions and, ultimately, high quality
experiences. Leisure also plays a major role in extending dwell times (and thus consumer
spending) and supporting the night-time economy.
2.51 There has been a notable shift from retail to commercial leisure uses (such as restaurants,
cinemas and gymnasiums) within newer retail-led schemes and many town centres.
Developers and landlords recognise the value of providing leisure in order to create an all-
round experience for shoppers, as seen in Colchester Borough with (for example) the plans for
Tollgate Village.
2.52 That said, even before the Covid-19 outbreak, the leisure sector was challenged by the
structural changes affecting retail businesses, with high street footfall in decline as consumers
shopped online or at the most prime locations. The challenges facing the sector are even more
pronounced in the light of Covid-19.
2.53 Cinemas have been particularly affected by the social-distancing measures and declining
audiences. Cineworld recently confirmed it will temporarily close its 127 Cineworld and
Picturehouse cinemas in the UK, citing the pandemic-induced lack of new films to draw in
audiences39. There is currently no Cineworld (or Picturehouse) operating in Colchester,
although the leisure development plans for Northern Gateway include a 12-screen Cineworld.
2.54 The restaurant sector, which for several years has been subject to high levels of competition
and discounting, and over-supply in some locations, has seen many major chains downsize
across the UK (e.g. Carluccio’s, Jamie Oliver, Prezzo). In this context, it is encouraging for
Colchester Town Centre that Carluccio’s (within the Fenwick department store) and Prezzo
(Culver Street East) have maintained their representation.
2.55 Other restaurant chains have been forced to downsize or make permanent closures in the light
of the Covid-19 crisis: it is reported that UK food and beverage sales halved in July 2020
compared to the previous year, as almost two-thirds of restaurants remained closed and many
consumers sought home deliveries40. Although the subsequent ‘Eat Out to Help Out’ scheme
helped the sector to recover, the 22:00 curfew imposed since the end of September 2020 is
likely to result in further closures41.
2.56 Whilst retail businesses have been adapting to the ‘new normal’ of store-based shopping, such
as managing queues and encouraging social distancing, the need for engaging with customers
and creating experiences should not be overlooked despite the ongoing Covid-19 restrictions.
Lush, for example, has introduced a new in-store shopping experience: it involves the customer
39 Property Week, 5 October 2020 (Cineworld to close all UK and US cinemas). 40 The Guardian, 13 August 2020 (Covid halves July sales in UK pub, bar and restaurant chains). 41 Property Week, 19 October 2020 (Shop closures surge over 70%).

11
washing their hands with samples of Lush soap and water as they enter the store, instead of
the clinical hand sanitiser used by most retailers42.
2.57 Offering all-round experiences ‘beyond retail’ through leisure and cultural attractions, such as
the outdoor bar and live music pop-up venue at Lion Walk (cited above), cannot be achieved
online and are therefore fundamental to the future recovery of town centres.
Potential Implications for the Borough’s Centres
2.58 This section has provided an overview of the national retail context and discussed some of the
key changes in the retail and leisure sub-sectors as a result of the Covid-19 pandemic.
2.59 The trends identified are likely to have a number of implications for the Borough’s centres.
Whilst the situation is fast-changing and somewhat uncertain in terms of the retail market
outlook, we outline below the potential implications:
▪ It is likely that the pandemic-induced restrictions on the retail, leisure and hospitality
industries will continue to have a significant impact on town centre footfall and activity.
We consider that Colchester Town Centre is particularly vulnerable given its exposure to
‘non-essential’ fashion-orientated retailers, and reliance on leisure and hospitality
(including the evening economy), other cultural activities and office/retail workers to
generate expenditure.
▪ Several factors including slower expenditure growth projections, the continued growth of
online shopping, together with the scale of collapsed or ‘at risk’ retailers (and those
downsizing or relaunching as online-only brands), highlight the reality that many town
centres have too much retail space overall. We identify in section 3 of this Update the
reduction in comparison goods retailers and increasing vacancy levels in Colchester Town
Centre, which should be taken into account when planning for new retail – particularly
comparison goods retail – floorspace in the Town Centre.
▪ The trend towards ‘right-sizing’ has led retailers (and increasingly leisure operators) to
target the most defensible and therefore high-demand locations, where footfall and
consumer spending is most resilient to economic changes. This is now affecting more and
more larger centres, as investors become increasingly selective and polarise towards fewer,
prime retail locations. The Borough’s centres have been reasonably stable in terms of
retailer representation since the 2016 Study (based on our updated healthcheck audits at
Appendix A), although the considerable reduction in comparison goods retailers in
Colchester Town Centre would suggest it is increasingly exposed and at risk to such trends.
▪ A key challenge for Colchester Town Centre will be retaining and improving the mix of
retailers and other services. To achieve this, the Town Centre will need to (inter alia):
o create the right conditions for investment in areas currently lacking in environmental
quality (e.g. Priory Walk, St John’s Walk Shopping Centre) to complement the
improvements delivered – and planned – in other areas of the Town Centre (as
identified in section 3 of this Update);
o improve accessibility, public transport connections, and car parking;
o provide opportunities for flexible store formats with click-and-collect facilities and
servicing arrangements that meet the needs of modern retail businesses; and
42 Essential Retail, 3 July 2020 (Covid-19: Retailers shouldn’t forget about experiential shopping).

12
o support a mix of retail and non-retail (including evening economy) attractions that are
distinguished from those available at competing shopping destinations, and which help
to increase dwell times and spend.
▪ Diversifying beyond traditional retail offers will be necessary in the context of reduced
retailer demand. This underlines the important role of shared mixed-use spaces and
meanwhile uses, which provide interest and high-quality experiences that cannot be
achieved online: town centre strategies should therefore be flexible in supporting the
evolution of the high street.
▪ Like successful retail businesses, the Borough’s centres should look to integrate their
physical and digital propositions in response to ‘tech-savvy’ consumer expectations and an
increasingly competitive marketplace.

13
3. Centre Hierarchy and Healthcheck Assessments
3.1 This section provides an assessment of the Borough’s centres as defined in Table SG5a of the
emerging Local Plan, namely:
▪ Town Centre: Colchester.
▪ District Centres: Tiptree; West Mersea; Wivenhoe; Tollgate; Peartree Road; Turner Rise;
and Highwoods.
3.2 We have carried out up-to-date ‘healthcheck’ audits of each centre (based on the performance
indicators set out under paragraph 006 of the Planning Practice Guidance43) informed by our
own site inspections during September 2020 and various sources of data including the Retail
and Town Centre Study 2016 (prepared by Cushman & Wakefield), Experian Goad data, and
information supplied by Colchester Borough Council and its partners.
3.3 The audits are included at Appendix A and provide the basis for re-assessing the role and
function of each centre. An overview is included in this section. Beyond the existing centres,
there is retail and (to a lesser extent) leisure floorspace within ‘non-central’ retail parks and
warehouses and we identify the most significant facilities below.
3.4 In addition, a key change since the 2016 Study has been the grant of planning permissions for
new retail and leisure floorspace in the Borough, including major developments at Tollgate
(Stanway) and North Colchester. This section also therefore identifies any relevant committed
developments.
Colchester Town Centre
3.5 Colchester Town Centre is the principal comparison goods shopping destination in the
Borough supported by a mix of non-retail uses and services including leisure, cultural and
community facilities. The number of units accommodating comparison goods retailers has
fallen considerably since the 2016 Study (from 241 to 190), which represents a trend occurring
in many centres across the UK but one that is increasingly affecting larger centres such as
Colchester.
3.6 Most of the ‘major’ comparison goods retailers are concentrated in and around the Town
Centre’s main shopping centres – Culver Square and Lion Walk – and such representation is
broadly unchanged since the 2016 Study, although Primark (Lion Walk) opened in 2017 while
the Fenwick department store (High Street) has benefitted from a major refurbishment. We
consider, for a centre of its size, higher end retailers are under-represented; however, the
strong mix of independent shops and stores help to provide a more distinguished retail offer.
3.7 A further notable change since the 2016 Study is the opening of the Curzon cinema scheme
(Queen Street). Alongside the new restaurants including at Greytown House44 (High Street)
and the refurbishment works to Mercury Theatre (Balkerne Gate), this has enhanced the Town
Centre’s all-round leisure offer. The completion of the High Street public realm works since
the 2016 Study has also improved the ‘experience’ for town centre users.
3.8 Vacancy levels in Colchester Town Centre have increased from 10.5% of total ground floor
premises (as reported in the 2016 Study) to 14.5% (based on the Experian Goad survey of
November 2019). This is above the national average (around 12%) and includes some
prominent vacant premises at the east of the Town Centre, at Priory Walk and adjacent
43 Specifically the Town centres and retail section. 44 Five Guys, Wagamama and Turtle Bay.
14
shopping streets (namely Long Wyre Street and Queen Street); Culver Street West; Lion Walk;
High Street; and St John’s Walk Shopping Centre.
3.9 Our audit has identified the significant impact of the Covid-19 crisis on town centre footfall45
and car park stays. Whilst the impact is not limited to Colchester Town Centre, we assess that
the Town Centre is particularly ‘at risk’ to such issues (more so than any other centre in the
Borough) as commented in section 2 above. Even before the Covid-19 outbreak, there is
evidence to suggest that both town centre footfall and car park stays have declined since the
2016 Study.
3.10 Overall, we assess that Colchester Town Centre continues to perform reasonably well against
many of the healthcheck indicators. Yet there are weaknesses and signs that the Town Centre
is increasingly vulnerable to structural changes in the retail sector and growing competition
from nearby shopping destinations. The current outlook and the committed developments at
Tollgate (Stanway) in particular, reinforce the need for measures to maintain the Town
Centre’s attractiveness and role as the principal mixed-use shopping destination in Colchester
Borough. This includes continued investment in the public realm and key opportunity sites
(including Vineyard Gate, Priory Walk and St John’s Walk Shopping Centre) to improve the
visitor experience and create a more vibrant, differential offer.
3.11 To that end, the public realm improvements proposed for St Nicholas Square and Balkerne
Gate using the £1m accelerated Towns Fund will help to create the conditions necessary for
inward investment and are aligned with the Council’s wider longer-term investment plans to
improve connectivity between various sites and celebrate the town’s culture and heritage (inter
alia) under the Town Deal. Increasing the residential and student population of the Town
Centre (including through the committed developments identified below) will also help to
generate expenditure to support retail and non-retail businesses.
Committed developments: Colchester Town Centre
Former Co-op Department Store, Long Wyre Street:
▪ Full planning permission (ref. 170424) was granted in December 2017 for change of use
of the existing building with associated physical works to allow two A1 retail units (323
sqm) and five A3 restaurant units (2,098 sqm), along with 24 residential apartments.
▪ Construction work on this St Nicholas Quarter residential-led scheme has commenced,
although it is understood that the restaurant units are unlikely to come forward.
Alumno Site, Queen Street:
▪ Full planning permission (ref. 182120) was granted on appeal in December 2019 for the
redevelopment of the site to provide purpose-built student accommodation; hotel; flexible
commercial (A1/A3/A4/B1(c)/D2) floorspace not exceeding 1,200 sqm; artist studios;
and associated access and public realm improvements.
▪ Construction work has not yet started on site.
Tiptree
3.12 Tiptree lies outside the Colchester Urban Area, approximately 16km to the southwest of
Colchester Town Centre.
3.13 The District Centre continues to perform an important role in terms of serving the
convenience-based shopping and service needs of surrounding communities. It is supported
45 Specifically at Culver Square and Lion Walk.

15
by three national supermarket chains – Asda, Iceland and Tesco – and includes a range of
independent retail service businesses, together with a medical centre, community centre and
library. There is a limited evening economy.
3.14 A key change since the 2016 Study is the closure of Boots (chemist). This remains one of only
two vacant premises within the centre, which is a strong indicator of its overall vitality and
viability.
3.15 Overall, we assess that Tiptree’s role and function is unchanged since the 2016 Study.
West Mersea
3.16 West Mersea lies outside the Colchester Urban Area, approximately 16km to the south of
Colchester Town Centre.
3.17 The District Centre provides a modest range of retail, service and community facilities that
cater for the day-to-day needs of local residents as well as the centre’s visitor function. The
retail offer is dispersed throughout the centre and is largely focused on convenience retail (the
main convenience stores are Tesco Express, Co-op and Spar). There is a library, post office and
sports/leisure centre, while the small number of independent cafes/restaurants provide a
limited evening economy.
3.18 Consistent with the 2016 Study, we consider West Mersea is performing well within the
limitations of its small scale and particular role in the centre hierarchy.
Wivenhoe
3.19 Wivenhoe lies outside the Colchester Urban Area, approximately 6km to the southeast of
Colchester Town Centre.
3.20 It is a small, linear, and somewhat fragmented centre serving the basic retail and service needs
of local residents. There are two convenience stores (Co-op and One Stop), a Boots (chemist),
and a small number of independent shops selling ‘boutique’ clothing and other personal goods.
There are no vacant premises.
3.21 Overall, Wivenhoe District Centre displays relatively strong performance (considering its
limited scale and function) and serves an important localised role. This is consistent with the
findings of the 2016 Study.
Tollgate
3.22 Tollgate lies within the Colchester Urban Area, approximately 5km to the west of Colchester
Town Centre in Stanway.
3.23 Tollgate is the Borough’s largest District Centre and has evolved from a predominantly ‘bulky’
retail park into an established, sub-regional shopping destination with extensive surface level
car parking. It includes a Sainsbury’s superstore and a substantial range of multiple
comparison goods retailers. Notwithstanding the limited changes to retailer representation
since the 2016 Study, we assess it remains the case that Tollgate has a strong influence over
shopping patterns across the catchment area (which extends well beyond Colchester Borough)
and directly competes with Colchester Town Centre for comparison goods expenditure.
3.24 The centre is lacking in terms of services and community facilities. It contains several food and
drink outlets. Additional such outlets (namely a public house, Starbucks coffee shop and two

16
restaurants – KFC and Nando’s) opened in 2018 as part of the Stane Leisure Park
development46, which sits to the west of the District Centre.
3.25 Considering this recent development and the planning permissions granted for major new
retail and leisure floorspace (identified below), Tollgate is evidently a growing multi-purpose
destination and competitor to Colchester Town Centre.
Committed developments: Tollgate
Tollgate Village:
▪ Outline planning permission (ref. 150239) was granted on appeal in August 2017 for
mixed use development comprising retail and leisure uses (up to 30,812 sqm gross) with
associated access, car parking, public realm improvements and associated works.
▪ The Council has since granted the reserved matters approval of appearance, landscaping,
layout and scale (in addition to a Section 73 planning permission47). The most recent
reserved maters consent48 allows for 19,195 sqm gross of A1 Comparison Retail; 1,858
sqm gross of A1 Convenience Retail; 2,100 sqm gross of A3/A4/A5 food and beverage uses;
and 6,690 sqm of floorspace for D2 Leisure, including a multiplex cinema and a tenpin
bowling facility.
▪ The Light will operate the proposed new cinema49. We are not aware of any other named
retail and leisure operators for the scheme.
▪ Construction work has not yet started on site.
Stane Retail Park:
▪ Full planning permission (ref. 193163) was granted in December 2019 for a new retail
park to the immediate north of Stane Leisure Park, comprising 24,016 sqm of A1 retail
floorspace and A3/A4/A5 food and beverage uses not exceeding 327 sqm.
▪ It is proposed that the scheme will accommodate two new foodstores (Aldi and M&S Food
Hall), B&Q and a terrace of other ‘bulky goods’ stores. We are not aware of any named
retailers for these other stores.
▪ Construction work started on site in September 2020.
▪ The Council has recently received a Section 73 application (ref. 202105) to vary the
conditions of the extant planning permission. The application seeks to remove the ‘bulky
goods’ restriction and make changes to the mezzanine floorspace. It is yet to be determined
by the Council.
Peartree Road
3.26 Peartree Road lies within the Colchester Urban Area, approximately 3.5km to the southwest of
Colchester Town Centre.
3.27 The District Centre comprises large format comparison goods stores and warehouses selling
predominantly ‘bulky goods’ (exceptions include Poundstretcher and Barnardo’s). The centre
also includes a Co-op convenience store, Domino’s Pizza, Greggs (bakery), and some active
leisure uses (e.g. gymnasiums).
46 Planning permission refs. 146486 and 150945 (granted on appeal). There are two vacant restaurants following the decision of Coast-to-Coast and Bella Italia to withdraw from the scheme prior to opening. 47 Application ref. 193133 granted by the Council in April 2020. 48 Application ref. 201503 granted by the Council in October 2020. 49 Gazette News, 30 May 2020 (Boss of Tollgate Village cinema chain The Light says residents should be excited).

17
3.28 These characteristics are broadly consistent with the findings of the 2016 Study, which
comments that the centre’s role and function would be supported through the introduction of
additional services and/or community facilities.
Turner Rise
3.29 Turner Rise lies within the Colchester Urban Area, less than two kilometres to the north of
Colchester Town Centre.
3.30 The District Centre comprises a large Asda superstore and a purpose-built retail park with large
format stores. There are several ‘value’ comparison goods retailers such as Poundland, Home
Bargains and Dunelm. Consistent with the 2016 Study, there are no vacant units; no
independent retailers; while services are limited to food and drink outlets (namely Pizza Hut,
Costa Coffee and Subway) and the Asda in-store optician, pharmacy, and café.
3.31 Overall, we consider that Turner Rise is performing well as a large format, value-orientated
shopping destination. The recent changes in retailer representation (i.e. Poundland and
Carpets 4 Less replacing Bathstore and We Do Home) have not, in our view, changed the
centre’s role and function since the 2016 Study.
Highwoods
3.32 Highwoods lies within the Colchester Urban Area, approximately 2.5km to the northeast of
Colchester Town Centre.
3.33 It is dominated by a Tesco Extra superstore with in-store concessions including a pharmacy,
print shop, café, and the Florence & Fred clothing range. Other uses within the adjacent
shopping centre are predominantly independent businesses (e.g. newsagents, dry cleaners,
hairdressers).
3.34 Our audit confirms that, consistent with the findings of the 2016 Study, Highwoods District
Centre functions as a main food shopping destination for surrounding communities. It also has
a limited but important service-based role and function.
Non-central locations
3.35 There are additional facilities outside the centre hierarchy in the form of retail parks and ‘solus’
warehouses. The main retail parks are Colchester Retail Park (which includes Matalan, Choice
Home Outlet, Shoe Zone, Poundland and Pure Gym) and Colne View Retail Park (comprising
Aldi, DFS, Halfords and Pets At Home). Large format retail warehouses include B&Q Extra
(Lightship Way), The Range (Cowdray Avenue) and Wickes (Clarendon Way Retail Park).
3.36 Colchester Borough also contains a number of ‘non-central’ foodstores, such as Waitrose (St
Andrew’s Avenue) and several Aldi50 and Lidl51 discounters.
3.37 Section 6 of this Update identifies the current supply of key leisure facilities in the Borough by
type and location, while a major new leisure-based scheme is proposed in North Colchester
(identified below).
Committed developments: Non-central locations
Northern Gateway (North Colchester):
▪ In January 2018, the Council granted full planning permission (ref. 160825) for a new
leisure-based scheme including a 12-screen cinema; 80-bed hotel; 4,548 sqm of A3/A5
50 Colne View Retail Park; London Road, Lexden; and Magdalen Street. 51 Gosbecks Road; and Abbot’s Road.

18
food and beverage uses; and 3,344 sqm of floorspace for other D2 Leisure comprising three
active leisure units.
▪ The scheme has not come forward and Turnstone Colchester Ltd recently submitted a
revised application for full planning permission (ref. 201631) comprising a 12-screen
cinema; 90-bed hotel; active leisure units (totalling 5,200 sqm); and restaurant / hot food
takeaway units (totalling 2,885 sqm). It is therefore similar to the 2018 approved scheme
but intends to respond to current operator requirements. The revised application is yet to
be determined by the Council.
▪ Cineworld will operate the proposed new cinema52. It is understood that other confirmed
or target end-users include Travelodge (hotel), Puttstars (indoor golf), Jump Street
(indoor climbing) and Hollywood Bowl (tenpin bowling).
Former Homebase, St Andrew’s Avenue:
▪ Full planning permission (ref. 183130) was granted in June 2019 for the sub-division of
the Homebase store into two units, including change of use to allow a new Lidl foodstore
(not exceeding 1,972 sqm gross) to occupy one of the units.
▪ The scheme has not come forward and Lidl has submitted a revised application (ref.
201217) for a larger format foodstore and a new A3/A5 food and beverage use. The revised
application is yet to be determined by the Council.
52 This was confirmed prior to the announcement that Cineworld will temporarily close all of its cinemas in the UK for reasons related to the Covid-19 pandemic.

19
4 Retail Capacity Update: Approach and Baseline Evidence
4.1 In this section, we outline our approach to retail capacity forecasting in this Update. We then
set out the baseline assumptions and forecasts underpinning the updated assessment of new
retail (comparison and convenience goods) floorspace capacity in Colchester Borough over the
plan period.
Approach
4.2 Our assessment adopts the Excel-based model used for retail capacity forecasting in the 2016
Study, applying the most up-to-date baseline evidence available.
4.3 We must point out that the updated assessment relies on the household survey of shopping
patterns undertaken approximately four years ago. To compensate for this, we have adjusted
the market shares indicated by the 2016 household survey where necessary (as described later
in this section).
4.4 We forecast the expenditure-based capacity for new retail floorspace as follows:
▪ define an appropriate catchment area for Colchester Borough, sub-divided into 9 zones
based on postcode sectors;
▪ calculate the total amount of comparison and convenience goods expenditure available
within each of the 9 zones comprising the catchment area, at the base and forecasting
years;
▪ allocate the available expenditure to the Borough’s shopping destinations based on the
results of the 2016 household survey (adjusted by CPW Planning) to estimate current sales
and forecast future sales in each shopping destination;
▪ identify any committed developments (i.e. retail floorspace with planning permission,
under construction and/or opened since the 2016 household survey) and assess their likely
turnover; and
▪ compare the estimated sales in the Borough’s shopping destinations with existing
floorspace, so as to assess the current trading performance of each shopping destination
and the capacity to support additional comparison and/or convenience goods floorspace
(after allowing for committed developments).
4.5 Our approach is consistent with the NPPF and established best practice.
Shopping destinations and scenarios assessed
4.6 The shopping destinations modelled are:
▪ Colchester Town Centre;
▪ the District Centres of Tollgate, Turner Rise, Peartree Road, Highwoods, and Tiptree; and
▪ Non-central stores in the Borough.
4.7 We assess the ‘baseline’ scenario for new retail floorspace in the Borough, in which we assume
that the 2016 pattern of market shares of convenience and comparison goods expenditure in
each of the Borough’s shopping destinations – indicated by the 2016 household survey
(adjusted by CPW Planning) – remains unchanged throughout the forecasting period. The
implicit assumption in this scenario is that any new retail floorspace in these shopping

20
destinations would not change the market shares of expenditure attracted from the catchment
area.
4.8 This ‘constant market share’ approach is widely used and accepted for strategic retail capacity
forecasting. However, the Council will be aware that it is a highly theoretical approach on the
basis it does not, for example, take into account the planned delivery of new retail floorspace
in the Borough and its potential impact on shopping patterns and market shares over time.
This is particularly the case in respect of the major development proposals at Tollgate (i.e.
Tollgate Village and Stane Retail Park), which are likely to reduce Colchester Town Centre’s
market share of comparison goods expenditure (and thus comparison goods floorspace
capacity) and increase expenditure retention at Tollgate.
Format of the retail capacity tables
4.9 In the remainder of this section, all references to Tables are those comprising our updated
assessment of new retail floorspace capacity set out at Appendix B:
▪ Tables 1 to 5 show the population and expenditure forecasts for the catchment area.
▪ Tables 6 to 13 are the tables for Colchester Town Centre. Tables 6 and 7 indicate the
pattern of market shares of expenditure on each category of comparison and convenience
goods respectively attracted from the catchment area, as indicated by the 2016 household
survey before correction. Table 8 shows the corrected pattern of market shares. Table 9 is
the product of Tables 5 and 7, indicating the amounts of expenditure on each comparison
goods sub-category attracted. Table 10 sets out forecast retail sales for both comparison
and convenience goods, on a zone-by-zone basis and overall. Table 11 accounts for the
sales capacity of existing main foodstores and other convenience goods shops in the Town
Centre, and Table 12 sets out any committed retail developments and their expected sales
levels (for both comparison and convenience goods). Table 13 brings together the
expenditure attracted, existing floorspace and commitments to arrive at the retail capacity
forecasts for Colchester Town Centre. It also shows the overall market shares of total
catchment area expenditure on comparison and convenience goods attracted by the Town
Centre.
▪ Tables 14 to 22 are the tables for Tollgate. These tables follow the same arrangement as
the tables for Colchester Town Centre; however, an additional table is included (Table 20)
indicating ‘benchmark’ comparison goods sales in the existing retail warehouses and
foodstores.
▪ Tables 23 to 31 are the tables for Turner Rise; Tables 32 to 40 are the tables for Peartree
Road; and Table 41 to 49 are the tables for Highwoods. These tables follow the same
arrangement as the tables for Tollgate.
▪ Tables 50 to 57 are the tables for Tiptree and follow the same arrangement as the tables
for Colchester Town Centre.
▪ Tables 58 to 66 are the tables for Non-central stores in the Borough and follow the same
arrangement as the tables for Tollgate.
Limitations of retail capacity forecasting
4.10 It is important to note that the updated retail capacity forecasts serve only as a guide for future
planning policies and decisions on planning applications. They are not prescriptive and the
further ahead the forecasting date, the less certain the forecasts. Of particular note, the Council
should be aware that capacity forecasts beyond five years should be treated with caution, as
they are based on various assumptions and forecasts that can and will change. Forecasting

21
accuracy, even over the next five years, is further uncertain due to the change in macro-
economic conditions and the impact of Covid-19.
Baseline Evidence
4.11 The baseline evidence used for this updated assessment has been obtained from reliable
sources and is as up-to-date as possible; while our interpretation and analysis of such evidence
is based on our professional judgements and experience of retail capacity forecasting.
Catchment area
4.12 We have adopted the same catchment area (and zones) as the 2016 Study. The catchment area
zones are based on postcode geography53 and extend beyond Colchester Borough’s
administrative boundary to reflect shopping patterns and expenditure flows.
4.13 A map of the catchment area showing the 9 zones is included at Appendix C.
Base and forecasting years
4.14 We have used 2020 as the base year for our updated forecasts. The model therefore provides
estimates of current sales in Colchester Town Centre, each of the District Centres, and Non-
central stores in the Borough as at 2020. As agreed with the Council, we have prepared capacity
forecasts at 2023, 2028 and 2033 (so as to cover the forthcoming plan period).
Catchment population
4.15 The starting point for the population forecasts is a report, dated October 2020, commissioned
from Precisely (formerly Pitney Bowes) on the current and projected future population of each
catchment area zone. The result is that, for the catchment area as a whole, the population is
expected to increase from 508,121 in 2020 to 554,168 by 2033 (representing an increase of
about 9%).
Price basis
4.16 All monetary values in this Update are in constant 2019 prices, unless otherwise stated.
Per capita expenditure
4.17 The report commissioned from Precisely sets out estimated average per capita expenditure on
comparison and convenience goods in each catchment area zone for 2020, together with
forecasts for 2023, 2028 and 2033. These estimates and forecasts take account of differences
in average per capita expenditure on comparison and convenience goods from zone to zone.
The resulting estimates and forecasts of per capita expenditure on both comparison and
convenience goods, including expenditure on Special Forms of Trading, are set out in the top
half of Table 2 at Appendix B.
4.18 The forecast growth in per capita expenditure in Table 2 is specific to the catchment area. The
use of such local growth forecasts is expected to be more reliable than relying on national
forecasts. Notwithstanding, they broadly reflect the UK-wide trend of slower expenditure
growth (particularly on comparison goods) in the short to medium term.
Special Forms of Trading (SFT)
4.19 We have made deductions from the per capita expenditure figures supplied by Precisely to
allow for expenditure via SFT. This includes online shopping, mail order and expenditure at
53 Refer to Table 1 at Appendix B for details of the relevant postcode sectors.

22
temporary market stalls; and is therefore expenditure not made in shops and stores. Table 2
shows the growing deductions we have made.
4.20 We have applied an SFT deduction of 6.5% for convenience goods expenditure in 2020,
increasing to 8% by 2033. Our SFT deductions for comparison goods expenditure are much
greater; from 20% in 2020 to 25% by the end of the forecasting period.
4.21 These deductions are based on our professional judgements54 at this moment in time. The
outlook is fast-changing and subject to the potential future impact of Covid-19 on shopping
habits (including online shopping), the influence of SFT may be far greater. This underlines
the need to review the retail capacity forecasts on a regular basis.
Total available expenditure in the catchment area
4.22 The effect of slower expenditure growth in the catchment area combined with increasing
expenditure via SFT (i.e. online shopping) is that there is substantially less expenditure
available to support new retail floorspace relative to the levels forecasted in the 2016 Study.
This is particularly the case for comparison goods floorspace.
4.23 To illustrate this, Table 3 at Appendix B shows that total catchment area comparison goods
expenditure is forecast to reach £1,684m by 2023, rising to £2,082m by 2033. These latest
forecasts are much lower than those set out in the 2016 Study for the same forecasting years:
£2,031m and £2,799m respectively.
Shopping patterns in the catchment area
4.24 For the purposes of this Update, we have relied on the 2016 household survey of shopping
patterns in the catchment area – the results of which are contained in the 2016 Study55.
4.25 The household survey covered the area shown on the map in Appendix C, which was divided
into the 9 zones shown on that map. It asked questions about households’ shopping habits for
main food and top-up food (i.e. convenience goods56) shopping, along with questions about
shopping habits for the following sub-categories of comparison goods:
▪ clothing and footwear;
▪ furniture and floor coverings;
▪ household textiles and soft furnishings;
▪ household appliances;
▪ audio-visual equipment;
▪ hardware, DIY goods and decorating supplies;
▪ chemist/medical goods and beauty products; and
▪ personal and luxury goods (e.g. books, jewellery, watches, china, glassware).
4.26 Although the household survey was undertaken approximately four years ago, we have agreed
with the Council that it remains a reliable basis on which to prepare updated retail capacity
forecasts for the following principal reasons:
54 Supported by information for the UK published by Oxford Economics (derived from Precisely’s up-to-date Retail Expenditure Guide 2020/21) and Experian Retail Planner Briefing Note 17. 55 Appendix A. 56 Includes food, alcoholic drinks, tobacco products, newspapers and periodicals, and non-durable household goods.

23
a) There has been limited new retail development in Colchester Borough since the 2016
household survey while the likely impact of such development on shopping patterns can
be addressed through market share updates (as described below); and
b) It is considered that the impact of the Covid-19 pandemic on town centre footfall and
consumer shopping habits would potentially undermine the reliability of any new
household survey undertaken at this time.
Market share updates
4.27 Our starting point for information on market shares (i.e. shopping patterns) in the catchment
area is the results of the 2016 household survey. Since that survey, limited new retail
development has come forward and there have been some notable occupier changes.
4.28 We have updated the survey-indicated market shares to take into account those new (post-
2016) retail developments and key occupier changes that, based on our professional
judgements, are likely to have altered the pattern of market shares of expenditure attracted by
a particular shopping destination; thereby seeking to make the market shares represent reality
more accurately.
4.29 We assess that no market share updates are necessary for Colchester Town Centre other than
to incorporate the 2016 Study adjustments for the opening of Primark (Lion Walk). There have
been no further significant changes in retailer representation.
4.30 Similarly, no market share updates have been made in respect of Tollgate. Changes in retailer
representation since the 2016 Study include the opening of a new Hobbycraft; Staples / Office
Outlet closing down; and Tapi Carpets replacing Carpets 4 Less. On balance, we consider these
changes are unlikely to have materially altered the overall pattern of market shares of
comparison goods expenditure attracted from the catchment area.
4.31 We assess that some market share updates are necessary for Turner Rise. To that end, we have
updated the comparison goods market shares (Table 24) to reflect that Poundland and Carpets
4 Less are now trading from the stores previously occupied by We Do Home and Bathstore
respectively at the time of the 2016 household survey. In particular, we have slightly increased
the market shares of expenditure on furniture and floor covering (Q5), household textiles and
soft furnishings (Q6) and hardware, DIY goods and decorating supplies (Q9) from some of the
zones. Some of this increased expenditure may have been redistributed from the Homebase
store on St Andrew’s Avenue, which closed in 2018 (considered further below).
4.32 No market share updates are necessary for Peartree Road, Highwoods and Tiptree.
4.33 With regards to Non-central stores in the Borough, we have updated the comparison goods
market shares (Table 59) to reflect the closure of Homebase at St Andrew’s Avenue.
Specifically, we have ‘stripped out’ the market shares of expenditure on furniture and floor
covering (Q5), household textiles and soft furnishings (Q6) and hardware, DIY goods and
decorating supplies (Q9) as indicated by the 2016 household survey.
4.34 We assess that no further market share updates are necessary. This includes the survey-
indicated market shares of convenience goods expenditure following the opening of two new
‘non-central’ Lidl foodstores on Gosbecks Road and Abbot’s Road respectively. For the
purposes of this Update, we have assumed that this new provision has not materially altered
the pattern of market shares attracted by Non-central stores in the Borough (i.e. there will be
some redistribution of convenience goods expenditure most likely affecting the Aldi foodstores
but the overall pattern of market shares as shown in Table 58 is broadly unchanged).

24
Market share corrections
4.35 The 2016 household survey provides a detailed picture of where households in each of the 9
catchment area zones do ‘most of’ their shopping for convenience goods and the different sub-
categories of comparison goods. This is common practice for a survey of this nature, since it is
not practical to ask respondents to quantify how much they spend on various goods, and where
and how often. Thus the results of the household survey (with the market share updates
described above) do not directly indicate actual expenditure flows, but are the best available
data to use as a proxy for modelling retail expenditure flows from residential areas to shopping
destinations. However, like all such surveys, this means that its results cannot be applied
uncritically: they tend to over-emphasise comparison goods shopping in large centres and
under-state such shopping trips to small centres57.
4.36 It is therefore necessary to introduce market share correction factors so as to transfer
expenditure in the model from one or more locations to others, to balance (or calibrate) the
model and make it represent reality more accurately58 based on our professional judgements.
Such correction factors were used for the 2016 Study and are necessary for the purposes of this
Update.
4.37 To that end, in respect of Colchester Town Centre, use of the comparison goods market shares
from the 2016 household survey without correction would generate an unrealistically high
sales density for the Town Centre; in view of its size and comparison goods retailers. We have
therefore reduced the survey-indicated comparison goods market shares for every catchment
zone by the market share correction factor of 80% indicated at the top of Table 8 (i.e. we have
reduced them by 20% from the no-change default factor of 100%). In terms of convenience
goods market shares in Colchester Town Centre, we consider it necessary to introduce a market
share correction factor of 140% (i.e. we have increased them by 40%) because, in our view, the
market shares derived from the 2016 household survey do not provide a realistic convenience
goods sales density for the Town Centre.
4.38 Adjustments for the other shopping destinations modelled are indicated in the equivalent
tables at Appendix B.
4.39 These corrections to the survey-indicated market shares are based on our professional
judgements and, we consider, ensure the model is more realistic in terms of average sales
densities and the current market shares attracted from the catchment area.
Visitor expenditure
4.40 We have made allowances for visitor expenditure in Colchester Town Centre and Tollgate
District Centre59 as they are likely to secure some of their comparison goods expenditure (in
particular) from outside the catchment area. These allowances are the same as those assumed
in the 2016 Study, which we consider remain realistic.
Existing shop floorspace
4.41 The existing shop floorspace in the Borough’s centres is derived from the most recent Experian
Goad surveys in respect of Colchester Town Centre (November 2019) and Tiptree (June 2017);
57 This is confirmed by the now revoked DCLG ‘Practice Guidance’ which states, ‘Also, surveys that use simple questions about where people shop, provide answers that relate to trips and not spending flows. They can also overstate the importance of the larger centres and stores, and can understate the smaller and less frequently visited stores.’ (Appendix B, paragraph B.34). 58 There is an approximate correlation between the size of a centre and its average sales density, with larger centres generally having higher sales densities than smaller centres (and hence higher shop rental values). 59 We have made no such allowance for the other District Centres and Non-central stores in the Borough given that they are unlikely to secure significant expenditure from outside the catchment area.

25
and from the 2016 Study (updated by CPW Planning as required) for each of the other centres.
With regards to Non-central stores in the Borough, floorspace data has been sourced from the
2016 Study and our own desktop investigations.
Committed developments
4.42 We have included in the model the new retail floorspace expected to result from a number of
committed developments in the Borough. These are identified in Figure 4.1 below.
Figure 4.1 – Committed new retail floorspace
Colchester Town Centre
Convenience Goods:
Alumno Site, Queen Street (application ref. 182120)
Former Co-op Department Store, Long Wyre Street (application ref. 170424)
Tollgate
Convenience Goods:
Tollgate Village (application ref. 150239)
Aldi, Stane Retail Park, Stanway (application ref. 193163) [1]
M&S Food Hall, Stane Retail Park, Stanway (application ref. 193163) [1]
Comparison Goods:
Tollgate Village (application ref. 150239)
B&Q, Stane Retail Park, Stanway (application ref. 193163) [1]
Other Bulky Goods Stores, Stane Retail Park, Stanway (application ref. 193163) [1]
Non-central stores in the Borough
Convenience Goods:
Lidl, Former Homebase, St Andrew’s Avenue, Colchester (application ref. 183130)
Sainsbury’s, assumed to replace B&Q Extra, Lightship Way (application ref. 143715) [2]
Comparison Goods:
Sainsbury’s, assumed to replace B&Q Extra, Lightship Way (application ref. 143715) [2]
Notes:
[1] Although not technically part of Tollgate District Centre, Stane Retail Park will function as part of the same mixed-use shopping destination.
[2] We understand Sainsbury’s may not progress. However, the planning permission has been implemented (see application ref. 192094) and represents a realistic fall-back in terms of the potential scale and nature of ‘new’ floorspace.
4.43 Our assumptions pertaining to the convenience and/or comparison goods net floorspace and
sales capacity of these committed developments are set out in Tables 12 (for Colchester Town
Centre), 21 (for Tollgate District Centre) and 65 (for Non-central stores in the Borough) at
Appendix B.
4.44 There is vacant retail floorspace in some of the Borough’s centres, a proportion of which we
assess is likely, in certain locations, to be reoccupied for retail purposes. Our assumptions in
this respect take into consideration the reduced retailer demand (particularly from comparison
goods retailers) and the changes to the Use Classes Order, which provide more flexibility to
change from retail to other commercial, business and service uses. Our assumptions also
consider the location and quality of vacant retail floorspace.
4.45 Accordingly, we have included in the model at Appendix B a proportion of vacant retail
floorspace as committed development; specifically for comparison goods floorspace in
Colchester Town Centre (Table 12) and Tollgate District Centre (Table 2160). Given the very
60 The comparison goods floorspace identified forms part of the Tollgate Village scheme.

26
limited amount of vacant retail floorspace at the other shopping destinations modelled, no
such floorspace is identified as commitment development.
Growth in sales densities
4.46 We have assumed that both existing and new comparison goods floorspace will increase its
sales density by approximately 2% per annum throughout the forecasting period. This
allocates a proportion of the forecast growth in expenditure to existing shops and stores, before
new floorspace becomes necessary. Our judgements in this respect take into consideration
Precisely’s Retail Expenditure Guide 2020/21 and Experian Retail Planner Briefing Note 17.
4.47 We have made no allowance for increases in sales densities of convenience goods floorspace
over the forecasting period.

27
5 Retail Capacity Update: Forecasts
5.1 In this section, we set out and describe the updated retail capacity forecasts for the Borough’s
shopping destinations over the forecasting period to 2033.
5.2 We indicate the capacity for new convenience and comparison goods floorspace in Colchester
Town Centre; the District Centre’s of Tollgate, Turner Rise, Peartree Road, Highwoods and
Tiptree; and Non-central stores in the Borough.
5.3 Although we distinguish between the Borough’s Town and District Centres and ‘non-central’
locations, this is for the purposes of forecasting reliability and does not mean that any capacity
forecast for Non-central stores in the Borough should be accommodated in the form of out-of-
centre retail development. The sequential approach should be applied, with a preference for
town centres and then edge-of-centre locations, and only if suitable sites are not available
should out-of-centre sites be considered.
5.4 We would highlight that our forecasts represent the ‘baseline’ scenario for new retail floorspace
in the Borough, in which we assume that the 2016 pattern of market shares of convenience and
comparison goods expenditure in each of the Borough’s shopping destinations – indicated by
the 2016 household survey (adjusted by CPW Planning) – remains unchanged throughout the
forecasting period, notwithstanding the potential impact of committed developments on
shopping patterns and market shares over time.
Convenience Goods Floorspace
5.5 Our updated ‘baseline’ capacity forecasts for new convenience goods floorspace in the Borough
are summarised in Figure 5.1 below.
5.6 The forecasts are for future floorspace capacity after allowing for the committed developments,
including 3,763 sqm net convenience goods floorspace at Tollgate (i.e. Tollgate Village and
Stane Retail Park) and 4,872 sqm net convenience goods floorspace at Non-central stores in
the Borough61. These are significant commitments and result in ‘negative’ expenditure-based
capacity to support new convenience goods floorspace at these shopping destinations over the
plan period, as shown in the table below.
5.7 We would further note that:
a) The forecasts are on the assumption that where retailers are shown in the model to be
trading above or below estimated ‘benchmark’ company average levels, their sales
densities will fall or rise to that company average level. In reality, however, some stores
may continue to trade above or below benchmark levels.
b) The forecasts are on the assumption that potential new convenience goods floorspace
would be delivered in the form of new foodstores trading at a ‘generic’ average sales density
of £12,000 per sqm net. Some operators would trade above this level whilst other
foodstores (and convenience goods shops) would trade below. Therefore, the format in
which new convenience goods floorspace is provided will affect the amount of such
floorspace that can be supported in terms of expenditure-based capacity.
61 Sainsbury’s (assumed to replace B&Q Extra on Lightship Way) and Lidl (occupying the former Homebase store on St Andrew’s Avenue).

28
Figure 5.1 – Summary of retail capacity forecasts: convenience goods (sqm net sales area)
2023 2028 2033 Table number
(Appendix B)
Colchester Town Centre -150 100 350 13
Tollgate -2,350 -1,950 -1,600 22
Turner Rise -800 -500 -200 31
Peartree Road -50 50 50 40
Highwoods 100 350 550 49
Tiptree -300 -150 -50 57
Non-central stores in the Borough -3,900 -3,400 -3,000 66
Combined forecasts for
Colchester Borough
-7,450 -5,500 -3,900 n/a
Source:
Tables 1-66, Appendix B.
Notes:
a) The forecasts are ‘baseline’ forecasts after allowing for the committed developments.
b) The forecasts are cumulative i.e. the forecasts for each year include the forecasts for the previous years and are not
additional to those earlier forecasts.
c) Forecasts rounded to the nearest 50 sqm net.
d) The grand totals (i.e. combined forecasts) may not exactly equal the sub-totals due to rounding.
5.8 Figure 5.1 shows that, whilst some of the Borough’s centres will have limited capacity for new
convenience goods floorspace towards the end of the plan period (Colchester Town Centre and
Highwoods in particular), the overall picture is that there will be a substantial theoretical over-
supply of such floorspace across the Borough. This is largely due to the significant
commitments at Tollgate and Non-central stores in the Borough.
5.9 No increases in market shares have been assumed as a result of these committed
developments. In practice, the potential new convenience goods floorspace coming forward
will be supportable in expenditure terms through the redistribution and/or ‘clawing-back’ of
expenditure from existing stores (some of which may be over-trading) in the catchment area.
Comparison Goods Floorspace
5.10 Our updated ‘baseline’ capacity forecasts for new comparison goods floorspace in the Borough
are summarised in Figure 5.2 below.
5.11 Again, it is important to highlight that the forecasts are for future floorspace capacity after
allowing for the major committed developments at Tollgate in particular. This includes up to
14,920 sqm net comparison goods floorspace associated with the Tollgate Village scheme and
the 13,748 sqm net which forms part of Stane Retail Park62. The forecasts also take into
account:
▪ the potential for a proportion of vacant retail floorspace in Colchester Town Centre to be
reoccupied as comparison goods floorspace (2,049 sqm net);
▪ the potential re-occupation of the 1,296 sqm net vacant retail warehouse (formerly Staples
/ Office Outlet) at Tollgate; and
▪ the 3,142 sqm net comparison goods floorspace potentially coming forward at Non-central
stores in the Borough through the re-use of the B&Q Extra on Lightship Way.
62 Namely the B&Q (excluding trade / non-retail sales and external space) and the ‘Other Bulky Goods Stores’.

29
Figure 5.2 – Summary of retail capacity forecasts: comparison goods (sqm net sales area)
2023 2028 2033 Table number
(Appendix B)
Colchester Town Centre 2,100 2,850 2,950 13
Tollgate -15,050 -14,650 -14,600 22
Turner Rise 50 200 200 31
Peartree Road 100 150 200 40
Highwoods -50 0 0 49
Tiptree 500 500 550 57
Non-central stores in the Borough 1,400 1,650 1,700 66
Combined forecasts for
Colchester Borough
-11,400 -9,850 -9,550 n/a
Source:
Tables 1-66, Appendix B.
Notes:
a) The forecasts are ‘baseline’ forecasts after allowing for the committed developments.
b) The forecasts are cumulative i.e. the forecasts for each year include the forecasts for the previous years and are not
additional to those earlier forecasts.
c) Forecasts rounded to the nearest 50 sqm net.
d) The grand totals (i.e. combined forecasts) may not exactly equal the sub-totals due to rounding.
e) The forecasts for Non-central stores in the Borough assume any new comparison goods floorspace would trade at a
typical average sales density for non-food retail warehouses. However, in the event that the forecast capacity or any
part of it can be accommodated in town centre or edge-of-centre format developments, the capacity would be less than
shown because town centre formats typically trade a higher sales densities than retail warehouses.
5.12 Figure 5.2 shows that, after allowing for commitments and for existing comparison goods
floorspace to become more efficient by 2% per annum from 2020 onwards (an assumption
applied to all shopping destinations modelled), there will be capacity to support new
comparison goods floorspace in Colchester Town Centre; amounting to about 2,100 sqm net
by 2023, rising to almost 3,000 sqm net towards the end of the plan period.
5.13 This forecast capacity is predicated on the market shares indicated by the 2016 household
survey (as corrected) remaining unchanged throughout the forecasting period and does not,
therefore, take into account the potential impact of the Tollgate Village and Stane Retail Park
committed developments on the Town Centre’s market shares of comparison goods
expenditure.
5.14 Largely as a result of these commitments, the combined Borough-wide ‘baseline’ forecasts
indicate that there will be a significant theoretical over-supply of comparison goods floorspace
throughout the plan period.
Use and Review of the Forecasts
5.15 As mentioned previously, the updated retail capacity forecasts serve as a guide for future
planning policies and decisions on planning applications. Whilst we have applied the most up-
to-date baseline evidence available, the forecasts are based on a number of assumptions and
are intended only as an indication of the likely order of magnitude of retail floorspace capacity
(if forecast trends are realised) rather than as prescriptive maximums or minimums.
5.16 The forecasts should be reviewed regularly in the light of actual population and (in particular)
expenditure growth, the outlook for which is subject to change given Covid-19 and the macro-
economic conditions. It will also be important to review the forecasts as and when committed
developments come forward and their effects become more measurable.

30
6 Commercial Leisure Audit
6.1 As our commentary and analysis in section 2 of this Update has set out, leisure uses and
experiences are an integral part of successful town centres. Given the continued growth of
online shopping it is increasingly important for town centres to diversify ‘beyond retail’ by
offering a range of leisure, entertainment and cultural activities that can help to attract visitors,
improve dwell times and, significantly, support their retail function.
6.2 Therefore, in accordance with the brief issued by the Council, we identify the current supply of
key leisure facilities in the Borough by type and location. Our review is informed by Experian
Goad’s latest survey data for Colchester Town Centre, the findings of the 2016 Study, and our
own desktop research.
6.3 We further identify the commercial leisure developments currently proposed in Colchester
Borough (specifically those with extant planning permission and any applications yet to be
determined by the local planning authority).
Colchester Town Centre
6.4 Our healthcheck audit included at Appendix A finds that Leisure Services are the second most
dominant use category in Colchester Town Centre behind Comparison Retail. Of the 152 units
accommodating Leisure Services, 128 units comprise food and beverage (F&B) uses.
6.5 Against this background, Figure 6.1 below provides a breakdown of existing F&B provision in
Colchester Town Centre.
Figure 6.1 – Food & Beverage Provision, Colchester Town Centre
Category Floorspace
(sqm gross)
Units
(count)
% of Total Leisure
Floorspace
% of Total Leisure
Units
Average Unit Size
(approx. sqm gross)
Bars & Wine Bars 3,614 15 18.1 11.7 240
Cafes 4,794 41 24.0 32.0 120
Fast Food & Take Away 2,954 28 14.8 21.9 110
Public Houses 3,530 13 17.7 10.2 270
Restaurants 5,045 31 25.3 24.2 160
TOTAL 19,937 128 100 100
Source:
Figures derived from Experian Goad Category Report for Colchester Town Centre (November 2019).
6.6 Our main observations include:
▪ F&B uses account for almost 20,000sqm (gross) of floorspace, which is approximately 17%
of the total amount of floorspace in Colchester Town Centre.
▪ Additional F&B uses – particularly restaurants e.g. ASK Italian, North Hill Noodle Bar,
Middletons Steakhouse & Grill – are focused on North Hill / North Station Road located
just beyond Experian Goad’s survey boundary. Actual F&B provision in the Town Centre
is therefore under-stated in the table above.
▪ Average unit sizes range from 110sqm to 270sqm (gross), with cafes and fast-food outlets
unsurprisingly comprising the smallest units.
▪ The number of units occupied by bars, cafes and restaurants has increased relative to the
survey findings of November 2015 (set out in the 2016 Study); when there were 13 bars,
32 cafes and 28 restaurants. The number of public houses has remained the same (13)
while the 2016 Study does not identify the number of fast-food outlets.

31
▪ The offer comprises a mix of national ‘chain’ and independent operators. The family-
friendly casual dining sector is particularly well represented.
▪ As commented previously, new F&B representation since the 2016 Study includes three
restaurants at Greytown House on High Street (namely Five Guys, Wagamama and Turtle
Bay). These new restaurants complement other nearby provision such as Bills, Pizza
Express, El Guaca and Mirra.
6.7 Colchester Town Centre has a range of other commercial leisure facilities.
6.8 The cinema offer is particularly important in terms of its contribution to the evening economy
and supporting retail uses. There are two cinemas: Odeon (Head Street)63 with 8-screens and
seating capacity for 1,257 persons; and Curzon (Queen Street) which opened in July 2018 and
includes 3-screens, offering a more premium cinema experience.
6.9 Colchester Town Centre also includes two theatres: Mercury Theatre (Balkerne Gate) and
Headgate Theatre (Chapel Street North). Mercury Theatre is undergoing refurbishment works
as part of the £9m ‘Mercury Rising’ project, which has been delayed due to the Covid-19
pandemic but is nearing completion and scheduled to re-open in Autumn 2020 (subject to
Covid-19 restrictions) with a new box office, café/bar, dance studio, and dedicated learning
and rehearsal spaces. Headgate Theatre is also temporarily closed to the public.
6.10 Other key leisure facilities in the Town Centre include:
▪ Buzz Bingo (previously Gala Bingo), Osbourne Street;
▪ The Gym (health and fitness club), Queen Street; and
▪ Firstsite (visual arts venue), Lewis Gardens, High Street.
Proposed new commercial leisure development: Colchester Town Centre
6.11 There are no major proposals for new commercial leisure development in Colchester Town
Centre.
6.12 Planning permissions have been granted for potential leisure uses on Long Wyre Street (ref.
170424) and at the Alumno Site on Queen Street (ref. 182120). The latter allows for A3/A4/D2
uses as part of flexible commercial floorspace not exceeding 1,200 sqm. The site of the former
Co-op department store on Long Wyre Street is currently the subject of residential-led
development and the planning permission allows for five A3 restaurant units (2,098 sqm),
although we understand these are unlikely to come forward.
Elsewhere in the Borough
6.13 Our healthcheck audits included at Appendix A identify the extent of existing F&B uses in the
Borough’s District Centres. Provision is relatively limited and complementary to the retail
offers.
6.14 A notable change since the 2016 Study has been the opening of Stane Leisure Park in 2018. It
lies to the west of Tollgate District Centre and includes a McMullen’s public house, Starbucks
coffee shop, and two restaurants (occupied by KFC and Nando’s respectively). There are
currently two vacant restaurants.
6.15 Figure 6.2 below identifies other commercial leisure facilities in Colchester Borough.
63 The 2016 household survey indicated that 23.8% of residents in Colchester’s catchment area ‘last’ visited this cinema, more than any other competing cinema. This survey pre-dated the opening of the Curzon cinema.

32
Figure 6.2 – Commercial Leisure Facilities, Colchester Borough (excluding Town Centre)
Cinemas Location
Nightflix Drive-in Cinema [1] Tollgate West, Tollgate
Tenpin Bowling Location
Tenpin Cowdray Avenue
Gymnasiums / Health Clubs Location
Bannatyne Health Club
Bannatyne Health Club - formerly Clarice House
David Lloyd Leisure
Leisure World
Everlast Fitness Club - formerly Sports Direct Fitness
Anytime Fitness
Anytime Fitness
You Fit - formerly Spirit Health Club
Topnotch Health Club
Fitness 4 Less
Energie Fitness
Gym 4 U
Gymophobics
Pure Gym
Pump Gyms
Hercules Gym
YourZone45
Whitehall Industrial Estate, Grange Way
Kingsford Park, Layer Road
United Way, Mile End
Cowdray Avenue
Clarendon Way
Moss Road, Peartree Road
The Hythe, Haven Road
Abbotts Lane
Wyncolls Road, Highwoods
Wyncolls Road, Highwoods
Stanway Retail Park, Peartree Road
Peartree Road
The Mulberry Centre, Haven Road
Colchester Retail Park, Sheepen Road
Whitehall Industrial Estate, Grange Way
Colne Bank Avenue
Angora Business Park, Peartree Road
Other Active Leisure Facilities Location
Rollerworld & Quasar (roller skating and laser tag)
Colchester Climbing Project (indoor climbing)
Jump Street (trampolining)
Go Bananas (soft play)
Childsplay Adventureland (soft play)
Jungle Adventure (soft play)
Colchester School of Gymnastics (gymnastics club)
Iceni (gymnastics club)
Eastgate Industrial Estate, Moorside
Globe Park, Moorside
Cowdray Centre, Mason Road
Cowdray Centre, Mason Road
Clarendon Way
Stanway Retail Park, Peartree Road
Brinkley Grove Road, Mile End
Moss Road, Peartree Road
Notes:
Facilities that have opened since the 2016 Study are highlighted.
[1] Nightflix Drive-in Cinema is a pop-up cinema concept on the former Sainsbury’s site.
Source:
CPW Planning research and the 2016 Study.
6.16 As shown in the table above, Colchester Borough currently has one tenpin bowling venue:
Tenpin64 located on Cowdray Avenue. Other active leisure facilities include roller skating and
laser tag (Rollerworld & Quasar) and indoor climbing (Colchester Climbing Project), both
situated within industrial warehouse accommodation at Moorside. The Borough is well served
by gymnasiums / health clubs, with several new openings since the 2016 Study.
Proposed new commercial leisure development: Elsewhere in the Borough
6.17 There are major proposals for new commercial leisure development in Colchester Borough,
particularly at Tollgate (Stanway) and North Colchester, as identified below.
▪ Tollgate Village (Stanway): Reserved matters approved for a retail-led scheme including a
multiplex cinema (to be operated by The Light), a tenpin bowling facility, and 2,100 sqm
gross of A3/A4/A5 food and beverage uses.
▪ Northern Gateway (North Colchester): Extant planning permission for a new leisure-based
scheme including a 12-screen cinema (to be operated by Cineworld), a hotel, three large
64 Includes 24 bowling lanes, pool tables and amusement arcades.

33
format active leisure units (D2), and 4,548 sqm of A3/A5 food and beverage uses. A revised
application involving less A3/A5 floorspace and more D2 floorspace65 is awaiting
determination.
6.18 There are additional, small-scale leisure uses consented as part of the Stane Retail Park
development (namely A3/A4/A5 food and beverage uses not exceeding 327 sqm) while Lidl
has submitted a revised application for the sub-division of the former Homebase store on St
Andrew’s Avenue to include a new A3/A5 use.
Conclusions
6.19 Overall, we consider that the quantity and quality of commercial leisure provision in Colchester
Town Centre and elsewhere in the Borough to be reasonably strong. The F&B offer is
substantial and it remains to be seen whether the operator ‘failures’ and downsizing in this
sector will have implications for existing provision in Colchester and/or the committed
developments at Tollgate Village and Northern Gateway. However, the restaurant vacancies at
Stane Leisure Park and within the Curzon cinema scheme in the Town Centre are perhaps an
indication of market saturation.
6.20 The Borough’s cinema offer has improved since the opening of Curzon (Queen Street), which
is likely to have reduced the level of cinema participation ‘leakage’ beyond Colchester Borough
as identified in the 2016 Study. The proposed new cinemas at Northern Gateway (Cineworld)
and Tollgate Village (The Light) will further diversify the cinema offering.
6.21 We assess that the Borough is well served by gymnasiums / health clubs and other active leisure
facilities such as indoor climbing, roller skating and laser tag. A new indoor climbing facility is
proposed as part of the Northern Gateway scheme, while the tenpin bowling facilities proposed
at Northern Gateway and Tollgate Village will provide choice beyond the existing venue
(Tenpin) on Cowdray Avenue.
6.22 In the light of the above, we do not consider the Council should allocate sites for major new
commercial leisure provision in the Borough. There are no obvious quantitative or qualitative
‘gaps’ based on existing supply and the proposed new commercial leisure developments
identified in this section. That said, leisure uses will continue to form an important part of
mixed-use schemes and the Council should plan positively and flexibly for such uses in
appropriate locations. Specific operator-led proposals should be considered on their merits
having regard to the development plan and other material considerations.
65 Comprising indoor golf (Puttstars), indoor climbing (Jump Street) and ten-pin bowling (Hollywood Bowl).

34
7 Opportunities for Growth and Change
7.1 NPPF 2012 requires local planning authorities to allocate sites to meet the needs for retail and
other main town centre uses in full66.
7.2 Section 5 of this Update considers the quantitative capacity (or need) for new retail floorspace
in Colchester Borough over the plan period. It identifies that, whilst some of the shopping
destinations (including Colchester Town Centre) will have limited capacity to support new
retail floorspace, the overall picture (Borough-wide) is that there will be a theoretical over-
supply of floorspace. This is largely due to the major committed developments, particularly at
Tollgate and Non-central stores in the Borough.
7.3 Given there is no robust method of quantifying the floorspace need for other main town centre
uses67 we have undertaken a commercial leisure audit (section 6) and sought to examine, in
qualitative terms, the increasingly important role of non-retail uses in achieving a balanced
mix of uses and ‘experiences’ and ensuring the vitality of town centres (section 2 in particular
and supported by the updated healthcheck audits at Appendix A).
7.4 Against this context we set out below our commercial review of potential development
opportunities. In accordance with our instructions, our assessment is focused on the relevant
Colchester Town Centre ‘allocations’ under Policy TC3 of the emerging Local Plan. Our high-
level assessment considers the potential of each site to accommodate retail and other main
town centre uses.
7.5 For the avoidance of doubt, our commentary on each site does not predetermine any particular
form of development; this will be a matter for the decision-maker (having regard to the
development plan and other material considerations) should proposals come forward. Further,
our assessment is not informed by feasibility studies to better understand the development
potential of a site and its constraints, or any appraisals to test financial viability. It is, however,
an appropriate basis on which to validate or suggest any revisions to Policy TC3 of the emerging
Local Plan (which we address in section 8 of this Update).
Vineyard Gate
7.6 The site lies within the southeast part of the Town Centre, with the Roman Wall to the north
and Osbourne Street to the south. It extends to approximately one hectare and sits
considerably lower than Eld Lane to the north (beyond the Roman Wall).
7.7 Situated nearby is Colchester bus station and Colchester Town rail station, and the ‘gateway’
credentials of the site would be enhanced further with the planned introduction of the Rapid
Transit System (expected to be operational by 2024).
7.8 A large portion of the site is currently used as a surface level car park. It is understood that the
entire site is owned by the Council, with remaining occupiers under short-term leases with
break clauses.
7.9 The site is identified in the St Botolph’s Quarter Masterplan (June 2005) as a key development
site for prime retail development to create an active and efficient extension of the Town
Centre’s retail circuit. At the time of the 2016 Study, the site represented a long-standing
Council priority for retail-led redevelopment. The retail market in the UK has changed
significantly since then, however, and there is growing competition from nearby shopping
66 Paragraph 23, sixth bullet. 67 In the same way there is for retail (and offices).

35
destinations. As a result, the Council is now focused on delivering a residential-led mixed use
scheme including public realm to showcase the site’s heritage features.
7.10 We consider that a residential-led mixed use scheme, which enhances the level of connectivity
with Eld Lane to the north, would revitalise this part of the Town Centre. It would act as a
catalyst for inward investment and generate additional footfall to support retail and non-retail
businesses. Other potential uses could include cultural, visitor and/or community facilities;
flexible office and/or workshop space; and retail and/or leisure services.
St Botolph’s
7.11 The site is situated to the east of Queen Street on the eastern edge of the Town Centre. It
benefits from good pedestrian connections to/from High Street, Culver Street East, and Priory
Walk.
7.12 The site includes the Roman House building and adjacent derelict land (Alumno Site).
7.13 The mixed-use regeneration of the site has been a long-standing Council objective. The St
Botolph’s Quarter Masterplan (June 2005) promotes the site for new cultural, retail, residential and visitor facilities including a visual arts venue (which was completed in 2011 in
the form of Firstsite) and restaurant, café and arts related uses.
7.14 It is important to highlight that, since the 2016 Study, the Curzon cinema scheme has opened
within the repurposed Roman House building; while planning permission has been granted on
appeal for the redevelopment of the Alumno Site for student accommodation, hotel, artist
studios, and flexible commercial floorspace.
7.15 We assess that the Curzon cinema scheme has contributed towards the improvement of the
Town Centre’s leisure offer since the 2016 Study. However, the scheme includes two vacant
restaurants at ground floor level, which is perhaps a consequence of the ‘downsizing’ trend in
the restaurant sector68 and/or an indication of market saturation69.
7.16 The planned redevelopment of the Alumno Site would further revitalise this part of the Town
Centre. In particular, we consider the new population arising from the student
accommodation, together with users of (and visitors to) the hotel and other commercial uses,
would have a positive impact on levels of footfall and activity. It would help to create the
conditions necessary to reposition and attract investment in the surrounding area, including
Priory Walk (considered further below).
Priory Walk
7.17 Priory Walk is a secondary shopping centre situated between Queen Street and Long Wyre
Street to the east of the Town Centre. It is anchored by Sainsbury’s and has a declining number
of occupied retail units.
7.18 Our updated healthcheck audit of Colchester Town Centre70 identifies that the shopping centre
is in a poor state and in need of investment; and has an adverse impact on the environmental
quality of the surrounding streets. Therefore, there is considerable potential to improve its
contribution to the vitality of the Town Centre, either through reconfiguration and
refurbishment (with retail floorspace potentially forming a reduced component) or
comprehensive redevelopment.
68 See paragraphs 2.54-2.55 of section 2. 69 As noted in paragraph 6.19 of section 6. 70 Appendix A.

36
7.19 Any proposals should seek to retain Sainsbury’s, which is the Town Centre’s main supermarket
and performs an important role catering for the main food and (more likely) top-up food
shopping needs of town centre users.
7.20 Significantly, the site is bookended by recent investments in the form of the Curzon cinema
scheme71 to the east and the St Nicholas Quarter residential-led development on Long Wyre
Street to the west, creating more favourable conditions for much-needed investment in Priory
Walk.
7.21 The delivery of a mixed use scheme – potentially including retail, flexible commercial and/or
community uses at ground floor with residential uses above – would complement nearby
recent investments and planned redevelopment, and help to attract further investment in this
part of the Town Centre.
71 In addition to the planned redevelopment of the Alumno Site.

37
8 Policy Recommendations
8.1 As part of our instructions on this Update, the Council has asked that we provide advice on a
suite of policies set out in the emerging Local Plan. These are:
▪ Policy SG5 (Centre Hierarchy)
▪ Policy SG6 (Town Centre Uses)
▪ Policy TC1 (Town Centre Policy and Hierarchy)
▪ Policy TC2 (Retail Frontages)
▪ Policy TC3 (Town Centre Allocations)
▪ Policy NC1 (North Colchester and Severalls Strategic Economic Area)
▪ Policy WC1 (Stanway Strategic Economic Area)
8.2 This section specifically considers whether these policies, as currently drafted and in the
context of NPPF 2012, are fit-for-purpose or whether any revisions are necessary in response
to the updated evidence base72.
8.3 Our policy recommendations will be incorporated into the Council’s Topic Paper 4 (Retail and
Town Centre Policies) prepared to support the forthcoming examination.
8.4 Policy SG5 (including Table SG5a) defines Colchester Borough’s hierarchy of centres. It
states that the centres will be the preferred location for main town centre uses and identifies
three ‘tiers’ of centre (Town73 / District74 / Local Centres) and definitions for each.
8.5 We consider that the hierarchy of centres and their definitions are appropriate (supported by
the results of the 2016 household survey and the updated healthcheck audits at Appendix A).
Although there are major development proposals at Tollgate (i.e. Tollgate Village and Stane
Retail Park), we assess that it is not necessary or appropriate to change its position in the centre
hierarchy based on these proposals. We consider below how Policy SG6 and/or Policy WC1
can be used as a tool for managing future development in this location.
8.6 Policy SG6 is a development control policy for proposals comprising main town centre uses.
It sets out the sequential approach to site selection (consistent with paragraph 24 of NPPF
2012) and adds:
Sites should be assessed in terms of their availability, suitability and viability for the broad scale and type of development proposed; and only when alternative sites have been discounted should less sequentially preferable sites be considered.
8.7 We note the term “broad scale and type of development” is not used in NPPF 2012. All it
requires (in paragraph 24) is that local planning authorities should apply a sequential test to
planning applications for main town centre uses (where applicable) and that applicants and
local planning authorities should demonstrate flexibility on issues such as format and scale.
We would recommend the policy wording reflects these particular requirements.
8.8 The remainder of the policy relates to the impact test and matters of hierarchy. We deal with
each of the criteria in turn.
72 For the avoidance of doubt, we have not been instructed to comment on the supporting text (only the policy wording). 73 Colchester Town Centre. 74 Tiptree, West Mersea, Wivenhoe, Tollgate, Peartree Road, Turner Rise, and Highwoods.

38
8.9 Criteria (i/ii) wording seeks to ensure that proposals for main town centre uses are appropriate
in the context of the centre hierarchy (the definitions set out in Policy SG5 provide a basis for
assessment). This is a sound approach, in our view, although the Council should consider
making it clearer that the criteria relate specifically to proposals in and on the edge of the Town
and District Centres.
8.10 Criteria (iii) wording relates to the character or amenity of the area and is therefore beyond
the scope of this Update.
8.11 Criteria (iv/v) wording reflects the impact test set out in paragraph 26 of NPPF 2012. We
consider that no changes are necessary.
8.12 Criteria (vi) wording sets out when impact assessments are required, including when proposals
exceed the floorspace thresholds identified in Table SG6.
8.13 Paragraph 26 of NPPF 2012 makes it clear that the impact test only applies to proposals over
2,500 sqm unless there is a different proportionate, locally set floorspace threshold. The
thresholds shown in Table SG6 reflect those contained in the Specification for Retail
Assessments (December 2017) prepared by Cushman & Wakefield. It sets particular floorspace
thresholds for each Town and District Centre for comparison retail, convenience retail, and
leisure services.
8.14 We consider that a more simplified approach would be appropriate in the light of the
increasingly mixed-use nature of development proposals, including the trend toward space-
sharing by retailers and other operators75, which is likely to become more prevalent given the
changes in the retail sector and the introduction of the new Class E (which combines retail,
commercial, business and service uses).
8.15 Figure 8.1 below sets out revised thresholds which we consider should be the ‘trigger’ for
requiring impact assessments in respect of proposals for retail and/or leisure floorspace
outside the Town and District Centres.
8.16 Separate floorspace thresholds are recommended for Colchester, Tollgate, Peartree Road,
Turner Rise and Highwoods (i.e. within the Colchester Urban Area) and for Tiptree, West
Mersea and Wivenhoe (i.e. outside the Colchester Urban Area). The thresholds consider the
scale of any future proposals relative to the centres and the likely cumulative effects of
committed developments previously identified in this Update.
Figure 8.1 – Floorspace thresholds for impact assessments in the Borough
Centre Retail and/or leisure floorspace (sqm gross)
Colchester
Tollgate
Peartree Road
Turner Rise
Highwoods
1,500
Tiptree
West Mersea
Wivenhoe
1,000
8.17 Those centres within the Colchester Urban Area are larger and/or include larger unit sizes.
They tend to have a trading overlap in terms of their market shares of catchment area
expenditure and are more likely to be affected by the committed developments (to varying
75 See paragraphs 2.37-2.42 of section 2.

39
degrees). In contrast, the District Centres of Tiptree, West Mersea and Wivenhoe are smaller,
more localised ‘rural’ centres; and we assess that a lower floorspace threshold is necessary
given their greater reliance on smaller format convenience goods shops and small-scale service
uses.
8.18 Given the impact test only applies to development outside of town centres, which are not in accordance with an up-to-date Local Plan (paragraph 26 of NPPF 2012), we recommend that
the criteria (vi) wording is updated to reflect this.
8.19 Policy TC1 supports the role of Colchester Town Centre at the top of the centre hierarchy and
as the priority focus for new Town Centre uses and larger scale development. Its support for
a diverse mix of uses is consistent with the findings of this Update in that, whilst retail (and
comparison goods retail in particular) should remain a key driver of activity in Colchester Town
Centre, the need for a complementary mix of non-retail (including evening economy)
attractions is increasingly important in the context of reduced retailer demand and consumers’
preference for all-round experiences.
8.20 We consider the policy is sufficiently flexible to respond to these trends; and is compatible with
the Government’s intention to support the adaption of high streets through the introduction of
Class E. To that end, the Council should consider including reference to shared mixed-use
spaces and meanwhile uses76 that can positively contribute towards the vitality of the Town
Centre.
8.21 Policy TC2 is the policy for primary and secondary frontages in Colchester Town Centre. It
therefore seeks to address paragraph 23 (third bullet) of NPPF 2012.
8.22 Policy TC2 seeks to maintain at least 70% A1 retail use on primary frontages and at least 50%
A1 retail use on secondary frontages; unless non-viability of A1 retail use can be demonstrated
(inter alia). Notwithstanding the introduction of the new Class E77, we assess that setting
minimum percentage thresholds is too rigid and inflexible. As an approach it can lead to
unintended consequences and does not seem to be entirely consistent with the provisions of
Policy TC1.
8.23 At a time when the Town Centre is faced with rising vacancy levels and a reduction in
comparison goods retailers78, as well as evidence of declining footfall (particularly due to the
Covid-19 pandemic79), we consider the most appropriate policy response involves a greater
level of flexibility for changes of use within the primary and secondary frontages.
8.24 We would therefore recommend that the policy wording is updated to remove the minimum
percentage thresholds for A1 retail use (including the requirement for “extended marketing (over 1 year)” to demonstrate non-viability of A1 retail use). However, to ensure the vitality of
the Town Centre, it would remain appropriate for the Council to seek to control the mix of uses
based on a series of qualitative criteria including those set out in Policy TC2.
8.25 Such criteria would allow for complementary non-retail uses to be provided in appropriate
locations. In order to recognise that primary frontages should include a high proportion of
retail uses (relative to secondary frontages80), the Council should consider including a further
76 Section 2 of this Update identifies the growing demand for such activity. 77 The permitted development rights introduced by the Government, allowing for certain changes of use without the need for planning permission, further restrict the ability of the Council to effectively control the Town Centre’s shopping frontages. 78 Since the 2016 Study. 79 As identified in the updated healthcheck audit of Colchester Town Centre at Appendix A. 80 See definition of “Primary and secondary frontages” (Annex 2, NPPF 2012).

40
criteria requiring that proposals should not harm the main retail function of the primary
frontages.
8.26 Policy TC3 identifies the Colchester Town Centre ‘allocations’ for retail and other main town
centre uses (i.e. Vineyard Gate, St Botolph’s and Priory Walk as considered in section 7
previously). The policy wording should be updated to reflect the following:
a) the updated retail capacity forecasts in section 5 are considerably lower than and
supersede those set out in the 2016 Study;
b) the Council’s strategy for Vineyard Gate has changed (since the 2016 Study) and is now
focused on delivering a residential-led mixed use scheme; and
c) the ‘need’ for retail and other main town centre uses will be addressed through the
Colchester Town Centre allocations, together with the more flexible policy response set out
previously.
8.27 Policy NC1 applies a zoned approach to planning for the future development of North
Colchester and Severalls Strategic Economic Area. Of particular relevance to the scope of this
Update is zone 2, which is identified for a leisure / community hub (inter alia).
8.28 Paragraph 24 of NPPF 2012 requires main town centre uses to be located in town centres, then in edge of centre locations and only if suitable sites are not available should out of centre sites be considered. However, it is understood that the “leisure / community hub” proposals
intend to complement the existing stadium and leisure facilities in the area and, providing the
Council is satisfied that more centrally located sites have been considered (and discounted) in
accordance with the sequential test, we would support the continuation of an approach where
North Colchester is identified for a leisure / community hub. We would further support the
restriction on retail uses included in the policy wording.
8.29 The policy also promotes a range of sport and recreation uses in zone 3 (subject to evidence
supporting the need for such uses and proposals being in accordance with an agreed
masterplan). Again, as an approach this is acceptable providing the Council is satisfied that the
requirements of the sequential test have been met for the purposes of plan-making.
8.30 Policy WC1 applies a zoned approach to planning for the future development of Stanway
Strategic Economic Area. The policy identifies zone 1 as the primary focus for B class employment uses and sets out a series of criteria for allowing non-B class uses.
8.31 It then adds main town centre uses will not be permitted in zone 1. Given that offices are main
town centre uses81 and the policy includes criteria for allowing alternative uses, we consider
that the restriction on “main town centre uses” is inconsistent with the Policy WC1 provisions
for zone 1 (when read as a whole) and should therefore be removed.
8.32 Zone 2 comprises Tollgate District Centre. The main thrust of the policy is similar to Policy
SG6 (criteria i/ii), in that it seeks to ensure that proposals are suitable for, and proportionate to, the role and function of the centre and its place within the hierarchy. Although we assess
that this is a sound approach, we would question whether it is necessary for Policy WC1 to
repeat the provisions of Policy SG6.
8.33 Policy WC1 further includes a series of criteria for allowing main town centre uses in zone 2
(i.e. Tollgate District Centre). We deal with each of the criteria in turn.
81 See definition of “Main town centre uses” (Annex 2, NPPF 2012).

41
8.34 Criteria (i) wording supports the introduction of new services and/or community facilities,
which we would support given the identified lack of such provision.
8.35 Criteria (ii) wording sets out the requirements of the sequential test consistent with paragraph
24 of NPPF 2012 and the provisions of Policy SG6.
8.36 Criteria (iii) wording reflects, in part, the impact test set out in paragraph 26 of NPPF 2012
and the provisions of Policy SG6 (specifically criteria iv). It omits reference to the other limb
of the impact test82 and the Council should consider including this.
82 Impact on “existing, committed and planned public and private investment…”.

42
9 Conclusions
9.1 This Update has been prepared by CPW Planning and provides the evidence base to assist the
Council with its work on the retail and town centre policies of the emerging Local Plan, and to
support the Council’s development management function. It supersedes the 2016 Study
prepared by Cushman & Wakefield.
9.2 In accordance with our instructions, the updated evidence base reflects the requirements of
and is compliant with the NPPF 2012 (against which the emerging Local Plan is being
examined).
9.3 The Update has been prepared in the context of the latest available information and recent
events, including the Covid-19 pandemic and changes to the Use Classes Order (i.e. Class E).
A further notable change since the 2016 Study has been the grant of planning permissions for
new retail and leisure floorspace in the Borough, in particular the major development
proposals at Tollgate (Stanway) and North Colchester.
9.4 To that end, the main objectives of this Update can be summarised as follows:
a) review national trends in the retail sector (particularly in response to Covid-19);
b) updated healthcheck audits of the Borough’s centres;
c) updated retail capacity forecasts in the light of committed developments and the latest
population and expenditure projections;
d) updated commercial leisure audit;
e) assess the potential to meet identified needs (as required by the NPPF 2012); and
f) identify any policy revisions in response to the updated evidence base.
9.5 We summarise below the main findings and conclusions of this Update.
National retail context and the potential implications for the Borough’s centres:
9.6 It is likely that the pandemic-induced restrictions on the retail, leisure and hospitality
industries will continue to have a significant impact on town centre footfall and activity. We
consider that Colchester Town Centre is particularly vulnerable given its exposure to ‘non-
essential’ fashion-orientated retailers, and reliance on leisure and hospitality (including the
evening economy), other cultural activities and office/retail workers to generate expenditure.
9.7 Several factors including slower expenditure growth projections, the continued growth of
online shopping, together with the scale of collapsed or ‘at risk’ retailers (and those downsizing
or relaunching as online-only brands), highlight the reality that many town centres have too
much retail space overall. We identify in section 3 of this Update the reduction in comparison
goods retailers and increasing vacancy levels in Colchester Town Centre, which should be taken
into account when planning for new retail – particularly comparison goods retail – floorspace
in the Town Centre.
9.8 The trend towards ‘right-sizing’ has led retailers (and increasingly leisure operators) to target
the most defensible and therefore high-demand locations, where footfall and consumer
spending is most resilient to economic changes. This is now affecting more and more larger
centres, as investors become increasingly selective and polarise towards fewer, prime retail
locations. The Borough’s centres have been reasonably stable in terms of retailer
representation since the 2016 Study (based on our updated healthcheck audits at Appendix A),
although the considerable reduction in comparison goods retailers in Colchester Town Centre
would suggest it is increasingly exposed and at risk to such trends.

43
9.9 A key challenge for Colchester Town Centre will be retaining and improving the mix of retailers
and other services. To achieve this, the Town Centre will need to (inter alia):
▪ create the right conditions for investment in areas currently lacking in environmental
quality (e.g. Priory Walk, St John’s Walk Shopping Centre) to complement the
improvements delivered – and planned – in other areas of the Town Centre (as identified
in section 3 of this Update);
▪ improve accessibility, public transport connections, and car parking;
▪ provide opportunities for flexible store formats with click-and-collect facilities and
servicing arrangements that meet the needs of modern retail businesses; and
▪ support a mix of retail and non-retail (including evening economy) attractions that are
distinguished from those available at competing shopping destinations, and which help to
increase dwell times and spend.
9.10 Diversifying beyond traditional retail offers will be necessary in the context of reduced retailer
demand. This underlines the important role of shared mixed-use spaces and meanwhile uses,
which provide interest and high-quality experiences that cannot be achieved online: town
centre strategies should therefore be flexible in supporting the evolution of the high street.
9.11 Like successful retail businesses, the Borough’s centres should look to integrate their physical
and digital propositions in response to ‘tech-savvy’ consumer expectations and an increasingly
competitive marketplace.
Updated healthcheck audits of the Borough’s centres:
Colchester Town Centre
9.12 Colchester Town Centre is the principal comparison goods shopping destination in the
Borough supported by a mix of non-retail uses and services. Although ‘major’ retailer
representation is broadly unchanged since the 2016 Study, notable changes in the Town
Centre’s performance over this period include.
▪ The number of comparison goods retailers has fallen considerably (from 241 to 190),
which represents a trend occurring in many centres across the UK but one that is
increasingly affecting larger centres such as Colchester;
▪ Vacancy levels are rising (from 10.5% of total ground floor premises to 14.5%) with some
prominent vacant premises at the east of the Town Centre in particular;
▪ Both footfall and car park stays have declined, especially during the Covid-19 crisis;
▪ The all-round leisure offer has shown signs of improvement with the opening of the Curzon
cinema scheme (Queen Street), alongside the new restaurants including at Greytown
House (High Street) and the refurbishment works to Mercury Theatre (Balkerne Gate);
▪ High Street has benefitted from the completion of public realm works (while further
improvements are proposed for St Nicholas Square and Balkerne Gate using the £1m
accelerated Towns Fund).
9.13 Overall, we assess that Colchester Town Centre continues to perform reasonably well against
many of the healthcheck indicators. Yet there are weaknesses and signs that the Town Centre
is increasingly vulnerable to structural changes in the retail sector and growing competition
from nearby shopping destinations. The current outlook and the committed developments at
Tollgate (Stanway) in particular, reinforce the need for measures to maintain the Town
Centre’s attractiveness and role as the principal mixed-use shopping destination in Colchester

44
Borough. This includes continued investment in the public realm and key opportunity sites
(including Vineyard Gate, Priory Walk and St John’s Walk Shopping Centre) to improve the
visitor experience and create a more vibrant, differential offer.
Tiptree
9.14 Tiptree District Centre continues to perform an important role in terms of serving the
convenience-based shopping and service needs of surrounding communities. It is supported
by three national supermarket chains – Asda, Iceland and Tesco – and includes a range of
independent retail service businesses, together with a medical centre, community centre and
library. Tiptree has a limited evening economy.
West Mersea
9.15 West Mersea District Centre provides a modest range of retail, service and community facilities
that cater for the day-to-day needs of local residents as well as the centre’s visitor function. The
retail offer is dispersed throughout the centre and is largely focused on convenience retail (the
main convenience stores are Tesco Express, Co-op and Spar). There is a library, post office and
sports/leisure centre, while the small number of independent cafes/restaurants provide a
limited evening economy.
Wivenhoe
9.16 Wivenhoe District Centre is a small, linear, and somewhat fragmented centre serving the basic
retail and service needs of local residents. There are two convenience stores (Co-op and One
Stop), a Boots (chemist), and a small number of independent shops selling ‘boutique’ clothing
and other personal goods. It serves an important localised role.
Tollgate
9.17 Tollgate is the Borough’s largest District Centre and has evolved from a predominantly ‘bulky’
retail park into an established, sub-regional shopping destination with extensive surface level
car parking. It includes a Sainsbury’s superstore and a substantial range of multiple
comparison goods retailers. Notwithstanding the limited changes to retailer representation
since the 2016 Study, we assess it remains the case that Tollgate has a strong influence over
shopping patterns across the catchment area (which extends well beyond Colchester Borough)
and directly competes with Colchester Town Centre for comparison goods expenditure.
9.18 The centre is lacking in terms of services and community facilities. It contains several food and
drink outlets, with additional provision at Stane Leisure Park to the west of the District Centre.
9.19 Considering this recent development (Stane Leisure Park) and the planning permissions
granted for major new retail and leisure floorspace (i.e. Tollgate Village and Stane Retail Park),
Tollgate is evidently a growing multi-purpose destination and competitor to Colchester Town
Centre.
Peartree Road
9.20 Peartree Road District Centre comprises large format comparison goods stores and
warehouses selling predominantly ‘bulky goods’ (exceptions include Poundstretcher and
Barnardo’s). The centre also includes a Co-op convenience store, Domino’s Pizza, Greggs
(bakery), and some active leisure uses (e.g. gymnasiums).
Turner Rise
9.21 Turner Rise District Centre comprises a large Asda superstore and a purpose-built retail park
with large format stores. There are several ‘value’ comparison goods retailers such as
Poundland, Home Bargains and Dunelm. Consistent with the 2016 Study, there are no vacant

45
units; no independent retailers; while services are limited to food and drink outlets (namely
Pizza Hut, Costa Coffee and Subway) and the Asda in-store optician, pharmacy, and café.
Highwoods
9.22 Highwoods District Centre is dominated by a Tesco Extra superstore with in-store concessions
including a pharmacy, print shop, café, and the Florence & Fred clothing range. It therefore
functions primarily as a main food shopping destination for surrounding communities. Other
uses within the adjacent shopping centre are predominantly independent businesses (e.g.
newsagents, dry cleaners, hairdressers).
Non-central locations
9.23 There are additional facilities outside the centre hierarchy in the form of retail parks (e.g.
Colchester Retail Park, Colne View Retail Park), ‘solus’ large format retail warehouses,
foodstores, and commercial leisure facilities.
9.24 A major new leisure-based scheme is proposed at Northern Gateway (North Colchester)
including a 12-screen Cineworld, a hotel, three large format active leisure units (D2), and
A3/A5 food and beverage uses.
Updated retail capacity forecasts:
9.25 Our forecasts for the Borough’s shopping destinations over the forecasting period to 2033
represent the ‘baseline’ scenario for new retail floorspace in the Borough, in which we assume
that the 2016 pattern of market shares of convenience and comparison goods expenditure in
each of the Borough’s shopping destinations – indicated by the 2016 household survey
(adjusted by CPW Planning) – remains unchanged throughout the forecasting period,
notwithstanding the potential impact of committed developments on shopping patterns and
market shares over time.
9.26 The tables below show that, whilst some of the shopping destinations will have limited capacity
to support new retail floorspace, the overall picture (Borough-wide) is that there will be a
theoretical over-supply of floorspace. This is largely due to the major committed developments,
particularly at Tollgate and Non-central stores in the Borough.
Summary of retail capacity forecasts: convenience goods (sqm net sales area)
2023 2028 2033 Table number
(Appendix B)
Colchester Town Centre -150 100 350 13
Tollgate -2,350 -1,950 -1,600 22
Turner Rise -800 -500 -200 31
Peartree Road -50 50 50 40
Highwoods 100 350 550 49
Tiptree -300 -150 -50 57
Non-central stores in the Borough -3,900 -3,400 -3,000 66
Combined forecasts for
Colchester Borough
-7,450 -5,500 -3,900 n/a
Notes:
a) The forecasts are ‘baseline’ forecasts after allowing for the committed developments.
b) The forecasts are cumulative i.e. the forecasts for each year include the forecasts for the previous years and are not
additional to those earlier forecasts.
c) Forecasts rounded to the nearest 50 sqm net.
d) The grand totals (i.e. combined forecasts) may not exactly equal the sub-totals due to rounding.

46
Summary of retail capacity forecasts: comparison goods (sqm net sales area)
2023 2028 2033 Table number
(Appendix B)
Colchester Town Centre 2,100 2,850 2,950 13
Tollgate -15,050 -14,650 -14,600 22
Turner Rise 50 200 200 31
Peartree Road 100 150 200 40
Highwoods -50 0 0 49
Tiptree 500 500 550 57
Non-central stores in the Borough 1,400 1,650 1,700 66
Combined forecasts for
Colchester Borough
-11,400 -9,850 -9,550 n/a
Notes:
a) The forecasts are ‘baseline’ forecasts after allowing for the committed developments.
b) The forecasts are cumulative i.e. the forecasts for each year include the forecasts for the previous years and are not
additional to those earlier forecasts.
c) Forecasts rounded to the nearest 50 sqm net.
d) The grand totals (i.e. combined forecasts) may not exactly equal the sub-totals due to rounding.
e) The forecasts for Non-central stores in the Borough assume any new comparison goods floorspace would trade at a
typical average sales density for non-food retail warehouses. However, in the event that the forecast capacity or any
part of it can be accommodated in town centre or edge-of-centre format developments, the capacity would be less than
shown because town centre formats typically trade a higher sales densities than retail warehouses.
9.27 The updated retail capacity forecasts serve as a guide for future planning policies and decisions
on planning applications. The forecasts should be reviewed regularly in the light of actual
population and (in particular) expenditure growth, the outlook for which is subject to change
given Covid-19 and the macro-economic conditions. It will also be important to review the
forecasts as and when committed developments come forward and their effects become more
measurable.
Updated commercial leisure audit:
9.28 We consider that the quantity and quality of commercial leisure provision in Colchester Town
Centre and elsewhere in the Borough to be reasonably strong. The F&B offer is substantial and
it remains to be seen whether the operator ‘failures’ and downsizing in this sector will have
implications for existing provision in Colchester and/or the committed developments at
Tollgate Village and Northern Gateway. However, the restaurant vacancies at Stane Leisure
Park and within the Curzon cinema scheme in the Town Centre are perhaps an indication of
market saturation.
9.29 The Borough’s cinema offer has improved since the opening of Curzon (Queen Street), which
is likely to have reduced the level of cinema participation ‘leakage’ beyond Colchester Borough
as identified in the 2016 Study. The proposed new cinemas at Northern Gateway (Cineworld)
and Tollgate Village (The Light) will further diversify the cinema offering.
9.30 We assess that the Borough is well served by gymnasiums / health clubs and other active leisure
facilities such as indoor climbing, roller skating and laser tag. A new indoor climbing facility is
proposed as part of the Northern Gateway scheme, while the tenpin bowling facilities proposed
at Northern Gateway and Tollgate Village will provide choice beyond the existing venue
(Tenpin) on Cowdray Avenue.
9.31 Overall, therefore, we do not consider the Council should allocate sites for major new
commercial leisure provision in the Borough. There are no obvious quantitative or qualitative
‘gaps’ based on existing supply and the proposed new commercial leisure developments
identified in this Update. That said, leisure uses will continue to form an important part of

47
mixed-use schemes and the Council should plan positively and flexibly for such uses in
appropriate locations. Specific operator-led proposals should be considered on their merits
having regard to the development plan and other material considerations.
Opportunities for growth and change:
9.32 Our review of potential development opportunities for retail and other main town centre uses
is focused on the relevant Colchester Town Centre ‘allocations’ under Policy TC3 of the
emerging Local Plan (i.e. Vineyard Gate, St Botolph’s and Priory Walk).
Vineyard Gate
9.33 Due to significant changes in the retail market and the growing competition from nearby
shopping destinations, the Council is now focused on delivering a residential-led mixed use
scheme including public realm to showcase the site’s heritage features.
9.34 We consider that a residential-led mixed use scheme, which enhances the level of connectivity
with Eld Lane to the north, would revitalise this part of the Town Centre. It would act as a
catalyst for inward investment and generate additional footfall to support retail and non-retail
businesses. Other potential uses could include cultural, visitor and/or community facilities;
flexible office and/or workshop space; and retail and/or leisure services.
St Botolph’s
9.35 Since the 2016 Study, the Curzon cinema scheme has opened within the repurposed Roman
House building. The scheme includes two vacant restaurants at ground floor level, which is
perhaps a consequence of the ‘downsizing’ trend in the restaurant sector and/or an indication
of market saturation.
9.36 Planning permission has been granted on appeal for the redevelopment of adjacent derelict
land (Alumno Site) including student accommodation, hotel, artist studios, and flexible
commercial floorspace.
9.37 The planned redevelopment of the Alumno Site would further revitalise this part of the Town
Centre. In particular, we consider the new population arising from the student
accommodation, together with users of (and visitors to) the hotel and other commercial uses,
would have a positive impact on levels of footfall and activity. It would help to create the
conditions necessary to reposition and attract investment in the surrounding area, including
Priory Walk.
Priory Walk
9.38 There is considerable potential to improve the site’s contribution to the vitality of the Town
Centre, either through reconfiguration and refurbishment (with retail floorspace potentially
forming a reduced component) or comprehensive redevelopment.
9.39 Any proposals should seek to retain Sainsbury’s, which is the Town Centre’s main supermarket
and performs an important role catering for the main food and (more likely) top-up food
shopping needs of town centre users.
9.40 The delivery of a mixed use scheme – potentially including retail, flexible commercial and/or
community uses at ground floor with residential uses above – would complement nearby
recent investments (i.e. the Curzon cinema scheme and the St Nicholas Quarter residential-led
development on Long Wyre Street) and planned redevelopment (i.e. the Alumno Site), and
help to attract further investment in this part of the Town Centre.

48
Policy recommendations for the emerging Local Plan:
9.41 We have reviewed a suite of policies set out in the emerging Local Plan (namely Policies SG5,
SG6, TC1, TC2, TC3, NC1 and WC1) and, overall, assess that only limited revisions are
necessary in the light of the updated evidence base.
9.42 The limited revisions proposed in section 8 of this Update seek to ensure that the retail and
town centre policies are consistent with the requirements of NPPF 2012; and address recent
events (including the Covid-19 pandemic and changes to the Use Classes Order) and other
notable changes since the 2016 Study, in particular the grant of planning permissions for new
retail and leisure floorspace at Tollgate (Stanway) and North Colchester.
9.43 Our policy recommendations will be incorporated into the Council’s Topic Paper 4 (Retail and
Town Centre Policies) prepared to support the forthcoming examination.

Appendix A (Updated Healthcheck Audits)

1
COLCHESTER TOWN CENTRE
October 2020
Centre classification in the emerging Local Plan (Policy SG5): Town Centre.
Diversity of uses:
Figure 1 below sets out the diversity of uses in Colchester Town Centre based on the latest survey
undertaken by Experian Goad (November 2019), relative to the survey findings of November 2015.
The analysis focuses on a number of use categories, as defined by Experian Goad, namely:
▪ Comparison Retail (e.g. clothing and footwear, furniture, jewellery, electrical goods, toys);
▪ Convenience Retail (e.g. butchers, bakers, supermarkets);
▪ Retail Services (e.g. dry cleaners, hairdressers and beauticians, travel agents);
▪ Leisure Services (e.g. cafes, restaurants);
▪ Financial & Business Services (e.g. banks, estate agents); and
▪ Vacant.
Figure 1 – Diversity of uses, Colchester Town Centre
Use Categories November 2019 November 2015
Units
(count)
Units
(%)
Floorspace
(sqm)
Floorspace
(%)
Units
(count)
Units
(%)
Floorspace
(sqm)
Floorspace
(%)
Comparison Retail 190 29.6 45,049 39.0 241 36.7 53,856 44.9
Convenience Retail 50 7.8 9,783 8.5 49 7.5 7,618 6.3
Retail Services 102 15.9 8,101 7.0 93 14.2 7,953 6.6
Leisure Services 152 23.7 27,648 23.9 141 21.5 26,505 22.1
Financial &
Business Services
55 8.6 8,882 7.7 64 9.7 10,322 8.6
Vacant 93 14.5 16,072 13.9 69 10.5 13,778 11.5
TOTAL 642 100 115,535 100 657 100 120,032 100
Source:
November 2019 figures from Experian Goad.
November 2015 figures derived from the Retail and Town Centre Study 2016.
The main findings from the analysis include:
▪ Comparison Retail continues to account for the highest proportion of units (29.6%) and
floorspace (39%), as expected for a centre the size of Colchester, but the number of units
dedicated to this use has fallen considerably since 2015 (from 241 to 190); and represents a
trend occurring in many centres across the UK. Given the reduction in floorspace has been
less substantial (from 53,856sqm to 45,049sqm), it is likely that smaller-sized units
previously occupied by Comparison Retail uses have become vacant or now accommodate
alternative uses.
▪ Of the total number of Comparison Retail units (190), 52 are occupied by retailers of
clothing and footwear, 22 are charity shops, and there are 14 jewellers.
HEALTHCHECK AUDIT

2
▪ The number of units dedicated to Convenience Retail (50 or 7.8% of the total number of
units) is broadly unchanged since 2015, although there has been a notable increase in
floorspace (from 7,618sqm to 9,783sqm) over this period.
▪ Leisure Services are the second most dominant use category and help to extend dwell time
and support the retail offer. There are currently 152 units accommodating such uses
(compared to 141 in 2015) including 41 cafes, 31 restaurants and 28 hot-food takeaways.
▪ There are 102 units occupied by Retail Services, of which some 76 are health and beauty
salons (including hairdressers). This represents a slight increase in the number of units
accommodating Retail Services since 2015, although the proportion of floorspace dedicated
to such uses is broadly unchanged.
▪ The findings in respect of Financial & Business Services indicate a reduction in both units
and floorspace since 2015, perhaps reflective of the continued shift towards online banking
and other professional services.
Vacancy levels:
A notable finding from the analysis set out in the table above is that, since November 2015, vacancy
levels in Colchester Town Centre have increased considerably; from 69 vacant ground floor premises
(10.5% of the total) to 93 in November 2019 (14.5%). This compares with the national average of
around 12%.
Over the same period, the overall quantum of vacant floorspace has risen from 13,778sqm (11.5% of
total floorspace) to 16,072sqm (13.9%). The average vacant unit size is therefore currently in the
region of 170sqm.
During our site inspections, we observed a particular concentration of vacant ground floor premises
at the east of the Town Centre, at Priory Walk and adjacent shopping streets (namely Long Wyre
Street and Queen Street). Notable vacancies include the former Holland & Barratt store at Priory
Walk; and on Long Wyre Street, the former Poundland store, the Argos store (closed at present due
to the Covid-19 situation), and the site of the former Co-op department store (currently the subject
of the St Nicholas Quarter residential-led development including A1/A3 premises at ground floor
level). To the south of Priory Walk, the new Curzon cinema scheme on Queen Street includes two
vacant restaurants.
Other large and/or particularly prominent vacant ground floor premises within the Town Centre
include:
▪ former Laura Ashley store, Culver Street West (adjacent to H. Samuel);
▪ former Boots Opticians and adjacent store, Lion Walk (between Primark and Poundland);
▪ former Mountain Warehouse store, High Street (adjacent to McDonald’s);
▪ former Oasis store, High Street (adjacent to Barclay’s); and
▪ former Poundland store, St John’s Walk Shopping Centre.
The largest vacant premises identified in the 2016 Study, the former BHS store at Lion Walk, is now
occupied by Primark.
Retailer representation and the balance between independent and multiple stores:
Colchester Town Centre has a strong retail offer, with a mixture of independent shops and
established national brands. It is particularly well represented by mass market fashion-orientated
retailers such as H&M, New Look, Next, Primark and River Island; but continues to be under-
represented by higher end comparison goods retailers as identified in the 2016 Study. In terms of
convenience goods provision, the Town Centre includes Sainsbury’s, Tesco Express, Iceland and the
M&S Food Hall.
Figure 2 below identifies the ‘major retailers’ (as defined by Experian Goad) present in Colchester
Town Centre. Representation is broadly unchanged since the 2016 Study, although the Primark

3
store at Lion Walk opened in 2017. Argos (Long Wyre Street) is temporarily closed at present, due
to the Covid-19 situation.
Figure 2 – Major retailer representation, Colchester Town Centre
Department Stores Mixed Goods
Retailers
Supermarkets Clothing Other Retailers
Debenhams
Marks & Spencer
Argos
Boots
TK Maxx
WH Smith
Wilkinson
Sainsbury’s
Tesco (Express)
H&M
Monsoon Accessorize (x2)
New Look
Next
Primark
River Island
Topman
Topshop
Carphone Warehouse
Clarks
Clintons
EE (x2)
HMV
O2
Superdrug
Vodafone
Waterstones
Source:
Experian Goad and CPW Planning research including site inspections (September 2020).
Most of these major retailers are concentrated in and around Lion Walk and Culver Square. Notable
exceptions include the Argos store, Wilkinson (St John’s Walk Shopping Centre) and Sainsbury’s
(Priory Walk).
Fenwick department store, whilst not identified as a major retailer by Experian Goad, is a key
‘anchor’ and has benefitted from a major refurbishment in recent years. It accommodates several in-
store concessions and brands (e.g. All Saints, Barbour International, Hobbs, Hugo Boss, Paul Smith)
that underpin the premium retail offer. Other multiples in the Town Centre include Fat Face, Schuh,
Shoe Zone, White Stuff, Lush, Paperchase, and Smiggle.
The leisure offer helps to support the Town Centre’s retail function and includes two cinemas: the
long-established Odeon (Head Street) and Curzon (Queen Street), which opened in 2018. Mercury
Theatre (Balkerne Gate) is a further significant attraction. The theatre is currently closed for
refurbishment works but scheduled to re-open in Autumn 2020 subject to Covid-19 restrictions.
There is a good variety of cafes/bars/restaurants that contribute to evening economy. New
representation since the 2016 Study includes three restaurants at Greytown House on High Street
(namely Five Guys, Wagamama and Turtle Bay) complementing other nearby provision such as
Bills, Pizza Express, El Guaca and Mirra.
Figure 3 below shows the balance between independent and multiple stores in Colchester Town
Centre.
Figure 3 – Number of independent and multiple stores, Colchester Town Centre
Use Categories Independent Stores
(count)
Multiple Stores
(count)
Comparison Retail 92 98
Convenience Retail 36 14
Retail Services 87 15
Leisure Services 103 49
Financial &
Business Services
29 26
TOTAL 347 202
Source:
Figures derived from Experian Goad (November 2019).

4
There is a risk that too many multiples can dilute the character and identity of a centre; however, we
consider that Colchester Town Centre has a well-balanced mix of independent and multiple stores.
The independent stores help to provide a distinguished retail offer and therefore a unique
experience for shoppers and other town centre users. During our site inspections, we identified a
high number of such shops and stores along Sir Isaac’s Walk / Eld Lane and the streets and passages
between High Street and the main shopping centres.
Customers’ experience and behaviour:
We outline below the key findings of the 2016 Study (based on the 2016 household survey) in the
absence of any more up-to-date survey evidence:
…few consumers in Colchester Borough – including the town’s immediate catchment (Zone 1) – do
most of their main food shopping in the town centre.
As expected for a centre the size of Colchester, it secures substantial market shares of comparison
goods expenditure from the catchment area. To this end, the town centre’s comparison goods
shopping offer is particularly strong in terms of clothing and footwear and books; jewellery and
watches; china, glassware and kitchen utensils; recreational and luxury goods. The main
competing destinations in this respect – according to the household interview survey – include
Chelmsford (town centre), Braintree (town centre and retail parks), Clacton-on-Sea (town centre
and retail parks) and Tollgate.
The opening of Primark in 2017 is likely to have increased the Town Centre’s market shares of
comparison goods expenditure – particularly on clothing and footwear. However, the impact of this
new attraction needs to be considered in the context of other recent performance indicators; for
example, the overall reduction in comparison goods retailers, rising vacancy levels, and declining
town centre footfall (identified below).
The 2016 Study further highlighted that, Car parking is a notable dislike about Colchester Town
Centre, with 12.9% [of survey respondents who use the Town Centre for shopping and services]
expressing the view that parking is too expensive and a further 10.2% stating that it is difficult to
park near shops. We have identified no significant improvements in this respect.
Pedestrian flows:
During our site inspections, we observed the highest pedestrian flows at Culver Square and Lion
Walk, and along Sir Isaac’s Walk in particular. The western section of High Street, close to the
Fenwick and M&S ‘anchor’ stores, was also reasonably busy.
Pedestrian flows were lower towards the more peripheral areas of the Town Centre, where there is
reduced quality in the retail/leisure offer and fewer footfall-generating attractions.
Footfall data has been obtained from the centre managers of Culver Square and Lion Walk.
Figure 4 below shows the levels of footfall recorded at Culver Square for each quarter of 2015, 2019
and (insofar as available) 2020. Despite the shopping centre’s retailer line-up remaining broadly the
same, there was a general decline in footfall between 2015 and 2019. This may be attributable to
many reasons, including the national trend of reduced footfall in town centre locations; and/or more
Colchester-specific reasons such as the increasing attractiveness of competing and out-of-centre
shopping destinations, and the shift in the Town Centre’s retail focus towards Lion Walk where
Primark opened in 2017.

5
Figure 4 – Footfall counts, Culver Square
Culver Square Q1 Q2 Q3 Q4 TOTAL
2015 1,351,718 1,423,089 1,507,869 1,895,551 6,178,227
2019 1,135,135 1,141,624 1,204,974 1,391,911 4,873,644
2020 892,083 157,409* 654,161** n/a 1,703,653
Source:
Colchester Borough Council from the centre managers.
Notes:
* Shopping centre closed due to Covid-19.
** Counts exclude September 2020.
As the 2020 footfall counts at Culver Square confirm, pedestrian flows in Colchester Town Centre
have fallen significantly due to the Covid-19 crisis. The graph in Figure 5 below illustrates the
impact of the national lockdown on visitor levels at Lion Walk specifically (relative to the levels
recorded in 2018 and 2019 respectively). Whilst the total number of visitors in July 2020 (501,695)
is down 27% on July 2019 levels (687,230), the upward trend since May/June 2020 is encouraging
for the future recovery.
Figure 5 – Footfall trends, Lion Walk
Source:
Colchester Borough Council from the centre managers (derived from Sensormatic summary report for July 2020).
Accessibility:
Colchester Town Centre is a transport ‘hub’ for the wider Borough and is accessible by public
transport, private car, and walking and cycling.
The shopping centres and streets focused within the core of the Town Centre are pedestrianised and,
generally, there is a good level of connectivity for pedestrians and cyclists.
It has two rail stations: Colchester Town (approximately 200m to the south of the Town Centre) and
Colchester (approximately 1.5km to the north of the Town Centre). Colchester Town is the primary
station serving the town and provides direct rail services London Liverpool Street, Ipswich, Norwich
and Clacton-on-Sea (inter alia). It is connected to the Town Centre with highly frequent bus services,
while the pedestrian route has been enhanced through the ‘Fixing the Link’ initiative.
Colchester bus station is situated at the southeast of the Town Centre, off Stanwell Street and
Osbourne Street, with routes to destinations throughout the Borough and beyond (including to

6
Stansted and Southend Airports). There are a number of bus stops throughout the Town Centre
including on St John’s Walk, High Street, Head Street and Queen Street.
The A134 runs to the south and west of Colchester Town Centre and serves the main vehicular
routes into the Town Centre, while High Street / East Street is another key vehicular route from the
east. In terms of car parking, the Town Centre is well served by several large car parks. The largest
multi-storey facilities are St John’s Car Park (645 spaces) and St Mary’s Car Park (617 spaces).
Other town centre car parks include Britannia Car Park, Middleborough Car Park, Priory Street Car
Park, Sheepen Road Car Park, and Vineyard Street Car Park.
Data shared by the North Essex Parking Partnership in respect of the abovementioned car parks
indicates that, over the period 2016-2019, the sum of car park stays reduced by approximately 3.5%
(from 1,443,355 in 2016 to 1,393,370 in 2019).
Figure 6 below includes the quarterly data for 2019 compared to the corresponding data for 2020. It
demonstrates the significant impact of Covid-19 on town centre car park stays, particularly during
April-June (down 86.4% on the previous year) and during July-September (down 55.1%) in the light
of pandemic-induced restrictions and the emphasis on home-working.
Figure 6 – Car park stays (all tariffs), Colchester Town Centre
2019 2020 Percentage change (%)
Q1 (January-March) 333,398 287,468 -13.8
Q2 (April-June) 343,743 46,883 -86.4
Q3 (July-September) 341,101 153,051 -55.1
Source:
Colchester Borough Council from the North Essex Parking Partnership.
Environmental quality:
As a historic centre, Colchester offers an attractive setting for shopping and services. Our main
observations include:
▪ High Street is a traditional, linear shopping street. It includes attractive buildings and some
key retailers such as Fenwick, Next, and Marks & Spencer. A programme of public realm
works was recently completed, which included improvements to the pavements on both sides
of the High Street between North Hill (to the west) and Queen Street (to the east).
▪ Culver Square and Lion Walk shopping centres are pedestrianised and offer a relatively high-
quality environment for shoppers and other users. They comprise a high proportion of the
Town Centre’s large, modern shop units. However, consistent with the findings of the 2016
Study, we consider the degree of connectivity between them is relatively poor and creates an
incoherent retail circuit.
▪ Narrow streets and passageways, such as Pelham’s Lane and Red Lion Walk, connect the
High Street with the main shopping centres. These provide a unique setting and make a
positive contribution to the Town Centre’s environmental quality.
▪ Sir Isaac’s Walk and Eld Lane comprise a narrow route aligned with small shop units,
creating a pleasant and somewhat intimate shopping environment. The route is reasonably
pedestrian-friendly (at the time of our site inspections it was marked/segregated for social-
distancing purposes) and has good connections into the town’s main shopping centres.
▪ The Town Centre’s secondary shopping centres, Priory Walk and St John’s Walk Shopping
Centre, are in a poor state and in need of investment. They have an adverse impact on the
environmental quality of the surrounding streets.
▪ Queen Street has benefitted from investment since the 2016 Study with the opening of the
Curzon cinema scheme (within the repurposed Roman House building). As well as providing

7
a new attraction, the scheme has enhanced the streetscape on the eastern side of Queen
Street close to Priory Walk (albeit the ground floor restaurants remain vacant).
▪ Other public realm improvements have been identified by the Council focused on St Nicholas
Square and Balkerne Gate (at the east and west of the Town Centre respectively). It is
envisaged that these ‘cultural gateway’ schemes will be delivered by April 2021 using the
£1m accelerated Towns Fund.
▪ The redevelopment of the former Co-op department store on Long Wyre Street, comprising
the St Nicholas Quarter residential-led scheme (which is under construction), will
complement the abovementioned improvements to St Nicholas Square. The site lies to the
immediate west of Priory Walk.
Perception of safety:
We identified no significant adverse issues with regards to safety or security during our site
inspections, which were conducted during the day. However, due to the ‘dead’ frontages and the
general poor state of St John’s Walk Shopping Centre and Priory Walk in particular, these areas of
the Town Centre were found to be somewhat unwelcoming.
Opening hours and the evening economy:
Most of the Town Centre’s shops and stores are open all week. Those focused within Culver Square
and Lion Walk are typically open for trading until 18:00 Monday-Saturday, with reduced opening
hours on Sundays.
The main supermarket, Sainsbury’s (Priory Walk), is open from 07:00 to 19:00 Monday-Saturday,
and from 10:30 to 16:30 on Sundays.
The variety of cafes/bars/restaurants and other commercial leisure attractions, including the two
cinemas (Odeon and Curzon), extend the hours of activity and provide an evening economy.
Commercial rents and yields:
The 2016 Study reports prime Zone A rents of £170 per square foot (psf) at Lion Walk, as at mid-
2016, with Culver Square achieving between £60-65 and £135 psf.
However, many centres across the UK are subject to declining rental levels in the face of company
voluntary arrangements (CVAs) and shop closures.
Information published on Realla.co.uk and EstatesGazette.com in September 2020 indicates that:
▪ Vacant ground floor premises at Lion Walk are available to let for £85-105 psf;
▪ The rental levels currently sought at Culver Square and on High Street (e.g. former Mountain
Warehouse store) are lower at around £40 psf;
▪ The vacant restaurants within the Curzon cinema scheme (Queen Street) are available to let
for £30 psf; and
▪ Other, more secondary areas of the Town Centre are achieving sub-£30 psf rents.
Barriers to business investment:
We consider that, of all the Borough’s centres, Colchester Town Centre is particularly vulnerable to
the current and potential future impacts of Covid-19, with the reduction in town centre footfall and
activity likely to have significant implications for business investment decisions.
Beyond Covid-19 related impacts, we consider that barriers to new businesses opening and/or
existing businesses expanding (that are specific to the Town Centre) are likely to include:
▪ the increasing levels of competition from nearby existing (and proposed new i.e. Tollgate
Village) shopping destinations;

8
▪ car parking issues (the 2016 household survey identified concerns that car parking is ‘too
expensive’ and that it is ‘difficult to park near shops’) in contrast to other shopping
destinations in the Borough, such as Tollgate District Centre and non-central retail parks,
which are served by free, extensive and dedicated surface level car parking; and
▪ parts of the Town Centre, notably Priory Walk and St John’s Walk Shopping Centre, do not
currently provide the conditions necessary to support business investment.

1
TIPTREE
October 2020
Centre classification in the emerging Local Plan (Policy SG5): District Centre.
Diversity of uses:
The table below sets out the diversity of uses in Tiptree based on the latest town centre survey
undertaken by Experian Goad (June 2017), relative to the survey findings of May 2015.
The analysis focuses on a number of use categories, as defined by Experian Goad, namely:
▪ Comparison Retail (e.g. clothing and footwear, furniture, jewellery, electrical goods, toys);
▪ Convenience Retail (e.g. butchers, bakers, supermarkets);
▪ Retail Services (e.g. dry cleaners, hairdressers and beauticians, travel agents);
▪ Leisure Services (e.g. cafes, restaurants);
▪ Financial & Business Services (e.g. banks, estate agents); and
▪ Vacant.
Use Categories June 2017 May 2015
Units
(count)
Units
(%)
Floorspace
(sqm)
Floorspace
(%)
Units
(count)
Units
(%)
Floorspace
(sqm)
Floorspace
(%)
Comparison Retail 19 26.4 2,481 18.9 19 27.1 2,481 19.2
Convenience Retail 6 8.3 6,169 47.0 6 8.6 6,169 47.7
Retail Services 19 26.4 1,533 11.7 17 24.3 1,329 10.3
Leisure Services 13 18.1 1,022 7.8 13 18.6 1,022 7.9
Financial &
Business Services
13 18.1 1,821 13.9 13 18.6 1,839 14.2
Vacant 2 2.8 93 0.7 2 2.8 93 0.7
TOTAL 72 100 13,119 100 70 100 12,933 100
Source:
June 2017 figures from Experian Goad.
May 2015 figures derived from the Retail and Town Centre Study 2016.
The number of units occupied by Comparison Retail (19), Convenience Retail (6), Leisure Services
(13) and Financial & Business Services (13) is unchanged since 2015, indicating a high level of
stability in recent years. The centre continues to serve a local convenience-based role, with a high
proportion of floorspace dedicated to Convenience Retail and a range of service uses.
Vacancy levels:
The latest Experian Goad survey identifies two vacant premises, which was verified during our site
inspections. This includes the shop unit formerly occupied by Boots.
HEALTHCHECK AUDIT

2
Retailer representation and the balance between independent and multiple stores:
Tiptree is represented by three national supermarket chains: Asda, Iceland, and Tesco. The latter is
an important ‘anchor’ for the centre, being centrally located off Church Road and with free surface
level car parking. It includes an in-store bakery and fishmonger as well as limited (Florence & Fred)
clothing ranges. Asda, which is slightly detached from the centre’s main shopping area, provides a
wide selection of convenience goods plus the George clothing range.
Boots (chemist) has closed since the 2016 Study and there are no other national multiple retailers.
The centre does, however, support a relatively strong mix of independent businesses including a
small range of clothing shops, opticians, dentist, pharmacy, dry cleaners, hairdressers, and cafes.
There is also a medical centre, community centre and library. Barclays and Lloyds are the main
retail banks.
Customers’ experience and behaviour:
In the absence of any up-to-date survey evidence, and given there has been few notable changes in
the centre’s offer and performance, we identify the relevant findings of the 2016 Study as follows:
Based on the results of the 2016 household interview survey, the centre’s convenience goods
shopping offer (dominated by Tesco and Asda) principally serves the western parts of Colchester
Borough. Some 20.4% of consumers in Zone 6 [Rural West] do most of their main food shopping in
Tiptree, with limited expenditure inflows from the wider catchment area. It has a strong, localised
‘top up’ food shopping function.
The centre further secures notable market shares of expenditure on certain comparison goods
subcategories from Zone 6 and also Zone 9 [Witham]. For example, around a quarter (24.5%) of
consumers in Zone 6 do most of their shopping for chemists and medical goods, cosmetics and
other beauty products in Tiptree. High proportions of consumers in Zones 6 and 9 do most of their
shopping for household appliances in the centre (8.7% and 8.2% respectively).
Pedestrian flows:
During our site inspections, we observed the highest pedestrian flows around the Tesco store
including the passageway connecting Church Road with Tesco’s surface level car park, which was at
approximately 70-80% capacity. The cafes and pavements on the eastern side of Church Road,
directly opposite Tesco, were also relatively busy. We observed some pedestrians undertaking
linked-trips between the centre’s main shopping area and the Asda store to the north.
Accessibility:
Tiptree is situated approximately 16km to the southwest of the Borough’s principal centre,
Colchester. It is a linear centre focused along the B1023 (Church Road), with bus stops serving the
main shopping area and the surrounding hinterland. There is no rail station.
Predominantly residential areas surround the centre, providing a substantial walk-in catchment.
Tesco’s customer car park provides free and convenient parking for visitors to the store and indeed
the wider centre.
Environmental quality:
Notwithstanding the relatively high traffic movements along Church Road, Tiptree is a pleasant
centre and well maintained.
Perception of safety:
We identified no adverse issues with regards to safety or security during our site inspections, which
were conducted during the day.

3
Opening hours and the evening economy:
Most shops and stores are open all week (with the possible exception of Sundays). The centre’s main
convenience goods store, Tesco, is open from 08:00 to 22:00 Monday-Saturday, with reduced
Sunday trading hours (10:00 to 16:00).
The centre has a limited number of ‘evening economy’ uses (pubs/bars/restaurants) but there are
several hot food takeaways and cafes.
Commercial rents and yields:
There is no published information.
Barriers to business investment:
We have identified no evidence of significant barriers to new businesses opening and/or existing
businesses expanding that are specific to Tiptree. The centre displays relatively strong performance
in relation to many indicators (considering its scale and function), while the lack of vacant premises
could be viewed as a barrier in terms of limiting business investment opportunities.

1
WEST MERSEA
October 2020
Centre classification in the emerging Local Plan (Policy SG5): District Centre.
Diversity of uses:
There are approximately 30 ground floor shop units, interspersed with residential uses, along the
B1025 (High Street / Barfield Road / Kingsland Road).
As reported in the 2016 Study, the centre has a modest range of retail, service and community
facilities. These cater for the day-to-day needs of local residents as well as the centre’s visitor
function.
The main convenience stores are Tesco Express, Co-op and Spar. We note that the Tesco Express
customer car park has a ‘drive thru’ click-and-collect facility. Other existing uses are predominantly
small scale and include a chemist (Boots), bike shop, butchers, hairdressers, and a small number of
cafes and delicatessens that are popular with tourists and other visitors. There is also a library, post
office and sports/leisure centre.
Vacancy levels:
During our site inspections, we observed only one vacant premises: a former public house at the
junction of High Street and Coast Road.
Retailer representation and the balance between independent and multiple stores:
Within the limitations of its small scale, the centre has a balanced mix of independent and multiple
stores. The national multiple retailers include Boots, Tesco Express, Co-op and Spar. These help to
sustain the mix of independent businesses (identified above), which provide a more distinct offer.
Customers’ experience and behaviour:
In the absence of any up-to-date survey evidence, and given there has been few notable changes in
the centre’s offer and performance, we identify the relevant findings of the 2016 Study as follows:
Based on the results of the 2016 household interview survey, the centre’s convenience goods
shopping offer principally serves the immediate catchment. To that end 8% of consumers in Zone 3
[Rural South] do most of their main food shopping in West Mersea, with little or no expenditure
inflows from the wider catchment area. It has a strong, localised ‘top up’ food shopping function.
The centre further secures notable market shares of expenditure on a limited number of
comparison goods sub-categories from Zone 3. For example, 13.6% of consumers in Zone 3 do
most of their shopping for household appliances in West Mersea. In addition, perhaps reflecting
the localised nature of shopping patterns for chemists and medical goods, cosmetics and other
beauty products, some 18.9% of consumers in Zone 3 do most of their shopping for such goods in
the centre.
HEALTHCHECK AUDIT

2
Pedestrian flows:
During our site inspections, we observed the highest pedestrian flows along High Street; particularly
around the public pay-and-display car park (behind the library) and the nearby cafes and
delicatessens. Levels of footfall were moderately high around the Tesco Express and Co-op stores.
Accessibility:
West Mersea lies approximately 16km to the south of the Borough’s principal centre, Colchester.
The centre has a substantial walk-in catchment and is well served by bus stops along the B1025.
There is no rail station.
The main car park is the public pay-and-display car park situated behind the library, on the western
side of High Street. At the time of our site inspections (weekday lunchtime), this car park was at full
capacity. The main convenience stores – Tesco Express, Co-op and Spar – also provide limited off-
site car parking.
Environmental quality:
West Mersea’s retail, service and community facilities are relatively dispersed throughout the centre.
It has a pleasant ‘village’ character, especially at its southern end (close to Coast Road), where some
of the cafes and delicatessens provide outdoor seating areas.
The centre’s shop frontages are generally well maintained.
Perception of safety:
We identified no adverse issues with regards to safety or security during our site inspections, which
were conducted during the day.
Opening hours and the evening economy:
The majority of the centre’s shops and stores are open on weekdays and Saturdays. Tesco Express
trades from 06:00 to 23:00 Monday-Saturday (from 07:00 on Sundays) and the Co-op store is open
from 07:00 to 21:00 Monday-Saturday, with reduced Sunday trading hours.
The independent cafes/restaurants provide a limited evening economy.
Commercial rents and yields:
There is no published information.
Barriers to business investment:
We have identified no evidence of significant barriers to new businesses opening and/or existing
businesses expanding that are specific to West Mersea. The centre displays relatively strong
performance in relation to many indicators (considering its scale and function), while the lack of
vacant premises could be viewed as a barrier in terms of limiting business investment opportunities.

1
WIVENHOE
October 2020
Centre classification in the emerging Local Plan (Policy SG5): District Centre.
Diversity of uses:
Wivenhoe comprises approximately 20 ground floor shop units, interspersed with residential and
community uses. There are two convenience stores (Co-op and One Stop), which serve the day-to-
day needs of local residents.
The comparison goods shopping offer is limited to Boots (chemist), a florist, opticians, and small
shops selling books, gifts and ‘boutique’ clothing. The centre also includes a library, post office,
estate agents, hairdressers, cafés/restaurants and a public house.
Vacancy levels:
No vacant premises were identified during our site inspections.
Retailer representation and the balance between independent and multiple stores:
Wivenhoe is represented by three national multiple retailers: Boots, Co-op and One Stop. These
support the centre’s limited range of independent businesses (identified above).
Customers’ experience and behaviour:
In the absence of any up-to-date survey evidence, and given there has been few notable changes in
the centre’s offer and performance, we identify the relevant findings of the 2016 Study as follows:
Based on the results of the 2016 household interview survey, the centre’s convenience goods
shopping offer principally serves the immediate catchment. Reflecting the limited range of
provision only 3.3% of consumers in Zone 3 [Rural South] do most of their main food shopping in
Wivenhoe. It has a greater localised ‘top up’ food shopping function.
Unsurprisingly, the centre secures little or no market shares of comparison goods expenditure
from Colchester’s catchment area. The main exception is chemists and medical goods, cosmetics
and other beauty products, with 6.9% of consumers in Zone 3 doing most of their shopping for
such goods in Wivenhoe.
Pedestrian flows:
During our site inspections, we observed relatively modest levels of footfall along Wivenhoe’s High
Street. The busiest part of the centre was the small shopping parade (including One Stop and Boots)
off Vine Drive, which benefits from dedicated off-street car parking.
Accessibility:
Wivenhoe is situated approximately 6km to the southeast of the Borough’s principal centre,
Colchester, which is accessible via the A133 (Clingoe Hill) and the B1028 (Colchester Road). To the
HEALTHCHECK AUDIT

2
south of the centre, the River Colne constrains accessibility to/from the south-western parts of the
Borough (e.g. West Mersea, Tiptree).
The centre has a substantial walk-in catchment. It has a rail station, and a number of bus stops
along High Street and Station Road.
Environmental quality:
The centre has an attractive ‘village’ character, particularly at its southern end (i.e. south of Station
Road) where the High Street narrows. Pavements and shop frontages are generally well maintained.
Perception of safety:
We identified no adverse issues with regards to safety or security during our site inspections, which
were conducted during the day.
Opening hours and the evening economy:
The centre’s main convenience stores are open all week; One Stop trades 07:00-22:00 (including on
Sundays) while the Co-op store is open from 06:00 to 23:00 Monday-Saturday, and from 10:00 to
16:00 on Sundays. Boots trades from 08:30 to 18:30 on weekdays, and from 09:00 to 17:00 on
Saturdays.
The public house and cafes/restaurants provide a limited evening economy.
Commercial rents and yields:
There is no published information.
Barriers to business investment:
We have identified no evidence of significant barriers to new businesses opening and/or existing
businesses expanding that are specific to Wivenhoe. The centre displays relatively strong
performance in relation to many indicators (considering its scale and function), while the lack of
vacant premises could be viewed as a barrier in terms of limiting business investment opportunities.
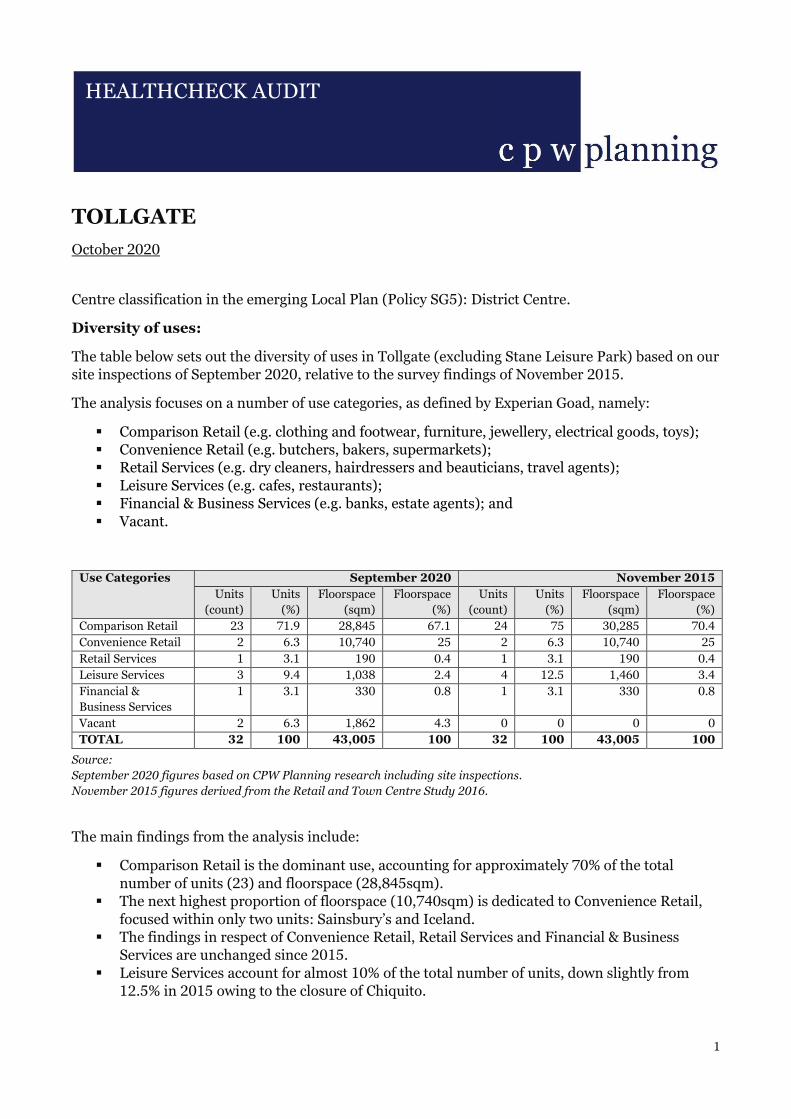
1
TOLLGATE
October 2020
Centre classification in the emerging Local Plan (Policy SG5): District Centre.
Diversity of uses:
The table below sets out the diversity of uses in Tollgate (excluding Stane Leisure Park) based on our
site inspections of September 2020, relative to the survey findings of November 2015.
The analysis focuses on a number of use categories, as defined by Experian Goad, namely:
▪ Comparison Retail (e.g. clothing and footwear, furniture, jewellery, electrical goods, toys);
▪ Convenience Retail (e.g. butchers, bakers, supermarkets);
▪ Retail Services (e.g. dry cleaners, hairdressers and beauticians, travel agents);
▪ Leisure Services (e.g. cafes, restaurants);
▪ Financial & Business Services (e.g. banks, estate agents); and
▪ Vacant.
Use Categories September 2020 November 2015
Units
(count)
Units
(%)
Floorspace
(sqm)
Floorspace
(%)
Units
(count)
Units
(%)
Floorspace
(sqm)
Floorspace
(%)
Comparison Retail 23 71.9 28,845 67.1 24 75 30,285 70.4
Convenience Retail 2 6.3 10,740 25 2 6.3 10,740 25
Retail Services 1 3.1 190 0.4 1 3.1 190 0.4
Leisure Services 3 9.4 1,038 2.4 4 12.5 1,460 3.4
Financial &
Business Services
1 3.1 330 0.8 1 3.1 330 0.8
Vacant 2 6.3 1,862 4.3 0 0 0 0
TOTAL 32 100 43,005 100 32 100 43,005 100
Source:
September 2020 figures based on CPW Planning research including site inspections.
November 2015 figures derived from the Retail and Town Centre Study 2016.
The main findings from the analysis include:
▪ Comparison Retail is the dominant use, accounting for approximately 70% of the total
number of units (23) and floorspace (28,845sqm).
▪ The next highest proportion of floorspace (10,740sqm) is dedicated to Convenience Retail,
focused within only two units: Sainsbury’s and Iceland.
▪ The findings in respect of Convenience Retail, Retail Services and Financial & Business
Services are unchanged since 2015.
▪ Leisure Services account for almost 10% of the total number of units, down slightly from
12.5% in 2015 owing to the closure of Chiquito.
HEALTHCHECK AUDIT

2
Tollgate medical centre is not recorded in the table above. It represents an important facility within
an area lacking in the provision of services and community facilities.
Stane Leisure Park, which sits to the west of the District Centre, is currently occupied by four
Leisure Services (namely a public house, coffee shop and two restaurants). These uses have come
forward since the 2016 Study.
Vacancy levels:
There are currently two vacant premises at Tollgate: the former Staples / Office Outlet at Tollgate
West Retail Park (1,440sqm) and the former Chiquito restaurant (422sqm).
Staples / Office Outlet fell into administration in 2018 while the Restaurant Group, which owns
Chiquito, closed the majority of its restaurants in March 2020 in response to the Covid-19 crisis (it
is unclear whether the Tollgate closure is temporary or permanent).
Stane Leisure Park includes two vacant restaurants.
Retailer representation and the balance between independent and multiple stores:
The table below identifies current retailer representation at Tollgate.
Tollgate Centre Tollgate West Retail Park Solus
AHF (Anglia Home Furnishings)
Argos
Bensons for Beds
Boots
Carpetright
Dreams
Harveys
Iceland
Next / Next Home
SCS
Smyths Toys
Sports Direct
Tapi Carpets
Wren Kitchens
B&M Bargains
Currys & PC World
Hughes Electrical
The Carphone Warehouse
Hobbycraft
Homebase
Magnet
Sainsbury’s
Source:
CPW Planning research including site inspections (September 2020).
Since the 2016 Study, Tapi Carpets has replaced Carpets 4 Less (which continues to trade elsewhere
in Colchester at Turner Rise) and a new Hobbycraft has opened on the site of the former Seapets
unit.
The centre’s food and beverage offer includes McDonalds, Costa Coffee, Harvester and Frankie &
Benny’s; while the adjacent Stane Leisure Park accommodates Starbucks, KFC, Nando’s and a
McMullen’s public house.
Customers’ experience and behaviour:
In the absence of any up-to-date survey evidence, we outline below the relevant findings of the 2016
Study.
Based on the results of the 2016 household interview survey, Tollgate is the most popular main
food shopping destination for consumers in Colchester’s catchment area. High proportions of
consumers from Colchester Borough in particular do most of their main food shopping at the

3
centre (most likely the Sainsbury’s superstore) including 38% from Zone 6 [Rural West], 29% from
Zone 1 [Colchester] and 11.9% from Zone 3 [Rural South].
Unsurprisingly, given the type and scale of the centre’s comparison goods shopping offer, Tollgate
directly competes with Colchester Town Centre and serves a Borough-wide catchment area. It is
clearly also a principal shopping destination for consumers outside of Colchester Borough,
securing substantial market shares of expenditure on certain comparison goods sub-categories
from, inter alia, Zone 4 [Clacton], Zone 5 [Frinton / Harwich], Zone 7 [Halstead], Zone 8
[Braintree] and Zone 9 [Witham].
To this end, Tollgate’s comparison goods shopping offer is particularly strong in terms of
furniture, carpets and other floor coverings; household textiles and soft furnishings; household
appliances; audiovisual equipment; and hardware, DIY goods, decorating supplies and garden
products.
Tollgate further secures substantial market shares of expenditure on the other comparison goods
subcategories – namely clothing and footwear; chemists and medical goods, cosmetics and other
beauty products; and all other comparison goods – from Zones 1, 3 and 6 in particular.
We consider the recent changes to retailer representation (identified above) are likely to have had a
limited effect on the centre’s market shares of comparison goods expenditure. Overall, we assess
that the 2016 household survey still provides a realistic picture of Tollgate’s influence over shopping
patterns across the catchment area.
Pedestrian flows:
During our site inspections, we observed the highest pedestrian flows within the Tollgate Centre
(particularly at its western end close to Argos and Iceland). Its substantial surface level car park was
at approximately 80% capacity.
The adjacent Tollgate West Retail Park was less busy; B&M Bargains appeared to be the most
popular store.
Accessibility:
Tollgate is situated within the Stanway area approximately 5km to the west of Colchester Town
Centre, off London Road (A1124) and adjacent to Junction 26 of the A12. It is therefore highly
accessible by private car and has extensive surface level car parking.
There are bus stops along London Road and Tollgate West respectively, which provide services
to/from the town centre and surrounding communities.
Tollgate is not served by a rail station.
Environmental quality:
Tollgate comprises purpose-built retail parks and a large Sainsbury’s superstore, with significant
areas dedicated to surface level car parking. It also includes several ‘solus’ retail and leisure
operators such as Homebase, Hobbycraft and Harvester.
The centre appears generally well maintained but (as identified in the 2016 Study) significant traffic
movements affect the pedestrian experience and act as a barrier between the centre’s various
components.
Perception of safety:
We identified no adverse issues with regards to safety or security during our site inspections, which
were conducted during the day.

4
Opening hours and the evening economy:
Sainsbury’s is open from 07:00 to 22:00 Monday-Saturday, with reduced trading hours on Sundays.
The adjacent retail parks and warehouses are generally open until 18:00 or 19:00 throughout the
week, although there are exceptions (e.g. Argos and Hobbycraft trade until 20:00 on weekdays).
The evening economy offer, which includes a small number of food and beverage operators, typically
extends until 21:00 or 22:00 throughout the week.
Commercial rents and yields:
There is no published information.
Barriers to business investment:
We have identified no evidence of significant barriers to new businesses opening and/or existing
businesses expanding that are specific to Tollgate, which is evidently the Borough’s most attractive
shopping destination outside and close to Colchester Town Centre.
Given the extant planning permissions for major new retail and leisure development (Tollgate
Village and Stane Park Phase 2 respectively), we assess that future business investment in this
location will largely depend on the extent and nature of operator demand.

1
PEARTREE ROAD
October 2020
Centre classification in the emerging Local Plan (Policy SG5): District Centre.
Diversity of uses:
The centre comprises a number of predominantly ‘bulky’ comparison goods stores and warehouses.
Other uses include a convenience store (Co-op), bakery, hot food takeaway, and gymnasiums.
Vacancy levels:
No vacant premises were identified during our site inspections.
Retailer representation and the balance between independent and multiple stores:
Fiveways Retail Park to the north of Peartree Road accommodates a Co-op convenience store
(including Subway and M&Co concessions), Poundstretcher, Mattressman, Barnardo’s and an
independent business selling windows, doors and conservatories. There is a Domino’s Pizza and a
Greggs (bakery), which has opened since the 2016 Study.
To the south and east lies several retail warehouses occupied by local and multiple retailers (or trade
outlets). These include Hatfields (furniture and interiors), Hatfields Budget Clearance, Easy
Bathrooms, It’s Bed Time, J. Franks Beds, Toolstation and Topps Tiles.
Conway Furniture and Lewis’s are the notable closures since the 2016 Study.
Customers’ experience and behaviour:
In the absence of any up-to-date survey evidence, we outline below the relevant findings of the 2016
Study.
Based on the results of the 2016 household interview survey, a relatively limited proportion of
consumers in Colchester’s catchment area do most of their main food and/or comparison goods
shopping at Peartree Road. However, the extent and type of provision would suggest that
consumers are prepared to travel and do ‘some’ of their shopping for certain comparison goods at
the centre, perhaps for occasional bulky goods.
Pedestrian flows:
During our site inspections, we observed the highest pedestrian flows within the retail park to the
north of Peartree Road, particularly between Poundstretcher and the Co-op store. The centre’s other
main retail areas, selling ‘bulky’ comparison goods, predominantly serve car users and levels of
footfall were relatively low.
Accessibility:
The centre is situated approximately 3.5km to the southwest of Colchester Town Centre, and less
than 2km to the southeast of Tollgate. There are bus stops along Peartree Road, and no rail station.
HEALTHCHECK AUDIT

2
Environmental quality:
The centre is characterised by retail parks and large format warehouses, with adjacent surface level
car parking.
Perception of safety:
We identified no adverse issues with regards to safety or security during our site inspections, which
were conducted during the day.
Opening hours and the evening economy:
Co-op is open from 07:00 to 21:00 Monday-Saturday, with reduced trading hours on Sundays. The
surrounding comparison goods stores and warehouses are generally open all week, but tend to close
earlier than the Co-op store.
There is no evening economy offer.
Commercial rents and yields:
There is no published information.
Barriers to business investment:
We have identified no evidence of significant barriers to new businesses opening and/or existing
businesses expanding that are specific to Peartree Road, although the lack of vacant premises could
be viewed as a barrier in terms of limiting business investment opportunities. It is considered that
future business investment in this location will largely depend on the demand for large format retail
stores and warehouses.
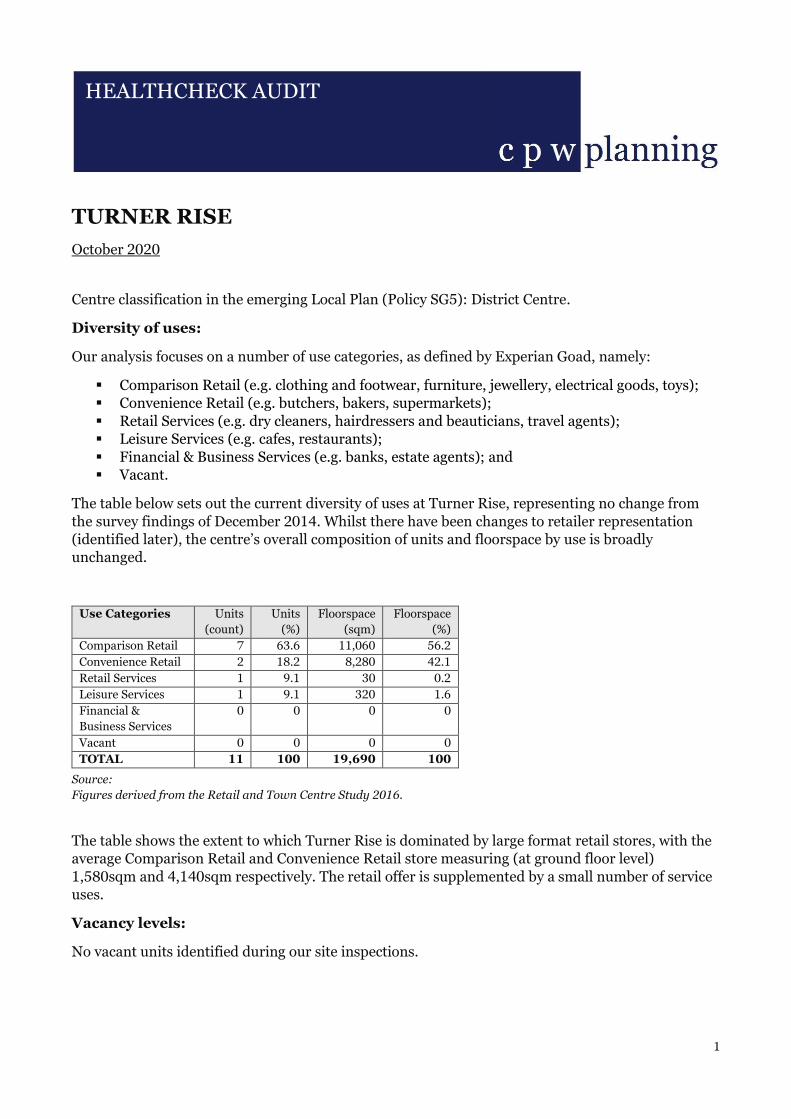
1
TURNER RISE
October 2020
Centre classification in the emerging Local Plan (Policy SG5): District Centre.
Diversity of uses:
Our analysis focuses on a number of use categories, as defined by Experian Goad, namely:
▪ Comparison Retail (e.g. clothing and footwear, furniture, jewellery, electrical goods, toys);
▪ Convenience Retail (e.g. butchers, bakers, supermarkets);
▪ Retail Services (e.g. dry cleaners, hairdressers and beauticians, travel agents);
▪ Leisure Services (e.g. cafes, restaurants);
▪ Financial & Business Services (e.g. banks, estate agents); and
▪ Vacant.
The table below sets out the current diversity of uses at Turner Rise, representing no change from
the survey findings of December 2014. Whilst there have been changes to retailer representation
(identified later), the centre’s overall composition of units and floorspace by use is broadly
unchanged.
Use Categories Units
(count)
Units
(%)
Floorspace
(sqm)
Floorspace
(%)
Comparison Retail 7 63.6 11,060 56.2
Convenience Retail 2 18.2 8,280 42.1
Retail Services 1 9.1 30 0.2
Leisure Services 1 9.1 320 1.6
Financial &
Business Services
0 0 0 0
Vacant 0 0 0 0
TOTAL 11 100 19,690 100
Source:
Figures derived from the Retail and Town Centre Study 2016.
The table shows the extent to which Turner Rise is dominated by large format retail stores, with the
average Comparison Retail and Convenience Retail store measuring (at ground floor level)
1,580sqm and 4,140sqm respectively. The retail offer is supplemented by a small number of service
uses.
Vacancy levels:
No vacant units identified during our site inspections.
HEALTHCHECK AUDIT

2
Retailer representation and the balance between independent and multiple stores:
Turner Rise includes a large Asda superstore with an in-store optician, pharmacy, and café. It sells
predominantly convenience goods (around 90% of total ground floor) with the remainder – plus
mezzanine floor – dedicated to comparison goods. The customer car park has a ‘drive thru’ click-
and-collect facility.
The adjacent retail park accommodates a range of multiple retailers: Poundland, Carpets 4 Less, Go
Outdoors, Home Bargains, Dunelm, Bensons for Beds, and Jollyes Petfood Superstore. The most
recent changes to retailer representation include Poundland and Carpets 4 Less replacing Bathstore
and We Do Home.
The food and drink offer comprises Pizza Hut, Costa Coffee and Subway (unchanged since the 2016
Study).
There are no independent stores.
Customers’ experience and behaviour:
In the absence of any up-to-date survey evidence, we outline below the relevant findings of the 2016
Study.
Based on the results of the 2016 household interview survey, the centre’s convenience goods
shopping offer (anchored by an Asda superstore) principally serves the central and northern parts
of Colchester Borough. Some 13.3% of consumers in Zone 1 [Colchester] do most of their main food
shopping at Turner Rise, followed by 4.3% in Zone 2 [Rural North].
Reflecting the centre’s comparison goods shopping offer, it secures substantial market shares of
expenditure on household textiles and soft furnishings – and is the Borough’s third most popular
shopping destination in this respect (behind Colchester Town Centre and Tollgate). High
proportions of consumers from Colchester Borough (i.e. Zones 1, 2 and 3) and also from the wider
catchment area (including Zones 4, 5, 6 and 7) do most of their shopping for such goods at Turner
Rise.
The centre secures relatively limited market shares of expenditure on other comparison goods
subcategories, with the exception of chemists and medical goods, cosmetics and other beauty
products. For example, 7.1% of consumers in Zone 1 [Colchester] do most of their shopping for
such goods at Turner Rise and this is likely to be attributable to the Asda superstore.
We consider the recent changes to retailer representation (identified above) are likely to have had a
limited effect on the centre’s market shares of comparison goods expenditure, particularly in respect
of the ‘bulky’ sub-categories (e.g. household textiles and soft furnishings, furniture and floor
coverings).
Pedestrian flows:
During our site inspections, we observed the highest pedestrian flows in and around the Asda
superstore. Its customer car park was at 70-80% capacity, while the surface level car parking
dedicated to the adjacent retail park was less busy (approximately 60% capacity).
Accessibility:
Turner Rise is situated less than two kilometres to the north of Colchester Town Centre, to the
immediate north of the railway lines serving nearby Colchester rail station. Bus stops within Asda’s
customer car park and along the A134 provide services to/from the town centre and surrounding
communities.

3
Environmental quality:
The centre comprises a large superstore (Asda) and a purpose-built retail park, focused around
substantial surface level car parking. It appears generally well maintained.
Perception of safety:
We identified no adverse issues with regards to safety or security during our site inspections, which
were conducted during the day.
Opening hours and the evening economy:
Asda is open 24-hours on weekdays, closing at 22:00 on Saturdays and with reduced Sunday trading
hours (10:00 to 16:00). The adjacent retail park is generally open until 21:00 throughout the week.
The evening economy offer is limited to Pizza Hut, which opens from lunchtime until 22:00 or 23:00
throughout the week.
Commercial rents and yields:
There is no published information.
Barriers to business investment:
We have identified no evidence of significant barriers to new businesses opening and/or existing
businesses expanding (aside from the finding that the retail park is fully occupied). Future business
investment at Turner Rise will largely depend on the demand for large format retail stores, while the
substantial surface level car park could provide opportunities for additional click-and-collect
facilities and other convenience-based services.

1
HIGHWOODS
October 2020
Centre classification in the emerging Local Plan (Policy SG5): District Centre.
Diversity of uses:
Highwoods is dominated by a Tesco Extra superstore with in-store concessions including Harris &
Hoole (café), Florence & Fred (clothing range), Max (print shop) and a pharmacy. The customer car
park has a ‘drive thru’ click-and-collect facility. The superstore sells predominantly convenience
goods (around 70% of total ground floor) with the remainder dedicated to comparison goods.
Other uses within the adjacent shopping centre include a dentist, post office, newsagents, dry
cleaners, hairdressers, and a coffee shop. There is also a Timpson kiosk outside the Tesco Extra.
Vacancy levels:
During our site inspections, we identified one vacant unit within the shopping centre adjacent to the
Tesco Extra.
Retailer representation and the balance between independent and multiple stores:
Tesco Extra and Timpson are the only national multiple retailers. The remainder of the centre
comprises independent stores (identified above).
Customers’ experience and behaviour:
In the absence of any up-to-date survey evidence, and given there has been few notable changes in
the centre’s offer and performance, we identify the relevant findings of the 2016 Study as follows:
Based on the results of the 2016 household interview survey, Tesco Extra is the Borough’s second
most popular main food shopping destination (behind the Sainsbury’s superstore at Tollgate).
High proportions of consumers do most of their main food shopping at Tesco Extra including some
19.2% from Zone 1 [Colchester], 10.5% from Zone 3 [Rural South] and 8.2% from Zone 2 [Rural
North].
The centre secures relatively limited market shares of comparison goods expenditure from
Colchester’s catchment area.
Pedestrian flows:
At the time of our site inspections (weekday afternoon) the Tesco Extra superstore was reasonably
busy. Its large customer car park was at 60-70% capacity.
Pedestrian flows between the superstore and the adjacent shopping centre were relatively modest.
HEALTHCHECK AUDIT

2
Accessibility:
The centre is situated approximately 2.5km to the northeast of Colchester Town Centre, off
Highwoods Approach. It is surrounded by residential areas and therefore serves a large walk-in
catchment.
Highwoods is easily accessible by car. There are bus stops (Highwoods Square) close to the shopping
centre.
Environmental quality:
The centre is characterised by the large superstore and its surface level car park.
The pedestrian thoroughfare between Tesco Extra and the adjacent shopping centre is poor and in
need of improvement, not least to encourage linked-trips (at the time of our site inspections a
section of the public realm was cordoned off).
Perception of safety:
We identified no adverse issues with regards to safety or security during our site inspections, which
were conducted during the day. However, we consider the area of public realm between Tesco Extra
and the adjacent shopping centre is likely to feel unwelcoming to pedestrians, especially after-dark.
Opening hours and the evening economy:
Tesco Extra is open from 06:00 to midnight Monday-Saturday, with reduced Sunday trading hours.
The adjacent shopping centre is generally open throughout the week.
The centre is lacking any evening economy.
Commercial rents and yields:
There is no published information.
Barriers to business investment:
We have identified no evidence of significant barriers to new businesses opening and/or existing
businesses expanding that are specific to Highwoods, although the lack of vacant premises could be
viewed as a barrier in terms of limiting business investment opportunities. The substantial surface
level car park could provide opportunities for additional click-and-collect facilities and other
convenience-based services.

Appendix B (Updated Retail Capacity Tables)

Catchment Area Population and Expenditure
Table: 1CATCHMENT AREA POPULATION FORECASTS
Base YearZone Postcode Sectors 2020 2023 2028 2033 BLANK COLUMN
1 147,872 152,470 159,054 164,851 2 36,366 37,014 38,180 39,199 3 46,879 48,191 50,224 52,083 4 69,259 70,987 73,510 75,904 5 46,889 48,155 50,214 52,237 6 36,327 36,986 38,084 38,976 7 22,172 22,644 23,382 24,058 8 62,788 63,658 64,780 65,871 9 39,569 40,137 40,551 40,989
TOTAL 508,121 520,242 537,979 554,168
Source:
Table: 2CATCHMENT AREA PER CAPITA EXPENDITUREPrice Basis: 2019 Prices
Catchment Zone Base Year Base Year2020 2023 2028 2033 BLANK COLUMN 2020 2023 2028 2033 BLANK COLUMN
1 1,987 1,923 1,962 1,998 3,283 4,059 4,463 4,8602 2,086 2,044 2,110 2,169 3,519 4,405 4,898 5,3843 2,016 1,956 1,998 2,034 3,374 4,183 4,603 5,0104 1,910 1,857 1,909 1,951 2,861 3,566 3,949 4,3165 1,896 1,841 1,880 1,907 2,963 3,683 4,050 4,3946 2,150 2,106 2,178 2,246 3,617 4,527 5,042 5,5607 2,275 2,222 2,291 2,350 3,686 4,603 5,112 5,6078 2,132 2,098 2,195 2,278 3,459 4,351 4,904 5,4439 2,223 2,186 2,303 2,405 3,612 4,540 5,154 5,755
Catchment Area Average 2,039 1,986 2,044 2,095 3,310 4,123 4,573 5,010
Expenditure on Special Formsof Trading (%)* 6.5 7.0 7.5 8.0 20.0 21.5 23.5 25.0
Catchment Zone Base Year Base Year2020 2023 2028 2033 BLANK COLUMN 2020 2023 2028 2033 BLANK COLUMN
1 1,858 1,788 1,815 1,838 2,627 3,186 3,415 3,645 2 1,950 1,901 1,952 1,996 2,815 3,458 3,747 4,038 3 1,885 1,819 1,848 1,871 2,699 3,284 3,522 3,757 4 1,785 1,727 1,766 1,795 2,289 2,799 3,021 3,237 5 1,773 1,712 1,739 1,755 2,371 2,891 3,098 3,295 6 2,010 1,959 2,014 2,066 2,894 3,554 3,857 4,170 7 2,127 2,066 2,119 2,162 2,949 3,613 3,911 4,206 8 1,994 1,951 2,030 2,096 2,767 3,416 3,752 4,082 9 2,079 2,033 2,131 2,213 2,889 3,564 3,943 4,316
Catchment Area Average 1,906 1,847 1,891 1,927 2,648 3,237 3,498 3,758
Source:from the Retail Expenditure Guide 2020/21 published by Precisely) and Experian Retail Planner Briefing Note 17.
CO15 1, 2, 3, 4, 5, 6; CO16 7, 8, 9.CO12 3, 4, 5; CO13 0, 9; CO14 8; CO16 0.CO5 0, 9; CO6 1, 2; CO8 5.CO9 1, 2, 3.CM7 1, 2, 3, 5, 9; CM77 6, 7, 8.CM3 2; CM8 1, 2, 3.
Forecasting Years
CO1 1, 2; CO2 7, 8, 9; CO3 0, 3, 4, 8, 9; CO4 0, 3, 5, 9; CO6 3.CO6 4, 5; CO7 6; CO10 5; CO11 1, 2; IP7 5. CO2 0; CO5 7, 8; CO7 0, 7, 8, 9.
Forecasting Years
Per Capita Expenditure Including Special Form of Trading Per Capita Expenditure Including Special Form of TradingCONVENIENCE GOODS COMPARISON GOODS
Precisely 'Anysite' Report for the Catchment Area (October 2020) for per capita expenditure. SFT deductions by CPW Planning, based on forecasts by Oxford Economics
Precisely 'Anysite' Report for the Catchment Area, October 2020.
Forecasting Years Forecasting Years
Per Capita Expenditure EXCLUDING* Special Form of Trading Per Capita Expenditure EXCLUDING* Special Form of TradingForecasting Years
DTZ RECAP Model 1

Table: 3CATCHMENT AREA EXPENDITURE FORECASTSCatchmentZone 2020 2023 2028 2033 BLANK COLUMN 2020 2023 2028 2033 BLANK COLUMN
(£000) (£000) (£000) (£000) (£000) (£000) (£000) (£000) (£000) (£000)
1 274,784 272,615 288,664 303,063 388,416 485,845 543,096 600,936 2 70,919 70,373 74,515 78,233 102,384 128,005 143,073 158,295 3 88,352 87,666 92,827 97,459 126,536 158,238 176,868 195,689 4 123,658 122,610 129,808 136,255 158,530 198,693 222,074 245,696 5 83,144 82,461 87,307 91,651 111,155 139,205 155,588 172,138 6 73,013 72,450 76,714 80,541 105,118 131,435 146,906 162,535 7 47,167 46,791 49,544 52,013 65,378 81,818 91,448 101,176 8 125,190 124,193 131,498 138,050 173,763 217,443 243,037 268,894 9 82,251 81,596 86,395 90,699 114,324 143,055 159,893 176,904
TOTALS 968,481 960,755 1,017,270 1,067,965 1,345,604 1,683,737 1,881,983 2,082,263
Source: Tables 1 and 2
Table: 4COMPARISON GOODS PER CAPITA EXPENDITURE BY GOODS TYPE
Per Capita Comparison Goods Expenditure in 2020 for the catchment area as a whole 2019 Prices
Clothing & footwearFurniture & floor
coverings Household textilesDomestic
appliancesAudio-visual &
computer equipmentDIY goods &
decorating supplies
Chemist's goods, medical & beauty
productsAll other comparison
goodsTotal Comparison
Goods
Including SFT (£) 637 167 120 169 345 203 549 1,120 3,310 Deduction for SFT (%) 23.0 12.0 14.0 22.5 33.0 8.0 8.5 23.6 20.0 Excluding SFT (£) 490 147 103 131 231 187 502 856 2,648
Source: Precisely 'Anysite' Report for the Catchment Area (October 2020) for per capita expenditure.SFT deductions estimated by CPW Planning.
Table: 5CATCHMENT AREA COMPARISON GOODS EXPENDITURE BY GOODS TYPE IN 2020Catchment Clothing & Furniture/ Household Household Audio-visual Hardware, DIY, Chemists, medcl All other
Zone footwear florcvrgs etc Textiles Appliances equipment garden prdcts & beauty goods comprsn gds
(£000) (£000) (£000) (£000) (£000) (£000) (£000) (£000)
1 71,946 21,556 15,138 19,212 33,906 27,394 73,684 125,596 2 18,965 5,682 3,990 5,064 8,937 7,221 19,423 33,106 3 23,438 7,023 4,931 6,259 11,046 8,924 24,004 40,916 4 29,365 8,798 6,178 7,841 13,838 11,181 30,074 51,261 5 20,589 6,169 4,332 5,498 9,703 7,840 21,087 35,942 6 19,471 5,834 4,097 5,199 9,176 7,414 19,941 33,990 7 12,110 3,628 2,548 3,234 5,707 4,611 12,403 21,140 8 32,186 9,644 6,772 8,595 15,168 12,255 32,963 56,187 9 21,176 6,345 4,456 5,655 9,980 8,063 21,688 36,967
TOTALS 249,247 74,679 52,442 66,556 117,461 94,904 255,266 435,106
Source: Tables 1 and 4
CONVENIENCE GOODS COMPARISON GOODSTOTAL RETAIL EXPENDITURE
DTZ RECAP Model 2

Scenario 1
Table: 6CONVENIENCE GOODS MARKET SHARES IN 20202020
Zones Main Food Top-up WEIGHTEDconvenience AVERAGE
Q1 Q3
70 30 100(%) (%) (%)
1 7.7 13.0 9.32 2.0 1.2 1.83 7.0 2.6 5.74 0.0 0.0 0.05 0.0 1.3 0.46 4.5 1.0 3.57 0.8 2.4 1.38 1.2 0.0 0.89 0.0 0.0 0.0
Sources: Household Interview Survey 2016.Expenditure weighting by CPW Planning.
Table: 7
COMPARISON GOODS MARKET SHARES BY GOODS TYPE IN 20202020 Allocations to
Colchester Town Centre
Indicated by Household Interview SurveyClothing & Furniture/ Household Household Audio-visual Hardware, DIY, Chemists, medcl All other WEIGHTED
footwear florcvrgs etc Textiles Appliances equipment garden products & beauty goods comparison gds AVERAGEQ4 Q5 Q6 Q7 Q8 Q9 Q10 Q11
Zones490 147 103 131 231 187 502 856 2,648 (%) (%) (%) (%) (%) (%) (%) (%) (%)
1 69.7 12.5 25.4 8.7 9.7 5.8 33.3 75.6 47.02 41.9 23.3 13.9 6.4 10.6 6.5 8.7 45.2 27.63 65.8 16.7 34.8 11.8 14.9 12.4 31.0 53.0 40.24 33.5 10.3 10.0 2.8 2.5 0.7 0.0 14.3 12.25 58.8 24.1 24.8 3.6 3.2 3.5 0.8 38.5 26.56 62.7 12.6 19.9 5.0 5.5 6.5 8.4 56.1 34.07 26.1 13.3 22.1 5.0 5.5 0.0 3.1 31.5 17.98 6.8 2.5 4.1 1.4 0.9 0.7 1.8 2.2 2.89 5.9 2.3 7.6 4.1 4.1 0.0 0.0 1.8 2.7
Sources: Household Interview Survey 2016.Table 4 for expenditure weights.
Colchester Town Centre
Colchester Town Centre
Expenditure weighting
Expenditure weighting
DTZ RECAP Model 3

Table: 8MARKET SHARES ATTRACTED FROM THE CATCHMENT AREAScenario: 1 Location: Colchester Town Centre
Market shares correction factors: Convenience Goods: 140 % of survey indicated figuresComparison Goods: 80 % of survey indicated figures
CatchmentZone
2020 2023 2028 2033 BLANK COLUMN 2020 2023 2028 2033 BLANK COLUMN
(%) (%) (%) (%) (%) (%) (%) (%) (%) (%)
1 13 13 13 13 38 38 38 382 2 2 2 2 22 22 22 223 8 8 8 8 32 32 32 324 0 0 0 0 10 10 10 105 1 1 1 1 21 21 21 216 5 5 5 5 27 27 27 277 2 2 2 2 14 14 14 148 1 1 1 1 2 2 2 29 0 0 0 0 2 2 2 2
Sources: CPW Planning for market share corrections.
CONVENIENCE GOODS COMPARISON GOODS
Baseline - Market shares indicated by the Household Interview Survey 2016 remain unchanged throughout the forecasting period.
PROPORTION OF CATCHMENT AREA EXPENDITURE ATTRACTED
DTZ RECAP Model 4

Table: 9COMPARISON GOODS SALES BY GOODS TYPE IN 2020Catchment 2020 Sales in Colchester Town Centre
Zones By Comparison Goods Type.Clothing & Furniture/ Household Household Audio-visual Hardware, DIY, Chemists, medcl All other
footwear florcvrgs etc Textiles Appliances equipment garden products & beauty goods comparison gds
(£000) (£000) (£000) (£000) (£000) (£000) (£000) (£000)
1 40,117 2,156 3,076 1,337 2,631 1,271 19,629 75,9602 6,357 1,059 444 259 758 375 1,352 11,9713 12,338 938 1,373 591 1,317 885 5,953 17,3484 7,870 725 494 176 277 63 0 5,8645 9,685 1,189 859 158 248 220 135 11,0706 9,767 588 652 208 404 386 1,340 15,2557 2,529 386 450 129 251 0 308 5,3278 1,751 193 222 96 109 69 475 9899 1,000 117 271 185 327 0 0 532
TOTALS 91,413 7,351 7,842 3,140 6,322 3,268 29,192 144,318
MARKETSHARES 36.7% 9.8% 15.0% 4.7% 5.4% 3.4% 11.4% 33.2%
Table: 10FORECAST RETAIL SALESScenario: 1 Location: Colchester Town Centre
Catchmentzone
2020 2023 2028 2033 BLANK COLUMN 2020 2023 2028 2033 BLANK COLUMN
(£000) (£000) (£000) (£000) (£000) (£000) (£000) (£000) (£000) (£000)
1 35,722 35,440 37,526 39,398 147,598 184,621 206,377 228,3562 1,418 1,407 1,490 1,565 22,524 28,161 31,476 34,8253 7,068 7,013 7,426 7,797 40,492 50,636 56,598 62,6204 0 0 0 0 15,853 19,869 22,207 24,5705 831 825 873 917 23,343 29,233 32,673 36,1496 3,651 3,622 3,836 4,027 28,382 35,488 39,665 43,8847 943 936 991 1,040 9,153 11,454 12,803 14,1658 1,252 1,242 1,315 1,381 3,475 4,349 4,861 5,3789 0 0 0 0 2,286 2,861 3,198 3,538
TOTALS 50,886 50,486 53,457 56,124 293,106 366,673 409,857 453,485
CONVENIENCE GOODS COMPARISON GOODSRETAIL SALES BY CATCHMENT ZONE
Baseline - Market shares indicated by the Household Interview Survey 2016 remain unchanged throughout the forecasting period.
DTZ RECAP Model 5

Table: 11
SALES CAPACITY OF EXISTINGMAIN FOOD & CONVENIENCE GOODS SHOPS AND STORES IN 2020Store Net Convenience Net convnce Convenience Convenience
Floorspace Goods Goods Goods sales Goods salesAllocation Floorspace Density
(sq m) (%) (sq m) (£ per sq m) (£000)
Sainsbury's (Priory Walk) 1,235 95 1,173 10,900 12,788M&S Food Hall (High Street) 1,058 9,821 10,386Iceland (St John's Walk) 480 98 470 7,219 3,396Other convenience goods shops and stores 5,649 85 4,802 5,000 24,010
ALL STORES 7,364 7,503 6,741 50,579
Sources: Retail and Town Centre Study 2016. Experian Goad. CPW Planning.
Table: 12SALES CAPACITY OF COMMITTED RETAIL DEVELOPMENTS 2020CONVENIENCE GOODSStore/Scheme Net Convenience Net Conv Gds Conv Goods Conv Goods
Floorspace Goods Floorspace Sales Density SalesAllocation
(sq m) (%) (sq m) (£ p sq m net) (£000)
170 95 162 5,000 808 150 95 143 5,000 713
ALL STORES 320 304 5,000 1,520
COMPARISON GOODSStore/Scheme Gross Net to Gross Net Sales Sales
Floorspace Ratio Floorspace Density(sq m) (%) (sq m) (£ p sq m net) (£000)
2,410 85 2,049 6,000 12,291
ALL STORES AND SCHEMES 2,410 2,049 6,000 12,291
Sources: Colchester Borough Council. Experian Goad. CPW Planning.
Vacant Town Centre 'Comparison Goods' Floorspace
Alumno Site, Queen Street (planning application ref. 182120)Former Co-op Department Store, Long Wyre Street (planning application ref. 170424)
DTZ RECAP Model 6

Table: 13FORECAST RETAIL CAPACITYScenario: 1 Location: Colchester Town Centre
ComparisonGrowth in sales per sq m from shop floorspace existing in 2020 Goods: 2.00 % pa 2020 to 2033
2020 2023 2028 2033 BLANK COLUMN 2020 2023 2028 2033 BLANK COLUMN
Residents'Spending £000 50,886 50,486 53,457 56,124 293,106 366,673 409,857 453,485Plus visitors'spending (%) - - - - 1.0 1.0 1.0 1.0 Totalspending (£000) 50,886 50,486 53,457 56,124 296,037 370,339 413,956 458,020
Existing shopfloorspace(sq m net) 7,503 7,503 7,503 7,503 47,763 47,763 47,763 47,763Salesper sq m net (£) 6,782 6,741 6,741 6,741 6,198 6,577 7,262 8,018Sales from extgflrspce (£000) 50,886 50,579 50,579 50,579 296,037 314,157 346,855 382,956
Available spending to support newshops (£000) 0 -94 2,878 5,544 0 56,182 67,101 75,064Less salescapacity ofcommitted newfloorspace (£000) 0 1,520 1,520 1,520 0 42,713 47,158 52,067Net availablespending for newshops (£000) 0 -1,614 1,358 4,024 0 13,469 19,942 22,997Sales per sq mnet in newshops (£) 12,000 12,000 12,000 12,000 6,000 6,367 7,030 7,762
Capacity fornew shopflrspc (sq m net) 0 -134 113 335 0 2,115 2,837 2,963
Market Share ofCatchment Area 5.3% 5.3% 5.3% 5.3% 21.8% 21.8% 21.8% 21.8%Expenditure
Sources: Experian Goad for Comparison Goods (ground floor) floorspace plus allowance by CPW Planning for mezzanine/upper floorspace.
Notes: Includes allowance for vacant 'comparison goods' floorspace in Colchester Town Centre; and comparison goods sales at Primark (Lion Walk).
Baseline - Market shares indicated by the Household Interview Survey 2016 remain unchanged throughout the forecasting period.
CONVENIENCE GOODS COMPARISON GOODS
DTZ RECAP Model 7

Scenario 1
Table: 14CONVENIENCE GOODS MARKET SHARES IN 20202020
Zones Main Food Top-up WEIGHTEDconvenience AVERAGE
Q1 Q3
70 30 100(%) (%) (%)
1 29.0 11.6 23.82 2.1 1.0 1.83 11.9 4.0 9.54 0.0 0.0 0.05 1.5 0.0 1.16 38.0 14.2 30.97 0.0 0.9 0.38 0.5 0.0 0.49 3.6 1.1 2.9
Sources: Household Interview Survey 2016.Expenditure weighting by CPW Planning.
Table: 15
COMPARISON GOODS MARKET SHARES BY GOODS TYPE IN 20202020 Allocations to
Tollgate
Indicated by Household Interview SurveyClothing & Furniture/ Household Household Audio-visual Hardware, DIY, Chemists, medcl All other WEIGHTED
footwear florcvrgs etc Textiles Appliances equipment garden products & beauty goods comparison gds AVERAGEQ4 Q5 Q6 Q7 Q8 Q9 Q10 Q11
Zones490 147 103 131 231 187 502 856 2,648 (%) (%) (%) (%) (%) (%) (%) (%) (%)
1 9.4 53.4 30.4 75.1 77.2 35.6 23.3 10.7 26.72 0.0 14.3 6.4 18.4 27.0 3.2 1.1 0.0 4.73 9.9 45.0 24.2 58.2 57.7 15.9 4.9 7.4 17.64 1.4 23.7 8.0 5.8 3.4 0.7 0.0 1.1 2.95 2.4 19.4 22.6 19.4 19.0 1.7 0.0 0.0 5.16 5.6 57.1 40.9 77.0 78.2 48.8 27.5 9.4 28.17 0.0 19.4 11.3 29.9 38.9 2.7 0.7 0.0 6.78 0.6 19.0 13.3 24.7 38.5 1.0 0.0 0.0 6.39 5.7 28.3 6.8 16.3 13.5 2.1 0.0 0.0 5.0
Sources: Household Interview Survey 2016. Table 4 for expenditure weights.
Tollgate
Tollgate
Expenditure weighting
Expenditure weighting
DTZ RECAP Model 8

Table: 16MARKET SHARES ATTRACTED FROM THE CATCHMENT AREAScenario: 1 Location: Tollgate
Market shares correction factors: Convenience Goods: 80 % of survey indicated figuresComparison Goods: 85 % of survey indicated figures
CatchmentZone
2020 2023 2028 2033 BLANK COLUMN 2020 2023 2028 2033 BLANK COLUMN
(%) (%) (%) (%) (%) (%) (%) (%) (%) (%)
1 19 19 19 19 23 23 23 232 1 1 1 1 4 4 4 43 8 8 8 8 15 15 15 154 0 0 0 0 2 2 2 25 1 1 1 1 4 4 4 46 25 25 25 25 24 24 24 247 0 0 0 0 6 6 6 68 0 0 0 0 5 5 5 59 2 2 2 2 4 4 4 4
Sources: CPW Planning for market share corrections.
CONVENIENCE GOODS COMPARISON GOODSPROPORTION OF CATCHMENT AREA EXPENDITURE ATTRACTED
Baseline - Market shares indicated by the Household Interview Survey 2016 remain unchanged throughout the forecasting period.
DTZ RECAP Model 9

Table: 17COMPARISON GOODS SALES BY GOODS TYPE IN 2020Catchment 2020 Sales in Tollgate
Zones By Comparison Goods Type.Clothing & Furniture/ Household Household Audio-visual Hardware, DIY, Chemists, medcl All other
footwear florcvrgs etc Textiles Appliances equipment garden products & beauty goods comparison gds
(£000) (£000) (£000) (£000) (£000) (£000) (£000) (£000)
1 5,749 9,784 3,912 12,264 22,249 8,290 14,593 11,4232 0 691 217 792 2,051 196 182 03 1,972 2,686 1,014 3,096 5,417 1,206 1,000 2,5744 349 1,772 420 387 400 67 0 4795 420 1,017 832 907 1,567 113 0 06 927 2,831 1,424 3,403 6,099 3,075 4,661 2,7167 0 598 245 822 1,887 106 74 08 164 1,557 766 1,804 4,964 104 0 09 1,026 1,526 258 783 1,145 144 0 0
TOTALS 10,607 22,464 9,087 24,258 45,780 13,301 20,510 17,192
MARKETSHARES 4.3% 30.1% 17.3% 36.4% 39.0% 14.0% 8.0% 4.0%
Table: 18FORECAST RETAIL SALESScenario: 1 Location: Tollgate
Catchmentzone
2020 2023 2028 2033 BLANK COLUMN 2020 2023 2028 2033 BLANK COLUMN
(£000) (£000) (£000) (£000) (£000) (£000) (£000) (£000) (£000) (£000)
1 52,209 51,797 54,846 57,582 89,336 111,744 124,912 138,2152 709 704 745 782 4,095 5,120 5,723 6,3323 7,068 7,013 7,426 7,797 18,980 23,736 26,530 29,3534 0 0 0 0 3,171 3,974 4,441 4,9145 831 825 873 917 4,446 5,568 6,224 6,8866 18,253 18,112 19,178 20,135 25,228 31,544 35,257 39,0087 0 0 0 0 3,923 4,909 5,487 6,0718 0 0 0 0 8,688 10,872 12,152 13,4459 1,645 1,632 1,728 1,814 4,573 5,722 6,396 7,076
TOTALS 80,716 80,083 84,797 89,027 162,440 203,190 227,122 251,300
Baseline - Market shares indicated by the Household Interview Survey 2016 remain unchanged throughout the forecasting period.
RETAIL SALES BY CATCHMENT ZONECONVENIENCE GOODS COMPARISON GOODS
DTZ RECAP Model 10

Table: 19
SALES CAPACITY OF EXISTINGMAIN FOOD & CONVENIENCE GOODS SHOPS AND STORES IN 2020Store Net Convenience Net convnce Convenience Convenience
Floorspace Goods Goods Goods sales Goods salesAllocation Floorspace Density
(sq m) (%) (sq m) (£ per sq m) (£000)
Sainsbury's (Western Approach) 10,650 58 6,177 10,900 67,329Iceland (The Tollgate Centre) 744 98 729 7,219 5,264
ALL STORES 11,394 6,906 10,511 72,593
Sources: Retail and Town Centre Study 2016. CPW Planning.
Table: 20SALES CAPACITY OF EXISTING COMPARISON GOODS FLOORSPACENet to gross ratio: 90 % (unless otherwise indicated) 2016
Store Gross Flrspce Net Flrspce Sales Density Sales2016 2016
(sq m) (sq m) (£per sqm net) (£000)
Comparison Goods Floorspace in stores & warehouses:Currys & PC World 1,900 1,710 7,000 11,970 The Carphone Warehouse [1] 280 252 n/a 2,000 Next 1,906 1,715 4,404 7,555 Next Home 1,850 1,665 3,600 5,994 B&M Bargains 1,160 1,044 3,452 3,604 Smyths Toys 1,394 1,255 n/a 6,145 Hughes Electrical 990 891 10,800 9,623 Dreams 1,050 945 n/a 1,391 AHF (Anglia Home Furnishings) 2,261 2,035 2,160 4,395 Sports Direct 1,755 1,580 5,497 8,683 Wren Kitchens 910 819 3,360 2,752 Harveys 860 774 2,177 1,685 Bensons For Beds [2] 600 540 2,177 1,176 Carpetright 1,270 1,143 1,266 1,447 Magnet 1,130 1,017 n/a 786 SCS 1,711 1,540 2,394 3,687 Tapi Carpets [3] 647 582 1,080 629 Boots 540 486 10,963 5,328 Argos 1,103 n/a n/a 6,606 Homebase [4] 5,528 4,726 1,309 6,187 Hobbycraft [3] 659 563 4,200 2,366 Comparison Goods Floorspace in main foodstores:Sainsbury's (Western Approach) n/a 4,473 8,300 37,126
29,755 4,407 131,133
Sources: Retail and Town Centre Study 2016. CPW Planning.
Notes:
(3) Estimated sales density.(4) 3,888 sq m net sales but 5% excluded for trade / non-retail sales; includes concessions (e.g. Bathstore).
Table: 21SALES CAPACITY OF COMMITTED RETAIL DEVELOPMENTS 2020CONVENIENCE GOODSStore/Scheme Net Convenience Net Conv Gds Conv Goods Conv Goods
Floorspace Goods Floorspace Sales Density SalesAllocation
(sq m) (%) (sq m) (£ p sq m net) (£000)
Tollgate Village (planning application ref. 150239) [1] n/a n/a 1,394 8,000 11,152 1,208 75 906 11,000 9,966 1,626 90 1,463 9,821 14,372
ALL STORES 2,834 3,763 35,490
COMPARISON GOODSStore/Scheme Gross Net to Gross Net Sales Sales
Floorspace Ratio Floorspace Density(sq m) (%) (sq m) (£ p sq m net) (£000)
n/a n/a 14,920 6,000 89,520 1,440 90 1,296 6,000 7,776 7,547 90 5,094 1,758 8,956 9,616 90 8,654 4,000 34,618
ALL STORES AND SCHEMES 18,603 29,965 140,869
Sources: Retail and Town Centre Study 2016. Colchester Borough Council. CPW Planning.
Notes:
Interview Survey of Shopping Patterns
(1) Currys & PC World concession.(2) Harveys upper floor.
Where no sales density is indicated (n/a), sales are based on average sales per outlet.
(2) 6,792 sq m net sales but 25% excluded for trade / non-retail sales. Excludes external space.
B&Q, Stane Retail Park, Stanway (planning application ref. 193163) [2]
M&S Food Hall, Stane Retail Park, Stanway (planning application ref. 193163)
Tollgate Village (planning application ref. 150239) [1]
(1) Maximum net floorspace figure as per condition 9 of the outline planning permission.
(3) Includes mezzanine space.
Vacant Retail Warehouse (Former Staples, Tollgate West Retail Park)
Other Bulky Goods Stores, Stane Retail Park, Stanway (planning application ref. 193163) [3]
Aldi, Stane Retail Park, Stanway (planning application ref. 193163)
TOTALS Trading at the date of the Household
DTZ RECAP Model 11

Table: 22FORECAST RETAIL CAPACITYScenario: 1 Location: Tollgate
ComparisonGrowth in sales per sq m from shop floorspace existing in 2020 Goods: 2.00 % pa 2020 to 2033
2020 2023 2028 2033 BLANK COLUMN 2020 2023 2028 2033 BLANK COLUMN
Residents'Spending £000 80,716 80,083 84,797 89,027 162,440 203,190 227,122 251,300Plus visitors'spending (%) - - - - 0.5 0.5 0.5 0.5 Totalspending (£000) 80,716 80,083 84,797 89,027 163,253 204,206 228,258 252,556
Existing shopfloorspace(sq m net) 6,906 6,906 6,906 6,906 29,755 29,755 29,755 29,755Salesper sq m net (£) 11,688 10,511 10,511 10,511 5,486 5,062 5,589 6,171Sales from extgflrspce (£000) 80,716 72,593 72,593 72,593 163,253 150,631 166,309 183,618
Available spending to support newshops (£000) 0 7,490 12,204 16,434 0 53,575 61,949 68,938Less salescapacity ofcommitted newfloorspace (£000) 0 35,490 35,490 35,490 0 149,492 165,051 182,229Net availablespending for newshops (£000) 0 -28,000 -23,286 -19,056 0 -95,916 -103,102 -113,291Sales per sq mnet in newshops (£) 12,000 12,000 12,000 12,000 6,000 6,367 7,030 7,762
Capacity fornew shopflrspc (sq m net) 0 -2,333 -1,941 -1,588 0 -15,064 -14,666 -14,596
Market Share ofCatchment Area 8.3% 8.3% 8.3% 8.3% 12.1% 12.1% 12.1% 12.1%Expenditure
Sources:
Notes:
Baseline - Market shares indicated by the Household Interview Survey 2016 remain unchanged throughout the forecasting period.
CONVENIENCE GOODS COMPARISON GOODS
DTZ RECAP Model 12

Scenario 1
Table: 23CONVENIENCE GOODS MARKET SHARES IN 20202020
Zones Main Food Top-up WEIGHTEDconvenience AVERAGE
Q1 Q3
70 30 100(%) (%) (%)
1 13.3 4.7 10.72 4.3 2.5 3.83 1.9 2.3 2.04 1.1 0.0 0.85 3.2 0.0 2.26 1.9 1.2 1.77 2.7 0.0 1.98 0.6 1.5 0.99 0.0 0.0 0.0
Sources: Household Interview Survey 2016.Expenditure weighting by CPW Planning.
Table: 24
COMPARISON GOODS MARKET SHARES BY GOODS TYPE IN 20202020 Allocations to
Turner Rise
Indicated by Household Interview SurveyClothing & Furniture/ Household Household Audio-visual Hardware, DIY, Chemists, medcl All other WEIGHTED
footwear florcvrgs etc Textiles Appliances equipment garden products & beauty goods comparison gds AVERAGEQ4 Q5 Q6 Q7 Q8 Q9 Q10 Q11
Zones490 147 103 131 231 187 502 856 2,648 (%) (%) (%) (%) (%) (%) (%) (%) (%)
1 1.3 1.4 23.6 0.5 0.0 4.1 7.1 1.1 3.32 0.0 0.0 10.0 0.0 0.0 1.3 3.7 0.0 1.23 0.0 0.0 16.8 0.0 0.0 0.0 0.9 2.6 1.74 0.7 1.5 9.0 0.7 0.0 0.0 0.0 0.0 0.65 1.0 0.0 8.0 0.0 0.0 0.0 0.0 0.0 0.56 1.2 0.0 13.9 0.0 0.0 0.0 2.3 0.0 1.27 2.3 3.7 5.9 1.2 1.3 0.0 1.9 0.0 1.48 0.0 0.0 2.5 0.0 0.9 0.0 0.0 0.0 0.29 0.0 0.0 2.5 0.0 0.0 0.0 0.0 0.0 0.1
Sources: Household Interview Survey 2016, with adjustments by CPW Planning. Table 4 for expenditure weights.
Turner Rise
Turner Rise
Expenditure weighting
Expenditure weighting
DTZ RECAP Model 13

Table: 25MARKET SHARES ATTRACTED FROM THE CATCHMENT AREAScenario: 1 Location: Turner Rise
Market shares correction factors: Convenience Goods: 160 % of survey indicated figuresComparison Goods: 210 % of survey indicated figures
CatchmentZone
2020 2023 2028 2033 BLANK COLUMN 2020 2023 2028 2033 BLANK COLUMN
(%) (%) (%) (%) (%) (%) (%) (%) (%) (%)
1 17 17 17 17 7 7 7 72 6 6 6 6 2 2 2 23 3 3 3 3 3 3 3 34 1 1 1 1 1 1 1 15 4 4 4 4 1 1 1 16 3 3 3 3 3 3 3 37 3 3 3 3 3 3 3 38 1 1 1 1 0 0 0 09 0 0 0 0 0 0 0 0
Sources: CPW Planning for market share corrections.
CONVENIENCE GOODS COMPARISON GOODSPROPORTION OF CATCHMENT AREA EXPENDITURE ATTRACTED
Baseline - Market shares indicated by the Household Interview Survey 2016 remain unchanged throughout the forecasting period.
DTZ RECAP Model 14

Table: 26COMPARISON GOODS SALES BY GOODS TYPE IN 2020Catchment 2020 Sales in Turner Rise
Zones By Comparison Goods Type.Clothing & Furniture/ Household Household Audio-visual Hardware, DIY, Chemists, medcl All other
footwear florcvrgs etc Textiles Appliances equipment garden products & beauty goods comparison gds
(£000) (£000) (£000) (£000) (£000) (£000) (£000) (£000)
1 1,964 634 7,502 202 0 2,359 10,986 2,9012 0 0 838 0 0 197 1,509 03 0 0 1,740 0 0 0 454 2,2344 432 277 1,168 115 0 0 0 05 432 0 728 0 0 0 0 06 491 0 1,196 0 0 0 963 07 585 282 316 81 156 0 495 08 0 0 356 0 287 0 0 09 0 0 234 0 0 0 0 0
TOTALS 3,904 1,193 14,076 398 442 2,556 14,407 5,135
MARKETSHARES 1.6% 1.6% 26.8% 0.6% 0.4% 2.7% 5.6% 1.2%
Table: 27FORECAST RETAIL SALESScenario: 1 Location: Turner Rise
Catchmentzone
2020 2023 2028 2033 BLANK COLUMN 2020 2023 2028 2033 BLANK COLUMN
(£000) (£000) (£000) (£000) (£000) (£000) (£000) (£000) (£000) (£000)
1 46,713 46,345 49,073 51,521 27,189 34,009 38,017 42,0662 4,255 4,222 4,471 4,694 2,048 2,560 2,861 3,1663 2,651 2,630 2,785 2,924 3,796 4,747 5,306 5,8714 1,237 1,226 1,298 1,363 1,585 1,987 2,221 2,4575 3,326 3,298 3,492 3,666 1,112 1,392 1,556 1,7216 2,190 2,173 2,301 2,416 3,154 3,943 4,407 4,8767 1,415 1,404 1,486 1,560 1,961 2,455 2,743 3,0358 1,252 1,242 1,315 1,381 0 0 0 09 0 0 0 0 0 0 0 0
TOTALS 63,039 62,541 66,222 69,524 40,845 51,093 57,111 63,192
Baseline - Market shares indicated by the Household Interview Survey 2016 remain unchanged throughout the forecasting period.
RETAIL SALES BY CATCHMENT ZONECONVENIENCE GOODS COMPARISON GOODS
DTZ RECAP Model 15

Table: 28
SALES CAPACITY OF EXISTINGMAIN FOOD & CONVENIENCE GOODS SHOPS AND STORES IN 2020Store Net Convenience Net convnce Convenience Convenience
Floorspace Goods Goods Goods sales Goods salesAllocation Floorspace Density
(sq m) (%) (sq m) (£ per sq m) (£000)
Asda (Petrolea Close) 6,096 75 4,572 14,600 66,751Iceland (Petrolea Close) 744 98 729 7,219 5,264
ALL STORES 6,840 5,301 13,585 72,015
Sources: Retail and Town Centre Study 2016. CPW Planning.
Table: 29SALES CAPACITY OF EXISTING COMPARISON GOODS FLOORSPACENet to gross ratio: 90 % (unless otherwise indicated) 2016
Store Gross Flrspce Net Flrspce Sales Density Sales2016 2016
(sq m) (sq m) (£per sqm net) (£000)
Comparison Goods Floorspace in stores & warehouses:Go Outdoors 4,217 3,795 2,500 9,488 Home Bargains [1] 1,650 1,485 4,000 5,940 Carpets 4 Less [1] 690 621 1,200 745 Dunelm 3,060 2,754 2,647 7,290 Bensons For Beds 1,030 927 2,117 1,962 Poundland [1] 830 747 3,400 2,540 Jollyes Petfood Superstore 490 441 2,292 1,011 Comparison Goods Floorspace in main foodstores:Asda (Petrolea Close) n/a 1,524 10,100 15,392
12,294 3,609 44,369
Sources: Retail and Town Centre Study 2016. CPW Planning.
Notes:
Table: 30SALES CAPACITY OF COMMITTED RETAIL DEVELOPMENTS 2020CONVENIENCE GOODSStore/Scheme Net Convenience Net Conv Gds Conv Goods Conv Goods
Floorspace Goods Floorspace Sales Density SalesAllocation
(sq m) (%) (sq m) (£ p sq m net) (£000)
ALL STORES - - -
COMPARISON GOODSStore/Scheme Gross Net to Gross Net Sales Sales
Floorspace Ratio Floorspace Density(sq m) (%) (sq m) (£ p sq m net) (£000)
ALL STORES AND SCHEMES - - -
Sources:
TOTALS Trading at the date of the HouseholdInterview Survey of Shopping Patterns
(1) Estimated sales density.
DTZ RECAP Model 16

Table: 31FORECAST RETAIL CAPACITYScenario: 1 Location: Turner Rise
ComparisonGrowth in sales per sq m from shop floorspace existing in 2020 Goods: 2.00 % pa 2020 to 2033
2020 2023 2028 2033 BLANK COLUMN 2020 2023 2028 2033 BLANK COLUMN
Residents'Spending £000 63,039 62,541 66,222 69,524 40,845 51,093 57,111 63,192Plus visitors'spending (%) - - - - - - - - Totalspending (£000) 63,039 62,541 66,222 69,524 40,845 51,093 57,111 63,192
Existing shopfloorspace(sq m net) 5,301 5,301 5,301 5,301 12,294 12,294 12,294 12,294Salesper sq m net (£) 11,892 13,585 13,585 13,585 3,322 4,145 4,577 5,053Sales from extgflrspce (£000) 63,039 72,015 72,015 72,015 40,845 50,966 56,270 62,127
Available spending to support newshops (£000) 0 -9,474 -5,793 -2,490 0 127 841 1,065Less salescapacity ofcommitted newfloorspace (£000) 0 0 0 0 0 0 0 0Net availablespending for newshops (£000) 0 -9,474 -5,793 -2,490 0 127 841 1,065Sales per sq mnet in newshops (£) 12,000 12,000 12,000 12,000 4,000 4,245 4,687 5,174
Capacity fornew shopflrspc (sq m net) 0 -790 -483 -208 0 30 179 206
Market Share ofCatchment Area 6.5% 6.5% 6.5% 6.5% 3.0% 3.0% 3.0% 3.0%Expenditure
Sources:
Notes:
COMPARISON GOODS
Baseline - Market shares indicated by the Household Interview Survey 2016 remain unchanged throughout the forecasting period.
CONVENIENCE GOODS
DTZ RECAP Model 17

Scenario 1
Table: 32CONVENIENCE GOODS MARKET SHARES IN 20202020
Zones Main Food Top-up WEIGHTEDconvenience AVERAGE
Q1 Q3
70 30 100(%) (%) (%)
1 0.4 3.7 1.42 0.0 0.0 0.03 2.1 7.0 3.64 0.0 0.0 0.05 0.0 0.0 0.06 0.0 0.0 0.07 0.0 0.0 0.08 0.6 0.0 0.49 0.0 0.0 0.0
Sources: Household Interview Survey 2016.Expenditure weighting by CPW Planning.
Table: 33
COMPARISON GOODS MARKET SHARES BY GOODS TYPE IN 20202020 Allocations to
Peartree Road
Indicated by Household Interview SurveyClothing & Furniture/ Household Household Audio-visual Hardware, DIY, Chemists, medcl All other WEIGHTED
footwear florcvrgs etc Textiles Appliances equipment garden products & beauty goods comparison gds AVERAGEQ4 Q5 Q6 Q7 Q8 Q9 Q10 Q11
Zones490 147 103 131 231 187 502 856 2,648 (%) (%) (%) (%) (%) (%) (%) (%) (%)
1 0.0 6.2 0.0 0.0 0.0 2.2 0.3 0.0 0.62 0.0 0.0 1.2 1.2 0.0 0.0 0.0 0.0 0.13 0.0 2.5 1.1 0.0 0.0 0.7 0.0 0.0 0.24 0.0 0.0 0.8 0.0 0.0 0.0 0.0 0.0 0.05 0.0 0.0 3.4 0.0 0.0 0.0 0.0 0.0 0.16 0.0 4.5 1.2 0.0 0.0 0.0 0.0 0.0 0.37 0.0 3.2 3.2 0.0 0.0 0.0 0.0 0.0 0.38 0.0 1.8 0.0 0.0 0.0 1.6 0.0 0.0 0.29 0.0 1.1 0.0 0.0 0.0 0.0 0.0 0.0 0.1
Sources: Household Interview Survey 2016. Table 4 for expenditure weights.
Peartree Road
Peartree Road
Expenditure weighting
Expenditure weighting
DTZ RECAP Model 18

Table: 34MARKET SHARES ATTRACTED FROM THE CATCHMENT AREAScenario: 1 Location: Peartree Road
Market shares correction factors: Convenience Goods: 120 % of survey indicated figuresComparison Goods: 500 % of survey indicated figures
CatchmentZone
2020 2023 2028 2033 BLANK COLUMN 2020 2023 2028 2033 BLANK COLUMN
(%) (%) (%) (%) (%) (%) (%) (%) (%) (%)
1 2 2 2 2 3 3 3 32 0 0 0 0 1 1 1 13 4 4 4 4 1 1 1 14 0 0 0 0 0 0 0 05 0 0 0 0 1 1 1 16 0 0 0 0 1 1 1 17 0 0 0 0 2 2 2 28 1 1 1 1 1 1 1 19 0 0 0 0 0 0 0 0
Sources: CPW Planning for market share corrections.
PROPORTION OF CATCHMENT AREA EXPENDITURE ATTRACTED
Baseline - Market shares indicated by the Household Interview Survey 2016 remain unchanged throughout the forecasting period.
CONVENIENCE GOODS COMPARISON GOODS
DTZ RECAP Model 19

Table: 35COMPARISON GOODS SALES BY GOODS TYPE IN 2020Catchment 2020 Sales in Peartree Road
Zones By Comparison Goods Type.Clothing & Furniture/ Household Household Audio-visual Hardware, DIY, Chemists, medcl All other
footwear florcvrgs etc Textiles Appliances equipment garden products & beauty goods comparison gds
(£000) (£000) (£000) (£000) (£000) (£000) (£000) (£000)
1 0 6,683 0 0 0 3,013 1,105 02 0 0 239 304 0 0 0 03 0 878 271 0 0 312 0 04 0 0 247 0 0 0 0 05 0 0 736 0 0 0 0 06 0 1,313 246 0 0 0 0 07 0 581 408 0 0 0 0 08 0 868 0 0 0 980 0 09 0 349 0 0 0 0 0 0
TOTALS 0 10,670 2,148 304 0 4,306 1,105 0
MARKETSHARES 0.0% 14.3% 4.1% 0.5% 0.0% 4.5% 0.4% 0.0%
Table: 36FORECAST RETAIL SALESScenario: 1 Location: Peartree Road
Catchmentzone
2020 2023 2028 2033 BLANK COLUMN 2020 2023 2028 2033 BLANK COLUMN
(£000) (£000) (£000) (£000) (£000) (£000) (£000) (£000) (£000) (£000)
1 5,496 5,452 5,773 6,061 11,652 14,575 16,293 18,0282 0 0 0 0 1,024 1,280 1,431 1,5833 3,534 3,507 3,713 3,898 1,265 1,582 1,769 1,9574 0 0 0 0 0 0 0 05 0 0 0 0 1,112 1,392 1,556 1,7216 0 0 0 0 1,051 1,314 1,469 1,6257 0 0 0 0 1,308 1,636 1,829 2,0248 1,252 1,242 1,315 1,381 1,738 2,174 2,430 2,6899 0 0 0 0 0 0 0 0
TOTALS 10,282 10,201 10,801 11,340 19,150 23,955 26,777 29,627
Baseline - Market shares indicated by the Household Interview Survey 2016 remain unchanged throughout the forecasting period.
RETAIL SALES BY CATCHMENT ZONECONVENIENCE GOODS COMPARISON GOODS
DTZ RECAP Model 20

Table: 37
SALES CAPACITY OF EXISTINGMAIN FOOD & CONVENIENCE GOODS SHOPS AND STORES IN 2020Store Net Convenience Net convnce Convenience Convenience
Floorspace Goods Goods Goods sales Goods salesAllocation Floorspace Density
(sq m) (%) (sq m) (£ per sq m) (£000)
Co-Op (Fiveways Retail Park) 1,470 85 1,250 8,400 10,496
ALL STORES 1,470 1,250 8,400 10,496
Sources: Retail and Town Centre Study 2016. CPW Planning.
Table: 38SALES CAPACITY OF EXISTING COMPARISON GOODS FLOORSPACENet to gross ratio: 90 % (unless otherwise indicated) 2016
Store Gross Flrspce Net Flrspce Sales Density Sales2016 2016
(sq m) (sq m) (£per sqm net) (£000)
Comparison Goods Floorspace in stores & warehouses:Poundstretcher 1,110 999 2,189 2,187 Barnado's 390 351 n/a 120 Mattressman 360 324 2,040 661 Hatfields of Colchester 2,370 2,133 1,855 3,957 Hatfields Budget Clearance 2,110 1,899 1,440 2,735 Topps Tiles 600 540 1,211 654 It's Bed Time 630 567 2,040 1,157 Other comparison goods stores (The Stanway Centre and Angora Business Park) 4,020 3,618 2,000 7,236 Comparison Goods Floorspace in main foodstores:Co-Op (Fiveways Retail Park) n/a 221 8,000 1,764
10,652 1,922 20,470
Sources: Retail and Town Centre Study 2016. CPW Planning.
Notes:
Table: 39SALES CAPACITY OF COMMITTED RETAIL DEVELOPMENTS 2020CONVENIENCE GOODSStore/Scheme Net Convenience Net Conv Gds Conv Goods Conv Goods
Floorspace Goods Floorspace Sales Density SalesAllocation
(sq m) (%) (sq m) (£ p sq m net) (£000)
ALL STORES - - -
COMPARISON GOODSStore/Scheme Gross Net to Gross Net Sales Sales
Floorspace Ratio Floorspace Density(sq m) (%) (sq m) (£ p sq m net) (£000)
ALL STORES AND SCHEMES - - -
Sources:
TOTALS Trading at the date of the HouseholdInterview Survey of Shopping Patterns
Where no sales density is indicated (n/a), sales are based on average sales per outlet.
DTZ RECAP Model 21
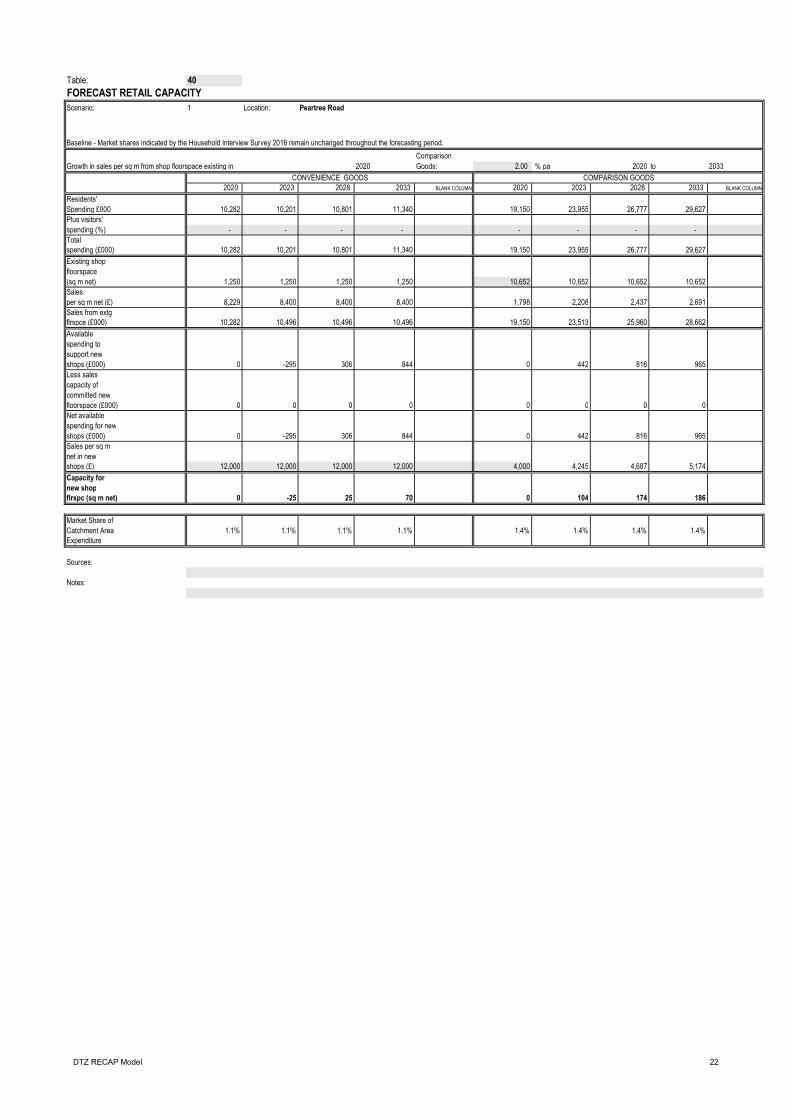
Table: 40FORECAST RETAIL CAPACITYScenario: 1 Location: Peartree Road
ComparisonGrowth in sales per sq m from shop floorspace existing in 2020 Goods: 2.00 % pa 2020 to 2033
2020 2023 2028 2033 BLANK COLUMN 2020 2023 2028 2033 BLANK COLUMN
Residents'Spending £000 10,282 10,201 10,801 11,340 19,150 23,955 26,777 29,627Plus visitors'spending (%) - - - - - - - - Totalspending (£000) 10,282 10,201 10,801 11,340 19,150 23,955 26,777 29,627
Existing shopfloorspace(sq m net) 1,250 1,250 1,250 1,250 10,652 10,652 10,652 10,652Salesper sq m net (£) 8,229 8,400 8,400 8,400 1,798 2,208 2,437 2,691Sales from extgflrspce (£000) 10,282 10,496 10,496 10,496 19,150 23,513 25,960 28,662
Available spending to support newshops (£000) 0 -295 306 844 0 442 816 965Less salescapacity ofcommitted newfloorspace (£000) 0 0 0 0 0 0 0 0Net availablespending for newshops (£000) 0 -295 306 844 0 442 816 965Sales per sq mnet in newshops (£) 12,000 12,000 12,000 12,000 4,000 4,245 4,687 5,174
Capacity fornew shopflrspc (sq m net) 0 -25 25 70 0 104 174 186
Market Share ofCatchment Area 1.1% 1.1% 1.1% 1.1% 1.4% 1.4% 1.4% 1.4%Expenditure
Sources:
Notes:
Baseline - Market shares indicated by the Household Interview Survey 2016 remain unchanged throughout the forecasting period.
CONVENIENCE GOODS COMPARISON GOODS
DTZ RECAP Model 22

Scenario 1
Table: 41CONVENIENCE GOODS MARKET SHARES IN 20202020
Zones Main Food Top-up WEIGHTEDconvenience AVERAGE
Q1 Q3
70 30 100(%) (%) (%)
1 19.2 13.6 17.52 8.2 3.5 6.83 10.5 4.5 8.74 0.0 0.0 0.05 1.5 0.8 1.36 2.7 0.0 1.97 0.8 0.0 0.68 1.5 0.0 1.19 0.0 0.0 0.0
Sources: Household Interview Survey 2016.Expenditure weighting by CPW Planning.
Table: 42
COMPARISON GOODS MARKET SHARES BY GOODS TYPE IN 20202020 Allocations to
Highwoods
Indicated by Household Interview SurveyClothing & Furniture/ Household Household Audio-visual Hardware, DIY, Chemists, medcl All other WEIGHTED
footwear florcvrgs etc Textiles Appliances equipment garden products & beauty goods comparison gds AVERAGEQ4 Q5 Q6 Q7 Q8 Q9 Q10 Q11
Zones490 147 103 131 231 187 502 856 2,648 (%) (%) (%) (%) (%) (%) (%) (%) (%)
1 2.1 0.0 2.4 2.0 3.1 1.5 6.8 2.6 3.12 0.0 0.0 1.2 2.6 2.8 1.0 0.0 0.0 0.53 0.9 5.6 1.9 0.0 1.1 3.8 3.8 0.0 1.64 0.0 0.0 1.2 0.0 0.0 0.0 0.9 0.0 0.25 0.0 0.0 0.0 0.0 0.0 1.7 0.8 0.0 0.36 0.0 0.0 1.2 0.0 1.5 0.0 0.0 0.0 0.27 0.0 0.0 0.0 0.0 0.0 0.0 0.0 0.0 0.08 0.0 0.0 0.0 0.0 0.0 0.0 0.6 0.0 0.19 0.0 0.0 0.0 0.0 0.0 0.0 0.0 0.0 0.0
Sources: Household Interview Survey 2016. Table 4 for expenditure weights.
Highwoods
Highwoods
Expenditure weighting
Expenditure weighting
DTZ RECAP Model 23

Table: 43MARKET SHARES ATTRACTED FROM THE CATCHMENT AREAScenario: 1 Location: Highwoods
Market shares correction factors: Convenience Goods: 75 % of survey indicated figuresComparison Goods: 110 % of survey indicated figures
CatchmentZone
2020 2023 2028 2033 BLANK COLUMN 2020 2023 2028 2033 BLANK COLUMN
(%) (%) (%) (%) (%) (%) (%) (%) (%) (%)
1 13 13 13 13 3 3 3 32 5 5 5 5 1 1 1 13 7 7 7 7 2 2 2 24 0 0 0 0 0 0 0 05 1 1 1 1 0 0 0 06 1 1 1 1 0 0 0 07 0 0 0 0 0 0 0 08 1 1 1 1 0 0 0 09 0 0 0 0 0 0 0 0
Sources: CPW Planning for market share corrections.
COMPARISON GOODSCONVENIENCE GOODS
Baseline - Market shares indicated by the Household Interview Survey 2016 remain unchanged throughout the forecasting period.
DTZ RECAP Model 24

Table: 44COMPARISON GOODS SALES BY GOODS TYPE IN 2020Catchment 2020 Sales in Highwoods
Zones By Comparison Goods Type.Clothing & Furniture/ Household Household Audio-visual Hardware, DIY, Chemists, medcl All other
footwear florcvrgs etc Textiles Appliances equipment garden products & beauty goods comparison gds
(£000) (£000) (£000) (£000) (£000) (£000) (£000) (£000)
1 1,662 0 400 423 1,156 452 5,512 3,5922 0 0 53 145 275 79 0 03 232 433 103 0 134 373 1,003 04 0 0 82 0 0 0 298 05 0 0 0 0 0 147 186 06 0 0 54 0 151 0 0 07 0 0 0 0 0 0 0 08 0 0 0 0 0 0 218 09 0 0 0 0 0 0 0 0
TOTALS 1,894 433 691 567 1,717 1,051 7,216 3,592
MARKETSHARES 0.8% 0.6% 1.3% 0.9% 1.5% 1.1% 2.8% 0.8%
Table: 45FORECAST RETAIL SALESScenario: 1 Location: Highwoods
Catchmentzone
2020 2023 2028 2033 BLANK COLUMN 2020 2023 2028 2033 BLANK COLUMN
(£000) (£000) (£000) (£000) (£000) (£000) (£000) (£000) (£000) (£000)
1 35,722 35,440 37,526 39,398 11,652 14,575 16,293 18,0282 3,546 3,519 3,726 3,912 1,024 1,280 1,431 1,5833 6,185 6,137 6,498 6,822 2,531 3,165 3,537 3,9144 0 0 0 0 0 0 0 05 831 825 873 917 0 0 0 06 730 724 767 805 0 0 0 07 0 0 0 0 0 0 0 08 1,252 1,242 1,315 1,381 0 0 0 09 0 0 0 0 0 0 0 0
TOTALS 48,266 47,886 50,705 53,234 15,207 19,020 21,261 23,525
Baseline - Market shares indicated by the Household Interview Survey 2016 remain unchanged throughout the forecasting period.
RETAIL SALES BY CATCHMENT ZONECONVENIENCE GOODS COMPARISON GOODS
DTZ RECAP Model 25

Table: 46
SALES CAPACITY OF EXISTINGMAIN FOOD & CONVENIENCE GOODS SHOPS AND STORES IN 2020Store Net Convenience Net convnce Convenience Convenience
Floorspace Goods Goods Goods sales Goods salesAllocation Floorspace Density
(sq m) (%) (sq m) (£ per sq m) (£000)
Tesco Extra (Highwoods Square) 6,241 70 4,369 10,700 46,745
ALL STORES 6,241 4,369 10,700 46,745
Sources: Retail and Town Centre Study 2016. CPW Planning.
Table: 47SALES CAPACITY OF EXISTING COMPARISON GOODS FLOORSPACENet to gross ratio: 90 % (unless otherwise indicated) 2016
Store Gross Flrspce Net Flrspce Sales Density Sales2016 2016
(sq m) (sq m) (£per sqm net) (£000)
Comparison Goods Floorspace in main foodstore:Tesco Extra (Highwoods Square) n/a 1,872 9,000 16,851
1,872 9,000 16,851
Sources: Retail and Town Centre Study 2016. CPW Planning.
Notes:
Table: 48SALES CAPACITY OF COMMITTED RETAIL DEVELOPMENTS 2020CONVENIENCE GOODSStore/Scheme Net Convenience Net Conv Gds Conv Goods Conv Goods
Floorspace Goods Floorspace Sales Density SalesAllocation
(sq m) (%) (sq m) (£ p sq m net) (£000)
ALL STORES - - -
COMPARISON GOODSStore/Scheme Gross Net to Gross Net Sales Sales
Floorspace Ratio Floorspace Density(sq m) (%) (sq m) (£ p sq m net) (£000)
ALL STORES AND SCHEMES - - -
Sources:
Interview Survey of Shopping PatternsTOTALS Trading at the date of the Household
DTZ RECAP Model 26

Table: 49FORECAST RETAIL CAPACITYScenario: 1 Location: Highwoods
ComparisonGrowth in sales per sq m from shop floorspace existing in 2020 Goods: 2.00 % pa 2020 to 2033
2020 2023 2028 2033 BLANK COLUMN 2020 2023 2028 2033 BLANK COLUMN
Residents'Spending £000 48,266 47,886 50,705 53,234 15,207 19,020 21,261 23,525Plus visitors'spending (%) - - - - - - - - Totalspending (£000) 48,266 47,886 50,705 53,234 15,207 19,020 21,261 23,525
Existing shopfloorspace(sq m net) 4,369 4,369 4,369 4,369 1,872 1,872 1,872 1,872Salesper sq m net (£) 11,048 10,700 10,700 10,700 8,122 10,338 11,414 12,602Sales from extgflrspce (£000) 48,266 46,745 46,745 46,745 15,207 19,356 21,371 23,595
Available spending to support newshops (£000) 0 1,141 3,960 6,489 0 -336 -110 -70Less salescapacity ofcommitted newfloorspace (£000) 0 0 0 0 0 0 0 0Net availablespending for newshops (£000) 0 1,141 3,960 6,489 0 -336 -110 -70Sales per sq mnet in newshops (£) 12,000 12,000 12,000 12,000 9,000 9,551 10,545 11,642
Capacity fornew shopflrspc (sq m net) 0 95 330 541 0 -35 -10 -6
Market Share ofCatchment Area 5.0% 5.0% 5.0% 5.0% 1.1% 1.1% 1.1% 1.1%Expenditure
Sources:
Notes:
Baseline - Market shares indicated by the Household Interview Survey 2016 remain unchanged throughout the forecasting period.
CONVENIENCE GOODS COMPARISON GOODS
DTZ RECAP Model 27

Scenario 1
Table: 50CONVENIENCE GOODS MARKET SHARES IN 20202020
Zones Main Food Top-up WEIGHTEDconvenience AVERAGE
Q1 Q3
70 30 100(%) (%) (%)
1 0.3 0.0 0.22 0.0 0.0 0.03 2.3 1.8 2.24 0.0 0.0 0.05 0.0 0.7 0.26 20.4 27.3 22.57 0.0 0.0 0.08 0.0 0.0 0.09 2.1 1.1 1.8
Sources: Household Interview Survey 2016.Expenditure weighting by CPW Planning.
Table: 51
COMPARISON GOODS MARKET SHARES BY GOODS TYPE IN 20202020 Allocations to
Tiptree
Indicated by Household Interview SurveyClothing & Furniture/ Household Household Audio-visual Hardware, DIY, Chemists, medcl All other WEIGHTED
footwear florcvrgs etc Textiles Appliances equipment garden products & beauty goods comparison gds AVERAGEQ4 Q5 Q6 Q7 Q8 Q9 Q10 Q11
Zones490 147 103 131 231 187 502 856 2,648 (%) (%) (%) (%) (%) (%) (%) (%) (%)
1 0.0 0.0 0.0 0.0 0.0 0.0 0.0 0.0 0.02 0.0 0.0 0.0 0.0 0.0 0.0 0.0 0.0 0.03 0.0 3.2 0.0 0.0 0.0 3.0 0.7 0.0 0.54 0.0 0.0 0.0 0.0 0.0 0.0 0.0 0.0 0.05 0.0 0.0 0.0 0.0 0.0 0.0 0.8 0.0 0.26 0.0 2.9 0.0 8.7 2.8 9.4 21.5 4.2 6.97 0.0 0.0 0.0 0.0 0.0 0.0 0.0 0.0 0.08 0.0 0.0 0.0 0.0 0.0 0.0 0.0 0.0 0.09 0.0 1.1 0.0 8.2 7.2 1.0 2.2 4.3 3.0
Sources: Household Interview Survey 2016.Table 4 for expenditure weights.
Tiptree
Tiptree
Expenditure weighting
Expenditure weighting
DTZ RECAP Model 28

Table: 52MARKET SHARES ATTRACTED FROM THE CATCHMENT AREAScenario: 1 Location: Tiptree
Market shares correction factors: Convenience Goods: 160 % of survey indicated figuresComparison Goods: 95 % of survey indicated figures
CatchmentZone
2020 2023 2028 2033 BLANK COLUMN 2020 2023 2028 2033 BLANK COLUMN
(%) (%) (%) (%) (%) (%) (%) (%) (%) (%)
1 0 0 0 0 0 0 0 02 0 0 0 0 0 0 0 03 3 3 3 3 0 0 0 04 0 0 0 0 0 0 0 05 0 0 0 0 0 0 0 06 36 36 36 36 7 7 7 77 0 0 0 0 0 0 0 08 0 0 0 0 0 0 0 09 3 3 3 3 3 3 3 3
Sources: CPW Planning for market share corrections.
CONVENIENCE GOODS COMPARISON GOODSPROPORTION OF CATCHMENT AREA EXPENDITURE ATTRACTED
Baseline - Market shares indicated by the Household Interview Survey 2016 remain unchanged throughout the forecasting period.
DTZ RECAP Model 29

Table: 53COMPARISON GOODS SALES BY GOODS TYPE IN 2020Catchment 2020 Sales in Tiptree
Zones By Comparison Goods Type.Clothing & Furniture/ Household Household Audio-visual Hardware, DIY, Chemists, medcl All other
footwear florcvrgs etc Textiles Appliances equipment garden products & beauty goods comparison gds
(£000) (£000) (£000) (£000) (£000) (£000) (£000) (£000)
1 0 0 0 0 0 0 0 02 0 0 0 0 0 0 0 03 0 213 0 0 0 254 160 04 0 0 0 0 0 0 0 05 0 0 0 0 0 0 160 06 0 161 0 430 244 662 4,073 1,3567 0 0 0 0 0 0 0 08 0 0 0 0 0 0 0 09 0 66 0 440 683 77 453 1,510
TOTALS 0 441 0 870 927 993 4,846 2,866
MARKETSHARES 0.0% 0.6% 0.0% 1.3% 0.8% 1.0% 1.9% 0.7%
Table: 54FORECAST RETAIL SALESScenario: 1 Location: Tiptree
Catchmentzone
2020 2023 2028 2033 BLANK COLUMN 2020 2023 2028 2033 BLANK COLUMN
(£000) (£000) (£000) (£000) (£000) (£000) (£000) (£000) (£000) (£000)
1 0 0 0 0 0 0 0 02 0 0 0 0 0 0 0 03 2,651 2,630 2,785 2,924 0 0 0 04 0 0 0 0 0 0 0 05 0 0 0 0 0 0 0 06 26,285 26,082 27,617 28,995 7,358 9,200 10,283 11,3777 0 0 0 0 0 0 0 08 0 0 0 0 0 0 0 09 2,468 2,448 2,592 2,721 3,430 4,292 4,797 5,307
TOTALS 31,403 31,160 32,994 34,639 10,788 13,492 15,080 16,685
RETAIL SALES BY CATCHMENT ZONECONVENIENCE GOODS COMPARISON GOODS
Baseline - Market shares indicated by the Household Interview Survey 2016 remain unchanged throughout the forecasting period.
DTZ RECAP Model 30

Table: 55
SALES CAPACITY OF EXISTINGMAIN FOOD & CONVENIENCE GOODS SHOPS AND STORES IN 2020Store Net Convenience Net convnce Convenience Convenience
Floorspace Goods Goods Goods sales Goods salesAllocation Floorspace Density
(sq m) (%) (sq m) (£ per sq m) (£000)
Tesco (Church Road) 1,697 90 1,527 10,700 16,342Asda (Church Road) 1,115 90 1,004 14,600 14,651Iceland (The Centre) 416 98 408 7,219 2,943Other convenience goods shops and stores 252 85 214 5,000 1,071
ALL STORES 3,480 3,153 11,104 35,007
Sources: Retail and Town Centre Study 2016. Experian Goad. CPW Planning.
Table: 56SALES CAPACITY OF COMMITTED RETAIL DEVELOPMENTS 2020CONVENIENCE GOODSStore/Scheme Net Convenience Net Conv Gds Conv Goods Conv Goods
Floorspace Goods Floorspace Sales Density SalesAllocation
(sq m) (%) (sq m) (£ p sq m net) (£000)
ALL STORES - - #DIV/0! -
COMPARISON GOODSStore/Scheme Gross Net to Gross Net Sales Sales
Floorspace Ratio Floorspace Density(sq m) (%) (sq m) (£ p sq m net) (£000)
ALL STORES AND SCHEMES - - #DIV/0! -
Sources:
DTZ RECAP Model 31

Table: 57FORECAST RETAIL CAPACITYScenario: 1 Location: Tiptree
ComparisonGrowth in sales per sq m from shop floorspace existing in 2020 Goods: 2.00 % pa 2020 to 2033
2020 2023 2028 2033 BLANK COLUMN 2020 2023 2028 2033 BLANK COLUMN
Residents'Spending £000 31,403 31,160 32,994 34,639 10,788 13,492 15,080 16,685Plus visitors'spending (%) - - - - - - - - Totalspending (£000) 31,403 31,160 32,994 34,639 10,788 13,492 15,080 16,685
Existing shopfloorspace(sq m net) 3,153 3,153 3,153 3,153 2,516 2,516 2,516 2,516Salesper sq m net (£) 9,961 11,104 11,104 11,104 4,288 4,550 5,024 5,546Sales from extgflrspce (£000) 31,403 35,007 35,007 35,007 10,788 11,448 12,640 13,955
Available spending to support newshops (£000) 0 -3,848 -2,014 -368 0 2,044 2,440 2,729Less salescapacity ofcommitted newfloorspace (£000) 0 0 0 0 0 0 0 0Net availablespending for newshops (£000) 0 -3,848 -2,014 -368 0 2,044 2,440 2,729Sales per sq mnet in newshops (£) 12,000 12,000 12,000 12,000 4,000 4,245 4,687 5,174
Capacity fornew shopflrspc (sq m net) 0 -321 -168 -31 0 481 521 527
Market Share ofCatchment Area 3.2% 3.2% 3.2% 3.2% 0.8% 0.8% 0.8% 0.8%Expenditure
Sources: Experian Goad for Comparison Goods (ground floor) floorspace.
Notes:
Baseline - Market shares indicated by the Household Interview Survey 2016 remain unchanged throughout the forecasting period.
CONVENIENCE GOODS COMPARISON GOODS
DTZ RECAP Model 32

Scenario 1
Table: 58CONVENIENCE GOODS MARKET SHARES IN 20202020
Zones Main Food Top-up WEIGHTEDconvenience AVERAGE
Q1 Q3
70 30 100(%) (%) (%)
1 14.5 38.1 21.62 4.3 5.8 4.83 20.7 18.9 20.24 0.9 0.6 0.85 1.6 0.9 1.46 4.8 9.4 6.27 0.0 0.0 0.08 0.0 0.8 0.29 0.0 0.0 0.0
Sources: Household Interview Survey 2016.Expenditure weighting by CPW Planning.
Table: 59
COMPARISON GOODS MARKET SHARES BY GOODS TYPE IN 20202020 Allocations to
Non-central stores in Borough
Indicated by Household Interview SurveyClothing & Furniture/ Household Household Audio-visual Hardware, DIY, Chemists, medcl All other WEIGHTED
footwear florcvrgs etc Textiles Appliances equipment garden products & beauty goods comparison gds AVERAGEQ4 Q5 Q6 Q7 Q8 Q9 Q10 Q11
Zones490 147 103 131 231 187 502 856 2,648 (%) (%) (%) (%) (%) (%) (%) (%) (%)
1 0.8 14.9 10.1 7.2 4.7 45.2 22.2 1.3 10.02 0.0 7.4 3.9 5.2 1.3 27.6 1.0 0.0 3.13 2.4 10.7 6.1 4.2 2.8 54.1 9.8 0.0 7.44 0.0 6.0 4.0 0.0 0.0 0.0 0.0 0.0 0.55 0.9 8.6 3.5 1.1 4.8 19.1 0.9 0.0 2.86 1.2 5.2 8.4 0.0 0.0 17.0 5.7 2.8 4.07 0.0 9.4 2.0 8.1 1.3 3.5 0.0 2.3 2.18 0.0 5.2 4.7 3.3 5.0 0.0 0.0 0.0 1.19 0.0 3.4 0.0 1.1 0.0 0.0 0.0 0.0 0.2
Sources: Household Interview Survey 2016, with adjustments by CPW Planning. Table 4 for expenditure weights.
Non-central stores in Borough
Non-central stores in Borough
Expenditure weighting
Expenditure weighting
DTZ RECAP Model 33

Table: 60MARKET SHARES ATTRACTED FROM THE CATCHMENT AREAScenario: 1 Location: Non-central stores in Borough
Market shares correction factors: Convenience Goods: 110 % of survey indicated figuresComparison Goods: 115 % of survey indicated figures
CatchmentZone
2020 2023 2028 2033 BLANK COLUMN 2020 2023 2028 2033 BLANK COLUMN
(%) (%) (%) (%) (%) (%) (%) (%) (%) (%)
1 24 24 24 24 11 11 11 112 5 5 5 5 4 4 4 43 22 22 22 22 9 9 9 94 1 1 1 1 1 1 1 15 2 2 2 2 3 3 3 36 7 7 7 7 5 5 5 57 0 0 0 0 2 2 2 28 0 0 0 0 1 1 1 19 0 0 0 0 0 0 0 0
Sources: CPW Planning for market share corrections.
Baseline - Market shares indicated by the Household Interview Survey 2016 remain unchanged throughout the forecasting period.
PROPORTION OF CATCHMENT AREA EXPENDITURE ATTRACTEDCONVENIENCE GOODS COMPARISON GOODS
DTZ RECAP Model 34

Table: 61COMPARISON GOODS SALES BY GOODS TYPE IN 2020Catchment 2020 Sales in Non-central stores in Borough
Zones By Comparison Goods Type.Clothing & Furniture/ Household Household Audio-visual Hardware, DIY, Chemists, medcl All other
footwear florcvrgs etc Textiles Appliances equipment garden products & beauty goods comparison gds
(£000) (£000) (£000) (£000) (£000) (£000) (£000) (£000)
1 662 3,694 1,758 1,591 1,833 14,240 18,811 1,8782 0 484 179 303 134 2,292 223 03 647 864 346 302 356 5,552 2,705 04 0 607 284 0 0 0 0 05 213 610 174 70 536 1,722 218 06 269 349 396 0 0 1,449 1,307 1,0947 0 392 59 301 85 186 0 5598 0 577 366 326 872 0 0 09 0 248 0 72 0 0 0 0
TOTALS 1,791 7,824 3,562 2,964 3,815 25,441 23,266 3,531
MARKETSHARES 0.7% 10.5% 6.8% 4.5% 3.2% 26.8% 9.1% 0.8%
Table: 62FORECAST RETAIL SALESScenario: 1 Location: Non-central stores in Borough
Catchmentzone
2020 2023 2028 2033 BLANK COLUMN 2020 2023 2028 2033 BLANK COLUMN
(£000) (£000) (£000) (£000) (£000) (£000) (£000) (£000) (£000) (£000)
1 65,948 65,428 69,279 72,735 42,726 53,443 59,741 66,1032 3,546 3,519 3,726 3,912 4,095 5,120 5,723 6,3323 19,438 19,287 20,422 21,441 11,388 14,241 15,918 17,6124 1,237 1,226 1,298 1,363 1,585 1,987 2,221 2,4575 1,663 1,649 1,746 1,833 3,335 4,176 4,668 5,1646 5,111 5,071 5,370 5,638 5,256 6,572 7,345 8,1277 0 0 0 0 1,308 1,636 1,829 2,0248 0 0 0 0 1,738 2,174 2,430 2,6899 0 0 0 0 0 0 0 0
TOTALS 96,942 96,180 101,841 106,921 71,430 89,350 99,875 110,507
COMPARISON GOODS
Baseline - Market shares indicated by the Household Interview Survey 2016 remain unchanged throughout the forecasting period.
RETAIL SALES BY CATCHMENT ZONECONVENIENCE GOODS
DTZ RECAP Model 35
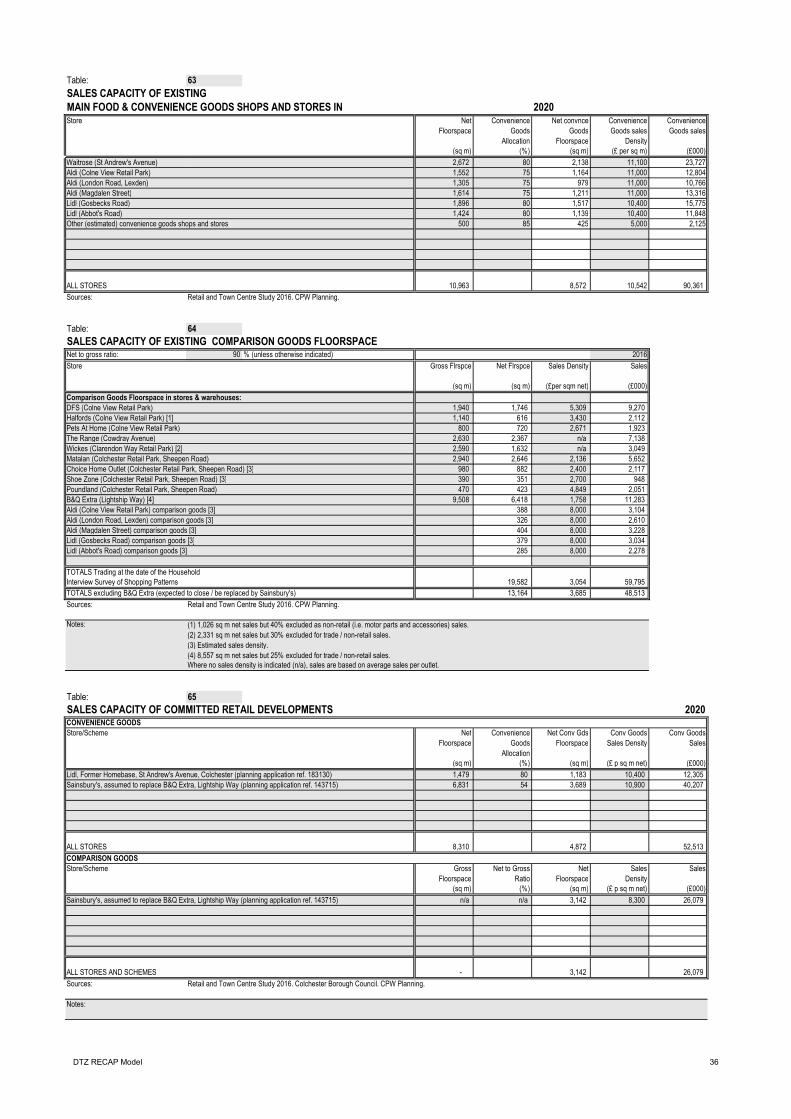
Table: 63
SALES CAPACITY OF EXISTINGMAIN FOOD & CONVENIENCE GOODS SHOPS AND STORES IN 2020Store Net Convenience Net convnce Convenience Convenience
Floorspace Goods Goods Goods sales Goods salesAllocation Floorspace Density
(sq m) (%) (sq m) (£ per sq m) (£000)
Waitrose (St Andrew's Avenue) 2,672 80 2,138 11,100 23,727Aldi (Colne View Retail Park) 1,552 75 1,164 11,000 12,804Aldi (London Road, Lexden) 1,305 75 979 11,000 10,766Aldi (Magdalen Street) 1,614 75 1,211 11,000 13,316Lidl (Gosbecks Road) 1,896 80 1,517 10,400 15,775Lidl (Abbot's Road) 1,424 80 1,139 10,400 11,848Other (estimated) convenience goods shops and stores 500 85 425 5,000 2,125
ALL STORES 10,963 8,572 10,542 90,361
Sources: Retail and Town Centre Study 2016. CPW Planning.
Table: 64SALES CAPACITY OF EXISTING COMPARISON GOODS FLOORSPACENet to gross ratio: 90 % (unless otherwise indicated) 2016
Store Gross Flrspce Net Flrspce Sales Density Sales2016 2016
(sq m) (sq m) (£per sqm net) (£000)
Comparison Goods Floorspace in stores & warehouses:DFS (Colne View Retail Park) 1,940 1,746 5,309 9,270 Halfords (Colne View Retail Park) [1] 1,140 616 3,430 2,112 Pets At Home (Colne View Retail Park) 800 720 2,671 1,923 The Range (Cowdray Avenue) 2,630 2,367 n/a 7,138 Wickes (Clarendon Way Retail Park) [2] 2,590 1,632 n/a 3,049 Matalan (Colchester Retail Park, Sheepen Road) 2,940 2,646 2,136 5,652 Choice Home Outlet (Colchester Retail Park, Sheepen Road) [3] 980 882 2,400 2,117 Shoe Zone (Colchester Retail Park, Sheepen Road) [3] 390 351 2,700 948 Poundland (Colchester Retail Park, Sheepen Road) 470 423 4,849 2,051 B&Q Extra (Lightship Way) [4] 9,508 6,418 1,758 11,283 Aldi (Colne View Retail Park) comparison goods [3] 388 8,000 3,104 Aldi (London Road, Lexden) comparison goods [3] 326 8,000 2,610 Aldi (Magdalen Street) comparison goods [3] 404 8,000 3,228 Lidl (Gosbecks Road) comparison goods [3] 379 8,000 3,034
285 8,000 2,278
19,582 3,054 59,795 TOTALS excluding B&Q Extra (expected to close / be replaced by Sainsbury's) 13,164 3,685 48,513
Sources: Retail and Town Centre Study 2016. CPW Planning.
Notes:
(3) Estimated sales density.(4) 8,557 sq m net sales but 25% excluded for trade / non-retail sales.
Table: 65SALES CAPACITY OF COMMITTED RETAIL DEVELOPMENTS 2020CONVENIENCE GOODSStore/Scheme Net Convenience Net Conv Gds Conv Goods Conv Goods
Floorspace Goods Floorspace Sales Density SalesAllocation
(sq m) (%) (sq m) (£ p sq m net) (£000)
1,479 80 1,183 10,400 12,305 6,831 54 3,689 10,900 40,207
ALL STORES 8,310 4,872 52,513
COMPARISON GOODSStore/Scheme Gross Net to Gross Net Sales Sales
Floorspace Ratio Floorspace Density(sq m) (%) (sq m) (£ p sq m net) (£000)
n/a n/a 3,142 8,300 26,079
ALL STORES AND SCHEMES - 3,142 26,079
Sources: Retail and Town Centre Study 2016. Colchester Borough Council. CPW Planning.
Notes:
TOTALS Trading at the date of the Household
(1) 1,026 sq m net sales but 40% excluded as non-retail (i.e. motor parts and accessories) sales.(2) 2,331 sq m net sales but 30% excluded for trade / non-retail sales.
Where no sales density is indicated (n/a), sales are based on average sales per outlet.
Interview Survey of Shopping Patterns
Lidl (Abbot's Road) comparison goods [3]
Sainsbury's, assumed to replace B&Q Extra, Lightship Way (planning application ref. 143715)
Sainsbury's, assumed to replace B&Q Extra, Lightship Way (planning application ref. 143715)Lidl, Former Homebase, St Andrew's Avenue, Colchester (planning application ref. 183130)
DTZ RECAP Model 36

Table: 66FORECAST RETAIL CAPACITYScenario: 1 Location: Non-central stores in Borough
ComparisonGrowth in sales per sq m from shop floorspace existing in 2020 Goods: 2.00 % pa 2020 to 2033
2020 2023 2028 2033 BLANK COLUMN 2020 2023 2028 2033 BLANK COLUMN
Residents'Spending £000 96,942 96,180 101,841 106,921 71,430 89,350 99,875 110,507Plus visitors'spending (%) - - - - - - - - Totalspending (£000) 96,942 96,180 101,841 106,921 71,430 89,350 99,875 110,507
Existing shopfloorspace(sq m net) 8,572 8,572 8,572 8,572 19,582 13,164 13,164 13,164Salesper sq m net (£) 11,309 10,542 10,542 10,542 3,648 4,233 4,674 5,160Sales from extgflrspce (£000) 96,942 90,361 90,361 90,361 71,430 55,726 61,526 67,929
Available spending to support newshops (£000) 0 5,819 11,481 16,561 0 33,624 38,349 42,578Less salescapacity ofcommitted newfloorspace (£000) 0 52,513 52,513 52,513 0 27,675 30,555 33,735Net availablespending for newshops (£000) 0 -46,694 -41,032 -35,952 0 5,950 7,794 8,842Sales per sq mnet in newshops (£) 12,000 12,000 12,000 12,000 4,000 4,245 4,687 5,174
Capacity fornew shopflrspc (sq m net) 0 -3,891 -3,419 -2,996 0 1,402 1,663 1,709
Market Share ofCatchment Area 10.0% 10.0% 10.0% 10.0% 5.3% 5.3% 5.3% 5.3%Expenditure
Sources:
Notes:
COMPARISON GOODSCONVENIENCE GOODS
Baseline - Market shares indicated by the Household Interview Survey 2016 remain unchanged throughout the forecasting period.
DTZ RECAP Model 38

Appendix C (Catchment Area Plan)
