retention and completion presentation. former mission: access new mission: completion funding...
TRANSCRIPT

Retention and Completion Presentation
Former Mission: Access
New Mission: Completion
Funding formula follows mission

The New Measuring Stick19
89-9
0
1990
-91
1991
-92
1992
-93
1993
-94
1994
-95
1995
-96
1996
-97
1997
-98
1198
-99
1999
-200
0
2000
-01
2001
-02
2002
-03
2003
-04
2004
-05
2005
-06
2006
-07
2007
-08
2008
-09
2009
-10
2010
-11
2011
-12
2012
-13
2013
-14
1800
1850
1900
1950
2000
2050
2100
2150
2200
1910
2105
1924
2079
20422073 2068
20151991
1952
2010
18221844
1865
1992
2033
2079
1952
20142048
2103
2042 20332063
2147
Degrees Awarded
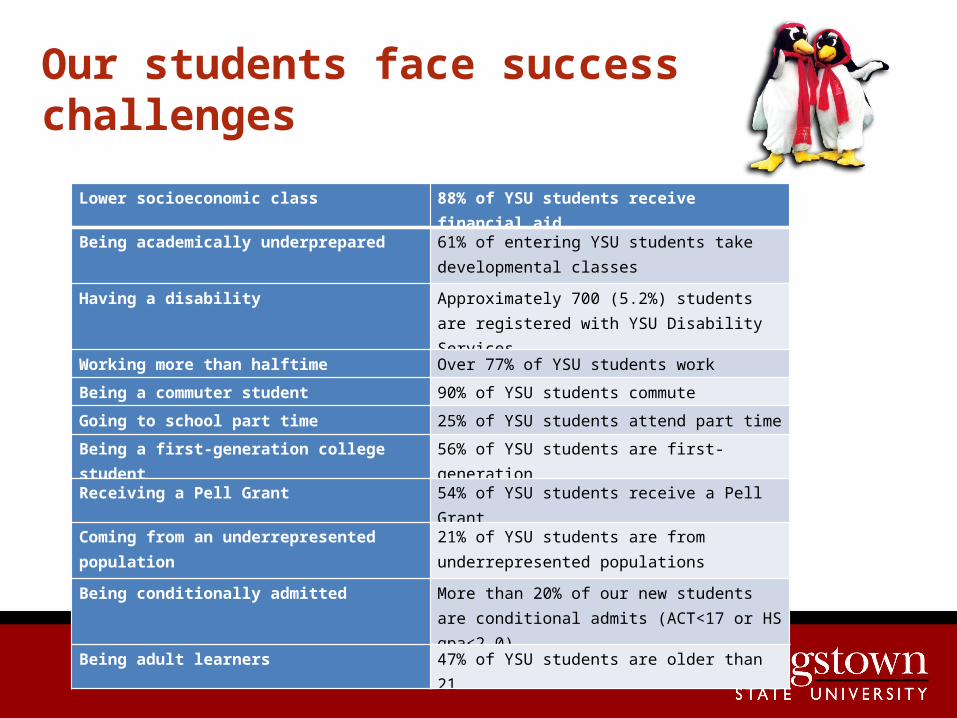
Our students face success challenges
Lower socioeconomic class 88% of YSU students receive financial aid
Being academically underprepared 61% of entering YSU students take developmental classes
Having a disability Approximately 700 (5.2%) students are registered with YSU Disability Services
Working more than halftime Over 77% of YSU students work
Being a commuter student 90% of YSU students commute
Going to school part time 25% of YSU students attend part time
Being a first-generation college student 56% of YSU students are first-generation
Receiving a Pell Grant 54% of YSU students receive a Pell Grant
Coming from an underrepresented population 21% of YSU students are from underrepresented populations
Being conditionally admitted More than 20% of our new students are conditional admits (ACT<17 or HS gpa<2.0)
Being adult learners 47% of YSU students are older than 21
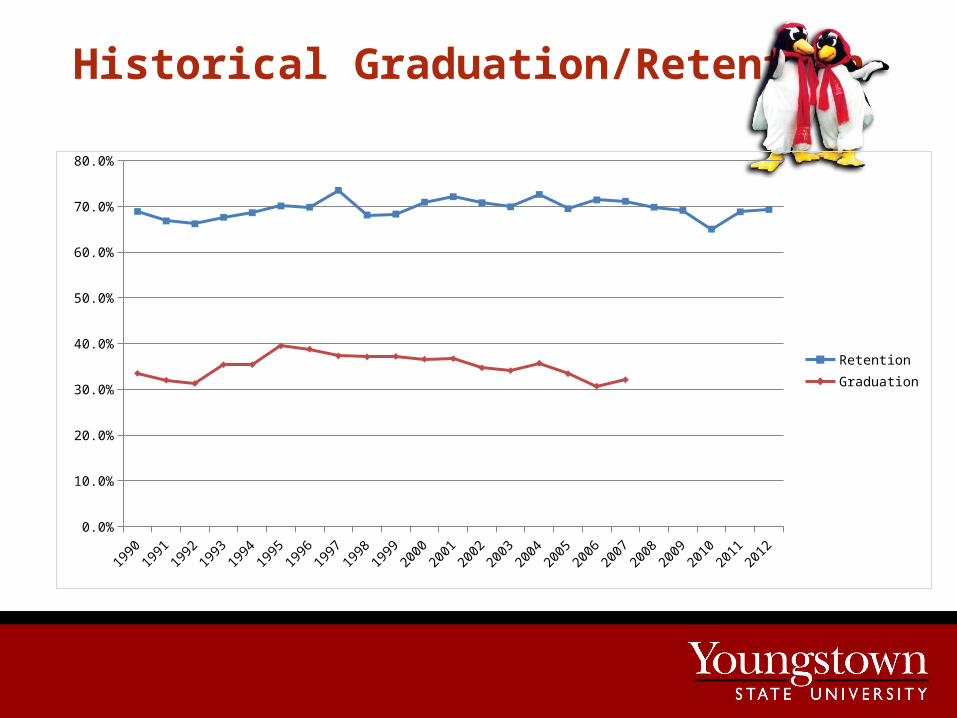
Historical Graduation/Retention
1990 1991 1992 1993 1994 1995 1996 1997 1998 1999 2000 2001 2002 2003 2004 2005 2006 2007 2008 2009 2010 2011 20120.0%
10.0%
20.0%
30.0%
40.0%
50.0%
60.0%
70.0%
80.0%
RetentionGraduation
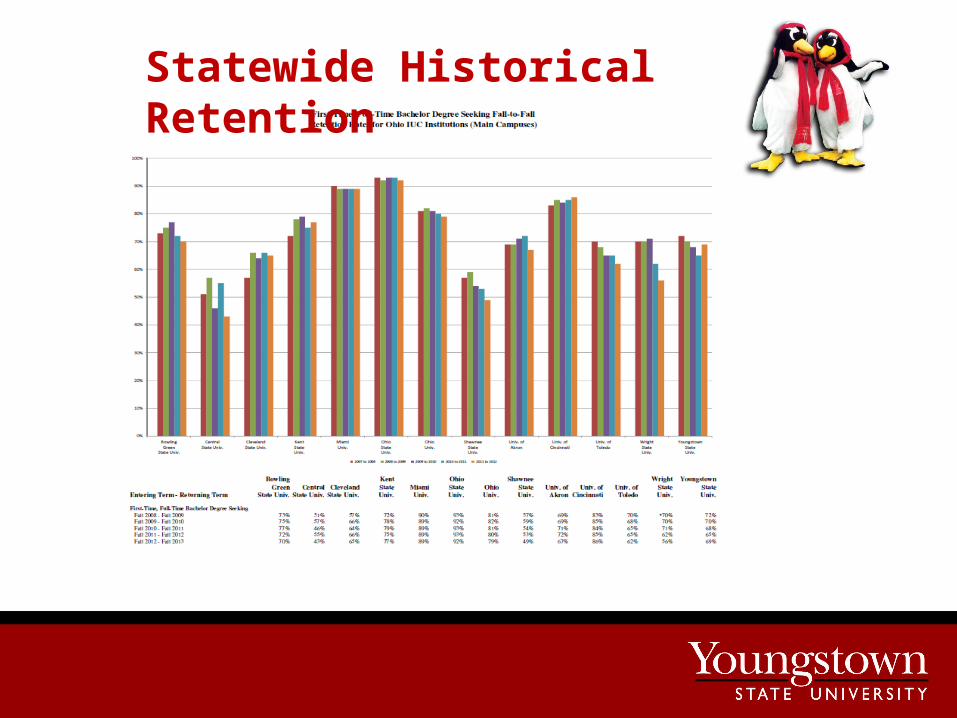
Statewide Historical Retention
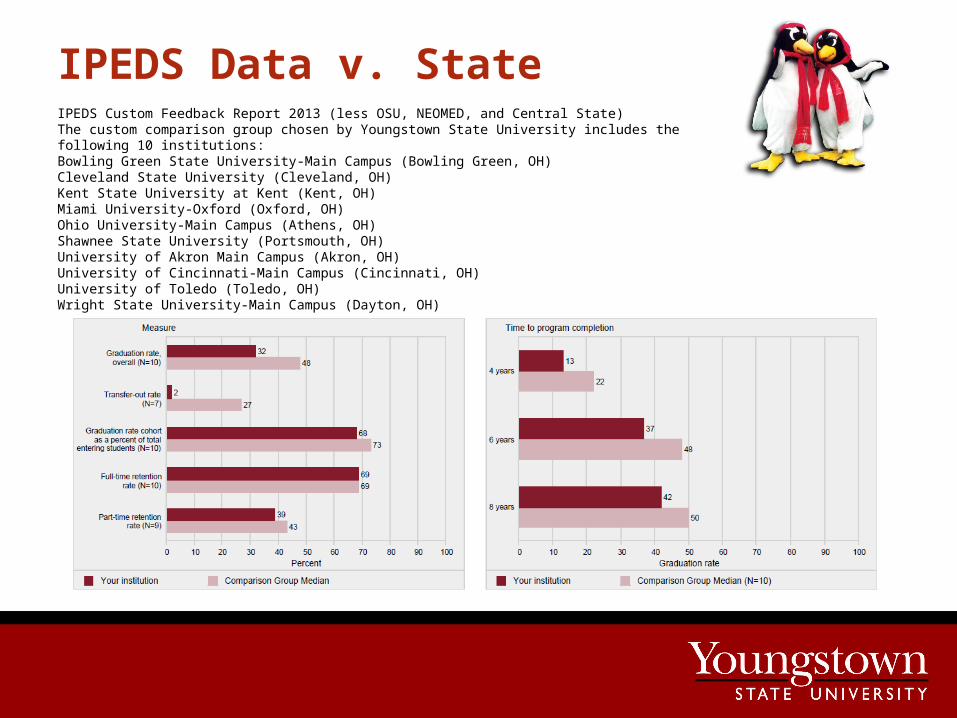
IPEDS Data v. StateIPEDS Custom Feedback Report 2013 (less OSU, NEOMED, and Central State)The custom comparison group chosen by Youngstown State University includes the following 10 institutions:Bowling Green State University-Main Campus (Bowling Green, OH)Cleveland State University (Cleveland, OH)Kent State University at Kent (Kent, OH)Miami University-Oxford (Oxford, OH)Ohio University-Main Campus (Athens, OH)Shawnee State University (Portsmouth, OH)University of Akron Main Campus (Akron, OH)University of Cincinnati-Main Campus (Cincinnati, OH)University of Toledo (Toledo, OH)Wright State University-Main Campus (Dayton, OH)
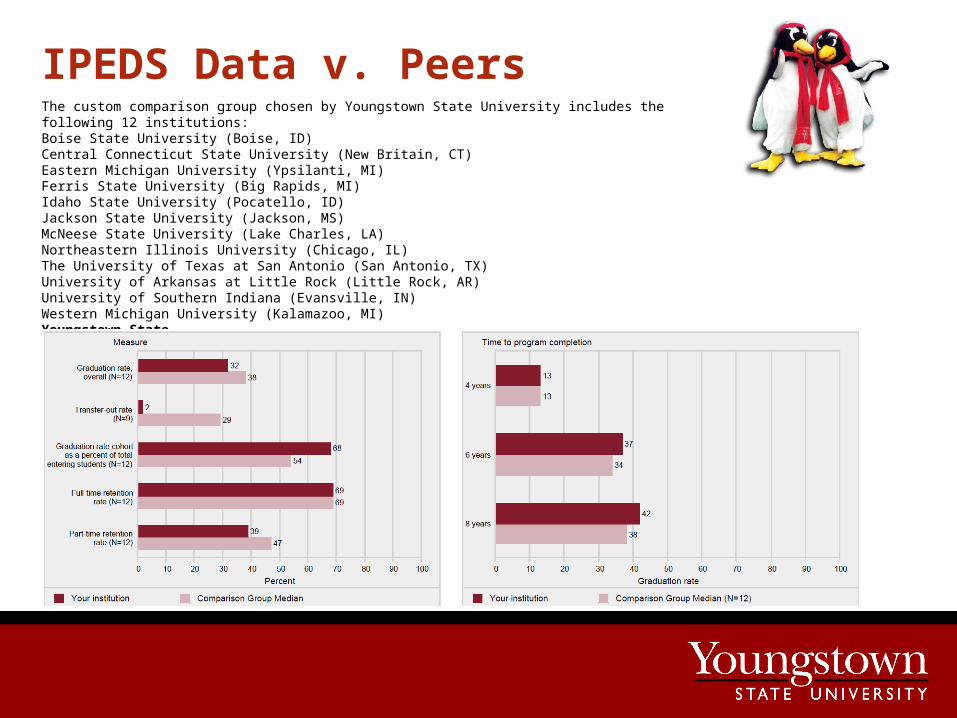
IPEDS Data v. PeersThe custom comparison group chosen by Youngstown State University includes the following 12 institutions:Boise State University (Boise, ID)Central Connecticut State University (New Britain, CT)Eastern Michigan University (Ypsilanti, MI)Ferris State University (Big Rapids, MI)Idaho State University (Pocatello, ID)Jackson State University (Jackson, MS)McNeese State University (Lake Charles, LA)Northeastern Illinois University (Chicago, IL)The University of Texas at San Antonio (San Antonio, TX)University of Arkansas at Little Rock (Little Rock, AR)University of Southern Indiana (Evansville, IN)Western Michigan University (Kalamazoo, MI)Youngstown State

CSP Use Drives Higher Retention Numbers
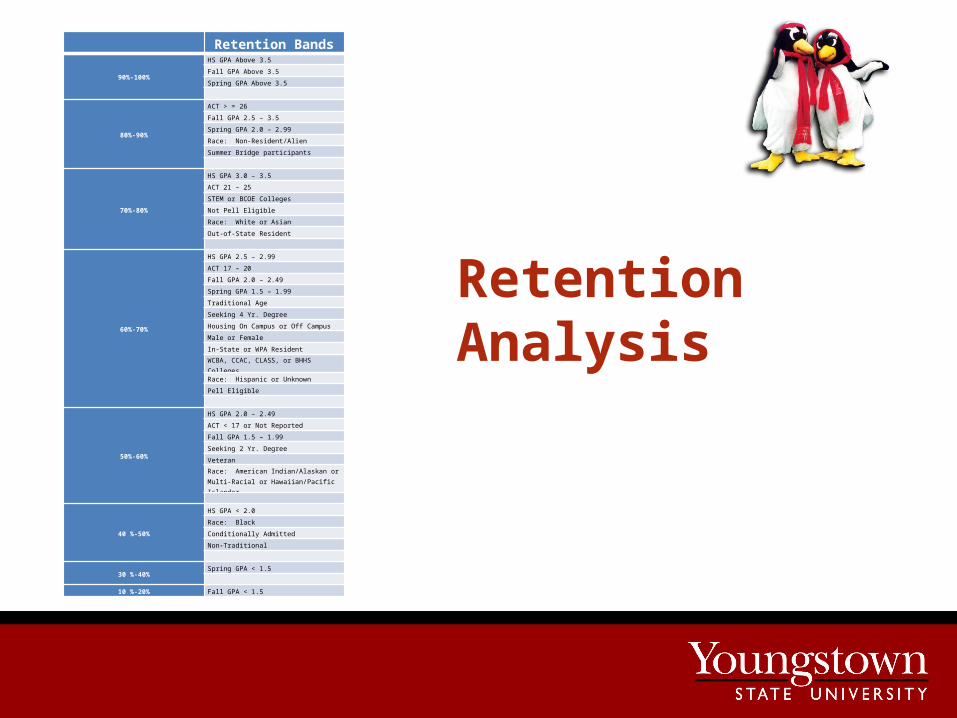
Retention Analysis
Retention Bands
90%-100%
HS GPA Above 3.5
Fall GPA Above 3.5
Spring GPA Above 3.5
80%-90%
ACT > = 26
Fall GPA 2.5 – 3.5
Spring GPA 2.0 – 2.99
Race: Non-Resident/Alien
Summer Bridge participants
70%-80%
HS GPA 3.0 – 3.5
ACT 21 – 25
STEM or BCOE Colleges
Not Pell Eligible
Race: White or Asian
Out-of-State Resident
60%-70%
HS GPA 2.5 – 2.99
ACT 17 – 20
Fall GPA 2.0 – 2.49
Spring GPA 1.5 – 1.99
Traditional Age
Seeking 4 Yr. Degree
Housing On Campus or Off Campus
Male or Female
In-State or WPA Resident
WCBA, CCAC, CLASS, or BHHS Colleges
Race: Hispanic or Unknown
Pell Eligible
50%-60%
HS GPA 2.0 – 2.49
ACT < 17 or Not Reported
Fall GPA 1.5 – 1.99
Seeking 2 Yr. Degree
Veteran
Race: American Indian/Alaskan or Multi-Racial or Hawaiian/Pacific Islander
40 %-50%
HS GPA < 2.0
Race: Black
Conditionally Admitted
Non-Traditional
30 %-40%Spring GPA < 1.5
10 %-20% Fall GPA < 1.5

Completion is OUR Challenge

Completion is OUR Challenge

Completion is OUR Challenge

Completion is OUR Challenge
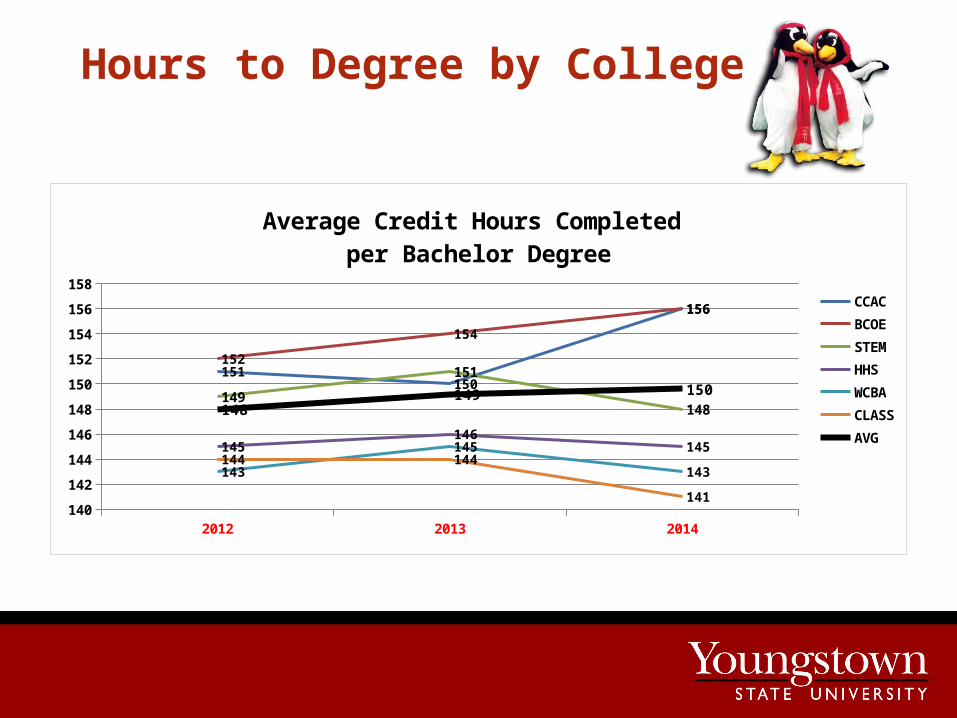
Hours to Degree by College
2012 2013 2014140
142
144
146
148
150
152
154
156
158
151150
156
152
154
156
149
151
148
145146
145
143
145
143144 144
141
148149 150
Average Credit Hours Completed per Bachelor Degree
CCACBCOESTEMHHSWCBACLASSAVG

YSU Response to “New Mission: Completion”

2020 Strategic Vision: Youngstown State University will become a national model for student success, academic excellence, resource stewardship, and regional engagement.
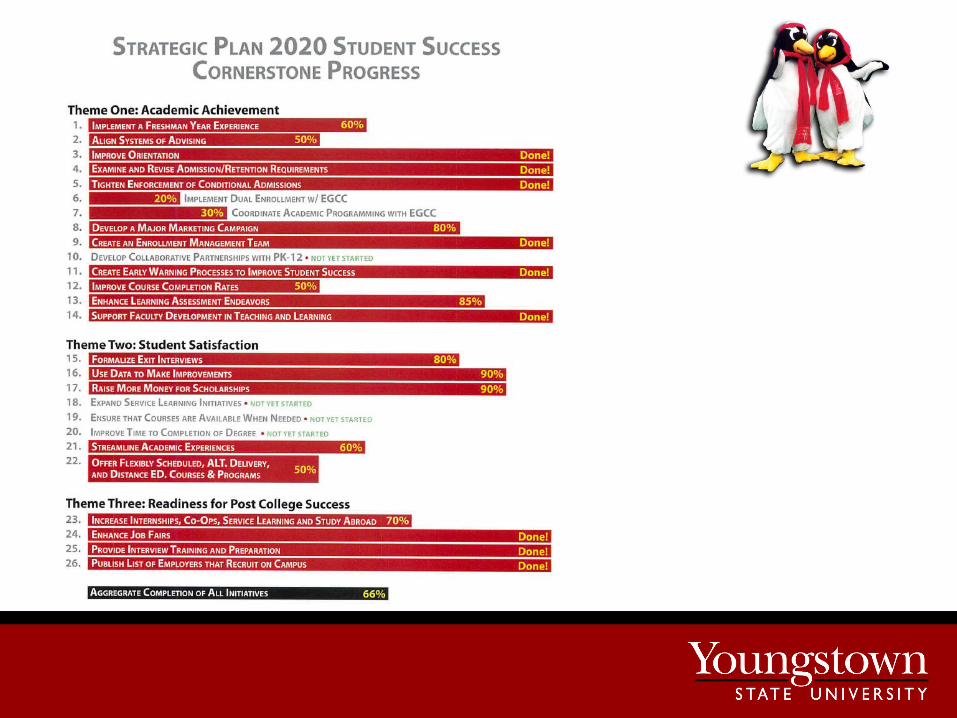

Student Success Progress
Theme 1: Academic Achievement Indicators
3 Yr. Average Current Trend 2020 Goal
Retention Rate (internal) 67% 69% ↑ 72%
Course Completion Rate 83% 85% ↑ 85%
Students in Good Standing 86% 91% 92%
Degrees Awarded 2081 2147 ↑↑ 2500
Entering Freshmen Avg. ACT 20.58 21.09 ↑↑ 22
Minority Graduation Rate 13.0% 13.2% ↑ 25%
Athlete Graduation Rate 59% 62% ↑↑↑ 72%
International Students 202 214 ↑ 300
Study Abroad Students 140 150 ↑ 225
Adult Students 28% 25% 30%
Board Metric: Six-Year Graduation Rate 34.7% 34.3% ↓ 43%

Student Success Progress
2009 2010 2011 2012 2013 20140
1000
2000
3000
4000
5000
6000
7000
8000
9000
10000
11000
12000
13000
14000
15000
2942 3043 2997 2964 2990 3048
1973 2077 2049 2162 2197 2128
2407 2485 2575 2530 2383 2110
57195941 5418
4593 40973468
Six year enrollment by class rank
All freshmensophomoresjuniorsseniors

Wide ranging, multifaceted plan.Research shows quantity of initiatives bests intensity.

Graduation Awarded 2,147 degrees in 2013-14. This was our highest number of degrees awarded in the last 25 years.
Retention Increased freshman retention rate by 5.5% over the last three years.
Increased all student retention rates by 4.8% over the last three years.
Course Completion Increased course completion rate 6.8% over the last three years.
Freshman GPA Increased incoming freshman average GPA by 9.4% over the last four years.
Freshman ACT Increased incoming freshman ACT average by 6.6% over the last four years.
Summer Bridge Program was been deemed by the U.S. Department of Education as a “promising strategy” for student success. Has 80% freshman retention rate and graduation rate is twice as high as our minority graduation rate.
Satisfactory Academic Progress
Reduced the number of students failing to qualify for continued Federal Aid by 53% over two years.
Non-attendance Fs Reduced non-attendance Fs by 28% over the last three years.
Upward Bound Has 97% High School graduation rate from Youngstown City Schools over the last eleven years.
Our Top 9 Successes to Date

Our Competitors are Improving More Quickly
Kent State6.7% retention increaseCites Improved qualityImproved academic advisingExpanded support servicesImproved cocurricular experiences15 credit hours4 yr. graduation
Cleveland State has leapfrogged us as well.
Akron 6.5% retention increaseCites Improved qualityCampus-wide buy-inEmphasis on pre-majorsTake 15 creditsUniversity 101 courseZip StartUse of E-tutoringImproved academic advising
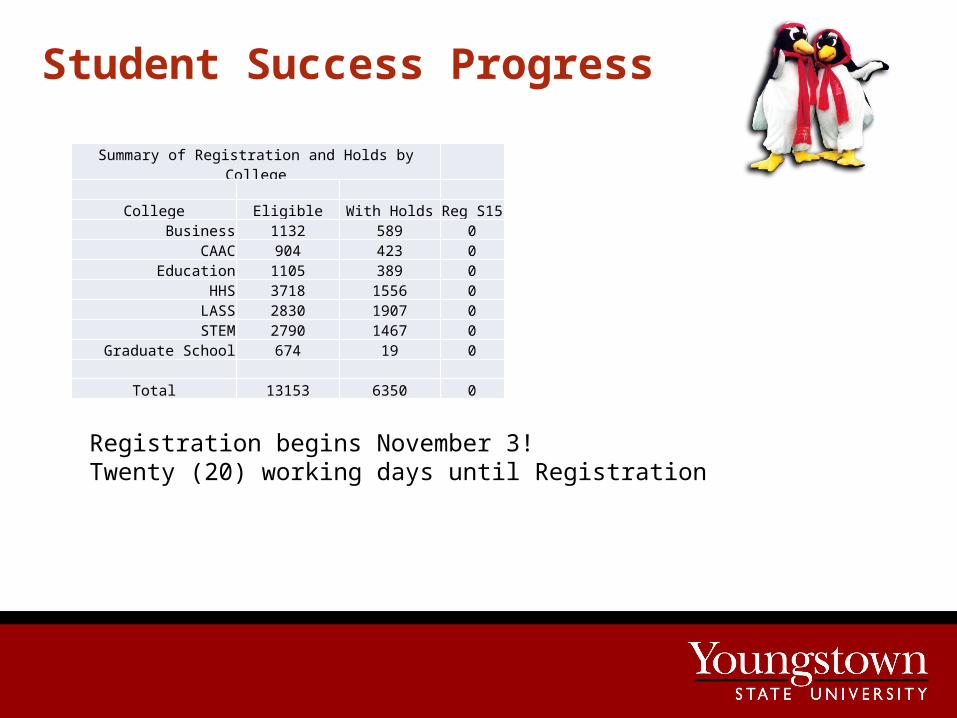
Student Success Progress
Summary of Registration and Holds by College
College Eligible With Holds Reg S15Business 1132 589 0
CAAC 904 423 0Education 1105 389 0
HHS 3718 1556 0LASS 2830 1907 0
STEM 2790 1467 0Graduate School 674 19 0
Total 13153 6350 0
Registration begins November 3!Twenty (20) working days until Registration

Generate and distribute regular, automated data reports to all constituents.
Develop academic advisement goals and provide regular, university-wide term reports on progress.
Provide graduation and retention data (College/major specific) to all stake holders.
Create a Student Success website.
Mandate and track faculty participation in Starfish Early Alert.
Mandate and track faculty recording class attendance.
Develop policies and procedures for use of data analytics generated by Starfish INSIGHT.
Track and improve fall-to-spring retention for sophomore students with the same fervor as the fall-to-fall tracking and reporting of first-time freshmen.
Implement proactive advisement for all students placed on warning and probation.
Develop and implement consistent policies and procedures for students on warning and probation that include contract signing, referrals, and follow-up.
Ensure all classes are listed with instructor and text befroe students register.
Develop Learning Communities and effective FYE experience for all entering students.
Integrate current first-year peer mentoring program into University 101 courses.
Make Welcome Penguin calls to all admitted students.
What’s Next? Ideas
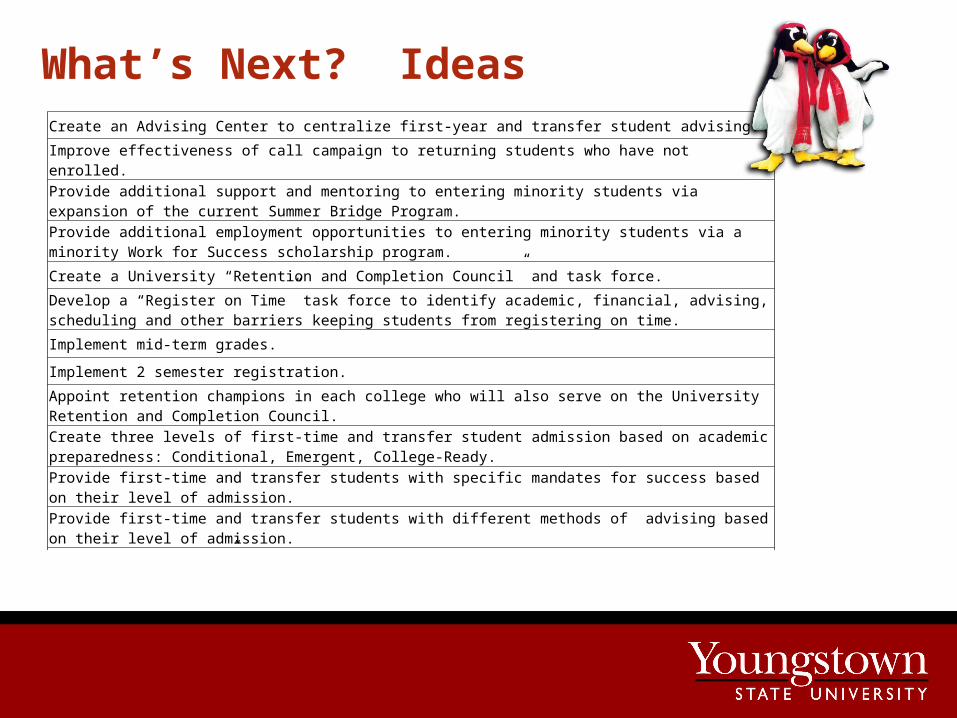
Create an Advising Center to centralize first-year and transfer student advising.
Improve effectiveness of call campaign to returning students who have not enrolled.
Provide additional support and mentoring to entering minority students via expansion of the current Summer Bridge Program.
Provide additional employment opportunities to entering minority students via a minority Work for Success scholarship program.
Create a University “Retention and Completion Council” and task force.
Develop a “Register on Time” task force to identify academic, financial, advising, scheduling and other barriers keeping students from registering on time.
Implement mid-term grades.
Implement 2 semester registration.
Appoint retention champions in each college who will also serve on the University Retention and Completion Council.
Create three levels of first-time and transfer student admission based on academic preparedness: Conditional, Emergent, College-Ready.
Provide first-time and transfer students with specific mandates for success based on their level of admission.
Provide first-time and transfer students with different methods of advising based on their level of admission.
Provide “encouragers” to all students admitted as conditional and emergent.
Provide Supplemental Instruction in all gateway courses and require conditionally admitted and emergent students to enroll in an SI- embedded course section.
Relocate Career Services to Student Center and create initiatives to frontload its engagement with students.
What’s Next? Ideas

Add a career planning component to University 101 Courses.
Increase career-relevant work experiences (internships, co-ops) prior to graduation.
Develop a program/campaign to ensure that every student, including prospects, receives appropriate and timely FAFSA assistance to maximize their eligibility for aid.
Embed significant financial literacy curriculum into the University 101 course.
Re-define sophomore status as 30 or more hours completed.
Cap most Baccalaureate degrees at 120 credit hours.
Develop a system to identify and remediate problems related to class availability.
Implement block scheduling for all first-time and transfer students.
Provide each entering student with a graduation map that outlines courses and terms that will lead to a four-year degree.
Create a three-year graduation map in appropriate bachelor’s degree program that includes summer sessions.
Develop a four-year course rotation plan so students can see when classes they need will be offered.
Raise the bulk rate tuition cap to allow students to take up to 18 sh.
Create a review and reporting process for all courses that have a 25% or higher rate of DFW.
Upgrade degree audit system so every student can review their remaining degree requirements in real time.
What’s Next? Ideas
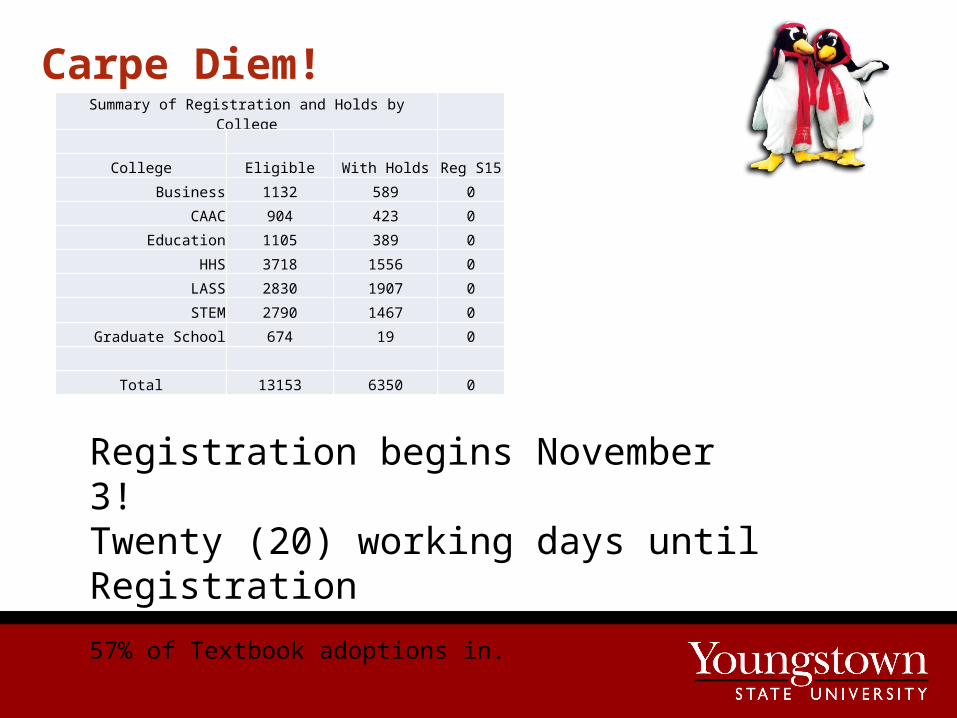
Carpe Diem!Summary of Registration and Holds by College
College Eligible With Holds Reg S15
Business 1132 589 0
CAAC 904 423 0
Education 1105 389 0
HHS 3718 1556 0
LASS 2830 1907 0
STEM 2790 1467 0
Graduate School 674 19 0
Total 13153 6350 0
Registration begins November 3!Twenty (20) working days until Registration
57% of Textbook adoptions in.