retro-commissioning: an owner’s look at the … · retro-commissioning: an owner’s look at the...
TRANSCRIPT
RETRO-COMMISSIONING: AN OWNER’S LOOK AT THE TRUE COSTS AND RETURN ON INVESTMENT
Adam Renzi, PE
AIA Quality Assurance
The Building Commissioning Association is a Registered Provider with The American Institute of Architects Continuing Education Systems (AIA/CES). Credit(s) earned on completion of this program will be reported to AIA/CES for AIA members. Certificates of the Completion for both AIA members and non-AIA members are available upon request.
This program is registered with AIA/CES for continuing professional education. As such, it does not include content that may be deemed or construed to be an approval or endorsement by the AIA of any material of construction or any method or manner of handling, using, distributing, or dealing in any material or product.
Questions related to specific materials, methods, and services will be addressed at the conclusion of this presentation.
2
Learning Objectives
3
1. Develop an understanding of the true costs of commissioning.2. Recognize the role of the owner in the commissioning process
when the owner acts as the commissioning provider.3. Identify the additional services necessary to complete the
existing building commissioning process.4. Utilize the data being developed to provide more accurate cost
numbers on future jobs.

4
Reminders
PLEASE INTERRUPT ME! (REALLY!)

5
Benefits of Retro-Commissioning
Improved Occupant Comfort • Indoor air quality concerns alleviated / reduction in employee absenteeism• Improved employee productivity & thermal comfort
Improved Building Operation• Reduced maintenance calls• Create benchmarks to facilitate efficient system monitoring
Reduced Operating Costs & Decreased Energy Consumption• Corrections to problems never identified during initial building start-up • Solutions to systematic problems in building operation• Elimination of excessive equipment run times due to changes in occupancy or space
usage• Replacement of malfunctioning equipment or sensors• Optimization of controls sequences• Extended equipment life

6
Where are the Retro-Commissioning Opportunities?
Design• Incorrect cooling load calculations• Poor equipment access• Incorrect head pressure control
Construction• Electric duct heaters with incorrect wiring• Incorrect air damper sequencing
Maintenance• Corroded condenser coils• Chilled water bypasses & leaks
Operations• Simultaneous heating and cooling• Control sequence not operating correctly• Temperature and humidity sensors out of calibration• Equipment not responding to control system• BAS programming vs. actual operation
Outside air dampers found to be non-functionaland using cardboard to hold outside air back.
7
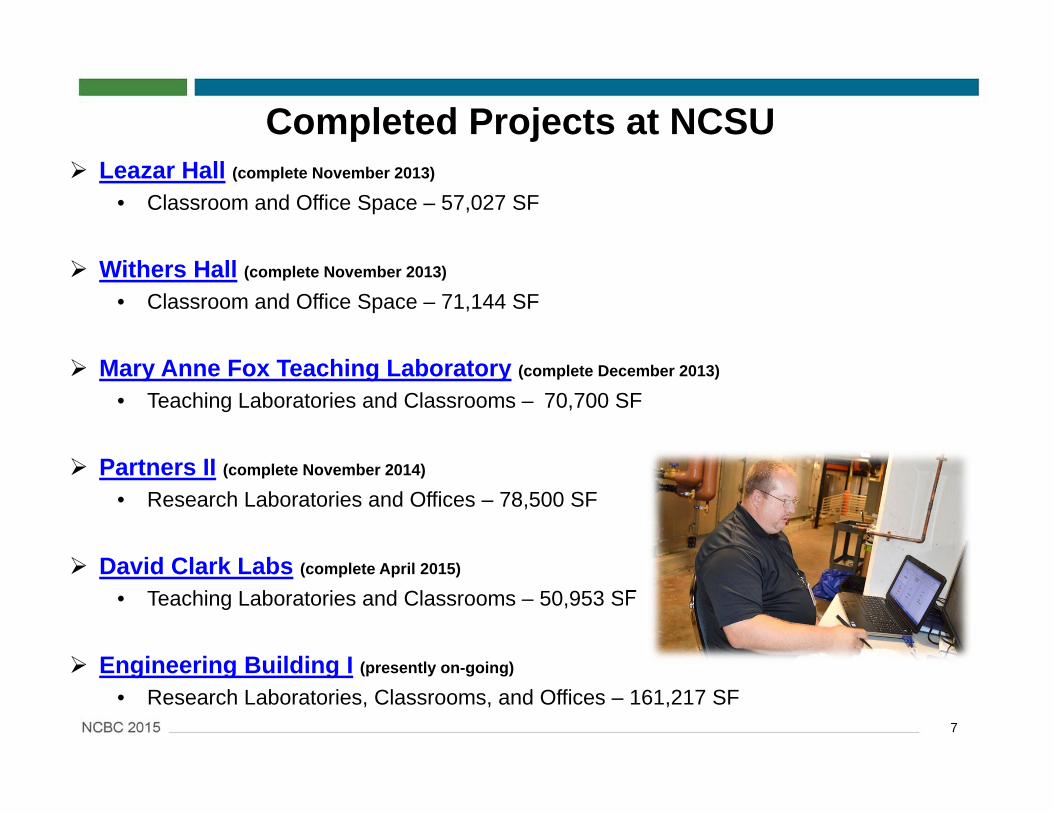
Completed Projects at NCSU Leazar Hall (complete November 2013)
• Classroom and Office Space – 57,027 SF
Withers Hall (complete November 2013)
• Classroom and Office Space – 71,144 SF
Mary Anne Fox Teaching Laboratory (complete December 2013)
• Teaching Laboratories and Classrooms – 70,700 SF
Partners II (complete November 2014)
• Research Laboratories and Offices – 78,500 SF
David Clark Labs (complete April 2015)
• Teaching Laboratories and Classrooms – 50,953 SF
Engineering Building I (presently on-going)
• Research Laboratories, Classrooms, and Offices – 161,217 SF

8
Costs to Re-Commission – Direct Costs
In industry today, the average cost for retro-commissioning is between $0.05 and $0.50 per square foot.
• Dependent on scope, size and age of building, and complexity of building systems.
Retro-Cx Cost Allocation• Planning & Investigation 69%• Implementation 27%• Verification and Tracking 4%
Simple Payback Time 0.2 to 2.1 years
Information for this slide taken from: The Cost-Effectiveness of Commercial Buildings Commissioning, Lawrence Berkeley National Laboratory, Mills, E., H. Friedman, T. Powell, N. Bourassa, D. Claridge, T. Haasl, and M.A. Piette. 2004

9
Costs to Re-Commission – Direct Costs
In industry today, the average cost for retro-commissioning is $0.05 and $0.50 per square foot.
• Dependent on scope, size and age of building, and complexity of building systems.
Retro-Cx Cost Allocation• Planning & Investigation 69%• Implementation 27%• Verification and Tracking 4%
Simple Payback Time 0.2 to 2.1 years
Information for this slide taken from: The Cost-Effectiveness of Commercial Buildings Commissioning, Lawrence Berkeley National Laboratory, Mills, E., H. Friedman, T. Powell, N. Bourassa, D. Claridge, T. Haasl, and M.A. Piette. 2004

10
Costs to Re-Commission – Associated Costs
The way in which we at NCSU provide commissioning services adds some costs not always fully calculated in ‘standard’ industry:
Building Commissioning at NC State University
Planning & Investigation
CxServices
Controls / Building Tuning
RepairsTesting & Balancing Services
Pre & Post Job
Documents

11
Costs to Re-Commission – Associated Costs
The way in which we at NCSU provide commissioning services adds some costs not always fully calculated in ‘standard’ industry:
Building Commissioning at NC State University
Planning & Investigation
CxServices
Controls / Building Tuning
RepairsTesting & Balancing Services
Pre & Post Job
Documents
• We must gather building documentation prior to starting a commissioning job. May or may not include design drawings, TAB reports, etc.
12
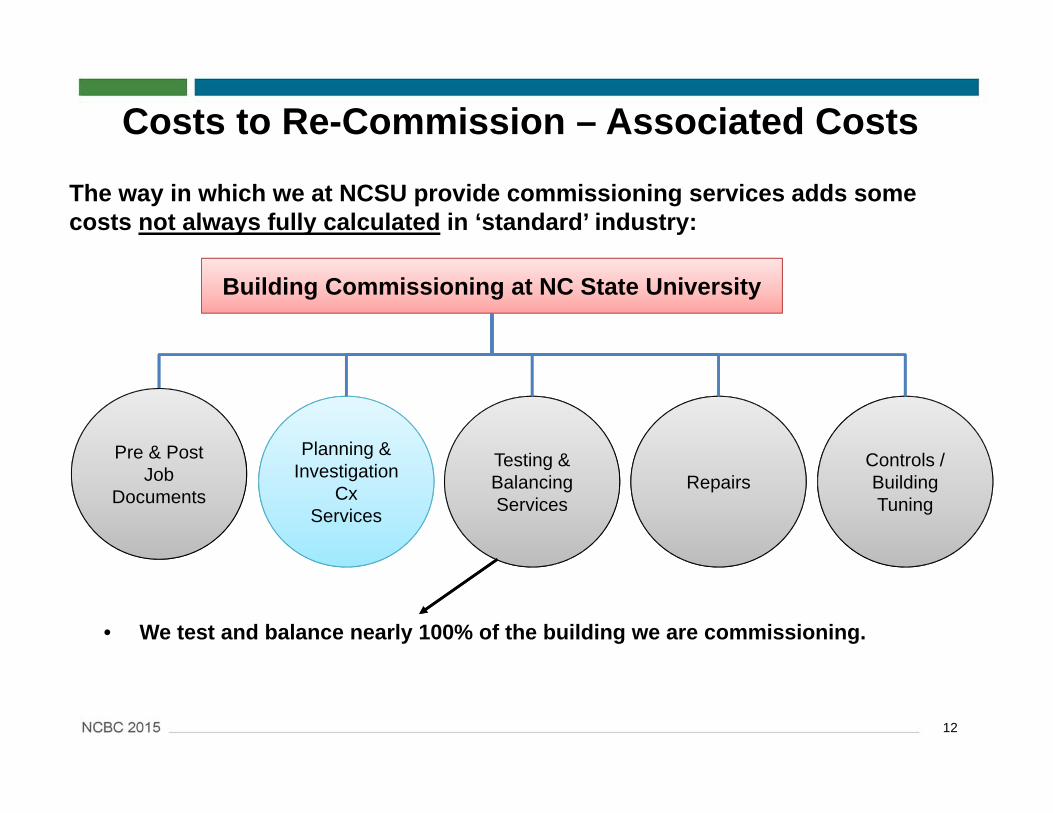
Costs to Re-Commission – Associated Costs
The way in which we at NCSU provide commissioning services adds some costs not always fully calculated in ‘standard’ industry:
Building Commissioning at NC State University
Planning & Investigation
CxServices
Controls / Building Tuning
RepairsTesting & Balancing Services
Pre & Post Job
Documents
• We test and balance nearly 100% of the building we are commissioning.
13
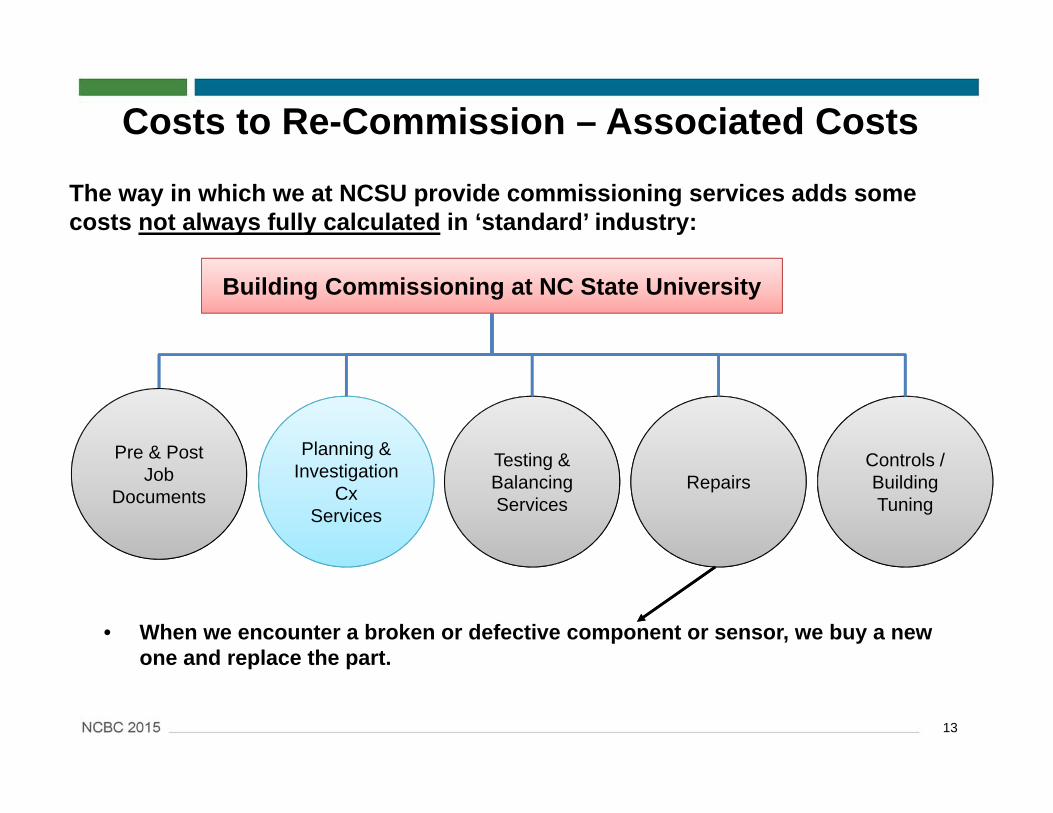
Costs to Re-Commission – Associated Costs
The way in which we at NCSU provide commissioning services adds some costs not always fully calculated in ‘standard’ industry:
Building Commissioning at NC State University
Planning & Investigation
CxServices
Controls / Building Tuning
RepairsTesting & Balancing Services
Pre & Post Job
Documents
• When we encounter a broken or defective component or sensor, we buy a new one and replace the part.

14
Costs to Re-Commission – Associated Costs
The way in which we at NCSU provide commissioning services adds some costs not always fully calculated in ‘standard’ industry:
Building Commissioning at NC State University
Planning & Investigation
CxServices
Controls / Building Tuning
RepairsTesting & Balancing Services
Pre & Post Job
Documents
• When we aren’t able to make the repair on our own, the maintenance shop assigned to the building will assist.

15
Costs to Re-Commission – Associated Costs
The way in which we at NCSU provide commissioning services adds some costs not always fully calculated in ‘standard’ industry:
Building Commissioning at NC State University
Planning & Investigation
CxServices
Controls / Building Tuning
RepairsTesting & Balancing Services
Pre & Post Job
Documents
• When there is a systematic failure, we will enlist the help of a project engineer and outside contractors to make the repair.

16
Costs to Re-Commission – Associated Costs
The way in which we at NCSU provide commissioning services adds some costs not always fully calculated in ‘standard’ industry:
Building Commissioning at NC State University
Planning & Investigation
CxServices
Controls / Building Tuning
RepairsTesting & Balancing Services
Pre & Post Job
Documents
• We employ our own building automation technicians to do BAS loop tuning.
17
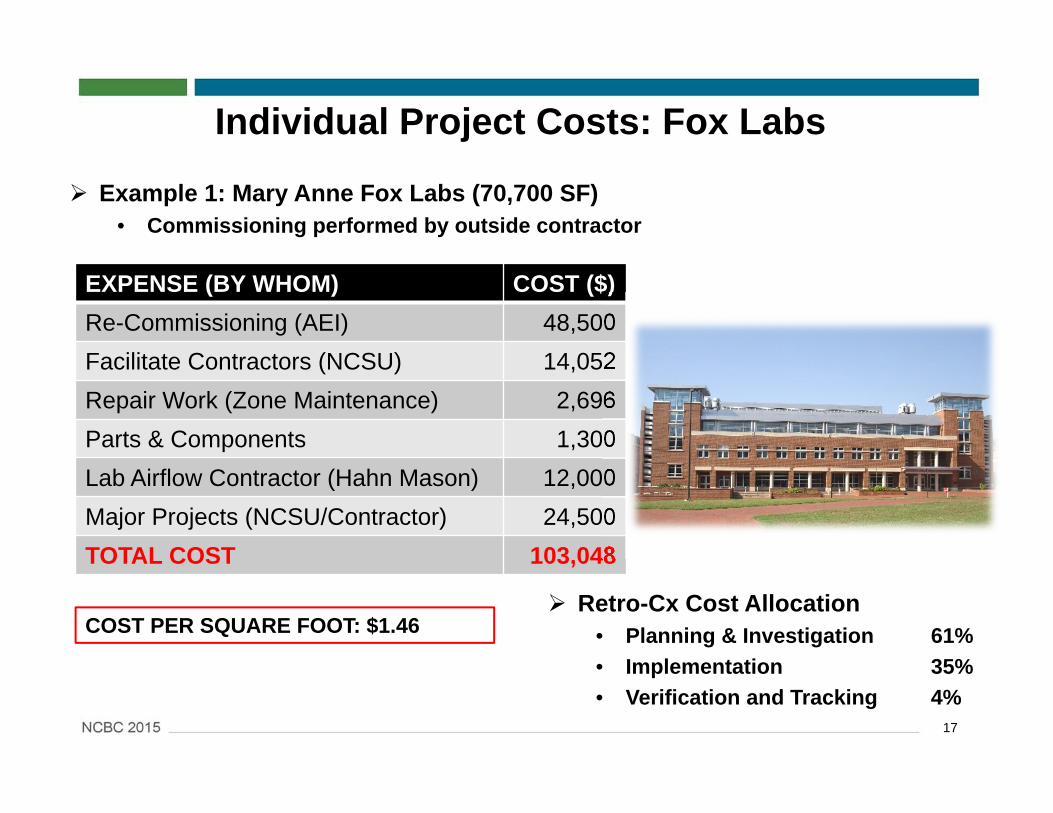
Individual Project Costs: Fox Labs
EXPENSE (BY WHOM) COST ($)Re-Commissioning (AEI) 48,500Facilitate Contractors (NCSU) 14,052Repair Work (Zone Maintenance) 2,696Parts & Components 1,300Lab Airflow Contractor (Hahn Mason) 12,000Major Projects (NCSU/Contractor) 24,500TOTAL COST 103,048
Example 1: Mary Anne Fox Labs (70,700 SF)• Commissioning performed by outside contractor
COST PER SQUARE FOOT: $1.46 Retro-Cx Cost Allocation
• Planning & Investigation 61%• Implementation 35%• Verification and Tracking 4%
18
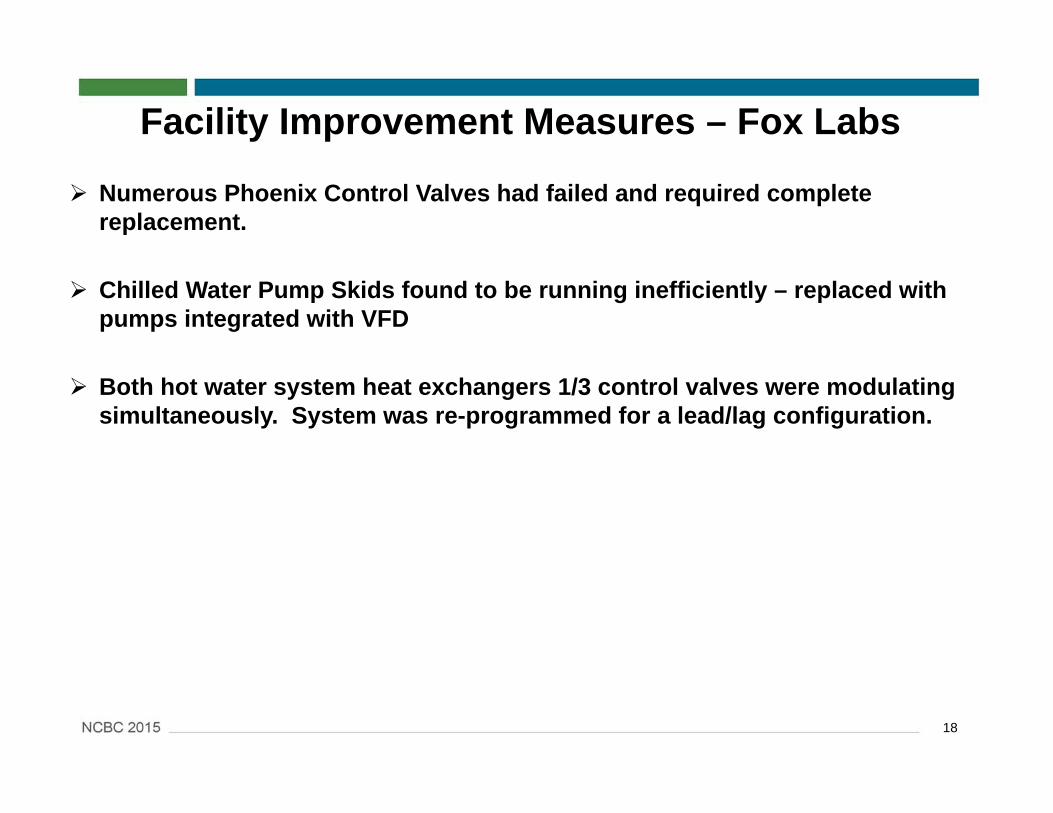
Facility Improvement Measures – Fox Labs
Numerous Phoenix Control Valves had failed and required complete replacement.
Chilled Water Pump Skids found to be running inefficiently – replaced with pumps integrated with VFD
Both hot water system heat exchangers 1/3 control valves were modulating simultaneously. System was re-programmed for a lead/lag configuration.

19
Individual Project Savings: Fox Labs
ENERGY CATEGORY SAVINGS ($)Electricity 17,854Steam 23,548Chilled Water 41,455Domestic Water 1,230TOTAL SAVINGS 84,087
Example 1: Mary Anne Fox Labs (70,700 SF)• Energy savings for Fiscal Year 2014 (as compared Fiscal Year 2013).
EUI dropped from 528 to 468 (11%)

20
EXPENSE (BY WHOM) COST ($)Re-Commissioning (NCSU) 29,630Repair Work (NCSU Cx Team) 16,387Repair Work (Zone 1) 6,207Parts & Components 3,956Major Projects (NCSU/Contractor) 19,008TOTAL COST $75,188
Example 2: Withers Hall (71,144 SF)• Commissioning performed by NCSU Commissioning Team
COST PER SQUARE FOOT: $1.06
Individual Project Costs: Withers Hall
Retro-Cx Cost Allocation• Planning & Investigation 39%• Implementation 57%• Verification and Tracking 4%

21
Facility Improvement Measures – Withers Hall
VAV supply box minimum found to be 50% of maximum, reduced to 20%.
OA Intakes Impacted and Inaccessible – Access Door Cut in Place and Mesh Screens Replaced with Bird Screens
Excessive sediment was found clogging the chilled water strainers on the AHU’s – New In-Line Strainer Installed
Hot Water System Triple Duty Valves found to have failed. Eliminated from piping system.

22
Individual Project Savings: Withers Hall
ENERGY CATEGORY SAVINGS ($)Electricity 15,193Steam 6,262Chilled Water 20,195Domestic Water 356TOTAL SAVINGS 42,006
Example 2: Withers Hall (71,144 SF)• Energy savings for Fiscal Year 2014 (as compared Fiscal Year 2013).
EUI dropped from 110 to 77 (30%)
23
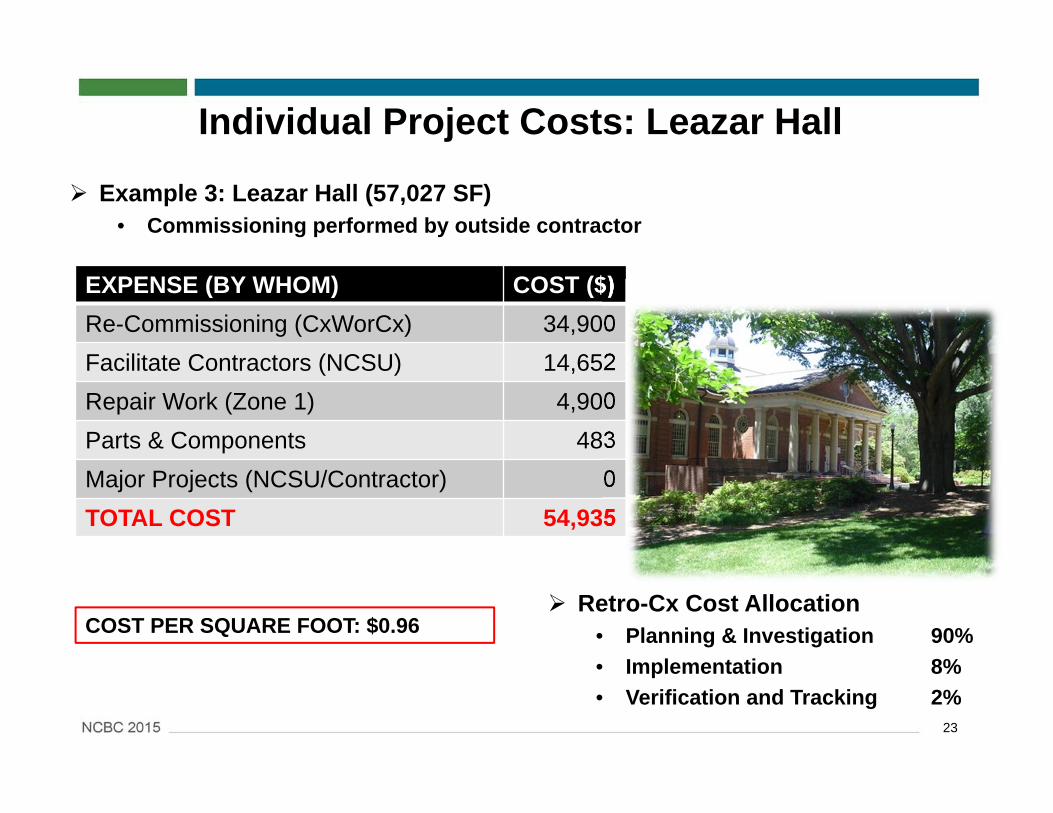
Individual Project Costs: Leazar Hall
EXPENSE (BY WHOM) COST ($)Re-Commissioning (CxWorCx) 34,900Facilitate Contractors (NCSU) 14,652Repair Work (Zone 1) 4,900Parts & Components 483Major Projects (NCSU/Contractor) 0TOTAL COST 54,935
Example 3: Leazar Hall (57,027 SF)• Commissioning performed by outside contractor
COST PER SQUARE FOOT: $0.96 Retro-Cx Cost Allocation
• Planning & Investigation 90%• Implementation 8%• Verification and Tracking 2%

24
Facility Improvement Measures – Leazar Hall
VAV supply box minimum found to be 50% of maximum, reduced to 20%.
Two air-handling units had excessive supply air (fixed sheave, no VFD), re-sheaved to reduce airflow.
AHU’s did not have economizer implemented as was intended in original sequence. Revise sequence to include free cooling.
25
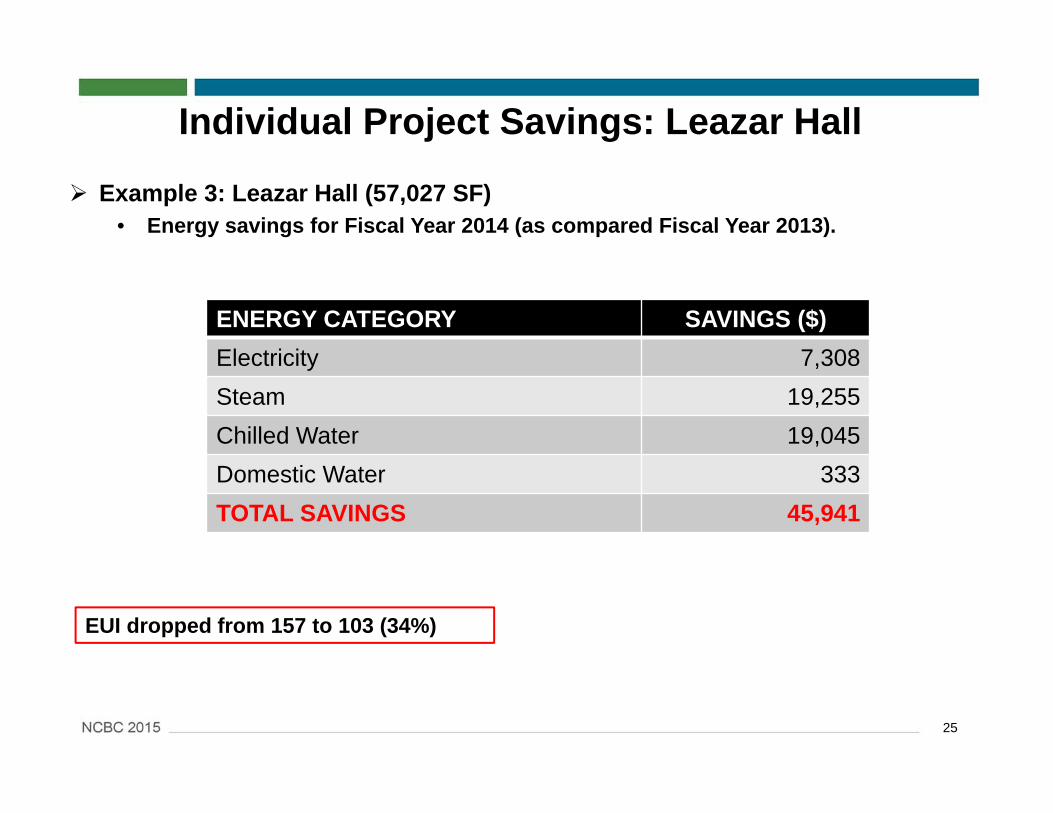
Individual Project Savings: Leazar Hall
ENERGY CATEGORY SAVINGS ($)Electricity 7,308Steam 19,255Chilled Water 19,045Domestic Water 333TOTAL SAVINGS 45,941
Example 3: Leazar Hall (57,027 SF)• Energy savings for Fiscal Year 2014 (as compared Fiscal Year 2013).
EUI dropped from 157 to 103 (34%)

26
Return on Investment (ROI)
EXAMPLE PROJECTS ROIMary Anne Fox Labs 0.61 yearsWithers Hall 0.89 yearsLeazar Hall 0.60 years
ROI - simple economic analysis of the costs against the energy savings.
• Our payback “goal” was 2.7 years for a lab/classroom.

27
Return on Investment (ROI)
ROI – building tenant safety.
• FOX LABS. Found a significant number of failed lab exhaust control valves.
• WITHERS HALL. Found the outside air intakes to each of the 8 air handlers to be fully impacted with dirt and debris.
• LEAZAR HALL. Found the outside air flow stations to be reading inaccurately, and in need of repair on all air handlers.
• DAVID CLARK LABS. Found a significant amount of collapsed exhaust ductwork above ceiling.
• PARTNERS II. Found numerous incorrect pressure relationships between labs and offices/classrooms.

28
Return on Investment (ROI)
ROI – the downside
Completed Projects
Projects Yet to Come

29
Lessons Learned
It costs more to Cx and repair items than we estimated
We are saving much more energy than we estimated
A 0.7 year simple payback means we need to do more commissioning to reduce campus energy costs
Found more issues that expected in a relatively ‘new’ building• Up-fits have significantly changed buildings in short time• Dampers not functioning• Device calibration requirement is high
Team effort /Communication key to success• Users, key constituents, Zone Maintenance Staff, Cx Team, Energy Management

30
Lessons Learned
Use of a 3rd part Cx Firm more expensive• NC State ‘assist’ so costs higher
Setup work orders to effectively capture where effort and costs occurred (Cx, Repairs, Projects)
Correcting the issue saves energy – simply making a list of the issues does not save energy
Correct potential safety issues in Labs• Phoenix Lab exhaust valves are not maintenance free
Cx Team develops basic scope of work for repairs & projects which helps to facilitate execution
Need to track energy usage to determine optimum time to re-commission again!