retrospective review of indications for...
TRANSCRIPT
i
RETROSPECTIVE REVIEW OF INDICATIONS FOR EMERGENCY
OBSTETRIC REFERRALS FROM MOFOLO COMMUNITY HEALTH CENTRE
TO CHRIS HANI-BARAGWANATH HOSPITAL.
Gerald Levin
A research report submitted to the Faculty of Health Sciences, University of
the Witwatersrand, Johannesburg, in partial fulfilment of the degree of Master
of Science in Medicine in Emergency Medicine
11 May, 2016

ii
Declaration
I, Dr Gerald Levin, student number 7602678 hereby declare the following:
• I am aware that plagiarism (the use of someone else’s work without
their permission and/or without acknowledging the original source) is wrong
• I confirm that this retrospective review work submitted is my own work.
• I have followed the required conventions in referencing the thoughts and
ideas of others.
• I understand that the University of the Witwatersrand may take disciplinary
action against me if there is a belief that this is not my own work, or that I
have failed to acknowledge the source of the ideas or words in my writing.
Signed:
Date: 11 May, 2016

iii
Dedication
To my family.
iv
Publications and presentations during this research
Retrospective review of indications for emergency obstetric referrals from
Mofolo Community Health Centre to Chris Hani Baragwanath Hospital. Levin
G, van Bogaert DK, Ndlela T, Manda K, Buchmann EJ, Basu J, Rubel D.
Poster presentation at 35th National Congress of the South African Society of
Obstetricians and Gynaecologists.(SASOG), 6-10 May 2012, Champagne
Sports Resort, Drakensburg, KwaZulu-Natal. Abstract in S Afr J OG. April
2012, 18(2):77.
World Health Organization (WHO) suggestion for universal voluntary testing for
HIV with immediate ARV therapy in South Africa. Levin G, Basu J, van
Bogaert DK, Goosen J. Oral presentation at 35th National Congress of the
South African Society of Obstetricians and Gynaecologists.(SASOG), 6-10
May 2012, Champagne Sports Resort, Drakensburg, KwaZulu-Natal. Abstract
in SAJOG April 2012, 18(2):60.
Retrospective Review of Indications for Emergency Obstetric Referrals from
Mofolo CHC to CH Baragwanath Hospital. 7th Public Health Association of
South Africa Conference (PHASA), 29-30 November 2011, Gauteng. Levin G,
van Bogaert DK, Ndlela T, Manda K, Buchmann EJ.
World Health Organization (WHO) Suggestion for Universal Voluntary Testing
with “Immediate ARV Therapy” in South Africa as a strategy for
elimination of HIV transmission. Wits Faculty of Health Sciences Research
Day & Postgrad Expo 22/09/2010 (oral presentation). Levin G, van Bogaert
DK.

v
Abstract
Retrospective review of indications for Emergency Obstetric referrals from
Mofolo Community Health Centre to CH Baragwanath Hospital.
Objectives: To determine the referral rate, clinical indications, and ambulance
response time for Emergency Obstetric Care referrals from Mofolo maternity obstetric
unit (MOU) to CH Baragwanath Hospital (CH-B).
Method: A retrospective comparative study of the admission book records of women
in labour who presented to Mofolo during the first 3 months of 2010 was conducted.
Data from 624 presentations in the admission book were allocated into referred and
non-referred groups with Excel spreadsheets.
Results: There were 317 deliveries at Mofolo MOU, of which 44 (13.9%) were
transferred to CH-B after delivery. Referred neonates numbered 21 (6.5%), as 23
neonates accompanied their mothers who were referred. Women in labour that were
referred to CH-B numbered 303. Thus, of 624 patients, there were 347 (55.6%)
referred to CH-B. Sixty nine women were referred for pregnancy induced
hypertension (19.9%). Prematurity referral was 17.7% (31.5 for premature rupture of
membranes, 25 for preterm labour and 5 underweight babies; thus 61.5 / 347 =
17.7% of referrals). Partogram delay was the referral reason for 51 women (14.7%),
and for meconium- stained amniotic fluid for 14.7%. Average ambulance response
time was 48.2 minutes and 55% went by ambulance.
Conclusion: Neonatal referral rate at Mofolo MOU was 6.5%; down from the 33% at
Chiawelo. The combined referral rate was similar; 55.6% at Mofolo MOU and 58.4%
at Chiawelo MOU. This rise may be related to ease of referral process together with
the increase in litigation. Mofolo MOU integration into the health district is facilitated
by accessible referral path and the choice of transport as 55% went by ambulance.

vi
ACKNOWLEDGEMENTS
• PEPFAR Fellowship, Wits Health Consortium & Jozi Family Medicine for the
1 year program ending 8/2010, during which this project was started.
• The Mofolo midwives and staff, for assistance at Mofolo CHC.
• Wits Ethics Committee, for unconditional approval.
• Prof Kramer for supervision, guidance, patience and assistance.
• Prof Eckard Buchmann, for referral protocol information & enthusiasm.
• Dr Manda, Prof Goosen, Prof van Bogard for stimulation & encouragement.
• Dr Olornuju and MRC for statistical assistance in June 2014.
• Prof Dave Rubin, for assistance with Histogram construction in R.
• Wits Post-graduate hub staff, for T- test assistance.
• Mr Benny Sikakane, for study permission and assistance.
• Gauteng Department of Health, City of Johannesburg, Baragwanath hospital,
PEPFAR Fellowship, FPD, US Aid and Right to Care; for logo permission on
the posters, and assistance.
• P Faugust, for proof-reading.

vii
TABLE OF CONTENTS Page
Title I ו
וו Declaration II
Dedication III ווו
ᴠ Publications arising from this study IVו
ᴠ Abstract V
ᴠו Acknowledgements VI
ᴠוו Table of contents VII
ᴠווו Abbreviations XI
1. Literature review 1
1.1 Referral from MOU to CH-B Academic Hospital 3
1.2 Referral reasons 8
1.2.1 Pregnancy induced hypertension (PIH) 8
1.2.2 Prolonged labour as a referral reason 10
1.2.3 Prematurity 13
1.2.4 Haemorrhage as a referral reason 14
1.3 Ambulance response time 16
1.4 Problem statement, Aim and Objectives of this study 21
2. Methods 22
2.1 Study design 22
2.2 Site 23
2.3 Study population 23
2.4 Data collection 24
2.5 Measuring tool (Microsoft-Excel ™ spreadsheets) 24
2.6 Ethical issues 27

viii
3. Results 28
3.1 Objective 1: Referral rate from Mofolo MOU to CH-B 28
3.2 Objective 2: Referral reasons 29
3.3 Objective 3: Ambulance response time 34
4. Discussion 37
4.1 Objective 1: Referral rate 37
4.2 Objective 2: Referral reasons 41
4.3 Objective 3: Ambulance response time 47
5. Conclusion 51
6. References 52
7. Appendices 63
1 Appendix 1; Facility permission (Mofolo CHC) 63
2 Appendix 2; Gauteng Department of Health permission 64
3 Appendix 3 Data sheet 65
4 Appendix 4; Ethics Clearance Certificate 66
5 Appendix 5; Protocol approval 67
ix
LIST OF FIGURES
Figure Page
Figure 1: Histograms illustrating birth weight for non-referred neonates (grams) 31
Figure 2: Histogram illustrating birth weight for referred neonates (grams) 32
Figure 3: Box and whisker plots of birth weights 33
Figure 4: Ambulance response time chart 35
Figure 5: Histogram of ambulance response time 36
(Call to Presentation time) for referred group.

x
LIST OF TABLES
Table Page
Table 1: Referral reasons for pre-delivery and post-delivery groups 29
Table 2: Comparative data of non-referred and referred groups 30

xi
ABBREVIATIONS
ANC Antenatal Clinic
APH Ante partum haemorrhage
ARV Anti-retroviral treatment
BBA Born before arrival
CH-B Chris Hani-Baragwanath Academic Hospital
CHC Community Health Centre
CPD Cephalo-pelvic disproportion
CS Caesarean section
DHS District Health Service
EmONC Emergency Obstetric and Neonatal Care
EMS Emergency Medical Services
FHNH Fetal heart not heard
HIV Human Immunodeficiency Virus
IMR Infant Mortality Rate
IUGR Intra Uterine Growth Retardation
KZN Kwa Zulu-Natal
MDG Millennium Development Goal
MMR Maternal Mortality Ratio per 100 000 live births
MOU Maternity Obstetric Unit
MRC Medical Research Council
MSL Meconium stained liquor
NCCEMD National Committee for Confidential Enquiry into Maternal Deaths
NPRI Non-pregnancy related infections
PCP Pneumocystis Jiroveci pneumonia
PHC Primary Health Care
PIH Pregnancy induced hypertension & eclampsia
PPH Postpartum Haemorrhage
PremROM Premature rupture of membranes
RPOC Retained products of conception
SGA Small for gestational age or preterm
USA United States of America
WHO World Health Organisation
1
Chapter 1. LITERATURE REVIEW
In South Africa, the Department of Health has stated that the outcomes of
maternal and child health care should be better. This is substantiated because
the government invests relatively more on health care than other countries
with similar outcomes (1). This study is of indications for emergency obstetric
referrals from a midwife staffed obstetric unit [MOU] within the Soweto Health
District, as well as the rate of referral and ambulance response time.
In the United States of America [USA] during the 20th century the maternal
death rate reduced by 99% (2). Chang et al state that in1900 there were 850
maternal deaths per 100 000 live births [MMR]. However, by 1982 the MMR in
USA had been reduced from 850 to 7.5; where it has remained subsequently
(2).
In a 2007 study from within Nigeria, Igberase and Ebeigbe (3) reported a
MMR of 2 232 during the 10 years reviewed. Main causes of maternal
mortality were puerperal sepsis (33%), abortion complications (22.6%),
preeclampsia/eclampsia (17.4%), prolonged obstructed labour (13.0%) and
obstetric haemorrhage (7.8%). Mortality among patients who had not attended
antinatal clinic [ANC] was 10 times higher than for patients who had attended
ANC (3).
The South African Department of Health (4) is committed to lowering both
MMR and the child mortality rate. As strategy, the Department of Health (5) has
recently repeated a goal of changing from a curative to a preventative
2
approach, called a primary health care [PHC] model. PHC is planned to be
more easily accessible to the community because there will be more clinics
within communities. The PHC model will deliver early, quality ante-natal and
post-natal health care, with the aim of reducing high maternal and child
mortality rates (4,5). In South Africa, health care is delivered by 3 077 clinics
and 313 Community Health Centres [CHC] at PHC level (6).
The District Health Service [DHS] is an important part of healthcare delivery
because it links PHC within the community to a higher level care, when
appropriate (5-8). National Health Act 61 of 2003 deals with the formation of
health districts and their role in the delivery of health services. Provision is
made to link PHC and DHS within an integrated health care service (4),
including midwifery and emergency medical services [EMS]. PHC facilities are
planned as the entrance level to DHS, through the referral process with
EMS, if indicated by protocol (6-8).
The implementation of the referral protocol requires monitoring, to facilitate the
DHS functioning. This is compatible with a 2014 meta-analysis by Salam et al
(8), which included 47 systematic reviews on pre-defined district level
interventions. They report that at district level, monitoring with feedback can
improve compliance with protocol (8).
Challenges with protocol implementation were identified by Afari et al (9) in
Ghana. They conducted interviews with staff in a region where 1 district
hospital and 10 health centres serve 171 499 people. For improvement their
suggestions included standardised referral protocol implementation (9).
3
Problems are associated with pregnant women avoiding the referral protocol
to a referral hospital. For example, Mashishi (10) performed a retrospective
study at Dilokong district maternity hospital in Limpopo during 2008. Within
the sample of 400 women, 85% were self-referred. As most women were self-
referred, 57% of women could have delivered with a lower level of care (10).
Furthermore, Mashishi (10) reports that 67% of self-referred women arrived at
Dilokong hospital with an ambulance and that when referral protocol
adherence is low, there is a risk of overloading the hospital maternity unit
(10). Thus, non-adherence to referral protocol on a large scale can weaken
health care delivery.
Das et al (11) stated that the majority of both maternal and neonatal deaths
happen at birth or during the next 24 hours. As obstetric care during this
period is critical, Das et al (11) used meta-analysis with 32 systematic reviews.
They conclude that social support within the community for pregnancy and
labour significantly reduces antenatal hospital admission, intra-partum
analgesia, labour duration, dissatisfaction, caesarean section delivery [CS]
and instrumentally assisted vaginal birth (7,11).
1.1 Referral from a Maternity Obstetric Unit (MOU) to CH B Academic Hospital
Dumont et al (12) suggest that a shift from the traditional risk assessment
approach to providing Emergency Obstetric and Neonatal Care services
appears appropriate to reduce MMR (12). Maternal deaths are reduced with
implementation of eight interventions identified by WHO, and are known as
Emergency Obstetric Care (13), delivered by comprehensive Emergency

4
Obstetric and Neonatal Care [EmONC] centres. Health facilities providing the
first seven interventions are basic EmONC centres and include midwife staffed
obstetric units [MOU], compared to complete Emergency Obstetric centres
that can provide all nine interventions listed below (13);
1. Assisted vaginal delivery,
2. Parenteral oxytocic drugs,
3. Parenteral anticonvulsants,
4. Removal of retained products of conception,
5. Parenteral antibiotics,
6. Basic neonatal resuscitation with bag and mask
7. Surgery,
8. Blood transfusion.
As MOU’s in the Soweto Health district do not have a blood bank on site,
the need for urgent blood transfusion is a referral reason. For example, blood
transfusions are indicated for postpartum haemorrhage [PPH], retained products of
conception [RPOC] and vaginal lacerations (14,15). In addition, anaemia is common
as 42.9% of maternal deaths appear to be associated with anaemia (16). Protocol
development is compatible with World Health Organisation [WHO] policy of
monitoring and investigating how the number of deaths may be reduced (17).
Protocol development includes appropriate management of the third stage of labour
to reduce morbidity and mortality, by standardizing an optimal approach (17).
Therefore protocol indications for referral are important for communication, training,
monitoring and evaluation.
5
Dlakavu (18) writes that in 2004, 33% of deliveries at CH-B were self-referred
and low risk. Dlakavu (18) then reports that in 2008, triaging self-referred
women was introduced at CH-B and women with low risk were down-referred
back to midwife obstetric units [MOU]. In a random sample study at CH-B
between 1 May 2010 and 31 May 2010, Dlakavu (18) extracted data from 182
deliveries. Only 35 of these women (19%) were self-referred. During the same
month, the triage team at CH-B triaged 171 women who presented and down-
referred 83 back (49%) to MOU level (18). Thus CH-B reduced the number of
self-referred women by 14%, possibly to match capacity with demand.
Chaturvedi et al (19) report that the process of referral of a pregnant woman involves
moving or transferring her from a lower level health facility to a higher level health
facility to receive comprehensive obstetric care. Mirkuzie et al (20) state that basic
EmONC alone can prevent 40% of neonatal deaths associated with birth, as well as
a significant amount of maternal deaths. Based on this statement, clinical
assessment, triage and referral are essential components of basic EmONC duty
(20).
At the first African Federation for Emergency Medicine consensus conference during
November 2011 in Cape Town, it was stated that an integrated approach to triage,
resuscitation, and stabilization of pregnant patients is needed (21,22). Acute care
referral systems, facility–based acute care and emergency nursing were prioritised
(21). The “Nurse Practice Guidelines” state that Emergency nursing requires working
with a multidisciplinary team (23), including emergency personnel. The emergency
nurse can identify life threatening problems, grade or prioritise the urgency of care
needed and provide appropriate resuscitation and management. Emergency nursing
6
is not confined to the emergency centre, and includes the pre-hospital emergency
treatment of patients (23). Terry (24) writes that the contribution of nurses is the
strongest numerically within the sub-Saharan health care sector (24).
DiFazio and Vessy (25) list nurse midwifery (obstetric nursing) as one of four fields
offering nurses advanced training and the opportunity to be registered as advanced
practice registered nurses in the USA, facilitating collaborative practice (25).
Waldman and Kennidy state that there are many examples of collaborative practice
in the USA, formed by certified nurse-midwives partnering with obstetricians to
provide good, efficient, cost-effective health care (26). DeJoy et al (27) write that
there are 3 examples in the USA where the certified nurse midwives deliver health
care to low and medium risk patients with the supervision of obstetricians (26, 27).
The referral rate of a health facility is the proportion of pregnant women that are
referred to other facilities. Chaturvedi et al (19) report that only 30% of deliveries in
India occurred within health facilities in 2005 when cash incentives for women
delivering in health facilities was introduced (19). By 2010, deliveries in health
facilities rose to 81%. In addition, during a 5 day study period at 96 health facilities,
there were 126 referrals from 1 182 pregnant women. Thus, the referral rate was
10.7% (19).
In an Australian study by Schultz et al (28) that was carried out in 2010, all expected
deliveries were referred from a remote, rural area. The strategy of Schultz et al (28)
was to refer all 99 pregnant women from the Barkly region in Australia’s Northern
Territory province to a town with comprehensive EmONC (28). Thus, if a

7
complication developed, high care was available without having to plan a transfer
flight. Hence, all expected deliveries were “emergency referrals” and flown to Alice
Springs Hospital, which is about 500 km away. A referral rate of 100% was desired in
this study (28).
Médecins sans Frontièrs started a comprehensive EmONC in rural Burundi during
2006. Within the district 9 900 deliveries a year were expected and there were 9
basic EmONC units. A linking ambulance service and referral system was started.
Tayler-Smith et al (29) collected data from ambulance call log books and
crosschecked with registers within the comprehensive EmONC. During 2011, there
were 1 406 women being transferred in by ambulance. As 9 900 deliveries were
expected, the referral rate was 1 406 ÷ 9 900; thus the apparent district referral rate
was thus 14.2% (29).
In Angola, Strand et al (30) counted the number of births within and referrals to
hospital from 3 peripheral basic EmONC units. From May to July 1996, there were 2
443 births and 395 referrals from the 3 basic EmONC units, which gives a referral
rate of 16.3% (30).
For example Admasu et al (31) report that over 50% of basic EmONC presentations
were referred in Ethopia, but only 7% of deliveries occurred in health facilities during
2008 (31). This high referral rate should be assessed together with the low
proportion of deliveries that occurred within health facilities.
8
In China, Sun et al (32) report that 10% of all deliveries have birth complications,
70% of which were delivered at Level 2 and 3 hospitals with a higher proportion of
neonatal death and preterm birth (32). It can be deduced that 7 out of every 10
deliveries with complications were referred (32).
Iyengar and Iyengar (33) conducted a study at 2 basic EmONC units in rural India.
During 2000 to 2008, there were 2 771 labour presentations. Among these
presentations 21% had life-threatening complications, most of which (76.2%) were
advised for referral. Among the women who were advised for referral, two-thirds
complied (33). Thus, 23.8% of women needing referral were not referred, and 33%
of those referred did not comply even though the referral system provided for
arranging transport (33).
Salam et al (8) assessed the effectiveness of district level interventions by reviewing
47 publications and found that engaging community opinion leaders to promote
evidence based medical practice improved compliance (8). Buchmann wrote that a
midwife-managed clinic, with a supportive referral hospital, can provide an
acceptable level of care (34).
1.2 Referral reasons
1.2.1 Pregnancy induced hypertension (PIH), caused 14 % of maternal deaths in
South Africa during 2008-2010 (35). In rural Bangladesh, Sikder et al reported that
among 27 241 births, over 75% of births were at home, with 328 (1%) having
eclampsia (36). This apparent difference may be resolved with definition sub-
groups.
9
Moodley (37) states high blood pressure is diagnosed when blood pressure is 140/90
mmHg or above on two serial measurements separated by 1at least 6 hours and
may be:
Hypertension when measured before week 20 of pregnancy
Gestational hypertension when measured after week 20 without proteinurea
Pre-eclampsia is hypertension after week 20 with proteinurea.
Superimposed pre-eclampsia is diagnosed in hypertension after week 20
when either (1) Spot urine protein or renal compromise with creatinine
≥100µmol/L (2) Neurological symptoms like headache or convulsions (3) Liver
disease with aspartate transaminase ˃40 IU/L (4) Haematological
abnormalities like haemolysis or thrombocytopenia or (5) Decreased fetal
growth (small fetus) is present (37).
Buchmann’s study (34) at in Soweto was undertaken to audit the referral system
from Chiawelo clinic to CH Baragwanath Hospital. Between October 1994 and May
1995, reported that 373 women were referred to CH-B in labour, of which 136 (36%)
had PIH as the referral reason.
However, a bigger proportion of PIH was reported in the study conducted by Litorp et
al (38) from Tanzania. They reported that PIH caused 42% of 467 near-misses and
77 maternal deaths in a study of 13 121 deliveries (38).
Strand et al (30) reported that of 157 who were referred from basic EmONC to
hospital in Luanda during 1996, 28 (17.8%) were referred for PIH (30). After
interventional training, the records from an additional 97 emergency obstetric

10
referrals from the same basic EmONC units to Luanda were compared after 20
months. After intervention, there were 10 referrals (10.4%) for PIH (30).
Recently, Sun et al (32) reported a greatly reduced incidence of PIH in hospital. Their
study included 60 445 deliveries in China. They (32) counted 1 016 hypertensive
women (1.7%) and 277 pre-eclampsia patients (0.4%). This lower proportion of PIH
was also reported in Sikder’s study of 27 241 births from Bangladesh, where 328
women (1%) were reported with eclampsia (36).
Although the frequency of PIH was relatively low in the above two studies at 1.7%
(32) and 1% (36), the high referral rate for PIH of 36% reported by Buchmann
appears appropriate in South Africa, as 14% of maternal mortality is associated with
hypertension and pre-eclampsia (6).
Thus, measurement of the proportion of PIH referrals from a MOU to hospital is of
interest, as the diagnostic rates differ in this literature review.
1.2.2 Prolonged labour as a referral reason, includes both maternal and neonatal
complications. Abraham and Berhan (39) write that abnormal or prolonged labour is
a frequent obstetric problem, and complicates about 20% of deliveries. Gifford et al
(40) report that 68% of unplanned caesarean section deliveries are because of
delayed labour occurring with vertex presentations (40). A South African study (41)
reported that 73% of women with prolonged labour had not yet delivered their first
baby (nulliparous). Failure of cervical dilatation was the main cause and referral for
caesarean section was 4 to 6 times more frequent (41).
11
Olierhead and Osrin (42) describe the partograph as a chart display of the progress
of labour on a chart, where some progress measurements are plotted graphically.
The partogram is recommended by WHO, as it helps childbirth healthcare workers to
recognise potential problems, and to take appropriate action with a standardised
approach (42). The aim is to manage obstructed labour with less maternal and fetal
death and injury (43). In an analysis of 74 publications, partograph application was
reported to assist with monitoring labour, continuity of care, staff involvement,
monitoring and supervision. Monitoring and evaluation were also facilitated, thus
national policy and medico-legal duty are assisted with implementation. Problems
with its use in some developing countries include many different partograph versions
as well as staff graphing skills (42).
The Soweto MOU referral protocol (14,15) defines poor progress in the latent phase
of first stage of labour as occurring when cervical dilatation is less than 4 cm after 8
hours. Abraham & Berhan (39) write that this occurs in 4% to 7% of women with
spontaneous labour (39). These newborn neonates will have a higher risk for
neonatal intensive care admission (33,35).
Poor progress in the active phase of labour can also be detected with the partogram
chart (42). When the cervix is 4 cm dilated, the active phase starts. Subsequent
cervical dilatation is plotted against time, and 1 cm dilatation per hour is required.
The action line on the partogram is placed 2 hours to the right, and if the cervical
dilatation is slow, this “action line” is crossed and transfer to hospital is
required (14,15,42). Poor progress in the second stage of labour is present if the fetal
head has not descended onto the pelvic floor after 2 hours of full (10 cm) cervical

12
dilatation. Referral to hospital is indicated when the “action line” of the plotted
partogram is crossed (14,15,42).
Blix et al (44) combined the data from 215 257 women in a meta-analysis of 15
studies on home childbirth. The referrals from home to hospital ranged from 9.9% to
31.9%. The most common referral reason was prolonged labour with an incidence
between 5.1% and 9.8%. The majority of transfers to hospital were before the
planned home birth, however transfer of women and neonates after birth ranged
from 1.7% to 7.3% (44).
Chaturvedi (19) writes that prolonged labour caused 40% of referrals, and maternal
referral had a 4 times higher risk for intrapartum neonatal death (19). Breech
presentation is the most frequent malpresentation, occurring in about 3% of term
pregnancies (45). As breech presentation can be associated with delay or arrested
labour, the protocol states immediate transfer to hospital if there is not full cervical
dilatation or if the presenting fetal part is at the Ischial spines or above (14,15). In the
In the Chaiwelo district of Soweto, Buchmann (34) reported that of 1 209 women in
labour, 373 (31%) were referred to CH-B during labour. Referral reasons were 49 for
1st stage poor progress (13.1%), 12 for preterm labour (3.2%), 11 for long latent
phase (2.9%), 10 for 2nd stage prolonged (2.7%), 78 for MSL (20.9%), 21 fetal
distress (5.6%) and 10 (2.7%) for fetal heart not heard [ FHNH]. Buchmann (34)
reported that of 253 CS, 95 (38%) were done for cephalopelvic disproportion [CPD].
A retrospective study by Sikder et al (36) reported that of 27 241 births, obstructed
labour ocurred in 2 950 (11%). However, there are different versions of the partogram
13
in use, with different time stages. The referral protocol (14,15) is interpreted as referral
for the age extremes (˂17 and ˃35 years) and with parity ≥5 before labour. As
this may not be policy in all national health policies, it may thus be of assistance to
determine the proportion of referrals due to delayed labour.
1.2.3 Prematurity causes 33% of childhood blindness, about 50% of cerebral palsy
in addition to being a major cause of perinatal death, reports Spong (46). Lloyd & de
Wit (47) wrote that the average proportion of low weight births is 14%, but that low
birth weight is associated with disproportionately more neonatal deaths as 60-80% of
deaths result from prematurity (47).
Low birth weight refers to birth weight below the tenth percentile of gestational age
(48), and is estimated birth weight under 2 kg. It can include pre-term, small for
gestational age and intrauterine growth restriction (IUGR) babies. Intrauterine growth
restriction (IUGR) is when fetal growth is under expectation, usually caused by
placental insufficiency (48).
• In symmetrical IUGR, the size of the fetal head is in proportion to abdominal
size. Early placental insufficiency, genetic abnormalities and uterine infections
are most likely causes (48).
• In asymmetrical IUGR, the head is disproportionally bigger than the abdomen.
The growth problem usually starts after 20 weeks with brain blood flow
maintained when there is placental insufficiency (48).
In China, a prospective study on 61 227 birth registries was conducted by Sun et al
(32) during 2010. Deliveries were at 151 hospitals (level 1-3), and complications

14
included 5.4% premature rupture of membranes (N = 3 290), Theron (49) states that
there is a high risk of ascending infection with prolonged rupture of membranes, and
that chorioamnionitis is the biggest cause of pre-term deliveries (49).
Continued antibiotics with ANC screening for infections is needed as Webb et al (50)
found that of women that delivered prematurely, 57% had urogenital infections and
59% had periodontal disease. In the United States during the 1970’s, Tudela et al
(51) did a study of 143 384 live born neonates. They reported that Group B
streptococcus sepsis was associated with a significant increase in preterm delivery
and chorioamnionitis often starts before birth (51). In 1988, Briggs (52) reported from
Nigeria in this study of 10 665 deliveries, 17% of booked and 66% of unbooked
patients presented after fetal death in utero respectively (52).
At Chiawelo clinic (34), 837 neonates were born, of which 274 were referred to CH-B
(33%). Neonatal referral reasons included 191 for MSL (70%), 17 for prematurity or
weight less than 2 000g (6.2%), 17 for asphyxia (6.2%) and 49 (17.9%) for other
reasons. The infant mortality rate [IMR] for clinic deliveries was 6 per 1 000 (34).
After 15 years of Health System strengthening, it is of interest investigating if the
neonatal referral rate from a MOU in Soweto to hospital has changed.
As prematurity is multifactorial (49), determining the proportion of prematurity could
help future policy at the 5 MOU’s in Soweto.
15
1.2.4 Haemorrhage as a referral reason
The National Committee for Confidential Enquiry into Maternal Deaths,
[NCCEMD] began in South Africa after the introduction of compulsory
notification of maternal deaths during October 1997 (35). A report for
20082010 found 14.1% of maternal deaths for the period 2008 to 2010 were
caused by obstetric haemorrhage (35).
Basu et al (16) write that haemorrhage in pregnancy causes 34% of maternal deaths
in Africa (16). Obstetric haemorrhage can occur both before and after delivery.
Antepartum haemorrhage [APH] is bleeding from the genital tract after 22 weeks of
pregnancy (53). Causes of APH include abruptio placenta (premature separation of a
normally placed placenta with bleeding between the placenta and the uterine wall).
Usually there is both vaginal bleeding and retroplacental bleeding. Measured blood
loss is difficult because of the retroplacental clot and the women may be in shock
with hypotension and tachycardia. If proteinurea is found, then PIH may be present.
Risk factors for abruption placenta include PIH, premature rupture of membranes,
blunt abdominal trauma to mother, cigarette smoking and cocaine abuse (53). Other
causes of APH include ruptured uterus, for which previous caesarean section or
uterine surgery are predisposing factors (53).
Post-partum haemorrhage [PPH] is a referral indication from the 5 MOU’s in Soweto
to CH-B (14,15). A retrospective review study of 28 women with PPH at CH-B
hospital was done by Hassim (54), who defined PPH as blood loss of 500ml or more
after vaginal delivery (54). PPH is caused by bleeding from the uterus where the
placenta was attached or from trauma to the genital tract and perineum. Retained
16
placenta was present in 37%, previous caesarean section in 40% and uterine atony
was associated with 70% (54).
In the Chiawelo study (34), there were 836 mothers who delivered at Chiawelo clinic
from which 59 (7.1%) were referred to CH-B after delivery. These post-delivery
referrals comprised 23 for postpartum haemorrhage (39%) and 5 for retained
products of conception (8.5%). In Bangladesh (36), a retrospective study on data
from 42 214 pregnant women reported haemorrhage in 12% (N = 5 232).
1.3 Ambulance response time.
London Ambulance Service (55) defines management of an obstetric emergency as
fast, clinical assessment of the pregnant women to determine complications, provide
emergency care followed by transport to an appropriate health facility (55).
Specialised equipment and staff are required to provide appropriate care to obstetric
and neonatal patients (56). This can be vital as, if a mother starts haemorrhaging,
she may die within 2 hours without appropriate treatment (57).
In South Africa, the Department of Health (58) has introduced specialized
ambulances for obstetric emergencies. In Gauteng there were 343 ambulances, of
which 13 were obstetric ambulances (58). KwaZulu-Natal was reported as having 40
obstetric ambulances (58).
In Africa, morbidity and mortality is relatively high for emergency patients, including
both obstetric and neonatal emergencies (59). The reasons for this are multifactorial,
including transportation problems. Nkyekyer reports that a descriptive study from
17
Ghana found that 72.9% of peripartum referrals arrived at hospital without an
ambulance (60). As ambulance response time only applied to 27% of obstetric
referrals in this study, assessment of transport method is relevant in addition to
measuring ambulance response time.
The main aim of Emergency Medical Service transport is to reduce both
morbidity and mortality from medical emergencies as time is critical (61).
Anest et al (61) reviewed data from 6 months of ambulance records in Ruhiira,
Uganda. They report that of 193 calls, 137 were for obstetric emergencies. Of
the obstetric calls, 93% were transfers to access surgery or transfusion
services (61).
David et al (62) undertook a study in Mozambique from August to December 2008.
There were 27 916 live births, which included 564 women who had life-threatening
obstetric complications (near- miss). Most of these near- miss women (70.7%) were
referred from a peripheral health facility to Maputo Central Hospital, and only 29.3%
were self-referred from home. David et al (62) conducted interviews to analyse the
events with emphasis on the 3 phases of delay as described by Thaddeus and
Maine (63):
• First delay is at the community level and includes delay in deciding to seek
health care. This was associated with 360 (63.8%) of near-miss cases (62).
• Second delay includes time taken to reach an obstetric facility and is
influenced by distance, cost of transport and method of transport. This was
associated with 120 (21.3%) of near-miss cases (62).

18
• Third delay includes receiving inadequate care after arrival at the health
facility. Thus delay caused by equipment shortage, staff and the referral
system are included. This included 393 (69.7%) of near-miss cases (62).
Ambulance transport time has many sub-components including waiting time,
transport time and offload time (64). Offload delay may occur when the ambulance
crew hands the patient over to the ED staff (64). Ambulance response time is the
time elapsed between calling for an ambulance and the ambulance arrival.
Transport delay between health institutions was associated with 6.9% of maternal
deaths in the Orange Free State province (34). Afterwards, the South African
Department of Health deployed 18 ambulances for transport between facilities during
December 2011 (65).
Schoon undertook a retrospective study comparing maternal mortality for 12 months
before the deployment of 18 ambulances (65). Schoon reports a drop in deaths
associated with referral; from 67 in 2011 to 24 in 2012. Thus MMR among
transferred patients decreased from 279 in 2011 to 152 in 2012 (45%), after
ambulance deployment (65). Schoon reports that the 45 % decrease in MMR
corresponded with improvements in:
“Register dispatch interval”, time between receiving the call for an
ambulance and ambulance departure for ordering site, decreased from 32
minutes to 22.5 minutes
Ambulance dispatched within 1 hour increased from 84.2 % to 90.7 %
19
However, Pattinson (66) argues that lowering maternal deaths in the Free State was
multifactorial including strategic improvements (concentrating services in strategic
areas) and improving the training and skills of healthcare providers; in addition to 18
new ambulances (66). An additional superimposed variable that probably contributed
to the decline in deaths following the introduction of 18 ambulances, is the extensive
antiretroviral rollout with immediate access for all pregnant women (67). This is
supported by a mata-analysis that reported HIV-infected pregnant women had 8
times greater risk of death (68). This very high risk of death with pregnancy if HIV
+ve drops from 8 times to 2 times with ARV (Personal communication, Dr A and V
Black at Wits Health and Reproductive institute, February 2015).
Response time of ambulances to calls in the Western Cape was assessed by
Marcus and Clow (70). They measured ambulance response time, the time from call
to time of ambulance arrival at 5 MOU’s in the Cape Peninsula (70). The mean
response time was 106.67 minutes (N = 48). A reasonable urban response time was
considered to be within 1 hour (70).
Govender (71) measured the ambulance response time within the Ugu Health
District of KwaZulu Natal The mean response time was 101 minutes, with 64.5% of
ambulance response times being over 1 hour. However, the Department of Health
had a target of 70% of ambulance responses arriving within 1 hour (71).
In East London, Mangesi (72) interviewed women who had nearly died during
pregnancy or delivery (near-misses). Administration, long referral procedure and
inadequate transport were identified as contributing to near-misses (72). With some

20
causes of near-misses identified, the risk of repeat near-misses can be reduced if
corrective action is implemented.
In Gauteng, 5.1% of avoidable deaths were caused by transport problems between
facilities (34), and so it could be important to monitor inter-facility transport time.
Thus, ambulance response time from the 5 MOU’s in Soweto to CH-B is of
relevance. The proportion of obstetric referrals that arrived at hospital with or without
an ambulance is also of interest for DHS monitoring and planning.
21
1.4 Problem statement, Aim and Objectives of this study
To audit Mofolo MOU so that results can be compared with external studies and the
Chiawelo study (35) within the Soweto DHS conducted 15 years earlier.
Aim:
This research report compared records of deliveries at Mofolo MOU with records
from referred patients.
Objectives:
1. To calculate the referral rate from Mofolo MOU for women presenting in labour,
as an index for protocol compatibility.
2. To determine clinical indications for referrals from Mofolo MOU to Chris Hani-
Baragwanath Academic Hospital.
3. To calculate ambulance response time and transport method for the referred
group.

22
Chapter 2. METHODS
Within the DHS, data is collected, reported, analysed and interpreted for evidence-
based decision making (73). Gauteng has 36 MOU’S, one of which is located in
Mofolo (34). Within Mofolo MOU, a Maternity Admission record book of patient data
is collected on a daily basis. Data from each patient is written across two pages and
includes a sequential presentation number for that month. Additional data includes
age, parity, gravidity, outcome with referral reason if appropriate, birth weight and
ambulance response time.
At Mofolo MOU, Midwife management is based on a written protocol from the
Hospital which is the referral centre. The referral protocol (14,15), together
with ongoing training, guides midwives to triage appropriately with evidence-
based maternity care. If appropriate, an ambulance is called for transportation
of referred women to Hospital. for specialist opinion, with theatre and blood
transfusion facilities (13-15). The patient outcome of birth or transfer before or
after birth is written in the Maternity Admission book.
2.1. Study design
This is a retrospective, cross-sectional descriptive study that reviewed the record
book for patient presentations and deliveries performed at Mofolo MOU during the
first three months of 2010. The researcher accessed the Maternity Admission book
containing data from 15/10/ 2009 to 2/4/2010. Data recorded from midnight on
1/1/2010 to midnight on 31/3/2010 was accessed.

23
2.2. Site
Mofolo MOU was the study site and is situated within Mofolo CHC in Soweto.
Two professional midwives and auxillary nurses attend patients, without
doctors. The pre-labour ward has 6 beds. Labour ward has 2 beds and 2
neonatal incubators. Post-delivery ward has 8 beds. After admission or
delivery, if referral is indicated to CH-B, an ambulance is called to transport the
patient to CH-B, if required. Ambulance response time is the time between
ordering an ambulance and the ambulance reporting at Mofolo MOU
reception.
Referral rate, referral reasons and ambulance response time and transport
rate were determined. The protocol for referral from Mofolo MOU to CH-B is
(14,15) and is undergoing continuous oral and written development. The 2nd
edition was printed in 2001 (74), and updated on an ongoing basis (14,15).
2.3. Study population
The criteria of inclusion in this study consisted of all presentations of women to
Mofolo MOU during the first three months of 2010 who were examined in labour,
documented and recorded in the unit Admission Book. This included women who
were examined, found not yet to be in active labour and discharged to go home, but
only for demographic variables (age, parity, gravidity).
• Non-referred group included deliveries at Mofolo MOU without subsequent
referral.
• Referred group will include all referrals to CH-B, both before and after
delivery.

24
2.4. Data collection
Permission was obtained from both Mofolo CHC (Appendix 1), and from Gauteng
Department for Health (Appendix 2). The DHS admission book (record book), written
by staff was the source document for this study. Data from admissions and
examinations was transcribed onto 60 data sheets, with records from 14 patients
included on each page (Appendix 3). Writing data sheets and electronic data capture
into Microsoft-Excel™ was undertaken by the researcher.
Data was initially entered into two Microsoft-Excel™ spreadsheets; referred and non-
referred women. After completion, data from the referred group was transferred onto
a second pair of Microsoft-Excel™ spreadsheets on a second computer. Thus the
referred group was subdivided into referral before delivery and referral after delivery.
Ambulance response time was filled into data sheets.
2.5. Measuring tool
The Microsoft-Excel™ spreadsheets were utilized for data analysis and comparison
of the two groups. Thus, data from consultations was allocated into 2 groups. Data
was categorised into the referred and non-referred groups. The data of these two
groups was compared. Spreadsheet columns include:-
Maternal age in years,
Fundal height/ gestational age on examination,
Haemoglobin concentration (G/dl),
HIV categorical group (0 –ve, 1 +e),
Parity,
Gravidity,
25
Referral in labour,
Fetal heart rate in beats per minute prior to delivery,
Referral after delivery,
Delivery birth weight, in Kilograms,
Neonate sex, male (M) and female (F),
Referral reason, 15 categories,
Ambulance response time, in minutes.
Mofolo MOU practised the 6 BEmOC elements (page 3), not surgery or blood
transfusions. The referral rate was calculated as the proportion (%) of women who
presented in labour to Mofolo MOU that were referred. Thus women who were
examined, found not to be in labour and discharged were excluded.
The Microsoft-Excel™ statistical program was applied for data analysis. Variables
listed on spreadsheets included; age (years), parity, haemoglobin (g/dl), birth weight
(kg) and time (minutes) from ambulance called to reporting at Mofolo MOU.
Statistical analysis was expressed as mean with standard deviation. The Student’s
unpaired T-test was applied to compare groups at the 5% level of significance.
Reasons for referral were grouped by number and included:
• Delayed labour
• Pregnancy induced hypertension/eclampsia [PIH]
• Antepartum haemorrhage [APH]
• Anaemia

26
• Cephelo-pelvic disproportion [CPD]
• Fetal heart not heard [FHNH]
• Fetal distress
• Preterm
• Premature and prolonged rupture of membranes [PremROM]
• Postpartum haemorrhage [PPH]
• Retained products of conception [RPOC]
• Possible meuconium aspiration [MSL]
• Neonatal reasons (low birth weight and neonatal distress)
• Other (vaginal warts, epilepsy, asthma, diabetes, shock or blood transfusion,
condylomata and cardiac problems).
“Referral reasons”, were allocated into 15 groups, to count the leading referral
reasons, both before and after delivery. The number and names of referral reasons
were counted manually on paper for both maternal and/or neonatal referrals.
Each variable was allocated a number, for statistical processing. For presentations
that had 2 or more referral reasons, a value one of ½ or 1/3 was allocated as
appropriate, to reduce a source of bias. Results were calculated as a percentage (%)
of the total sample and frequencies. Microsoft- Excel™ statistics was applied for
mean ± standard deviation. Histograms and a Box-and-whisker diagram of birth
weight was drawn with R software. A flow chart of ambulance response time were
drawn with Microsoft Word™. The Student’s unpaired T-test was applied; at the 5%
level of significance.

27
The referral group (N=347) was then divided into two sub-groups; pre-delivery
(N=303) and post-delivery (N=44), within a separate spreadsheet on a second
computer. The proportion (%) of referrals was calculated.
After the total number of transfers was calculated, the percentage of transfers by
ambulance was counted. Ambulance response time is the time elapsed between
calling for an ambulance and the ambulance reporting arrival to the reception at
Mofolo MOU for fetching the patient for transportation to CH-B hospital. The average
ambulance response time was calculated and a histogram was constructed with R
software (www.r-project.org), with 20 minute periods. The percentage of transfers to
CH-B with either ambulance or private transport was calculated. The average
ambulance response time was also calculated for transfers taking 60 minutes or
longer.
2.6 Ethical issues
The University of the Witwatersrand Research Ethics Committee clearance certificate
was obtained on 28 January 2011, Number M110126 (Appendix 4). Revised protocol
approval was obtained from the Division of Emergency Medicine Research Assessor
Group (Appendix 5).
28
Chapter 3. RESULTS
3.1 Objective 1: Rate of referral from Mofolo MOU to CH-B
Of the 834 women presenting, there were 210 (25.1%) non-labour consultations who
were discharged after being acknowledged as their attendance was encouraged to
reduce 2nd stage delay. Four women in labour were transferred out because of staff
shortages.
Data from 620 presentations was reviewed and consisted of:
• There were 317 deliveries at Mofolo MOU (50.6% of labour presentations).
• There were 347 referred patients (347 ÷ 620 x 100) = 56%. ; 303 patients
(87.3%) were referred to CH-B before delivery, and 44 after delivery (12.7%).
• Of the 44 neonates transferred to CH-B after delivery, 21 were referred and
23 accompanied their referred mothers. The neonatal referral rate was thus:
21 ÷ 317 x 100 = 6.6%
29
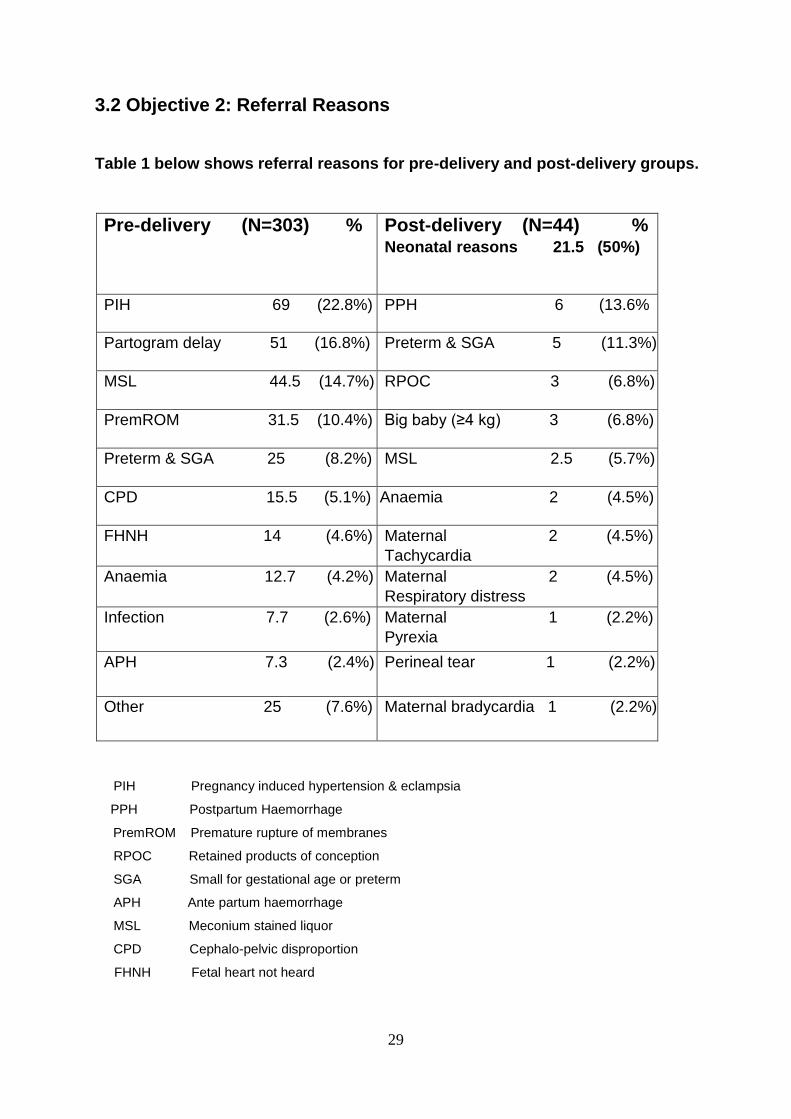
3.2 Objective 2: Referral Reasons
Table 1 below shows referral reasons for pre-delivery and post-delivery groups.
Pre-delivery (N=303) % Post-delivery (N=44) % Neonatal reasons 21.5 (50%)
PIH 69 (22.8%) PPH 6 (13.6%
Partogram delay 51 (16.8%) Preterm & SGA 5 (11.3%)
MSL 44.5 (14.7%) RPOC 3 (6.8%)
PremROM 31.5 (10.4%) Big baby (≥4 kg) 3 (6.8%)
Preterm & SGA 25 (8.2%) MSL 2.5 (5.7%)
CPD 15.5 (5.1%) Anaemia 2 (4.5%)
FHNH 14 (4.6%) Maternal 2 (4.5%)
Tachycardia
Anaemia 12.7 (4.2%) Maternal 2 (4.5%)
Respiratory distress
Infection 7.7 (2.6%) Maternal 1 (2.2%)
Pyrexia
APH 7.3 (2.4%) Perineal tear 1 (2.2%)
Other 25 (7.6%) Maternal bradycardia 1 (2.2%)
PIH Pregnancy induced hypertension & eclampsia
PPH Postpartum Haemorrhage
PremROM Premature rupture of membranes
RPOC Retained products of conception
SGA Small for gestational age or preterm
APH Ante partum haemorrhage
MSL Meconium stained liquor
CPD Cephalo-pelvic disproportion
FHNH Fetal heart not heard
30
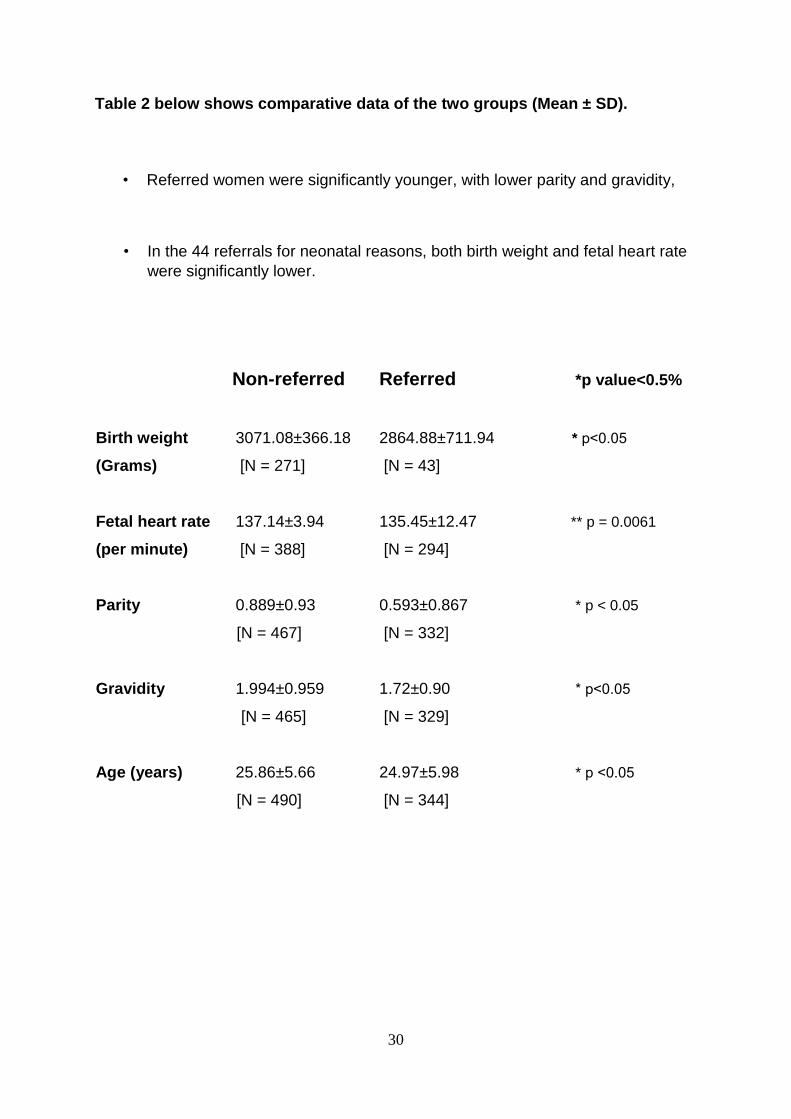
Table 2 below shows comparative data of the two groups (Mean ± SD).
• Referred women were significantly younger, with lower parity and gravidity,
• In the 44 referrals for neonatal reasons, both birth weight and fetal heart rate
were significantly lower.
Non-referred Referred *p value<0.5%
Birth weight 3071.08±366.18 2864.88±711.94 * p˂0.05
(Grams) [N = 271] [N = 43]
Fetal heart rate 137.14±3.94 135.45±12.47 ** p = 0.0061
(per minute) [N = 388] [N = 294]
Parity 0.889±0.93 0.593±0.867 * p < 0.05
[N = 467] [N = 332]
Gravidity 1.994±0.959 1.72±0.90 * p˂0.05
[N = 465] [N = 329]
Age (years) 25.86±5.66 24.97±5.98 * p ˂0.05
[N = 490] [N = 344]
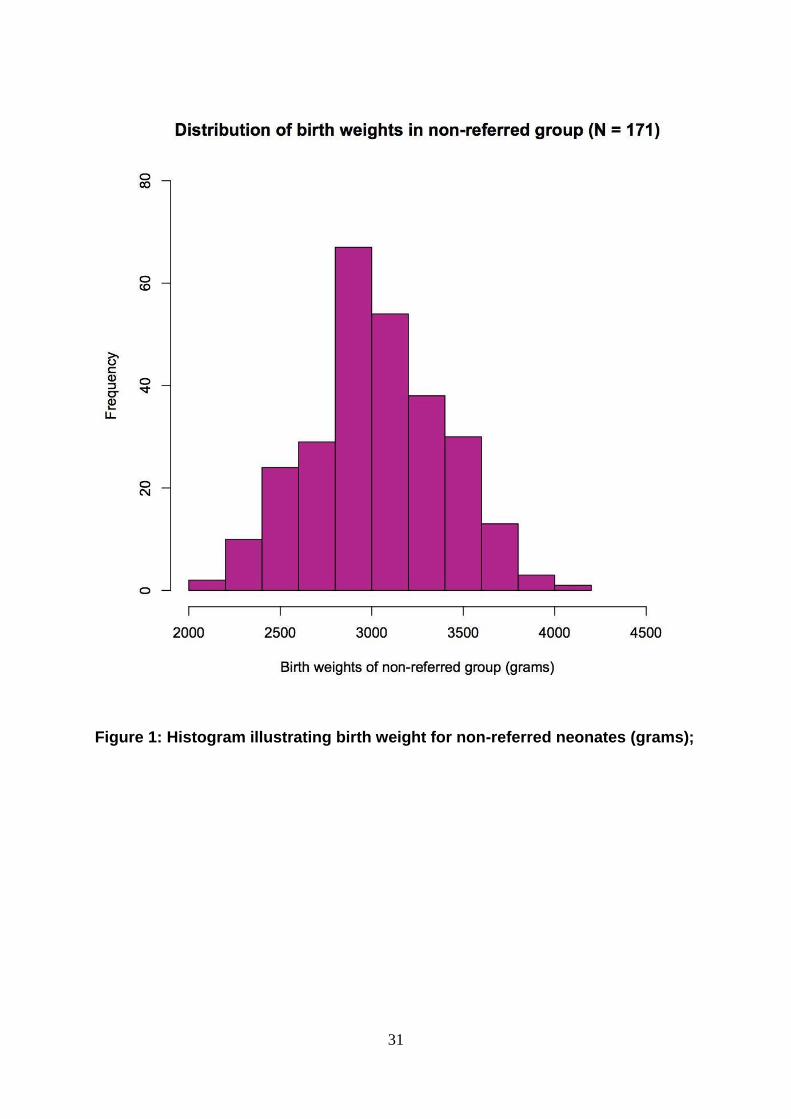
31
Figure 1: Histogram illustrating birth weight for non-referred neonates (grams);
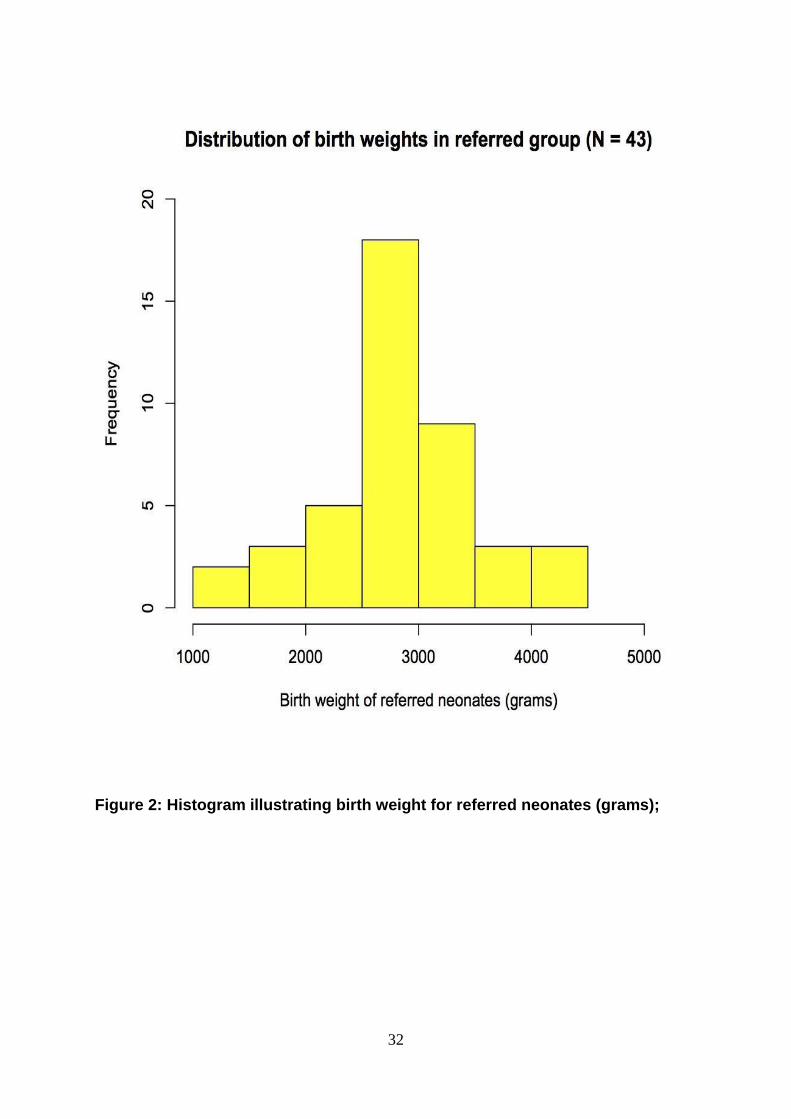
32
Figure 2: Histogram illustrating birth weight for referred neonates (grams);
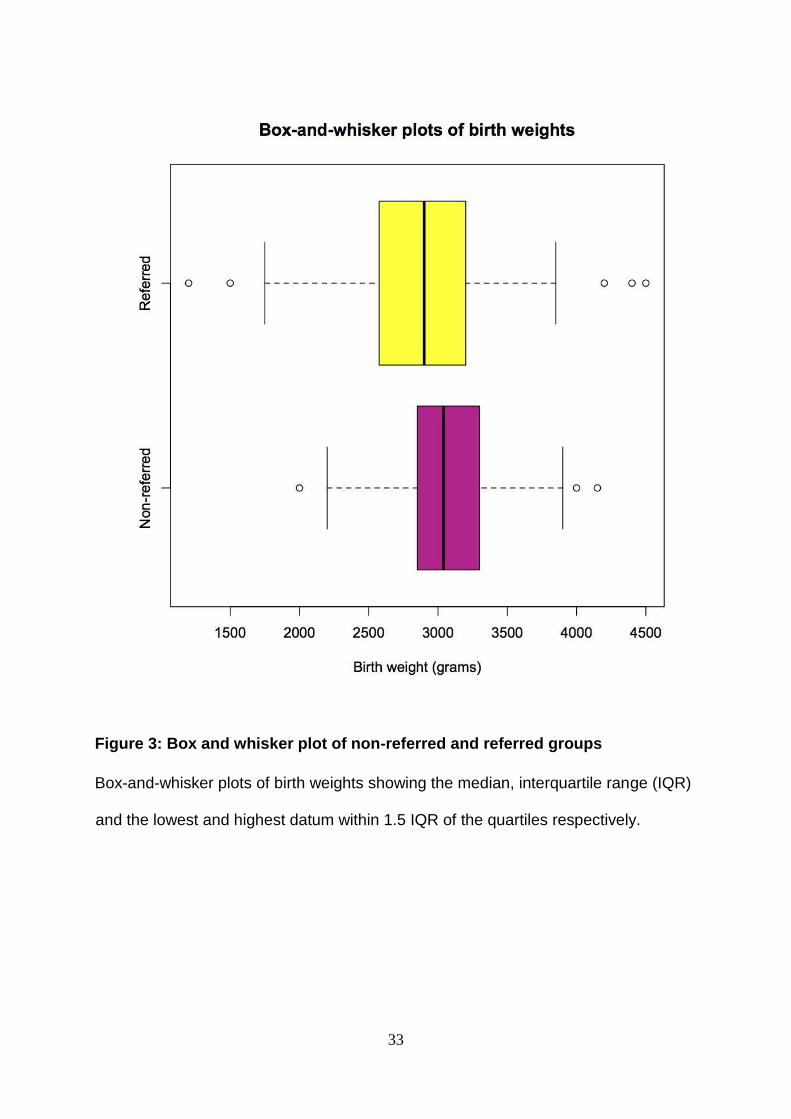
33
Figure 3: Box and whisker plot of non-referred and referred groups
Box-and-whisker plots of birth weights showing the median, interquartile range (IQR)
and the lowest and highest datum within 1.5 IQR of the quartiles respectively.

34
3.3 Objective 3: Ambulance response time for transfer
Ambulance response time results were:
The Mean ambulance response time was 48.2 minutes [N=191].
Ambulance response time was under 60 minutes for 77% of ambulance
transfers.
For the 23% of ambulance responses which took 60 minutes or longer, the
average response time was 105.4 minutes.
Ambulance response time was recorded for 55%. Mofolo MOU is one block
walk from a main road. It was reported to the researcher that many
transferred women chose private transport. Thus it appears that 45% of
patients for transfer chose private transport from Mofolo MOU to Chris Hani-
Baragwanath Academic Hospital.
Response time for 172 pre-delivery referrals was 48.74±45.3 minutes.
For the 19 post-delivery referrals with recorded ambulance response time, the
time was 44.1±22.1 minutes. This was 4 minutes shorter, suggesting an
element of triage but was not statistically significantly different from the total
ambulance response time.
35
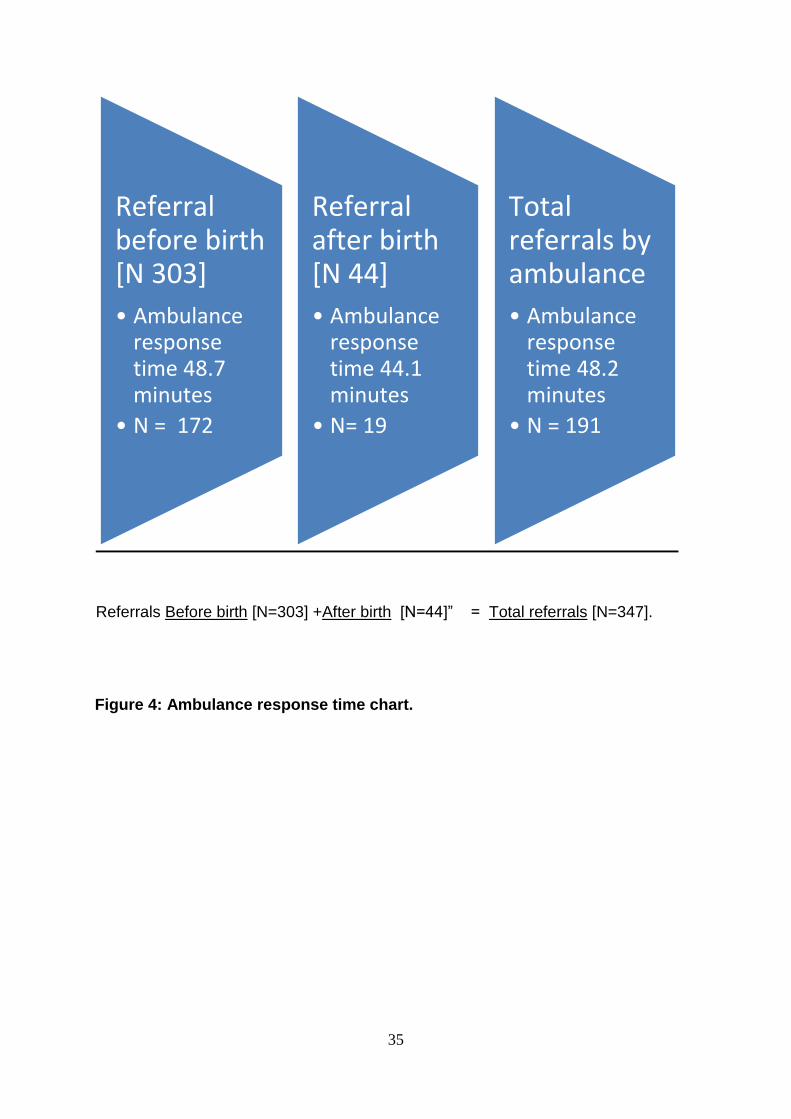
Referrals Before birth [N=303] +After birth [N=44]” = Total referrals [N=347].
Figure 4: Ambulance response time chart.
Referral before birth N [ 303]
• Ambulance response time 48.7 minutes
• N = 172
Referral after birth [ N 44]
• Ambulance response time 44.1 minutes
• N= 19
Total referrals by ambulance
• Ambulance response time 48.2 minutes
• N = 191

36
Figure 5: Histogram of ambulance response time (Call to Presentation time) for
referred group (N = 191)
37
Chapter 4. DISCUSSION
Of the 7 MOU’s in Soweto Health District, only Chiawelo MOU has been
reported on (34). As DHS integration is essential, Mofolo MOU was chosen for
this research because:
• It is representative of the 7 MOU’s in Soweto DHS,
• Mofolo MOU had not been reported on before,
• Evaluating Mofolo MOU could assist with Soweto DHS monitoring and
evaluation strategy,
• The researcher was a PEPFAR fellow with Wits Health Consortium for
1 year based at Mofolo CHC from August 2009.
4.1 Objective 1: Referral Rate.
At a MOU (basic EmONC), it is important to assess the referral rate as this impacts
on both the demand side (pregnant women), and the supply side (Referral hospital
like CH-B).
Among the 620 women who presented to Mofolo MOU in labour, there were 317
deliveries (51%). There were 347 referred women; 303 before delivery and 44 after
delivery. Thus, the referral rate was 347 ÷ 620 = 56% from Mofolo MOU.
It is of interest to compare the Mofolo MOU referral rate in 2010 with Chiawelo MOU
in 1995 as they are in the same DHS. At Chiawelo MOU (34), the total referral rate
from 1 209 labour presentations was:

38
(373 pre-delivery women + 59 post-delivery women + 274 neonates) ÷ 1209 =
58.4% referral rate.
In addition, the neonatal referral rate was 33% as 837 neonates were born in the
Chiawelo study (34) of which 274 were referred to CH-B.
Thus, the referral rates from Mofolo MOU in 2010 was similar to Chiawelo MOU in
1995, but the portion of neonates referred from Mofolo MOU was 6.5%; down from
the 33% at Chiawelo MOU.
This referral rate is higher than the study in rural Burundi by Tayler-Smith et al (29),
which suggests a district referral rate of 14.2% (31). The rural district had mountains
and 1 paved road connected to dirt roads. The distance of the 8 basic EmONC units
from the comprehensive EmONC varied from 1 to 70 km, with the furthest being a 3
hour ambulance drive one way (29).
In comparison to rural Burundi (29), Mofolo MOU is 6 km from CH-B. In addition, as
Mofolo CHC is 1 block from a main road, referred patients can choose between
ambulance or private transport. Thus, Mofolo MOU functioned as the delivery facility
for 51% of women, and as the entry level facility for 56% of referred women. Quality
PHC is delivered, and integration within DHS facilitates referral with both EMS and
private transport, on tarred roads.

39
Strand et al (30) evaluated the combined referral rate from 3 peripheral EmONC
units to hospital in Luanda, Angola. During 3 months in1996, there were 398 referrals
from 2 443 births, giving a referral rate of 16.3%. Education about partogram use
followed together with discussions about possible referral process improvements
(30). From December 1998 to February 1999, there were 429 referrals from 1 752
births; a referral rate of 24.5%. The results from the 1st study were discussed and
solutions were implemented which improved health care for obstetric emergency
referrals (30), in keeping with collaborative practice (24-27).
In India (19), deliveries within health facilities rose from 30% in 2005 to 81% in 2010.
During a 5 day study at 97 health facilities, there was a 10.7% referral rate (19). The
average referral distance from basic EmONC to complete EmONC was 47 km. With
increasing road distance and transfer time, a high referral rate like the 56% at Mofolo
requires more transport resources.
In response, Buchmann (75) reflects that WHO suggested the ideal referral rate is
15%, as studies of referral rate have reported that both maternal and perinatal
deaths reduce only up to a certain referral rate (75).
In Ethiopia, Admasu et al (31), report that the referral rate appears to be 43%, but
only 7% of deliveries were in health facilities, and only 3% in comprehensive
EmONC facilities. Thus, the referral rate should be assessed together with the
proportion of deliveries within health facilities. Within the Mofolo suberb, over 90% of
deliveries occur within health facilities (T Ndlela, personal communication).
40
Buchmann deduces that a referral rate of below 15% is sub-optimal, however stating
the optimal upper referral rate is multifactorial and more complex (75). For example,
a 100% referral rate was targeted in an Australian study (28). The policy was to fly all
deliveries from remote Northern Territory 500 km to a comprehensive EmONC unit.
Thus, if an obstetric emergency develops, the pregnant women will benefit from
better risk management. With this proactive policy, of 99 Barkly women, 93 were
flown before delivery and 6 immediately after (28).
In the1994 Chiawelo study (34), the the total referral rate from 1 209 labour
presentations at Chiawelo was: (373 pre-delivery women + 59 post-delivery women
+ 274 neonates) ÷ 1209 = 58.4%. However neonatal referral rate to CH-B (33%)
from Chiawelo clinic was 33%; 837 neonates were born, of which 274 were referred
(34). At Chiawelo, Neonatal referral reasons included 191 for MSL (70%), but at
Mofolo only 5.7% of 44 neonates were referred for MSL. Buchmann reports that after
the Chiawelo study in 1997, the high rate of neonatal referral was discussed with the
paediatric department and interventions were implemented (Buchmann; personal
oral communication 6-17 July 2015).
The referral rate at Mofolo was 56%, which is similar. As Mofolo and Chiawelo are in
the same health district (DHS), it is important to consider why total referral rate was
similar, when the referral rate for neonates was lower at Mofolo MOU (21 neonates
referred ÷ 317 deliveries) = 6.6%, excluding 23 neonates that accompanied their
mothers who were referred post-delivery. Thus the neonatal referral rate at Mofolo
MOU was 6.6% compared to 33% neonatal referral rate at Chiawelo (34), but with a

41
similar combined referral rate. What are possible causes for increased maternal
referral, and could the trend continue?
Thus, the maternal referral rate has risen from 35.7% in 1994. Why? In a review from
Discovery health, a private medical aid administrator which has 2.1 million members
in South Africa, Kula et al (77) report that a referral rate of 71% was calculated in
2011. Clinical data from over 200 000 deliveries was included during the 2005-2011
period (77).
Howarth reports that during the last 10 years in the United Kingdom, 49% of all
insurance claims paid were for obstetrics. This appears to reflect the situation in
South Africa (78). It is possible that an early referral policy may have been adopted
to avoid litigation.
The present referral rate may have decreased with:
• Additional training as well as a new National referral protocol (15)
• The drop in MMR South Africa now is observing. The National department of
Health Annual Report for 2013/14 states on page 14 that MMR was reduced
from 304 in 2009 to 269 in 2012 (69).
4.2 Objective 2: Referral Reasons.
PIH was the single biggest referral reason with 69 (19.8%) of 347 referred women
from Mofolo MOU. At Chiawelo (34), 373 women were referred to CH-B in labour, of
which 136 (36%) had PIH as the referral reason. Thus, the 19.8% of referrals from
42
Mofolo for PIH in 2010 is significantly less than the 36% of referrals with PIH
reported by Buchmann during fifteen years earlier (34).
As Buchmann was subsequently associated with district protocol development
(14,15) and training, the lower PIH referral rate observed at Mofolo in 2010 may be
from feedback within the DHS to reduce PIH referrals after the Chiawelo study (34).
Greatly reduced PIH referrals were reported by Sun et al (32), whose study included
60 445 deliveries in China. They counted 1 016 hypertensive women (1.7%) and 277
eclampsia (0.4%) patients (32). This lower proportion of PIH was also reported in
Sikder’s study (36) of 42 214 pregnant women from Bangladesh, where 328 (1%)
reported eclampsia (36). The large difference between the higher Soweto DHS
referral rate for PIH could be due to different protocol criteria for diagnosis.
In the interventional study of Strand et al (30), the proportion of referrals for PIH was
17.8% in 1996 and was reduced to 10.4% of referrals in 1998/9. This is compatible
with the proportion of PIH being reduced in the Soweto (Chiawelo-Mofolo) DHS after
interventional training with protocol modification.
A bigger proportion of eclampsia was reported in the study conducted by Litorp et al
(38) from Tanzania. They reported that eclampsia caused 42% of 467 near-misses
and 77 maternal deaths in a study of 13 121 deliveries (39). The leading clinical
signs for near-miss diagnosis were fits (35%) and shock (24%). The diagnosis was
made on arrival for 43% and after arrival for 56%. There were 180 of 222 women
(82%) with eclampsia who met the near-miss criteria on arrival (38). This suggests

43
that the clinical diagnosis of eclampsia is much more specific than that of PIH, with
raised blood pressure and proteinurea.
Pattinson (66) suggests the challenge of predicting PIH could be assisted with the
availability of uterine artery Doppler ultrasound in South African MOU units. He
confirms that definitive treatment is delivery, but implies that more accurate diagnosis
is needed (66). If available, more accurate screening could reduce referrel numbers
for PIH.
Thus, the PIH referral rate from Mofolo MOU was 19.8%, and this appears to be
midrange between 1% (32,36) to 42% (38).
Prematurity, described as decreased gestational age and/or size, was the second
highest referral reason from Mofolo MOU to CH-B. Combined prematurity referral
reasons caused 17.7% of referrals (31.5 for PremROM, 25 for Preterm and 5
underweight babies; thus 61.5 / 347 = 17.7% of referrals). As can be expected, the
neonates referred from Mofolo to CH-B were significantly lighter (P<0.05). Hund et
al (79) writes that PIH is associated with increased prematurity and greater need
for neonatal admission. Thus, the high proportion of PIH referrals from Mofolo
could increase the proportion of prematurity, as combined prematurity was the 2nd
highest referral reason.
The risk of infection rises with premature/preterm rupture of membranes (Prem
ROM) and increases with time (71). In this study PremROM accounted for 31.5
referrals (10.4%) from Mofolo MOU to CH-B and infection was the referral reason for
44
7.7 women (2.3%). Thus, of the 624 women in the Mofolo study, 5% had PremROM
and infection was frequently a joint referral reason. Tayler-Smith et al (29), reported
rupture of membranes for over 12 hours in 116 of 406 referrals (28%). This rate of
PremROM with infection is compatible with the report of Faksh et al (80), who writes
that 30-40% of preterm births occur after PremROM (80).
Anaemia was the referral reason for 15.7 women (4.5%). Like PIH and infection,
anaemia also predisposes to both prematurity (16) and maternal death (16). Basu et
al (16) extracted data on all anaemic women who delivered during May 2010 at
Charlotte Maxeke Johannesburg Academic Hospital. There were 689 deliveries, from
which 26 women were transfused (4%). ANC records were examined and 18 of the
26 women (86%) had anaemia at the 1st ANC visit (Haemaglobin ˂11 gm/dl). Basu
et al (16) state anaemia screening twice during ANC with iron supplementation is
important.
As blood transfusions are not given at Mofolo MOU, women requiring a blood
transfusion are referred to CH-B according to referral protocol. At Mofolo MOU, 4.2%
of women were referred for anaemia pre-delivery and 4.5% of post-delivery women
were referred for anaemia
In a study of 5 997 births, Fouelifack et al (81) found that adolescent births were
9.3% but were associated with 29.3% of preterm deliveries. Maternal age data is
available at Mofolo MOU, and the determination of adolescent births could be
determined in a following study, linked with lowering the prematurity rate (81).
45
Similarly, the preterm rate was higher in the Australian study by Schultz et al (28), as
16% of deliveries were preterm and 21% had low birth weight. The proportion of
mothers under 20 years was 29%. This study (28) and the Mofolo study, both have
high preterm rates.
DeFranco et al (82) report that women who get pregnant within 18 months of giving
birth have a higher risk for a preterm birth. The effect of birth intervals on preterm
delivery is of interest where PremROM is high, like Mofolo. This could also be
assessed, but within a prospective study, as this data is not in the record book at
present (82).
Partogram delay in labour was the third highest referral reason from Mofolo, and
was the referral reason for 51 women (14.7%). This is lower than the Chiawelo study
(34), where 70 of 374 (18.7%) women were referred for partogram reasons.
Tayler-Smith (31) reported that 216 women with prolonged labour over 24 hours
(15%) included in 1 406 referrals. These 3 studies have similar referral proportions
for partogram delay.
Furthermore, an additional 15.5 women (4.5%) were referred from Mofolo MOU to
CH-B for CPD. Similarly, 95 Women (4.7% of all deliveries) were referred from
Chiawelo for CPD (34). The combined partogram and CPD referral proportion of
19.2% from Mofolo is close to the 18.7% from Chiawelo (34).

46
Strand et al (30) conducted an interventions study within Angola during 1996. Data
from 157 women who were referred from 3 MOU’s was reviewed. The distance to
hospital was between 2 and 6 kilometers away and maternal mortality was 17.8%.
After partogram education and additional changes at both MOU’s and Hospital, data
from 92 referrals was compared with the earlier study. Maternal mortality was 0 in
the secoud study, and was associated with a significant improvement in partogram
quality and decreased waiting time. Of referred women, 28.7% were referred for
prolonged labour in 1996 and 29,2% in 1998/9 after intervention. As partogram delay
caused 16.8% of referrals from Mofolo MOU, the referral rate for partogram delay
appears 84% lower (30). Less referrals for CPD earlier, could account for this larger
proportion.
Pattinson (66) states that assisted deliveries in the United Kingdom are 13% of
lowrisk deliveries whereas the South African assisted delivery rate is under 1%.
Consequently, the skills for assisted delivery are not as well developed in South
Africa and this opportunity could be developed (66).
From a meta-analysis of 15 studies, Blix et al (44) report that the proportion of
emergency transfers to hospital from home births varies from 0% to 5.4% (44).
Pattinson states that a low figure suggests good screening for low risk births together
with assisted delivery skills (66).
Haemorrhage was the referral reason for 13.3 of 347 referrals (3.8%) from Mofolo.
Of 303 pre-delivery referrals, there were 7.7 APH referrals and of 43 post-delivery
referrals, 6 were for PPH. The Chiawelo study (34) had a much higher rate of PPH
as this was the indication for 23 of 59 (39%) of all post- delivery referrals.
47
Basu et al (16) report that the indications for blood transfusion for 26 women during
May 2010 included 21 for PPH (80%) due to atonic uterus and 2 for retained
products of conception [RPOC], being 4%. At Mofolo, 6 of 347 referrals were for
PPH (1.7%) and 3 were for RPOC (0.86%).
In the same study, Basu (16) reported 2 women had vaginal lacerations (8%) as the
cause of haemorrhage, and 1 had abruption placenta (4%). Packed red cells were
transfused for 24 women (92%), 1 received packed red cells and platelets (4%) and
1 received packed red cells, platelets and fresh frozen plasma (16). For 20 of 26
women the number of units was written, and was 2 units on average (16). Basu et al
(19) report that multiparity and late ANC booking were associated with haemorrhage.
HIV status was documented for 24 women, and 13 were positive (54%).
In this study at Mofolo, infection was counted only as the referral reason for 7.7
women (2.2%), which may be underestimated because infection causes 44% of
maternal deaths in South Africa (35).
4.3 Objective 3: Ambulance response time.
For the 191 referred women (55%) who went by ambulance to CH-B, the
average ambulance response time was 48.7 minutes. Mofolo DHS is urban and
can be compared with the Cape Peninsula (70). Urban response time of
ambulances to calls was assessed by Marcus and Clow (70). They measured
ambulance response time; the time from call to time of ambulance arrival, at

48
5 MOU’s in the Cape Peninsula (70). The mean response time was 106.67
minutes (N = 48).
Govender measured the ambulance response time within the rural Ugu Health
District of KwaZulu Natal (71). The mean response time was 101 minutes, with
64.5% of ambulance response times being over 1 hour. However, the Department of
Health had a target of 70% of ambulance responses arriving within 1 hour (71).
However, a reasonable urban response time in South Africa was considered to be
within 1 hour (70). A response time of 2 hours is suggested as adequate (57) for
obstetric emergency referrals within a first –world urban setting.
Chaturvedi et al (19) write that two hour travel time is the acceptable standard for
transfer time to EmONC. During a 5 day study on travel time for inter-facility referrals
in rural India, 1 182 pregnant women presented at 96 health facilities. Women
arriving directly from home numbered 1 071 (90.1%) and 111 (9.4%) were referred.
The average inter-facility travel time was 1.25 hours. Obstructed labour was the most
frequent referral reason (40%), with “Time to Death” of 12 hours without adequate
treatment compared to 2 hours for haemorrhage (19). A 2 year maternal death
review found that the average time of death was 6.75 hours after arrival (19).
Pembe at al (83) applied the 3 stage delay model of Thaddeus and Maine (63) to
analyse 155 maternal deaths in Tanzania. Stage 1 delay (before MOU or hospital
arrival) of pregnant women seeking care was most frequent (73.3%). Stage 3 delay
in receiving treatment was rated was 18.3% (83).
49
Strand et al (30) reported on an interventional study in Angola on referrals from
peripheral obstetric units to 2 hospitals in Luanda. Data from 157 obstetric
emergency referrals was studied. The average transport time from the MOU’ was 54
minutes (stage 2), but the waiting time (stage 3) from admission in the referral
hospital until first doctor examination was 13.7 hours. After interventional
improvements in hospital admission and partogram education, data from 92
admissions was compared. Waiting time was reduced from 13.7 hours to 1.2 hours
(30).
Kaye et al (84) conducted a prospective study on referrals to Mulago
Hospital in Kampala. Within 983 referrals there were 104 near-misses and 17
maternal deaths. They found stage 1 delay important as personal, family and
community problems led to stage 1 delay in 23% of near-misses and 43% of
maternal deaths (84).
At Mofolo, the ambulance response time is one component of stage 2 delay, another
being Ambulance transport time. In addition to stage 2 delay, stage 1 and stage 3
delay are also very important.
Pacagnella et al (85) undertook a study at 27 referral obstetric facilities in Brazil.
During 2009, the research team screened of 82 144 births in a prospective trial.
Potentially life-threatening conditions were present in 9 555 deliveries (11.6%) and
delay occurred in 52% of these deliveries, but delay in transfer occurred in 3.3%.
There were 140 maternal deaths (0.17%) and delay was found to occur in 84%, but
50
transfer delay occurred in 26.4% of these deaths. Pacagnella et al found an increase
in delay was associated with a more severe outcome (85).
Pattinson (66) suggests that the decrease in maternal deaths after the addition of 18
ambulances (68) was multifactorial In this study at Mofolo MOU, 214 women who
presented were assessed as not being in labour and discharged. Encouraging early
screening can be expected to lower stage 1and 2 delay for participating women.
Reducing stage 1 and 2 delay was possibly a factor in the Free State.
Furthermore the ARV rollout at that time was also associated with lowering maternal
mortality. This is supported by a mata-analysis that reported HIV-infected pregnant
women had 8 times greater risk of death (68). As South Africa has 300 000 pregnant
HIV +ve women annually (86), ARV treatment is vital to prevent rising MMR (87).
Within the Soweto DHS, PHC facilities are planned as the entrance level to
DHS, through the referral process with EMS if indicated by protocol (6-8). At
Mofolo MOU the ambulance response time was within the desired 70%
response rate within 1 hour. In addition, private transport assisted with linking
Mofolo MOU to CH-B. Thus within the Soweto DHS (4), the 5 MOU’s are
integrated; with a referral process to CH-B.
51
Chapter 5. CONCLUSION
Objective 1: The total referral rate (56%) appears comparable to that of the Chiawelo
study (58.4%), which is part of the same DHS (34). However, as the referral rate for
neonates has dropped to 6.6% at Mofolo MOU from 33% at Chiawelo, the apparent
referral rate for women has increased at Mofolo MOU. Objective 2: The maternal
referral reasons appears compatible with protocol and the literature review.
Objective 3: Ambulance response time appears fast in comparison to other studies
and integrates Mofolo MOU within the District Health Service. Staff within Mofolo
MOU feel this is appropriate as alternative transport is usually faster. Follow-up
reports from CH-B would assist in answering this question. The proportion of referrals
that did not travel by ambulance was 45%.
Limitations: The number of ANC visits attended was not written in the record.
Outcomes from CH-B could be helpful for triage and treatment. Feedback from CH-B
on referrals was not documented in the record book, including no feedback from CH-
B was obtained about the arrival rate among the 45% of referred women who
undertook to go with private transport. Post-delivery referral reasons are not all
included newly diagnosed HIV and born before arrival, not all of which were referred.
Some scored ½ or 1/3.
Recommendation: A follow-up study measuring the referral rate and ambulance
transport form is suggested, as 45% of transferred patients appeared not to have been
transported by ambulance.

52
Chapter 6. REFERENCES
1. South African Department of Health. Reducing maternal and child mortality
through strengthening primary healthcare [pamphlet]. Johannesburg:
PRICELESS SA, University of the Witwatersrand; 2014, 2015.
2. Chang J, Elam-Evans LD, Berg CJ, et al. Pregnancy-related mortality
surveillance—United States, 1991—1999. MMWR Surveill Summ, 2003 Feb
21;52(2):1-8.
3. Igberase GO, Ebeigbe PN. Maternal mortality in a rural referral hospital in the
Niger Delta, Nigeria. J Obstet Gynaecol. 2007 Apr;27(3):275-8.
4. South African Department of Health. Strategic Plan 2014/15 -2018/19 [cited
2014 Oct 25]; ISBN: 978-0-621-4247-4. Available from: http://www.health-
e.org.za/wpcontent/uploads/2014/08/SA-DoH-Strategic-Plan-2014-to-2019.pdf
5. Maternal and Child Health. The National Department of Health [Internet].
[cited 2014 Oct 6]; Available from: http://www.health.gov.za/mch.php
6. South African Department of Health. South Africa’s National Strategic Plan
for a Campaign on Accelerated Reduction of Maternal and Child
Mortal in Africa (CARMMA). Pretoria, 2012.
7. South Africa National Department of Health (2011) Health Data Advisory and
Coordination Committee Report. Strategic Plan for Maternal, Newborn, Child and
Women’s Health (MNCWH) and Nutrition in South Africa 2012-2016.
Pretoria.
8. Salam RA, Lassi ZS, Das JK, et al. Evidence from district level inputs to improve
quality of care for maternal and newborn health: interventions and findings.
Reprod Health. 2014 Sep 4;11 Suppl 2:S3.
53
9. Afari H, Hirschhorn LR, Michaelis A, et al. Quality improvement in emergency
obstetric referrals: qualitative study of provider perspectives in Assin North
district, Ghana. BMJ Open 2014 May 15;4(5):e005052.
10. Mashishi MM. Assessment of referrals to a district hospital maternity unit in South
Africa. [Thesis]. University of the Witwatersrand; 2014 Feb 5
[cited 2014 Sept 27]. University of the Witwatersrand Library E-Reserve.
Available from: http://hdl.handle.net10539/13656
11. Das JK, Kumar R, Salam RA, et al. Evidence from facility level inputs to improve
quality of care for maternal and newborn health: interventions and findings.
Reprod Health. 2014 Sep 4;11 Suppl 2:S4.
12. Dumont A, Fournier P, Abrahamowicz M, et al. Quality of care, risk management,
and technology in obstetrics to reduce hospital-based maternal mortality in
Senegal and Mali (QUARITE): a cluster-randomised trial. Lancet. 2013 Jul 13;
382(9887):146-157.
13. Dogba M, Fournier P. Human resources and the quality of emergency obstetric
care in developing countries: a systematic review of the literature. Hum Resour
Health. 2009 Feb 6;7:7.
14. Buchmann E, Sithole J, editors. Primary Maternity Care; A manual for clinics and
community health centres. Chris Hani Baragwanath Hospital and District Health
Services. Johannesburg; 2011. P. 1-57.
15. Buchmann E, Van der Walt R et al. Guidelines for Maternity Care in South Africa.
Pretoria (South Africa): Department of Health; fourth edition 2015. Report ISBN
No.:978-0-620-66530-8
16.Basu JK, Hartford L, Nzama N, et al. The use of blood transfusions in the
obstetric unit of an academic hospital in South Africa. South Afr J Epidemol
Infect. 2012; 27(1):34-36.
54
17. Hogan MC, Foreman KJ, Naghavi M, et al. Maternal mortality for 181 countries,
1980–2008: a systematic analysis of progress towards Millennium Development
Goal 5. Lancet. 2010 May 8;375(9726):16091623.
18. Dlakavu WF. Self- referral of women in labour at Chris Hani Baragwanath
Hospital after the introduction of a triage down referral system [thesis].
University of the Witwatersrand; 2013 Jan 25 [cited 2014 Sept 27].
University of the Witwatersrand Library E-Reserve. Available from:
http://hdl.handle.net/10539/12297
19. Chaturvedi S, Randive B, Diwan V, et al. Quality of obstetric referral services in
India’s JSY cash transfer programme for institutional births: a study from
Madhya Pradesh province. PloS One. 2014 May 8;9(5):e96773.
20. Mirkuzie AH, Sisay MM, Reta AT, et al. Current evidence on basic emergency
obstetric and newborn care services in Addis Ababa, Ethiopia: a cross sectional
study. BMC Pregnancy Childbirth. 2014 Oct 10;14:354.
21. Calvello E, Reynolds T, Hirshon JM, et al. Emergency care in sub-Saharan
Africa: Results of a consensus conference. Afr J Emerg Med. 2013;3(1),42-48.
22. Reynolds TA, Wallis LA. Addressing African acute care needs through
consensus-building. Afr J Emerg Med. 2013;3(1):1-2.
23. Emergency Nurses Society of South Africa. Definition of emergency nurse and
emergency nursing. Practice Guideline EN001. 2010; 1-3.
24.Terry BM. Emergency nurses- A resource-tired approach. Afr J Emerg Med.
2014;4(1):6-7.
25. DiFazio RL, Vessey J. Advanced practice registered nurses: Addressing
emerging needs in emergency care. Afr J Emerg Med. 2014;4(1):43-49.
26. Waldman RN, Kennedy HP. Collaborative practice between Obstetricians and

55
Midwives. Obstet Gynecol. 2011 Sept;118(3):503-504.
27. Dejoy S, Burkman RT, Graves BW, et al. Making it work: Successful
Collaborative Practice. Obstet Gynecol. 2011 Sep;118(3):683-686.
28. Schultz R, Lockey R, Oats JJ. Birthing in Barkly: births to Barkly women in 2010.
Rural Remote Health. 2013 Sep 19;13(3):2396.
29. Tayler-Smith K, Zachariah R, Manzi M, et al. An ambulance referral network
improves access to emergency obstetric and neonatal care in a district of rural
Burundi with high maternal mortality. Trop Med Int Health. 2013 Aug;18(8):993-
1001.
30. Strand RT, de Campos PA, Paulsson G, et al. Audit of referral of obstetric
emergencies in Angola: a tool for assessing quality of care. Afr J Reprod Health.
2009 Jun;13(2):75-85.
31. Admasu K, Haile-Mariam A, Baily P. Indicators for availability, utilization and
quality of emergency obstetric care in Ethiopia, 2008. Int J Gynaecol Obstet.
2011 Oct;115(1):101-105.
32. Sun L, Yue H, Sun B, et al. Estimation of high risk pregnancy contributing to
perinatal morbidity and mortality from a birth population-based regional survey in
2010 in China. BMC Pregnancy Childbirth. 2014 Sep 30;14:338.
33.Iyengar K, Iyengar SD. Emergency obstetric care and referral: experience of two
midwife-led health centres in rural Rajasthan, India. Reprod Health Matters. 2009
May:17(33):9-20.
34. Buchmann EJ. Perinatal health in the Chiawelo district of Soweto; health
services, patient referral and clinical management. CHASA J Compreh Health.
1997; 8(1):31-35.
35. South African Department of Health. National Committee for Confidential Enquiry
into Maternal Deaths. Saving Mothers 2008-2010: Fifth report on the Confidential
56
Enquiries into Maternal Deaths in South Africa. [cited 2012 Dec]. Available from:
http://www.doh.gov.za/docs/reports/2012/Report_on_Confidential_Enquiries_into
_Maternal _Deaths_in_South_Africa.pdf
36. Sikder SS, Labrique AB, Shamim AA, et al. Risk factors for reported obstetric
complications and near misses in rural northwest Bangladesh: analysis from a
prospective cohort study. BMC Pregnancy Childbirth. 2014 Oct 4;14:347.
37. Moodley J. Hypertensive disorders of pregnancy. In: Cronje HS, Cilliers JBF,
Pretorius MS, editors. Clinical obstetrics; a South African perspective. 3rd ed. Van
Schaik publishers: 2012. Chapter 57; p.536-553.
38. Litorp H, Kidanto HL, Rőőst M, et al. Maternal near-miss and death and their
association with caesarean section complications: a cross-sectional study at a
university hospital and a regional hospital in Tanzania. BMC Pregnancy
Childbirth. 2014, 14:244.
39. Abraham W, Berhan Y. Predictors of labour abnormalities in university hospital:
unmatched case control study. BMC Pregnancy Childbirth . 2014 Aug 3;14:256
40. Gifford DS, Morton SC, Fiske M, et al. Lack of progress in labour as a reason for
caesarean. Obstet Gynaecol 2000 Apr;95(4):589-595.
41.Maghoma J, Buchmann EJ. Maternal and fetal risks associated with prolonged
latent phases of labour. J Obstet Gynaecol. 2002 Jan;22(1):16-19.
42. Olierhead E, Osrin D. Barriers to and incentives for achieving partograph use in
obstetric practice in low- and middle-income countries: a systematic review. BMC
Pregnancy & Childbirth 2014 Aug 16;14:281.
43. Groppi L, Somigliana E, Pisani V, et al. A hospital-centered approach to improve
emergency obstetric care in South Sudan. Int J Gynaecol Obstet. 2014 Sep 19.
Pii: S0020-7292(14)00468-8.
57
44. Blix E, Kumle M, Kjaergaard H, et al. Transfer to hospital in planned home births:
a systematic review. BMC Pregnancy Childbirth. 2014 May 29, 14:179.
45. Buchmann EJ. Breech presentation. In: Cronje HS, Cilliers JBF, Pretorius MS,
editors. Clinical obstetrics; a South African perspective. 3rd ed. Van Schaik
publishers: 2012. Chapter 42; p.364-374.
46. Spong CY. Prediction and prevention of recurrent preterm birth. Obstet Gynecol.
2007 Aug;110(2 Pt 1):405-415.
47. Lloyd LG, de Witt TW. Neonatal mortality in South Africa: How are we doing and
can we do better? S Afr Med J. 2013 Aug;103(8):518-9.
48. Steyn DW. Inadequate fundal growth. In: Cronje HS, Cilliers JBF, Pretorius MS,
editors. Clinical obstetrics; a South African perspective. 3rd ed. Van Schaik
publishers: 2012. Chapter 19; p.157-165.
49. Theron GB. Pre-term rupture of membranes. In: Cronje HS, Cilliers JBF, Pretorius
MS, editors. Clinical obstetrics: a South African perspective. Pretoria: Van Schaik,
2012: Chapter 24; p.204-210.
50. Webb DA, Mathew L, Culhane JF. Lessons learned from the Philadelphia
Collaborative Preterm Prevention Project: the prevalence of risk factors and
program participation rates among women in the intervention group. BMC
Pregnancy Childbirth. 2014 Nov 1;14(1):368.
51. Tudela CM, Stewart RD, Roberts SW, et al. Intrapartum Evidence of Early-Onset
Group B Streptococcus. Obstet Gynecol. 2012 Mar;119(3):626-629.
52. Briggs ND. Maternal death in the booked and unbooked patients: University of
Port Harcourt Teaching Hospital experience. Trop J Obstet Gynaecol. 1988;
1(1):26-29.
58
53. Buchmann EJ. Antipartum haemorrhage. In: Cronje HS, Cilliers JBF, Pretorius
MS, editors. Clinical obstetrics; a South African perspective. 3rd ed. Van Schaik
publishers: 2012. Chapter 25; p.211-218.
54. Hassim T. Profiles and outcomes of women undergoing hysterectomy for primary
postpartum haemorrhage at Chris Hani Baragwanath Hospital. MScMed (O&G)
report 2013, Wits. Available from:
http://wiredspace.wits.ac.za/handle/10539/12720
55. Obstetric Care Policy -London Ambulance Service (UK); 2014 Feb 3; p 4.
Available from: www.londonambulance.nhls.uk/talking_with.../idoc.ashx?...
56. Policy on obstetric/neonatal ambulance utilization. KwaZulu-Natal department
Memorandum 22 October 2012. Available from:
healthweb.kznhealth.gov.za/emrs/obstetric_neonatal_ambulance
57. Averting Maternal Death and Disability. Referral systems for emergency obstetric
and newborn care. Columbia University, Mailman School of Public Health. [cited
2015 19 Jan]; Available from:
http://www.amddprogram.org/content/referralsystems
58. Fokazi S. Obstetric vehicles. Department denies ambulance shortage. Health
writer, the Argus. 17 June 2013:8.
59. Mould-Millman CN, Rominski S, Oteng R. Ambulance or Taxi? High acuity
prehospital transports in the Ashanti region of Ghana. Afr J Emerg Med. 2014
March;4(1):8-13.
60. Nkyekyer K. Peripartum referrals to Korle Bu teaching hospital, Ghana-a
descriptive study. Trop Med Int Health. 2000 Nov;5(11):811-817.
61. Anest T, Millin M, Carle S, et al. Obstetric emergencies: Re-thinking EMS in rural
Africa. Afr J Emerg Med. 2012 Dec;2(4):165.
59
62. David E, Machungo F, Zanconato G, et al. Maternal near miss and maternal
deaths in Mozambique: a cross-sectional, region-wide study of 635 consecutive
cases assisted in health facilities of Maputo province. BMC Pregnancy Childbirth.
2014 Dec 10;14:401.
63. Thaddeus S, Maine D. Too far to walk: maternal mortality in context. Soc Sci
Med. 1994;38(8):1091—1110.
64. Carter AJE, Overton J, Terashima M, et al. Can Emergency Medical Services
Use Turnaround Time as a Proxy for Measuring Ambulance Offload Time? J Em
Med. 2014 Jul;47(1):30-35.
65. Schoon MG. Impact of inter-facility transport on maternal mortality in the Free
State Province. S Afr Med J. 2013 August;103(8):534-537.
66. Pattinson RC. Reducing direct causes of maternal death. S Afr J OG.
2013;19(3):59-60.
67. Burton R. Maternal health: There is cause for optimism. S Afr Med J. 2013 July;
103(8):520-521.
68. Calvert C, Ronsmans C. The contribution of HIV to pregnancy-related mortality: a
systematic review and meta-analysis. AIDS. 2013 Jun 19;27(10):1631-1639.
69.Department of Health/ Annual Report 2013-2014: page 14 [cited 2014 Dec 7].
RP:170/2014, ISBN:978-0-621-42831-5 Available from: http://www.health-
e.org.za/wp-content/uploads/2014/11/National-Department-of Health-Annual-
Report-2013-14.pdf
70. Marcus JK, Clow SE. Response times of ambulances to calls from Midwife
Obstetric Units of the Peninsula Maternal and Neonatal Service (PMNS) in Cape
Town, Curationis. 2009 March;32(1):59-66.
71. Govender S. Emergency transport of obstetric patients within the Ugo Health
60
District [dissertation]. Durban University of Technology. 2011 [cited 2012 Dec 22].
Available from: http://ir.dut.ac.za/handle.net/10321/688
72. Mangesi L. Near-misses in maternal health services in South Africa:
patients’ perspectives from East London Hospital complex and referral
areas [thesis]. University of the Witwatersrand. 2013 Mar 19 [cited 2014
Sept 27]. University of the Witwatersrand Library E-Reserve. Available
from: http://hdl.handle.net/10539/12566
73. South African Department of Health. District Health Management Information
System (DHMIS). Standard Operating Procedures: National
Level. Pretoria: 2013 December.
74. Buchmann E, Thembekile N, Moabelo E. Primary care midwifery – Practical
guidelines for nurses at clinics and midwife obstetric units. 2nd ed. Johannesburg:
Chris Hani Baragwanath Hospital; 2001. P 1-47.
75. Buchman EJ. What proportion of births should be vaginal? Proceedings of 35th
SASOG Congress; 2012 May 6-10; Champagne Sports Resort, Drakensberg,
KZN. Abstract in: S Afr J OG. 2012 April;18(2):78.
76. Levin G, van Bogaert DK, Ndlela t et al. Retrospective review of indications for
emergency obstetric referrals from Mofolo community health centre to CH
Baragwanath Hospital. Proceedings of 35th SASOG Congress; 2012 May 6-10;
Champagne Sports Resort, Drakensberg, KZN. Abstract in: S Afr J OG. 2012
April;18(2):77.
77.Kula D, Naidoo S, Ruff B, et al. Can medical schemes afford a caesarean section
rate of over 60 %? Proceedings of 35th SASOG Congress; 2012 May 6-10;
Champagne Sports Resort, Drakensberg, KZN. Abstract in: S Afr J OG. 2012
April;18(2):78.

61
78. Bateman C. Litigation benefits state-delivered medicine-but for how long? SAMJ.
2015 Jan;105(1):13-14.
79. Hund M, Allegranza D, Schoedi, et al. Multicenter prospective clinical study to
evaluate the prediction of short-term outcome in pregnant women with suspected
preeclampsia (PROGNOSIS): study protocol. BMC Pregnancy Childbirth. 2014,
14:324.
80. Faksh A, Wax JR, Lucas, et al. Preterm premature rupture of membranes ≥32
weeks gestation: impact of revised practice guidelines. Am J Obstet Gynecol.
2011 Oct;205:340.e1-e5.
81. Fouelifack FY, Tameh TY, Mbong EN, et al. Outcomes of deliveries among
adolescent girls at the Yaounde central hospital. BMC Pregnancy Childbirth.
2014 Mar 17;14:102.
82. DeFranco EA, Ehrlich S, Muglia LJ. Influence of interpregnancy interval on birth
timing. BJOG. 2014 Dec;121(13):1633-1640.
83.Pembe AB, Paulo C, D’mello BS, et al. Maternal mortality at Muhimbili national
hospital in Dar-es-Salaam, Tanzania in the year 2011. BMC Pregnancy
Childbirth. 2014 Sep 13;14:320.
84. Kaye D, Mirembe F, Aziga F, et al. Maternal mortality and associated nearmisses
among emergency intrapartum obstetric referrals in Mulago Hospital,
Kampala, Uganda. East Afr Med J. 2003 March;80(3)144-149.
85. Pacagnella RC, Cecatti JG, Parpinelli MA, et al. Delays in receiving obstetric care
and poor maternal outcomes: results from a national multicentre cross-sectional
study. BMC Pregnancy Childbirth. 2014 May 5;14:159.

62
86. Buchmann E. HIV in pregnancy [unpublished lecture notes].
Essential Steps in Managing Obstetric Emergencies
(ESMOE), Wits Reproductive Health Institute; lecture given 2014 June 26.
ESMOE course, 26/6/2014.
87. Aniji CD, Towobola OA, et al. Impact of antiretroviral therapy on pregnancy
outcomes. S Afr J HIV Med 2013; 14(4):176-178.

63
7. APPENDICIES
Appendix 1: Approval for study within Mofolo CHC

64
Appendix 2: Gauteng Department of Health approval

65
Appendix 3: Data sheet
[page 61 for February 2010]
Date,
Time Fundus Height (week)
Fetal H Rate (BPM)
Age (yrs)
Hb g/dl
Parity RPR 0,1+
baby
m/f
weight
DART 0-,1+
Meds 0,1,2 0/pills/S
Clin Delive N1,Y2,H3 LN4
Neonate Ref B N 1,Y2
Mater Ref B N1,Y2
Ref Reason 1-22
Ambul Δ time
253
254
255
256
257
258
259
260
261
262
263
264
265
266

66
Appendix 4: Ethics Clearance Certificate

67
Appendix 5: Protocol approval

68