return predictability through board links predictability through board links aaron burt and...
TRANSCRIPT
Return Predictability Through Board Links∗
Aaron Burt and Christopher Hrdlicka†
September 19, 2016
ABSTRACT
We find that investors fail to immediately account for information in past prices among firmswith interconnected boards: a long-short portfolio, formed based on these links, yields anannual alpha of 6.5%. This predictability is limited to the period of the board link andnot driven by industry or previously identifed links. Investor inattention plays a key role:the predictability is concentrated among the largest firms, the long-end and in semi-private,hand-collected data on board links. Insider trading is a key mechanism: filtering on thetrades of the linked director yields an annual alpha of 15%.
∗We are grateful to seminar participants at the University of Washington and the 2015 WFA meetingsfor helpful comments and suggestions. All errors are our own.†All authors are at the Michael G. Foster School of Business, University of Washington, PACCAR Hall,
Box 353226, Seattle, WA 98195-3226, USA. Corresponding author: Christopher Hrdlicka, Phone: 206-616-0332, Email: [email protected], Web: http://faculty.washington.edu/hrdlicka/

Boards of directors influence firms both by exercising control rights and providing valuable
information and advice to managers.1 Directors often sit on multiple boards, creating links
among firms. Shared directors provide a common influence and channel for information
diffusion across firms. In efficient markets, investors should quickly incorporate this shared
influence across firms into prices, eliminating predictability among board-linked firms. We
find, however, that a firm’s returns can be predicted by the prior returns of those firms with
which they share a director.
Is it reasonable to expect sufficient commonality among board-linked firms to generate
the comovement in returns necessary for return predictability? Extensive research has shown
that board-linked firms tend to behave more similarly and experience similar events than
non-linked firms behave and experience. Firms with linked boards are more likely to adopt
similar governance structures such as poison pills (Davis, 1991; Davis and Greve, 1997).
Board-linked firms are also more likely to adopt similar accounting techniques such as their
choice of stock option expensing methods (Reppenhagen, 2010), willingness to backdate
executive options (Bizjak, Lemmon, and Whitby, 2009) or use corporate life insurance tax
shelters (Brown, 2011). Some of these more aggressive accounting techniques exemplify the
general tendency of linked firms to engage in similar earnings management. This results in
firms with shared directors to jointly be more likely to restate those earnings (Chiu, Teoh,
and Tian, 2013). In the extreme case, a firm is more likely to be sued for fraud if one of its
directors sits on the board of another firm that has been sued for fraud (Fich and Shivdasani,
2007).
Outside of governance and accounting practices, firms with linked boards share other
common behaviors. They are more likely to make the switch from the NYSE to NASDAQ
together (Rao, Davis, and Ward, 2000), thereby increasing their visibility and access to
capital. Firms sharing directors also have similar acquisition patterns with acquisitions by
one firm making the other board-linked firm more likely to make an acquisition (Haunschild,
1For an overview of the influence of boards see the recent reviews by Hermalin and Weisbach (2003);Adams, Hermalin, and Weisbach (2010) and the references therein.
2

1993). Moreover, board-linked firms pay similar premia for their targets (Haunschild, 1994).
Board-linked firms are also more likely to be jointly acquired by private equity companies
(Stuart and Yim, 2010) than non-linked firms.
These joint actions raise the question of what value effects exist for firms with shared
directors? Researchers have studied the value effects of these common actions and reputa-
tional effects of similar governance with short window event studies. Ferris, Jagannathan,
and Pritchard (2003) and Fich and Shivdsani (2006) use returns on board member appoint-
ments and departures to study the value effects of busy boards. Fich and Shivdasani (2007)
uses the returns to linked firms on the announcement dates of fraud lawsuits against firms
with shared directors as a measure of the reputational cost to allowing poor governance. For
these returns to be accurate measures of the value effects due to actions at firms across the
board network, investors must immediately and accurately update prices after such events.
We ask the question, how quickly do investors incorporate the information about firms linked
through shared directors?
We answer this question by using two sources of data to map the networks of firms with
shared directors between 1996 and 2014. The first is the readily available “public” databases
RiskMetrics and BoardEx. The second is a hand-collected database of directors obtained
from mutual fund voting records filed with the SEC. Though technically publicly available,
because it is less readily available, we call this a “semi-private” database.
After mapping the director network, we follow the methodology of Cohen and Frazzini
(2008) and apply the correction of Burt and Hrdlicka (2016) to test for delayed price discovery
among board links. We form a long-short trading strategy by sorting firms into quintiles
each month based on the average of the prior month’s idiosyncratic returns of firms with
which each firm shares at least one director. The five-factor alpha of the value weighted long-
short portfolio is 6.5% per year. This alpha is both economically and statistically significant,
indicating that investors process the common influences of linked boards into stock prices
with a delay. Though we find a large effect with a delay of one month, the predictability
3

dissipates thereafter showing investors ultimately become aware of the relevant information
in board links.
We find that this return predictability and, hence, delayed price discovery is concentrated
among the largest firms and at the long end of the portfolio. Together, these findings suggest
that investor inattention is important to this predictability, and trading frictions are not the
sole source of the delayed price discovery.
Further evidence that investor inattention, rather than trading frictions, is responsible
for the delayed price discovery comes in two forms. First, we find that predictability flows
from small firms to big firms. In fact, there is almost no predictability flowing from big
firms to small firms. Second, we find that when using only the public data on director links,
return predictability is substantially muted. Including the semi-private, hand collected data
on directors increases the predictability, as measured with alpha, by almost 50%.
The similar behavior among board-linked firms may come from three channels. First,
common directors may transmit information across firms such as which management prac-
tices and actions should be taken to respond to the current economic environment. Second,
firms with linked boards are more likely to share governance features (and failures) due to
a common director’s experiences, predilections, or willingness to exert time and effort on
governance. Third, links among firms’ boards may reveal more fundamental connections
between the firms that make linked boards beneficial.
We attempt to distinguish among these channels by excluding from all results linked firms
in the same industry and other economics link between firms. We exclude links that coincide
with customer and suppliers relationships (Cohen and Frazzini, 2008), links between firms
which are both part of the same strategic alliance (Cao, Chordia, and Lin, 2015), and firms
with head quarters in the same MSA.2,3 Despite having removed these links, we find that
2The predictability we find also appears to be different from that documented by Cao et al. (2015) amongjoint ventures because their predictability is concentrated among small firms while the predictability we findis concentrated among the largest firms.
3Gulati and Westphal (1999) shows that a linked board affects the likelihood of a joint venture betweenthe linked firms. However, whether this effect is positive or negative depends upon the ratio of insiders tooutsiders on the board.
4
return predictability among board-linked firms remains.
To overcome the concern that shared directors proxy for another separate underlying
economic link, we also perform an out-of-sample test using the links. Specifically, we form
a sample of linked firms from shared directors 1-3 years before (after) a shared director link
begins (ends). If the shared director is a proxy for another underlying economic link unrelated
to the director, we expect to find that these out-of-sample links should yield similar return
predictability. However, we find just the opposite. Using the out-of-sample links from 1-3
years before and after a link exists, we find the return predictability becomes economically
small and statistically insignificant. If we use the sample period of 2-4 years before (after)
a shared director link begins (ends), we find the economic magnitude decays further. Thus,
the shared director links yield return predictability among firms.
We investigate the mechanism driving the observed predictability. We rule out the intra-
industry effect documented by Hou (2007) and the big to small firm information flow of
Lo and MacKinlay (1990). Given the predictability is in the long end of the portfolio and
we are investigating predictability of firms linked by insiders we consider the mechanism of
these insiders trades. Filtering on trades of the linked board members we find the return
predictability increases giving a five-factor model long-short alpha of 15% per year.
Overall, the predictability provides further evidence of investor inattention, especially to
small firms whose board are poorly covered by commercially available databases. Moreover
we present a variety of evidence that the predictability is driven by the presence of a shared
director. The delayed incorporation of information regarding these board-linked firms into
prices suggests that short-horizon event studies of boards’ value effects understate the true
effects of corporate boards. Nevertheless, the fact that returns of such linked firms move
together, even with a delay, provides further evidence that the common actions of boards,
even just one director, have important value effects on firms.
5

I. Data
We identify firms which share at least one director and use these board links to test
for return predictability. Our data on directors comes from three primary sources. For
two of our sources, we use the relatively public and easily accessible databases, RiskMetrics
and BoardEx. The RiskMetrics Directors Database tracks the directors of S&P 1500 firms
annually for the years 1996 to 2014. For the years 1999 and earlier, RiskMetrics includes
director information for some additional firms beyond the S&P1500. BoardEx includes
annual information on boards of directors for the years 2000-2015, including some firms
which are not in the S&P 1500. The BoardEx and RiskMetrics database use differing unique
identifiers for each unique director. We hand-match directors across the databases on their
name, year of service and firm to obtain the unique number of shared directors per firm.
Combining the databases provides coverage of over 2000 firms. Our sample is the set of these
firms which share at least one director with another firm. Given the ease of accessibility to
this data, we refer to this sample as our “public” sample.
For our third source, we supplement the public sample with hand-collected data on
directors from Mutual Fund’s SEC filings on director elections. Mutual Funds are required
to file a Form N-PX annually regarding their votes on each proxy statement proposal for each
firm the mutual fund holds. This voting data includes votes cast for or against directors up
for election and is available for download starting in 2002 on the SEC Edgar website. Using
two general assumptions, we construct a second sample of firms which share at least one
director with another firm. First, we assume that a director who is up for election is elected.
Second, if a director appears in the data for a given firm in any two non-consecutive years, we
assume the director was an active director in the years omitted. Both of these assumptions
could potentially inflate the number of board connections and the average length of time
for which two firms are connected. However, in our case, the misidentification of connected
boards would only induce noise in our sample, and hence, bias our findings downward.
To identify the firms with connected boards, we use a fuzzy matching process on director
6

names. The fuzzy matching leads to noise in our identification of the board links, but this
also would only bias our findings downward. We exclude any firm-to-firm overlaps with our
public sample. Although the mutual fund voting data is public, given that it is less easily
accessible than the directors data in our public sample, we refer to the board links derived
from this data as our “semi-private” sample.
We combine our public and semi-private sample into a “full” sample. We use this sample
for most of our analysis throughout the paper. Two firms are considered linked at the end
of each calendar year in which a director is active. We define a director as active for the
first time after the first annual report following the election of a director. We combine
monthly returns from CRSP with our full sample of board-linked stocks to test for slow
price discovery following the methodology of Cohen and Frazzini (2008) with the correction
of Burt and Hrdlicka (2016). We limit our data to common stocks (share codes 10 and 11)
traded on the NYSE, AMEX and NASDAQ. We also exclude utilities and financial firms
from the predicted side of the link.
Table I provides summary statistics for our sample at the end of each calendar year for
the years 1997-2015. Panel A shows that the full sample covers, on average, 92% of the total
market capitalization of the CRSP universe each year. This accounts for approximately
2,055 firms per year, which is 45%, on average, of the total common stocks in the CRSP
Universe of firms. In later years, the number of firms in the total sample grows due to the
additional data from the semi-private sample. Hence the maximum number of firms is 2,632
firms in a given year. Over our entire sample, the mean firm size percentile (based on NYSE
percentiles) is 0.48 while the average firm book-to-market percentile is 0.46. For a given firm
in our sample, the median firm is linked to 3 other firms.4
Panels B provides an overview of the public portion of our sample. The mean annual
number of firms between the years 1997 and 2014 is 1,491, which represents approximately
34% of the total number of common stocks traded in the NYSE, AMEX, NASDAQ. Risk-
4Due to the fuzzy match a few firms end up with many matches due to common director names. Thisnoise in our links biases us against finding anything.
7

Table I Summary Statistics This table shows summary statistics as of December of each year. Panel A includes an summary of the overallsample. Panel B provides an overview of the public sample, which is all board links identified based on directors listed in the RiskMetrics andBoardEx Databases for the years 1997-2015. Panel C summarizes the board links based on the unique set of firms with shared directors added tothe overall sample through hand-collection from mutual fund voting records. This sample is summarized before removing links overlapping with thepublic sample. Percent coverage of CRSP Universe (EW) is the number of stocks with a valid board link to one or more firms divided by the totalnumber of CRSP stocks. Percent coverage of CRSP Universe (VW) is the total market capitalization of stocks with a valid board link to one ormore firms divided by the total market value of all CRSP stocks. Book-to-market is the Compustat book value of equity divided by the market valueof equity. Size is the firm’s market value of equity. Book-to-market and size percentiles are based on the percentile rankings of NYSE stocks only.Number of unique links per firm is the number of stocks with a valid board link connected to a firm, regardless of the number of shared directors ineach link.
Panel A: Full Sample (18 Yearly Observations, 1997 - 2015)
Min Q1 Median Q3 Max Mean Std.
Number of firms in the sample each year 1226 1630 2148 2504 2632 2055 518Full sample % coverage of CRSP Universe (EW) 16.3 29.3 48.8 63.2 66.3 44.9 18.5Full sample % coverage of CRSP Universe (VW) 80.1 90.2 93.5 94.6 96.0 91.6 4.8Firm size percentile (NYSE) 0.01 0.2 0.45 0.75 0.99 0.48 0.3Firm book to market percentile (NYSE) 0.01 0.2 0.45 0.7 0.99 0.46 0.3Number of Unique Links Per Firm 1 2 3 7 43 5.24 5.41
Panel B: Public Sample (18 Yearly Observations, 1997 - 2015)
Min Q1 Median Q3 Max Mean Std.
Number of firms in the sample each year 1111 1226 1582 1671 1793 1491 223Full sample % coverage of CRSP Universe (EW) 16.3 29.0 32.6 36.0 39.5 31.0 6.9Full sample % coverage of CRSP Universe (VW) 80.1 88.0 90.8 92.0 92.8 88.9 4.2Firm size percentile (NYSE) 0.01 0.35 0.55 0.8 0.99 0.57 0.28Firm book to market percentile (NYSE) 0.01 0.2 0.4 0.7 0.99 0.45 0.29Number of Unique Links Per Firm 1 2 4 8 43 5.67 5.2
Panel C: Semi-Private Sample - Unique Firms (11 Yearly Observations, 2004 - 2015)
Min Q1 Median Q3 Max Mean Std.
Number of firms in the sample each year 283 700 813 835 887 728 182Full sample % coverage of CRSP Universe (EW) 5.9 15.1 20.0 21.6 22.6 17.9 5.4Full sample % coverage of CRSP Universe (VW) 0.7 1.5 2.1 2.9 4.4 2.3 1.1Firm size percentile (NYSE) 0.01 0.05 0.1 0.2 0.99 0.16 0.16Firm book to market percentile (NYSE) 0.01 0.2 0.5 0.8 0.99 0.51 0.33Number of Unique Links Per Firm 1 1 2 3 24 2.14 2.21
8

Metrics data set consists of S&P 1500 firms, while BoardEx contributes some additional
firms outside the S&P 1500. RiskMetrics’ focus on S&P 1500 firms means that fewer smaller
firms are included in our sample. Thus, the public sample represents only 31% of the total
number of firms in the CRSP universe each year, but comprises 88.9% of the total market
capitalization of common stocks in the CRSP universe. Firms in the public sample tend
to be bigger than those in the overall sample. The average firm size percentile based 0.57
and the average book-to-market percentile is 0.45. These firms also have a higher number of
unique links due to shared directors than the full sample of firms, with an average number
of unique links of 4.67 and a median of 4.
Panels C provides an overview of the semi-private portion of our sample. The hand-
collected data comes from votes cast in most funds owned by Fidelity, Vanguard and Di-
mensional Fund Advisors. Thus, it includes both large firms and small firms. We show the
summary statistics for only the unique firms identified through the hand-collection process.
The mean annual number of firms between the years 1997 and 2015 is 728, which represents
approximately 18% of the total number of common stocks traded in the NYSE, AMEX,
NASDAQ. In contrast to the public sample, however, the firms in the semi-private sample
are considerably smaller. Thus, the semi-private sample represents 2.3% of the total market
capitalization of the CRSP universe. Firms in the semi-private sample have a mean firm size
percentile of 0.16 compared to the mean size percentile of 0.48 in the public sample. The
average book-to-market percentile of the semi-private sample is 0.51. The number of unique
links per firm is also less for the semi-private sample. With a median of 2 links per firm,
small firms in the semi-private sample appear to have about half as many unique board links
than firms in the public sample.
9

II. Predictable Returns
If markets are efficient prices, should respond quickly to relevant news events. However,
identifying ex-ante relevant news events is difficult, especially once one moves beyond the
largest of firm events. Economically linked firms present an opportunity to exploit financial
markets’ impounding of relevant news, visible via returns, as proxy for relevant news at the
related firms. This allows the study of the effect of the continuous flow of often small or not
directly observable news events into market prices.
We follow the methodology of detecting slow price discovery among economically linked
firm originated by Cohen and Frazzini (2008); Menzly and Ozbas (2004, 2010) and refined
by Burt and Hrdlicka (2016). For each firm in our sample at each month, t, we form an
equal-weighted portfolio of the prior period’s, t − 1, idiosyncratic shocks to each firm with
which our first firm is linked via common directors. We refer to this portfolio of idiosyncratic
shocks as the board-links return (BLRET ). We then sort firms into quintile portfolios at
time t based on this board-links return. We consider these quintile portfolios both value-
weighted and equal-weighted rebalancing them monthly. Our key statistic of interest is the
five-factor alpha of the long-short portfolio of the extreme quintiles (Fama and French, 1993,
1996; Carhart, 1997; Pastor and Stambaugh, 2003). As shown in Burt and Hrdlicka (2016)
positive alphas in this long-short portfolio indicate slow price discovery.
The idiosyncratic shocks used in the sorting are calculated from a five-factor model rolling
regression, estimated using one year of prior monthly data: t − 13 to t − 2. Idiosyncratic
shocks, rather than excess returns, are used for the sorting to remove bias in the predictabil-
ity due to shared model misspecification (correlated alphas) that would arise using excess
returns. Additionally using show idiosyncratic shocks provides a more powerful test of de-
layed price discovery, improving the signal-to-noise ratio by eliminating noise from both
model misspecification and common systematic shocks. (See Burt and Hrdlicka (2016) for
an analysis of this methodology.)
To provide an opportunity for investors to learn of the firm links stemming from shared
10

directors, we impose a six-month gap between the end of the link observation year and
portfolio formation. New links, as measured by shared directors at the end of the previous
calendar year, come into use in July of each year and continue through the following June.
To overcome potential micro-cap effects, we exclude all stocks whose previous month’s price
was less than $5 from the side of the link being predicted. This methodology results in 216
monthly observations for five quintile portfolios.
Table II shows the alphas of five quintile portfolios (value- and equal-weighted) along
with the long-short portfolio formed from quintiles 5 and 1. We see that, regardless of
the asset pricing model used, the alpha of the value-weighted long-short portfolio is highly
economically and statistically significant. The five-factor alpha of the value-weighted long-
short portfolio is 54 basis points per month or 6.5% per year. The equal-weighted alpha is
essentially zero, so we focus on the more interesting value-weighted results for the remainder
of the paper. This positive alpha indicates slow information diffusion.
The larger value-weighted alpha shows the predictability is stronger in the largest firms,
which tend to be more liquid. Furthermore, the predictability is concentrated in the long end
of the portfolio where short-selling constraints do not bind. The concentration of predictabil-
ity in large firms and in the long end of the portfolio suggests that investor inattention or
limited information processing drives the predictability rather than only trading frictions.
Though the alphas due to predictability from board links over one-month horizon are
large, the additional predictability (alphas) becomes statistically insignificant thereafter.
The subsequent disappearance of the predictability shows investors eventually respond to the
relevant information contained in the returns of these linked firms. Importantly, investors
need never become aware of the link or past idiosyncratic shocks to linked firms for this
eventual price discovery. The information could come out through a separate channel, such
as a news report specific to the firm slow to respond or that firm’s earnings announcement.
In the following sections we show that the link between firms through their shared director
is responsible for this return predictability. And we demonstrate that this link is not simply
11

Table II Abnormal Returns of Board-Linked Sorted Portfolios, 1997-2015 Thistable shows monthly abnormal returns for value- (equal-) weighted portfolios of board-linked stocks. Inmonth t (returns at t+ 1), stocks are assigned to one of five portfolios based on the equal-weighted portfolioof the five-factor model’s idiosyncratic returns of all stocks with which the firm shares at least one directorin month t. The five portfolios are rebalanced monthly to maintain value- (equal-) weighting. Alpha isthe intercept on a regression of the monthly excess return for the portfolio using the selected asset pricingmodels. The models include the CAPM 1-factor model, the Fama and French (1993) 3-factor model, andthe 3-factor model augmented with momentum of Carhart (1997) and liquidity of Pastor and Stambaugh(2003). L/S is the alpha of a portfolio that is long the highest quintile and short the lowest quintile. Alphasare in monthly percent and t-statistics are shown in parentheses below the coefficient estimates.
Value Weights Q1(Low) Q2 Q3 Q4 Q5(High) L/S
Excess Returns 0.407 0.638 0.588 0.386 0.989 0.581(1.005) (2.001) (2.017) (1.225) (2.311) (2.722)
1-Factor Alpha -0.189 0.155 0.149 -0.095 0.371 0.560(-1.210) (1.576) (1.569) (-1.042) (2.039) (2.604)
3-Factor Alpha -0.153 0.184 0.172 -0.088 0.428 0.581(-1.071) (1.907) (2.052) (-0.969) (2.522) (2.672)
4-Factor Alpha -0.118 0.184 0.183 -0.122 0.474 0.592(-0.825) (1.887) (2.173) (-1.373) (2.801) (2.698)
5-Factor Alpha -0.110 0.146 0.166 -0.123 0.440 0.550(-0.754) (1.487) (1.945) (-1.350) (2.561) (2.468)
Equal Weights Q1(Low) Q2 Q3 Q4 Q5(High) L/S
Excess Returns 0.819 0.801 0.836 0.855 0.960 0.141(1.907) (2.072) (2.218) (2.249) (2.243) (1.268)
1-Factor Alpha 0.202 0.246 0.295 0.307 0.348 0.146(1.081) (1.463) (1.793) (1.881) (1.834) (1.300)
3-Factor Alpha 0.004 0.043 0.098 0.102 0.138 0.133(0.032) (0.342) (0.792) (0.882) (1.037) (1.175)
4-Factor Alpha 0.116 0.130 0.183 0.172 0.225 0.109(0.956) (1.122) (1.587) (1.561) (1.807) (0.957)
5-Factor Alpha 0.045 0.035 0.095 0.068 0.162 0.117(0.375) (0.317) (0.854) (0.653) (1.305) (1.011)
12

proxying for other previously identified relationships between firms. We then provide further
evidence that investor inattention is responsible for the slow information diffusion. Finally
we investigate the mechanism by which information about the linked firms originally enters
the market, finding trading by insiders is one important channel. This connection to insider
trading provides further identification that the link between the firms is indeed due to the
shared directors.
III. Robustness and Identification
Though two firms sharing a common director is a good summary statistics for a relation-
ship between the two firms, we now establish that such a link provides a measure of similarity
between firms over and above previously identified measures. Moreover, we argue that the
return predictability found in our main result is at least in part due to similar actions or
experiences among firms with shared directors due to the influence of the shared directors.
We employ three approaches in an attempt to distinguish the channels of general firm
similarity and the influence of directors. First, we exclude firms linked by directors that are
also in the same industry. Second, we exclude firms also linked by previously documented
economic links. Third, we show that the return predictability is limited to the time period
of the director link.
In Table III we show the predictability obtained when we exclude linked firms in the
same industry. Using 3 or 4-digit SIC codes as our industry measure we obtain virtually
identical results to our main specification: statistically significant five-factor monthly alphas
56 and 50 bps. Even excluding linked firms that share the same industry at the very coarse
2-digit SIC level, we still obtain statistically significant 42bps per month alpha.
In the last three columns of Table III we exclude firms linked at the industry level (3-digit
SIC) and firms linked by the customer-supplier relationships, strategic alliances or that share
the same MSA. We obtain the customer-supplier links network by following the method of
13

Cohen and Frazzini (2008) to replicate their network and extend the link relationships to
the present. We find economically and statistically significant five-factor alphas for the long-
short portfolio of 53 bps per month or 6.4% per year. Excluding firms linked by alliances
as identified in Cao et al. (2015) we again find that the five-factor alphas for the long-short
portfolios remain economically large and statistically significant: 51 bps per month. The
reason for such small differences from excluding these sets of links is that there is little
overlap between firms with shared directors and firms with customer-supplier relationships
and alliances.
One might hypothesize that firms share director because they have similar location and
thus the director link simply picks up common exposure to local economic variables. To show
that such local effects do not drive our results we exclude linked firms with headquarters in
the same MSA. We continue to find an economically and statistically significant alpha of 43
bps per month or 5.2% per year.
As an alternative test of whether the return predictability is due to the influence of the
shared directors or simply similar firms sharing directors, we look at return predictability in
the period before the link begins and after the link ends. Table IV reports the long-short
alpha derived based on quintile portfolios formed by using out-of-sample director-linked
firms. We first link firms one to three years before or after (or combined) the periods in
which the firms share a director. In comparison to the statistically significant in-sample
alpha of 54 basis points, we find that the five-factor alpha of the value-weighted long-short
portfolio using the out-of-sample links is neither economically and nor statistically. It is -5
bps per month in the one to three years before the link begins and 11 bps per month in
the one to three years after the link ends. Even combining the before and after periods to
improve the power or consider the sample window two to four years before and after, we
continue to find no evidence return predictability.
That predictability among firms with shared directors occurs only when the shared direc-
tor link exists, suggests that the commonality among these firms flows through the director.
14

Table III Robustness: Abnormal Board-Linked Stock Returns Excluding Commonly Known Economic Links,1997-2015 This table shows monthly abnormal returns for value-weighted portfolios of board-linked stocks. In month t (returns at t + 1), stocksare assigned to one of five portfolios based on the equal-weighted portfolio of the five-factor model’s idiosyncratic returns of all stocks with whichthe firm shares at least one director in month t. The five portfolios are rebalanced monthly to maintain value-weighting. Alpha is the intercept on aregression of the monthly excess return for the portfolio using various asset pricing models. The models include the CAPM 1-factor model, the Famaand French (1993) 3-factor model, and the 3-factor model augmented with momentum of Carhart (1997) and liquidity of Pastor and Stambaugh(2003). The alphas of the portfolios that are long the highest quintile and short the lowest quintile are shown below. Each column excludes linkswhich are commonly known or previously documented. The first column is the main result from Table II. The next 3 columns exclude all board-linkedstocks in the same industries identified by SIC-2, SIC-3 or SIC-4 codes. The “Customer-Supplier” column excludes board-linked stocks that are alsocustomer-supplier links identified in Cohen and Frazzini (2008) and extended to 2015. The “Alliances” column excludes board-linked stocks that arein the same alliance as identified by Cao et al. (2015). The “Same MSA” column excludes board-linked stocks of firms with headquarters in the samecensus-defined metropolitan statistical area (MSA). Alphas are in monthly percent and t-statistics are shown in parentheses below the coefficientestimates.
Main Industry Industry Industry Customer- Alliance SameValue Weights Result SIC-4 SIC-3 SIC-2 Supplier Member MSA
Excess Returns 0.581 0.454 0.564 0.423 0.537 0.491 0.456(2.722) (2.173) (2.731) (2.131) (2.607) (2.367) (2.218)
1-Factor Alpha 0.560 0.495 0.561 0.410 0.535 0.493 0.456(2.604) (2.365) (2.695) (2.052) (2.573) (2.356) (2.198)
3-Factor Alpha 0.581 0.486 0.579 0.431 0.553 0.520 0.472(2.672) (2.295) (2.753) (2.149) (2.633) (2.467) (2.250)
4-Factor Alpha 0.592 0.498 0.539 0.393 0.515 0.498 0.425(2.698) (2.327) (2.552) (1.950) (2.440) (2.341) (2.022)
5-Factor Alpha 0.550 0.499 0.556 0.415 0.531 0.507 0.427(2.468) (2.291) (2.591) (2.027) (2.476) (2.347) (1.996)
15

This methodology cannot fully reject that shared directors do not indicate economic connec-
tions between firms other than that caused by the director. But for such other connections
to be driving the predictability, they would have to vary in exactly the same points in time
as the directors’ appointments.
Given these timing results and the results that other economic connections (Table III)
do not explain our results suggests that the economic connection is driven by the common
influence of directors on both firms. Combining these results with the fact that most links
between firms are attributable to one director (see Table I), the extent of predictability
we find suggests that even one director can wield significant influence on a firm. This is
consistent with the findings a large literature on common actions and risk exposures among
firms with shared directors.5
IV. Inattention to Costly Information
The return predictability we document in Table II is concentrated in the long-end of the
value weighted portfolio. That there is an alpha due to return predictability available in a
long only position for trades primarily in the largest most liquid firms (of S&P1500 firms)
suggests investor inattention rather than trading frictions is responsible. To further explore
the extent to which investor inattention plays a role in the return predictability through
board links, we decompose this predictability into that attributable to different information
sets about shared directors. These information sets are constructed to vary in the degree to
which they are publicly available and readily accessible.
Our overall sample of board links comes from two sources. Our first data source is the
director databases: RiskMetrics and BoardEx. Though these databases are available for a
fee, they are both widely accessed databases. Moreover they are easy to use and covers the
largest most actively followed firms in the market, primarily S&P1500 firms. Finally, these
5See for example Davis (1991); Haunschild (1993, 1994); Davis and Greve (1997); Rao et al. (2000); Fichand Shivdasani (2007); Bizjak et al. (2009); Reppenhagen (2010); Stuart and Yim (2010); Brown (2011);Chiu et al. (2013).
16
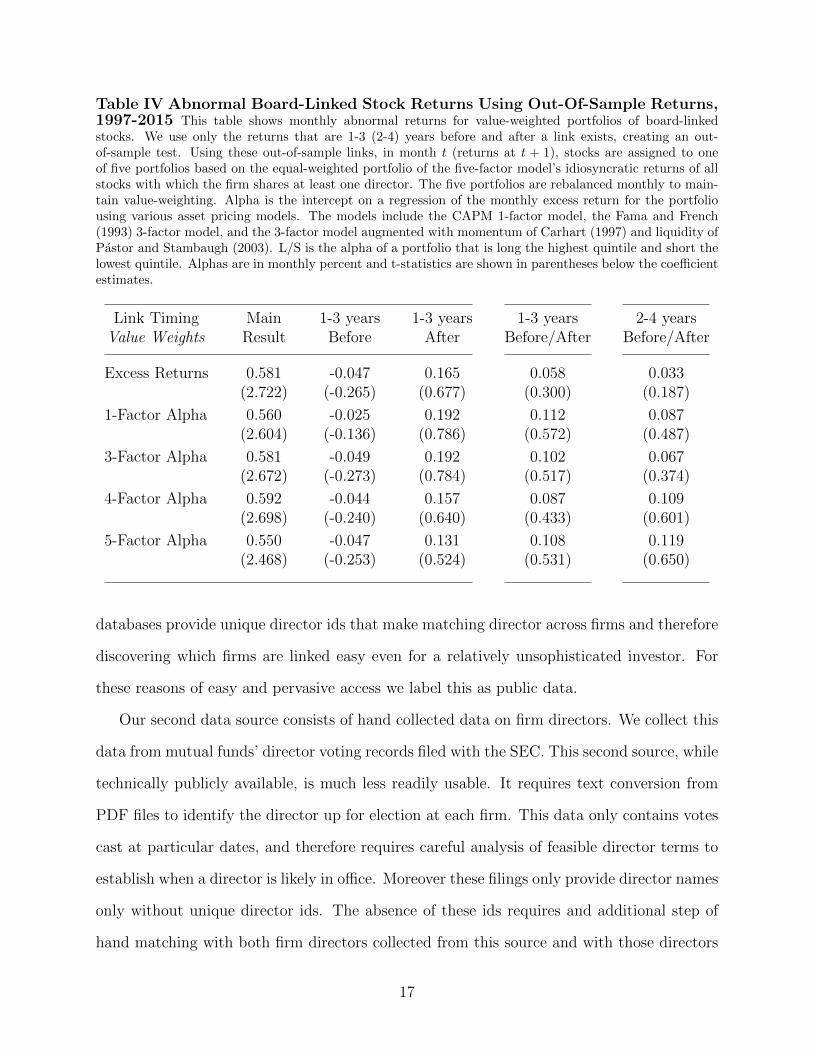
Table IV Abnormal Board-Linked Stock Returns Using Out-Of-Sample Returns,1997-2015 This table shows monthly abnormal returns for value-weighted portfolios of board-linkedstocks. We use only the returns that are 1-3 (2-4) years before and after a link exists, creating an out-of-sample test. Using these out-of-sample links, in month t (returns at t + 1), stocks are assigned to oneof five portfolios based on the equal-weighted portfolio of the five-factor model’s idiosyncratic returns of allstocks with which the firm shares at least one director. The five portfolios are rebalanced monthly to main-tain value-weighting. Alpha is the intercept on a regression of the monthly excess return for the portfoliousing various asset pricing models. The models include the CAPM 1-factor model, the Fama and French(1993) 3-factor model, and the 3-factor model augmented with momentum of Carhart (1997) and liquidity ofPastor and Stambaugh (2003). L/S is the alpha of a portfolio that is long the highest quintile and short thelowest quintile. Alphas are in monthly percent and t-statistics are shown in parentheses below the coefficientestimates.
Link Timing Main 1-3 years 1-3 years 1-3 years 2-4 yearsValue Weights Result Before After Before/After Before/After
Excess Returns 0.581 -0.047 0.165 0.058 0.033(2.722) (-0.265) (0.677) (0.300) (0.187)
1-Factor Alpha 0.560 -0.025 0.192 0.112 0.087(2.604) (-0.136) (0.786) (0.572) (0.487)
3-Factor Alpha 0.581 -0.049 0.192 0.102 0.067(2.672) (-0.273) (0.784) (0.517) (0.374)
4-Factor Alpha 0.592 -0.044 0.157 0.087 0.109(2.698) (-0.240) (0.640) (0.433) (0.601)
5-Factor Alpha 0.550 -0.047 0.131 0.108 0.119(2.468) (-0.253) (0.524) (0.531) (0.650)
databases provide unique director ids that make matching director across firms and therefore
discovering which firms are linked easy even for a relatively unsophisticated investor. For
these reasons of easy and pervasive access we label this as public data.
Our second data source consists of hand collected data on firm directors. We collect this
data from mutual funds’ director voting records filed with the SEC. This second source, while
technically publicly available, is much less readily usable. It requires text conversion from
PDF files to identify the director up for election at each firm. This data only contains votes
cast at particular dates, and therefore requires careful analysis of feasible director terms to
establish when a director is likely in office. Moreover these filings only provide director names
only without unique director ids. The absence of these ids requires and additional step of
hand matching with both firm directors collected from this source and with those directors
17
in our first data source. Finally, this data covers firms not in the publicly available databases
and, therefore, it consists primarily of small firms with likely smaller investor followings.6
We see small firm makeup from Table I where the new firms identified through this hand
collected database represent on average across years 18% of the CRSP universe by count but
only 2% by market cap. Due to the difficulty of its collection, the steps required to make it
usable and focus on small firms, we refer to it as semi-private data.
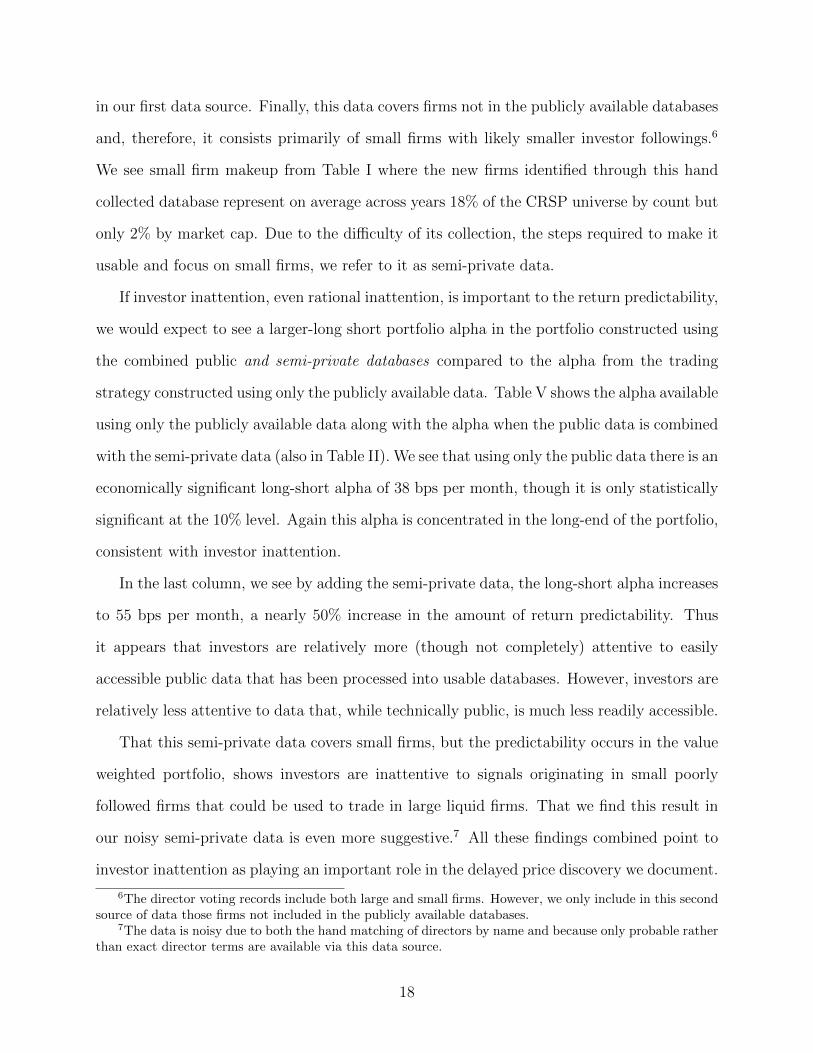
If investor inattention, even rational inattention, is important to the return predictability,
we would expect to see a larger-long short portfolio alpha in the portfolio constructed using
the combined public and semi-private databases compared to the alpha from the trading
strategy constructed using only the publicly available data. Table V shows the alpha available
using only the publicly available data along with the alpha when the public data is combined
with the semi-private data (also in Table II). We see that using only the public data there is an
economically significant long-short alpha of 38 bps per month, though it is only statistically
significant at the 10% level. Again this alpha is concentrated in the long-end of the portfolio,
consistent with investor inattention.
In the last column, we see by adding the semi-private data, the long-short alpha increases
to 55 bps per month, a nearly 50% increase in the amount of return predictability. Thus
it appears that investors are relatively more (though not completely) attentive to easily
accessible public data that has been processed into usable databases. However, investors are
relatively less attentive to data that, while technically public, is much less readily accessible.
That this semi-private data covers small firms, but the predictability occurs in the value
weighted portfolio, shows investors are inattentive to signals originating in small poorly
followed firms that could be used to trade in large liquid firms. That we find this result in
our noisy semi-private data is even more suggestive.7 All these findings combined point to
investor inattention as playing an important role in the delayed price discovery we document.
6The director voting records include both large and small firms. However, we only include in this secondsource of data those firms not included in the publicly available databases.
7The data is noisy due to both the hand matching of directors by name and because only probable ratherthan exact director terms are available via this data source.
18
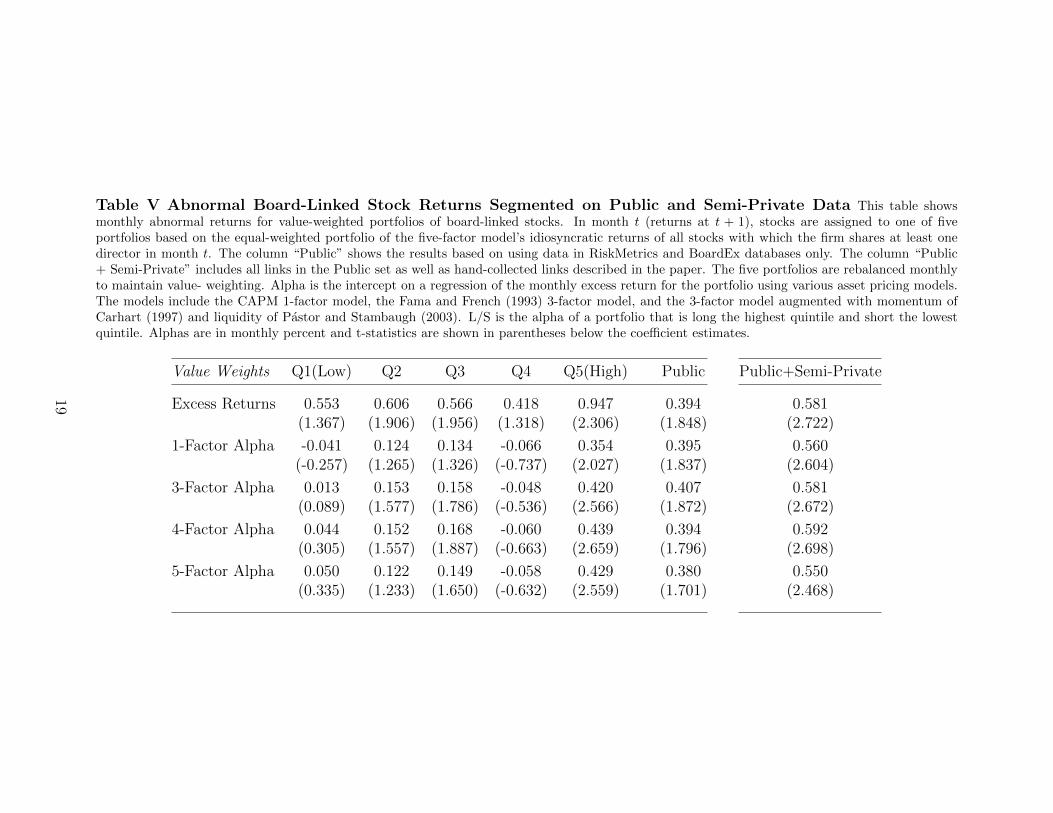
Table V Abnormal Board-Linked Stock Returns Segmented on Public and Semi-Private Data This table showsmonthly abnormal returns for value-weighted portfolios of board-linked stocks. In month t (returns at t + 1), stocks are assigned to one of fiveportfolios based on the equal-weighted portfolio of the five-factor model’s idiosyncratic returns of all stocks with which the firm shares at least onedirector in month t. The column “Public” shows the results based on using data in RiskMetrics and BoardEx databases only. The column “Public+ Semi-Private” includes all links in the Public set as well as hand-collected links described in the paper. The five portfolios are rebalanced monthlyto maintain value- weighting. Alpha is the intercept on a regression of the monthly excess return for the portfolio using various asset pricing models.The models include the CAPM 1-factor model, the Fama and French (1993) 3-factor model, and the 3-factor model augmented with momentum ofCarhart (1997) and liquidity of Pastor and Stambaugh (2003). L/S is the alpha of a portfolio that is long the highest quintile and short the lowestquintile. Alphas are in monthly percent and t-statistics are shown in parentheses below the coefficient estimates.
Value Weights Q1(Low) Q2 Q3 Q4 Q5(High) Public Public+Semi-Private
Excess Returns 0.553 0.606 0.566 0.418 0.947 0.394 0.581(1.367) (1.906) (1.956) (1.318) (2.306) (1.848) (2.722)
1-Factor Alpha -0.041 0.124 0.134 -0.066 0.354 0.395 0.560(-0.257) (1.265) (1.326) (-0.737) (2.027) (1.837) (2.604)
3-Factor Alpha 0.013 0.153 0.158 -0.048 0.420 0.407 0.581(0.089) (1.577) (1.786) (-0.536) (2.566) (1.872) (2.672)
4-Factor Alpha 0.044 0.152 0.168 -0.060 0.439 0.394 0.592(0.305) (1.557) (1.887) (-0.663) (2.659) (1.796) (2.698)
5-Factor Alpha 0.050 0.122 0.149 -0.058 0.429 0.380 0.550(0.335) (1.233) (1.650) (-0.632) (2.559) (1.701) (2.468)
19

Although not conclusive proof of causality, seeing that the amount of return predictability
varies with the publicity of the director links between firms also provides further evidence
that the return predictability flows through the director channel. If the shared directors were
simply proxying for another link between the firms, the publicity of such a link would need
not vary exactly with the publicity of the director link. And thus, we would not expect to
see variation in the predictability of returns based on the publicity of the director link.
V. Mechanism
We now investigate possible mechanisms for the observed return predictability. We have
already shown in Table III that the predictability we document is not driven by the inter-
industry predictability documented in Hou (2007). We next check whether it originates from
big firms leading small firms as documented by Lo and MacKinlay (1990).
In Table VI we split the sample based on firm size. In Panel A we look at the ability of
large firms to predict small firms by only including predictor firms (firms used for sorting)
that are smaller than the predicted firms. We see there is no economically or statistically
significant predictability as the five-factor long-short alpha is only 19 bps per month. This
lack of predictability is not due to simply spitting our sample. In Panel B we only include
predictor firms smaller than the predicted firms. We find an economically significant pre-
dictability of 44 bps per month which is significant at the 10% level. This predictability is
only slightly smaller than that in the full sample showing that predictability is driven by
small firms predicting big firms.Thus contrary to previously documented predictability this
predictability does not flow from large firms to small firms.
A natural mechanism to investigate as the source of return predictability across firms
with linked directors is the trading behavior of firm insiders. This is a particularly plausible
mechanism given our findings of return predictability concentrated in the long end of the
portfolio. Though return predictability could arise in several ways from insiders’ attempts
20

Table VI Abnormal Board-Linked Stock Returns Segmented on Linked Firms’Relative Sizes This table shows monthly abnormal returns for value-weighted portfolios of board-linkedstocks. In month t (returns at t+1), stocks are assigned to one of five portfolios based on the equal-weightedportfolio of the five-factor model’s idiosyncratic returns of all stocks with which the firm shares at leastone director in month t. Panel A only includes predictor firms in the sorting portfolio that are larger thanthe predicted firm. Panel B only includes predictor firms in the sorting portfolio that are smaller thanthe predicted firm. The five portfolios are rebalanced monthly to maintain value-weighting. Alpha is theintercept on a regression of the monthly excess return for the portfolio using various asset pricing models.The models include the CAPM 1-factor model, the Fama and French (1993) 3-factor model, and the 3-factormodel augmented with momentum of Carhart (1997) and liquidity of Pastor and Stambaugh (2003). L/S isthe alpha of a portfolio that is long the highest quintile and short the lowest quintile. Alphas are in monthlypercent and t-statistics are shown in parentheses below the coefficient estimates.
Panel A: Big-to-Small.
Value Weights Q1(Low) Q2 Q3 Q4 Q5(High) L/S
Excess Returns 0.594 0.566 0.556 0.544 0.757 0.162(1.669) (1.800) (1.728) (1.709) (2.178) (0.828)
1-Factor Alpha 0.066 0.099 0.078 0.080 0.253 0.187(0.507) (0.867) (0.667) (0.620) (1.752) (0.946)
3-Factor Alpha 0.058 0.057 0.056 0.010 0.241 0.184(0.437) (0.519) (0.494) (0.086) (1.654) (0.921)
4-Factor Alpha 0.081 0.055 0.095 0.039 0.275 0.194(0.610) (0.498) (0.850) (0.331) (1.884) (0.965)
5-Factor Alpha 0.059 0.038 0.056 -0.028 0.251 0.193(0.437) (0.341) (0.492) (-0.242) (1.694) (0.940)
Panel B: Small-to-Big.
Value Weights Q1(Low) Q2 Q3 Q4 Q5(High) L/S
Excess Returns 0.624 0.544 0.477 0.957 0.427(1.304) (1.930) (1.845) (1.443) (2.220) (1.921)
1-Factor Alpha -0.068 0.137 0.107 -0.028 0.330 0.397(-0.431) (1.301) (0.987) (-0.306) (1.867) (1.779)
3-Factor Alpha -0.056 0.164 0.152 0.007 0.361 0.417(-0.395) (1.556) (1.638) (0.072) (2.128) (1.851)
4-Factor Alpha -0.032 0.162 0.165 -0.005 0.395 0.427(-0.226) (1.529) (1.764) (-0.056) (2.320) (1.878)
5-Factor Alpha -0.039 0.118 0.150 -0.008 0.406 0.445(-0.269) (1.105) (1.576) (-0.086) (2.343) (1.923)
21

to exploit their private information about the joint prospects of linked firms through op-
portunistic trading, in all cases insiders would have a preference for purchasing their own
company stock: revealing good news and concentrating the predictability in the long-end
of the portfolio. This preference for purchases rather than sells is driven by the differential
liability and even prosecution probability for insider trading in each direction.
We consider three hypothesis about insider trading behavior. First, insiders could trade
simultaneously in both linked firms. If the market is more aware of one trade than the other
or the firms have different price impact then we would expect to see returns in the more
closely watched/sensitive firm lead those in the other firm.
Our second hypothesis is that insiders might trade sequentially in linked firms as they
become aware of the prospects of firms. For example if they trade in January in one firm
and February in the second firm, we could see the returns of the first firm lead those of the
second if either the market becomes sequentially aware of their trades or simply through the
sequential timing of the price impact from these trades.
Our third hypothesis is that an insider might choose to trade in only one firm. They
might choose this strategy if they have taken similar actions at both firms on which they are
a director. If they learn about the outcome of that action earlier at one firm and expect the
same outcome at the second firm, they may choose to trade in the second firm where they
plausibly do not yet have material information.
All three hypothesis have the same implication: upon filtering the predictive signal on
insider trading behavior, we should find a stronger predictability (larger long-short alpha) if
insider trading is important. For this filtering we use only non-routine insider trades as de-
fined by Cohen, Malloy, and Pomorski (2012). In Table VII we show the return predictability
where we only retain firms in the first and fifth quintiles when the direction of the net-trades
of insiders in the predicting firm at t agree with the return of the quintile at t. That is
we only keep firms in quintile one where insiders are selling and only keep firms in quintile
five when insiders are buying. To make sure this is a tradable strategy we only use data on
22
insider trades that is publicly available through filings to the SEC by the of month t.
In Panel A we consider all board members’ trades under the hypothesis that the linked
board member may share his or her knowledge either explicitly or inadvertently with fellow
board members. We find under this filter, the five-factor model long-short alpha increases to
83 bps per month consistent with insider trading playing an important role. In Panel B we
only consider the trades of the linked director to see if the information appears to originate
with him or her. The return predictability increases further giving a long-short alpha of 93
bps per month or 11% annually. This confirms that the insider who sits on both boards
is a key component in the return predictability, providing further identification that return
predictability is not simply flowing through shared board membership serving as a general
proxy of firm similarity. Finally, in both panels the predictability is primarily in the long
end, consistent with insiders preferring to buy rather than sell when trading on potentially
opportunistic information.
In Table VIII we show the number of firm month observations in the first and fifth
quintiles for the full sample and after applying filters on all insider trades in agreement and
only the linked insider trades in agreement with the portfolio assignment. We also list the
five-factor long-short alpha for of each filter for comparison. By construction there is an
equal number of observations in the full sample for the two quintiles. When we filter on
either type of insider trading, we see that there are 60 percent more buy observations (Q5)
than sell observations (Q1). This is consistent both with insiders preferring to buy rather
than sell and our findings of the predictability concentration in the long-end of the portfolio.
Comparing the two different insider trading filters, we see that the trades by the linked
board member represent approximately 80% of the sample of all insider trades. This again
confirms that it is the behavior of the linked director driving the predictability observed.
Given that we have established insider trading behavior is an important mechanism, we
now attempt to differentiate among the three hypothesis by looking directly at the trading
behavior in both of the linked firms. In Table IX we continue to restrict the sample to firms
23

Table VII Abnormal Board-Linked Stock Returns With Links Restricted to In-sider Trades This table shows monthly abnormal returns for value-weighted portfolios of board-linkedstocks intersected with insider trades. In month t (returns at t + 1), stocks are assigned to one of fiveportfolios based on the equal-weighted portfolio of the five-factor model’s idiosyncratic returns of all stockswith which the firm shares at least one director in month t. Panel A restricts the links to those stocks forwhich at least one of the linked stocks has an opportunistic insider trade during month t. Panel B restrictsthe links to those stocks for which at least one of the linked stocks has a linked director’s opportunisticinsider trade during month t Insider trades are defined as opportunistic if the insider has not traded in thesame month in any of the 3 years prior (Cohen et al., 2012). The five portfolios are rebalanced monthlyto maintain value-weighting. Alpha is the intercept on a regression of the monthly excess return for theportfolio using various asset pricing models. The models include the CAPM 1-factor model, the Fama andFrench (1993) 3-factor model, and the 3-factor model augmented with momentum of Carhart (1997) andliquidity of Pastor and Stambaugh (2003). L/S is the alpha of a portfolio that is long the highest quintileand short the lowest quintile. Alphas are in monthly percent and t-statistics are shown in parentheses belowthe coefficient estimates.
Panel A: Board links restricted to having any opportunistic trades during month texecuted by any board member.
Value Weights Q1(Low) Q5(High) L/S
Excess Returns 0.387 1.174 0.787(0.812) (2.663) (2.142)
1-Factor Alpha -0.128 0.673 0.800(-0.428) (2.684) (2.165)
3-Factor Alpha -0.162 0.674 0.837(-0.551) (2.686) (2.242)
4-Factor Alpha -0.126 0.697 0.824(-0.426) (2.758) (2.188)
5-Factor Alpha -0.179 0.654 0.834(-0.597) (2.553) (2.180)
Panel B: Board links restricted to having any opportunistic trades during month texecuted by the linked director.
Value Weights Q1(Low) Q5(High) L/S
Excess Returns 0.283 1.131 0.848(0.605) (2.538) (2.318)
1-Factor Alpha -0.211 0.639 0.849(-0.696) (2.384) (2.305)
3-Factor Alpha -0.249 0.646 0.894(-0.829) (2.389) (2.414)
4-Factor Alpha -0.222 0.692 0.914(-0.733) (2.553) (2.446)
5-Factor Alpha -0.265 0.660 0.925(-0.862) (2.399) (2.436)
24
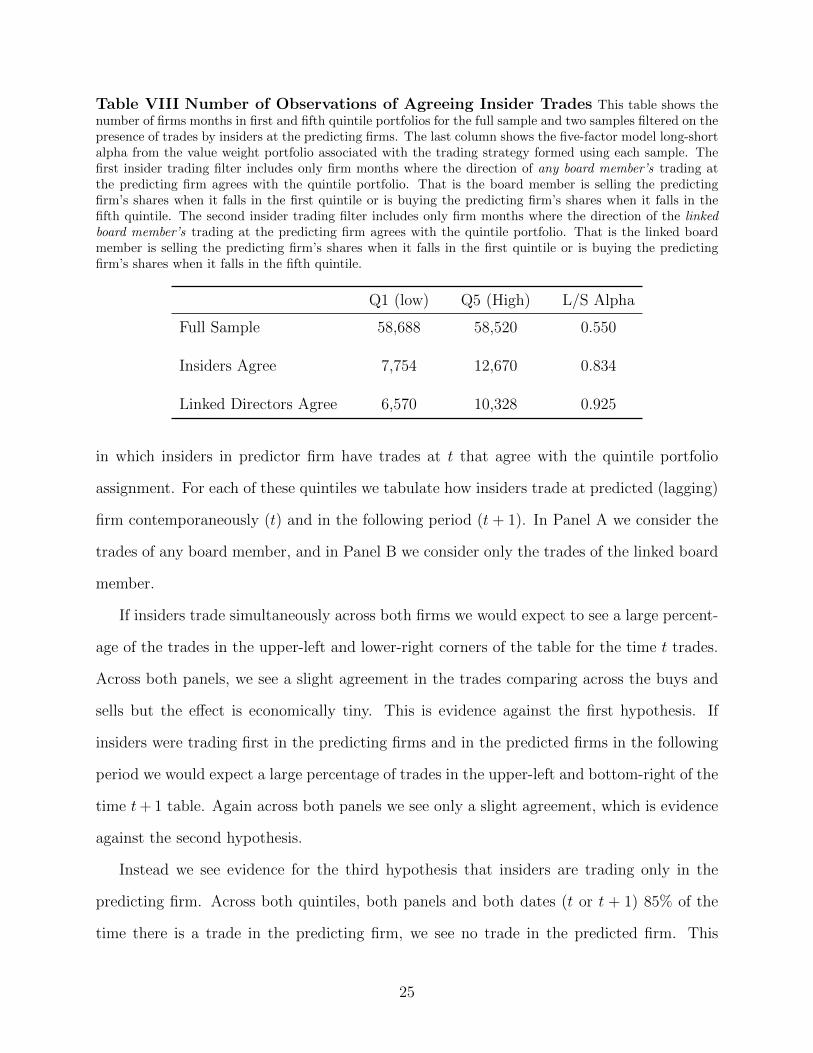
Table VIII Number of Observations of Agreeing Insider Trades This table shows thenumber of firms months in first and fifth quintile portfolios for the full sample and two samples filtered on thepresence of trades by insiders at the predicting firms. The last column shows the five-factor model long-shortalpha from the value weight portfolio associated with the trading strategy formed using each sample. Thefirst insider trading filter includes only firm months where the direction of any board member’s trading atthe predicting firm agrees with the quintile portfolio. That is the board member is selling the predictingfirm’s shares when it falls in the first quintile or is buying the predicting firm’s shares when it falls in thefifth quintile. The second insider trading filter includes only firm months where the direction of the linkedboard member’s trading at the predicting firm agrees with the quintile portfolio. That is the linked boardmember is selling the predicting firm’s shares when it falls in the first quintile or is buying the predictingfirm’s shares when it falls in the fifth quintile.
Q1 (low) Q5 (High) L/S Alpha
Full Sample 58,688 58,520 0.550
Insiders Agree 7,754 12,670 0.834
Linked Directors Agree 6,570 10,328 0.925
in which insiders in predictor firm have trades at t that agree with the quintile portfolio
assignment. For each of these quintiles we tabulate how insiders trade at predicted (lagging)
firm contemporaneously (t) and in the following period (t + 1). In Panel A we consider the
trades of any board member, and in Panel B we consider only the trades of the linked board
member.
If insiders trade simultaneously across both firms we would expect to see a large percent-
age of the trades in the upper-left and lower-right corners of the table for the time t trades.
Across both panels, we see a slight agreement in the trades comparing across the buys and
sells but the effect is economically tiny. This is evidence against the first hypothesis. If
insiders were trading first in the predicting firms and in the predicted firms in the following
period we would expect a large percentage of trades in the upper-left and bottom-right of the
time t+ 1 table. Again across both panels we see only a slight agreement, which is evidence
against the second hypothesis.
Instead we see evidence for the third hypothesis that insiders are trading only in the
predicting firm. Across both quintiles, both panels and both dates (t or t + 1) 85% of the
time there is a trade in the predicting firm, we see no trade in the predicted firm. This
25
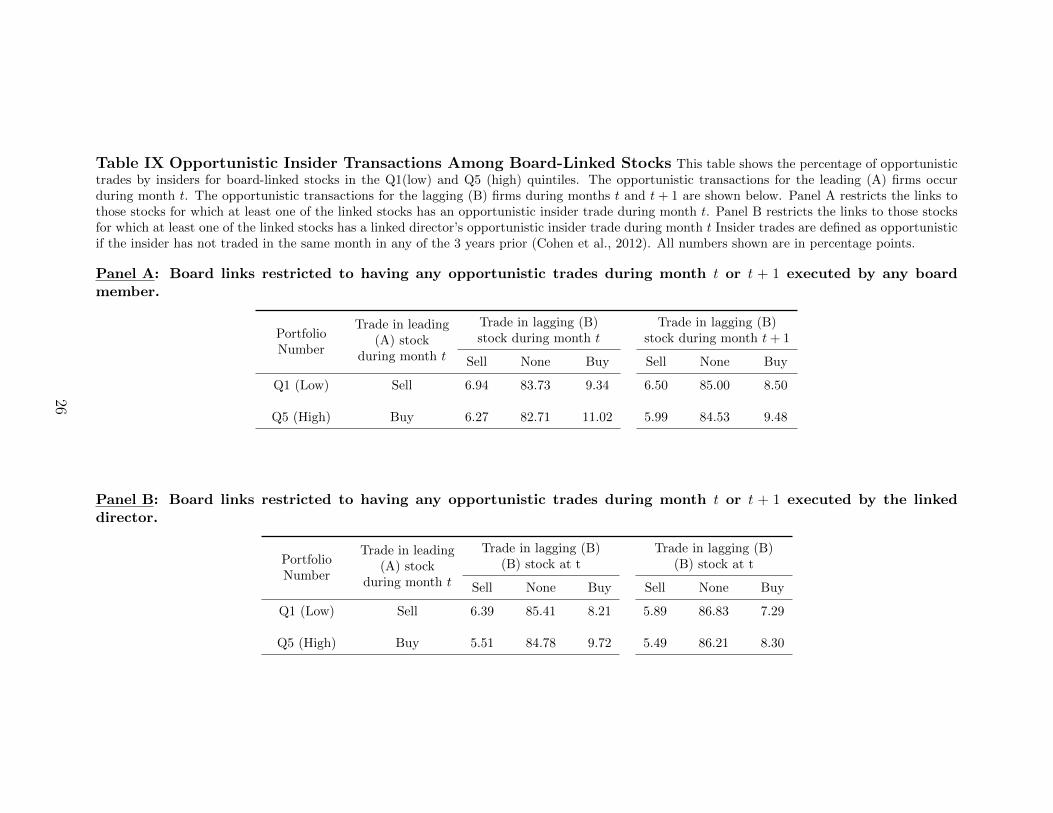
Table IX Opportunistic Insider Transactions Among Board-Linked Stocks This table shows the percentage of opportunistictrades by insiders for board-linked stocks in the Q1(low) and Q5 (high) quintiles. The opportunistic transactions for the leading (A) firms occurduring month t. The opportunistic transactions for the lagging (B) firms during months t and t + 1 are shown below. Panel A restricts the links tothose stocks for which at least one of the linked stocks has an opportunistic insider trade during month t. Panel B restricts the links to those stocksfor which at least one of the linked stocks has a linked director’s opportunistic insider trade during month t Insider trades are defined as opportunisticif the insider has not traded in the same month in any of the 3 years prior (Cohen et al., 2012). All numbers shown are in percentage points.
Panel A: Board links restricted to having any opportunistic trades during month t or t + 1 executed by any boardmember.
PortfolioNumber
Trade in leading(A) stock
during month t
Trade in lagging (B) Trade in lagging (B)stock during month t stock during month t + 1
Sell None Buy Sell None Buy
Q1 (Low) Sell 6.94 83.73 9.34 6.50 85.00 8.50
Q5 (High) Buy 6.27 82.71 11.02 5.99 84.53 9.48
Panel B: Board links restricted to having any opportunistic trades during month t or t + 1 executed by the linkeddirector.
PortfolioNumber
Trade in leading(A) stock
during month t
Trade in lagging (B) Trade in lagging (B)(B) stock at t (B) stock at t
Sell None Buy Sell None Buy
Q1 (Low) Sell 6.39 85.41 8.21 5.89 86.83 7.29
Q5 (High) Buy 5.51 84.78 9.72 5.49 86.21 8.30
26

suggests that the linked board members are trading in one firm based on information they
have in the other firm on whose board they sit.
One might suspect that the linked board members would vary the intensity of their
opportunistic trading with either the strength of their information or confidence in it. To
test this hypothesis we restrict the firms included in the quintiles to those where the linked
board members trades at the predicting firm fall in the most extreme quintile of trades
that agree with the assigned quintile. That is in the first quintile we only keep firms where
insiders net-trades (e.g., sales) fell in the bottom quintile of all board members trades in
that quintile.
Table X shows the return predictability that results from this filter. For the first time,
we find a strong negative alpha in the short-end of the portfolio. This suggests that while
the majority of the time insiders prefer to make opportunistic purchases they are willing to
make opportunistic sales when they have an extreme signal. Overall, we find a five-factor
long-short portfolio alpha of 125 bps per month or 15% annually. This suggests that insiders
do vary the intensity of their trades based on the strength of their cross-firm information.
VI. Conclusion
Firms which share common directors exhibit similar behavior including adopting common
governance structures, accounting methods and acquisition premiums. Such linked firms also
experience common events such as lawsuits for fraud or being targeted for private equity
takeovers. We show that investors fail to immediately incorporate into share prices the
information from experiences of firms linked by common directors. Sorting firms based on
the lagged idiosyncratic shocks experienced by firms with which they share a director, we
form a long-short trading strategy that generates an alpha of over 6.5% per year. We present
a variety of evidence to show that the link of between the firms formed by the shared director
is key to this predictability. This evidence culminates with our finding that the return
27

Table X Abnormal Board-Linked Stock Returns With Links Restricted to Ex-treme Insider Trades This table shows monthly abnormal returns for value-weighted portfolios ofboard-linked stocks intersected with extreme insider trades. In month t (returns at t + 1), stocks are as-signed to one of five portfolios based on the equal-weighted portfolio of the five-factor model’s idiosyncraticreturns of all stocks with which the firm shares at least one director in month t. Within each portfolio,stocks are ranked in five quintiles based on the linked stocks’ opportunistic insider trades during month t. Inthe Q1 (low) portfolio, stocks are retained only if one of its linked stocks has an opportunistic trade (sell) inthe lowest quintile of insider trades. In the Q5 (high) portfolio, stocks are retained only if one of its linkedstocks has an opportunistic trade (buy) in the highest quintile of insider trades. Insider trades are definedas opportunistic if the insider has not traded in the same month in any of the 3 years prior (Cohen et al.,2012). The five portfolios are rebalanced monthly to maintain value-weighting. Alpha is the intercept ona regression of the monthly excess return for the portfolio using various asset pricing models. The modelsinclude the CAPM 1-factor model, the Fama and French (1993) 3-factor model, and the 3-factor modelaugmented with momentum of Carhart (1997) and liquidity of Pastor and Stambaugh (2003). L/S is thealpha of a portfolio that is long the highest quintile and short the lowest quintile. Alphas are in monthlypercent and t-statistics are shown in parentheses below the coefficient estimates.
Value Weights Q1(Low) Q5(High) L/S
Excess Returns -0.146 1.144 1.290(-0.294) (2.005) (2.539)
1-Factor Alpha -0.647 0.576 1.223(-1.910) (1.450) (2.401)
3-Factor Alpha -0.609 0.593 1.202(-1.787) (1.490) (2.334)
4-Factor Alpha -0.615 0.695 1.309(-1.788) (1.752) (2.541)
5-Factor Alpha -0.579 0.669 1.249(-1.660) (1.663) (2.388)
28

predictability is concentrated in periods with trading by the linked director. Restricting the
sample to the top and bottom quintiles of these directors’ trades, more than doubles the
alpha on the strategy to 15% per year.
Delayed price discovery suggests that event studies aimed at measuring the importance
of boards’ actions can understate the true effect of boards. That the returns of board-
linked firms eventually move together after a one month delay provides additional evidence
that the common actions of boards influence firm value. Moreover, the dissipation of the
predictability after a one-month lag suggests that event study windows should be expanded
from the common window of days to one month or more. Finally, we show a new way in
which shared directors attempt to trade opportunistically on their knowledge of the joint
prospects of the firms on whose boards they sit.
29
REFERENCES
Adams, Renee B, Benjamin E Hermalin, and Michael S Weisbach, 2010, The role of boards
of directors in corporate governance: A conceptual framework and survey, Journal of
Economic Literature 48, 58–107.
Bizjak, John, Michael Lemmon, and Ryan Whitby, 2009, Option backdating and board
interlocks, Review of Financial Studies .
Brown, Jennifer L, 2011, The spread of aggressive corporate tax reporting: A detailed exam-
ination of the corporate-owned life insurance shelter, The Accounting Review 86, 23–57.
Burt, Aaron, and Christopher Hrdlicka, 2016, Understanding network-based measures of
information diffusion, Working Paper.
Cao, Jie, Tarun Chordia, and Chen Lin, 2015, Alliances and return predictability, Journal
of Fiancial and Quantitative Analysis.
Carhart, Mark M, 1997, On persistence in mutual fund performance, Journal of Finance 52,
57–82.
Chiu, Peng-Chia, Siew Hong Teoh, and Feng Tian, 2013, Board interlocks and earnings
managment contagion, Accounting Review .
Cohen, Lauren, and Andrea Frazzini, 2008, Economic links and predictable returns, Journal
of Finance 63, 1977–2011.
Cohen, Lauren, Christopher Malloy, and Lukasz Pomorski, 2012, Decoding inside informa-
tion, The Journal of Finance 67, 1009–1043.
Davis, Gerald F, 1991, Agents without principles? the spread of the poison pill through the
intercorporate network, Administrative science quarterly 583–613.
Davis, Gerald F, and Henrich R Greve, 1997, Corporate elite networks and governance
changes in the 1980s, American journal of sociology 103, 1–37.
Fama, Eugene F., and Kenneth R. French, 1993, Common risk factors in the returns on
stocks and bonds, Journal of Financial Economics 33, 3–56.
Fama, Eugene F., and Kenneth R. French, 1996, Multifactor explanations of asset pricing
anomalies, Journal of Finance 51, 55–84.
30
Ferris, Stephen P, Murali Jagannathan, and Adam C Pritchard, 2003, Too busy to mind
the business? monitoring by directors with multiple board appointments, The Journal of
Finance 58, 1087–1112.
Fich, Eliezer M., and Anil Shivdasani, 2007, Financial fraud, director reputation, and share-
holder wealth, Journal of Financial Economics .
Fich, Eliezer M., and Anil Shivdsani, 2006, Are busy boards effective monitors?, Journal of
Finance .
Gulati, Ranjay, and James D Westphal, 1999, Cooperative or controlling? the effects of
ceo-board relations and the content of interlocks on the formation of joint ventures, Ad-
ministrative Science Quarterly 44, 473–506.
Haunschild, Pamela R., 1993, Interorganizational imitation: the impact of interlocks on
corporate acquisition activity, Administrative Science Quarterly .
Haunschild, Pamela R., 1994, How much is that company worth?: Interoganizational rela-
tionships, uncertainty, and acquisition premiums, Administrative Science Quarterly .
Hermalin, Benjamin E., and Michael S. Weisbach, 2003, Boards of directors as an endoge-
nously determined institution: A survey of the economic literature, Economic Policy Re-
view .
Hou, Kewei, 2007, Industry information diffusion and the lead-lag effect in stock returns,
Review of Financial Studies 20, 1113–1138.
Lo, Andrew W., and A. Craig MacKinlay, 1990, When are contrarian profits due to stock
market overreaction?, Review of Financial Studies 3, 175–205.
Menzly, Lior, and Oguzhan Ozbas, 2004, Cross-industry momentum (presented at 2005 AFA
Meetings in Philadelphia, PA) Working Paper.
Menzly, Lior, and Oguzhan Ozbas, 2010, Market segmentation and cross-predictability of
returns, The Journal of Finance 65, 1555–1580.
Pastor, Lubos, and Robert F Stambaugh, 2003, Liquidity risk and expected stock returns,
Journal of Political Economy 111, 642–685.
Rao, Hayagreeva, Gerald F Davis, and Andrew Ward, 2000, Embeddedness, social iden-
tity and mobility: Why firms leave the nasdaq and join the new york stock exchange,
Administrative Science Quarterly 45, 268–292.
31

Reppenhagen, David A, 2010, Contagion of accounting methods: Evidence from stock option
expensing, Review of accounting studies 15, 629–657.
Stuart, Toby E., and Soojin Yim, 2010, Board interlocks and the propensity to be targeted
in private equity transactions, Journal of Financial Economics .
32