return to mercury: an overview of the messenger spacecraft ... · return to mercury: an overview of...
TRANSCRIPT

1
TFAWS2012-PT-03
RETURN TO MERCURY: AN OVERVIEW OF THE MESSENGER SPACECRAFT THERMAL CONTROL SYSTEM DESIGN AND
UPDATE ON ORBITAL FLIGHT PERFORMANCE
Carl J. Ercol,1 Shawn M. Begley,
2 and G. Allan Holtzman
3
At 01:00 UTC on March 18, 2011, the MErcury Surface, Space ENvironment,
GEochemistry, and Ranging (MESSENGER) spacecraft became the first to
achieve orbit around the planet Mercury. Designed and built by The Johns
Hopkins University Applied Physics Laboratory in conjunction with the
Carnegie Institution of Washington, MESSENGER was launched on August 3,
2004, and has recently completed its primary mission of a one-year orbital phase
to study Mercury. Currently, MESSENGER is in the initial portion of a yearlong
extended mission to gather more science with an orbit period that was shortened
from 12 to 8 hours. Before orbit injection at Mercury, the spacecraft completed a
seven-year cruise phase that included a flyby of the Earth (August 2005), two
flybys of Venus (October 2006 and June 2007), and three flybys of Mercury
(January and October 2008 and October 2009). The January 2008 Mercury flyby
marked the first spacecraft visit to Mercury since Mariner 10 (1975) and made
MESSENGER the first spacecraft to encounter Mercury near the planet’s
perihelion. This paper will provide an overview of the thermal design challenges
for both the cruise and orbital phases and the flight temperature and power data
that verify the performance of the mission thermal control subsystem to date.
INTRODUCTION
The MErcury Surface, Space ENvironment, GEochemistry, and Ranging (MESSENGER)
mission has been characterizing Mercury in detail by observing the planet from orbit for one
Earth year. Although it had long been desired to follow the Mariner 10 flybys with an orbital
mission, early studies had deemed this type of mission infeasible, or at least prohibitively
expensive because of mass and thermal constraints. MESSENGER utilized a trajectory,
discovered by analysts at the Jet Propulsion Laboratory (JPL) [1, 2] and later refined by analysts
at The Johns Hopkins University Applied Physics Laboratory (APL), in which flybys of Earth,
Venus, and Mercury itself, interspersed with five large deterministic deep-space maneuvers
(DSMs), positioned the spacecraft for its successful Mercury orbit insertion (MOI) on March 18,
2011 (see Figure 1).
1Thermal Design and Operations Lead Engineer, The Johns Hopkins University Applied Physics Laboratory, 11100
Johns Hopkins Road, Laurel, MD 20723. 2Instrument Operations and Analysis Thermal Lead, The Johns Hopkins University Applied Physics Laboratory, 11100
Johns Hopkins Road, Laurel, MD 20723. 3Spacecraft Analysis and Operations Thermal Lead, The Johns Hopkins University Applied Physics Laboratory, 11100
Johns Hopkins Road, Laurel, MD 20723.

2
Figure 1. Shown is the variation in spacecraft-to-Sun distance as a function of elapsed mission day
during the MESSENGER mission. Key mission events are highlighted. Currently, MESSENGER is
approximately at the midpoint of its first extended orbit mission. EFB, Earth flyby; M1–M3,
Mercury flybys 1–3; MET, mission elapsed time; V1 and V2, Venus flybys 1 and 2.
The highly varying thermal environments expected during the cruise and Mercury orbital phases
were a key engineering challenge in the spacecraft design. Driven by solar distances as small as
0.30 AU, the spacecraft thermal protection is accomplished with a large sunshade that shields most
spacecraft components from direct solar exposure and allows them to operate at conditions typical
of other interplanetary spacecraft. The orbital geometry as a function of Mercury true anomaly
(MTA) was chosen via comprehensive thermal environment analysis to minimize the thermal
hazards on the dayside of Mercury [3] by factoring analytical thermal constraints into the mission
design. While in orbit, MESSENGER experiences steady-state heating from the Sun and transient
heating from Mercury, both of which are functions of Mercury’s solar distance, which varies
between 0.3 AU (perihelion) and 0.46 AU (aphelion). Because most of the spacecraft hardware is
protected by the sunshade, no specialized thermal designs were required. Certain hardware (the
solar panels, sunshade, phased-array and low-gain antennas, and Digital Sun Sensor [DSS] heads) is
continuously exposed to the Sun throughout the mission and was specially designed to handle the
temperatures and solar flux input experienced at 0.3 AU [4–7].
The MESSENGER mission is a collaboration between the Carnegie Institution of Washington
(CIW) and APL and was selected as the seventh mission in NASA’s Discovery Program, with a
formal project start in January 2000. The spacecraft engineering and science instrument design
evolved over the three-year period from January 2000 to spring 2003. Assembly and integration
of the spacecraft began in February 2003, and testing continued up to launch in August 2004.
Orbital operations are now supported from the Mission Operations Center at APL with
communications through NASA’s Deep-Space Network (DSN) antennas.

3
Figure 2. The MESSENGER spacecraft and flight coordinate system.
OVERVIEW OF SPACECRAFT THERMAL DESIGN
The thermal design and operation of the MESSENGER spacecraft addressed three mission
phases: outer cruise, inner cruise, and Mercury orbit. During the inner cruise and orbital phases,
the thermal design relies on a ceramic-cloth sunshade to protect the vehicle from the intense
solar environment encountered when inside of 0.95 AU. As shown in Figure 2, the sunshade
creates a benign thermal environment when oriented with the –Y axis pointed toward the Sun,
allowing for the use of standard electronics and electrical components and thermal blanketing
materials. The solar arrays, sunshade, DSSs, and phased-array antennas, which are shown in
Figures 3 and 4, are Sun-exposed components that required nonstandard thermal design and
specialized construction. These components have been designed to operate throughout the
Mercury year and also during orbits that cross over one of Mercury’s two “hot poles” that face
the Sun at Mercury perihelion. When at spacecraft perihelion, the sunshade, solar arrays,
sunshade-mounted DSSs, and sunshade-mounted antenna suite experience as much as 11 times
the solar radiation near Earth. During this time, the sunshade temperature rises to greater than
300°C. In certain orbits around Mercury, the spacecraft passes between the Sun and the
illuminated planet for ~30 minutes. During this period, the sunshade protects the spacecraft from
direct solar illumination, but the back of the spacecraft is exposed to the hot Mercury surface.
Components such as the battery and star trackers are positioned such that the spacecraft body
blocks a substantial portion of the planet view, minimizing direct radiation from the planet
surface when the spacecraft is in nominal operation. High-power spacecraft electronics that
require dedicated radiators could not be packaged in a manner similar to that of the battery to
reduce environmental heating from Mercury. These electronics boxes instead required
specialized thermal design to allow for full, unrestricted operation during all parts of the orbital
Magnetometer
Propellant tank
(1 of 3)Launch Vehicle
AdapterSolar Array
(back)
Front Phased-Array and
Fanbeam Antennas
Low-gain AntennasBattery Sunshade
Large Velocity Adjust
(LVA) Thruster
Helium Tank
Star Trackers
Back Phased-Array,
Fanbeam, and Low-gain
Antennas
Magnetometer
Propellant tank
(1 of 3)Launch Vehicle
AdapterSolar Array
(back)
Front Phased-Array and
Fanbeam Antennas
Low-gain AntennasBattery Sunshade
Large Velocity Adjust
(LVA) Thruster
Helium Tank
Star Trackers
Back Phased-Array,
Fanbeam, and Low-gain
Antennas
+Y
+XPitch
Roll
Yaw
+Z
Pitch
Nominal (Anti-Sun)
Roll
Yaw
Magnetometer
Propellant tank
(1 of 3)Launch Vehicle
AdapterSolar Array
(back)
Front Phased-Array and
Fanbeam Antennas
Low-gain AntennasBattery Sunshade
Large Velocity Adjust
(LVA) Thruster
Helium Tank
Star Trackers
Back Phased-Array,
Fanbeam, and Low-gain
Antennas
Magnetometer
Propellant tank
(1 of 3)Launch Vehicle
AdapterSolar Array
(back)
Front Phased-Array and
Fanbeam Antennas
Low-gain AntennasBattery Sunshade
Large Velocity Adjust
(LVA) Thruster
Helium Tank
Star Trackers
Back Phased-Array,
Fanbeam, and Low-gain
Antennas
+Y
+XPitch
Roll
Yaw
+Z
Pitch
Nominal (Anti-Sun)
Roll
Yaw
+Y
+XPitch
Roll
Yaw
+Z
Pitch
Nominal (Anti-Sun)
Roll
Yaw
4
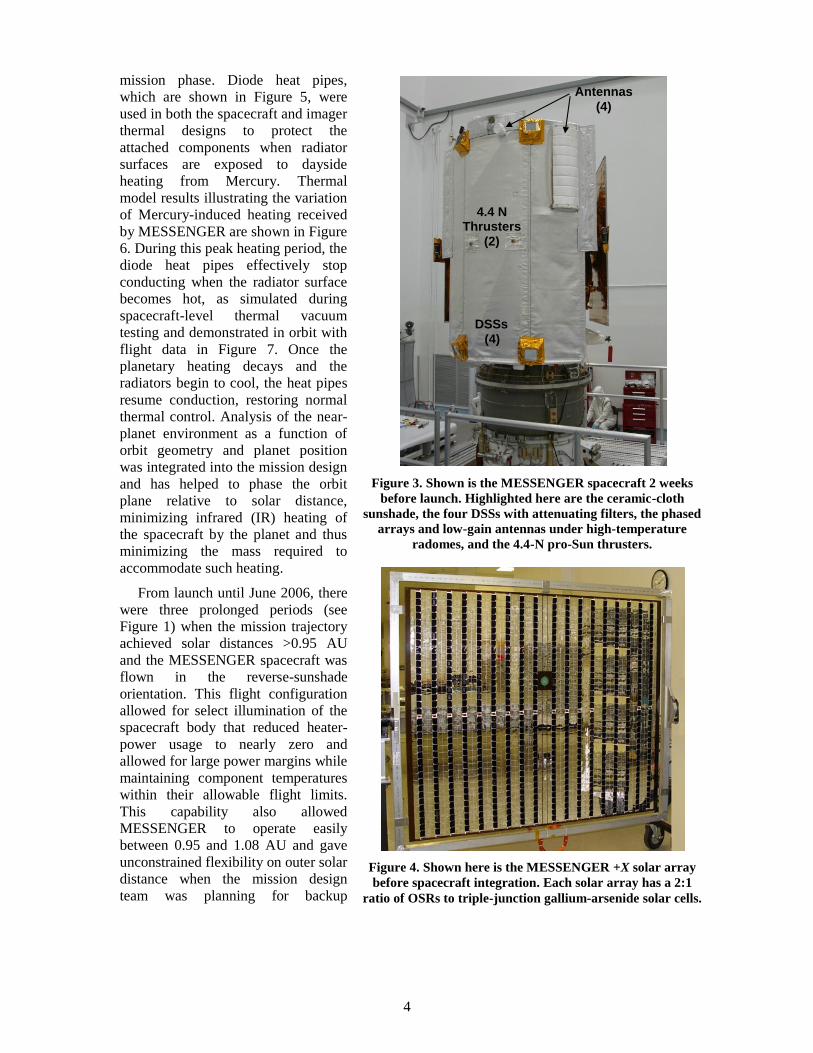
mission phase. Diode heat pipes,
which are shown in Figure 5, were
used in both the spacecraft and imager
thermal designs to protect the
attached components when radiator
surfaces are exposed to dayside
heating from Mercury. Thermal
model results illustrating the variation
of Mercury-induced heating received
by MESSENGER are shown in Figure
6. During this peak heating period, the
diode heat pipes effectively stop
conducting when the radiator surface
becomes hot, as simulated during
spacecraft-level thermal vacuum
testing and demonstrated in orbit with
flight data in Figure 7. Once the
planetary heating decays and the
radiators begin to cool, the heat pipes
resume conduction, restoring normal
thermal control. Analysis of the near-
planet environment as a function of
orbit geometry and planet position
was integrated into the mission design
and has helped to phase the orbit
plane relative to solar distance,
minimizing infrared (IR) heating of
the spacecraft by the planet and thus
minimizing the mass required to
accommodate such heating.
From launch until June 2006, there
were three prolonged periods (see
Figure 1) when the mission trajectory
achieved solar distances >0.95 AU
and the MESSENGER spacecraft was
flown in the reverse-sunshade
orientation. This flight configuration
allowed for select illumination of the
spacecraft body that reduced heater-
power usage to nearly zero and
allowed for large power margins while
maintaining component temperatures
within their allowable flight limits.
This capability also allowed
MESSENGER to operate easily
between 0.95 and 1.08 AU and gave
unconstrained flexibility on outer solar
distance when the mission design
team was planning for backup
Figure 3. Shown is the MESSENGER spacecraft 2 weeks
before launch. Highlighted here are the ceramic-cloth
sunshade, the four DSSs with attenuating filters, the phased
arrays and low-gain antennas under high-temperature
radomes, and the 4.4-N pro-Sun thrusters.
Figure 4. Shown here is the MESSENGER +X solar array
before spacecraft integration. Each solar array has a 2:1
ratio of OSRs to triple-junction gallium-arsenide solar cells.
DSSs
(4)
Antennas
(4)
4.4 N Thrusters
(2)

5
missions that introduced different mission trajectories and outer solar-distance excursions without
complicating the spacecraft thermal or power designs. To achieve acceptable temperature control,
spacecraft radiator surfaces used to maintain temperature for the battery and other critical
electrical components were always kept orthogonal to the Sun, while ~25% of the spacecraft
multi-layer insulation (MLI), the helium tank, and most of the thrusters were fully illuminated.
Because this flight configuration was designed exclusively to minimize the effects of solar
distance on the spacecraft power and thermal subsystem designs, certain operational constraints
were enforced to prevent temperature excursions above the allowable flight limits for some
components. Steady-state Sun elevation and yaw angles were limited to a ±5 cone centered
along the spacecraft +Y axis (the principal axis corresponding to the Magnetometer boom) so as
to reduce solar exposure of spacecraft radiators and mitigate solar trapping inside of the adapter
and the star tracker baffles. Because of the high thermal time constant for the spacecraft, transient
events of less thangreater thanless than2 hours requiring Sun angle excursions outside of the ±5
cone were acceptable and allowed for complete flexibility when performing spacecraft propulsive
maneuvers, certain instrument calibrations, and post-launch hardware-commissioning activities.
Figure 5. Diode heat pipes were used to protect high-power electronics requirements during the
Mercury orbit phase. The PSE, shown here, required dedicated radiators. Because the MESSENGER
structure was fabricated from a composite with a small coefficient of thermal expansion, a slip-mount
design was used to fasten electronics boxes to the structure, and integral thermal vias connect specified
electronics boxes directly to the heat pipes. S/C, spacecraft.
Condenser Radiator
TTyyppiiccaall MM5555JJ DDeecckk
HHeeaatt PPiippeess
TThheerrmmaall VViiaass
TTyyppiiccaall
PPoowweerr
BBooxx
•Slip •Washer
•Chassis
•S/C •Deck
•Insert

6
Figure 6. Shown is the predicted incident thermal flux emitted by Mercury as seen at different
locations on the spacecraft. Spacecraft thermal-control radiators are located in the –Z and ±X
directions.
Figure 7. Shown is the PSE orbital temperature response during the first hot season of Mercury year
three. The planetary heating on the PSE radiator increased sharply near September 29, 2011, at
10:30 UTC, causing the diode heat pipes to shut down and keeping the PSE comfortably cool.
17.6 18.1
-10
0
10
20
30
40
50
60
Tem
per
atu
re (
°C)
PSE baseplate
PSE radiator

7
Once power margins were deemed to be acceptable, the inner cruise phase began on March 8,
2005, when MESSENGER was transitioned into the nominal sunshade-to-Sun orientation from
the reverse-sunshade orientation that had been maintained since launch. It was apparent within
the first 24 hours from the transition that the sunshade was extremely effective at insulating the
spacecraft from the Sun. The nominal spacecraft power of ~220 W that was experienced when in
the reverse-sunshade configuration more than doubled as dormant heaters became active (as
shown in Figure 8). MESSENGER relies on heater power to keep components within allowable
flight temperature limits, and because approximately one-half of spacecraft launch mass was
propellant, the biggest user of heater power was the propulsion system.
Figure 8. Power lean near Earth’s solar distance, the MESSENGER spacecraft was designed to be
maneuvered so as to illuminate the spacecraft body, represented by the back-to-Sun label, as a means
to reduce heater-power demand. When the power margin was adequate, the spacecraft was
maneuvered into the shade-to-Sun (nominal flight attitude) orientation. As shown, the power
difference between the two Sun orientations was ~220 W. MET, mission elapsed time.
Battery temperature control relies on two redundant heater circuits that are independently
controlled by single mechanical thermostats. Heater control is augmented with 5 W of internal
heat dissipation resulting from the constant trickle charge rate that maintains the battery at 100%
state of charge. During reverse-sunshade orientation when the spacecraft was near 1.0 AU, the
battery was maintained at less than0°C with trickle charge and a small amount of heater power.
When the spacecraft was flipped and the sunshade was oriented toward the Sun, the battery
temperature was maintained at a nearly constant temperature of approximately 5°C with 32 W
of heater power and 5 W of trickle charge. As the solar distance decreased from near 1.0 AU to
0.63 AU, battery temperature increased from 5°C to approximately 1C with the primary
heater at 100% duty cycle. Once inside of 0.63 AU, the battery temperature cycled between 5C
and 1C with the duty cycle varying as a function of solar distance (Table 1). To date, including
more than five Mercury years in orbit, the MESSENGER battery has been maintained below
0
200
400
600
800
1000
1200
1400
0 100 200 300 400 500 600 700
Po
we
r (W
)
MET (Days Since Launch)
Measured
Load Power
Predicted Power Available
Spacecraft to Loads
Shade-to-Sun Shade-to-Sun
Back-to-Sun Back-to-Sun

8
15C. Peak battery heating occurs during the eclipsing noon–midnight orbital conditions when
the spacecraft passes between the Sun and the planet.
Table 1. Duty cycle variation in relation to solar distance
Solar Distance (AU) Heater Duty Cycle (%)
>0.65 100
0.63 93
0.56 89
0.50 81
0.42 70
0.39 51
0.31 34
During inner cruise, the battery-heater duty cycle is affected by sunshade frontal temperature, which is a
function of solar distance. When the spacecraft was flown in the reverse-sunshade orientation during outer
cruise, the battery-heater duty cycle averaged between 0% and 20%.
Mounted on the sunshade frame are four DSSs, three low-gain antennas, and the combined
phased-array and fan-beam antenna assembly. To provide the spacecraft with hemispherical and
directional antenna coverage along with a Sun-safe attitude determination, these components
view the Sun continuously and were thermally designed and tested to meet all operational
requirements when near the Earth and when at Mercury perihelion. The temperatures of these
components as functions of solar distance are shown in Figure 9. It can be seen that the
temperature increase of each component follows an inverse-squared-distance law.
Figure 9. The sunshade-mounted components (see Figure 3) behaved nominally as solar distance
decreased. Comprehensive solar-simulation testing at the NASA Glenn Research Center (GRC)
Tank 6 facility ensured that these components were designed to operate properly in MESSENGER’s
high-solar-flux environment without any surprises.
As with the sunshade-mounted components, the solar arrays always receive direct illumination
from the Sun and had to be designed to operate and survive over a very broad range of

9
environments. Thermal control of the solar arrays is managed by using a 2:1 packing factor ratio
of optical solar reflectors (OSRs) to triple-junction gallium-arsenide solar cells (Figure 4)
combined with an ability to rotate each solar array independently. The off-normal tilting reduces
the effective solar constant in proportion to the cosine of the angle of incidence. The thermal
design of each panel, and hence the design driver for packing factor, allows for steady-state
survivability at any Sun angle at any mission solar distance. Solar-array operation is discussed in
more detail below.
The spacecraft electronics are mounted to the composite structure and, except for radiators and
apertures, are completely covered with MLI. Complete spacecraft coverage with MLI, although
attractive from the perspectives of heater power and coupled thermal mass, was not feasible, so
electronics boxes dissipating, on average, greater than 20 W have dedicated radiators. These
radiators effectively keep the connected electronics boxes cool and, in conjunction with MLI heat
leakage, help to keep the rest of the spacecraft at benign temperatures. The Power System
Electronics (PSE) and Inertial Measurement Unit (IMU) are located on the –X side of the
spacecraft, and the two Integrated Electronic Modules (IEMs), the Power Distribution Unit
(PDU), and the Solar Array Junction Box (SAJB) are located on the +X side of the spacecraft.
The ±X-side-panel radiator components increase the temperature by ~10°C, as a result of thermal
coupling to the solar arrays, as the solar flux changes by one order of magnitude. The Advanced
Star Tracker (AST), located on the –Z deck, is unaffected by solar distance. Because the
propulsion tanks are always under positive heater control, the heater duty cycle decreases as solar
distance decreases and/or spacecraft electronics dissipation increases, keeping the main fuel tanks
at nearly constant temperature. Because thermal performance of the MESSENGER spacecraft
during inner and outer cruise phase has been comprehensively summarized [8–12], the remainder
of this paper will focus on the orbital phase of the mission.
ORBITAL ENVIRONMENTS OVERVIEW
Mercury’s highly eccentric 88-day heliocentric orbit causes the solar flux to vary between 4.7
suns (planet aphelion, 0.46 AU) and 11.1 suns (planet perihelion, 0.30 AU), where one sun is
equivalent to the nominal solar constant at Earth. Also, Mercury rotates once every 59 days,
causing the planet surface temperature to reach steady temperature conditions. Because
Mercury’s surface absorbs between 90% and 94% of the incident solar radiation, the planet
reradiates the equivalent absorbed solar energy in the IR spectrum, creating an extremely harsh
IR thermal environment for a spacecraft in orbit or passing close by. The maximum surface
temperature at the subsolar point when at Mercury perihelion is ~430°C; the temperature
decreases ~300°C at aphelion as the surface temperature distribution and corresponding
reradiated heat drop off as a function of the cosine law from the subsolar point to the dawn–dusk
terminator. When the spacecraft is in the vicinity of the terminator or is in eclipse over the
nightside, the planet’s surface temperature is –180°C, which is independent of solar distance and
drives the thermal environment. The planet surface temperature distribution and corresponding
reradiated IR flux distribution as seen by the spacecraft are functions of both solar distance and
orbit plane position from the subsolar point. Once in orbit at Mercury, a spacecraft’s orbit plane is
relatively inertial with respect to the Sun; however, gravitational forces from Mercury and the
Sun cause the orbital line of apsides to rotate around Mercury, changing the local position of the
orbit periapsis relative to the subsolar point (Figure 10).
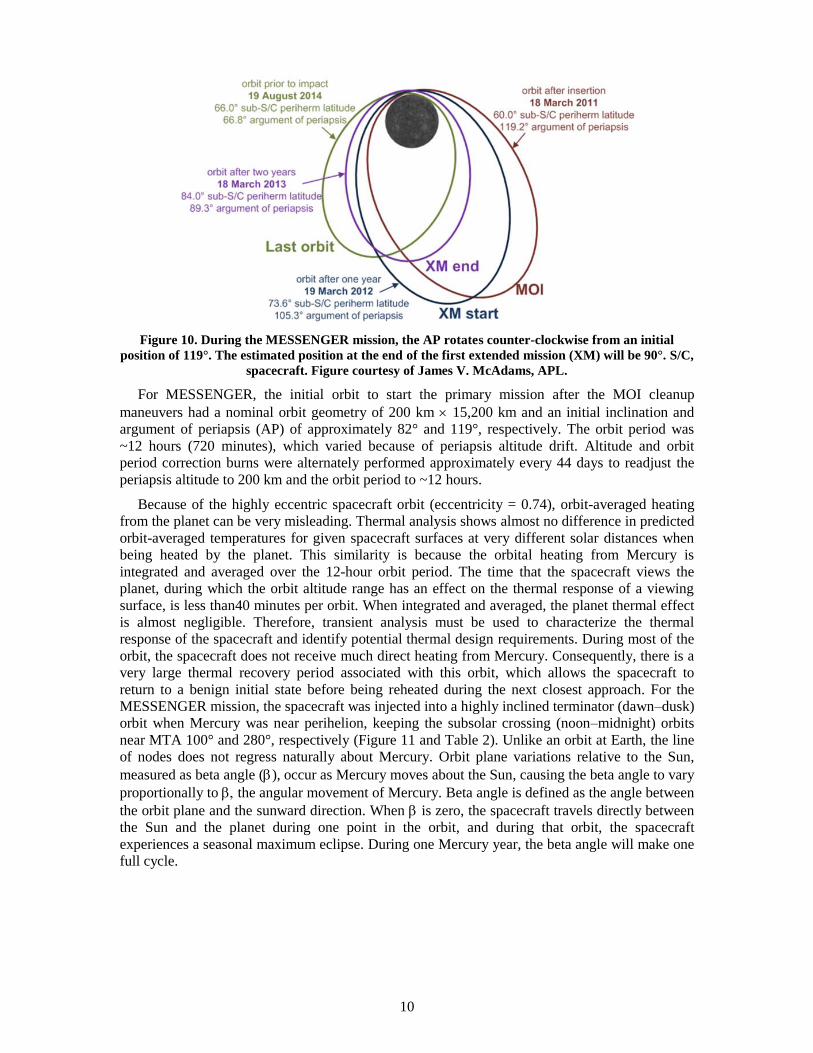
10
Figure 10. During the MESSENGER mission, the AP rotates counter-clockwise from an initial
position of 119°. The estimated position at the end of the first extended mission (XM) will be 90°. S/C,
spacecraft. Figure courtesy of James V. McAdams, APL.
For MESSENGER, the initial orbit to start the primary mission after the MOI cleanup
maneuvers had a nominal orbit geometry of 200 km 15,200 km and an initial inclination and
argument of periapsis (AP) of approximately 82° and 119°, respectively. The orbit period was
~12 hours (720 minutes), which varied because of periapsis altitude drift. Altitude and orbit
period correction burns were alternately performed approximately every 44 days to readjust the
periapsis altitude to 200 km and the orbit period to ~12 hours.
Because of the highly eccentric spacecraft orbit (eccentricity = 0.74), orbit-averaged heating
from the planet can be very misleading. Thermal analysis shows almost no difference in predicted
orbit-averaged temperatures for given spacecraft surfaces at very different solar distances when
being heated by the planet. This similarity is because the orbital heating from Mercury is
integrated and averaged over the 12-hour orbit period. The time that the spacecraft views the
planet, during which the orbit altitude range has an effect on the thermal response of a viewing
surface, is less than40 minutes per orbit. When integrated and averaged, the planet thermal effect
is almost negligible. Therefore, transient analysis must be used to characterize the thermal
response of the spacecraft and identify potential thermal design requirements. During most of the
orbit, the spacecraft does not receive much direct heating from Mercury. Consequently, there is a
very large thermal recovery period associated with this orbit, which allows the spacecraft to
return to a benign initial state before being reheated during the next closest approach. For the
MESSENGER mission, the spacecraft was injected into a highly inclined terminator (dawn–dusk)
orbit when Mercury was near perihelion, keeping the subsolar crossing (noon–midnight) orbits
near MTA 100° and 280°, respectively (Figure 11 and Table 2). Unlike an orbit at Earth, the line
of nodes does not regress naturally about Mercury. Orbit plane variations relative to the Sun,
measured as beta angle (), occur as Mercury moves about the Sun, causing the beta angle to vary
proportionally to the angular movement of Mercury. Beta angle is defined as the angle between
the orbit plane and the sunward direction. When is zero, the spacecraft travels directly between
the Sun and the planet during one point in the orbit, and during that orbit, the spacecraft
experiences a seasonal maximum eclipse. During one Mercury year, the beta angle will make one
full cycle.

11
Figure 11. Unlike a spacecraft in Earth orbit, the MESSENGER orbit plane is inertially fixed and
does not rotate about Mercury’s equator. The orbit plane position relative to the Sun will vary only
as a function of MTA.
Table 2. The relationship between MTA, solar distance, and MESSENGER orbit plane beta angle
MTA (°) Solar Distance (AU) Beta Angle (
0 0.300 78.0
10 0.309 83.3
20 0.311 78.0
30 0.316 68.9
40 0.323 59.3
50 0.327 49.5
60 0.337 39.7
70 0.347 29.8
80 0.358 19.9
90 0.370 9.9
100 0.387 0.0
110 0.398 –9.9
120 0.414 –19.9
130 0.428 –29.8
140 0.440 –39.7
150 0.453 –49.5
160 0.460 –59.3
170 0.466 –68.9
180 0.467 –78.0
190 0.464 –83.3
200 0.460 –78.0
210 0.450 –68.9
220 0.439 –59.3
230 0.427 –49.5
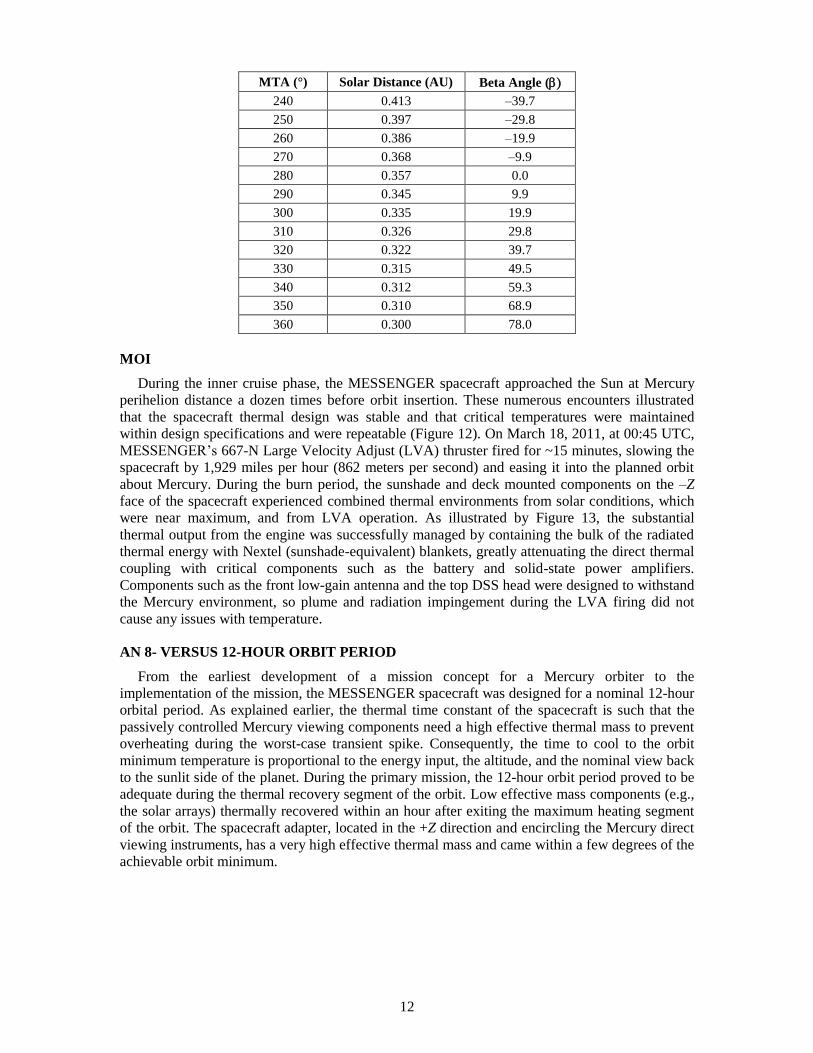
12
MTA (°) Solar Distance (AU) Beta Angle (
240 0.413 –39.7
250 0.397 –29.8
260 0.386 –19.9
270 0.368 –9.9
280 0.357 0.0
290 0.345 9.9
300 0.335 19.9
310 0.326 29.8
320 0.322 39.7
330 0.315 49.5
340 0.312 59.3
350 0.310 68.9
360 0.300 78.0
MOI
During the inner cruise phase, the MESSENGER spacecraft approached the Sun at Mercury
perihelion distance a dozen times before orbit insertion. These numerous encounters illustrated
that the spacecraft thermal design was stable and that critical temperatures were maintained
within design specifications and were repeatable (Figure 12). On March 18, 2011, at 00:45 UTC,
MESSENGER’s 667-N Large Velocity Adjust (LVA) thruster fired for ~15 minutes, slowing the
spacecraft by 1,929 miles per hour (862 meters per second) and easing it into the planned orbit
about Mercury. During the burn period, the sunshade and deck mounted components on the –Z
face of the spacecraft experienced combined thermal environments from solar conditions, which
were near maximum, and from LVA operation. As illustrated by Figure 13, the substantial
thermal output from the engine was successfully managed by containing the bulk of the radiated
thermal energy with Nextel (sunshade-equivalent) blankets, greatly attenuating the direct thermal
coupling with critical components such as the battery and solid-state power amplifiers.
Components such as the front low-gain antenna and the top DSS head were designed to withstand
the Mercury environment, so plume and radiation impingement during the LVA firing did not
cause any issues with temperature.
AN 8- VERSUS 12-HOUR ORBIT PERIOD
From the earliest development of a mission concept for a Mercury orbiter to the
implementation of the mission, the MESSENGER spacecraft was designed for a nominal 12-hour
orbital period. As explained earlier, the thermal time constant of the spacecraft is such that the
passively controlled Mercury viewing components need a high effective thermal mass to prevent
overheating during the worst-case transient spike. Consequently, the time to cool to the orbit
minimum temperature is proportional to the energy input, the altitude, and the nominal view back
to the sunlit side of the planet. During the primary mission, the 12-hour orbit period proved to be
adequate during the thermal recovery segment of the orbit. Low effective mass components (e.g.,
the solar arrays) thermally recovered within an hour after exiting the maximum heating segment
of the orbit. The spacecraft adapter, located in the +Z direction and encircling the Mercury direct
viewing instruments, has a very high effective thermal mass and came within a few degrees of the
achievable orbit minimum.

13
Figure 12. Shown here is flight temperature data of one of the four forward-facing DSSs and at the
battery. The temperature data are repeatable as a function of solar distance (Suns), indicating that
material properties are stable and not degrading. MET, mission elapsed time.
Figure 13. Shown is temperature data taken during the 15-minute MOI maneuver. Key components
such as the solid-state amplifiers and battery were barely affected, whereas the sunshade-mounted
low-gain antenna and upper DSS head saw measurable temperature rises.
-20
0
20
40
60
80
100
120
140
160
180
Tem
pe
ratu
re (°
C)
DSS head
Front low gain antenna
Battery
Solid State Power Amplifier

14
When options were being considered for an extension to the primary mission, one proposal
was to reduce the orbit period from 12 to 8 hours (480 minutes) by keeping periapsis at ~200 km
and reducing apoapsis from 15,200 km to ~10,000 km. The major benefit in going to the 8-hour
orbit is that the spacecraft experiences three orbits per day instead of two as well as greater
integrated time at lower altitude. The initial concern in moving to the shorter orbit period was that
the spacecraft would be adversely affected by the shorter orbit period and the potential of higher
background thermal radiation from Mercury due to the smaller effective orbit diameter.
Comprehensive system-level thermal analysis was performed to simulate the differences in the
two orbit geometries as well as time constant effects on spacecraft components. During the most
intense heating segment of each orbit, which occurs at the lowest altitudes, per Figure 14, the 8-
and 12-hour orbits are nearly identical, with the maximum calculated difference being less than
10% higher for the 8-hour orbit. During the recovery segment of the orbit when elapsed time and
spacecraft distance from Mercury factor into the temperature performance, thermal analysis
modeling both orbit scenarios as well as variation in AP were done. For the orbits being analyzed,
the drift in AP is the about the same and has to be factored into the analysis. Once again, looking
at a component that represents a low effective thermal mass, the solar arrays were analyzed for
both the 8- and 12-hour orbits. As illustrated by Figure 15, predictions show the solar-array
performance to be nearly identical for both orbit geometries when using the same angles for
operation and safe tilt. However, for a high effective thermal mass component such as the
adapter, per Figure 16, the difference in peak temperature increases ~10°C for the 8-hour orbit
compared with the 12-hour orbit. For the passively controlled adapter, Figures 14 and 16 also
illustrates the effect of AP shift on expected spacecraft heating and temperature. As shown, the
Out-Bound Season (OBS) and In-Bound Season (IBS) parts of the Mercury orbit effectively
“switch” relative to peak temperature profiles. The OBS is defined as going from Mercury
perihelion to Mercury aphelion (MTA 0° to 180°), and the IBS is defined as going from Mercury
aphelion to Mercury perihelion (MTA 180° to 0°). Because of gravitational effects, the orbit AP
rotates from 120° initially to 90 by the end of the extended mission. Because of the changing
orbit geometry, as the AP reduces over time, the peak temperature of the adapter will increase
during the OBS and decreases during the IBS.
Figure 14. During the maximum heating segment of each orbit, the 8- and 12-hour orbits are nearly
identical and independent of argument of periapsis (AP). TA, true anomaly.

15
Figure 15. As shown here, solar-array thermal performance is nearly identical for 8- and 12-hour
geometries for given angles for operation and safe tilt.
Figure 16. As the orbit AP rotates northward, the seasonal temperature profiles change as well. As
shown, the OBS and IBS parts of the Mercury year effectively “switch” relative to peak temperature
profiles during the lifetime of the mission.

16
Because the spacecraft had already completed the primary mission and analytical simulations
comparing the effects of 8- and 12-hour orbit periods showed an ~10°C difference in the peak
temperature during the highest heating portions of each OBS and IBS, it was decided to pursue
the 8-hour orbit geometry for the extended mission. On April 20, 2012, the MESSENGER
spacecraft completed the second of two maneuvers that reduced the orbital period from 12 hours
to 8 hours. The final orbit correction burn occurred at MTA 195°, near the start of the IBS for
Mercury year 5. The flight data depicted in Figure 17 show the 10°C peak difference in adapter
temperature for 8- and 12-hour orbits at MTA 267° environmental conditions. Spacecraft and
instrument performance is discussed further below.
Figure 17. The flight data depicted in this figure verify the 10°C peak difference in adapter
temperature that was predicted between 8- and 12-hour orbits at MTA 267° environmental
conditions.
Figure 18. Shown is a view of the spacecraft before launch, with solar arrays in stowed positions. It is
hypothesized that excessive IR trapping between the spacecraft and sunshade is contributing to the
RF connector temperature increase.

17
Figure 19. The thermal effects of a spacecraft roll around the Y axis (Sun line) were analyzed and
compared to the results of the nominal spacecraft attitude. Per the analysis, it was shown that by
biasing +X toward the planet, the –X and +Z thermal environments as seen by the antenna would be
sufficiently reduced to protect the antenna from thermal damage.
FRONT PHASED-ARRAY ANTENNA THERMAL MITIGATION
From flight data analyzed during the first 30 days of the mission, it was estimated that the
signal feeds for front phased-array and fan-beam antenna assembly could exceed qualification
temperatures at the highest thermal input, which would occur during the inbound portion of the
first hot season. As previously illustrated, the peak heating, especially on external spacecraft
components, was predicted to occur during the IBS when the spacecraft is near MTA 310°. No
electronics are affected, but the antenna feed assembly is soldered with SN63, which has a
melting temperature of ~180°C. As shown in Figure 18, the antenna is located around the
midpoint on the –X side of the sunshade. It is hypothesized that excessive IR caused by heat flux
along the –X and lesser +Z directions is being trapped between the spacecraft and sunshade and is
contributing to the radio frequency (RF) connector temperature increase. If signal continuity to
part of the phased-array antenna is lost, then antenna output during downlink would be lower in
proportion to the number of sticks that were compromised (1 stick = 1/8 gain to system or
~12.5% lower gain if damaged) [7]. If signal continuity is lost or degraded to the front fan-beam
antenna, the spacecraft would lose the ability to receive high-gain uplink for the part of the
mission when the spacecraft-to-Earth orbit geometry dictates the use of the front antenna
assembly. A mitigation plan that was devised to protect the antenna from the expected high
thermal flux while minimizing the effect on spacecraft normal operations was quickly studied and
implemented. Because the phased array was not transmitting and the attitude-dependent
instruments were not obtaining data during hottest points of the IBS orbits, the plan to protect the
antenna was to reduce the –X and +Z view to the planet during a window around periapsis
passage. Thermal analysis correlated to the first OBS antenna temperature data and spacecraft
attitude predicted that during the peak heat portion of the first IBS, the antenna could have easily
18
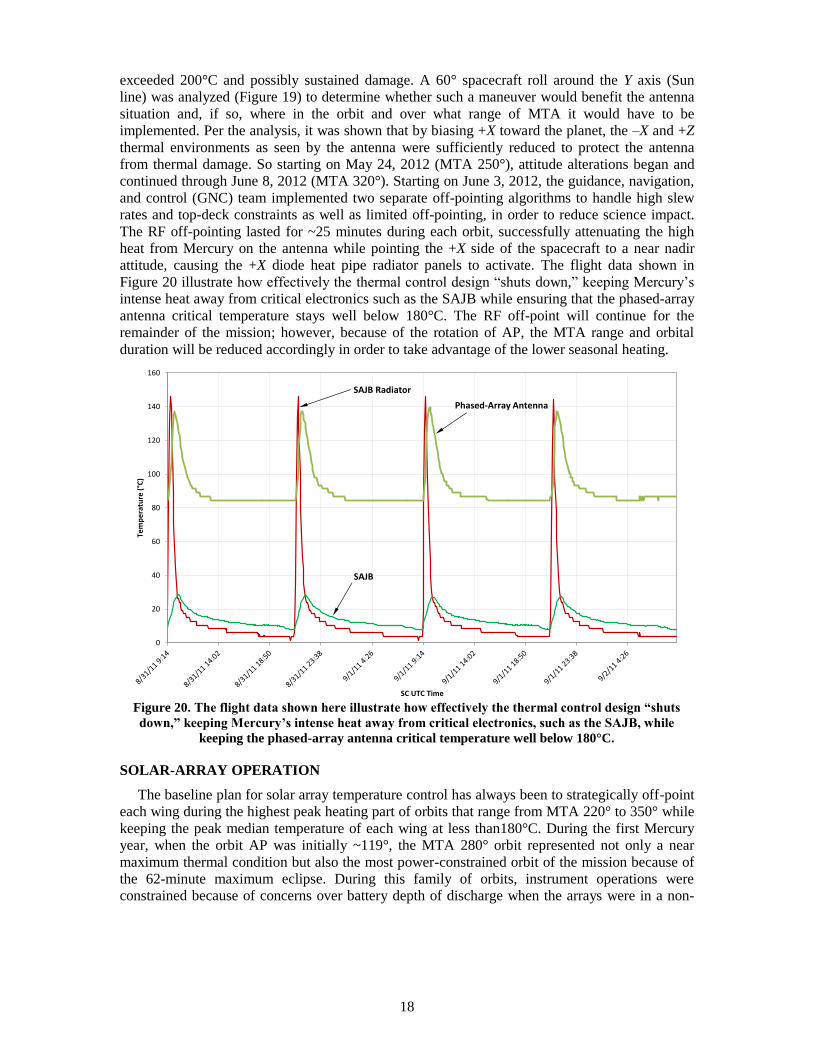
exceeded 200°C and possibly sustained damage. A 60° spacecraft roll around the Y axis (Sun
line) was analyzed (Figure 19) to determine whether such a maneuver would benefit the antenna
situation and, if so, where in the orbit and over what range of MTA it would have to be
implemented. Per the analysis, it was shown that by biasing +X toward the planet, the –X and +Z
thermal environments as seen by the antenna were sufficiently reduced to protect the antenna
from thermal damage. So starting on May 24, 2012 (MTA 250°), attitude alterations began and
continued through June 8, 2012 (MTA 320°). Starting on June 3, 2012, the guidance, navigation,
and control (GNC) team implemented two separate off-pointing algorithms to handle high slew
rates and top-deck constraints as well as limited off-pointing, in order to reduce science impact.
The RF off-pointing lasted for ~25 minutes during each orbit, successfully attenuating the high
heat from Mercury on the antenna while pointing the +X side of the spacecraft to a near nadir
attitude, causing the +X diode heat pipe radiator panels to activate. The flight data shown in
Figure 20 illustrate how effectively the thermal control design “shuts down,” keeping Mercury’s
intense heat away from critical electronics such as the SAJB while ensuring that the phased-array
antenna critical temperature stays well below 180°C. The RF off-point will continue for the
remainder of the mission; however, because of the rotation of AP, the MTA range and orbital
duration will be reduced accordingly in order to take advantage of the lower seasonal heating.
Figure 20. The flight data shown here illustrate how effectively the thermal control design “shuts
down,” keeping Mercury’s intense heat away from critical electronics, such as the SAJB, while
keeping the phased-array antenna critical temperature well below 180°C.
SOLAR-ARRAY OPERATION
The baseline plan for solar array temperature control has always been to strategically off-point
each wing during the highest peak heating part of orbits that range from MTA 220° to 350° while
keeping the peak median temperature of each wing at less than180°C. During the first Mercury
year, when the orbit AP was initially ~119°, the MTA 280° orbit represented not only a near
maximum thermal condition but also the most power-constrained orbit of the mission because of
the 62-minute maximum eclipse. During this family of orbits, instrument operations were
constrained because of concerns over battery depth of discharge when the arrays were in a non-
0
20
40
60
80
100
120
140
160
Tem
pe
ratu
re (
°C)
SC UTC Time
SAJB Radiator
SAJB
Phased-Array Antenna

19
power-producing orientation. Per the MTA 280°/AP 119° solar-array simulation shown in Figure
21, the solar arrays experience a 62-minute eclipse, during which the minimum temperature
reached is –110°C; this eclipse is followed by ~20 minutes of high-solar-intensity heating, during
which the battery is partially recharged, followed by the subsolar point crossing, near which orbit
periapsis is at ~60° north latitude and the solar arrays are edge-on to the Sun for ~25 minutes and
not generating power. As part of the ongoing power and thermal solar-array management, thermal
analysis is performed per Mercury year to account for orbit geometry differences induced by the
rotation on the line of apsides. Figure 22 is a comparison of the analysis done at the beginning of
the mission, when the initial AP was 119° and the orbit period was 12 hours, to what is expected
at the end of the first extended mission, when the AP is calculated to be 90° and the orbit period
will be 8 hours. At the beginning of the mission, no active solar-array control was performed
during the OBS, but as illustrated, in order to keep array temperatures in the desired range, the
wings will need to be off-pointed for ~30 minutes per orbit, from about MTA 30° to about MTA
140°. Note that the maximum eclipse for the OBS and IBS is still at MTA 100° and 280°,
respectively; but the maximum eclipse times have increased by ~10 minutes during the OBS and
decreased by ~22 minutes during the IBS as the AP increases from 119° to 90°.
Figure 21. During solar-array management, the objective is to keep the median peak array
temperature at less than180°C during the hottest part of the orbit. Per the solar-array simulation
shown, the solar arrays must be maintained edge-on to the Sun for ~25 minutes and, as a
consequence, does not generate power.
SPACECRAFT OPERATION AND PERFORMANCE SUMMARY
The thermal control system for the MESSENGER spacecraft has performed well during the
orbital phase of the mission. Since MOI, spacecraft temperatures and other housekeeping telemetry
have been processed and catalogued per orbit, and minimum, maximum, and orbit-average
temperatures have been published as a function of MTA for each Mercury year. This summary
information for the adapter, current to Mercury year 6 MTA 161° as of the time of this writing, is
0
10
20
30
40
50
60
70
80
90
100
-150
-100
-50
0
50
100
150
200
-100 -50 0 50 100 150 200So
lar
Arr
ay O
ff-P
oin
t A
ngl
e
Sola
r A
rray
Te
mp
era
ture
C
Time Since Eclipse (minutes)
!MEDIAN TEMP (C)
!SOL PANL ROT ANG

20
shown in Figure 23. The OBSs and IBSs, mentioned previously, can clearly be seen in the figure.
The temperatures at the peak of the OBS are seen to drift upward for each Mercury year, caused by
the drift in the orbit AP. The corresponding decrease in temperatures at the peak of the IBS for each
Mercury year is masked by attitude and operational constraints placed on the spacecraft during this
season, as well as the change to an 8-hour orbit around MTA 190° in Mercury year 5. When
plotting the temperature extremes per orbit as a function of MTA, the temperature response of any
given spacecraft component is seen against the backdrop of data from the previous Mercury year,
which is very useful in understanding the thermal state of the spacecraft.
Figure 22. A comparison of the analysis done at the beginning of the mission, when the initial AP was
119° and the orbit period was 12 hours, to what is expected at the end of the first extended mission,
when the AP is calculated to be 90° and the orbit period will be 8 hours. Note that the maximum
eclipse for the OBS and IBS is still at MTA 100° and 280°, respectively; however, the maximum
eclipse times have increased by ~10 minutes during the OBS and decreased by ~22 minutes during the
IBS as the AP increases from 119° to 90°.
The orbital temperature response of most spacecraft hardware is seen to be a strong function of
the spacecraft position and attitude in orbit, in addition to the season. In Figure 23, the adapter
temperature generally follows a smooth transition in and out of the OBSs and IBSs, with step
changes in temperatures at certain MTA values. For example, the temperatures drop steeply at
MTA 270° because of the imposed spacecraft off-pointing rules, mentioned previously. Early in
the orbital phase of the mission, specific scenarios were analyzed with the actual spacecraft
attitude profile through the use of the external spacecraft model in commercial thermal software
in order to better understand situations that occurred. Later in the mission, heat rates for all orbits
were run for the predicted spacecraft attitude profile and characterized in a similar fashion as the
temperature telemetry. To limit the large amount of data and processing time that these
calculations would entail, the bulk heat-rate processing was limited to the environmental heating

21
on the principal spacecraft directions (six faces of a cube). A code was written for this purpose to
integrate the IR heating from the planet surface, which varies in temperature according to the
solar direction vector, on the faces of a cube with the correct spacecraft position and attitude as a
function of time. The code also factors in the solar distance for the heating calculation,
determines the MTA value for each time step, contains a trigger to limit orbit steps yet include
any for which the position or attitude changes more than a given amount, and segregates the data
on the basis of orbit periapsis passage times to seamlessly fold the heat-rate data into the existing
temperature telemetry process. The heat rates for the +X direction are shown in the upper portion
of Figure 24, whereas the SAJB radiator temperatures are shown in the lower portion. A strong
correlation between the heat rates and temperatures is seen in the chart, a result that is expected
because the radiator is on the +X side of the spacecraft. Similar correlations are seen with other
spacecraft hardware, especially radiators. Note that heat-rate calculations extend beyond the
current time because they are calculated from the planned spacecraft attitude. This forecasting
allows the near-term plan for science and guidance and control for the spacecraft, as it is being
generated, to be directly evaluated for thermal concerns and modified accordingly. The small
black triangle in the figure indicates the time before which final spacecraft attitudes have been
processed, whereas the yellow triangle indicates the time beyond which only long-term spacecraft
attitude predictions have been processed.
Figure 23. The OBSs and IBSs, described in the text, can clearly be seen. The temperatures at the
peak of the OBS are seen to drift upward for each Mercury year, caused by the drift in the orbit AP.
The sharp temperature step change around MTA 270° is due to the spacecraft attitude adjustment
for RF off-pointing.
Using the post-processing techniques described here, it is apparent that the spacecraft thermal
performance is repeatable, predictable, and well understood. Furthermore, now that heat-rate
predictions are folded into the planning process, thermal constraints are resolved in greater detail
and early enough to allow for even more science measurements to be obtained.
-40
-20
0
20
40
60
80
100
120
Tem
pe
ratu
re (°
C)
MTA (degrees)
Y2 max Y2 min Y2 avg Y4 max Y4 min Y4 avg
Y5 max Y5 min Y5 avg Y6 max Y6 min Y6 avg
22
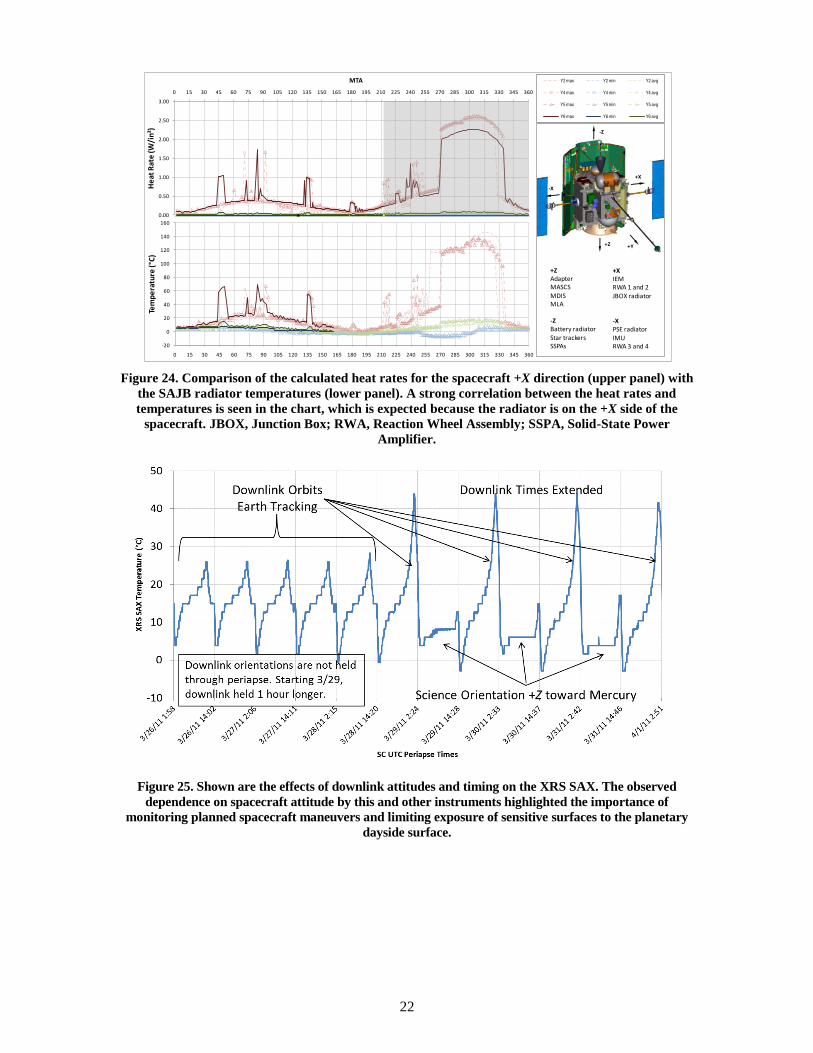
Figure 24. Comparison of the calculated heat rates for the spacecraft +X direction (upper panel) with
the SAJB radiator temperatures (lower panel). A strong correlation between the heat rates and
temperatures is seen in the chart, which is expected because the radiator is on the +X side of the
spacecraft. JBOX, Junction Box; RWA, Reaction Wheel Assembly; SSPA, Solid-State Power
Amplifier.
Figure 25. Shown are the effects of downlink attitudes and timing on the XRS SAX. The observed
dependence on spacecraft attitude by this and other instruments highlighted the importance of
monitoring planned spacecraft maneuvers and limiting exposure of sensitive surfaces to the planetary
dayside surface.
-20
0
20
40
60
80
100
120
140
160
0 15 30 45 60 75 90 105 120 135 150 165 180 195 210 225 240 255 270 285 300 315 330 345 360
Tem
pe
ratu
re (°
C)
Y2 max Y2 min Y2 avg
Y4 max Y4 min Y4 avg
Y5 max Y5 min Y5 avg
Y6 max Y6 min Y6 avg
0.00
0.50
1.00
1.50
2.00
2.50
3.00
0 15 30 45 60 75 90 105 120 135 150 165 180 195 210 225 240 255 270 285 300 315 330 345 360
He
at R
ate
(W/i
n²)
MTA
+Z
+X
-Z
-X
+Y
+ZAdapterMASCSMDISMLA
-ZBattery radiatorStar trackersSSPAs
+XIEMRWA 1 and 2JBOX radiator
-XPSE radiatorIMURWA 3 and 4
23
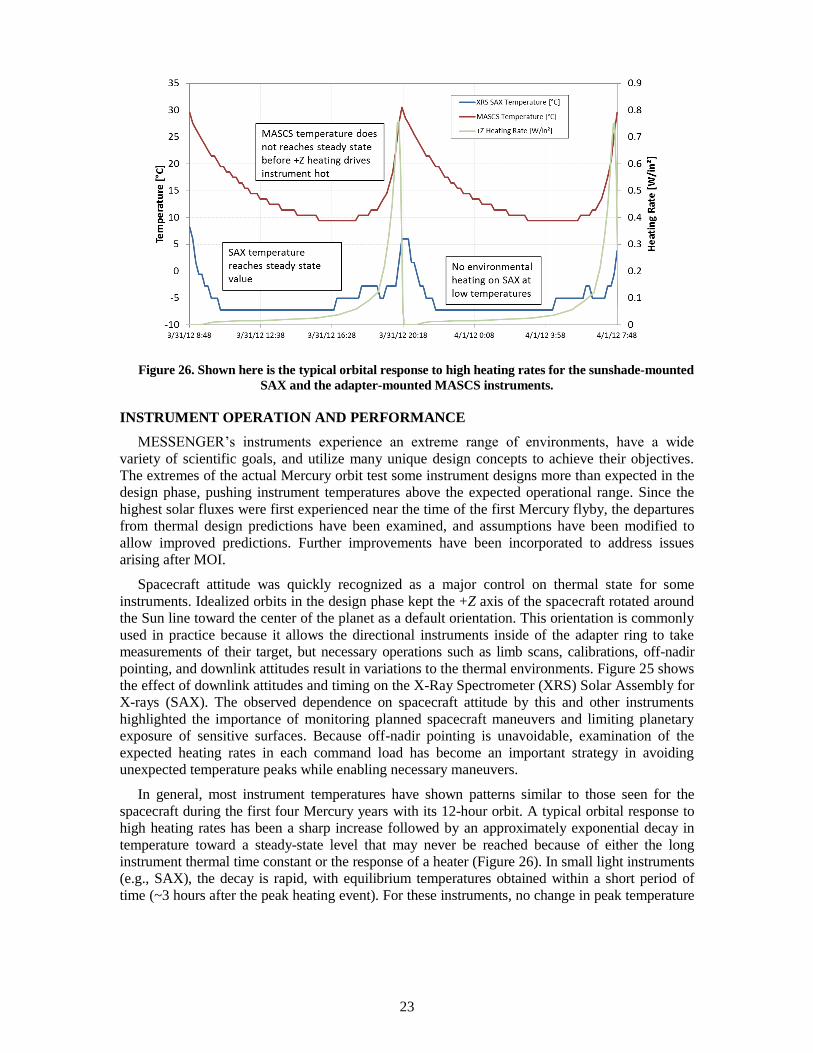
Figure 26. Shown here is the typical orbital response to high heating rates for the sunshade-mounted
SAX and the adapter-mounted MASCS instruments.
INSTRUMENT OPERATION AND PERFORMANCE
MESSENGER’s instruments experience an extreme range of environments, have a wide
variety of scientific goals, and utilize many unique design concepts to achieve their objectives.
The extremes of the actual Mercury orbit test some instrument designs more than expected in the
design phase, pushing instrument temperatures above the expected operational range. Since the
highest solar fluxes were first experienced near the time of the first Mercury flyby, the departures
from thermal design predictions have been examined, and assumptions have been modified to
allow improved predictions. Further improvements have been incorporated to address issues
arising after MOI.
Spacecraft attitude was quickly recognized as a major control on thermal state for some
instruments. Idealized orbits in the design phase kept the +Z axis of the spacecraft rotated around
the Sun line toward the center of the planet as a default orientation. This orientation is commonly
used in practice because it allows the directional instruments inside of the adapter ring to take
measurements of their target, but necessary operations such as limb scans, calibrations, off-nadir
pointing, and downlink attitudes result in variations to the thermal environments. Figure 25 shows
the effect of downlink attitudes and timing on the X-Ray Spectrometer (XRS) Solar Assembly for
X-rays (SAX). The observed dependence on spacecraft attitude by this and other instruments
highlighted the importance of monitoring planned spacecraft maneuvers and limiting planetary
exposure of sensitive surfaces. Because off-nadir pointing is unavoidable, examination of the
expected heating rates in each command load has become an important strategy in avoiding
unexpected temperature peaks while enabling necessary maneuvers.
In general, most instrument temperatures have shown patterns similar to those seen for the
spacecraft during the first four Mercury years with its 12-hour orbit. A typical orbital response to
high heating rates has been a sharp increase followed by an approximately exponential decay in
temperature toward a steady-state level that may never be reached because of either the long
instrument thermal time constant or the response of a heater (Figure 26). In small light instruments
(e.g., SAX), the decay is rapid, with equilibrium temperatures obtained within a short period of
time (~3 hours after the peak heating event). For these instruments, no change in peak temperature

24
is expected from the change to an 8-
hour orbit. Their time constants are
sufficiently short that they retain no
memory of the previous heat flux
peak when the next heat pulse
arrives. Other instruments react more
slowly, with temperatures
continuously cooling until the next
heating pulse causes another jump in
temperature reflecting the
environmental load received.
Many of the instruments have
powered off to avoid the periods of
highest heat flux during the
inbound hot season. The resulting
decrease in internal dissipation
reduces instrument temperatures
and allows passage through the
extremes. Power system limitations
have driven some of this instrument inactivity, but some of these limitations are being removed
as the AP and IBS heat fluxes are reduced, as shown in Figure 16. With the power system
limitations reduced, thermal limits will require power cycling of the Mercury Atmospheric and
Surface Composition Spectrometer (MASCS) to maintain safe temperatures. Additional
modeling and temperature prediction work will continue in order to maximize science returns
within the thermal limits protecting the instrument. The Mercury Laser Altimeter (MLA)
successfully completed the primary mission but has gradually experienced laser degradation
from firing at temperatures >30°C. A new autonomy rule was added to prevent laser activity at
greater than 30°C and prolong instrument life. The combination of the new limit, increasing
OBS heating rates, and the 8-hour orbit would have resulted in many orbits with no MLA
science. A new thermal management scheme has been implemented and refined that bypasses
the inflexible instrument thermal control system to cool the instrument bulk below its designed
operating temperature so that the heating pulse near periapsis will not raise the temperature so
much that a shot cannot be fired.
SUMMARY
On March 29, 2011, at 5:20 a.m. EDT, MESSENGER captured the historic image of Mercury
shown in Figure 27 with the wide-angle camera (WAC) of the Mercury Dual Imaging System
(MDIS). This image is the first ever obtained from a spacecraft in orbit about the Solar System’s
innermost planet and, to date, MESSENGER has taken in excess of 100,000 images and
completed >1,000 orbits.
Overall, the MESSENGER spacecraft thermal control design has performed very well, as
supported by the data presented in this paper. A summary of minimum and maximum component
temperatures for the orbital phase compared with the flight acceptance limits (Table 3) illustrates
well this general assessment.
Figure 27. This image, captured using the MDIS WAC, is the
first ever obtained from a spacecraft in orbit about Mercury.
To date, MESSENGER has taken in excess of 100,000 images
and completed in excess of 1,000 orbits.

1
Table 3. A summary of measured minimum and maximum component temperatures to date
Component
min max min max min max min max min max min max min max low high cold hot
Adapter -16 94 -16 80 -16 78 -16 84 -18 89 -14 96 -18 96 -20 100
SA3 -X -107 221 -106 214 -100 215 -98 220 -92 199 -74 199 -107 221 -140 230 33 9
SA1 +X -111 193 -109 186 -103 194 -102 200 -95 178 -78 178 -111 200 -140 230 29 30
ReactionWheels 23 56 23 50 23 49 24 52 23 54 26 54 23 56 -40 70 63 14
FrontLowAntenna -1 126 2 132 2 128 4 126 8 135 13 89 -1 135 -100 150 99 15
FrontPhaseAntenna 44 167 44 144 46 158 46 158 45 172 51 165 44 172 -100 150 144 -22
VCXO 12 47 14 45 12 45 13 46 16 49 17 52 12 52 -34 60 46 8
SSPA -7 30 -7 35 -12 37 -7 33 -9 37 -7 35 -12 37 -34 50 22 13
StarTracker -6 19 -6 19 -6 19 -6 18 -6 22 -5 17 -6 22 -34 65 28 43
IMU -1 33 2 37 2 35 2 35 4 39 6 44 -1 44 -24 65 23 21
DSADhotSide3 73 191 75 184 75 179 75 179 75 181 80 174 73 191 -85 185 158 -6
DSADhotSide1 71 167 71 167 71 165 71 163 73 160 73 153 71 167 -85 185 156 18
Boxes -7 41 -8 41 -6 40 -6 39 -9 43 -4 43 -9 43 -34 65 25 22
Tanks 13 33 13 30 13 32 14 32 12 36 14 35 12 36 0 50 12 14
HeTank 5 25 7 17 4 22 6 17 6 22 9 21 4 25 0 50 4 25
Battery -6 7 -5 9 -5 10 -5 9 -5 12 -5 4 -6 12 -10 25 4 13
MDIS -45 43 -33 45 -31 46 -32 47 -39 47 -29 60 -45 60 -50 50 5 -10
MASCS -15 48 -3 52 -2 53 -1 55 -18 56 3 65 -18 65 -30 50 12 -15
EPS -37 22 -34 22 -15 27 -14 22 -39 24 -12 21 -39 27 -30 45 -9 18
FIPS -3 23 3 22 3 21 4 21 -1 24 7 26 -3 26 -30 65 27 39
MAGbox 5 35 16 33 14 33 15 31 11 32 13 32 5 35 -34 65 39 30
MAGsensor -128 105 -128 96 -128 91 -120 96 -111 107 -103 132 -128 132 -135 135 7 3
XRSmxu -17 47 -1 49 0 50 -1 51 -18 49 10 59 -18 59 -30 65 12 6
XRSsax -29 57 -27 66 -25 62 -25 60 -20 64 -9 46 -29 66 -50 65 21 -1
NUSsens -21 18 -12 13 -14 13 -13 14 -12 17 -7 19 -21 19 -30 50 9 31
MLAbody -14 42 -13 44 -13 40 -13 43 -14 40 -13 50 -14 50 -30 50 16 0
PDU 5 32 7 33 5 32 6 32 7 34 10 38 5 38 -34 65 39 27
PSE -12 22 -11 22 -10 21 -10 24 -8 24 0 32 -12 32 -34 70 22 38
PSErad -16 53 -16 84 -16 60 -16 57 -12 84 -7 69 -16 84 -50 240 34 156
GRSbox 16 42 16 41 18 40 14 43 9 45 7 51 7 51 -34 65 41 14
GRScomp -16 49 -16 58 -16 41 -16 44 -15 49 -19 54 -19 58 -45 60 26 2
SAJB -8 27 -5 28 -5 27 -6 26 -2 29 5 31 -8 31 -30 75 22 44
SAJBrad -12 135 -9 146 -9 142 -9 137 -7 137 -1 69 -12 146 -50 240 38 94
OCXO 16 37 16 37 16 37 17 36 16 40 19 39 16 40 -25 60 41 20
Mercury years 1-6 Acceptance MarginMercury year 1 Mercury year 2 Mercury year 3 Mercury year 4 Mercury year 5 Mercury year 6, to date

1
ACKNOWLEDGMENTS
The MESSENGER mission is supported by the NASA Discovery Program under contracts to
CIW and APL. The author acknowledges Sean Solomon, the MESSENGER spacecraft Principal
Investigator at CIW, and Peter Bedini, the MESSENGER spacecraft Project Manager at APL, for
their support in the preparation and presentation of this paper.
REFERENCES
1 C. L. Yen, “Ballistic Mercury Orbiter Mission via Venus and Mercury Gravity Assist.” J. Astronaut. Sci., 37, pp.
417432, 1989. 2 A. G. Santo et al., “The MESSENGER Mission to Mercury: Spacecraft and Mission Design.” Planet. Space Sci., 49,
pp. 14811500, 2001. 3 C. J. Ercol and A. G. Santo, “Determination of Optimum Thermal Phase Angles at Mercury Perihelion for an Orbiting
Spacecraft.” 29th International Conference on Environmental Systems, Society of Automotive Engineers, Tech. Paper
Ser., paper 1999-01-21123, 10 pp., Denver, CO, July 2125, 1999. 4 C. J. Ercol et al., “Prototype Solar Panel Development and Testing for a Mercury Orbiter Spacecraft.” 35th Intersociety
Energy Conversion Engineering Conference, American Institute of Aeronautics and Astronautics, paper AIAA-2000-
2881, 11 pp., Las Vegas, NV, July 2428, 2000. 5 C. J. Ercol, “MESSENGER Heritage: High-Temperature Technologies for Spacecraft to the Inner Solar System.”
American Institute of Aeronautics and Astronautics Space 2007 Conference, paper AIAA-2007-6188, 8 pp., Long
Beach, CA, September 1820, 2007. 6 P. D. Wienhold and D. F. Persons, “The Development of High-Temperature Composite Solar Array Substrate Panels for
the MESSENGER Spacecraft.” SAMPE J., 39 (6), pp. 617, 2003. 7 R. E. Wallis, J. R. Bruzzi, and P. M. Malouf, “Testing of the MESSENGER Spacecraft Phased-Array Antenna.”
Antenna Measurement Techniques Association 26th Meeting and Symposium, pp. 331336, Stone Mountain, GA,
October 2004. 8 C. J. Ercol et al., “Power Subsystem Thermal Design and Early Mission Performance.” 4th International Energy
Conversion Engineering Conference and Exhibit, paper AIAA-4144, 14 pp., San Diego, CA, June 2629, 2006. 9 R. L. Vaughan et al., “Return to Mercury: The MESSENGER Spacecraft and Mission.” Institute of Electrical and
Electronics Engineers Aerospace Conference, IEEEAC paper 1562, 15 pp., Big Sky, MT, March 411, 2006. 10 C. J. Ercol, “Return to Mercury: An Overview of the MESSENGER Spacecraft Thermal Control System Design and
Up-to-Date Flight Performance.” 38th International Conference on Environmental Systems, SAE International, paper
2008-01-2123, 15 pp., San Francisco, CA, June 29–July 2, 2008. 11 C. J. Ercol, G. Dakermanji, and S. C. Laughery, “The MESSENGER Spacecraft Power System: Thermal Performance
through the First Mercury Flyby.” 6th Annual International Energy Conversion Engineering Conference, paper AIAA-
2008-5785, 12 pp., Cleveland, OH, July 28–30, 2008. 12 C. J. Ercol, “The MESSENGER Spacecraft Power System: Thermal Performance through Mercury Flyby 3.” 8th
Annual International Energy Conversion Engineering Conference, paper AIAA-2010-6848, 16 pp., Nashville, TN, July
25–28, 2010.
CONTACT INFORMATION
To whom correspondence should be addressed: Carl J. Ercol, Lead MESSENGER Thermal
Engineer, Space Department, The Johns Hopkins University Applied Physics Laboratory, 11100
Johns Hopkins Road, Laurel, MD 20723-6099.