reuters/issei kato 2018 state of corporate law departments · 2018 state of corporate law...
TRANSCRIPT

2018 State of Corporate Law DepartmentsInnovation, Data and Collaboration Drive Optimal Results
ASSOCIATION CONTRIBUTOR PRIMARY CONTRIBUTORS
REUTERS/Issei Kato

2018 STATE OF CORPORATE LAW DEPARTMENTS
2
EXECUTIVE SUMMARYThe modern legal department takes a far more proactive stance than the traditional department. The modern legal department works to add value to the organization rather than be perceived as a cost center operating reactively to legal requests.
Three key themes emerge as central to the modern legal department ethos. First, fostering a culture of ongoing improvement and innovation. Second, embedding data-driven review and decision-making, embracing metrics as “the way we do business here.” And third, investing time and energy in developing business partner relationships with external suppliers, working as one collaborative team to deliver better outcomes.
The modern department aligns itself with three key goals:
1 To ensure the long-term sustainability of the organization by identifying, monitoring and mitigating risk
2 To maximize shareholder value by driving up the effectiveness and efficiency of legal input to maximum return
3 To be socially responsible in considering ethical behaviors surrounding ethical sourcing, the diversity agenda and pro bono efforts
At the same time as working toward these higher goals, the modern legal function is dealing with significant environmental change — a more dynamic and complex legal landscape — changing regulations and government policy, often across more and more jurisdictions.
To be fit for purpose, the modern legal department is more corporate in its approach. It utilizes formal operations management disciplines, and it is no surprise that half of legal departments now have dedicated legal operations roles.
Modern departments leverage efficiency gains and information management through systems and technology. These systems enable them to gain control of legal activity through understanding both demand and spend in much more detail. Measurement enables more effective management, and metrics are a critical resource for the modern legal department as they, like other departments, become more data-driven. The last section of this report defines 21 metrics that departments should consider tracking.

2018 STATE OF CORPORATE LAW DEPARTMENTS
3
Key to staying modern will be constant innovation. While few departments will be early adopters by definition, modern departments can learn from their more adventurous peers and emulate their successes. They can also look to disrupters on the supply side in the form of the alternative legal services providers and how different approaches are creating new and significant industry players. Only 41 percent of departments have implemented some form of innovation into the way they work in the last year and only 22 percent of legal departments are increasing their technology spend.
Figures reveal that spend is increasingly moving in-house, now up to an average of 43 percent of total budget, and that overall spend aligns with low revenue growth. Analysis of legal spend patterns against different ratios of internal and external allocation has identified an optimal range where legal spend was most efficient — between 40 percent and 70 percent allocated internally. So perhaps the average of 43 percent should continue to increase until the supply-side can offer a more cost-effective approach.
Controlling external counsel costs emerged as the number-one priority for legal departments, and law firm realized rates have seen very little growth over the last five years, just 1 percent per year. Legal departments would benefit from implementing some of the highly effective cost control strategies identified on page 8, with the most effective being implementing a fixed/flat fee for matters of a similar type.
Departments also could consider allocating more spend with a fewer number of firms to try to drive down cost in a meaningful way. But the data shows that nearly half of departments are in fact increasing the number of firms they work with. Feedback from external lawyers suggests that a more business-partnering approach with a smaller number of “preferred provider” firms will result in more effective and efficient service. Through taking a more holistic view of their legal work, external lawyers should be better placed to help with the broader risk agenda.
This report, the first annual report for legal departments produced by Thomson Reuters and Acritas, concludes that more modern departments embrace innovation, are data-driven and work collaboratively with other parties in the legal ecosystem to create an optimal result.
At NetApp, our mission is to help our customers change the world with data. And when it comes to digital transformation, our own legal industry has a long, long way to go. The three key themes in this report resonate with me. Innovation is required to evolve and improve how we deliver value to our clients. Electronic signatures and workflow automation are relatively simple examples that yielded material improvements in speed, cost and auditability at NetApp. As more of our legal work is provided by an increasingly diverse array of outside providers, a “partnering” approach will achieve better results than a “vendor” approach. While not all law firms are equally comfortable with the candor, we seek to both provide and receive honest performance feedback. By working collaboratively, we achieve solutions that not only drive down cost but provide superior risk management too. But the most important theme for me is being data-driven. Running legal like a business means using data to identify opportunities, create efficiencies and fail fast. Data should inform strategy and help govern execution, even in legal!
– Matt Fawcett, Senior Vice President, General Counsel and Secretary, NetApp
Figures reveal that spend is increasingly moving in-house, now up to an average of 43 percent of total budget, and that overall spend aligns with low revenue growth.

2018 STATE OF CORPORATE LAW DEPARTMENTS
4
DATA CREDENTIALS
Acritas conducts an ongoing global research study of senior in-house counsel, called Sharplegal, which started in 2007. More than 2,000 interviews are conducted by telephone each year exploring their approach to buying legal services, their experiences with law firms, and their spend level and team size. This report draws on the 600 interviews conducted with U.S.-based respondents each year.
In 2017, Acritas conducted two surveys with partners at law firms who had been nominated as stand-out by the senior in-house counsel it interviewed in 2016. In the first Acritas Stars™ lawyer survey, these attorneys were asked about their compensation levels and the qualities they believed made them stand out. The survey also evaluated the effectiveness of their law firms in helping them deliver for clients. The second survey evaluated their clients’ performance in managing their input and delivering for their organizations.
Thomson Reuters Legal Tracker is the industry-leading e-billing, matter management, analytics and reporting platform used by nearly 1,200 of the world’s best corporate legal departments. With more than $73B in approved legal spend data, Legal Tracker provides pricing and benchmarking information allowing legal departments to make more-informed business decisions and improve the bottom line.
In 2017, Legal Tracker conducted two client surveys, one in the spring and one in the fall, receiving responses from 161 and 155 legal departments, respectively, with demographics representing legal departments and corporations of all sizes. The combination of quantitative benchmarking from the Legal Tracker product and qualitative survey responses is published in the Thomson Reuters Legal Tracker LDO Index: Benchmarking and Trends reports.
Corporate Legal Operations Consortium (CLOC) is an organization of corporate legal operations leaders who aim to optimize legal services delivery models and share knowledge. The group’s work has helped define what skills and focuses are needed for law departments to make legal operations work and enabled a community of professionals to form around operations.
In 2017, CLOC conducted a survey of 156 companies including 11 percent of the Fortune 500 across 32 industries. Among the companies surveyed, they had a $7B median company revenue, and $60M in average external legal spending. The data incorporated in the CLOC analysis is based on range estimations (not exact numbers) provided by respondents. To provide actionable data, some of the data points and charts in this presentation used the midpoint of a data range as the respondent’s data input. For example, if company X reported 50–99 attorneys, the data point used for analysis was 75. Similarly, if company Y reported $1M– $4.9M in external legal spend, the data point used for analysis was $2.5M.
Today, legal departments face a choice: evolve or fall behind. The best organizations are turning to legal operations to empower attorneys and increase impact. Whether it is using data and embracing metrics, building stronger collaborative relationships with law firms, or embracing diversity initiatives, modern legal departments are changing the way legal works and delivering value to the corporation. We created the Corporate Legal Operations Consortium (CLOC) to change the future of our industry for the better.
– Christine Coats, Vice President, Legal Operations at Oracle, and CLOC CFO
Thomson Reuters Legal Tracker is the industry-leading e-billing, matter management, analytics and reporting platform used by nearly 1,200 of the world’s best corporate legal departments.

2018 STATE OF CORPORATE LAW DEPARTMENTS
5
TRENDS IN DEMAND FOR LEGAL SERVICESFIVE-YEAR REVIEW
MACRO TREND RESEARCH GROUP LEGAL SPEND TREND
U.S. GDP has increased approximately 2% per year over the last five years
Developed economies growing at approximately half the rate of emerging economies Source: World Bank national accounts data, and OECD National Accounts data files
Combined revenue of the organizations* surveyed increased by 6% per year, three times the rate of U.S. GDP
Individual growth rates were extremely diverse and the typical (median) rate is just 2% Source: Acritas Sharplegal U.S.
The typical legal spend as a proportion of revenue has stayed consistent, suggesting legal spend has grown in line with revenue
Level of legal spend remains the same but encompasses more work Source: Acritas Sharplegal U.S.
* A control cell of organizations that took part in Acritas’ survey in both 2013 and 2017
MORE SPEND STAYS IN-HOUSE — 6 PERCENT SHIFT FROM EXTERNAL TO INTERNAL
The proportion of legal budget allocated internally has increased from 37 percent in 2013 to 43 percent in 2017. Given the pay difference between private practice and in-house legal departments — the typical U.S. partner is paid nearly double the typical chief legal officer/general counsel — it is not surprising that legal departments are continuing to move more work in-house.
0
20
40
60
80
10037% 40% 41% 40% 43%
63% 60% 59% 60% 57%
2013 2014 2015 2016 2017
InternalExternal
Chart 2
Thomson Reuters Legal TrackerMltratech Collaborati/Team Connect
76%
41%
41%
30%
29%
2013 2014 2015 2016 2017
Chart 4
Source: Thomson Reuters Legal Tracker Customer Survey
Chart 10
100
150
250
350
450
550
200
300
400
500
Hourly Rates
Partner Index AverageOf Counsel Index AverageAssociate Index AverageLegal Assistant Index AverageParalegal Index Average
Focus on legal operations
Allocating work to law firms that are proactive in showing their value
Internal data security focus
Using technology to simplify workflow and manual processes
Controlling outside counsel costs
19%
17%41%
14%
6%
6%
6%
E-Billing
Documentmanagement
Outsourcing
Project management
AFA/Pricing
Contract management
65%
22%
13%7 or more
4-6 people
1-3 people
74%
12%
9%Higher use of fixed fees/AFA
More efficient
Reduce rates/charge less
6%Transparent/regular billing
AttorneysParalegalsLegal opsOther roles
57%
20%
9%
14%
Source: Thomson Reuters Legal Tracker Customer Survey
16%
Female in-house
Male in-house
75%
84%
25%
Male external Female external
>70% internal:Less efficient
70%-<80% >80%
Chart #1
Chart #2
Chart #3
Chart 1
2013 2014 2015 2016 2107
Innovated
Have not innovated
Chart 2
41%
59%
Thomson Reuters Legal TrackerMltratech Collaborati/Team ConnectT360 – TyMetrixLexisNexis CousellinkSimpleLegalOtherNone
Chart 3
7.5 7.7 7.7 7.8 8.1
2013 2014 2015 2016 2017 2013 2014 2015
Source: Acritas’ Sharplegal US and Acritas Star lawyer survey (compensation)
Chart 4
Source: Thomson Reuters Legal Tracker Customer Survey
Chart 5
Chart 6
What Ebilling System Do You Use?
Chart 7
Chart 8
Source: Acritas Sharplegal US
InternalExternal
Chart 11
Chart 10
0
20
40
60
80
100
Source: Thomson Reuters Legal Tracker
100
150
250
350
450
550
200
300
400
500
63%
37%
60%
40%
59%
41%
60%
40%
57%
43%
Hourly Rates
0
2
4
6
8
10
Chart #4
Chart #3
Chart 1
2013 2014 2015 2016 2107
Chart 2
Chart 3
7.5 7.7 7.7 7.8 8.1
2013 2014 2015 2016 2017 2013 2014 2015
Source: Acritas’ Sharplegal US and Acritas Star lawyer survey (compensation)
Chart 4
Source: Thomson Reuters Legal Tracker Customer Survey
InternalExternal
0
20
40
60
80
100
Source: Thomson Reuters Legal Tracker
100
150
250
350
450
550
200
300
400
500
63%
37%
60%
40%
59%
41%
60%
40%
57%
43%
Hourly Rates
0
2
4
6
8
10
Chart 2
Thomson Reuters Legal TrackerMltratech Collaborati/Team Connect
76%
41%
41%
30%
29%
2013 2014 2015 2016 2017
Chart 4
Chart 10
Source: Thomson Reuters Legal Tracker
100
150
250
350
450
550
200
300
400
500
Hourly Rates
Partner Index AverageOf Counsel Index AverageAssociate Index AverageLegal Assistant Index AverageParalegal Index Average
Focus on legal operations
Allocating work to law firms that are proactive in showing their value
Internal data security focus
Using technology to simplify workflow and manual processes
Controlling outside counsel costs
Chart #5
Chart #6
Chart #7
Innovated
Have not innovated
41%
59%
19%
17%41%
14%
6%
6%
6%
E-Billing
Documentmanagement
Outsourcing
Project management
AFA/Pricing
Contract management
Thomson Reuters Legal TrackerMitratech Collaborati/Team ConnectT360 – TyMetrixLexisNexis CousellinkSimpleLegalOtherNone
34%
14%
9%
8%
6%
14%
17%
Legal operations
No specialist roles
49%
51%
65%
22%
13%7 or more
4-6 people
1-3 people
Chart #8
Chart #9
Chart #10
Chart #11
Criticized value
Did not criticize value
42%
58%
74%
12%
9%Higher use of fixed fees/AFA
More efficient
Charging less
6%Transparent/regular billing
<20%
<20% - 40% internal:Less efficient
>40% - 70% internal:Optimal efficiency
>70% internal:Less efficient
20%-<30% 30%-<40% 40%-<50% 50%-<60% 60%-<70% 70%-<80% >80%
Proportion of spend that is internal
AttorneysParalegalsLegal opsOther roles
57%
20%
9%
14%
Male
Female
21%
79%
18%
Female in-house
Male in-house
70%
81%
30%
Select male lead partner Select female lead partner
Suggested improvements from clients relating to law firm value
Perceived value from law firms
Source: Acritas Sharplegal U.S. and Acritas Star Lawyer Survey (compensation)
The CLOC member survey found the breakdown to be 62 percent external spend to 38 percent internal spend. The average internal spend per legal department FTE (including all employees in the legal department) is $221,000, with $607,000 as the average external spend per in-house attorney.
Source: CLOC member survey
2018 STATE OF CORPORATE LAW DEPARTMENTS
6
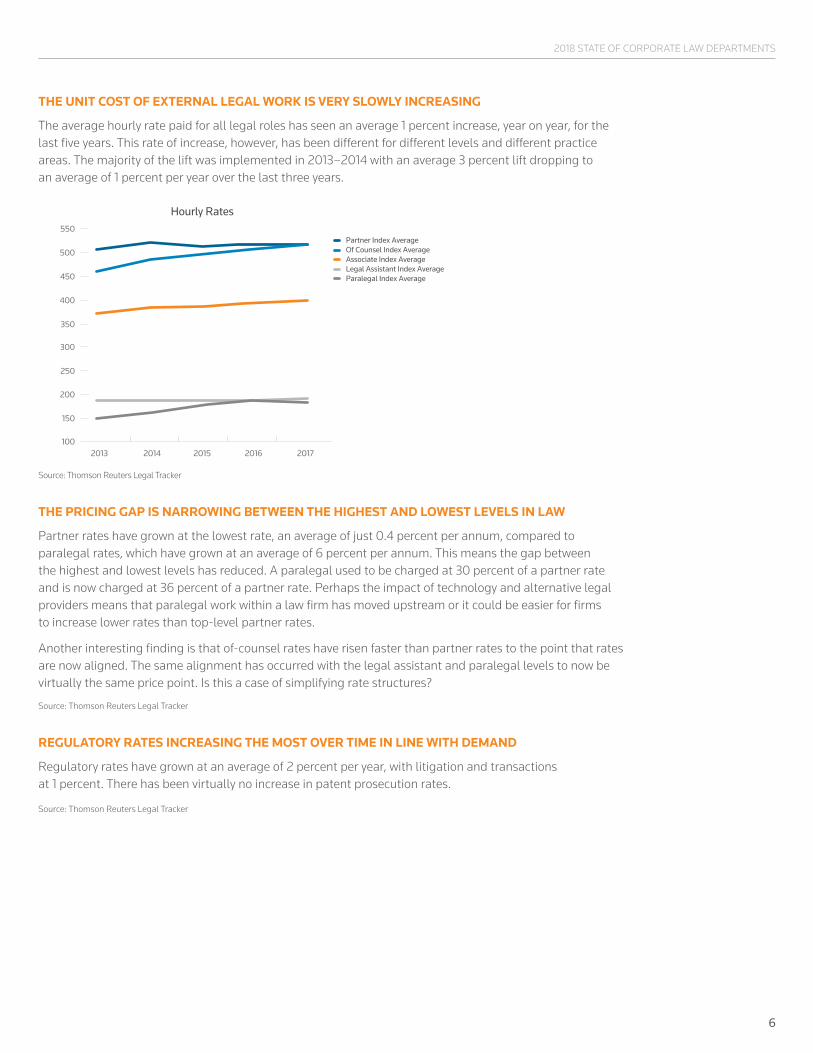
THE UNIT COST OF EXTERNAL LEGAL WORK IS VERY SLOWLY INCREASING
The average hourly rate paid for all legal roles has seen an average 1 percent increase, year on year, for the last five years. This rate of increase, however, has been different for different levels and different practice areas. The majority of the lift was implemented in 2013–2014 with an average 3 percent lift dropping to an average of 1 percent per year over the last three years.
0
20
40
60
80
10037% 40% 41% 40% 43%
63% 60% 59% 60% 57%
2013 2014 2015 2016 2017
InternalExternal
Chart 2
Thomson Reuters Legal TrackerMltratech Collaborati/Team Connect
76%
41%
41%
30%
29%
2013 2014 2015 2016 2017
Chart 4
Source: Thomson Reuters Legal Tracker Customer Survey
Chart 10
100
150
250
350
450
550
200
300
400
500
Hourly Rates
Partner Index AverageOf Counsel Index AverageAssociate Index AverageLegal Assistant Index AverageParalegal Index Average
Focus on legal operations
Allocating work to law firms that are proactive in showing their value
Internal data security focus
Using technology to simplify workflow and manual processes
Controlling outside counsel costs
19%
17%41%
14%
6%
6%
6%
E-Billing
Documentmanagement
Outsourcing
Project management
AFA/Pricing
Contract management
65%
22%
13%7 or more
4-6 people
1-3 people
74%
12%
9%Higher use of fixed fees/AFA
More efficient
Reduce rates/charge less
6%Transparent/regular billing
AttorneysParalegalsLegal opsOther roles
57%
20%
9%
14%
Source: Thomson Reuters Legal Tracker Customer Survey
16%
Female in-house
Male in-house
75%
84%
25%
Male external Female external
>70% internal:Less efficient
70%-<80% >80%
Chart #1
Chart #2
Chart #3
Chart 1
2013 2014 2015 2016 2107
Innovated
Have not innovated
Chart 2
41%
59%
Thomson Reuters Legal TrackerMltratech Collaborati/Team ConnectT360 – TyMetrixLexisNexis CousellinkSimpleLegalOtherNone
Chart 3
7.5 7.7 7.7 7.8 8.1
2013 2014 2015 2016 2017 2013 2014 2015
Source: Acritas’ Sharplegal US and Acritas Star lawyer survey (compensation)
Chart 4
Source: Thomson Reuters Legal Tracker Customer Survey
Chart 5
Chart 6
What Ebilling System Do You Use?
Chart 7
Chart 8
Source: Acritas Sharplegal US
InternalExternal
Chart 11
Chart 10
0
20
40
60
80
100
Source: Thomson Reuters Legal Tracker
100
150
250
350
450
550
200
300
400
500
63%
37%
60%
40%
59%
41%
60%
40%
57%
43%
Hourly Rates
0
2
4
6
8
10
Chart #4
Chart #3
Chart 1
2013 2014 2015 2016 2107
Chart 2
Chart 3
7.5 7.7 7.7 7.8 8.1
2013 2014 2015 2016 2017 2013 2014 2015
Source: Acritas’ Sharplegal US and Acritas Star lawyer survey (compensation)
Chart 4
Source: Thomson Reuters Legal Tracker Customer Survey
InternalExternal
0
20
40
60
80
100
Source: Thomson Reuters Legal Tracker
100
150
250
350
450
550
200
300
400
500
63%
37%
60%
40%
59%
41%
60%
40%
57%
43%
Hourly Rates
0
2
4
6
8
10
Chart 2
Thomson Reuters Legal TrackerMltratech Collaborati/Team Connect
76%
41%
41%
30%
29%
2013 2014 2015 2016 2017
Chart 4
Chart 10
Source: Thomson Reuters Legal Tracker
100
150
250
350
450
550
200
300
400
500
Hourly Rates
Partner Index AverageOf Counsel Index AverageAssociate Index AverageLegal Assistant Index AverageParalegal Index Average
Focus on legal operations
Allocating work to law firms that are proactive in showing their value
Internal data security focus
Using technology to simplify workflow and manual processes
Controlling outside counsel costs
Chart #5
Chart #6
Chart #7
Innovated
Have not innovated
41%
59%
19%
17%41%
14%
6%
6%
6%
E-Billing
Documentmanagement
Outsourcing
Project management
AFA/Pricing
Contract management
Thomson Reuters Legal TrackerMitratech Collaborati/Team ConnectT360 – TyMetrixLexisNexis CousellinkSimpleLegalOtherNone
34%
14%
9%
8%
6%
14%
17%
Legal operations
No specialist roles
49%
51%
65%
22%
13%7 or more
4-6 people
1-3 people
Chart #8
Chart #9
Chart #10
Chart #11
Criticized value
Did not criticize value
42%
58%
74%
12%
9%Higher use of fixed fees/AFA
More efficient
Charging less
6%Transparent/regular billing
<20%
<20% - 40% internal:Less efficient
>40% - 70% internal:Optimal efficiency
>70% internal:Less efficient
20%-<30% 30%-<40% 40%-<50% 50%-<60% 60%-<70% 70%-<80% >80%
Proportion of spend that is internal
AttorneysParalegalsLegal opsOther roles
57%
20%
9%
14%
Male
Female
21%
79%
18%
Female in-house
Male in-house
70%
81%
30%
Select male lead partner Select female lead partner
Suggested improvements from clients relating to law firm value
Perceived value from law firms
Source: Thomson Reuters Legal Tracker
THE PRICING GAP IS NARROWING BETWEEN THE HIGHEST AND LOWEST LEVELS IN LAW
Partner rates have grown at the lowest rate, an average of just 0.4 percent per annum, compared to paralegal rates, which have grown at an average of 6 percent per annum. This means the gap between the highest and lowest levels has reduced. A paralegal used to be charged at 30 percent of a partner rate and is now charged at 36 percent of a partner rate. Perhaps the impact of technology and alternative legal providers means that paralegal work within a law firm has moved upstream or it could be easier for firms to increase lower rates than top-level partner rates.
Another interesting finding is that of-counsel rates have risen faster than partner rates to the point that rates are now aligned. The same alignment has occurred with the legal assistant and paralegal levels to now be virtually the same price point. Is this a case of simplifying rate structures?
Source: Thomson Reuters Legal Tracker
REGULATORY RATES INCREASING THE MOST OVER TIME IN LINE WITH DEMAND
Regulatory rates have grown at an average of 2 percent per year, with litigation and transactions at 1 percent. There has been virtually no increase in patent prosecution rates.
Source: Thomson Reuters Legal Tracker

2018 STATE OF CORPORATE LAW DEPARTMENTS
7
CONVERGENCE — A FOCUS FOR THE MODERN DEPARTMENT, BUT ONLY HALF OF DEPARTMENTS HAVE CUT THE NUMBER OF FIRMS THEY WORK WITH
Convergence is common with modern legal departments, and 53 percent of legal departments have cut the number of firms they work with over the last four years with the median number of firms cut at 16; however, 43 percent of legal departments have grown the number of law firms they work with over the same period, with 17 law firms as the median number of additional firms appointed.
Realized benefits from convergence include stronger adoption of legal departments’ policies and procedures yielding cleaner data for analysis to spot trends, working with partners who deeply understand the corporations’ business and terminology providing more value and efficiency in legal work, and reduced internal costs to support law firms, resulting in the ability of operational staff to support more high-value activities.
The typical client worked with 78 different law firms; however, 41 percent worked with more than 100 firms.
Source: Thomson Reuters Legal Tracker
EXTERNAL LAW FIRMS ARE RAISING THEIR GAME WHEN IT COMES TO VALUE
The legal department perception of value received from law firms is increasing. The average satisfaction rating of value for money has increased 9 percent over the last five years. All areas of service delivery have seen improvement, which justifies the perception of enhanced value, even though rates have been largely static.
0
20
40
60
80
10037% 40% 41% 40% 43%
63% 60% 59% 60% 57%
2013 2014 2015 2016 2017
InternalExternal
Chart 2
Thomson Reuters Legal TrackerMltratech Collaborati/Team Connect
76%
41%
41%
30%
29%
2013 2014 2015 2016 2017
Chart 4
Source: Thomson Reuters Legal Tracker Customer Survey
Chart 10
100
150
250
350
450
550
200
300
400
500
Hourly Rates
Partner Index AverageOf Counsel Index AverageAssociate Index AverageLegal Assistant Index AverageParalegal Index Average
Focus on legal operations
Allocating work to law firms that are proactive in showing their value
Internal data security focus
Using technology to simplify workflow and manual processes
Controlling outside counsel costs
19%
17%41%
14%
6%
6%
6%
E-Billing
Documentmanagement
Outsourcing
Project management
AFA/Pricing
Contract management
65%
22%
13%7 or more
4-6 people
1-3 people
74%
12%
9%Higher use of fixed fees/AFA
More efficient
Reduce rates/charge less
6%Transparent/regular billing
AttorneysParalegalsLegal opsOther roles
57%
20%
9%
14%
Source: Thomson Reuters Legal Tracker Customer Survey
16%
Female in-house
Male in-house
75%
84%
25%
Male external Female external
>70% internal:Less efficient
70%-<80% >80%
Chart #1
Chart #2
Chart #3
Chart 1
2013 2014 2015 2016 2107
Innovated
Have not innovated
Chart 2
41%
59%
Thomson Reuters Legal TrackerMltratech Collaborati/Team ConnectT360 – TyMetrixLexisNexis CousellinkSimpleLegalOtherNone
Chart 3
7.5 7.7 7.7 7.8 8.1
2013 2014 2015 2016 2017 2013 2014 2015
Source: Acritas’ Sharplegal US and Acritas Star lawyer survey (compensation)
Chart 4
Source: Thomson Reuters Legal Tracker Customer Survey
Chart 5
Chart 6
What Ebilling System Do You Use?
Chart 7
Chart 8
Source: Acritas Sharplegal US
InternalExternal
Chart 11
Chart 10
0
20
40
60
80
100
Source: Thomson Reuters Legal Tracker
100
150
250
350
450
550
200
300
400
500
63%
37%
60%
40%
59%
41%
60%
40%
57%
43%
Hourly Rates
0
2
4
6
8
10
Chart #4
Chart #3
Chart 1
2013 2014 2015 2016 2107
Chart 2
Chart 3
7.5 7.7 7.7 7.8 8.1
2013 2014 2015 2016 2017 2013 2014 2015
Source: Acritas’ Sharplegal US and Acritas Star lawyer survey (compensation)
Chart 4
Source: Thomson Reuters Legal Tracker Customer Survey
InternalExternal
0
20
40
60
80
100
Source: Thomson Reuters Legal Tracker
100
150
250
350
450
550
200
300
400
500
63%
37%
60%
40%
59%
41%
60%
40%
57%
43%
Hourly Rates
0
2
4
6
8
10
Chart 2
Thomson Reuters Legal TrackerMltratech Collaborati/Team Connect
76%
41%
41%
30%
29%
2013 2014 2015 2016 2017
Chart 4
Chart 10
Source: Thomson Reuters Legal Tracker
100
150
250
350
450
550
200
300
400
500
Hourly Rates
Partner Index AverageOf Counsel Index AverageAssociate Index AverageLegal Assistant Index AverageParalegal Index Average
Focus on legal operations
Allocating work to law firms that are proactive in showing their value
Internal data security focus
Using technology to simplify workflow and manual processes
Controlling outside counsel costs
Chart #5
Chart #6
Chart #7
Innovated
Have not innovated
41%
59%
19%
17%41%
14%
6%
6%
6%
E-Billing
Documentmanagement
Outsourcing
Project management
AFA/Pricing
Contract management
Thomson Reuters Legal TrackerMitratech Collaborati/Team ConnectT360 – TyMetrixLexisNexis CousellinkSimpleLegalOtherNone
34%
14%
9%
8%
6%
14%
17%
Legal operations
No specialist roles
49%
51%
65%
22%
13%7 or more
4-6 people
1-3 people
Chart #8
Chart #9
Chart #10
Chart #11
Criticized value
Did not criticize value
42%
58%
74%
12%
9%Higher use of fixed fees/AFA
More efficient
Charging less
6%Transparent/regular billing
<20%
<20% - 40% internal:Less efficient
>40% - 70% internal:Optimal efficiency
>70% internal:Less efficient
20%-<30% 30%-<40% 40%-<50% 50%-<60% 60%-<70% 70%-<80% >80%
Proportion of spend that is internal
AttorneysParalegalsLegal opsOther roles
57%
20%
9%
14%
Male
Female
21%
79%
18%
Female in-house
Male in-house
70%
81%
30%
Select male lead partner Select female lead partner
Suggested improvements from clients relating to law firm value
Perceived value from law firms
Source: Acritas Sharplegal U.S.
Not only is the perception of value increasing, but 66 percent of legal departments consider it a high (29 percent) or medium (37 percent) priority to allocate more work to firms that proactively show their value.Source: Legal Tracker Client Survey
Yet nearly one-third of legal departments don’t measure law firm performance in any manner. Of those departments that do measure performance, outcome-based evaluations are the most important (21.5 percent) followed by informal qualitative feedback (17.7 percent). More than half of legal departments do not rely on formal attorney ratings and use other means to assess performance.Source: CLOC Member Survey

2018 STATE OF CORPORATE LAW DEPARTMENTS
8
CURRENT PRIORITIES FOR THE LEGAL FUNCTION
Legal departments identified their top priorities. The top five most often identified as high priority are presented in the chart below and discussed in detail thereafter. The highest priority of all was controlling outside counsel costs.
0
20
40
60
80
10037% 40% 41% 40% 43%
63% 60% 59% 60% 57%
2013 2014 2015 2016 2017
InternalExternal
Chart 2
Thomson Reuters Legal TrackerMltratech Collaborati/Team Connect
76%
41%
41%
30%
29%
2013 2014 2015 2016 2017
Chart 4
Source: Thomson Reuters Legal Tracker Customer Survey
Chart 10
100
150
250
350
450
550
200
300
400
500
Hourly Rates
Partner Index AverageOf Counsel Index AverageAssociate Index AverageLegal Assistant Index AverageParalegal Index Average
Focus on legal operations
Allocating work to law firms that are proactive in showing their value
Internal data security focus
Using technology to simplify workflow and manual processes
Controlling outside counsel costs
19%
17%41%
14%
6%
6%
6%
E-Billing
Documentmanagement
Outsourcing
Project management
AFA/Pricing
Contract management
65%
22%
13%7 or more
4-6 people
1-3 people
74%
12%
9%Higher use of fixed fees/AFA
More efficient
Reduce rates/charge less
6%Transparent/regular billing
AttorneysParalegalsLegal opsOther roles
57%
20%
9%
14%
Source: Thomson Reuters Legal Tracker Customer Survey
16%
Female in-house
Male in-house
75%
84%
25%
Male external Female external
>70% internal:Less efficient
70%-<80% >80%
Chart #1
Chart #2
Chart #3
Chart 1
2013 2014 2015 2016 2107
Innovated
Have not innovated
Chart 2
41%
59%
Thomson Reuters Legal TrackerMltratech Collaborati/Team ConnectT360 – TyMetrixLexisNexis CousellinkSimpleLegalOtherNone
Chart 3
7.5 7.7 7.7 7.8 8.1
2013 2014 2015 2016 2017 2013 2014 2015
Source: Acritas’ Sharplegal US and Acritas Star lawyer survey (compensation)
Chart 4
Source: Thomson Reuters Legal Tracker Customer Survey
Chart 5
Chart 6
What Ebilling System Do You Use?
Chart 7
Chart 8
Source: Acritas Sharplegal US
InternalExternal
Chart 11
Chart 10
0
20
40
60
80
100
Source: Thomson Reuters Legal Tracker
100
150
250
350
450
550
200
300
400
500
63%
37%
60%
40%
59%
41%
60%
40%
57%
43%
Hourly Rates
0
2
4
6
8
10
Chart #4
Chart #3
Chart 1
2013 2014 2015 2016 2107
Chart 2
Chart 3
7.5 7.7 7.7 7.8 8.1
2013 2014 2015 2016 2017 2013 2014 2015
Source: Acritas’ Sharplegal US and Acritas Star lawyer survey (compensation)
Chart 4
Source: Thomson Reuters Legal Tracker Customer Survey
InternalExternal
0
20
40
60
80
100
Source: Thomson Reuters Legal Tracker
100
150
250
350
450
550
200
300
400
500
63%
37%
60%
40%
59%
41%
60%
40%
57%
43%
Hourly Rates
0
2
4
6
8
10
Chart 2
Thomson Reuters Legal TrackerMltratech Collaborati/Team Connect
76%
41%
41%
30%
29%
2013 2014 2015 2016 2017
Chart 4
Chart 10
Source: Thomson Reuters Legal Tracker
100
150
250
350
450
550
200
300
400
500
Hourly Rates
Partner Index AverageOf Counsel Index AverageAssociate Index AverageLegal Assistant Index AverageParalegal Index Average
Focus on legal operations
Allocating work to law firms that are proactive in showing their value
Internal data security focus
Using technology to simplify workflow and manual processes
Controlling outside counsel costs
Chart #5
Chart #6
Chart #7
Innovated
Have not innovated
41%
59%
19%
17%41%
14%
6%
6%
6%
E-Billing
Documentmanagement
Outsourcing
Project management
AFA/Pricing
Contract management
Thomson Reuters Legal TrackerMitratech Collaborati/Team ConnectT360 – TyMetrixLexisNexis CousellinkSimpleLegalOtherNone
34%
14%
9%
8%
6%
14%
17%
Legal operations
No specialist roles
49%
51%
65%
22%
13%7 or more
4-6 people
1-3 people
Chart #8
Chart #9
Chart #10
Chart #11
Criticized value
Did not criticize value
42%
58%
74%
12%
9%Higher use of fixed fees/AFA
More efficient
Charging less
6%Transparent/regular billing
<20%
<20% - 40% internal:Less efficient
>40% - 70% internal:Optimal efficiency
>70% internal:Less efficient
20%-<30% 30%-<40% 40%-<50% 50%-<60% 60%-<70% 70%-<80% >80%
Proportion of spend that is internal
AttorneysParalegalsLegal opsOther roles
57%
20%
9%
14%
Male
Female
21%
79%
18%
Female in-house
Male in-house
70%
81%
30%
Select male lead partner Select female lead partner
Suggested improvements from clients relating to law firm value
Perceived value from law firms
Source: Thomson Reuters Legal Tracker Customer Survey
PRIORITY 1 Controlling outside counsel costs
Legal departments revealed the cost control strategies they had utilized and which they considered to be most effective. All of the strategies were considered effective by at least 80 percent of those who had implemented them. The strategies most often rated “highly effective” as a proportion of those who had implemented them were:
1 Alternative fee arrangement (AFA) — Fixed/flat fee — Set amount at group level (matters of a similar type)
2 Strict enforcement of billing guidelines
3 Reduction of invoice expenses
Source: Thomson Reuters Legal Tracker Customer Survey
PRIORITY 2 Using technology to simplify workflow and manual processes
Only two in five departments perceive themselves to have innovated the way they handle legal work in the last year. However, this is still a higher rate of innovation than departments are seeing from their external suppliers. The main areas of innovation were in developing systems — contract management, project management, e-billing and document management. New pricing models were also popular, along with outsourcing.
0
20
40
60
80
10037% 40% 41% 40% 43%
63% 60% 59% 60% 57%
2013 2014 2015 2016 2017
InternalExternal
Chart 2
Thomson Reuters Legal TrackerMltratech Collaborati/Team Connect
76%
41%
41%
30%
29%
2013 2014 2015 2016 2017
Chart 4
Source: Thomson Reuters Legal Tracker Customer Survey
Chart 10
100
150
250
350
450
550
200
300
400
500
Hourly Rates
Partner Index AverageOf Counsel Index AverageAssociate Index AverageLegal Assistant Index AverageParalegal Index Average
Focus on legal operations
Allocating work to law firms that are proactive in showing their value
Internal data security focus
Using technology to simplify workflow and manual processes
Controlling outside counsel costs
19%
17%41%
14%
6%
6%
6%
E-Billing
Documentmanagement
Outsourcing
Project management
AFA/Pricing
Contract management
65%
22%
13%7 or more
4-6 people
1-3 people
74%
12%
9%Higher use of fixed fees/AFA
More efficient
Reduce rates/charge less
6%Transparent/regular billing
AttorneysParalegalsLegal opsOther roles
57%
20%
9%
14%
Source: Thomson Reuters Legal Tracker Customer Survey
16%
Female in-house
Male in-house
75%
84%
25%
Male external Female external
>70% internal:Less efficient
70%-<80% >80%
Chart #1
Chart #2
Chart #3
Chart 1
2013 2014 2015 2016 2107
Innovated
Have not innovated
Chart 2
41%
59%
Thomson Reuters Legal TrackerMltratech Collaborati/Team ConnectT360 – TyMetrixLexisNexis CousellinkSimpleLegalOtherNone
Chart 3
7.5 7.7 7.7 7.8 8.1
2013 2014 2015 2016 2017 2013 2014 2015
Source: Acritas’ Sharplegal US and Acritas Star lawyer survey (compensation)
Chart 4
Source: Thomson Reuters Legal Tracker Customer Survey
Chart 5
Chart 6
What Ebilling System Do You Use?
Chart 7
Chart 8
Source: Acritas Sharplegal US
InternalExternal
Chart 11
Chart 10
0
20
40
60
80
100
Source: Thomson Reuters Legal Tracker
100
150
250
350
450
550
200
300
400
500
63%
37%
60%
40%
59%
41%
60%
40%
57%
43%
Hourly Rates
0
2
4
6
8
10
Chart #4
Chart #3
Chart 1
2013 2014 2015 2016 2107
Chart 2
Chart 3
7.5 7.7 7.7 7.8 8.1
2013 2014 2015 2016 2017 2013 2014 2015
Source: Acritas’ Sharplegal US and Acritas Star lawyer survey (compensation)
Chart 4
Source: Thomson Reuters Legal Tracker Customer Survey
InternalExternal
0
20
40
60
80
100
Source: Thomson Reuters Legal Tracker
100
150
250
350
450
550
200
300
400
500
63%
37%
60%
40%
59%
41%
60%
40%
57%
43%
Hourly Rates
0
2
4
6
8
10
Chart 2
Thomson Reuters Legal TrackerMltratech Collaborati/Team Connect
76%
41%
41%
30%
29%
2013 2014 2015 2016 2017
Chart 4
Chart 10
Source: Thomson Reuters Legal Tracker
100
150
250
350
450
550
200
300
400
500
Hourly Rates
Partner Index AverageOf Counsel Index AverageAssociate Index AverageLegal Assistant Index AverageParalegal Index Average
Focus on legal operations
Allocating work to law firms that are proactive in showing their value
Internal data security focus
Using technology to simplify workflow and manual processes
Controlling outside counsel costs
Chart #5
Chart #6
Chart #7
Innovated
Have not innovated
41%
59%
19%
17%41%
14%
6%
6%
6%
E-Billing
Documentmanagement
Outsourcing
Project management
AFA/Pricing
Contract management
Thomson Reuters Legal TrackerMitratech Collaborati/Team ConnectT360 – TyMetrixLexisNexis CousellinkSimpleLegalOtherNone
34%
14%
9%
8%
6%
14%
17%
Legal operations
No specialist roles
49%
51%
65%
22%
13%7 or more
4-6 people
1-3 people
Chart #8
Chart #9
Chart #10
Chart #11
Criticized value
Did not criticize value
42%
58%
74%
12%
9%Higher use of fixed fees/AFA
More efficient
Charging less
6%Transparent/regular billing
<20%
<20% - 40% internal:Less efficient
>40% - 70% internal:Optimal efficiency
>70% internal:Less efficient
20%-<30% 30%-<40% 40%-<50% 50%-<60% 60%-<70% 70%-<80% >80%
Proportion of spend that is internal
AttorneysParalegalsLegal opsOther roles
57%
20%
9%
14%
Male
Female
21%
79%
18%
Female in-house
Male in-house
70%
81%
30%
Select male lead partner Select female lead partner
Suggested improvements from clients relating to law firm value
Perceived value from law firms
Source: Acritas Sharplegal U.S.

2018 STATE OF CORPORATE LAW DEPARTMENTS
9
Surprisingly, the majority of legal departments have not increased their technology budget. Only 22 percent had seen an increase, and 13 percent had decreased their budget.
Source: Thomson Reuters Legal Tracker Customer Survey
What e-billing system do you use?
0
20
40
60
80
10037% 40% 41% 40% 43%
63% 60% 59% 60% 57%
2013 2014 2015 2016 2017
InternalExternal
Chart 2
Thomson Reuters Legal TrackerMltratech Collaborati/Team Connect
76%
41%
41%
30%
29%
2013 2014 2015 2016 2017
Chart 4
Source: Thomson Reuters Legal Tracker Customer Survey
Chart 10
100
150
250
350
450
550
200
300
400
500
Hourly Rates
Partner Index AverageOf Counsel Index AverageAssociate Index AverageLegal Assistant Index AverageParalegal Index Average
Focus on legal operations
Allocating work to law firms that are proactive in showing their value
Internal data security focus
Using technology to simplify workflow and manual processes
Controlling outside counsel costs
19%
17%41%
14%
6%
6%
6%
E-Billing
Documentmanagement
Outsourcing
Project management
AFA/Pricing
Contract management
65%
22%
13%7 or more
4-6 people
1-3 people
74%
12%
9%Higher use of fixed fees/AFA
More efficient
Reduce rates/charge less
6%Transparent/regular billing
AttorneysParalegalsLegal opsOther roles
57%
20%
9%
14%
Source: Thomson Reuters Legal Tracker Customer Survey
16%
Female in-house
Male in-house
75%
84%
25%
Male external Female external
>70% internal:Less efficient
70%-<80% >80%
Chart #1
Chart #2
Chart #3
Chart 1
2013 2014 2015 2016 2107
Innovated
Have not innovated
Chart 2
41%
59%
Thomson Reuters Legal TrackerMltratech Collaborati/Team ConnectT360 – TyMetrixLexisNexis CousellinkSimpleLegalOtherNone
Chart 3
7.5 7.7 7.7 7.8 8.1
2013 2014 2015 2016 2017 2013 2014 2015
Source: Acritas’ Sharplegal US and Acritas Star lawyer survey (compensation)
Chart 4
Source: Thomson Reuters Legal Tracker Customer Survey
Chart 5
Chart 6
What Ebilling System Do You Use?
Chart 7
Chart 8
Source: Acritas Sharplegal US
InternalExternal
Chart 11
Chart 10
0
20
40
60
80
100
Source: Thomson Reuters Legal Tracker
100
150
250
350
450
550
200
300
400
500
63%
37%
60%
40%
59%
41%
60%
40%
57%
43%
Hourly Rates
0
2
4
6
8
10
Chart #4
Chart #3
Chart 1
2013 2014 2015 2016 2107
Chart 2
Chart 3
7.5 7.7 7.7 7.8 8.1
2013 2014 2015 2016 2017 2013 2014 2015
Source: Acritas’ Sharplegal US and Acritas Star lawyer survey (compensation)
Chart 4
Source: Thomson Reuters Legal Tracker Customer Survey
InternalExternal
0
20
40
60
80
100
Source: Thomson Reuters Legal Tracker
100
150
250
350
450
550
200
300
400
500
63%
37%
60%
40%
59%
41%
60%
40%
57%
43%
Hourly Rates
0
2
4
6
8
10
Chart 2
Thomson Reuters Legal TrackerMltratech Collaborati/Team Connect
76%
41%
41%
30%
29%
2013 2014 2015 2016 2017
Chart 4
Chart 10
Source: Thomson Reuters Legal Tracker
100
150
250
350
450
550
200
300
400
500
Hourly Rates
Partner Index AverageOf Counsel Index AverageAssociate Index AverageLegal Assistant Index AverageParalegal Index Average
Focus on legal operations
Allocating work to law firms that are proactive in showing their value
Internal data security focus
Using technology to simplify workflow and manual processes
Controlling outside counsel costs
Chart #5
Chart #6
Chart #7
Innovated
Have not innovated
41%
59%
19%
17%41%
14%
6%
6%
6%
E-Billing
Documentmanagement
Outsourcing
Project management
AFA/Pricing
Contract management
Thomson Reuters Legal TrackerMitratech Collaborati/Team ConnectT360 – TyMetrixLexisNexis CousellinkSimpleLegalOtherNone
34%
14%
9%
8%
6%
14%
17%
Legal operations
No specialist roles
49%
51%
65%
22%
13%7 or more
4-6 people
1-3 people
Chart #8
Chart #9
Chart #10
Chart #11
Criticized value
Did not criticize value
42%
58%
74%
12%
9%Higher use of fixed fees/AFA
More efficient
Charging less
6%Transparent/regular billing
<20%
<20% - 40% internal:Less efficient
>40% - 70% internal:Optimal efficiency
>70% internal:Less efficient
20%-<30% 30%-<40% 40%-<50% 50%-<60% 60%-<70% 70%-<80% >80%
Proportion of spend that is internal
AttorneysParalegalsLegal opsOther roles
57%
20%
9%
14%
Male
Female
21%
79%
18%
Female in-house
Male in-house
70%
81%
30%
Select male lead partner Select female lead partner
Suggested improvements from clients relating to law firm value
Perceived value from law firms
Organizations with legal operations staff are more likely than the average legal department to have adopted technology, as 83 percent of CLOC member legal departments use an e-billing system. However, 46 percent of legal departments do not have a contract management system in place.
Source: CLOC member survey
PRIORITY 3 Data security focus
In the past five years there has been a significant rise in the headlines of corporate data breaches. Examples such as the release of the Panama Papers and the ransomware attack on DLA Piper highlight the responsibility of the legal department to protect sensitive information both internally and externally.
66 percent of organizations surveyed said an internal data security focus is a high (41 percent) or medium (25 percent) priority, while 54 percent of legal departments also highlighted external data security focus on outside counsel security practices.
Source: Thomson Reuters Legal Tracker Customer Survey
PRIORITY 4 Increased focus on legal operations
Just under half of the legal departments have dedicated legal operations roles, most often between one and three headcount.
0
20
40
60
80
10037% 40% 41% 40% 43%
63% 60% 59% 60% 57%
2013 2014 2015 2016 2017
InternalExternal
Chart 2
Thomson Reuters Legal TrackerMltratech Collaborati/Team Connect
76%
41%
41%
30%
29%
2013 2014 2015 2016 2017
Chart 4
Source: Thomson Reuters Legal Tracker Customer Survey
Chart 10
100
150
250
350
450
550
200
300
400
500
Hourly Rates
Partner Index AverageOf Counsel Index AverageAssociate Index AverageLegal Assistant Index AverageParalegal Index Average
Focus on legal operations
Allocating work to law firms that are proactive in showing their value
Internal data security focus
Using technology to simplify workflow and manual processes
Controlling outside counsel costs
19%
17%41%
14%
6%
6%
6%
E-Billing
Documentmanagement
Outsourcing
Project management
AFA/Pricing
Contract management
65%
22%
13%7 or more
4-6 people
1-3 people
74%
12%
9%Higher use of fixed fees/AFA
More efficient
Reduce rates/charge less
6%Transparent/regular billing
AttorneysParalegalsLegal opsOther roles
57%
20%
9%
14%
Source: Thomson Reuters Legal Tracker Customer Survey
16%
Female in-house
Male in-house
75%
84%
25%
Male external Female external
>70% internal:Less efficient
70%-<80% >80%
Chart #1
Chart #2
Chart #3
Chart 1
2013 2014 2015 2016 2107
Innovated
Have not innovated
Chart 2
41%
59%
Thomson Reuters Legal TrackerMltratech Collaborati/Team ConnectT360 – TyMetrixLexisNexis CousellinkSimpleLegalOtherNone
Chart 3
7.5 7.7 7.7 7.8 8.1
2013 2014 2015 2016 2017 2013 2014 2015
Source: Acritas’ Sharplegal US and Acritas Star lawyer survey (compensation)
Chart 4
Source: Thomson Reuters Legal Tracker Customer Survey
Chart 5
Chart 6
What Ebilling System Do You Use?
Chart 7
Chart 8
Source: Acritas Sharplegal US
InternalExternal
Chart 11
Chart 10
0
20
40
60
80
100
Source: Thomson Reuters Legal Tracker
100
150
250
350
450
550
200
300
400
500
63%
37%
60%
40%
59%
41%
60%
40%
57%
43%
Hourly Rates
0
2
4
6
8
10
Chart #4
Chart #3
Chart 1
2013 2014 2015 2016 2107
Chart 2
Chart 3
7.5 7.7 7.7 7.8 8.1
2013 2014 2015 2016 2017 2013 2014 2015
Source: Acritas’ Sharplegal US and Acritas Star lawyer survey (compensation)
Chart 4
Source: Thomson Reuters Legal Tracker Customer Survey
InternalExternal
0
20
40
60
80
100
Source: Thomson Reuters Legal Tracker
100
150
250
350
450
550
200
300
400
500
63%
37%
60%
40%
59%
41%
60%
40%
57%
43%
Hourly Rates
0
2
4
6
8
10
Chart 2
Thomson Reuters Legal TrackerMltratech Collaborati/Team Connect
76%
41%
41%
30%
29%
2013 2014 2015 2016 2017
Chart 4
Chart 10
Source: Thomson Reuters Legal Tracker
100
150
250
350
450
550
200
300
400
500
Hourly Rates
Partner Index AverageOf Counsel Index AverageAssociate Index AverageLegal Assistant Index AverageParalegal Index Average
Focus on legal operations
Allocating work to law firms that are proactive in showing their value
Internal data security focus
Using technology to simplify workflow and manual processes
Controlling outside counsel costs
Chart #5
Chart #6
Chart #7
Innovated
Have not innovated
41%
59%
19%
17%41%
14%
6%
6%
6%
E-Billing
Documentmanagement
Outsourcing
Project management
AFA/Pricing
Contract management
Thomson Reuters Legal TrackerMitratech Collaborati/Team ConnectT360 – TyMetrixLexisNexis CousellinkSimpleLegalOtherNone
34%
14%
9%
8%
6%
14%
17%
Legal operations
No specialist roles
49%
51%
65%
22%
13%7 or more
4-6 people
1-3 people
Chart #8
Chart #9
Chart #10
Chart #11
Criticized value
Did not criticize value
42%
58%
74%
12%
9%Higher use of fixed fees/AFA
More efficient
Charging less
6%Transparent/regular billing
<20%
<20% - 40% internal:Less efficient
>40% - 70% internal:Optimal efficiency
>70% internal:Less efficient
20%-<30% 30%-<40% 40%-<50% 50%-<60% 60%-<70% 70%-<80% >80%
Proportion of spend that is internal
AttorneysParalegalsLegal opsOther roles
57%
20%
9%
14%
Male
Female
21%
79%
18%
Female in-house
Male in-house
70%
81%
30%
Select male lead partner Select female lead partner
Suggested improvements from clients relating to law firm value
Perceived value from law firms
Source: Acritas Sharplegal survey U.S.

2018 STATE OF CORPORATE LAW DEPARTMENTS
10
Seventy percent of legal departments surveyed have identified a focus on legal operations as high (30 percent) or medium (40 percent) priority.
Source: Thomson Reuters Legal Tracker Customer Survey
For organizations with legal operations, the ratio varies based on the annual revenue of the company.
LARGE COMPANIES($10B+ revenue)
MID-SIZE COMPANIES($1B-$9.9B revenue)
SMALL COMPANIES(Less than $1B revenue)
Average attorney headcount 188 41 9
Average Legal Ops headcount 21 6 1
Average attorney to revenue ratio1 Attorney per
$585M1 Attorney per
$196M1 Attorney per
$65M
Average internal spend per legal department FTE*
$225Kper FTE
$236Kper FTE
$175Kper FTE
* Legal department FTEs include attorneys, paralegals, Legal Ops professionals, administrators, and all other members of the legal department
Source: CLOC member survey
PRIORITY 5 Allocating work to law firms that are proactive in showing their value
Traditionally, legal departments heavily focused on rates and expense reductions as a lever to drive value and this focus remains important. Modern legal departments are showing value in additional ways including being predictive in their workflows by understanding the legal department data through active management of matters with collaborative involvement from attorneys, outside counsel and legal operations; detailed matter budgets, predictability and forecasting; and benchmarking performance.
0
20
40
60
80
10037% 40% 41% 40% 43%
63% 60% 59% 60% 57%
2013 2014 2015 2016 2017
InternalExternal
Chart 2
Thomson Reuters Legal TrackerMltratech Collaborati/Team Connect
76%
41%
41%
30%
29%
2013 2014 2015 2016 2017
Chart 4
Source: Thomson Reuters Legal Tracker Customer Survey
Chart 10
100
150
250
350
450
550
200
300
400
500
Hourly Rates
Partner Index AverageOf Counsel Index AverageAssociate Index AverageLegal Assistant Index AverageParalegal Index Average
Focus on legal operations
Allocating work to law firms that are proactive in showing their value
Internal data security focus
Using technology to simplify workflow and manual processes
Controlling outside counsel costs
19%
17%41%
14%
6%
6%
6%
E-Billing
Documentmanagement
Outsourcing
Project management
AFA/Pricing
Contract management
65%
22%
13%7 or more
4-6 people
1-3 people
74%
12%
9%Higher use of fixed fees/AFA
More efficient
Reduce rates/charge less
6%Transparent/regular billing
AttorneysParalegalsLegal opsOther roles
57%
20%
9%
14%
Source: Thomson Reuters Legal Tracker Customer Survey
16%
Female in-house
Male in-house
75%
84%
25%
Male external Female external
>70% internal:Less efficient
70%-<80% >80%
Chart #1
Chart #2
Chart #3
Chart 1
2013 2014 2015 2016 2107
Innovated
Have not innovated
Chart 2
41%
59%
Thomson Reuters Legal TrackerMltratech Collaborati/Team ConnectT360 – TyMetrixLexisNexis CousellinkSimpleLegalOtherNone
Chart 3
7.5 7.7 7.7 7.8 8.1
2013 2014 2015 2016 2017 2013 2014 2015
Source: Acritas’ Sharplegal US and Acritas Star lawyer survey (compensation)
Chart 4
Source: Thomson Reuters Legal Tracker Customer Survey
Chart 5
Chart 6
What Ebilling System Do You Use?
Chart 7
Chart 8
Source: Acritas Sharplegal US
InternalExternal
Chart 11
Chart 10
0
20
40
60
80
100
Source: Thomson Reuters Legal Tracker
100
150
250
350
450
550
200
300
400
500
63%
37%
60%
40%
59%
41%
60%
40%
57%
43%
Hourly Rates
0
2
4
6
8
10
Chart #4
Chart #3
Chart 1
2013 2014 2015 2016 2107
Chart 2
Chart 3
7.5 7.7 7.7 7.8 8.1
2013 2014 2015 2016 2017 2013 2014 2015
Source: Acritas’ Sharplegal US and Acritas Star lawyer survey (compensation)
Chart 4
Source: Thomson Reuters Legal Tracker Customer Survey
InternalExternal
0
20
40
60
80
100
Source: Thomson Reuters Legal Tracker
100
150
250
350
450
550
200
300
400
500
63%
37%
60%
40%
59%
41%
60%
40%
57%
43%
Hourly Rates
0
2
4
6
8
10
Chart 2
Thomson Reuters Legal TrackerMltratech Collaborati/Team Connect
76%
41%
41%
30%
29%
2013 2014 2015 2016 2017
Chart 4
Chart 10
Source: Thomson Reuters Legal Tracker
100
150
250
350
450
550
200
300
400
500
Hourly Rates
Partner Index AverageOf Counsel Index AverageAssociate Index AverageLegal Assistant Index AverageParalegal Index Average
Focus on legal operations
Allocating work to law firms that are proactive in showing their value
Internal data security focus
Using technology to simplify workflow and manual processes
Controlling outside counsel costs
Chart #5
Chart #6
Chart #7
Innovated
Have not innovated
41%
59%
19%
17%41%
14%
6%
6%
6%
E-Billing
Documentmanagement
Outsourcing
Project management
AFA/Pricing
Contract management
Thomson Reuters Legal TrackerMitratech Collaborati/Team ConnectT360 – TyMetrixLexisNexis CousellinkSimpleLegalOtherNone
34%
14%
9%
8%
6%
14%
17%
Legal operations
No specialist roles
49%
51%
65%
22%
13%7 or more
4-6 people
1-3 people
Chart #8
Chart #9
Chart #10
Chart #11
Criticized value
Did not criticize value
42%
58%
74%
12%
9%Higher use of fixed fees/AFA
More efficient
Charging less
6%Transparent/regular billing
<20%
<20% - 40% internal:Less efficient
>40% - 70% internal:Optimal efficiency
>70% internal:Less efficient
20%-<30% 30%-<40% 40%-<50% 50%-<60% 60%-<70% 70%-<80% >80%
Proportion of spend that is internal
AttorneysParalegalsLegal opsOther roles
57%
20%
9%
14%
Male
Female
21%
79%
18%
Female in-house
Male in-house
70%
81%
30%
Select male lead partner Select female lead partner
Suggested improvements from clients relating to law firm value
Perceived value from law firms
Source: Acritas Sharplegal survey U.S.

2018 STATE OF CORPORATE LAW DEPARTMENTS
11
SHAPING UP FOR THE NEXT FIVE YEARS – LEGAL DEPARTMENT TOOLKITGuide to a leaner, more effective legal function
COLLATE AND REVIEW METRICS
By keeping track of key metrics, you will be able to assess whether you are improving over time and how you compare with your peer group.
To put together this recommended set of metrics, we have considered three separate pieces of research. First we looked at the metrics legal departments are currently using, as reported in both the Acritas and Thomson Reuters surveys. Then, we looked at the academic model developed by Acritas with its advisory board — the PEER model, which reveals metrics that help departments track performance against the three key legal function goals — to be effective and efficient and to prevent legal risk. We also reviewed the best practices developed by Thomson Reuters where they categorize departments by sophistication, from at worst “chaotic” to at best “predictive.”
The metrics most used by predictive and optimized departments are highlighted with an asterisk.
Key recommended metrics are:
AREA METRIC HOW TO ENHANCE METRIC
Coverage — the scale and scope of your legal responsibility
1. Revenue2. Increasing/decreasing legal work —
defined by the number of matters opened*3. Number of jurisdictions covered
Analyze by practice group or organizational unit and benchmark against peers
P = Preventative 4. Number of regulations to comply with5. Number of legal risks to mitigate6. Level of training (new starters/existing)7. Percent of key meetings with legal representation
Horizon scanningRisk mapping quarterlyWorking with HREmbedding lawyers in the business units
E = Efficient 8. Total legal spend9. External and internal split10. Spend by law firm*11. Spend by matter type*12. Spend by practice group*13. Spend by business unit*14. Number of attorneys/paralegals
Optimal range 40%-70%; allocated internallySavings from invoice review*Requiring matter budgetsBenchmarking against peers
E = Effective 15. Value of settlements16. Value of fines17. Commercial value-add18. Organizational effectiveness — number
of matters closed*
Use preventive measuresRegularly audit complianceBusiness and financial skills
R = Review 19. Legal spend as a proportion of revenue 20. Satisfaction of internal users 21. Feedback from external lawyers
Review by business unitAnalyze feedbackAnalyze feedback
2018 STATE OF CORPORATE LAW DEPARTMENTS
12
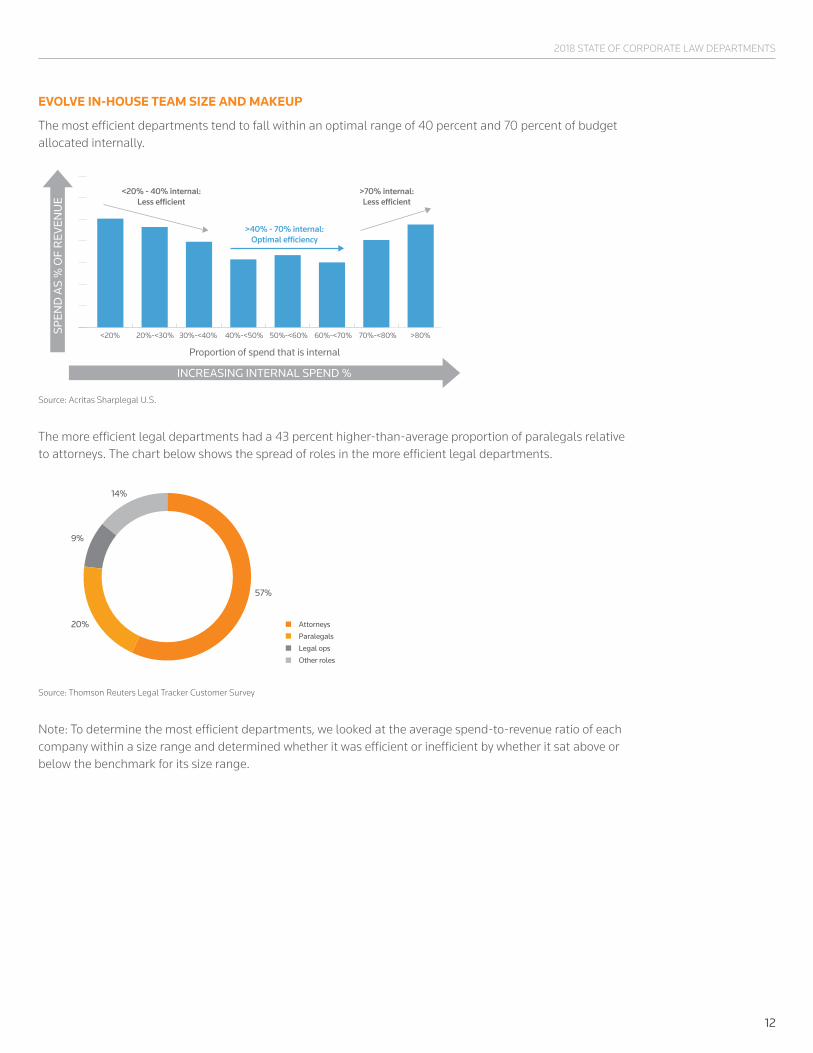
EVOLVE IN-HOUSE TEAM SIZE AND MAKEUP
The most efficient departments tend to fall within an optimal range of 40 percent and 70 percent of budget allocated internally.
0
20
40
60
80
10037% 40% 41% 40% 43%
63% 60% 59% 60% 57%
2013 2014 2015 2016 2017
InternalExternal
Chart 2
Thomson Reuters Legal TrackerMltratech Collaborati/Team Connect
76%
41%
41%
30%
29%
2013 2014 2015 2016 2017
Chart 4
Source: Thomson Reuters Legal Tracker Customer Survey
Chart 10
100
150
250
350
450
550
200
300
400
500
Hourly Rates
Partner Index AverageOf Counsel Index AverageAssociate Index AverageLegal Assistant Index AverageParalegal Index Average
Focus on legal operations
Allocating work to law firms that are proactive in showing their value
Internal data security focus
Using technology to simplify workflow and manual processes
Controlling outside counsel costs
19%
17%41%
14%
6%
6%
6%
E-Billing
Documentmanagement
Outsourcing
Project management
AFA/Pricing
Contract management
65%
22%
13%7 or more
4-6 people
1-3 people
74%
12%
9%Higher use of fixed fees/AFA
More efficient
Reduce rates/charge less
6%Transparent/regular billing
AttorneysParalegalsLegal opsOther roles
57%
20%
9%
14%
Source: Thomson Reuters Legal Tracker Customer Survey
16%
Female in-house
Male in-house
75%
84%
25%
Male external Female external
>70% internal:Less efficient
70%-<80% >80%
Chart #1
Chart #2
Chart #3
Chart 1
2013 2014 2015 2016 2107
Innovated
Have not innovated
Chart 2
41%
59%
Thomson Reuters Legal TrackerMltratech Collaborati/Team ConnectT360 – TyMetrixLexisNexis CousellinkSimpleLegalOtherNone
Chart 3
7.5 7.7 7.7 7.8 8.1
2013 2014 2015 2016 2017 2013 2014 2015
Source: Acritas’ Sharplegal US and Acritas Star lawyer survey (compensation)
Chart 4
Source: Thomson Reuters Legal Tracker Customer Survey
Chart 5
Chart 6
What Ebilling System Do You Use?
Chart 7
Chart 8
Source: Acritas Sharplegal US
InternalExternal
Chart 11
Chart 10
0
20
40
60
80
100
Source: Thomson Reuters Legal Tracker
100
150
250
350
450
550
200
300
400
500
63%
37%
60%
40%
59%
41%
60%
40%
57%
43%
Hourly Rates
0
2
4
6
8
10
Chart #4
Chart #3
Chart 1
2013 2014 2015 2016 2107
Chart 2
Chart 3
7.5 7.7 7.7 7.8 8.1
2013 2014 2015 2016 2017 2013 2014 2015
Source: Acritas’ Sharplegal US and Acritas Star lawyer survey (compensation)
Chart 4
Source: Thomson Reuters Legal Tracker Customer Survey
InternalExternal
0
20
40
60
80
100
Source: Thomson Reuters Legal Tracker
100
150
250
350
450
550
200
300
400
500
63%
37%
60%
40%
59%
41%
60%
40%
57%
43%
Hourly Rates
0
2
4
6
8
10
Chart 2
Thomson Reuters Legal TrackerMltratech Collaborati/Team Connect
76%
41%
41%
30%
29%
2013 2014 2015 2016 2017
Chart 4
Chart 10
Source: Thomson Reuters Legal Tracker
100
150
250
350
450
550
200
300
400
500
Hourly Rates
Partner Index AverageOf Counsel Index AverageAssociate Index AverageLegal Assistant Index AverageParalegal Index Average
Focus on legal operations
Allocating work to law firms that are proactive in showing their value
Internal data security focus
Using technology to simplify workflow and manual processes
Controlling outside counsel costs
Chart #5
Chart #6
Chart #7
Innovated
Have not innovated
41%
59%
19%
17%41%
14%
6%
6%
6%
E-Billing
Documentmanagement
Outsourcing
Project management
AFA/Pricing
Contract management
Thomson Reuters Legal TrackerMitratech Collaborati/Team ConnectT360 – TyMetrixLexisNexis CousellinkSimpleLegalOtherNone
34%
14%
9%
8%
6%
14%
17%
Legal operations
No specialist roles
49%
51%
65%
22%
13%7 or more
4-6 people
1-3 people
Chart #8
Chart #9
Chart #10
Chart #11
Criticized value
Did not criticize value
42%
58%
74%
12%
9%Higher use of fixed fees/AFA
More efficient
Charging less
6%Transparent/regular billing
<20%
<20% - 40% internal:Less efficient
>40% - 70% internal:Optimal efficiency
>70% internal:Less efficient
20%-<30% 30%-<40% 40%-<50% 50%-<60% 60%-<70% 70%-<80% >80%
Proportion of spend that is internal
AttorneysParalegalsLegal opsOther roles
57%
20%
9%
14%
Male
Female
21%
79%
18%
Female in-house
Male in-house
70%
81%
30%
Select male lead partner Select female lead partner
Suggested improvements from clients relating to law firm value
Perceived value from law firms
Source: Acritas Sharplegal U.S.
The more efficient legal departments had a 43 percent higher-than-average proportion of paralegals relative to attorneys. The chart below shows the spread of roles in the more efficient legal departments.
0
20
40
60
80
10037% 40% 41% 40% 43%
63% 60% 59% 60% 57%
2013 2014 2015 2016 2017
InternalExternal
Chart 2
Thomson Reuters Legal TrackerMltratech Collaborati/Team Connect
76%
41%
41%
30%
29%
2013 2014 2015 2016 2017
Chart 4
Source: Thomson Reuters Legal Tracker Customer Survey
Chart 10
100
150
250
350
450
550
200
300
400
500
Hourly Rates
Partner Index AverageOf Counsel Index AverageAssociate Index AverageLegal Assistant Index AverageParalegal Index Average
Focus on legal operations
Allocating work to law firms that are proactive in showing their value
Internal data security focus
Using technology to simplify workflow and manual processes
Controlling outside counsel costs
19%
17%41%
14%
6%
6%
6%
E-Billing
Documentmanagement
Outsourcing
Project management
AFA/Pricing
Contract management
65%
22%
13%7 or more
4-6 people
1-3 people
74%
12%
9%Higher use of fixed fees/AFA
More efficient
Reduce rates/charge less
6%Transparent/regular billing
AttorneysParalegalsLegal opsOther roles
57%
20%
9%
14%
Source: Thomson Reuters Legal Tracker Customer Survey
16%
Female in-house
Male in-house
75%
84%
25%
Male external Female external
>70% internal:Less efficient
70%-<80% >80%
Chart #1
Chart #2
Chart #3
Chart 1
2013 2014 2015 2016 2107
Innovated
Have not innovated
Chart 2
41%
59%
Thomson Reuters Legal TrackerMltratech Collaborati/Team ConnectT360 – TyMetrixLexisNexis CousellinkSimpleLegalOtherNone
Chart 3
7.5 7.7 7.7 7.8 8.1
2013 2014 2015 2016 2017 2013 2014 2015
Source: Acritas’ Sharplegal US and Acritas Star lawyer survey (compensation)
Chart 4
Source: Thomson Reuters Legal Tracker Customer Survey
Chart 5
Chart 6
What Ebilling System Do You Use?
Chart 7
Chart 8
Source: Acritas Sharplegal US
InternalExternal
Chart 11
Chart 10
0
20
40
60
80
100
Source: Thomson Reuters Legal Tracker
100
150
250
350
450
550
200
300
400
500
63%
37%
60%
40%
59%
41%
60%
40%
57%
43%
Hourly Rates
0
2
4
6
8
10
Chart #4
Chart #3
Chart 1
2013 2014 2015 2016 2107
Chart 2
Chart 3
7.5 7.7 7.7 7.8 8.1
2013 2014 2015 2016 2017 2013 2014 2015
Source: Acritas’ Sharplegal US and Acritas Star lawyer survey (compensation)
Chart 4
Source: Thomson Reuters Legal Tracker Customer Survey
InternalExternal
0
20
40
60
80
100
Source: Thomson Reuters Legal Tracker
100
150
250
350
450
550
200
300
400
500
63%
37%
60%
40%
59%
41%
60%
40%
57%
43%
Hourly Rates
0
2
4
6
8
10
Chart 2
Thomson Reuters Legal TrackerMltratech Collaborati/Team Connect
76%
41%
41%
30%
29%
2013 2014 2015 2016 2017
Chart 4
Chart 10
Source: Thomson Reuters Legal Tracker
100
150
250
350
450
550
200
300
400
500
Hourly Rates
Partner Index AverageOf Counsel Index AverageAssociate Index AverageLegal Assistant Index AverageParalegal Index Average
Focus on legal operations
Allocating work to law firms that are proactive in showing their value
Internal data security focus
Using technology to simplify workflow and manual processes
Controlling outside counsel costs
Chart #5
Chart #6
Chart #7
Innovated
Have not innovated
41%
59%
19%
17%41%
14%
6%
6%
6%
E-Billing
Documentmanagement
Outsourcing
Project management
AFA/Pricing
Contract management
Thomson Reuters Legal TrackerMitratech Collaborati/Team ConnectT360 – TyMetrixLexisNexis CousellinkSimpleLegalOtherNone
34%
14%
9%
8%
6%
14%
17%
Legal operations
No specialist roles
49%
51%
65%
22%
13%7 or more
4-6 people
1-3 people
Chart #8
Chart #9
Chart #10
Chart #11
Criticized value
Did not criticize value
42%
58%
74%
12%
9%Higher use of fixed fees/AFA
More efficient
Charging less
6%Transparent/regular billing
<20%
<20% - 40% internal:Less efficient
>40% - 70% internal:Optimal efficiency
>70% internal:Less efficient
20%-<30% 30%-<40% 40%-<50% 50%-<60% 60%-<70% 70%-<80% >80%
Proportion of spend that is internal
AttorneysParalegalsLegal opsOther roles
57%
20%
9%
14%
Male
Female
21%
79%
18%
Female in-house
Male in-house
70%
81%
30%
Select male lead partner Select female lead partner
Suggested improvements from clients relating to law firm value
Perceived value from law firms
Source: Thomson Reuters Legal Tracker Customer Survey
Note: To determine the most efficient departments, we looked at the average spend-to-revenue ratio of each company within a size range and determined whether it was efficient or inefficient by whether it sat above or below the benchmark for its size range.

2018 STATE OF CORPORATE LAW DEPARTMENTS
13
CONTINUOUS REVIEW OF TECHNOLOGY AND INNOVATION
For legal departments, putting in place systems that create better management information and controls can only help to enable a more efficient and smarter approach. The diagram below shows examples of innovation given by legal departments in Acritas’ survey this year, plotted on a spectrum from incremental to transformational.
INCREMENTAL > BREAKTHROUGH > TRANSFORMATIONAL >
• Alternatives to law firms, e.g., contract lawyers
• Legal managed services• Estimating tools and AFAs• Online education• Document management system
• Contract management system• Legal project management system• E-Billing• E-Signatures• Research & knowledge database• Law firm dashboards to view legal work
• Analytical tools• Algorithms• Warning systems• Predictions• Tracking compliance
Source: Acritas Sharplegal U.S.
DRIVE HIGH PERFORMANCE THROUGH PREFERRED SUPPLIER ARRANGEMENTS AND DEVELOPMENT OF IN-HOUSE SKILLS
A key factor relating to high performance, from the external lawyer perspective, was the “mindset” of in-house legal buyers when appointing and managing their lawyers. Those who took a collaborative, open, trusting and respectful approach were far more likely to yield better results for their organization, because the internal and external lawyers were working together as one team.
Interestingly, panels were an area of great dissatisfaction for some external lawyers, although for others they worked extremely well. Where panels were used as a vehicle to create business partner relationships, the best outcome was achieved. Key to this was being open and honest about work availability and criteria for allocation, as well as spending time building knowledge about the clients’ business and the way they like to work. When panels were used as a front to get rates down and added value up, while work continued to go to preferred providers, often off-panel, the biggest breakdowns in relationships were observed.
In an Acritas survey of external Star lawyers asking how their legal department clients could improve, project management skills came up top. Effective communication was a key success factor, especially considering that scope changed on two out of three matters.
Typical components of good management included:
PROJECT MANAGEMENT COMPONENT FAILURE RATE
Bring in external lawyers at the right time 26%
Provide sufficient background information — particularly around how the matter relates to company goals, the risk appetite and the parties involved
49%
Have an up-front discussion about servicing preferences, pricing and resourcing 36%
Set realistic timelines 42%
Respond quickly to inquiries 25%
Give access to internal business people where required 21%
Source: Acritas Star Lawyer survey — Appraising clients

2018 STATE OF CORPORATE LAW DEPARTMENTS
14
INCREASE DIVERSITY TO GET A BETTER RESULT
A study of more than 1,000 reviews of law firm performance revealed that male and female lead partners perform equally well. A mixed-gender legal team, however, performs significantly better than a single-gender legal team. Acritas and Thomson Reuters recommend that 1 in 3 matters be allocated to a female lead to encourage law firm diversity at the senior levels and accelerate the growth of female equity partners. We need a 22nd metric to track proportion of matters awarded by gender! In addition, all matters requiring a team should have both genders represented.
Seventy-nine percent of the senior U.S. in-house counsel that Acritas interviewed in 2017 were male. Male in-house counsel are less likely to select female external lawyers than their female counterparts as leads on their matters, which means the majority of power in law firms continues to lie with men. If in-house buyers, especially men, could consciously increase the number of female lead partners they select, the change in the balance of power will accelerate.
0
20
40
60
80
10037% 40% 41% 40% 43%
63% 60% 59% 60% 57%
2013 2014 2015 2016 2017
InternalExternal
Chart 2
Thomson Reuters Legal TrackerMltratech Collaborati/Team Connect
76%
41%
41%
30%
29%
2013 2014 2015 2016 2017
Chart 4
Source: Thomson Reuters Legal Tracker Customer Survey
Chart 10
100
150
250
350
450
550
200
300
400
500
Hourly Rates
Partner Index AverageOf Counsel Index AverageAssociate Index AverageLegal Assistant Index AverageParalegal Index Average
Focus on legal operations
Allocating work to law firms that are proactive in showing their value
Internal data security focus
Using technology to simplify workflow and manual processes
Controlling outside counsel costs
19%
17%41%
14%
6%
6%
6%
E-Billing
Documentmanagement
Outsourcing
Project management
AFA/Pricing
Contract management
65%
22%
13%7 or more
4-6 people
1-3 people
74%
12%
9%Higher use of fixed fees/AFA
More efficient
Reduce rates/charge less
6%Transparent/regular billing
AttorneysParalegalsLegal opsOther roles
57%
20%
9%
14%
Source: Thomson Reuters Legal Tracker Customer Survey
16%
Female in-house
Male in-house
75%
84%
25%
Male external Female external
>70% internal:Less efficient
70%-<80% >80%
Chart #1
Chart #2
Chart #3
Chart 1
2013 2014 2015 2016 2107
Innovated
Have not innovated
Chart 2
41%
59%
Thomson Reuters Legal TrackerMltratech Collaborati/Team ConnectT360 – TyMetrixLexisNexis CousellinkSimpleLegalOtherNone
Chart 3
7.5 7.7 7.7 7.8 8.1
2013 2014 2015 2016 2017 2013 2014 2015
Source: Acritas’ Sharplegal US and Acritas Star lawyer survey (compensation)
Chart 4
Source: Thomson Reuters Legal Tracker Customer Survey
Chart 5
Chart 6
What Ebilling System Do You Use?
Chart 7
Chart 8
Source: Acritas Sharplegal US
InternalExternal
Chart 11
Chart 10
0
20
40
60
80
100
Source: Thomson Reuters Legal Tracker
100
150
250
350
450
550
200
300
400
500
63%
37%
60%
40%
59%
41%
60%
40%
57%
43%
Hourly Rates
0
2
4
6
8
10
Chart #4
Chart #3
Chart 1
2013 2014 2015 2016 2107
Chart 2
Chart 3
7.5 7.7 7.7 7.8 8.1
2013 2014 2015 2016 2017 2013 2014 2015
Source: Acritas’ Sharplegal US and Acritas Star lawyer survey (compensation)
Chart 4
Source: Thomson Reuters Legal Tracker Customer Survey
InternalExternal
0
20
40
60
80
100
Source: Thomson Reuters Legal Tracker
100
150
250
350
450
550
200
300
400
500
63%
37%
60%
40%
59%
41%
60%
40%
57%
43%
Hourly Rates
0
2
4
6
8
10
Chart 2
Thomson Reuters Legal TrackerMltratech Collaborati/Team Connect
76%
41%
41%
30%
29%
2013 2014 2015 2016 2017
Chart 4
Chart 10
Source: Thomson Reuters Legal Tracker
100
150
250
350
450
550
200
300
400
500
Hourly Rates
Partner Index AverageOf Counsel Index AverageAssociate Index AverageLegal Assistant Index AverageParalegal Index Average
Focus on legal operations
Allocating work to law firms that are proactive in showing their value
Internal data security focus
Using technology to simplify workflow and manual processes
Controlling outside counsel costs
Chart #5
Chart #6
Chart #7
Innovated
Have not innovated
41%
59%
19%
17%41%
14%
6%
6%
6%
E-Billing
Documentmanagement
Outsourcing
Project management
AFA/Pricing
Contract management
Thomson Reuters Legal TrackerMitratech Collaborati/Team ConnectT360 – TyMetrixLexisNexis CousellinkSimpleLegalOtherNone
34%
14%
9%
8%
6%
14%
17%
Legal operations
No specialist roles
49%
51%
65%
22%
13%7 or more
4-6 people
1-3 people
Chart #8
Chart #9
Chart #10
Chart #11
Criticized value
Did not criticize value
42%
58%
74%
12%
9%Higher use of fixed fees/AFA
More efficient
Charging less
6%Transparent/regular billing
<20%
<20% - 40% internal:Less efficient
>40% - 70% internal:Optimal efficiency
>70% internal:Less efficient
20%-<30% 30%-<40% 40%-<50% 50%-<60% 60%-<70% 70%-<80% >80%
Proportion of spend that is internal
AttorneysParalegalsLegal opsOther roles
57%
20%
9%
14%
Male
Female
21%
79%
18%
Female in-house
Male in-house
70%
81%
30%
Select male lead partner Select female lead partner
Suggested improvements from clients relating to law firm value
Perceived value from law firms
Source: Acritas Sharplegal U.S.
DEVOTE TIME TO PRO BONO WORK TO GIVE BACK AND BUILD RELATIONSHIPS
47% of U.S. legal departments have carried out pro bono in the last 12 months. Aside from being a good thing to do, collaborating with external suppliers like law firms on pro bono efforts is a fantastic way to build deeper relationships.
Source: Acritas Sharplegal survey U.S., base 402, January-October 2017

2018 STATE OF CORPORATE LAW DEPARTMENTS
15
REPORT CONTRIBUTORS
CONTACT DETAILS FOR FURTHER INFORMATION ABOUT THOMSON REUTERS AND ACRITAS
Acritas: To learn more, contact Acritas at [email protected].
Thomson Reuters: To learn more, contact your client success manager or the Legal Tracker sales team at [email protected].
LISA HART SHEPHERD, CEO ACRITAS
Lisa is the founder and CEO of Acritas. Lisa specializes in creating effective research tools and analyzing the resulting data to help legal departments, law firms and ALSPs deliver higher performance.
Acritas provides peer group benchmark data to legal departments on spend levels, team size and remuneration. This data is collated through its annual global survey of more than 2,000 legal departments.
Through its analytics platform, Acritas also provides a database of recommended Star lawyers, as identified by the in-house counsel interviewed.
Best-practice resources, such as the Acritas PEER model, are also available on Acritas Analytics for legal departments.
To access these resources, senior in-house counsel need to participate in a 25-minute telephone interview.
CARLY TOWARD, THOMSON REUTERS
Carly is director of Support + Business Operations at Thomson Reuters. Carly is an attorney with over 10 years of experience working with legal software solutions and providing insight to corporate legal department customers.
Thomson Reuters Legal Tracker has nearly 1,200 corporate legal department customers, from the world’s largest legal departments to solo general counsel.
Through its analytics feature embedded in the Legal Tracker product, Thomson Reuters provides real-time benchmarks based on more than $73B of approved legal spend and matter management data.
Best-practice resources — for example, the LDO Index — are available from legaltracker.com.
To learn more about how to harness the power of Legal Tracker, contact your client success manager or the Legal Tracker sales team.

© 2018 Thomson Reuters S051439/1-18
ASSOCIATION CONTRIBUTOR PRIMARY CONTRIBUTORS