rev frbclev 195608
TRANSCRIPT

MONTHLY
Buiitma evieutF E D E R A L R E S E R V E BANK of C L E V E L A N D
I N T H I S I S S U E
Changing Fortunes of Bituminous Coal (3) Impact on Employment and
Community Development.............. 2
Notes................................................ 13
Continuing Boom in Price of Farm Land . .14
HARLAN
BITUMINOUS COAL fields underlie about one-third of the area of the Fourth Federal Reserve District.
The varying impact of developments in the coal mining industry upon three local communities is discussed in an article beginning on page 2.
CADIZUNIONTOWN
Digitized for FRASER http://fraser.stlouisfed.org/ Federal Reserve Bank of St. Louis

Changing Fortunes of Bituminous Coal(3) Impact on Employment and Community Development
EDITOR’S NOTE: This is the third of a series of articles about bituminous coal. The first, entitled “ The Comeback of Coal,” appeared in the February 1956 issue of the Review. The second, ‘ ‘ New Techniques Aid the Industry’s Recovery, ’ ’ was published in the April 1956 issue.
A fourth and final article, discussing the future of bituminous coal, will appear in an early issue.
Co a l is t r u l y king in many mining communities where it is the only industry of any size and few alternative job opportu
nities exist. When the number of men actively employed in the coal fields was cut in half during the last eight years, serious unemployment problems arose in dozens of mining towns. Despite substantial out-migration, they remain chronic labor surplus areas. Many such areas are located in the Fourth Federal Reserve District.
Not all areas have been affected equally or in the same manner. As readily accessible reserves were being worked out in some areas, mining activity has been stepped up in others. But, even though employment may have remained fairly stable in some localities, coal mining operations have still left their mark on the land.
Position of Fourth District in Soft Coal Industry
Coal’s changing fortunes are of importance to this Federal Reserve District. The District lies athwart the great Appalachian coal region and has supplied a large part of the nation’s soft coal needs for decades. Currently, about one-third of the industry’s output comes from mines within the Fourth District. Seventy-five years ago, the propor
tion was over one-half, but it has declined gradually over the years as southern and midwestern fields have been developed.
Reserves of coal in the Fourth District do not represent as large a share of the nation’s total as the production record would seem to indicate. Only about 18 percent of the country ’s soft coal reserves lie within the District’s boundaries. The District’s prominence as a coal producer is attributable to the high quality and accessibility of its coals rather than the quantity available, and also to its strategic location near the center of the nation’s prime coal market — the United States industrial belt. That belt may be identified as being roughly 300 miles wide, with the center running approximately from Chicago through Pittsburgh to Philadelphia on the East Coast. The concentration of heavy industry in the western two-thirds of the belt is partly a result of the historic wedding of Lake Superior iron ores and Pennsylvania coals.
Since a third of the coal industry’s output comes from mines within the District, it is not surprising to find that industry trends within the District almost exactly parallel industry trends nationally. This is true of changes in the level of production, the declines in mine employment, the increased use of machines and the allied gains in pro
2
Digitized for FRASER http://fraser.stlouisfed.org/ Federal Reserve Bank of St. Louis

ductivity, and almost any other facet of bituminous coal mining activity.
EM PLO YM ENT A N D U N E M P L O Y M E N T
There has been a long, persistent downtrend in employment in the nation’s soft coal fields since the 1923 peak was reached. But, through 1945, it was a gradual process, with minor ups and downs, averaging less than 2 percent attrition each year, or about the same percentage as the average rate of gain in productivity during the period. After a temporary upturn in 1946, 1947, and 1948, the number of men actively engaged in the bituminous coal fields was reduced by more than half during the next eight years.
Within the Fourth District, employment at bituminous mines dropped from 162,000 miners in 1948 to less than 75,000 early this year. Mine employment was reduced as production dropped during coal’s postwar slump, but the employment decline was intensified as increased mechanization and new mining techniques caused productivity to spurt upwards.
The employment decline persisted through 1955 even though production turned up, as illustrated by an accompanying chart. Em
ployment continued downward this year, but at a slower rate, while impressive year-to-year gains in production were again scored in the first part of 1956.
Dwindling employment may seem incompatible with the much publicized comeback of coal since 1954, but the explanation is clear. A lengthened work week has been partly responsible for the output gains registered by a smaller work force. Increased productivity, however, has been the major factor. The effect of productivity gains that have been achieved since 1948 is shown in the accompanying chart by the widening gap between the curves depicting production and man-days worked.
With modern mechanized mines demonstrating productivity rates more than double the present average, further substantial improvements in this direction appear inevitable. Thus, the relatively favorable future now being envisioned for the coal industry does not necessarily carry over to mine employment. For the near term, at least, the improvement in the demand for coal offers little prospect of alleviating the serious unemployment which plagues many mining communities.
EMPLOYMENT, PRODUCTION AND MAN-DAYS WORKED Bituminous Coal Mines, Fourth District
Coal's com eback has
not halted the decline
in mine employment. The
J955 increase in pro
duction was effected by
an ex pan s i on of the
work week coupled with
further gains in pro
ductivity.
3
Digitized for FRASER http://fraser.stlouisfed.org/ Federal Reserve Bank of St. Louis

Chronic Unemployment Persists in Many Mining Areas
Unemployed miners do not bulk large in the total employment picture of the Fourth District. The nearly 90,000 miners laid off by mines of the District since 1948 — if all were still unemployed today—would comprise only about iy 2 percent of the District’s labor force of 5,600,000 persons. However, many mining communities have few alternative job opportunities to offer the disemployed miner. Job openings in some areas cannot be found, even within an hour or more of commuting time from ex-miners’ homes. These areas, most of which have little or no industrial development except mining, are the ones hardest hit by coal’s rapid technological advances during the past few years.
Eastern Kentucky and the fringe counties around the Pittsburgh metropolitan area contain many communities where layoffs at the mines have created local — but nonetheless serious — unemployment problems. On the other hand, job-hunting miners in eastern Ohio and sections of western Pennsylvania apparently have, to a large extent, been absorbed in the vast manufacturing complex along the upper Ohio River, around Pittsburgh and in the Mahoning Valley.
Eleven areas of substantial labor surplus associated with coal lie wholly or partly in the Fourth District, according to the latest listing of the U. S. Bureau of Employment Security. As can be seen from the accompanying map, they are concentrated in the eastern Kentucky coal field and around—but not within easy commuting distance of—the Pittsburgh industrial area.(1)
Three Areas
Three areas in the Fourth District illustrate the varying effects of coal’s impact upon the local economy. The Uniontown- Connellsville area in western Pennsylvania and the Harlan area in eastern Kentucky have suffered large reductions in employment during the past decade. In both areas, a sub
stantial proportion of the labor force is currently unemployed. The unemployment problem in the Uniontown-Connellsville area has been accentuated by the near exhaustion of its famous reserves of coking coal, while employment in the Harlan area has been affected merely by the changing fortunes of coal. Nevertheless, there is much optimism around Uniontown these days as local efforts to attract new industry begin to bear fruit. In Harlan, on the other hand, no local organization has been formed to find ways of alleviating the unemployment problem.
An entirely different situation is exemplified by the Cadiz area of southeastern Ohio. Mining employment is currently about the same as it was 35 years ago. However, stripping operations will eventually turn over about a third of Harrison County’s rolling farm land. During the past few years, the
( i ) Designation as a “ substantial labor surplus area” by B.E.S. means that 6 percent or more of the labor force is xinemployed and that the number of job seekers is expected to exceed the number of job openings during the next four months. (Actually, unemployment runs much higher than 6 percent in most of the areas shown on the accompanying map.) The coal areas shown on the map accounted for 11 out of 13 “ substantial surphis labor areas” in the entire Fourth District as of May 1956.
4
Digitized for FRASER http://fraser.stlouisfed.org/ Federal Reserve Bank of St. Louis

reclamation efforts of a large coal company in the Cadiz area have shown that the stripped land can be returned to some productive use.
A brief look at each of these three areas will show the different ways in which coal has affected their local economies.
F A Y E T T E C O U N T Y , P E N N S Y L V A N IA
At the foothills of the Appalachians in southwestern Pennsylvania, th e Uniontown-Con-nelsville area has undergone
serious buffetings by the changing fortunes of coal. In addition to the reduced labor requirements brought about by the industry’s trends, Fayette County’s famous coking-coal reserves are fast being worked out and will probably be virtually exhausted in another ten years. The citizens of the area are now trying to replace coal as their economic base with a two-pronged attack—first, by raising funds to attract new industry and second, by a concerted effort to redevelop the blighted areas of their county.
The Uniontown-Connellsville area was once the coke center of the United States. Con- nellsville coal, and coke made therefrom, were for years synonomous with the best metallurgical grades. America’s steel industry was literally raised on Fayette County’s coals. Thus, the coal and coke industries climbed with the fortunes of steel following the Civil War.
In those earlier days, it was most economical to convert the coal into coke at the mine; coal mining boomed in Fayette County as beehive ovens were built on a large scale around the seemingly limitless supply of rich coals. The beehive coke industry continued to expand in the area until 1909. Thereafter such coking operations declined, as the more efficient by-product ovens took over the assignment of supplying the steel industry’s needs. Today, several plants still operate beehive ovens, intermittently, on the outskirts of Uniontown but they are the sole survivors of
what once was one of the area’s major industries.
The coal business around Uniontown and Connellsville outlasted the coke industry, reaching its peak during World War I. The tonnage of coal produced from the area’s 8- foot seam remained close to peak levels through the 1920’s. By the 1930’s, however, it was evident that the most valuable portion of the Pittsburgh bed—the rich coking coals —were being exhausted. The downtrend in coal mining activity had begun. With only a temporary interruption during World War II, the decline has continued to the present.
Mining Decline = Unemployment + Out-Migration
As production dropped from its World War II high, the number of men working in the mines has shrunk steadily each year. From about 21,300 miners in 1942, or more than 40 percent of the Uniontown-Connells- ville area’s employment total, the number reached 3,500 miners this year or less than 10 percent of the total. The reduction in mine employment of some 17,800 workers just
One of the few beehive coke plants still operating at Uniontown reflects the heritage of Fayette County.
5
Digitized for FRASER http://fraser.stlouisfed.org/ Federal Reserve Bank of St. Louis

about equalled the over-all employment loss in the area during this period since few other industries increased their work forces.
Fayette County had some industry to cushion the blow that coal’s decline has dealt to its cconomy. But, the other industry of the area was far from adequate to absorb the large numbers of miners who have been laid off and the younger people who have entered the labor force. Many of the younger people have left to seek work elsewhere. They have gone mostly to the manufacturing centers in Ohio around Youngstown and Cleveland. Some also have gone to the auto plants in Detroit and to the Federal government offices in Baltimore and Washington. After the younger people get established in their new community they often begin pressing their elders to join them. Increasing numbers of older residents have been leaving Fayette County during the last several years.
The total population of Fayette County declined by about 10,000 between 1940 and 1950 and by another 7,000 through 1955; the current population count is estimated to be around 183,000. Estimates of the total number of persons who have left the county during the same period are not available. The number, however, must be large.(2)
The Commuters
Commuting to work in adjoining counties is practiced on a large scale in the Uniontown- Connellsville area. At shift changes, the highways towards the steel mills around Pittsburgh, and west towards the coal mines in neighboring Greene County(3), fill up with cars of Fayette County residents hurrying to or from work. Currently, it is estimated that more than 11,100 commuters work outside the county. That amounts to almost one-
(2) A story told of a picnic held in Cleveland last year is illustrative. Several ex-Fayette County couples planned to hold a picnic for some of their old friends and neighbors who had moved to the Cleveland area. To their surprise, about 1,800 persons showed up to make the affair a grand reunion.(3) Greene County (jiist west of Fayette County bordering West Virginia) is one of the few counties in the western Pennsylvania field where mining activity has been expanded in the postwar period. The largest mine in the United States is in Greene County near Carmichaels and Masontown.
fifth of the Uniontown-Connellsville resident labor force.
Without the daily movement of workers out of the county, the local economy of Fayette County would be exhibiting more serious symptoms of distress. Retail sales in the county, in fact, registered less than a 2-percent drop between the 1948 and 1954 Censuses.(4) Bank deposits and loan activity, on the other hand, have risen steadily throughout the postwar period.
The fact remains that 11 percent of the resident labor force of the Uniontown- Connellsville labor market area are unemployed at present. Such a figure is well above tolerable limits even though it represents a considerable improvement over the unemployment picture of two years ago when 20 percent of the labor force, or more than13,000 persons, were unemployed.
The people of Fayette County know what their area needs — new industry. They have set out to get it.
Planning for the Future
Fayette County’s most abundant resources are workers and coal. The coal that remains —though plentiful— lies in seams that are too thin and of too poor quality to prove of strategic value today. Attention, therefore, is focused on the potentialities of the workers.
The notion that ex-coal miners are of strong back and weak mind is a myth. It takes much more than that to be a miner. Ex-miners have generally proven adaptable to a wide variety of semi-skilled and skilled jobs in industry, partly because of their varied experience with mining machinery and equipment. Also, miners are workers; they have been used to being paid on a tonnage basis and they produce well.
The Uniontown Chamber of Commerce has taken the lead in promoting the human resources of Fayette County. In 1951 the
(4) A 2-percent drop in retail sales between 1948 and 1954, although a more favorable showing than that made by certain other coal-mining areas, is still relatively unfavorable. Retail sales in the entire Fourth District, for example, increased 25 percent between the two Census years.
6
Digitized for FRASER http://fraser.stlouisfed.org/ Federal Reserve Bank of St. Louis
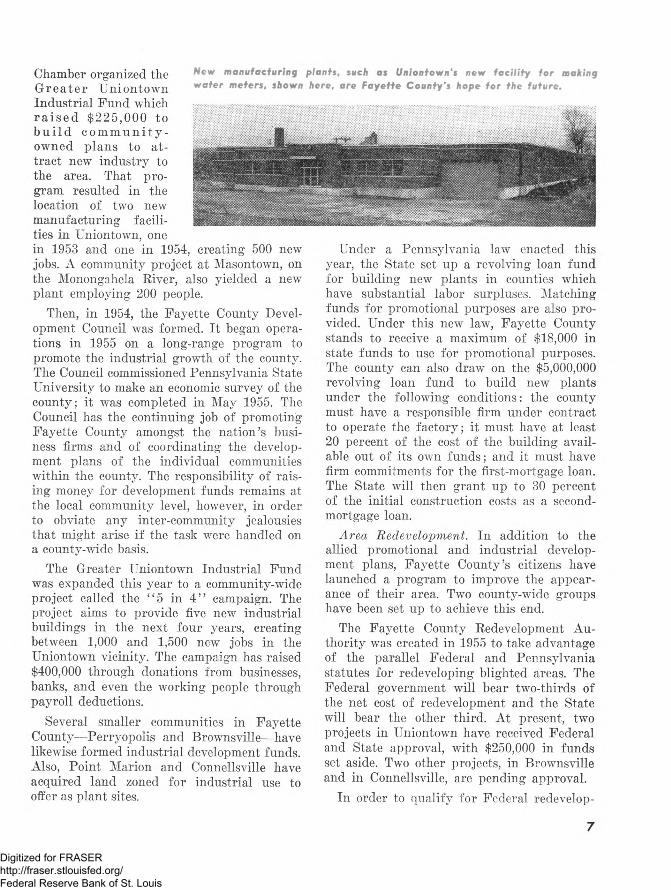
New manufaeturing plants, such as Uniontown's new facility for making water meters, shown here, are Fayette County's hope for the future.
Chamber organized the G reater Uniontown Industrial Fund which r a i s e d $225,000 to b u i l d c o m m u n i t y - owned plans to attract new industry to the area. That program resulted in the location of two new manufacturing facilities in Uniontown, one in 1953 and one in 1954, creating 500 new jobs. A community project at Masontown, on the Monongahela River, also yielded a new plant employing 200 people.
Then, in 1954, the Fayette County Development Council was formed. It began operations in 1955 on a long-range program to promote the industrial growth of the county. The Council commissioned Pennsylvania State University to make an economic survey of the county; it was completed in May 1955. The Council has the continuing job of promoting Fayette County amongst the nation’s business firms and of coordinating the development plans of the individual communities within the county. The responsibility of raising money for development funds remains at the local community level, however, in order to obviate any inter-community jealousies that might arise if the task were handled on a county-wide basis.
The Greater Uniontown Industrial Fund was expanded this year to a community-wide project called the “ 5 in 4 ” campaign. The project aims to provide five new industrial buildings in the next four years, creating between 1,000 and 1,500 new jobs in the Uniontown vicinity. The campaign has raised $400,000 through donations from businesses, banks, and even the working people through payroll deductions.
Several smaller communities in Fayette County— Perryopolis and Brownsville—have likewise formed industrial development funds. Also, Point Marion and Connellsville have acquired land zoned for industrial use to offer as plant sites.
Under a Pennsylvania law enacted this year, the State set up a revolving loan fund for building new plants in counties which have substantial labor surpluses. Matching funds for promotional purposes are also provided. Under this new law, Fayette County stands to receive a maximum of $18,000 in state funds to use for promotional purposes. The county can also draw on the $5,000,000 revolving loan fund to build new plants under the following conditions: the county must have a responsible firm under contract to operate the factory; it must have at least 20 percent of the cost of the building available out of its own funds; and it must have firm commitments for the first-mortgage loan. The State will then grant up to 30 percent of the initial construction costs as a second- mortgage loan.
Area Redevelopment. In addition to the allied promotional and industrial development plans, Fayette County’s citizens have launched a program to improve the appearance of their area. Two county-wide groups have been set up to achieve this end.
The Fayette County Redevelopment Authority was created in 1955 to take advantage of the parallel Federal and Pennsylvania statutes for redeveloping blighted areas. The Federal government will bear two-thirds of the net cost of redevelopment and the State will bear the other third. At present, two projects in Uniontown have received Federal and State approval, with $250,000 in funds set aside. Two other projects, in Brownsville and in Connellsville, are pending approval.
In order to qualify for Federal redevelop
7
Digitized for FRASER http://fraser.stlouisfed.org/ Federal Reserve Bank of St. Louis
ment funds, each city and borough must have its own comprehensive master city plan. To coordinate the over-all planning in the county, the Fayette County Planning Commission has been established. A full-time planner began work July 1, 1956, on planning, zoning and land use studies in the county. Cities and boroughs will still be responsible for their own plan, however.
The people of the Uniontown-Connellsville area view the future with a considerable measure of optimism. The worst shocks to their economy are thought to be behind them. Their current efforts are making the future look much brighter than heretofore.
H A R L A N C O U N T Y , K EN T U C K Y
Harlan County, in the mountainous southeastern corner of Kentucky, is another example of an area where serious commu
nity problems have been tied closely to the fortunes of coal. The county will be recalled by many as the scene of violent episodes in the history of the struggle over unionization. It is a union stronghold today(5), but coal’s technological advances have whittled down considerably the number of dues - paying union members.
Coal mining employs two-thirds of the county’s labor force. Since the postwar employment peak of about 13,200 miners was reached in 1950, more than 6,300 have been laid off or gone elsewhere to work, so that fewer than 6,900 miners are digging coal in Harlan County today. Fifteen years ago, some 15,900 miners were at work in the county.
Production, on the other hand, has not fluctuated widely since 1950. The 1955 tonnage was, in fact, only 3 percent less than the 1950 total, while employment in the interim had dropped almost 50 percent and payrolls in the county had shrunk by more than $6 million.
(5) Miners in the other areas discussed in this article are also union members, for the most part.
The effects of the sharp contraction in employment and income upon the county’s economy cannot be fully measured in a statistical sense since “ what might have been” is not susceptible to any meaningful measurement. It is more illuminating to probe some of the factors in Harlan County’s problem.
The high quality of Harlan’s coals has been the main factor in keeping the county in the coal business. The county’s coals have a low ash and sulphur content and most of it is good coking coal. It is available in quantity, with reserves sufficient to maintain the present production pace for over a hundred years in the future.
Harlan's Competitive Disadvantages
Harlan County is at a competitive disadvantage in several respects. Its coals lie in relatively thin seams, other coal fields are closer to the coal market, and, even in nearby counties, nonunion miners work at lower wages than unionized Harlan.
The average thickness of coal seams in Eastern Kentucky is about 42 inches. A few seams up to 71 inches thick are being worked in Harlan County, but most operations are in seams at about the average for the field. The coal measures run through the mountains, cropping out on all sides. Almost all of the mining is underground although strip and auger methods are used in the few cases where practicable. Drift mines work in from the side of a hill, going in 3 to 4 miles after the coal. The miners’ work clothes have large pads sewn to the knees, because much of the work at the face must be done in a kneeling position.
In the thicker seams, mechanization has proceeded apace, as the industry attempts to maximize production with a minimum work force. Continuous mining is not practicable in seams under 38 inches with present types of machinery. Furthermore, continuous mining techniques are precluded in some areas because of poor roof conditions. Hand loading is mandatory where the roof is too low to permit passage of loading machines. In spite
8
Digitized for FRASER http://fraser.stlouisfed.org/ Federal Reserve Bank of St. Louis

of these limitations, mechanization in Harlan County is increasing as newer mines are opened to replace the older ones that are not adaptable to machine operations. Consequently, the number of men needed to work in the mines is expected to drop further over the near term.
The increased use of machinery underground means that additional coal cleaning plants will be needed. Six plants with a daily capacity of over 12,000 net tons are now in operation in the county, and one more is coming. One company is treating substantial tonnages of Harlan coals at a new washing plant in Corbin with a 12,500-ton daily capacity. The coal—refuse and all— goes directly from the tipple into railroad cars for transport to the cleaning plant nearly 90 miles away. There it is laundered and returned to the railroad cars for the balance of its journey to steel mills on the Lower Lakes.
Harlan County mine operators appear to be unanimous on the point that rail freight differentials are against Harlan. This is a reflection of the fact that the area is literally surrounded by coal fields — each one between it and a prime coal market. Fortunately, the railroads ’ charge is more like a zone rate than a ton-mile rate. Otherwise, little coal would leave the county.
"Trucker" Operations
One factor that keeps Harlan in the competitive race for coal markets is the “ truckers” . Opinion is divided on the relative importance of truck-mine operations in the county, but it appears that such tonnage bulks fairly large in the total and has grown rapidly in the past year. The estimates of the number of miners employed by the truckers at present ranges from 300 to 2,000. Because of the nature of their mining operation, an exact count is virtually impossible to obtain.
The truck-mine system works like this: The owner of coal land makes an agreement with a “ trucker” to operate his mine. The owner agrees to provide the trucker with machinery and haulage equipment, and to pay a stipulated price per ton for all coal dumped at his
tipple, as well as the welfare and retirement fund payment of 40 cents per ton to the mine workers’ union. The trucker, in turn, hires union miners and pays their union dues for them—but negotiates on pay. The pay may be only half scale or the “ gang” may be hired to work on shares or at a piece-rate system. In Harlan County, they must be union men, however.
In many cases, the output of truck mines is bought by a regular mine operator at a discount below his own cost. The mine operator sells the coal over his tipple, mixed with his own output, thus lowering total cost. At present, the tipples of several mines that have been recently shut down are still being operated with trucker coal from nearby sources. Truck coal sells at about a dollar a ton discount.
Truck operations are apparently countenanced by the union, in spite of the fact that the growth of trucker operations has had the effect of narrowing the wage differential between Harlan County mines and the nonunion mines in adjacent counties.
The continued growth of truck operations undoubtedly depends upon a sustained demand for coal. Any decline in demand would hit such marginal operations first of all.
Out-Migration
Trucker operations may have eased the unemployment picture somewhat, but Harlan County has long been a declining labor market, or, stated otherwise, an area of labor surplus. Consequently, there has been considerable out-migration, mainly to the industrial centers to the north.
Harlan County’s population declined from75.300 in 1940 to 71,900 in 1950 and to68,000 in 1955 for a cumulative loss of about7.300 people, or about 10 percent, in 15 years. Some idea of the population growth that “ might have been” can be obtained from the large numbers of people leaving Harlan County during this period. The University of Kentucky estimates that out-migration from Harlan County totaled 20,000 between 1940
9
Digitized for FRASER http://fraser.stlouisfed.org/ Federal Reserve Bank of St. Louis

and 1950 and another 12,300 between 1950 and 1955. The large numbers involved reflect, in part, the area’s higher than average birth rate. Families average about three children each.
It is chiefly the younger people who leave the area. Among the cities to which they go to find work are Louisville, Cincinnati, Hamilton, Detroit, Cleveland, Dayton, Akron and Columbus.
A few statistical measures of economic activity in Harlan County help round out the picture. Total employment in the county has dropped almost as much as mine employment since 1950. Between 1950 and 1955, total employment fell nearly 40 percent while the number of men working in the mines dropped almost 50 percent. Retail sales in the county declined markedly between the Census of 1948 and the Census of 1954.
Deposits at the three banks in the county at the end of 1955 were actually slightly above the 1950 figure, although they had slipped by several percentage points since 1953. The deposit stability may be due largely to the fact that most of the out-migrants have been younger people who had no established accounts. Bank loans, on the other hand, have risen steadily since 1950. Outstanding loan volume at the end of 1955 was one-fourth greater than 1950. Local bankers attributed the increase to a rising volume of real-estate mortgage loans and business loans to oil and lumber companies. Coal companies are not large borrowers at the local banks.
Prospects
Locally, little concern has been voiced about the steady stream of out-migrants from Harlan County. The exodus has been going on for years. No local effort is being made to attract new industry to supply the jobs that would employ the surplus workers.
One positive step that is being taken in Harlan County is the establishment at the regional vocational school of classes to train mine electricians and mechanics how to operate the new machinery going into the mines.
The training is part of the Federal vocational program subsidized under the Smith-Hughes Act. Harlan has one of the 13 regional vocational schools and has conducted mine safety and training classes since 1939.
Under the new program of training for mechanized operations, classes will be given night or day to meet the need for trained men as it arises. Young men are preferred for the training, but there is a problem here as it is often the younger men who display the least interest in going into the mines.
On the regional and state level, some promotional work has been attempted for the Eastern Kentucky area, but no appreciable results have yet been achieved. Harlan’s industrial resources, for example, have been outlined in a monograph published by the Agricultural and Industrial Development Board of Kentucky located at Frankfort. As yet, there has been no response by companies seeking new industrial locations. Therefore, as matters stand now, Harlan County’s fortunes are still tied to coal.
HARRISON C O U N T Y , O H IO
A considerable contrast both to Fayette and to Harlan Counties is offered by H a r r i s o n County, in the hilly southeast
ern section of Ohio. Although it is the leading coal-producing county in Ohio, and has miners making up about half of its work force, it has suffered no chronic unemployment problems similar to those in Pennsylvania and Eastern Kentucky. Rather, the problem facing the area around Cadiz is what to do with its rolling farm land after the stripping shovels have removed all the coal they can reach. This problem is being tackled by the mining companies.
Aside from its coal industry, Harrison County is mainly a rural agricultural area. Dairying and livestock are the predominant types of farming — and the types best suited to the hilly topography. Altogether, there are close to 1,000 farms in the county and about half of them are commercial farms.
10
Digitized for FRASER http://fraser.stlouisfed.org/ Federal Reserve Bank of St. Louis

About half of the labor force of 5,000 persons is working in the coal industry, a fourth in manufacturing and the rest in service industries and on the farm. An earthenware factory at Scio is the only major manufacturing facility in the county, however. Since Wheeling and Steubenville are only about 25 miles distant, and over good highways, trade and service industries have not been expanded. Retail trade in the county has actually been declining since 1951 even though payrolls have remained high. The number of persons living in the county has not changed significantly since 1920.
Mining operations will eventually affect about one-third of the total land area of Harrison County. The major seam now being worked lies fairly fiat under the southeastern third of the county. Hills of varying heights cover this 41// r foot seam, with the coal outcropping around the base of the hills. Since the coal is so near the surface, most of it will be recovered by stripping, or open-cut, mining techniques. At present, about four-fifths of the county’s coal output comes from stripping operations. Reserves in the area are estimated to be sufficient to support the present level of mining operations for at least another 50 years.
Opponents of open-cut mining object strongly to the unsightly spoil piles left in the wake of the huge shovels. Some residents of the Cadiz area are emphatic on the subject. However, a good part of the opposition to strip mining in the Cadiz area has died down since the largest coal operator in the county has demonstrated what can be accomplished in the way of reclamation. Of course, the people who have sold their “ coal farms” for sums far in excess of their value as going farms have not been unhappy.
Spoil Bonk Restoration
When the big shovels move out of a stripped area they leave behind a series of ridges of mixed earth and rock. The ridges parallel the stripping cuts made to bare the coal seam and each ridge represents the top of the pile of
overburden removed from one 55-foot wide cut. These are the spoil banks.
The strata overlying the 4i/o-foot coal seam in the Cadiz area includes layers of hard rock as well as a thick layer of limestone just over the coal. The rock and limestone must be broken up by explosives and moved aside in order to get at the coal. Thus, pieces of broken rock and limestone are sprinkled liberally through the loose earth in the spoil bank.
Prior to 1949, spoil banks in the Cadiz area were voluntarily reforested by many operators, who planted a mixture of hardwoods such as locust, ash, sycamore and maple. The Ohio Reclamation Association, formed by a group of surface mining companies in southeastern Ohio, handled most of the planting. The reforested areas have proven to be good sanctuaries for wild life.
In 1949, Ohio passed a strip-mine law, partly sponsored by the large mining companies, requiring surety bonds be posted to assure that reclamation be done by the operator as spelled out in the new law. The law was amended in 1955. As it reads now, the operator must post a bond of $220 for each acre of coal land before he begins mining operations. The bond is returned when the reclamation is completed and approved by the State.
Reclamation of strip-mined land, as defined in the Ohio law, includes grading the spoil banks to a gently rolling topography, providing access roads and fire lanes, constructing earth dams in the last cut, and planting trees, shrubs, grasses, and legumes wherever revegetation is possible.
What Can Be DoneThe reclamation job done by one company
in Harrison County during the past 5 years has provided quite a contrast to the harsh, rugged contours of a raw spoil bank. Rolling fields of forage crops predominate, with small groups of white-faced Herefords grazing here and there. Tree seedlings are growing on the steeper slopes of the first bank and the last
11
Digitized for FRASER http://fraser.stlouisfed.org/ Federal Reserve Bank of St. Louis

cut. Since 1950, about 70 percent of this company’s reclaimed bank area has been seeded for use as pasture land and the remainder reforested. The general contour of the graded banks, their accessibility, and their soil structure and composition determine the type of restoration.
The company has done considerable experimentation with different mixtures of grasses and legumes for seeding the leveled banks. At first, standard farm mixtures of sweet clover, brome grass, alfalfa and orchard grass were used. More recently, the legumes have been the newer types of creeping alfalfa and birds- foot trefoil. Crown vetch, a new legume, was introduced this year; its roots spread laterally and it shows much promise as a forage crop.
Experimenting with various ways to improve the results of its restoration efforts is a continuous job at this company. It will not be stopped until the company is satisfied that it has found the best solution. For example, the effects of different fertilizer mixtures applied at the time of seeding are now being studied in a series of test plots.
The restored fields support a good stand of forage crops. One reason the growth is so good is the large amounts of limestone which are broken up and mixed with the soil in the open-cut mining process. The Hereford cattle grazed on these fields gain an average of over one pound a day. This is a faster rate than that experienced in adjoining pastures which were not disturbed by strip mining. When the cattle are given their choice between two such fields, they invariably choose to graze on the reclaimed bank area.
Reclamation is a relatively expensive operation when the cost of grading, seeding and planting is measured against the probable value of the land after it has been restored. Using large grading equipment, the total reclamation cost averages somewhere between $150 and $180 per acre, or more than double the average value of farm land in Harrison County. This cost includes going a little further than the Ohio law requires with the
Spoil bank
Photos courtesy Hanna Coal Company
restoration job, but it is felt that the added cost has been justified by the end result.
Spoil bank restoration is more than merely compliance with the law, however, for most large coal operators. Their investment in coal lands and large, expensive equipment usually keep them operating in the same general vicinity for years. Reclamation is partly a civic responsibility and partly good public relations. I f it can be successfully demonstrated that the restored banks can be put to some economic use, then it is also good business, for the land can eventually be sold. After all, coal companies do not usually want to get into the land or cattle businesses.
Failure to comply with the Ohio law means more than just the forfeiture of the $220 per acre bond. I f the law is strictly enforced, the bond forfeiture does not relieve the operator of the responsibility for restoring the spoil bank acreage. Refusal of a state license to conduct further stripping operations is the penalty for noncompliance.
In Summary
The counties of Fayette, Harlan and Harrison serve to illustrate three different aspects of coal’s impact upon local areas. To a large extent, the local problems associated with coal
12
Digitized for FRASER http://fraser.stlouisfed.org/ Federal Reserve Bank of St. Louis

The transition from spoil bank to pasture land in Harrison County is exemplified by these photos.
isture land
in each of those three counties are representative of their parts of the Fourth District.
Harlan County typifies the problems encountered throughout the industrially underdeveloped areas of eastern Kentucky where coal is still king. The main exception is the immediate area around the Huntington-Ash
land metropolitan area where mining does not bulk large in the total industrial picture. Also, the story differs slightly in Clay and Leslie Counties (next to Harlan) in that coal operations are largely nonunion.
The reclamation of spoil banks in Harrison County shows progress being made on a problem that faces coal operators, as well as other surface mining companies, throughout southeastern Ohio. The extent of progress varies somewhat with local topography and soil conditions. Progress varies also among mining companies, but, with the incentives supplied by the new Ohio law, recent developments have marked a big step forward in improving land use and values in the Ohio stripping area.
Fayette County, on the other hand, is faced with a problem infrequently encountered— dwindling reserves of economically recoverable coal. The problem has not affected many areas in the bituminous coal region of Pennsylvania. Where it has, the effects have been mitigated by the community’s nearness to the Pittsburgh manufacturing complex. To the extent that the problem affects other mining localities in the future, community development programs similar to those used in the Uniontown area will be needed to attract new industry.
NOTES
Recent public addresses on topics bearing on monetary policy include:
Address by Woodlief Thomas, Economic Adviser, Board of Governors of the Federal Reserve System, before the Wisconsin Bankers Association Convention, Milwaukee, June 20, 1956. Subject: “ Economic Trends and Monetary Policy.”
Paper delivered by Merle Hostetler, Director of Research, Federal Reserve Bank of Cleveland, to the American Marketing Association Conference, Pittsburgh, June 20, 1956. Subject: “ Moderating the Business Cycle.”
(A limited number of copies of both speeches are available at the Research Department of this bank.)
13
Digitized for FRASER http://fraser.stlouisfed.org/ Federal Reserve Bank of St. Louis

Continuing Boom in Price of Farm Land
A v e r a g e p r ic e s of farm land rose to a new all-time high between November 1, 1955
and March 1, 1956. Yet prices of farm products during this four-month interval averaged the lowest for any November-March since 1946. Income from sales of farm products at the prevailing price level was the lowest since 1950 for the same four-month period. To acquire ownership of land, farmers have continued to accumulate mortgage debt.
What conclusions may safely be drawn concerning the current market for farm real- estate in view of the apparently inconsistent trends? Are land prices too high? Are there factors at work, aside from income and prices, which are maintaining the optimistic tone to the market ? Has credit been used beyond the limits of sound practice to provide money for bidding up land prices ?
Data collected in a recent survey by the U. S. Department of Agriculture may serve as a basis for at least some partial illumination of these questions.
Land Values on the Rise
Land values have increased at an average rate of 6.7 percent per year since 1940. To a farmer who may have purchased a 160-acre
farm at $70 per acre in 1940, the increase in valuation would have supplemented his capital accumulation at the average rate of nearly $1,300 per year over the past 16 years. Such a farm, previously valued at $11,200, would now be worth nearly $32,000. It is not valid to dismiss this increase, amounting to 183 percent, with the casual observation that everything went up in price over this period. Average wholesale prices went up 117 percent over the same interval; average consumer prices went up 92 percent.
During the War and early postwar period until 1948, it was evident why land values were rising. Farm prices were advancing generally at a comparable rate; farm income was stretching to record heights. In the 1949 recession period, and later during the Korean conflict, land values still tended to follow the direction of agricultural price trends. During ’52 and ’53, however, the rate of decline in farm prices became decidedly greater than the moderate easing of land values which was then under way. By late 1953, the continuously declining farm price level had been recognized as a national problem; at this point, however, land values again turned upward. Thus, commodity prices and land values have followed divergent paths for over two years.
14
Digitized for FRASER http://fraser.stlouisfed.org/ Federal Reserve Bank of St. Louis

How Explain the Rise?
Traditional explanations of trends in land prices have had to be supplemented since 1953 to account for the unexpected strength. One widely offered explanation cites the fact that, with a heavy investment in farm machinery, a larger land base is necessary in order to reduce costs per unit of production through full and efficient use of such equipment. This observation is lent support by the continued upward movement in the proportion of land buyers that are already owner- operators. It is further noted in this connection that bidding is often quite active for a parcel of land which would make a desirable addition to any one of several adjoining farms.
Another factor to which attention has been directed during the past year or so is the point that land prices generally tend to follow crop prices more closely than they follow prices of livestock and livestock products. Besides the fact that price-support programs are more applicable to crops than to livestock, it is also significant that production
Since November 1953, land values have risen while prices of farm products have generally moved downward.
NOTE: Land values are plotted at Survey dates, i.e., March 1, July 1 and November 1 for each year 1942-56; March 1 only for 1940 and 1941. Prices shown at Survey dates are averages of four previous months, mid-month quotations.
Farm mortgage debt has increased each year since 1946; in 19S6 it stands at a 24-year high.
efficiency has been stepped up at a much sharper pace for crops than for livestock; thus, a relatively more favorable profit for crops can be derived, despite lower prices.
Another point is that a sizable percentage of nonfarm people have come to look upon farm land as a good investment over the long run. The proportion of nonfarm buyers in the farm real-estate market is slightly below the level of the war and immediate postwar years, but is still above that of 1940 and 1941.
Demands for land for residential, industrial and public facility purposes also contribute to the strengthening of land prices over most parts of the country. Between the Census of Agriculture of 1950 and that of 1955, about 330,000 acres of land were lost from farms, a significant part of which was taken over for residential and industrial sites. Besides establishing an increased value of farmland because of location, such a development also results in “ displaced” farmers with adequate cash at hand for the purchase of other farms.
All factors considered, the current real estate market balances out to a situation where owners are often very reluctant to sell while, on the other hand, prospective buyers seem willing to bid up prices when a matter
15
Digitized for FRASER http://fraser.stlouisfed.org/ Federal Reserve Bank of St. Louis
o f only a few thousand dollars stands between them and a desired tract of land.
Mortgage Volume Apparently Conservative
Although some easing of farm-mortgage credit terms beginning in 1955 has been cited as a strengthening factor in land values, mortgage debt does not seem out of line with historical relationships. Outstanding credit secured by real estate has risen in each year of the past decade, with a cumulative increase of 85 percent for the period. It should be noted, however, that the farm-mortgage debt of ten years ago was at the lowest level in 32 years and that the present debt load was exceeded for 12 consecutive years from 1921 through 1932, when the value of the nation’s real estate was much lower than it is now.
Farm mortgage indebtedness, when related to the value of the nation’s farm land, reveals the current situation as decidedly more favorable than that prior to World War II. Early this year, indebtedness was equivalent to slightly over 9 percent of land value. In 1940, the ratio was nearly 20 percent; it averaged over 20 percent during the 1930’s and most of the 1920’s. Prior to 1945 and since 1910 there was no year in which the ratio of mortgage debt to land value was as low as it is at the present time.
Such a favorable comparison of debt to land value does not preclude the fact that some individuals are overextended, nor even that credit terms have been extra lenient in some instances. With a low ratio of debt to land value, however, it does not seem likely that excessive leniency in credit terms has been a decisive factor in the spiraling price of land.
Question of Overvaluation
A survey conducted by the U. S. Department of Agriculture late last year revealed a growing feeling that land values are too high. This opinion was expressed by 48 percent of the respondents, which included local real- estate dealers, lenders, lawyers, abstractors, county officials and farmers. The proportion of respondents holding that opinion ran up to 67 percent in the eastern corn belt.
The Department of Agriculture cites several factors in questioning whether present land prices are adequately supported by prospective long-term earnings. In 1955, the rate of return on land relative to market value was the lowest since 1938, about the same as in 1910-14, and below prevailing interest rates on farm mortgages. The Department has also raised a question as to whether the future pressures of population on land will be so great as some people anticipate; it is pointed out that there may be some tendency to underestimate the effectiveness of new technology in getting more food from each acre of land.
It may be noted that if farm land is currently overpriced, then the relationship of debt to land value would be correspondingly less favorable than indicated above.
In the final analysis, the current farm-land market may be considered in terms of individual farms and individual farmers. A good farmer on good land can produce enough income to support a capitalized value above today’s average land prices. On the other hand, inherently low-quality land, priced at the average of today’s market, might more than tax the ability of the best of farmers to justify the investment.
16
Digitized for FRASER http://fraser.stlouisfed.org/ Federal Reserve Bank of St. Louis