revealing the beattie magnetic anomaly and the anatomy of ... · and 5, southern end). 2. the...
TRANSCRIPT

11th SAGA Biennial Technical Meeting and Exhibition Swaziland, 16 - 18 September 2009, pages 490 - 499
Revealing the Beattie Magnetic Anomaly and the anatomy of the crust of southernmost Africa: Geophysics and deep sub-surface geology where the Cape Fold Belt and Karroo Basin
meet
A. S. Lindeque1,2,3, M.J. de Wit4
1. Now at Alfred Wegener Institute for Polar and Marine Research, Geophysics, Building D3280, Am Alten
Hafen 26, 27568 Bremerhaven, Germany, [email protected] 2. Council for Geoscience, Western Cape, P.O. Box 572, Bellville 7535, Cape Town, South Africa
3. GeoForschungsZentrum Potsdam, Section 2.2, Telegrafenberg, 14473 Potsdam, Germany 4. AEON - Africa Earth Observatory Network and Department of Geological Sciences, University of Cape
Town, Rondebosch 7701, South Africa, [email protected]
ABSTRACT The deep crust of the southernmost margin of Africa contains unresolved tectonic features such as the Paleozoic Cape Fold Belt (CFB), the Paleozoic-Mesozoic Karroo Basin and the largest terrestrial magnetic anomaly, the Beattie Magnetic Anomaly (BMA). Without resolving these structures, our understanding of the evolution of the southern margin will be incomplete and limited. Under the auspices of the Inkaba yeAfrica framework, several geophysical datasets were acquired from 2004 to 2007, along two transects across the margin and its unique tectonic features. This research presents a tectonic model and crustal geometry, at the centre 100 km of the western transect. The model is derived from the joint interpretation of: surface geology, aeromagnetic data, nearby deep boreholes, teleseismic receiver functions, impedance spectroscopy measurements on borehole samples, near vertical reflection seismic data (NVR), shallow P- and S-wave velocity data, wide angle refraction data and magnetotelluric data. The model differentiates a four component ~ 42 to 45 km thick crust and constrains the two part BMA to a ~10 to 12 km wide northern zone, and a ~5 to 7 km wide southern zone, both at ~7 to 8 km below surface, continuing for a depth of ~5 km, and, contained in the Mesoproterozoic Namaqua-Natal mid-crust. The BMA source is interpreted to be a Namaqua-like massive to disseminated, deformed/metamorphosed strataform sulphide ore body. The model presents evidence in support of a thin-skinned tectonic thrust model for the evolution of the flat-based CFB and shows no significant fore-deep stratigraphic thickening in the Karroo Basin towards the CFB front. The tectonic model suggests a Meso-Proterozoic collision orogen setting, overprinted by a mid-Phanerozoic thin-skinned fold and thrust belt coupled to the far-field accretion/subduction margin to the south. Key words: Beattie Magnetic Anomaly, Karroo Basin, Cape Fold Belt, Seismic reflection, Namaqua Natal Metamorphic Belt.
INTRODUCTION Tectonically, southernmost Africa is dominated by the Paleozoic Cape Fold Belt (CFB) and the Paleozoic-Mesozoic Karoo Basin, underlain by a Precambrian basement that hosts the world’s largest terrestrial magnetic anomaly, the E-W Beattie Magnetic Anomaly (BMA) (Figures 1 and 2). These features were first observed almost a century ago, but remain enigmatic, and resolving them will have implications for our understanding of the anatomy and evolution of the southern margin of Africa. This research presents
further interpretation of the first ~100 km northeast-southwest near vertical reflection (NVR) seismic profile across the southernmost Karoo Basin (from Prince Albert in the south, to Slingersfontein farm in the north), the BMA and the tectonic front of the CFB (Figure 2). The NVR seismic profile forms part of the western branch of the longer onshore/offshore Inkaba yeAfrica geophysical Agulhas-Karoo Transect across the southern margin of Africa (www.inkaba.org). Inkaba yeAfrica is a German/South African research initiative that observes earth systems in a natural core-to-space laboratory over southern Africa (de Wit and Horsfield, 2006).
490

Lindeque and de Wit
METHOD AND RESULTS The NVR seismic data acquisition, -processing and preliminary interpretation of the profile are described in Lindeque et al. (2006; 2007). The final migrated seismic image is shown in Figure 3, the integrated line drawing interpretation is illustrated in Figure 4 and the new tectonic model depicted in Figure 5. The interpretation and revised tectonic model presented here, integrates coincident data from deep boreholes (Eglinton and Armstrong, 2003), surface geology (Albat, 1984; CGS; Joubert 1971; 1986a,b; Macey 2000; 2001; in press; Stowe, 1980), impedance spectroscopy measurements on borehole samples (Branch et al. 2007), teleseismic receiver function data (Harvey et al. 2001), wide angle refraction data (Stankiewicz et al. 2007; 2008; Parsiegla et al. 2007; 2009), magnetotelluric data (Weckmann et al. 2007a,b), and shallow P- and S- wave velocity models (Bräuer et al. 2007). The NVR seismic profile reveals a complex circa 42 to 45 km thick crust, consistent with previous teleseismic receiver function analyses (Harvey et al. 2001) and wide angle refraction onshore/offshore modelling (Stankiewicz et al. 2007; 2008, Parsiegla et al. 2007; 2009). The resulting tectonic model differentiates four components: 1. THE UPPER CRUST In the upper crust (<13 km), surface geology and two deep boreholes link a seismic stratigraphic package of variably dipping reflectors above a section of sub-horizontal reflectors to the Karoo- and Cape Supergroups, respectively. Folds and faults previously mapped at surface correlate downwards with distinct features in the upper 1 to 1.5 km of the seismic image, and with lateral velocity variation in shallow P- and S- wave velocity models (Bräuer et al. 2007). High S-wave velocities (2.82 - 3.30 km/s) correspond to major anticlinal hinges and low velocities to synclinal hinges. The seismic profile also images low-angle thrust faults rooted in a zone of local décollements at 2 to 3 km depth. This zone corresponds to velocity changes in the coincident refraction data, and a ~150 meter thick high conductivity/low resistivity (< 2 Ωm) band in the coincident magnetotelluric (MT) data (Weckmann et al. 2007a,b). Impedance spectroscopy measurements on borehole samples of the graphitic and pyritiferous shales of the Whitehill- and Prince Albert Formations (the lower Ecca Group near the base of the Karoo Basin) suggest both formations may contribute to the high conductivity band (Branch et al. 2007). The ~2 to 5 km thick folded Karoo Supergroup rests paraconformably on the non-folded sandstone / shale Cape Supergroup. The latter corresponds to a prominent, sub-horizontal, highly reflective package along the entire profile, thickening N-S from ~2 to 10 km. The base of the Cape Supergroup is flat, even beneath the CFB front. The base is defined by a strong seismic discontinuity (unconformity) at ~5 to 10 km depth against the
underlying crystalline basement (see upper 10 km in Figures 4 and 5). The CSG is in parts, tectonically detached from the overlying Karoo Supergroup and underlying mid-crust (see CSG in Figure 5). There is no significant fore-deep stratigraphic thickening in the Karoo Basin, toward the CFB tectonic front (Figures 4 and 5, southern end). 2. THE MID-CRUST
This mid-crust wedge is ~21 km thick (from ~12 to ~33 km depth) in the south and ~13 km thick in the north and, consistent with rock retrieved from deep boreholes (Eglington and Armstrong, 2003), interpreted as an extension of the ~1.2 Ga Mesoproterozoic Namaqua-Natal Metamorphic Belt (NNMB). Based on variation in reflectivity, the wedge is divided into three components and the fabric is interpreted as stacked wedges of the NNMB Bushmanland terrane (1.0 to 1.2 Ga amphibolite-granulite gneisses). The mid-crust contains a distinct north dipping seismic fabric, consistent with the D2 fabric mapped in the field (Albat, 1984; CGS; Joubert 1971; 1986a,b; Macey 2000; 2001; in press), but in contrast to previous models that postulated a dip to the south (e.g. Hälbich, 1983a,b,c; 1993). Previous models also propose NNMB up to the northern edge of the Cape Fold Belt Front (e.g. Cornell et al. 2006; de Beer and Meyer, 1983;1984) but the NVR seismic image presents evidence to suggest the NNMB continues below the CFB tectonic front and possibly farther south to the continental margin. A mid-crustal detachment, interpreted as a shear or thrust plane, separates the mid- and lower crust (red line and arrow in Figure 4, and red line between the mid-crust (shades of orange) and lower crust (shades of green and grey) in Figure 5). 3. THE BMA Collectively the geophysical datasets constrain the two-part BMA, which is a new contribution to our understanding of this regional anomaly. The axes of the BMA maximum delineated from aeromagnetic data (Figure 1), correspond to two complex zones of higher reflectivity in the mid-crust, imaged ~5 to 7 km apart near the centre of the NVR seismic profile (Figures 3 to 5). A northern zone is ~10 to 12 km wide and a southern zone ~5 to 7 km wide. The combined width is ~24 km, with a maximum depth ~5 km and a depth to the top of the anomaly ~7 to 8 km. The northern zone corresponds to a high velocity (> 6.4 km/s) region in the tomography model (Stankiewicz et al. 2007; 2008) and a ~5 to 10 km wide “bean shape” high conductivity anomaly (derived from the MT data, (Weckmann et al. 2007a,b)) with a bounding surface that is largely discordant to the seismic reflectors (Figure 5). The latter is interpreted as a metasomatic or metamorphic overprint effect. Some researchers previously related the source of the BMA to graphite bearing shear zones (Weckmann et al. 2007a,b) - but the mid-crust should then have displayed multiple
491

Anatomy of the crust of southernmost Africa
north dipping high conductivity anomalies to fit the seismic image, and others proposed a deep crustal suture zone and serpentinised ophiolite wedge (e.g. Burke, 1977; Corner, 1989; de Beer and Meyer, 1983;1984; Hälbich, 1993; Pitts et al. 1992). Here, it is postulated that the BMA source may also be interpreted as Namaqua-like massive to disseminated deformed / metamorphosed strataform sulphide ore body, flanked by smaller strataform ore bodies (Figure 5). This is similar to large base metal deposits found in the NNMB outcrops ~450 km to the northwest (Bailie, 2005; 2007; Colliston, 2002; 2003). 4. THE LOWER CRUST The highly reflective lower crust wedge thins N-S from ~24 km to ~10 km thick and based on reflectivity variations, four sub-components are identified. From top to bottom these are: 1) a complex of north and south dipping reflectors (~5 to 20 km thick), interpreted as two interleaving slivers of Kheisian NNMB basement; 2) a ~10 km thick transparent layer, interpreted as older Palaeo-Proterozoic NNMB basement; and 3) a ~2 to 5 km thick layer of strong horizontal reflectivity, sub-parallel to a clearly imaged continuous Moho, interpreted as mafic underplating. The Moho shows complex structures at ~30 and 60 km along the profile. The NVR data suggest that the NNMB continues below the CFB front and possibly to the continental margin (Lindeque et al. 2007, Parsiegla et al. 2007; 2009). THE TECTONIC SETTING The upper crustal data supports a relatively thin skinned north verging end-Phanerozoic tectonic setting for the CFB most probably linked to far-field south-directed subduction processes (e.g. Lock 1980), without significant fore-deep stratigraphic thickening in the Karoo Basin, as suggested in previous models (e.g. Johnson et al. 2006). The middle- and lower crustal data supports Mesoproterozoic accretionary tectonics in a southward subducting regime during earlier NNMB basement evolution. The seismic discontinuity between the mid-and lower crust is interpreted as a south dipping thrust plane (thrusting to the north), related to Meso-Proterozoic tectonic accretion during final Rodinia assembly. The depth of the mid-crust discontinuity is consistent with teleseismic receiver function data (Harvey et al. 2003), and the interpreted thrusting to the north, is consistent with seismic profiles across the Kaapvaal craton that imaged the NNMB basement thrust against and onto the craton (e.g. Tinker et al. 2002). The tectonic model also suggests that the Meso-Proterozoic collision orogen was overprinted by a mid-Phanerozoic thin-skinned fold and thrust belt coupled to the far-field subduction/accretion margin to the south, during formation of Rodinia and Pangea respectively. This model stands in contrast to more widely accepted far-field subduction to the north models.
THE PROFILE IN A GLOBAL CONTEXT Current Rodinia (Dalziel, 1991; Hoffman 1991) supercontinent reconstruction models link the NNMB to the Grenville Province of North America across the Grenville-Kibaran orogen (e.g. Li et al. 2008). The data presented allow the first direct comparison of seismic profiles across opposite flanks of this orogen. In this brief first order comparison of seismic profiles on neighbouring Rodinia remnants, the NVR seismic image may not be exactly the same as the LITHOPROBE Abitibi-Grenville line 32-33 that cross a coeval Mesoproterozoic terrane (Clowes et al. 1996; Ludden and Hynes, 2000; White et al. 2000), but structurally, it fits into the greater Rodinia reconstruction context. This first direct comparison of such NVR seismic profiles on adjacent remnants show that seismic profiles may be a useful tool to compliment or test palaeomagnetic pole data in supercontinent reconstructions. CONCLUSIONS Based on these datasets and seismic reflectivity variation, the complex 2 to 45 km thick crust is divided into four components: (1) the 2-5 km thick Karoo Supergroup and the 2.5-12 km thick Cape Supergroup (CSG) in the upper crust. The flat CSG base is defined by a strong seismic discontinuity. (2) The 13-21 km underlying mid-crust with a distinct north dipping seismic fabric, interpreted as ~1.2 Ga Mesoproterozoic Namaqua-Natal Metamorphic Belt (NNMB) that contains the BMA (3). The highly reflective 10-24 km thick lower crust (4), interpreted as Kheisian NNMB basement and older Palaeo-Proterozoic NNMB basement. A 2-5 km thick highly reflective layer, sub-parallel to a clear Moho, interpreted as mafic underplating. In contrast to previous models, the NVR data and tectonic model presented here, support a thin-skinned north verging end-Phanerozoic tectonic setting for the CFB without significant fore-deep thickening in the Karoo Basin. The NVR data and joint interpretation of the other datasets also suggests the NNMB continues below the CFB tectonic front and possibly to the continental margin. In contrast to previous models it is postulated that the BMA source could be a large massive or disseminated metamorphosed strataform sulphide ore body similar to large base metal deposits in NNMB outcrops ~450 km to the northwest. The NVR profile fits in well with the recent global Rodinia reconstruction model. ACKNOWLEDGMENTS Funding for the NVR seismic data acquisition was provided by the GeoForschungsZentrum (GFZ) Potsdam (Germany), the Council for Geoscience Western Cape Unit in Cape Town (CGS), and the South African National Research Foundation (NRF) under the auspices of Inkaba yeAfrica. The geophysical
492

Lindeque and de Wit
instruments were provided by the Geophysical Instrument Pool Potsdam (GIPP). We would like to thank the CGS, AEON, GFZ, and NRF for funding AL’s research. This work is part of AL's Master degree at the University of Cape Town. REFERENCES
Albat, H.M. (1984) The Proterozoic Granulite Facies Terrane around Kliprand, Namaqualand Metamorphic Complex. Precambrian Research Unit Bulletin, 33, University of Cape Town, South Africa, 382pp.
Bailie, R.H. and Reid, D.L. (2005) Ore textures and possible sulphide partial melting at Broken Hill, Aggeneys, South Africa I: Petrography. South African Journal of Geology, 108, 51-70.
Bailie, R.H., Armstrong, R., Reid, D.L. (2007) The Bushmanland Group supracrustal succession, Aggeneys, Bushmanland, South Africa: Provenance, age of deposition and metamorphism. South African Journal of Geology, 110, 59-86.
Bräuer, B., Ryberg, T., Lindeque, A.S (2007) Shallow seismic velocity structure of the Karoo Basin, South Africa. South African Journal of Geology, 110, 439-448.
Branch, T., Ritter, O., Weckmann, U., Sachsenhofer, R.F., Schilling, F. (2007) The Whitehill Formation - a high conductivity marker horizon in the Karoo Basin. South African Journal of Geology, 110, 465 - 476.
Burke, K., Dewey, J.F., Kidd, W.S.F. (1977) World distribution of sutures - the sites of former oceans. Tectonophysics. 40, 69-99.
CGS 1:250000 mapsheet series, Council for Geoscience, Pretoria, South Africa.
Clowes, R.M., Calvert, A.J., Eaton, D.W., Hajnal, Z., Hall, J. and Ross, G.M. (1996) LITHOPROBE reflection studies of Archean and Proterozoic crust in Canada. Tectonophysics, 264, 65-88.
Colliston, W.P. and Schoch, A.E. (2002). The structural development of the Aggeneys Hills, Namaqua Metamorphic Complex. South African Journal of Geology, 105, 301-324.
Colliston, W.P. and Schoch, A.E. (2003). A mid-Proterozoic Volcano-Sedimentary sequence in the Aggeneys hills Duplex, Namaqua Metamorphic Complex. South African Journal of Geology, 106, 343-360.
Cornell, D.H., Thomas, R.J., Moen, H.F.G., Reid, D.L., Moore, J.M., Gibson, R.L. (2006) The Namaqua-Natal Province In: Johnson, M.R., Anhaeusser, C.R. and Thomas, R.J. (Eds.), The Geology of South Africa. Geological Society of South Africa, Johannesburg/Council for Geoscience, Pretoria, 325-379.
Corner, B. (1989), The Beattie anomaly and its significance for crustal evolution within the Gondwana framework, Extended Abstracts, South African Geophysical Association, First Technical Meeting, 15–17.
Dalziel, I.W.D. (1991) Pacific Margins of Laurentia and East Antarctica-Australia as a conjugate rift pair: evidence and implications for an Eocambrian Supercontinent. Geology, 19, 598-601.
De Beer, J.H. and Meyer, R. (1983) Geoelectrical and gravitational characteristics of the Namaqua-Natal Mobile Belt and its boundaries. Special Publication Geology Society of South Africa, 10, 91-100.
De Beer, J.H. and Meyer, R. (1984) Geophysical characteristics of the Namaqua-Natal Mobile Belt and its boundaries, South Africa. Journal of Geodynamics, 1, 473-494
de Wit, M.J. Horsfield, B. (2006) Inkaba ye Africa Project Surveys Sector of Earth from Core to Space. EOS, American Geophysical Union, 87, 113-117.
Eglington, B.M. and Armstrong, R.A. (2003) Geochronological and isotopic constraints on the Mesoproterozoic Namaqua-Natal Belt: evidence from deep borehole intersection in South Africa. Precambrian Research, 125, 179-189.
Hälbich, I.W. (1983a) A tectogenesis of the Cape Fold Belt (CFB). 165-175. In: Söhnge, A.P.G. & Hälbich, I.W. (Eds) Geodynamics of the Cape Fold Belt. Special Publication of the Geological Society of South Africa. 12, 184pp.
Hälbich, I.W. (1983b) A geodynamic model for the Cape Fold Belt (CFB). 177-184. In: Söhnge, A.P.G. & Hälbich, I.W. (Eds) Geodynamics of the Cape Fold Belt. Special Publication of the Geological Society of South Africa. 12, 184pp.
Hälbich, I.W. (1983c) Geodynamics of the Cape Fold Belt in the Republic of South Africa, a summary. 21-29. In: Rast, N. & Delany,F.M. (Eds) Profiles of Orogenic Belts. Geodynamics Series, American Geophysical Union / Geological Society of America. 10, 310pp.
Hälbich, I.W. (Compiler) (1993) Global Geoscience Transect 9. The Cape Fold Belt - Agulhas Bank transect across Gondwana Suture, Southern Africa. American Geophysical Union Special Publication, 202, 18pp.
Harvey, J.D., de Wit, M.J., Stankiewicz, J., Doucoure, C.M. (2001) Structural variations of the crust in the southwestern Cape, deducted from seismic receiver functions. South African Journal of Geology, 104, 231-242.
Hoffman, P.F. (1991) Did the breakout of Laurentia turn Gondwanaland inside out? Science, 252, 1409-1412.
Johnson, M.R., van Vuuren, C.J., Visser, J.N.J., Cole, D.I., Wickens, H., de V., Christie, A.D.M., Roberts, D.L., Brandl, G. (2006) Sedimentary Rocks of the Karoo
493

Anatomy of the crust of southernmost Africa
494
Supergroup. In: Johnson, M.R., Anhaeusser, C.R. and Thomas, R.J. (Eds.), The Geology of South Africa. Geological Society of South Africa, Johannesburg / Council for Geoscience, Pretoria, 461-499
Joubert, P. (1971) The Regional Tectonism of the Gneisses of Part of Namaqualand. Precambrian Research Unit Bulletin, 10, University of Cape Town, South Africa, 220pp.
Joubert, P. (1986a) The Namaqualand Metamorphic Complex - A summary. 1395-1420. In: Anhaeusser, C.R., and Maske, S., (Eds.) Mineral Deposits of Southern Africa, Geological Society of South Africa, 2, 2376pp.
Joubert, P. (1986b) Namaqualand - A model of Proterozoic Accretion? Transactions of the Geological Society of South Africa. 89, 79-96.
Li, Z.X., Bogdanova, S.V., Collins, A.S., Davidson, A., De Waele, B., Ernst, R.E., Fitzsimons, I.C.W., Fuck, R.A., Gladkochub, D.P., Jacobs, J., Karlstrom, K.E., Lu, S., Natapov, L.M., Pease, V., Pisarevsky, S.A., Thrane, K., Vernikovsky, V. (2008) Assembly, configuration, and break-up history of Rodinia: A synthesis. Precambrian Research, 160, 179-210.
Lindeque, A., Ryberg, T., Weber, M., deWit, M.J. (2006). Understanding the Beattie Magnetic Anomaly, Karoo Basin and Deep Crustal Tectonics of Southernmost Africa: Near Vertical Seismic Reflection Data of the Inkaba yeAfrica Onshore-Offshore Agulhas-Karoo Geoscience Transect. American Geophysical Union, EOS Transactions, 87 (52).
Lindeque, A.S., Ryberg, T., Stankiewicz, J., Weber, M. and de Wit, M.J. (2007). Deep crustal seismic reflection experiment across the southern Karoo Basin, South Africa. South African Journal of Geology, 110, 419-438.
Ludden, J. and Hynes, A. (2000) The Abitibi-Grenville Lithoprobe transect: two billion years of crust formation and recycling in the Precambrian shield of Canada. Canadian Journal of Earth Science, 37, 459-476.
Lock, B.E. 1980. Flat-plate subduction and the Cape Fold Belt of South Africa. Geology, 8, 35-39.
Macey, P.H. (2000). The geology of the Kliprand Area, SE Namaqualand. Sheet 3018DA Kliprand. Council for Geoscience internal report, unpublished. 57pp.
Macey, P.H. (2001). The geology of the region between Garies and Kliprand, southern Namaqualand. 1:50 000 sheets 3018 CA (Buffelsfontein), 3018 CB (Suurdam), 3018 DA (Kliprand) and 3018 DB (Oubees). Council for Geoscience internal report, unpublished.
Macey, P.H., Minaar, H., Botha, P.M.W., Siegfried, P., Almond, J. (in press) The Geology of the Loeriesfontein area: Explanation to 1:250 000
mapsheet 3018 Loeriesfontein. Council for Geoscience, Pretoria, South Africa.
Parsiegla, N., Gohl, K. and Uenzelmann-Neben, G. (2007) Deep crustal structure of the sheared South African continental margin: first results of the Agulhas-Karoo Geoscience Transect. South African Journal of Geology, 110, 393-406.
Parsiegla, N., Stankiewicz, J., Gohl, K., Ryberg, T., Uenzelmann-Neben, G. (2009) Southern African continental margin: Dynamic processes of a transform margin. G3 - Geochemistry Geophysics Geosystems, 10, 3, Q03007, doi:10.1029/2008GC002196.
Pitts, B.E., Maher, M.J., de Beer, J.H., and Gough, D.I. (1992) Interpretation of magnetic, gravity and magnetotelluric data across the Cape Fold Belt and Karoo Basin. In: De Wit, M.J. and Ransome, I.D.G. (Editors) Inversion tectonics of the Cape Fold Belt, Karoo and Karoo and Cretaceous basins of Southern Africa, Balkema, Rotterdam, Netherlands,
Stankiewicz, J., Ryberg, T., Schulze, A., Lindeque, A.S., Weber, M.H. and De Wit, M.J. (2007) Initial Results from Wide-Angle Seismic Refraction Lines in the Southern Cape. South African Journal of Geology, 110, 407-418.
Stankiewicz, J., Parsiegla, N., Ryberg, T., Gohl, K., Weckmann, U., Trumbull, R., Weber, M. (2008) Crustal structure of the southern margin of the African continent: Results from geophysical experiments. Journal of Geophysical Research, 113, B10313, doi:10.1029/2008JB005612.
Stowe, C.W. (1980) Preliminary report on geodynamics in the Upington Geotraverse. Annual Report Precambrian Research Unit, University of Cape Town, South Africa. 17, 24-48.
Tinker, J., de Wit, M.J., Grotzinger, J. (2002) Seismic Stratigraphic Constraints on Neoarchean - Paleoproterozoic Evolution of the Western Margin of the Kaapvaal Craton, South Africa, South African Journal of Geology, 105, 107-134.
Weckmann, U., Ritter, O., A. Jung., Branch, T. and de Wit, M. (2007a) Magnetotelluric measurements across the Beattie magnetic anomaly and the Southern Cape Conductive Belt, South Africa. Journal of Geophysical Research, 112, doi:10.1029/2005 JB003975.
Weckmann, U., Jung, A., Branch, T. Ritter, O. (2007b) Comparison of electrical conductivity structures and 2D magnetic modelling along two profiles crossing the Beattie Magnetic Anomaly, South Africa. South African Journal of Geology, 110, 449-464.
White, D.J., Forsyth, D.A., Asudeh, I., Carr, S.D., Wu, H., Easton, R.M., Mereu, R.F. (2000) A seismic-based cross section of the Grenville Orogen in southern Ontario and western Quebec. Canadian Journal of Earth Science, 37, 183-192.

Lindeque and de Wit
Figure 1. (a) Total field aeromagnetic map of southern Africa showing the regional east-west striking Beattie Magnetic Anomaly (BMA) and area of interest (red block). (b) Aeromagnetic map in area of interest: NVR1 profile shotpoints = red dots (~100 km); BMA maximum axes = black dashed lines; BMA extent (~ 30 km) = shades of yellow to red.
495
Anatomy of the crust of southernmost Africa
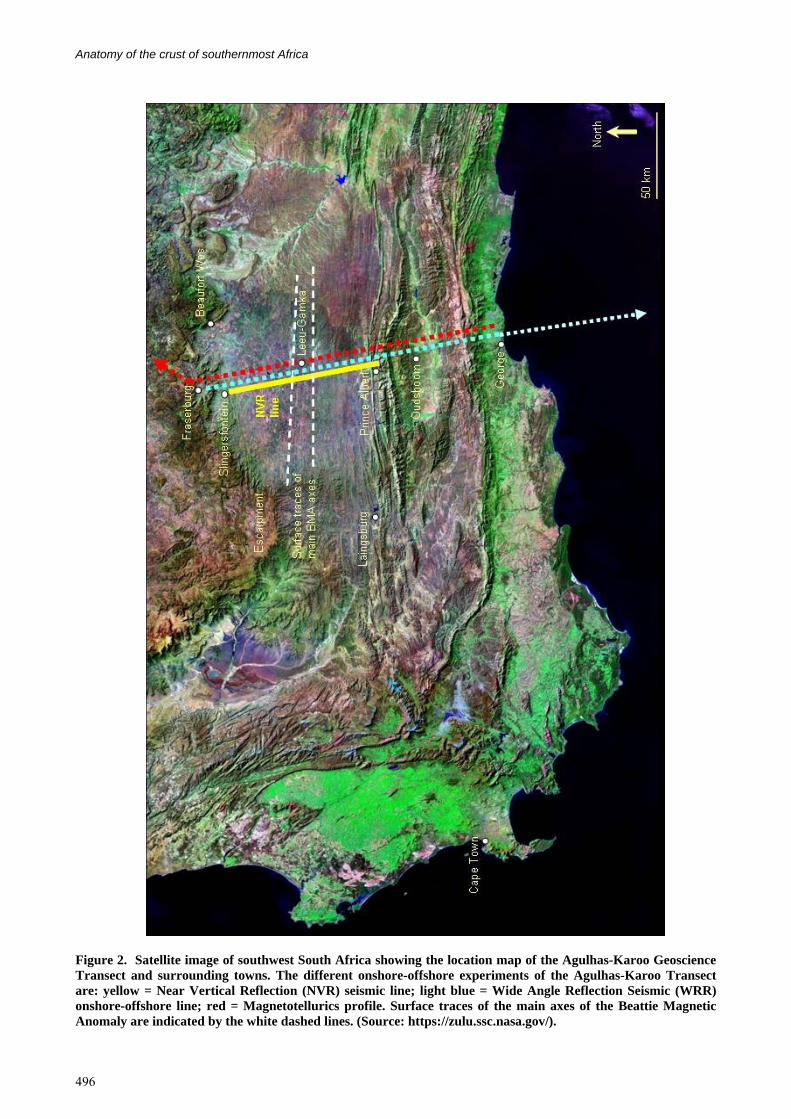
Figure 2. Satellite image of southwest South Africa showing the location map of the Agulhas-Karoo Geoscience Transect and surrounding towns. The different onshore-offshore experiments of the Agulhas-Karoo Transect are: yellow = Near Vertical Reflection (NVR) seismic line; light blue = Wide Angle Reflection Seismic (WRR) onshore-offshore line; red = Magnetotellurics profile. Surface traces of the main axes of the Beattie Magnetic Anomaly are indicated by the white dashed lines. (Source: https://zulu.ssc.nasa.gov/).
496

Lindeque and de Wit
Figure 3. Geological cross section from the CGS 1:250000 mapsheets (5x vertical exaggeration) and the migrated CMP seismic profile in depth domain with coherency (dip- scan filter) applied before migration. Regions with complex distinct reflectivity are imaged in the upper, middle and lower crust. A series of shallow, continuous, slightly south dipping reflectors occur along most of the profile at approximately 1.5 to 3.5 s TWT. This package is very different from the deeper reflections. A region of strong reflectivity outlines the expected region of the BMA, at 5 s TWT and 55 to 65 km along the profile. Highly reflective lower crust is imaged from 12 to 15 s TWT, and the Moho is clearly imaged at 42 to 45 km or ~15 s TWT. CMP interval 50 m.
497
Anatomy of the crust of southernmost Africa
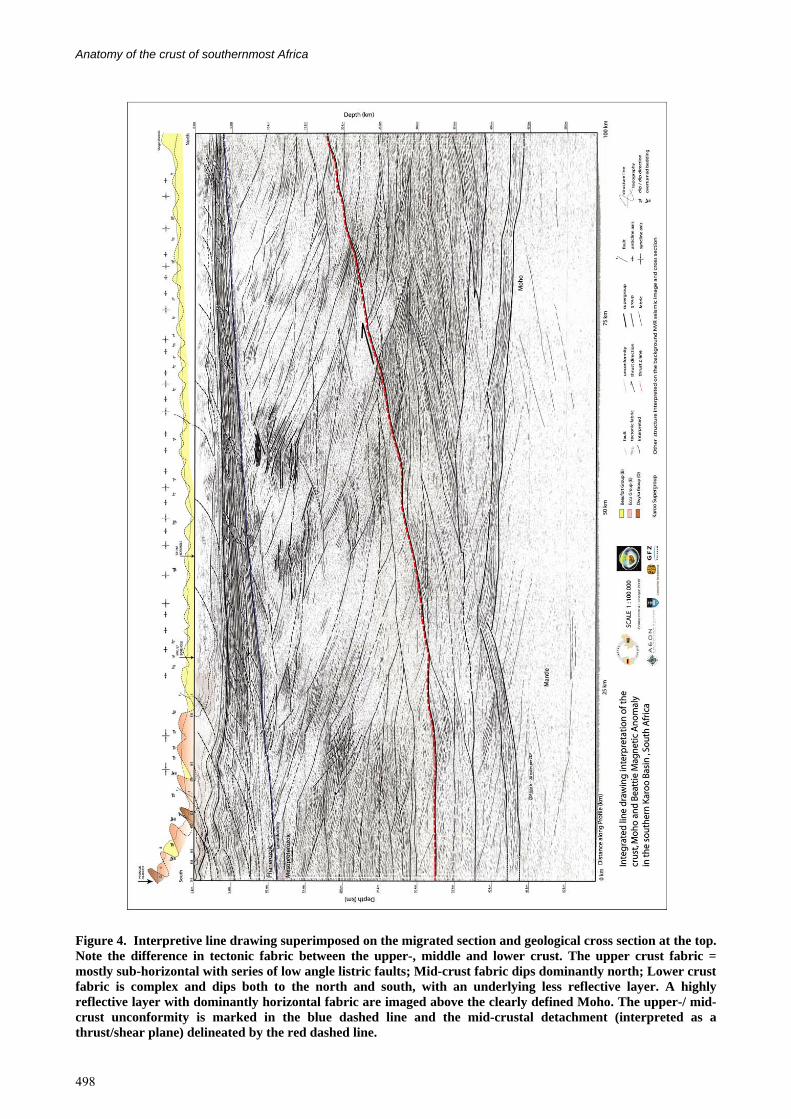
Figure 4. Interpretive line drawing superimposed on the migrated section and geological cross section at the top. Note the difference in tectonic fabric between the upper-, middle and lower crust. The upper crust fabric = mostly sub-horizontal with series of low angle listric faults; Mid-crust fabric dips dominantly north; Lower crust fabric is complex and dips both to the north and south, with an underlying less reflective layer. A highly reflective layer with dominantly horizontal fabric are imaged above the clearly defined Moho. The upper-/ mid-crust unconformity is marked in the blue dashed line and the mid-crustal detachment (interpreted as a thrust/shear plane) delineated by the red dashed line.
498

Lindeque and de Wit
499
Figure 5. Newly proposed tectonic model and geological cross section from 1:250000 map sheets. The upper crust = Karoo Supergroup (yellow = Beaufort Group; pink = Ecca Group; brown = Dwyka Group) and Cape Supergroup (light blue = Witteberg Group; blue = Bokkeveld Group, light purple = Nardouw Formation and dark purple Peninsula Formation). Low angle thrusts (dashed lines) are rooted in a décollement, interpreted between the Ecca and Dwyka Groups, along the Whitehill Formation. The Phanerozoic Cape Supergroup is detached from the basement by a clearly imaged angular unconformity (blue dashed line). Mid-crust = shades of orange, interpreted as Mesoproterozoic Namaqua-Natal Metamorphic Belt wedges of the Bushmanland Group. The northerly dip contrasts with previous models. The two part Beattie Magnetic Anomaly (BMA) at depths of 7 - 15 km (red polygons in the middle). Mid-crustal detachment = red/black line in the middle; Lower crust = shades of green, interpreted as older Palaeo-Proterozoic slivers, bounded by a above, and older material below (light grey). A 1 to 2 km thick layer of mafic underplating material straddles the Moho (dark grey).