revealing the beneficial effect of protease supplementation to high gravity beer fermentations using
TRANSCRIPT

RESEARCH Open Access
Revealing the beneficial effect of proteasesupplementation to high gravity beerfermentations using “-omics” techniquesMaya P Piddocke1, Alessandro Fazio2, Wanwipa Vongsangnak3,5, Man L Wong1, Hans P Heldt-Hansen4,Chris Workman2, Jens Nielsen3 and Lisbeth Olsson1,3*
Abstract
Background: Addition of sugar syrups to the basic wort is a popular technique to achieve higher gravity in beerfermentations, but it results in dilution of the free amino nitrogen (FAN) content in the medium. Themulticomponent protease enzyme Flavourzyme has beneficial effect on the brewer’s yeast fermentationperformance during high gravity fermentations as it increases the initial FAN value and results in higher FANuptake, higher specific growth rate, higher ethanol yield and improved flavour profile.
Results: In the present study, transcriptome and metabolome analysis were used to elucidate the effect on theaddition of the multicomponent protease enzyme Flavourzyme and its influence on the metabolism of thebrewer’s yeast strain Weihenstephan 34/70. The study underlines the importance of sufficient nitrogen availabilityduring the course of beer fermentation. The applied metabolome and transcriptome analysis allowed mapping theeffect of the wort sugar composition on the nitrogen uptake.
Conclusion: Both the transcriptome and the metabolome analysis revealed that there is a significantly higherimpact of protease addition for maltose syrup supplemented fermentations, while addition of glucose syrup toincrease the gravity in the wort resulted in increased glucose repression that lead to inhibition of amino aciduptake and hereby inhibited the effect of the protease addition.
IntroductionDespite the fact that beer brewing is a traditional pro-cess, there is in the today’s competitive market a con-stant demand for further process improvement. One ofthe main targets for improvement in the brewing fer-mentation process is the fermentation time, wort fer-mentability and ethanol yield, equipment use and laborcosts. High gravity brewing technique has been intro-duced since the 70s and gained increasing popularity inrecent years as it meets many of these targets.High gravity brewing uses wort with higher sugar con-
centration than the one normally used. The resultingbeer has higher ethanol content, but the product is thendiluted to the required alcohol content. A popularapproach for achieving higher sugar concentration is the
addition of sugar syrups as adjuncts to the wort, whichusually has gravity in the range of 12-14°Plato. However,as sugar syrups do not contain any considerableamounts of nitrogen, their addition to the basic wortdilutes the free amino nitrogen (FAN) content presentin the media. Thus, to ensure presence of sufficientnitrogen and to avoid incomplete brewer’s yeast fermen-tation, it is a requirement that higher gravity wort hashigher free amino nitrogen content compared to lowergravity wort. While FAN requirements for wort of 12°Plato are in the range of 140-150 mg l-1, wort with >18°Plato requires FAN of 280 mg l-1 [1]. To a certainextent, the FAN requirement is also strain specific [2].In an earlier study we characterized high gravity beer
fermentations at 21°Plato with increased available nitro-gen content by addition of various nitrogen sources tothe wort - ammonium sulphate, urea or proteases [3].The results from this characterization showed that thenitrogen supplementation generated by the addition of
* Correspondence: [email protected] for Microbial Biotechnology, Department of Systems Biology,Technical University of Denmark, DK-2800 Kongens Lyngby, DenmarkFull list of author information is available at the end of the article
Piddocke et al. Microbial Cell Factories 2011, 10:27http://www.microbialcellfactories.com/content/10/1/27
© 2011 Piddocke et al; licensee BioMed Central Ltd. This is an Open Access article distributed under the terms of the CreativeCommons Attribution License (http://creativecommons.org/licenses/by/2.0), which permits unrestricted use, distribution, andreproduction in any medium, provided the original work is properly cited.
the multicomponent enzyme (Flavourzyme) with bothendo and exo peptidase activities resulted in the bestfermentation performance in terms of higher ethanolyield, specific growth rate and specific ethanol produc-tivity in addition to high FAN utilization.In today’s brewing market the efforts are focused on
maintaining low sale prices despite an increase in rawmaterial prices while maintaining profits. In order toreach these goals it is important to introduce innova-tive solutions, and the enzyme producing companiesoffer new solutions where enzymes can be used toimprove the brewing process. The main targets for thecurrently available enzymes in brewing are focused onobtaining higher extract yields, improved attenuationcontrol, longer beer filter cycle runs, shorter cookingcycles, and reduced beer losses and maturation time[4]. Proteases are commercially used for bioethanolproduction as a way to provide additional nitrogenavailable for the yeast. Protease addition to the simul-taneous saccharification and fermentation of wholemilled cereals is known to improve the final ethanolconcentration and the volumetric productivity [5].While addition of proteases is a commonly used prac-tice for bioethanol production, studies of the additionof proteases as a way to enhance the free amino nitro-gen in beer fermentation are very limited. In brewing,additions of proteases have further importance as theamino acid metabolism is related to the flavour andaroma profile of the final beer. The major classes ofyeast derived flavour compounds are formed as by-products of the metabolism of sugars and amino acids[6]. Under fermentative conditions, some of the pro-ducts from the amino acid metabolism might bereleased into the medium and contribute to the beerflavour.To approach the problem with nitrogen limitations in
high gravity beer fermentations, we showed that addingthe multicomponent protease Flavourzyme gives super-ior fermentation performance in terms of increasedinitial FAN value and higher FAN uptake, higher speci-fic growth rate, higher ethanol yield and improved fla-vour profile, in terms of lower acetaldehyde and ethylacetate levels. In this study we therefore undertook amore detailed analysis of the effect of protease additionto high gravity worts using genome-wide transcriptomeanalysis and metabolome analysis.
Materials and methodsStrainThe flocculent bottom fermenting industrial lager beeryeast strain Weihenstephan 34/70 (Hefebank Weihenste-phan, Freising, Germany) was used in this study. Thestrain was maintained as a frozen stock culture in 40%(v/v) glycerol.
Fermentation setupFor the studied fermentations, wort with gravity corre-sponding to 21°Plato was used. Higher gravity wasachieved with either glucose or maltose syrup supple-mentation to the basic wort of 14°Plato [7]. The fermen-tation setup was designed to simulate as closely aspossible the larger scale beer fermentations.
WortAll-malt wort with starting gravity of 14.3°Plato and pH5.2, (Alectia, Denmark), was used. This wort contained90% carbohydrates of which the fermentable carbohy-drates consisted of 4.4% fructose, 12.5% glucose, 66.5%maltose and 16.7% maltotriose (w/v). The wort also con-tained non-fermentable carbon sources such as dextrinsand b-glucan. ZnSO4
.7H2O, was added to a concentra-tion of 0.1 ppm Zn. For adjusting the wort to highergravity- 21°Plato, highly fermentable syrups- Clears-weet® 95% Refined Liquid Dextrose Corn Syrup (95.5%glucose, 2.5% maltose, 1% maltotriose, 1% higher sac-charides, present in % dry basis (w/w) and Satin Sweet®
65% High Maltose Corn Syrup (70% maltose, 18% mal-totriose, 9% higher saccharides, 2% glucose, present in %dry basis) were used as adjuncts [7]. Both syrups werekindly provided from Cargill Nordic A/S. Prior to inocu-lation, the wort was oxygenated with air until it reached100% saturation.
Fermentation conditionsFor the pre-culture, the yeast from the stock culture waspropagated on YPD plates at 30°C for four days. A sin-gle yeast colony was transferred to 20 ml of 14°Platowort in a sterile 50 ml Falcon tube and incubated at 25°C in a rotary shaker at 150 rpm. After 48 hours, thepreculture was transferred to a 500 ml shake flask with375 ml of fresh wort and incubated for 72 h.All fermentations were performed in 2.2 L bioreactor
(Biostat B5; Braun Biotech International, Melsungen,Germany) with a working volume of 1.5 L. Dissolvedoxygen was monitored with an autoclavable polaro-graphic oxygen electrode. The fermentors were con-nected to Braun Biotech Multi-Fermenter ControlSystem (MFCS) for data acquisition. Silicone based anti-foam agent FD20P in a concentration of 0.1 ml/L (Basil-don Chemicals, England) with food grade quality wasused in the fermentations. The reactors were inoculatedwith a volume of pre-culture, corresponding to 1 × 10⁷
cells/ml. During the cultivation the temperature wasmaintained at 14°C and the stirring was set to 90 rpm.Prior to sampling the stirring was increased to 300 rpmfor 2 min. The higher stirring allowed better mixing andhomogenization of the media and ensured representativesampling. The pH was recorded on-line, but not con-trolled. After the fermentation was completed, the
Piddocke et al. Microbial Cell Factories 2011, 10:27http://www.microbialcellfactories.com/content/10/1/27
Page 2 of 14

whole fermentation broth was transferred to a sterilevessel and stored for 14 days at 0°C, for further matura-tion. Each of the studied fermentation conditions wasinvestigated in duplicate experiments. Detailed physiolo-gical characteristics of the performed cultivations havebeen described previously [7].
Calculations of growth characteristic parametersThe specific growth rate was determined as the slopefrom the linear function of the ln (natural logarithmicfunction) of the cell number (cells/ml) and the fermen-tation time (h) during the exponential growth phase.The yield coefficients were determined as the slopefrom the linear regression on the corresponding pairs ofsubstrate (total saccharides) and product concentration(glycerol and ethanol).
Protease supplementationIn order to increase the available free amino nitrogencontent in the studied high gravity beer fermentations,the enzyme Flavourzyme was used as a supplement in aconcentration of 60 ppm. Flavourzyme is a commerciallyavailable enzyme produced by Novozymes A/S. Pre-viously, Flavourzyme has been commercially used toboost the nitrogen supplementation in bioethanol fer-mentations. It is a fungal multicomponent enzyme pro-duced from Aspergillus oryzae with both endo- and exo-peptidase activities. The optimal temperature and pH forthis enzyme complex is 50°C and pH 5-7, respectively.
Enzyme hydrolysisIn order to determine the activity of the enzyme Fla-vourzyme and to investigate whether an increase in thegravity or change in the wort sugar composition influ-ence its activity, the hydrolysis efficiency of Flavourzymein wort at three different gravities was examined. Thethree different wort compositions were: 14 ˚Plato wort,21 ˚Plato wort adjusted with glucose syrup and 21˚Platowort adjusted with maltose syrup. The hydrolysis wasperformed in 1 L autoclaved shake flasks with a workingvolume of 800 ml of the selected wort. The enzyme Fla-vourzyme was added to each of the flask in a concentra-tion of 60 ppm. As controls, shake flasks hydrolysis withno enzyme addition were used. The shake flasks wereplaced on a shaking table with an agitation of 90 rpmand a temperature of 14 ˚C, conditions that resemblethose prevailing during the brewing experiment. For thesampling, 10 ml samples from each of shake flasks weretaken daily. Each hydrolysis lasted for two weeks andwas done in duplicates.
SamplingIn order to ensure homogenous composition of the cul-tivation liquid, prior to each sampling, stirring was
increased to 300 rpm. Both transcriptome and metabo-lome samples were stored at -80°C until further treat-ment. Samples for analysis of sugars and alcohols werecollected on a regular basis every 24 hours throughoutthe fermentation. For measuring the free amino nitrogencontent from the fermentations, samples were collectedfrom the first and the final day of the primary fermenta-tion. For all of the above analyses, 2-10 ml of fermenta-tion samples were withdrawn from the fermentor,immediately filtered through a Cameo 0.20 μm pore sizeacetate/glass filters (Sartorius AG, Germany) and storedat -20°C prior to analysis.For the cells count determination, samples were also
collected daily. For the transcriptome analyses 20 mlsamples were taken both from the early exponential andfrom the stationary phase. For the metabolome analyses,10 ml samples were taken in the early phase and 20 mlsamples, respectively were taken in the stationary phase.Each sampling was performed in duplicates.
Free amino nitrogen (FAN)The levels of free amino nitrogen (FAN) of the unfer-mented worts and from the last day of the beer fermen-tation were determined using the ninhydrin method at570 nm [8]. Glycine was used as a standard.
HPLC analysisA Dionex Summit HPLC system (Synnyvale, CA) wasused for analysis of sugars and metabolites from theextracellular medium. All metabolites were detectedrefractometrically (Waters 410 Differential Refract-ometer Detector, Millipore Corp., Milford, MA) afterseparation on an Aminex HPX-87H column (Biorad,Hercules, CA) at a temperature of 60°C using 5 mMH2SO4 as eluent. To allow the separation of the sugarswith different degree of polymerization, two Aminexcolumns were mounted in serie with isocratic elution at0.40 ml/min. External standards of maltotriose (DP3),maltose (DP2), glucose (DP1), fructose (DP1), glyceroland ethanol were used.
Metabolome analysisAfter withdrawal from the fermentor, the samples wererapidly quenched into 20 ml precooled (-40°C) 72%methanol. Cells were centrifuged at 10 000 × g for 20minutes in -20°C to separate them from the quenchingsolution. Further on, the intracellular metabolites wereextracted using chloroform: methanol: 3 mM Pipes buf-fer (pH = 7) extraction [9]. Following extraction, thesamples were lyophilized using a Christ-Alpha 1-4 freezedryer.Following lyophilisation, the samples were resus-
pended in 200 μl of 1% (w/v) NaOH solution and deri-vatised using previously described methodology [10,11].
Piddocke et al. Microbial Cell Factories 2011, 10:27http://www.microbialcellfactories.com/content/10/1/27
Page 3 of 14
In order to decrease the matrix effect in the extracellu-lar samples containing a high concentration of malto-dextrins (sugars), the samples were resuspended in 2 mlof NaOH solution. As external standards, amino acidstandards (Sigma) at two different levels were used. Asinternal standards, 20 mM of EDTA and 30 mM ofchlorophenylalanine were used. Samples were normal-ised by the amount of intracellular standards and by thecell number and expressed as normalized peak area.Intra- and extracellular metabolites belonging to thegroup of amino acids and non-amino organic acids wereanalysed by GC-MS. GC-MS analysis was performedwith a Hewlett-Packard system HP 6890 gas chromato-graph coupled to a HP 5973 quadrupole mass selectivedetector (EI) operated at 70 eV. For the analyses, col-umn J&W1701 column with size (30m ×250 μm × 0.15μm) was used (Folsom, CA). The used GC-MS programhas previously been described [12]. Peak detection wasconducted with AMDIS (NIST, Gaithersburg, MD)using default parameters. Each sample was analysed induplicates.
Transcriptome analysisProbe preparation and hybridization to arraysSamples for RNA isolation were taken in duplicates dur-ing the stationary phase of the fermentations. For eachsample, 20 mL of culture were sampled into 50 mLtubes containing 20 mL crushed ice and immediatelycentrifuged at 4000 rpm for 5 min at 4°C. The superna-tant was discarded and the pellet was frozen instanta-neously in liquid nitrogen and stored at -80°C. TotalRNA was extracted using RNeasy Mini Kit (Qiagen),according to the protocol for total RNA isolation fromyeast. The quality and the integrity of the extracted totalRNA was analyzed using an Agilent Bioanalyzer 2100(Agilent technologies Inc., USA) and RNA 6000 NanoLabChip kit. The cDNA and cRNA syntheses, labelingand cRNA hybridization on the oligonucleotide YeastGenome 2.0 Array (Affymetrix, CA) were performed asdescribed in the Affymetrix GeneChip® expression ana-lysis manual [13]. GeneChip® Hybridization Oven, Flui-dics Station FS-450 and 3000 7G Scanner were used forarray hybridization, washing, staining and scanning.Data acquisition and gene expression analysisAffymetrix Microarray Suite v5.0 was used to generateCEL files from the scanned microarrays. Data analysiswas performed by using the statistical open source lan-guage R [14]. Data preprocessing was carried out byusing the Robust Multichip Average (RMA) method[15]. The function rma is contained in the R/affy pack-age [16] and it implements RMA by correcting the Per-fect Match (PM) probes, performing normalization [17]and calculating the expression measure by using medianpolish method.
In order to select genes whose expression levels wererelated to the experimental factors, Two-Way AnalysisOf Variance (ANOVA) was performed. The 2×2 experi-mental design comprises two main factors (’wort type’and ‘protease supplementation’), each having two levels(’glucose wort/maltose wort’ and ‘protease supplemen-ted/protease non-supplemented’). The Two-WayANOVA model was fitted in order to identify signifi-cantly changed gene expression levels with respect tothe two above mentioned factors, as well as, the interac-tion term (’wort type*protease supplementation’). The P-value was corrected for multiple testing by applying theFalse Discovery Rate (FDR) methodology [18] and geneswere selected by imposing a cut-off value of 0.05.Furthermore, as regards to the gene lists associated withthe two main factors, only genes with |log2(fold change)|> 1.301 were considered. Genes selected within theinteraction term were further investigated in order tofind out which genes showed differences in each of thefour possible factor level combinations: ‘glucose wort*-protease supplemented’, ‘glucose wort*protease non-sup-plemented’, ‘maltose wort*protease supplemented’ and‘maltose wort*protease non-supplemented’. The identifi-cation of these genes was achieved by using the tem-plate match method and the R/code [19]. Moreover,gene ontology (GO) process terms of the selected geneswere determined using GO Slim Mapper tools (Sacchar-omyces Genome Database (SGD)) with significance atP-value < 0.01. Normalized gene expression data wasdeposited at Gene Expression Omnibus (GEO) database[20] with accession number GPL2529 (platform),GSM607733-GSM607740 (samples) and GSE24645(series).Reporter Regulators (Transcription Factors) analysisReporter regulators, also named Reporter TranscriptionFactors or TFs, were determined using the software andregulatory network of Oliveira et al., 2008 [21]. Thesoftware is based on reconstructed graph covering eachknown transcription factor or regulatory protein, con-nected to all genes known to be effected by these pro-teins from the Yeast Protein Database (YPD).In order to apply Reporter TFs, pairwise t-test analysis
was performed to obtain statistical values. After thatgene expression data sets was combined with recon-structed graph covering each known transcription factoror regulatory protein to identify a key transcription fac-tor and its regulatory pathway that was the most signifi-cantly effected by the addition of protease in the 21°Plato glucose or maltose syrup supplementedfermentations.
ResultsDuring the course of high gravity beer fermentations,brewer’s yeast is exposed to a number of stressful
Piddocke et al. Microbial Cell Factories 2011, 10:27http://www.microbialcellfactories.com/content/10/1/27
Page 4 of 14

conditions such as high osmotic pressure caused by thehigh glucose concentrations in the beginning of the fer-mentations and ethanol stress, imposed by the elevatedethanol concentration levels towards the end of the fer-mentations. Furthermore, an increase in the gravity bythe addition of sugar syrups to the media results inlower free amino nitrogen concentrations than the mini-mum required, thus brewer’s yeast is exposed to anadditional stress, caused by nitrogen limitation and lim-itations in the level of other nutrients, resulting inrestricted growth [22]. In order to further investigatethe effect of protease addition and its influence on thebrewer’s yeast metabolism, detailed intra and extracellu-lar metabolome and transcriptome analyses were per-formed in samples collected from the early exponentialand from the stationary phase of the fermentations.
Enzyme hydrolysisIn order to determine the activity of the enzyme at theconditions prevailing during beer fermentation, enzymehydrolysis experiments were performed.With optimum temperature at 50°C and pH of 5-7,
obviously, the lager beer fermentations at 14°C, with apH ranging from around 5.2 to 4 during the course ofthe fermentations, provide harsh conditions for theenzyme. According to the Flavourzyme product sheet, atthe conditions imposed during lager beer fermentation,the enzyme will be functioning with approximately 40%of its maximum activity. To determine the activity ofFlavourzyme during the course of lager beer fermenta-tions, Flavourzyme hydrolysis was performed at condi-tions resembling the conditions of lager beerfermentations. The results of the FAN analysis for theinitial and the final sample of the enzyme hydrolysisexperiments are presented in Figure 1.
The hydrolysis experiments showed significantlyhigher increase in the FAN content, for the Flavourzymesupplementation (25 to 40 mg l-1), while variations atthe FAN value for the control fermentations remainwithin the measurement standard deviation of 10%.
Physiological characterisation of the Flavourzymesupplemented fermentationsPrevious characterisation of the Flavourzyme supple-mented fermentations has shown to result in a higherspecific growth rate, but a similar overall ethanol yieldcompared to the non supplemented fermentations [3].Both for the glucose and maltose supplemented fer-
mentations with Flavourzyme addition, the specificgrowth rate was 0.074 (h-1), compared to 0.050 (h-1) and0.064 (h-1) for the glucose and maltose syrup supplemen-ted fermentations, respectively, without enzyme supple-mentations. For the glucose syrup supplementedfermentations, the ethanol yield was 0.48 g/g both for thenon supplemented and Flavourzyme supplemented fer-mentations, while the glycerol yield was 0.026 and 0.024(g/g), respectively. For the maltose supplemented fermen-tations, ethanol yield was 0.49 (g/g) for the control and0.47 (g/g) for the Flavourzyme supplemented fermenta-tions, while the glycerol yield remain the same in bothcases (0.018 g/g). Furthermore, supplementation withFlavourzyme also resulted in shorter lag phase of thebrewer’s yeast cell growth. Despite the similar or slightlylower ethanol yield for the Flavourzyme supplementedfermentations, due to the higher specific growth rate, thespecific ethanol productivity (calculated from the yieldcoefficients multiplied by the growth rate) of those fer-mentations was higher (Figure 2). The Flavourzyme sup-plemented fermentations also showed improved wortfermentability. While the non supplemented fermenta-tions resulted in final gravity of 5.2 and 4.3, for the glu-cose and maltose syrup supplementation, respectively,the same fermentations with Flavourzyme addition hadfinal gravity of 4.9 and 3.5, respectively, pointing to animproved utilization of the nitrogen available in the wort.In order to further investigate the effect of the multi-
component enzyme Flavourzyme on the metabolism ofthe lager brewer’s yeast strain Weihenstephan 34/70, fol-lowing the physiological characterization, samples fortranscriptome analysis and intra- and extracellular meta-bolome analysis from the early exponential phase(around 40 to 50 fermentation hours) and from the sta-tionary phase (around 200 to 220 fermentation hours)were collected (the sampling points are indicated byarrows in Figure 2). The exact time of sampling for thestudied fermentation conditions varied between the glu-cose and maltose syrup supplemented as well asbetween protease supplemented and non-supplementedfermentations.
0
50
100
150
200
250
300
Initial Final Initial Final Initial Final Initial Final Initial Final Initial Final
Control Flavourzyme Control Flavourzyme Control Flavourzyme
14 21 Gl 21 M
Ave
rage
FA
N (m
g l -1
)
Figure 1 Results from the FAN measurements of initial andfinal samples collected during enzyme hydrolysis assays. Thevalues are average of duplicate measurements with standarddeviation < 10%.
Piddocke et al. Microbial Cell Factories 2011, 10:27http://www.microbialcellfactories.com/content/10/1/27
Page 5 of 14

Metabolome analysisMetabolites are the end products of cellular regulatoryprocesses and they play a very important role in con-necting many different pathways that operate within aliving cell. Metabolome analysis is complicated since itincludes all small molecules in a biological system. Inaddition, metabolites are heterogeneous, have differenttypes of structures, functional groups, physicochemicalproperties, concentrations and many of them are stillunknown [9]. Thus, the levels of metabolites can beregarded as the ultimate response of an organism togenetic alterations or environmental influences.In the current study, the principle of alkylation reac-
tion using methyl chloroformate [10,11] was used toenable simultaneous separation, detection and quantifi-cation of both intracellular and extracellular metabolites,belonging to the groups of amino acids and non-aminoorganic acids as well as their derivatives. From theapproximately 600 metabolites included in the genome-wide metabolic reconstruction for yeast Saccharomycescerevisiae [23], 40% are amines, amino acids and organicacids. Out of those, the applied method used in-housedeveloped MS library, consisting of 75 metaboliteswhich play a major role in the central carbon
metabolism and amino acid biosynthesis. For calculatingthe fold change of the metabolites between the studiedconditions, the value for each metabolite was repre-sented as the average value from duplicate analysis ofmetabolome samples from the same fermentation aswell as from duplicate fermentations.Intracellular metabolitesIn total, 39 intracellular metabolites were determinedfrom the early exponential and from the stationary phaseof the studied fermentations. In order to investigate theimpact of the enzyme addition on the type of the sugarsyrups used, the samples for the glucose and maltose syr-ups supplemented fermentations from the early exponen-tial and from the stationary phase were compared.Comparison between the glucose and maltose syrup
supplemented fermentations with protease supplementa-tion showed higher concentration for most of the aminoacids and organic acids for the maltose syrup supple-mented fermentations with protease addition (See Table1 and Table 2). The effect on the addition of Flavour-zyme was especially pronounced for the early exponen-tial phase of the studied fermentations. From the earlyexponential phase of the control fermentations onlyasparagine was present in higher level for maltose syrup
D.
A.
C.
B.
Figure 2 A. Control fermentations with glucose syrup supplementation; B. Control fermentations with maltose syrupsupplementation; C. Glucose syrup supplemented fermentations with Flavourzyme addition; D. Maltose syrup supplementedfermentations with Flavourzyme addition. Arrows in the figures correspond to the sampling points for metabolome and transcriptomeanalysis of the studied fermentations. In the graphs, black circles represent the concentrations of glucose, black squares of fructose, blacktriangles of maltose, black diamonds of maltotriose, white squares of ethanol, white circles of glycerol and white triangles represent the numbersof cells/ml.
Piddocke et al. Microbial Cell Factories 2011, 10:27http://www.microbialcellfactories.com/content/10/1/27
Page 6 of 14

supplemented fermentations. For the samples from theearly exponential phase, Flavourzyme addition in themaltose syrup supplemented fermentation showed anincrease in the fold change for fifteen of the studiedamino acids (Table 1). The fold change increase formost of the amino acids was in the range from 1 to 2,with the exception of isoleucine, that had a fold changeincrease of 2.74. For the stationary phase of the controlfermentations, in total, also fifteen amino acids werepresent in higher fold change for the maltose syrup sup-plemented fermentations, with a fold change in therange from 1 to 13.8. For the stationary phase of thecontrol fermentations, higher fold change for the mal-tose syrup supplemented fermentations compared to theglucose syrup supplemented ones, was observed for theintermediate of cysteine- cystathionine (13.8), histidine(13.2), phenylalanine (10.7) and lysine (8.95) (Table 1).All of the studied organic acids from the early expo-
nential phase of the control fermentations were presentin higher concentrations for the glucose syrup
supplemented fermentations compared to the maltosesyrup supplemented ones. Addition of Flavourzyme tothe maltose syrup supplemented fermentations resultedin increase in the concentrations for most of the TCAcycle intermediates. While for most of the organic acidsthe increase in the fold change was in the range between1 to 2, pyruvic acid and nicotinic acid showed higherfold change increase to 3.63 and 3.09, respectively. Inthe stationary phase, the control fermentations withmaltose syrup supplementation resulted in higher foldincrease in the range of 1.36 to 3.72 for succinic, citra-malic, citric and cis-aconitic acids, respectively. Additionof Flavourzyme to the maltose supplemented fermenta-tions resulted in higher fold change for nicotinic, isoci-tric, cis-aconitic, 2-isopropylmalic, citric and 2-oxoglutaric acids. Their fold change increase was in therange of 1.10 to 2.70.Extracellular metabolitesIn total, 14 extracellular metabolites were determinedfrom the early exponential and from the stationary
Table 1 Fold change of the intracellular amino acids and amino acid intermediates compounds of the maltose syrupversus glucose syrup supplemented fermentations
Maltose/Glucose Early exponential phase Maltose/Glucose Stationary phase
Control Flavourzyme supplementation Control Flavourzyme supplementation
Alanine 0.19 1.18 4.63 1.22
Glycine 0.05 0.22 5.46 1.40
2-aminobutyric acid 0.13 0.49 0.29 1.61
Valine 0.12 1.15 6.06 1.49
Leucine 0.14 1.97 3.61 1.35
Isoleucine 0.38 2.74 4.01 0.95
4-amino-n-butyric acid - 1.20 1.41 0.85
Proline 0.13 0.82 0.55 1.11
Threonine 0.42 1.00 0.89 0.39
Serine 0.26 1.75 1.44 0.73
Asparagine 1.02 1.37 1.82 1.00
Methionine 0.74 1.78 - -
N-acetyl-L-glutamate - - 0.37 0.54
Phenylalanine 0.29 1.40 10.7 1.14
Trans-4-hydroxyproline - - - 1.87
Ornithine - 0.35 1.02 0.90
Lysine 0.35 0.65 8.95 1.99
Glutamine - - - 2.50
Histidine 0.29 1.31 13.2 1.03
Tyrosine 0.50 1.01 3.50 0.84
Tryptophan 0.42 1.14 7.38 1.19
Cystathionine 0.27 0.46 13.8 1.29
Aspartic acid 0.27 1.10 3.26 1.69
Glutamic acid 0.19 1.76 3.72 1.00
The underlined numbers represents an increase in the fold change between the Flavourzyme supplemented versus non-supplemented fermentations for therespective fermentation phase. The symbol “-"indicates that the metabolites were not present in the studied conditions.
Piddocke et al. Microbial Cell Factories 2011, 10:27http://www.microbialcellfactories.com/content/10/1/27
Page 7 of 14

phase of the studied fermentations. In general, fewercompounds were found extracellularly thanintracellularly.Comparison of the determined extracellular metabo-
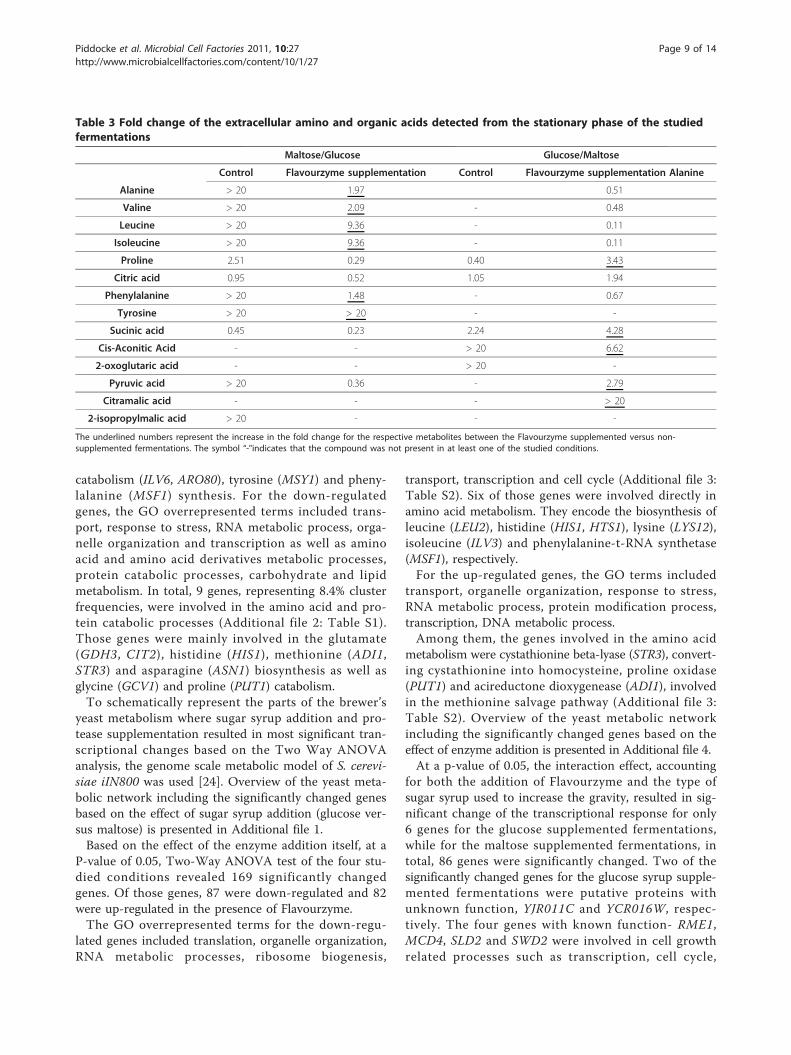
lites from the stationary phase between the maltose andglucose syrup supplemented fermentations without pro-tease supplementation, showed significantly higher con-centrations of the amino acids and organic acidsinvolved in the pyruvate metabolism- alanine, valine,leucine, pyruvic acid and 2-isopropylmalic acid. In addi-tion, phenylalanine and tyrosine involved in the phos-phoenolpyruvate metabolism and isoleucine were alsopresent in significantly higher concentrations for themaltose syrup supplemented fermentations (Table 3).For the glucose supplemented fermentations withoutprotease supplementation, the TCA cycle intermediates-citric acid, succinic acid, cis-aconitic acid and 2-oxoglu-taric acids were present in significantly higherconcentrations.Addition of Flavourzyme to the maltose syrup supple-
mented fermentations resulted in further increase of thealanine, valine, leucine, isoleucine and phenylalanineconcentrations (Table 3). Addition of Flavourzyme tothe glucose syrup supplemented fermentations resultedin further increase of the concentrations of the TCAintermediates- citric, succinic, pyruvic acid as well asincrease in the concentration of citramalic acid.
Transcriptome analysisTo study the effect on the addition of the multicompo-nent protease Flavourzymes on the metabolism of thebrewer’s yeast Weihenstephan 34/70, genome-wide tran-scription profiles from the stationary phase of the stu-died fermentations were analyzed. To quantitativelydetermine the genes with significantly changed expres-sion, Two-Way ANOVA analysis was performed.Based only on the type of sugar syrup used (maltose
rich versus glucose rich), at a P-value of 0.05, Two-WayANOVA test revealed 311 genes with significantchanges in their expression. Of those, 204 were up-regu-lated and 107 were down-regulated in the maltose syrupsupplemented fermentations. The levels of the foldchange for the significantly changed genes were in therange from -4 to 3.4. Among the up-regulated genes,the most significantly enriched GO terms revealed over-representation for the following categories: organelleorganization, RNA metabolic process, translation, tran-scription, transport, cell cycle as well as response tostress, carbohydrate and lipid metabolism (Additionalfile 1). Of the up-regulated genes, 6 genes, (representing2.9% of cluster frequency) were involved in the aminoacids related metabolism and protein catabolism. Thesix genes were involved in amino acids biosynthesis(ECM17), glycine catabolism (GRS1), branch chainamino acids- leucine, isoleucine, valine synthesis and
Table 2 Fold change of the intracellular organic acids for the studied fermentations of the maltose syrup versusglucose syrup supplemented fermentations
Maltose/Glucose Early exponential phase Maltose/Glucose Stationary phase
Control Flavourzyme supplementation Control Flavourzyme supplementation
Pyruvic acid - 3.63 - 0.68
Malonic acid - 0.13 - 0.35
(3S)-3-Methyl-2-oxopentanoic acid - 0.36 - 0.61
Fumaric acid - 1.16 - 0.96
Malic acid - 1.16 - 0.96
Succinic acid 0.10 1.57 1.36 0.62
Citramalic acid 0.00 1.03 1.69 0.45
Nicotinic acid 0.29 3.09 0.34 1.10
2-isopropylmalic acid - - 0.39 1.30
2-oxoglutaric acid - 0.84 0.49 2.70
Citric acid 0.20 1.74 1.46 1.59
cis-Aconitic Acid 0.35 1.98 3.75 1.27
Pyroglutamic acid 0.26 - - -
Isocitric acid 0.09 0.64 0.10 1.23
Cumaric acid - 0.71 - 0.56
5-hydroxymethyl-2-furaldehyde - 0.78 - 0.46
Glutaric acid - 0.01 - 0.71
Glyceric acid - 1.71 - 0.91
The underlined numbers represent the increase in the fold change for the studied metabolites between the Flavourzyme supplemented versus non-supplemented fermentations for the respective fermentation phase. The symbol “-"indicates that the metabolites were not present in the studied conditions.
Piddocke et al. Microbial Cell Factories 2011, 10:27http://www.microbialcellfactories.com/content/10/1/27
Page 8 of 14
catabolism (ILV6, ARO80), tyrosine (MSY1) and pheny-lalanine (MSF1) synthesis. For the down-regulatedgenes, the GO overrepresented terms included trans-port, response to stress, RNA metabolic process, orga-nelle organization and transcription as well as aminoacid and amino acid derivatives metabolic processes,protein catabolic processes, carbohydrate and lipidmetabolism. In total, 9 genes, representing 8.4% clusterfrequencies, were involved in the amino acid and pro-tein catabolic processes (Additional file 2: Table S1).Those genes were mainly involved in the glutamate(GDH3, CIT2), histidine (HIS1), methionine (ADI1,STR3) and asparagine (ASN1) biosynthesis as well asglycine (GCV1) and proline (PUT1) catabolism.To schematically represent the parts of the brewer’s
yeast metabolism where sugar syrup addition and pro-tease supplementation resulted in most significant tran-scriptional changes based on the Two Way ANOVAanalysis, the genome scale metabolic model of S. cerevi-siae iIN800 was used [24]. Overview of the yeast meta-bolic network including the significantly changed genesbased on the effect of sugar syrup addition (glucose ver-sus maltose) is presented in Additional file 1.Based on the effect of the enzyme addition itself, at a
P-value of 0.05, Two-Way ANOVA test of the four stu-died conditions revealed 169 significantly changedgenes. Of those genes, 87 were down-regulated and 82were up-regulated in the presence of Flavourzyme.The GO overrepresented terms for the down-regu-
lated genes included translation, organelle organization,RNA metabolic processes, ribosome biogenesis,
transport, transcription and cell cycle (Additional file 3:Table S2). Six of those genes were involved directly inamino acid metabolism. They encode the biosynthesis ofleucine (LEU2), histidine (HIS1, HTS1), lysine (LYS12),isoleucine (ILV3) and phenylalanine-t-RNA synthetase(MSF1), respectively.For the up-regulated genes, the GO terms included
transport, organelle organization, response to stress,RNA metabolic process, protein modification process,transcription, DNA metabolic process.Among them, the genes involved in the amino acid
metabolism were cystathionine beta-lyase (STR3), convert-ing cystathionine into homocysteine, proline oxidase(PUT1) and acireductone dioxygenease (ADI1), involvedin the methionine salvage pathway (Additional file 3:Table S2). Overview of the yeast metabolic networkincluding the significantly changed genes based on theeffect of enzyme addition is presented in Additional file 4.At a p-value of 0.05, the interaction effect, accounting
for both the addition of Flavourzyme and the type ofsugar syrup used to increase the gravity, resulted in sig-nificant change of the transcriptional response for only6 genes for the glucose supplemented fermentations,while for the maltose supplemented fermentations, intotal, 86 genes were significantly changed. Two of thesignificantly changed genes for the glucose syrup supple-mented fermentations were putative proteins withunknown function, YJR011C and YCR016W, respec-tively. The four genes with known function- RME1,MCD4, SLD2 and SWD2 were involved in cell growthrelated processes such as transcription, cell cycle,
Table 3 Fold change of the extracellular amino and organic acids detected from the stationary phase of the studiedfermentations
Maltose/Glucose Glucose/Maltose
Control Flavourzyme supplementation Control Flavourzyme supplementation Alanine
Alanine > 20 1.97 0.51
Valine > 20 2.09 - 0.48
Leucine > 20 9.36 - 0.11
Isoleucine > 20 9.36 - 0.11
Proline 2.51 0.29 0.40 3.43
Citric acid 0.95 0.52 1.05 1.94
Phenylalanine > 20 1.48 - 0.67
Tyrosine > 20 > 20 - -
Sucinic acid 0.45 0.23 2.24 4.28
Cis-Aconitic Acid - - > 20 6.62
2-oxoglutaric acid - - > 20 -
Pyruvic acid > 20 0.36 - 2.79
Citramalic acid - - - > 20
2-isopropylmalic acid > 20 - - -
The underlined numbers represent the increase in the fold change for the respective metabolites between the Flavourzyme supplemented versus non-supplemented fermentations. The symbol “-"indicates that the compound was not present in at least one of the studied conditions.
Piddocke et al. Microbial Cell Factories 2011, 10:27http://www.microbialcellfactories.com/content/10/1/27
Page 9 of 14

meiosis, RNA and DNA metabolic processes (Figure 3).Among the four genes, only MCD4 was up-regulatedwhile the rest of the genes were down-regulated.Among the 86 significantly changed genes for the mal-
tose supplemented fermentations with Flavourzymeaddition, 41 genes were down-regulated and 45 geneswere up-regulated. In order to determine significantlyenriched Gene Ontology (GO) process terms within thesignificantly changed genes, based on the interactioneffect of the type of sugar syrup and addition of pro-tease, Saccharomyces Genome Database (SGD) - GOtools with significance at p < 0.05 were used. The mostoverrepresented GO terms among the up-regulatedgenes with known function were transport and cellgrowth related processes such as RNA metabolic pro-cess, transcription and DNA metabolic process (Addi-tional file 5: Table S3). 11 of the 45 up-regulated geneswere ORF with unknown function. Three of the up-regulated genes - ARG82, ARO80 and MET13, weredirectly involved in amino acid metabolism. ARG82 isinositol polyphosphate multikinase (IPMK), regulatingarginine-, phosphate-, and nitrogen-responsive genes;ARO80 is activating transcription of aromatic aminoacid catabolic genes in the presence of aromatic aminoacids and MET13 is major isozyme of methylenetetrahy-drofolate reductase, involved in the methionine bio-synthesis pathway. Among the down-regulated genes,the most overrepresented GO terms were also cellgrowth related processes such as RNA metabolic pro-cess, organelle organization, transcription, ribosome bio-genesis and translation. Three of the down-regulatedgenes- FRS2, VAS1, HTS1 were also involved in cellularamino acid and derivative metabolic process. FRS2 is
alpha subunit of cytoplasmic phenylalanyl-tRNA synthe-tase, VAS1 is mitochondrial and cytoplasmic valyl-tRNAsynthetase and HTS1 is cytoplasmic and mitochondrialhistidine tRNA synthetase.To schematically represent the parts of the brewer’s
yeast amino acid metabolism where the interactioneffect of protease supplementation and type of sugarsyrup used as a supplement resulted in most significanttranscriptional changes based on the Two Way ANOVAanalysis (Figure 4), the genome scale metabolic model ofS. cerevisiae iIN800 was used [24]. Detailed overview ofthe most significant transcriptional changes in thebrewer’s yeast amino acid metabolism as a result of theinteraction effect of protease supplementation and sugarsyrup used as adjunct is presented in Additional file 6.Detailed yeast metabolic map including all significantly
changed genes from Two Way ANOVA analysis for theinteraction effect (sugar*enzyme supplementation) in thebrewer’s yeast metabolic network (based on the genomescale metabolic model S.cerevisiae iIN800) is presentedin Additional file 7.Analysis of RegulatorsTo identify the transcription factors around which themost significant changes occur, the reporter featuresalgorithm [21], using the interaction based on protein-protein interaction networks was applied (Table 4,hypergeometric test at P < 0.01). In total, the analysisrevealed 5 TFs with high degree of transcriptionalregulation.Among those, Fks1 is involved in cell wall synthesis
and maintenance, Pos5 is mitochondrial NADH kinaseand phosphorylates NADH and NAD(+) with lower spe-cificity and it is required for the response to oxidative
A. B.
Figure 3 Schematic overview of the GO annotation, based on the biological process ontology, for the significantly changed genes inmaltose syrup supplemented fermentations with Flavourzyme addition. A. The main overrepresented GO annotation categories for the upregulated genes. B. The main overrepresented GO annotation categories for the down regulated genes.
Piddocke et al. Microbial Cell Factories 2011, 10:27http://www.microbialcellfactories.com/content/10/1/27
Page 10 of 14

stress, Hap1 is a zinc finger transcription factor involvedin the complex regulation of gene expression inresponse to levels of heme and oxygen, Mot3 is nucleartranscription factor involved in repression of a subset ofhypoxic genes by Rox1p, repression of several DAN/TIRgenes during aerobic growth, and repression of ergos-terol biosynthetic genes. While Hap1 and Mot3 areinvolved in RNA metabolic processes and transcription,Pos5 is involved in response to stress and cofactor meta-bolic process, Hap1 in cellular respiration, Fks1 in cellwall and membrane organization and transport andUpc2 in carbohydrate metabolic process. To account forthe directionality of the reported regulations, ReporterTFs for only the up-regulated or only the down-regu-lated genes were performed. Among the five signifi-cantly altered TFs, only Mot3 was involved in theregulation of the down-regulated genes, while the rest ofthe TFs were involved in the regulation of the up-regu-lated genes.
DiscussionIn the food industry, enzymes can be used as alternativesfor traditional chemical-based technology and can substi-tute the use of synthetic chemicals in many different pro-cess applications. Their advantages are associated withmore specific modes of action, reduced formation ofbyproducts and as a result, improved environmental per-formance of the production process such as lower energyconsumption and biodegradability of waste products.Here we show that addition of the multicomponent
enzyme Flavourzyme led to increase in the availableFAN in wort, which in turn resulted in improved fer-mentation performance with higher specific growth rateand more favored flavour profile of the final beer. Inaddition to the importance of the assimilable nitrogenavailability, our detailed metabolome and transcriptomeanalysis confirmed the importance of the wort sugarcomposition on the utilization of the supplied nitrogen.Both transcriptome and metabolome analysis revealedsignificantly lower impact on the Flavourzyme additionfor the glucose syrup supplemented fermentations com-pared to the maltose ones.Thus, the difference in the amino acids and organic
acid profile among the studied fermentations were dri-ven by the combined effect of two major events. On oneside, the intracellular metabolome profile revealedhigher intracellular concentration for most of the aminoacids in the maltose syrup supplemented fermentationscompared to the glucose ones. Increase in the range of1-2 fold for the amino acids in the early exponentialphase for the maltose syrup supplemented fermentationsrevealed that addition of Flavourzyme primarily influ-enced the amount of nitrogenous compounds in themaltose syrup supplemented wort. During the stationary
ILV6_1
ILV1
YLR089C AAT1_1
ILV5_1
BAT1_2
ILV3_1
ILV2_1
ILV5_2
PUT1
PUT2
ILV3_2
LYS12
U49_
U50_
LYS4
LYS20_2
MSD1
U41_
MSE1
YER087W
MST1
ISM1
CO2m
NH3m
NADPHm
NADPm
CO2m
NADPHm
NADPm
NADHm
NADm
NADHm
NADm
NADHm
NADm
CO2m
COAm
H2Om
CO2m
AMPm
ATPm
PPIm
ATPmAMPmMPPIm
ATPm
ADPm
PPIm
2-AcetolactateM
(R)-3-Hydroxy-3-methyl-2-oxobutanoateM
GlutamateM
2-OxoglutarateM
(R)-2-OxoisovalerateM
L-IsoleucineM
2 PyruvateM
L-ThreonineM
2-Aceto-2-hydroxy butyrateM
(R)-2,3-dihydroxy-3-methylbutanoateM L-ProlineM
3-Methyl-2-oxobutanoateM
2-OxobutanoateM
PyruvateM
L-AlanineM 2-OxoglutarateM
GlutamateM
OxaloacetateM
L-Asp
artateM
OxaloglutarateM
2-Hydroxybutane-1,2,4-tricarboxylateM
But-1-ene-1,2,4-tricarboxylateM
HomoisocitrateM
2-OxoadipateM
Acetyl-CoAM 2-OxoglutarateM
PyruvateM
L-Aspartyl-tRNA(Asp)M
tRNA(Asp)M
L-Glutamate 5-semialdehydeM
GlutamateM
(S)-1-Pyrroline-5-carboxylateM
L-Glutamyl-tRNA(Glu)M
tRNAM
tRNA(Pro)M
M)or
P(A
NRt-
lynil
orP-
L
M)r
hT(
ANR
t
L-Threonyl-tRNA(Thr)M
L-Isoleucyl-tRNA(Ile)M
tRNA(Ile)M
AMPM
ATPM
PPIM
AMPM ATPMPPIM
Lysine
Branched amino acids(Valine, leucine, isoleucine)
Alanine and aspartateconversions
Prolineconversions
MSM1
MSY1
MSF1
ATPm
AMPmM
PPIm
ATPm
AMPmM
PPIm
ATPm
AMPmM
PPIm
L-Methionyl-tRNAM
tRNA(Met)M
tRNA(Phe)M
L-Methionine
L-Tyrosyl-tRNA(Tyr)M
tRNA(Tyr)M
L-Tyrosine
L-PhenylalanineL-Phenylalanyl-tRNA(Phe)M
(A)
NADH
H2O
NADP
NADPH
ADP
ATP
NAD
NADPH
NADP
AMP
ATP
PPI
alpha-D-Glutamyl phosphate
(S)-1-Pyrroline-5-carboxylate
L-Glutamate
L-Proline
L-Glutamate 5-semialdehyde
L-Glutamate 5-semialdehyde
L-Prolinyl-tRNA(Pro)
tRNA(Pro)
PRO3_1
U66_
PRO2_1
PRO1
PRO2_2
YHR020W
Proline
PI
NAD
NADH
NADH
NAD
H2O
NH3
H2ONH3
NH3
H2S
COA
THFAdenosine
NAD
NADH
2 NADH
2 NAD
NAD
PI
NADH
NH3
ADP
ATP
ADP
ATP
PPI
PI
ATP
H2O
H2O
PPI
ATP
PPI
PI
H2O
H2O
H2O
ADP
ATP
PI
PI
PI
PI
NADP
NADPH
PI
NADPH
NADPH
AMP
ATP
PPI
AMP
ATP
PPI
AMPATP PPI
AMPATP PPI
AMP
ATP
PPI
AMPATP
PPI
2-Dehydro-3-deoxy-D-arabino-heptonate7-P
3-Dehydroquinate
3-Dehydroshikimate
Shikimate
3-Phospho-D-glycerateL-Aspartate
3-Phosphonooxypyruvate
Homocysteine
L-Cystathionine
Pyruvate
etavuryP
L-Cysteine
L-Methionine
2-Oxobutanoate
L-Homoserine
L-Histidine
Shikimate3-P
4-Phospho-L-aspartate
SAM
N1-(5-Phospho-D-ribosyl)-ATP
N1-(5-Phospho-D-ribosyl)-AMP
L-Histidinol
3-(Imidazol-4-yl)-2-oxopropyl phosphate
5-(5-Phospho-D-ribosylaminoformimino)-1-(5-phosphoribosyl)-imidazole-4-carboxamide
"N-(5'-Phospho-D-1'-ribulosylformimino)-5-amino-1-(5""-phospho-D-ribosyl)-4-imidazolecarboxamide"
L-Glutamine
L-Glutamate
AIRCAR
PRPP
O-Phospho-L-homoserine
Phosphoenolpyruvate
5-O-(1-Carboxyvinyl)-3-phosphoshikimate
L-Serine
Acetyl-CoAMTHF
S-Adenosyl-L-homocysteine O-Acetyl-L-serine
Acetate
2-OxobutanoateL-Threonine
AcetaldehydeAcetate
Chorismate
L-PhenylalanineL-Tryptophan
L-Tyrosine
L-Glutamate
2-Oxoglutarate
L-Histidinol phosphate
L-Aspartate 4-semialdehyde
D-erythro-1-(Imidazol-4-yl)glycerol3-P
L-Glutamate
2-Oxoglutarate
3-Phosphoserine
THF
METTHF
Glycine
Pyruvate
L-Alanine
Glyoxylate
D-Erythrose 4-P Phosphoenolpyruvate
SAMSAH
tRNA(His)
SAH
Uroporphyrinogen III
Sirohydrochlorin
L-Histidyl-tRNA(His)
tRNA(Cys)
L-Cysteinyl-tRNA(Cys)
tRN
A(S
er)
L-Serinyl-tRNA(Ser)
Glycine
)ylG(
ANRt
L-Glyciyl-tRNA(Gly)
tRNA(Thr)
L-Methionyl-tRNA(Met)
)ehP(
ANRt
L-Phenylalanyl-tRNA(Phe)
ARO1_1
ARO1_3
SER3
STR3
CHA1_2
CYS3
MHT1
YFL030W
ARO1_4
HOM3
SAM2
HIS1
HIS4_1
HIS2
HIS3
HIS4_2
HIS6
THR1
ARO1_5
SER2
U48_
U47_
SAH1
CHA1_1
YGR012
W
THR4_1
U46_
GLY1
HIS5
HOM2
HIS7
SER1_1
SHM2
ARO2
HOM6_1
HIS4_3
ARO1_2
ARO4
ARO3
SER33
YIL167W
SAM1
2_6MOH
SAM4
HTS1
MET1
YNL247W
SES1DIA4
GRS1GRS2
THS1
FRS1FRS2
Aromatic amino acid
HistidineGlycine,Serine,Threonine
Homoserine
Cysteine
Methionine
Protein synthesis
Protein synthesis
PI
ATP
gamma-L-Glutamyl-L-cysteine
L-glutamate
GSH1
Prephenate
ARO7
Peptide PEPTxt
Oligopeptide OPEPxt
Dipeptide DIPEPxt
PTR2_3
PTR2_2
PTR2_1
(B)
METxtL-Methionine 3P
UM
Mit
och
on
dri
a
Cyt
op
lasm
Figure 4 Parts of Weihenstephan 34/70 amino acid metabolism (based on the genome scale metabolic model of S. cerevisiae iIN800)with significantly changed genes in the metabolic network identified from Two Way ANOVA Analysis. The significantly expressed genesbased on the effect of type of sugar added (maltose versus glucose) are represented by square. The significantly expressed genes based on theeffect of enzyme added (enzyme versus non-enzyme supplementation) are represented by triangle. Shapes coloured in red represent the up-regulated genes and shapes coloured in green represent the down-regulated genes for the respective studied effect. Blue circle representssignificantly expressed genes of the interaction effect (sugar*enzyme).
Table 4 Transcription factors for the maltosesupplemented fermentations, based on the t-testcomparison between the control and Flavourzymesupplemented fermentations
Transcription factors Number of neighbours Z-score P-value
FKS1 24 2,7 0,003
POS5 141 2,48 0,007
HAP1 24 2,47 0,008
MOT3 19 2,34 0,01
UPC2 17 2,08 0,02
The number of neighbours indicates the number of genes regulated by theparticular transcription factor. Z-score represents the score of each TF,calculated based on the score of its neighbours. The P-value gives measure ofsignificance and all results ≤0.05 are reported.
Piddocke et al. Microbial Cell Factories 2011, 10:27http://www.microbialcellfactories.com/content/10/1/27
Page 11 of 14

phase, comparison across the metabolome profilebetween the glucose and maltose syrup supplementedfermentations without addition of proteases also showedhigher concentration for most of the amino acids andsome of the organic acids for the stationary phase sam-ples of the maltose syrup supplemented fermentations.Furthermore, this difference was further enhanced withthe addition of Flavourzyme.The amino acids present in wort have been pre-
viously classified into three groups based on theimpact formation of a-keto acid analogues that repre-sent important flavour compounds [25]. According tothis classification, aspartate, asparagine, glutamate, glu-tamine, threonine, serine, methionine and prolinebelong to class 1, isoleucine, valine, phenylalanine, gly-cine, alanine and tyrosine belong to class 2 and lysine,histidine, arginine and leucine belong to class 3. Whilethe concentration of amino acids from class 1 in thewort is considered to be relatively unimportant, as theycan be either assimilated from the wort or synthesizedde novo, the initial concentration of the compoundsfrom class 2 is crucial since in the later stages of thefermentation the synthesis of these compounds fromsugars is repressed. The amino acids from class 3 arealso of importance since they are delivered exclusivelyfrom the wort. Thus, deficiencies in the amino acidsfrom group 2 and group 3 will restrict the synthesis ofcompounds derived from the a-keto acid analogue ofthese amino acids and metabolism of their related by-products and thus affect the beer quality [6]. Additionof Flavourzyme leads to an increase in the amino acidcontent mainly present in class 2 and 1, as well as his-tidine belonging to class 3. Thus, addition of Flavour-zyme might also contribute to a more balanced flavourprofile of the resulting beer product.Addition of Flavourzyme to the maltose syrup sup-
plemented fermentations revealed intracellular increasein the amino acids such as alanine, valine and leucineinvolved in the pyruvate and phosphoenol pyruvatemetabolism both from the early exponential and fromthe stationary phase. Comparison across the glucoseand maltose syrup fermentations without and with Fla-vourzyme addition also revealed higher concentrationsof these amino acids for the maltose syrup supplemen-ted fermentations. Increase in the pyruvic acid itself, aswell as most of the other TCA cycle intermediatessuch as fumaric, malic, succinic and citric acid fromthe early exponential phase of the maltose syrup sup-plemented fermentations was also observed. Theincrease in the concentrations of those compounds ispossibly an indicator of the higher metabolic activity inthe maltose syrup supplemented fermentations com-pared to the glucose ones [5]. Addition of Flavourzymeto the glucose syrup supplemented fermentations
results in an increase in the intracellular concentra-tions of TCA cycle intermediates such as 2-oxoglutaricacid, citric acid and isocitric acid in the stationaryphase. The observed accumulation of TCA intermedi-ates inside the cell could be a result of amino acidscatabolism, but it may also be due to repression onyeast growth due to the increased osmotic pressureleading to incomplete TCA cycle metabolism [6].Transcriptome analyses confirmed the higher impact
of Flavourzyme supplementation on the maltose syrupsupplemented fermentations compared to the glucoseones. While statistical analyses revealed only 6 signifi-cantly changed genes upon addition of Flavourzyme forthe glucose syrup supplemented fermentations, 86 geneswere significantly changed for the maltose syrup supple-mented fermentations.Addition of Flavourzyme did not result in the same
transcriptional response in the glucose syrup supple-mented fermentations compared to the maltose syrupsupplemented ones. Presence of high concentrations ofglucose in the growth medium likely represses thetranscription of multiple genes involved in the alterna-tive carbohydrate and mitochondrial metabolism. Thisphenomenon is known as carbon catabolite repression(CCR). CCR encounter coordinated down regulation ofthe transcription of large group of genes involved inmetabolism of non-glucose carbon sources, a numberof hexose transporters and respiration [26,27]. A majorrole in the global regulation of CCR is played by thetwo nutrient signaling transducers- Snf1 and Gcn2.Tor1 is another important nutritional transducerwhich has been implicated in the up-regulation of thegeneral amino acid permease with broad specificity-Gap1, in the down regulation of the tryptophan andtyrosine permease- Tat2 and the high affinity histidinepermease- Hip1. A study of Peter et al., 2006 [28]found that transport of neutral, cationic and anionicamino acids is regulated by CCR at the protein expres-sion and functional levels. By deletion of various genesinvolved in the amino acids sensing and uptake, theauthors proved that signaling of the activation of neu-tral and cationic amino acid permeases due to CCRactivation is via the TOR1 pathway and not throughthe Snf1/Mig1, Gcn2 or Ras kinase pathways. Theauthors observed an increase in the amino acid trans-porter activity for all three classes of amino acids whenS. cerevisiae was grown on alternative carbon source asfor example galactose media, compared to those grownon glucose media. This observation may explain thelower amino acid uptake for the glucose syrup supple-mented fermentations with Flavourzyme addition,where only a small increase in the relative concentra-tion for some of the studied intracellular amino acids(in our metabolome profile) and low number of
Piddocke et al. Microbial Cell Factories 2011, 10:27http://www.microbialcellfactories.com/content/10/1/27
Page 12 of 14

significantly changed genes (in our transcriptome pro-file) were observed compared to maltose syrup supple-mented fermentations with Flavourzyme addition.Thus, it is possible that the observed carbon cataboliterepression in glucose rich media also represses theuptake of nitrogenous compounds in the wort. As aresult of such repression, the low number of signifi-cantly changed genes in the glucose syrup supplemen-ted fermentations is possible indication that theregulatory control of the Flavourzyme addition ismainly achieved at the levels of enzyme kinetics (meta-bolome) levels and not at hierarchical (transcriptome)levels [29].On the contrary, for the maltose syrup supplemented
fermentations, addition of Flavourzyme might have alsoresulted in significant changes at the levels of transcrip-tion/translation and post-translational modifications.
ConclusionIn conclusion, changes in the amino acid uptake whenglucose or alternative to glucose carbon sources areused, plays an important role in protein synthesis andother processes of cell metabolism. For example,amino acids form intermediates for the major catabolicpathways such as acetyl CoA, pyruvate and 2-oxogluta-rate [28]. Therefore, the wort’s amino acid content andutilization in combination with the wort’s sugar com-position used is of great importance since it will havesignificant impact, not only on the brewer ’s yeastmetabolism, but also on the flavour profile of the finalbeer. This study is also an illustration how combina-tion of transcriptome and metabolome analyses can beused for “system-wide” analysis in industrial yeast fer-mentations for better understanding of the complexsecondary metabolism and the types of regulation(hierarchical and/or metabolic) as a result of givenenvironmental change.
Additional material
Additional file 1: Overview of the brewer’s yeast metabolic networkincluding the significantly changed genes based on the effect ofsugar syrup addition. The figure presents parts of the brewer’s yeastmetabolism where sugar syrup supplementation resulted in mostsignificant transcriptional changes based on the Two Way ANOVAanalysis.
Additional file 2: GO annotation based on the biological processontology for the significantly changed genes in glucose versusmaltose syrup supplemented fermentations regardless of theFlavourzyme addition. Table S1 contains the most overrepresentedcategories, from the GO annotation based on the biological processontology, including the significantly changed up- and down-regulatedgenes for the glucose versus maltose syrup supplemented fermentationsregardless of the Flavourzyme addition.
Additional file 3: GO annotation based on the biological processontology for the significantly changed genes from the comparisonof enzyme (Flavourzyme) supplemented versus non-enzyme
(control) fermentations, regardless of the type of sugar syrup usedas adjunct. Table S2 includes the most overrepresented categories fromthe GO annotation (based on the biological process ontology) for thesignificantly changed up- and down-regulated genes for theFlavourzyme supplemented versus non supplemented fermentations,regardless of the type of sugar syrup used as adjunct.
Additional file 4: Overview of the brewer’s yeast metabolic networkincluding the significantly changed genes based on the effect ofenzyme addition. The figure presents a schematic overview of thebrewer’s yeast metabolism where protease supplementation resulted inmost significant transcriptional changes based on Two Way ANOVAanalysis.
Additional file 5: GO annotation based on the biological processontology for the significantly changed genes in maltose syrupsupplemented fermentations with Flavourzyme addition. Table S3presents the overrepresented GO annotation categories, based on thebiological process ontology, for the significantly changed up- and down-regulated genes in maltose syrup supplemented fermentations withFlavourzyme addition.
Additional file 6: Overview of the brewer’s yeast amino acidmetabolism (based on the genome scale metabolic model of S.cerevisiae iIN800) including the significantly changed genes of theinteraction effect on enzyme and sugar syrup addition. The figurepresents a close-up look of the brewer’s yeast amino acid metabolismwhere the interaction effect of enzyme and sugar syrup addition resultsin most significant transcriptional changes.
Additional file 7: Overview of the brewer’s yeast metabolic networkincluding the significantly changed genes from the interactioneffect of protease supplementation and sugar syrup addition. Thefigure presents a schematic overview of the brewer’s yeast metabolismwhere the interaction effect of enzyme and sugar syrup addition resultsin most significant transcriptional changes.
AcknowledgementsThe authors would like to thank Pia Friis, Lene Christiansen and TinaJohansen at the Technical University of Denmark for the provided technicalassistance. In addition, we would like to thank the Technical University ofDenmark, Brewing and Alcoholic Beverage Department Novozymes A/S,Denmark and Food Denmark Research School for providing financialsupport to MPP.
Author details1Center for Microbial Biotechnology, Department of Systems Biology,Technical University of Denmark, DK-2800 Kongens Lyngby, Denmark.2Center for Biological Sequence Analysis, Department of Systems Biology,Technical University of Denmark, DK-2800 Kongens Lyngby, Denmark.3Chalmers University of Technology, Department of Chemical and BiologicalEngineering, SE-412 96 Gothenburg, Sweden. 4Brewing and AlcoholicBeverage Department, Novozymes A/S, Denmark. 5Center for SystemsBiology, Soochow University, Suzhou 215006, China.
Authors’ contributionsMPP- carried out most of the experimental work, data interpretation anddrafted the manuscript; AF - performed analysis of the transcriptome data;WV- performed analysis of the transcriptome data and draw the metabolicmaps; MLW - carried out part of the fermentation studies, transcriptome andmetabolome sampling; HPHH- participated in the discussion of the data andmanuscript correction; CW- manuscript correction; JN- discussion of the dataand manuscript correction; LO- discussion and interprepation of the data,manuscript correction and edited the manuscript. All authors read andapproved the final manuscript.
Declaration of competing interestsThe authors declare that they have no competing interests.
Received: 27 September 2010 Accepted: 23 April 2011Published: 23 April 2011
Piddocke et al. Microbial Cell Factories 2011, 10:27http://www.microbialcellfactories.com/content/10/1/27
Page 13 of 14

References1. O’Connor-Cox E, Paik J, Ingledew W: Improved ethanol yields through
supplementation with excess assimilable nitrogen. J Ind Microbiol 1991,8:45-52.
2. Boulton C, Quain D: Brewing Yeast and Fermentation Oxford: BlackwellScience Ltd; 2006.
3. Piddocke MP: The effect of high gravity on brewer’s yeast metabolism-physiological studies and “-omics” analyses. PhD thesis TechnicalUniversity of Denmark, Department of Systems Biology; 2009.
4. Novozymes A/S. [http://www.novozymes.com/en/solutions/food-and-beverages/Pages/default.aspx].
5. Devantier R: Saccharomyces cerevisiae in very high gravity ethanolfermentations using simultaneous saccharification and fermentation.PhD thesis Technical University of Denmark, BioCentrum; 2005.
6. Briggs D, Boulton C, Brookes P, Stevens R: Brewing Science and PracticeCambridge: Woodhead Publishing Ltd; 2004.
7. Piddocke MP, Kreisz S, Heldt-Hansen HP, Nielsen KF, Olsson L: Physiologicalcharacterisation of brewer’s yeast in high gravity beer fermentationswith glucose or maltose syrups as adjuncts. Appl Microbiol Biotechol 2009,84:453-464.
8. European Brewery Convention: Analytica-EBC Fachverlag Hans Carl,Nürnberg; 1998.
9. Villas-Bôas SG: Mass spectrometry in metabolome analysis. Mass SpectrRev 2005, 24:613-646.
10. Villas-Bôas SG, Delicado DG, Akesson M, Nielsen J: Simultaneous analysis ofamino and nonamino organic acids as methyl chloroformate derivativesusing gas chromatography-mass spectrometry. Anal Biochem 2003,322:134-138.
11. Villas-Bôas SG, Moxley J, Akesson M, Stephanopoulos G, Nielsen J: High-throughput metabolic state analysis: the missing link in integratedfunctional genomics of yeasts. Biochem J 2005, 388:669-677.
12. Panagiotou G, Kouskoumvekaki I, Jónsdóttir SO, Olsson L: Monitoring novelmetabolic pathways using metabolomics and machine learning:induction of phosphoketolase pathway in Aspergillus nidulanscultivations. Metabolomics 2007, 3:503-516.
13. Affymetrix&GeneChip: Affymetrix GeneChip Expression Analysis TechnicalManual Santa Clara, CA; 2007, revision 2.
14. Gentleman RC, Carey VJ, Bates DM, Bolstad B, Dettling M, Dudoit S, Ellis B,Gautier L, Ge Y, Gentry J, et al: Bioconductor: open software developmentfor computational biology and bioinformatics. Genome Biol 2004, 5:R80.
15. Irizarry RA, Bolstad BM, Collin F, Cope LM, Hobbs B, Speed TP: Summariesof Affymetrix GeneChip probe level data. Nucleic Acids Res 2003, 31(4):e15.
16. Gautier L, Cope L, Bolstad BM, Irizarry RA: Affy–analysis of AffymetrixGeneChip data at the probe level. Bioinformatics 2004, 20:307-315.
17. Workman C, Jensen LJ, Jarmer H, Berka R, Gautier L, Nielsen HB, Saxild HH,Nielsen C, Brunak S, Knudsen S: A new non-linear normalization methodfor reducing variability in DNA microarray experiments. Genome Biol2002, 3, research0048.1-0048.16.
18. Benjamini Y, Hochberg Y: Controlling the False Discovery Rate: a practicaland powerful approach to multiple testing. J R Statist Soc B 1995,57:289-300.
19. Pavlidis P: Using ANOVA for gene selection from microarray studies ofthe nervous system. Methods 2003, 31:282-289.
20. Gene Expression Omnibus. [http://www.ncbi.nlm.nih.gov/geo/], (CEO)database.
21. Oliveira AP, Patil KR, Nielsen J: Architecture of transcriptional regulatorycircuit is knitted over the topology of bio-molecular interactionnetworks. BMC Syst Biol 2008, 2:17.
22. Gibson BR, Lawrence SJ, Leclaire JPR, Powell CD, Smart KA: Yeast responsesto stresses associated with industrial brewery handling. FEMS MicrobiolRev 2007, 31:535-569.
23. Förster J, Famili I, Fu P, Palsson BØ, Nielsen J: Genome-scale reconstructionof the Saccharomyces cerevisiae metabolic network. Genome Res 2003,13:244-253.
24. Nookaew I, Jewett MC, Meechai A, Thammarongtham C, Laoteng K,Cheevadhanarak S, Nielsen J, Bhumiratana S: The genome scale metabolicmodel iIN800 and its validation. BMC Systems Biology 2008, 2:71.
25. Jones M, Pragnell MG, Pierce JS: Absorption of amino acids by yeast froma semidefinied medium simulating wort. J Inst Brew 1970, 75:520-536.
26. Gancedo JM: Yeast carbon catabolite repression. Mol Biol Rev 1998,62:334-361.
27. Gash AP, Werner-Washburne M: The genomics of yeast responses toenvironmental stress and starvation. Func Integr Genomics 2002, 2:181-192.
28. Peter GJ, Dűring L, Ahmed A: Carbon catabolite repression regulatesamino acid permeases in Saccharomyces cerevisiae via the TOR signalingpathway. J Biol Chem 2006, 281:5546-5552.
29. Cakir T, Patil KR, Önsan ZÍ, Ülgen KÖ, Kildar B, Nielsen J: Integration ofmetabolome data with metabolic networks reveals reporter reactions.Mol Syst Biol 2006, 2:1-11.
doi:10.1186/1475-2859-10-27Cite this article as: Piddocke et al.: Revealing the beneficial effect ofprotease supplementation to high gravity beer fermentations using“-omics” techniques. Microbial Cell Factories 2011 10:27.
Submit your next manuscript to BioMed Centraland take full advantage of:
• Convenient online submission
• Thorough peer review
• No space constraints or color figure charges
• Immediate publication on acceptance
• Inclusion in PubMed, CAS, Scopus and Google Scholar
• Research which is freely available for redistribution
Submit your manuscript at www.biomedcentral.com/submit
Piddocke et al. Microbial Cell Factories 2011, 10:27http://www.microbialcellfactories.com/content/10/1/27
Page 14 of 14