revealing travel patterns and city structure with taxi
TRANSCRIPT

1
Revealing travel patterns and city structure with taxi trip data
Xi Liua,b, Li Gong a,b, Yongxi Gong c, Yu Liu a,b* a Institute of Remote Sensing and Geographical Information Systems, Peking University, Beijing
100871, PR China b Beijing Key Lab of Spatial Information Integration and Its Applications, Peking University, Beijing
100871, PR China c Shenzhen Key Laboratory of Urban Planning and Decision Making, Harbin Institute of
Technology Shenzhen Graduate School, Shenzhen 518055, PR China
Abstract: Delineating travel patterns and city structure has long been a core research topic in
transport geography. Different from the physical structure, the city structure beneath the
complex travel-flow system shows the inherent connection patterns within the city. On the basis
of massive taxi trip data of Shanghai, we built spatially-embedded networks to model the
intra-city spatial interactions and introduced network science methods into the issue. The
community detection method is applied to reveal sub-regional structures, and several network
measures are used to examine the properties of sub-regions. Considering the differences
between long- and short-distance trips, we reveal a two-level hierarchical polycentric city
structure of Shanghai. Further explorations on sub-network structures demonstrate that urban
sub-regions have broader internal spatial interactions, while suburban centers are more
influential in local traffic. By incorporating the land use of centers from the travel pattern
perspective, we investigate sub-region formation and center–local places interaction patterns.
This study provides insights into using emerging data sources to reveal travel patterns and city
structures, which could potentially aid in applying urban and transportation policies. The
sub-regional structures revealed in this study are more easily interpreted for
transportation-related issues than other structures, such as administrative divisions.
Keywords: GPS-enabled taxi data; travel pattern; urban structure; spatially-embedded network;
community detection
1. Introduction
The structures of cities are closely related to the intra-city travel patterns of their residents. The
allocation of resources within a city generates travel demands and drives people to travel, while
the travel flows inversely indicate the need for modification of current living habitats and
construction of new transport facilities. On the basis of approaches such as field surveying,
remote sensing, and policy consulting, urban forms are more accessible than travel data. Thus,
compared with the impacts of travel behaviors on city structure, more studies focus on the
impacts of city structure on travel behaviors, which has drawn the attention of geographers since
the 1970s (Yue et al., 2014). Researchers have investigated the influence of urban form from
different aspects, such as the mixture of land uses and settlement sizes (Stead and Marshall,
2001; Song et al., 2014), and have tried to evaluate urban policies through travel behaviors of
residents (Schwanen et al., 2004; Lowry and Lowry, 2014). Handy (1996) categorized the
methodologies of these studies into five categories: simulation studies, aggregated analyses,
disaggregated analyses, choice model, and activity-based analyses. Among them, aggregated

2
analyses focus on the aggregated-level characteristics of individual travel behaviors, which are
referred to as travel patterns.
Although urban forms can be relatively easily measured, we should nevertheless interpret the
cities beyond the spatial distributions of their physical environments and economical resources.
The underlying structure of a city, such as which regions have more internal spatial interactions
and how the city centers interact with their vicinities, illustrates the method for cities to function
as dynamic systems rather than as static artifacts. The ties that connect the discrete physical
resources of a city into an integrated system are flows of people and freight, and the flows
represent the spatial interaction strengths between places. Studies have been conducted to
reveal the underlying city structure via flow systems since the 1960s, when Berry (1966) explored
the spatial structure beneath the complex flow systems. Because of the limitations of data
sources, analytic tools, and computation capabilities (Yue et al., 2014), these studies had limited
development and most studies relating to city structures still focused on urban morphology.
Travel behavior studies experienced a low period during the 1990s (Timmermans et al., 2002) for
the same reason.
Technological achievements in recent years have once again brought travel patterns and urban
structure to the forefront of transport geography research. Big geospatial data, which are
collected from sources such as mobile phone records, social media check-ins, and taxi trajectories,
provide abundant locations to model movement of people around cities. Compared with
traditional travel survey data, big data are more accurate, objective, plentiful, cost-effective, and
accessible, and they provide opportunities to better describe people’s movements (Lu and Liu,
2012). Big data have also drawn the attention of statistical physicists (Brockmann et al., 2006;
Gonzalez et al., 2008; Schneider et al., 2013; Song et al., 2010) and computer scientists (Cho et al.,
2011) to provide novel ideas on issues related to human mobility and city structure. The massive
travel flows enable us to model an entire city into a spatially-embedded flow network (Batty,
2013). Armed with recently-developed network analytic methods, we are able to explore the
sub-regional structures of cities and the patterns of people traveling within those sub-regions.
Community detection has been developed to find sub-structures of networks, and it divides a
network into sub-networks that have stronger connections within themselves than with others.
In terms of flow networks, sub-networks represent sub-regions that have strong internal spatial
interactions. Many researchers have applied community detection and other network science
methods on a national scale trying to determine whether existing administrative boundaries are
still reasonable (Ratti et al., 2010; Thiemann et al., 2010; Liu et al., 2014), exploring the relations
between commuting properties and socio-demographic variables (De Montis et al., 2007),
comparing human spatial interactions within different countries to find common patterns
(Sobolevsky et al., 2013), and providing suggestions for regional partitions (De Montis et al.,
2013).
While large volumes of movements can be extracted from big geospatial data, most city-level
studies still treat the origination and the end of a trip as two unrelated activities attempting to,
for example, depict the city structure from the land use perspective (Guo et al., 2012; Liu et al.,
2012b; Toole et al., 2012; Reades et al., 2009). With regard to studies that systematically view

3
intra-city flows, Tanahashi et al. (2012) applied graph-partitioning methods to the human
mobility network extracted from phone records in New York City, focusing on human travel
patterns between the partitioned sub-regions instead of revealing regional structures. Roth et al.
(2011) utilized individual travel information of the London Underground to explore the
polycentric city structure, but the subway travels were constrained by linear routes, and thus, the
results are unable to fully reflect the urban dynamics.
We apply taxi trip data, which have been widely used to investigate city structure since the 1970s
(Goddard, 1970), to implement our method. The recent availability of large volumes of taxi
Global Positioning System (GPS) trajectories has strongly promoted related studies, including
transportation analysis (Fang et al., 2012; Gao et al., 2013; Li et al., 2011), urban planning (Veloso
et al., 2011; Zheng et al., 2011), land use analysis (Kang et al., 2013; Liu et al., 2012b; Qi et al.,
2011; Yuan et al., 2012), human mobility patterns (Liang et al., 2012; Liu et al., 2012a), and spatial
model calibration (Yue et al., 2012). Although taxi trajectories are unable to reflect continuous
displacements of specific people, which are crucial for the time geography framework, they
describe collective human mobility patterns of intra-city travels with accurate positions and time
stamps. With information of when and where a customer is picked up or dropped off by a taxi,
meaningful trips corresponding to displacements between people’s consecutive activities are
easy to extract, which is a difficult and time-consuming effort to obtain from other forms of data.
Precise spatiotemporal properties of massive intra-city trips generated by taxi trajectories lay a
solid foundation to completely reflect the structure of the city.
In this study, we introduce complex network science methods to analyze GPS-enabled taxi data
collected in Shanghai, China and explore the structure of intra-city flows. To comprehensively
reveal the city structure from different levels, we pay much attention to patterns of trips for
different length. The contribution of this work is twofold. First, our knowledge of the city
structure mostly comes from urban designs and plans, which are partially arbitrary. However, this
research provides an objective bottom-up view to depict the structure with residents’ travel
flows. It extends the exploration of complex city flow networks with new data and methods and
demonstrates the cities’ function in reality. Second, with taxi data acting as an observatory to
intra-urban flows, the city structure revealed in this study has strong connections with
transportation applications. Further explorations of different flow structures in urban and
suburban sub-regions provide new insights for traffic optimization and city management. The rest
of the paper is organized as follows: Section 2 describes the study area and the preparation of
data; Section 3 introduces the community detection method, reveals the hierarchical polycentric
city structure, and explores the land use of the centers; and discussion and conclusions, along
with suggestions for policy-making, are stated in Section 4.

4
2. Study area and data preparation
2.1 Shanghai districts
As the economic center of China, Shanghai (Fig. 1) is an international-level metropolis, with a
land area of more than 6,000 km2. It comprises 16 districts and 1 county since 2012. The eight
districts in Puxi, along with the Lujiazui area in Pudong, are the core urban areas of Shanghai
(shown in the rectangle in Fig. 1). Pudong District is separated from the western part of Shanghai,
the older urban area, by the Huangpu River and has experienced rapid development in recent
decades. Shanghai has two airports, viz., the Shanghai Pudong International Airport and the
Shanghai Hongqiao International Airport. Shanghai Railway Station and Shanghai South Railway
Station were two major railway hubs in 2009. The study area covers all the Shanghai districts
except for Chongming County.
The public transit system, including buses, subways, taxis, and ferries, serves a large part of
intra-city travels in China. In 2010, the public transport system catered to 34% travels in Shanghai
and 47% travels in the core urban area, with taxis producing 19.3% of the intra-urban trips by
public transportation1. Thus, taxis form an important supplement to buses and metros in
Shanghai. Traveling by taxi offers flexible routes and is more time-efficient than other modes of
transportation. In China, taxi trajectories provide a reasonable data source for urban studies,
given their capacity to capture a large proportion of urban passenger flows.
1 http://www.shanghai.gov.cn/shanghai/node2314/node25307/node25455/node25459/u21ai605264.html, in Chinese.
5
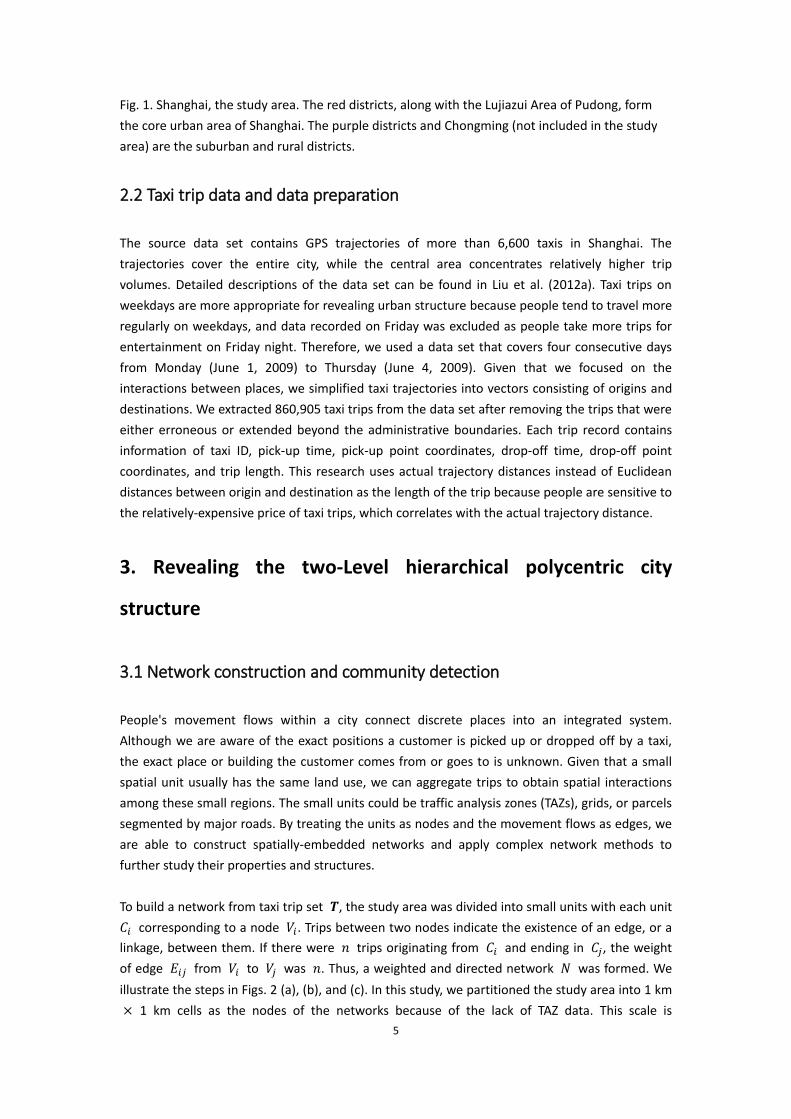
Fig. 1. Shanghai, the study area. The red districts, along with the Lujiazui Area of Pudong, form
the core urban area of Shanghai. The purple districts and Chongming (not included in the study
area) are the suburban and rural districts.
2.2 Taxi trip data and data preparation
The source data set contains GPS trajectories of more than 6,600 taxis in Shanghai. The
trajectories cover the entire city, while the central area concentrates relatively higher trip
volumes. Detailed descriptions of the data set can be found in Liu et al. (2012a). Taxi trips on
weekdays are more appropriate for revealing urban structure because people tend to travel more
regularly on weekdays, and data recorded on Friday was excluded as people take more trips for
entertainment on Friday night. Therefore, we used a data set that covers four consecutive days
from Monday (June 1, 2009) to Thursday (June 4, 2009). Given that we focused on the
interactions between places, we simplified taxi trajectories into vectors consisting of origins and
destinations. We extracted 860,905 taxi trips from the data set after removing the trips that were
either erroneous or extended beyond the administrative boundaries. Each trip record contains
information of taxi ID, pick-up time, pick-up point coordinates, drop-off time, drop-off point
coordinates, and trip length. This research uses actual trajectory distances instead of Euclidean
distances between origin and destination as the length of the trip because people are sensitive to
the relatively-expensive price of taxi trips, which correlates with the actual trajectory distance.
3. Revealing the two-Level hierarchical polycentric city
structure
3.1 Network construction and community detection
People's movement flows within a city connect discrete places into an integrated system.
Although we are aware of the exact positions a customer is picked up or dropped off by a taxi,
the exact place or building the customer comes from or goes to is unknown. Given that a small
spatial unit usually has the same land use, we can aggregate trips to obtain spatial interactions
among these small regions. The small units could be traffic analysis zones (TAZs), grids, or parcels
segmented by major roads. By treating the units as nodes and the movement flows as edges, we
are able to construct spatially-embedded networks and apply complex network methods to
further study their properties and structures.
To build a network from taxi trip set 𝑻, the study area was divided into small units with each unit
𝐶𝑖 corresponding to a node 𝑉𝑖. Trips between two nodes indicate the existence of an edge, or a
linkage, between them. If there were 𝑛 trips originating from 𝐶𝑖 and ending in 𝐶𝑗, the weight
of edge 𝐸𝑖𝑗 from 𝑉𝑖 to 𝑉𝑗 was 𝑛. Thus, a weighted and directed network 𝑁 was formed. We
illustrate the steps in Figs. 2 (a), (b), and (c). In this study, we partitioned the study area into 1 km
× 1 km cells as the nodes of the networks because of the lack of TAZ data. This scale is

6
determined on the basis of relevant studies (Liu et al., 2012b) that suggest that the cell size is
detailed enough to depict the urban structure. Additionally, the cells have a size similar to TAZs,
acting as appropriate substitutions to represent relatively uniform socio-economic
characteristics.
Fig. 2. To construct a network from taxi trips, the study area was divided into small regions (a)
with each small region corresponding to a node in the network. A directed edge or linkage
existed between two nodes if there were taxi trips from one node to the other. The weight of an
edge equals the taxi trips it represents (b, c), and the properties of the network thus reflected the
structure of the city and the spatial interactions among the small regions. (d) provides an
illustration of the communities detected from a network, which was divided into four parts
(depicted by four circles) in which the sub-networks had relatively dense connections. The
community detection result corresponds to closely connected sub-regions (e).
In a network, some nodes indicate much stronger connections among them than with other
nodes. By dividing the taxi trip network into densely-connected sub-networks, we were able to
divide the city into intensely-interactive sub-regions. In network science, community detection
methods are able to partition an entire network into tightly connected sub-networks (Fig. 2 (d)),
called communities, and reveal the network’s clustering characteristics (Girvan and Newman,
2002). Community detection can be implemented using many algorithms, among which the
Infomap algorithm is able to handle the weighted and directed networks and performs stably and
quickly (Fortunato, 2010). It applies a two-level description of a random walk on a network and
aims to minimize the expected description length, or “code length,” of the random walk. The
optimized two-level description corresponds to the community structure of the network. For
detailed information of the Infomap algorithm, please refer to Rosvall and Bergstrom (2008). We
adopted the Infomap toolkit provided in igraph R package (Csárdi and Nepusz 2006) for this

7
study.
3.2 Two-level hierarchical city structure
We first constructed a network 𝑁𝑎𝑙𝑙 comprising all of the taxi trips in the data set. The
community detection result of 𝑁𝑎𝑙𝑙 (Fig. 3) mainly consists of large, spatially continuous regions
indicating the influence of the distance decay effect on spatial interactions. Some single cells in
suburban areas also belong to the large urban communities because of some infrequent
long-distance travels between the cell and the urban area. Small communities primarily exist in
suburban and rural areas because of low taxi trip volume. In Fig. 3, communities with less than 10
cells are not displayed.
Fig. 3. Community detection result of the network constructed by all taxi trips. Cells in the same
color are of the same community.
As shown in Fig. 3, communities in urban areas are large and detailed structures might be
concealed. To detect detailed structural information, we paid more attention to short trips for the
following three aspects. First, short trips link local places and may help find smaller zones. Second,
short and long intra-city travels often have different purposes and travel patterns, especially in a
large city such as Shanghai. Third, a majority of taxi trips are short (half of the trips are shorter
than 4.72 km and three quarters of the trips are shorter than 8.32 km). They represent the spatial
interactions between close places and can, thus, depict the city structure on a more detailed
scale. The different patterns between short- and long-distance trips could be confirmed by some
simple analyses. For example, splitting all trips into two sub-sets by the median length (4.72 km)
and naming them the short-trip set 𝑻𝒔 and the long-trip set 𝑻𝒍 results in their volumes
displaying different temporal distributions (Fig. 4). Short trips reach a higher volume peak at
approximately 2 p.m., while long trips have larger volume at night. The spatial distributions of the
sum of pick-up points and drop-off points in 𝑻𝒔 and 𝑻𝒍 (Fig. 5) are also different. More trips in
𝑻𝒍 originate or end in regions containing railway stations and airports.

8
Fig. 4. Temporal pick-up point volumes (a) and temporal drop-off point volumes (b) of short- and
long-distance trips. The curves of short and long trips peak at different times.
Fig. 5. Spatial distributions of the sum of pick-up points and drop-off points. Hot spots of short
trips (a) concentrate in urban areas, whereas hot spots of long trips (b) also include airports and
railway stations.
Network statistics could also distinguish the patterns of short and long trips. We constructed
networks 𝑁𝑠 and 𝑁𝑙 from trips in 𝑻𝒔 and 𝑻𝒍. The two networks contain approximately the
same number of trips; however, 𝑁𝑙 includes more nodes and less average edge weight. Most of
the long-trip network edges (78%) are aggregated by three trips or less, which are, in general, ad
hoc and imply greater randomness than short trips. Reasonably, long trips connect places that
are far from each other, leading to large sub-regions in the community detection result. Short
trips are more spatially stable, suggesting that a more meaningful structure can be identified
from 𝑁𝑠.
Table 1 Basic statistics of networks constructed from short and long trips
Trip number Nodes Edges Average edge weight Proportions of edges with
weight equal or less than 3
Short 430,453 2,066 29,277 14.70 0.47
Long 430,452 2,816 137,490 3.13 0.78

9
To reveal the underlying city structure, we first detected clustered sub-networks from the
network constructed by short-distance trips, finding a basic structure, and then gradually added
long-distance trips into the network, exploring how these long distance interactions influence the
city structure. We use 𝑻𝒊 to represent the trip data set containing all trips shorter than 𝑖 km,
and 𝑁𝑖 is the network constructed from 𝑻𝒊. We started by applying the community detection
method to 𝑁2 because traveling by taxi in Shanghai is rarely less than 1 km (1.6% of total taxi
trips). Then, we detected sub-regional structures on 𝑁3, 𝑁4, 𝑁5, ..., and finally 𝑁𝑎𝑙𝑙.
The gradually changing results of sub-regional city structures are rather interesting (Fig. 6). They
clearly depict a two-level hierarchical structure. The result of 𝑁2 consists of small, spatially
consecutive regions. When adding longer trips into the network, the small regions start to grow
larger and merge with adjacent sub-regions, as illustrated by the results of 𝑁3 and 𝑁4. However,
the results of 𝑁4, 𝑁5 and 𝑁6 are very similar, with few sub-regions expanding or merging. This
steady state shows the relatively regular spatial structure of short trips and may result from the
concentrations of local travels. The steady state, however, begins to change when longer trips are
added, but the sub-regions in the community detection results of 𝑁7, 𝑁8, ..., and 𝑁𝑎𝑙𝑙 are
merged by the steady state communities almost without boundary changes, especially in urban
areas where trips are abundant. This pattern implies that short trips dominate local spatial
interactions, whereas long trips play the role of connecting these local clusters instead of
following the same pattern of short trips and maintaining the augmenting process of sub-regions.
The low trip volumes in some suburban or rural areas make it difficult to maintain local
interaction structures when longer trips are added, leading to some small changes of sub-region
boundaries. Note that suburban and rural communities containing less than 10 cells because of
low trip volumes have been omitted in the visualizations.

10
Fig. 6. The community detection results of 𝑁2 (a), 𝑁4 (b), 𝑁5 (c), 𝑁6 (d), 𝑁12 (e) and 𝑁𝑎𝑙𝑙
(f). The boundaries of 𝑁5 are also depicted in other figures.
Finally, a two-level hierarchical city structure was revealed from the aspect of intra-city
interactions. The first-level sub-regions show a steady structure dominated by short-distance
spatial interactions, which strongly relate to the travel demand of local residents and their
periodic mobility routines. We named these basic sub-regions Level One Zones (L1Z). The
community detection result of 𝑁5 is used to represent the L1Zs because the result of 𝑁4 still
grows a little compared with the result of 𝑁5, while a few rural L1Zs start to merge in the result
of 𝑁6. The second-level sub-regions illustrate the interaction patterns reflected by all the taxi
trips, and we named these regions Level Two Zones (L2Z). We use the community detection
result of 𝑁𝑎𝑙𝑙 to illustrate the L2Zs. The hierarchical sub-regional structure provides insights into
how the city could be properly divided into closely related sub-regions on the basis of intra-city
travels.
The most common way people interpret the sub-regional structure of a city is to refer to its
administrative divisions (Ratti et al., 2010; De Montis et al., 2013), but with the exception of the
boundary of the Huangpu River between Pudong and the core urban districts in Puxi, most L1Z
(Fig. 7 (a)) and L2Z (Fig.4) boundaries are not consistent with district-level administrative
boundaries. However, the mismatch between boundaries is reasonable. First, the district
boundaries have been arbitrarily determined in a top-down fashion, aiming at facilitating
administration rather than considering human mobility. Second, advanced transport facilities, low
travel costs, and diverse travel needs result in stronger dynamics in urban areas, which
undermine the influence of administrative boundaries on people’s travel behaviors. In the rural
and suburban districts, where human dynamics are less intensified than the core urban districts,
most of the L1Z boundaries are consistent with town/subdistrict2 boundaries (Fig. 7 (b)), a
sub-level administrative division of district in Shanghai. This is a very interesting finding,
suggesting that administrative hierarchy shapes intra-urban movements, especially in less
developed areas. Such a phenomenon may be traced back to the urban planning a few decades
ago, when administrative units played an important role in China’s management system. It also
demonstrates the reasonableness of the revealed structure.
Therefore, by emphasizing the different semantics behind travels of different lengths, we
unveiled the hierarchical structure buried in taxi trip data. The matching boundaries of L1Zs and
L2Zs also inversely indicate the different travel patterns considering travel length and their
influence on city structure. Compared with administrative boundaries, the hierarchical structure
extracted from massive intra-city travel data provides a bottom-up view of our living habitat,
throwing light on transportation-related issues. To aid in urban and transportation planning, the
underlying mechanism of the structure formation should be explored.
2 Jiedao in Chinese, detailed information can be found in http://en.wikipedia.org/wiki/Subdistricts_of_the_ People's_Republic_of_China

11
Fig. 7. Comparison of L1Zs and administrative boundaries of Shanghai at the district level (a) and
the town level (b). Towns and subdistricts are the sub-level administrative divisions of the
districts in Shanghai. Note that the eight core-urban districts are still represented at the district
level in (b). The boundaries of many suburban and rural L1Zs are consistent with some
town/subdistrict boundaries.
3.3 Properties and centers of sub-regions
To explore the two-level sub-regional structure formation, we investigated the sub-networks
corresponding to those sub-regions. The sub-networks also depict people’s travel patterns in
sub-regions. For the first-level sub-regions, 15 L1Zs containing more than 1,000 taxi trips each
were selected for further study (Fig. 8 (a)) because too few taxi trips may not guarantee steady
structures. These 15 L1Zs cover the core urban area of Shanghai and some suburban sections
where traffic problems, such as congestion, are prone to exist. The 15 L1Zs are numbered in
descending order according to their internal trip amounts. L1Z 1 lies in the center of Shanghai
and contains the largest number of taxi trips. L1Zs from 1 to 7 lie in the urban area, while L1Zs
from 8 to 15 lie in suburbs. Urban L1Zs generally contain more trips than suburban trips (Fig. 9
(a)). Moreover, the central urban, urban, and suburban L1Zs lie in a relatively concentric order
(the separation of the eastern part and the central area by the Huangpu river caused some
modification), which is similar to the Burgess concentric model (Burgess, 1925). For the
second-level sub-regions, four L2Zs (Fig. 8 (b)) merged by more than one L1Zs were selected.
They are L2Z I, consisting of L1Zs 1, 3, 6, and 7; L2Z II, containing L1Zs 5, 8, 9, and 11; L2Z III,
covering L1Zs 4, 10, and 14; and L2Z IV, including L1Zs 12 and 15. Note that L1Zs 2 and 13 remain
unmerged at the second level. This may be attributed to the well-developed facilities for daily
needs in L1Z 2 and the function as a free trade zone of L1Z 13. To construct sub-networks
corresponding to the 15 L1Zs, we used all the internal taxi trips in each L1Z. For the L2Zs, we used
internal trips of each L2Z with travel length longer than 6 km, which contribute mostly for
merging the L1Zs to form L2Zs.
12
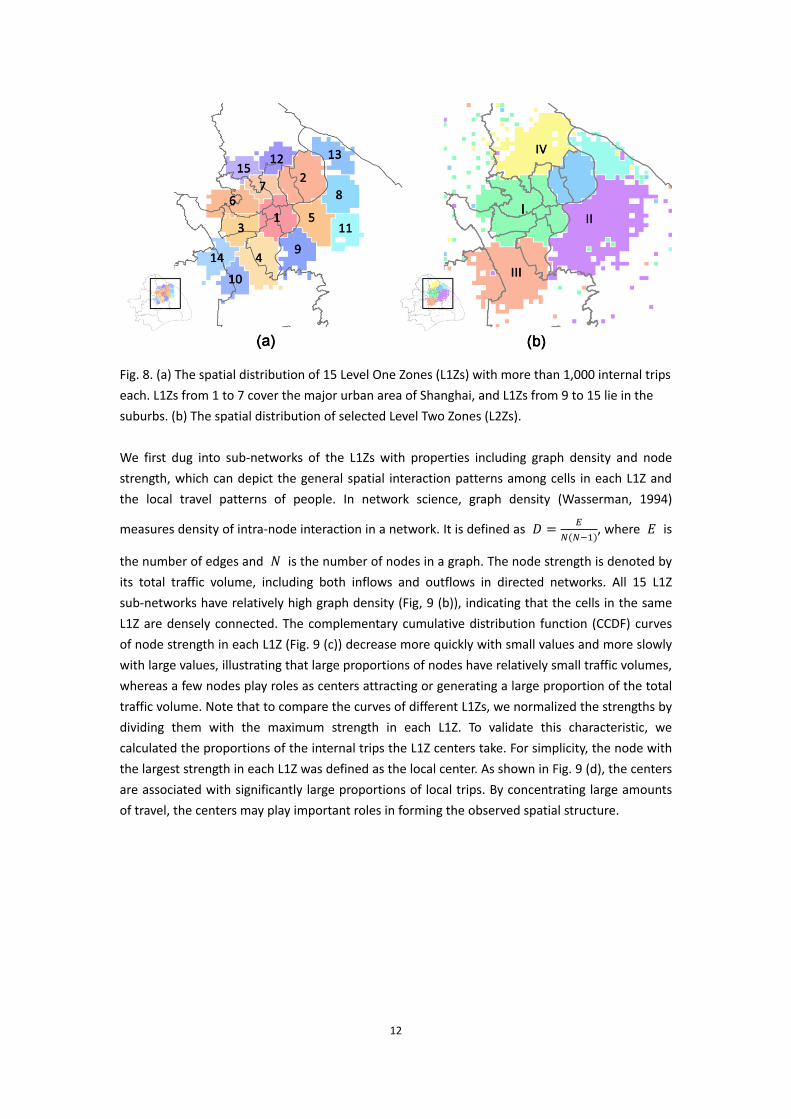
Fig. 8. (a) The spatial distribution of 15 Level One Zones (L1Zs) with more than 1,000 internal trips
each. L1Zs from 1 to 7 cover the major urban area of Shanghai, and L1Zs from 9 to 15 lie in the
suburbs. (b) The spatial distribution of selected Level Two Zones (L2Zs).
We first dug into sub-networks of the L1Zs with properties including graph density and node
strength, which can depict the general spatial interaction patterns among cells in each L1Z and
the local travel patterns of people. In network science, graph density (Wasserman, 1994)
measures density of intra-node interaction in a network. It is defined as 𝐷 =𝐸
𝑁(𝑁−1), where 𝐸 is
the number of edges and 𝑁 is the number of nodes in a graph. The node strength is denoted by
its total traffic volume, including both inflows and outflows in directed networks. All 15 L1Z
sub-networks have relatively high graph density (Fig, 9 (b)), indicating that the cells in the same
L1Z are densely connected. The complementary cumulative distribution function (CCDF) curves
of node strength in each L1Z (Fig. 9 (c)) decrease more quickly with small values and more slowly
with large values, illustrating that large proportions of nodes have relatively small traffic volumes,
whereas a few nodes play roles as centers attracting or generating a large proportion of the total
traffic volume. Note that to compare the curves of different L1Zs, we normalized the strengths by
dividing them with the maximum strength in each L1Z. To validate this characteristic, we
calculated the proportions of the internal trips the L1Z centers take. For simplicity, the node with
the largest strength in each L1Z was defined as the local center. As shown in Fig. 9 (d), the centers
are associated with significantly large proportions of local trips. By concentrating large amounts
of travel, the centers may play important roles in forming the observed spatial structure.

13
Fig. 9 (a) Total trip numbers in each L1Z. (b) Graph density of each L1Z sub-network. (c)
Complementary cumulative distribution function (CCDF) curves of normalized strength in each
L1Z. (d) The proportion of total internal traffic amount the centers take in each BTZ. (e) The
values of 𝑘𝐵 in each L1Z. (f) The values of 𝑘𝐶 in each L1Z. The comparisons between average
values of urban and suburban L1Zs demonstrate that urban L1Zs have broader interactions, while
suburban L1Z centers are more influential in local traffic.
High node strength does not guarantee that these centers are also centers in the aspect of
sub-network structure. Thus, we applied two additional node centrality properties: betweenness
centrality, which measures the importance of a node in organizing flows in the network, and
closeness centrality, which measures the average shortest distance between the node and all the
other nodes in the network. We applied the normalized properties in this study. Normalized
betweenness centrality is defined as 𝐶𝐵(𝑖) =1
(𝑁−1)(𝑁−2)∑
𝜎𝑠𝑡(𝑖)
𝜎𝑠𝑡𝑠≠𝑡 , where 𝑁 is the total
number of nodes, 𝜎𝑠𝑡(𝑖) is the number of shortest paths going from node s to node t through
node i, and 𝜎𝑠𝑡 is the number of all of the shortest paths going from node s to node t (Freeman,
1977). Normalized closeness centrality is defined as 𝐶𝐶(𝑖) = 𝑁−1
∑ 𝑑𝑖𝑗𝑖≠𝑗, where 𝑑𝑖𝑗 is the length of
the shortest path between node 𝑖 and 𝑗 (Freeman, 1979). We explored how betweenness and
closeness centralities change as the node strength 𝑠𝑡𝑟(𝑖) increases. Node strengths in each L1Z
are scaled to the range of 0 to 1 for comparison. Results show that the 15 L1Zs share common
characteristics: betweenness centrality increases linearly with strength as 𝐶𝐵(𝑖) = 𝑘𝐵𝑠𝑡𝑟(𝑖) +
𝑏𝐵 with significant levels of 0.01, and closeness centrality increases linearly with logarithm
strength as 𝐶𝐶(𝑖) = 𝑘𝐶log (𝑠𝑡𝑟(𝑖)) + 𝑏𝐶 with significant levels of 0.001. The increases illustrate
that the volume centers are also structure centers, which play decisive roles in organizing local
taxi flows. Although residents take taxis directly from origins to destinations instead of

14
transferring in the centers, the increase of betweenness centrality still demonstrates that many
low-degree nodes do not have direct interactions between them, while high-strength nodes
connect directly to large proportions of nodes in different parts of the L1Z. The increase of
closeness centrality shows that high-strength nodes also have closer distances to all of the other
nodes in the same L1Z.
In addition to the shared characteristics, some differences exist between urban and suburban
L1Zs. Apart from the higher internal trip volumes, the urban L1Zs also have higher graph density
values, illustrating that the well-developed urban regions have broader interactions than
suburban regions. Moreover, the CCDF curves of suburban L1Zs decrease more quickly in
low-strength regions and more slowly in high-strength regions than urban L1Zs, indicating that
centers in suburban areas account for larger proportions of internal traffic volumes, which is
confirmed by the higher average proportion of internal trips taken by the suburban centers.
Additionally, the coefficients 𝑘𝐵 and 𝑘𝐶 are both larger on average in suburban L1Zs (Fig. 9 (e),
(f)), implying that betweenness and closeness centralities grow more quickly in suburban areas.
Therefore, low strength nodes have more interactions between each other in urban areas, and
centers are more influential on local traffic in suburban L1Zs. The differences may result from the
different development levels: the well-developed urban area concentrates various types of
resources, generating travels for different purposes among broader regions; land use of suburban
regions may be more homogenous, and local travels tend to be dominated by the local centers
that contain key resources for this region.
By analyzing sub-networks corresponding to L2Zs, we found that they also have center cells
containing large traffic volumes. Despite the fact that L2Zs are merged by L1Zs, only some L1Z
centers, which may have higher capacity and also dominate the long-length internal trips, are still
acting as centers in L2Zs. Some new centers, in which special functions are particularly attractive
to long-distance trips, also emerged in L2Zs. Detailed studies of sub-regions depict a hierarchical
polycentric urban structure of Shanghai from the movement flow aspect. The centers stemming
from taxi flows show their centrality mostly in the transport system. In addition to centers of
market or employment, these centers may also play important transport roles as transfer centers.
Land use indicates the demand of intra-urban travels. To interpret the formation of the
polycentric city structure and the way centers interact with local travels, we explored the land
use, or the functions in the city, of these centers. Most urban L1Z centers are important
commercial and business centers, while suburban L1Z centers favor mixed residential areas and
metro stations that are vital for local people. L2Z centers consist of both some of the L1Z centers
and important transport terminals, such as airports and train stations. Therefore, the land use of
centers illustrate the formation of such hierarchical city structure, which is somewhat consistent
with the mechanism mentioned in the Central Place Theory (Christaller, 1966), although at a
smaller scale. L1Z centers concentrate important resources for local residents and the type of
resources are different for urban and suburban L1Zs. These resources mainly serve the L1Z areas
and lead to concentration of local travels. Some of the L2Z centers are L1Z centers that contain
the most influential commercial and business resources in the city, serving large L2Z areas. Their
influences in intra-city travel decays slower than other L1Z centers. Different from the Central

15
Place Theory, some irreplaceable transportation facilities also act as L2Z centers, because of their
broad attractiveness. The nesting structure indicates the different travel frequency and travel
purposes between long and short trips. By revealing the functions of these centers, we have a
better understanding of the polycentric urban structure formation and the mechanism for these
centers to influence travel patterns in sub-regions. For detailed information about land use of
centers and their interaction with sub-regions, please refer to the appendix of the paper.
4. Discussion and conclusions
This study uses collective intra-city trips extracted from emerging taxi GPS trajectory data to
explore travel patterns and city structure. Network science methods, especially community
detection methods, are introduced to reveal the sub-regional city structure on the basis of spatial
interactions. This approach reveals the two-level hierarchical polycentric structure of Shanghai
and also sheds light on urban and transportation policy-making issues. Some limitations of taxi
data representativeness should be noted. First, taxi trips are only able to represent a part of
intra-urban travels. Some travels, such as long-distance commuting, are hardly reflected by taxi
trajectories. However, most existing data are only able to show city characteristics from a specific
perspective. Future studies could take advantage of each type of data and combine the results to
show comprehensive patterns of urban spatial interaction. In addition, the conclusions drawn
from taxi trip data could also contribute to the improvement of other transportation modes
because of their complementary relations. Second, taxi passengers are biased samples of city
population. The impact of this issue is mitigated in this study, given that we pay more attention to
the properties of L1Zs resulting from local taxi travels which are affordable for, and often
preferred by, a majority of dwellers in their daily lives. Therefore, we suggest that taxi trips
constitute a relatively stable proportion of intra-city travels with large data volume and high
precision. Taxi data are reasonable to represent intra-city spatial interactions and reveal city
structure.
This study reveals a two-level hierarchical polycentric structure of Shanghai with a view of spatial
interactions represented by taxi trips. Using network science methods to analyze spatial
interactions brings a promising approach to the study of city structure from the aspect of traffic
flows. The sub-regional structure shows how the places within a city interact and cluster. The
sub-regions, viz., the L1Zs and L2Z, could provide new opportunities to determine urban and
transportation planning boundaries and help validate existing urban management policies. Most
sub-region borders found in this study differed from Shanghai’s city district borders because
administrative boundaries have limited impacts on intra-city travels, especially in cities with high
dynamics such as Shanghai. Thus, the borders found in this study provide reasonable alternative
boundaries for urban planning because the places in the same sub-regions have more
interactions than in administrative regions. Traditional transportation planning boundaries, such
as TAZs and census blocks, are based on population. The sub-regions we found are based on
connectivity strength between small analysis units such as TAZs. The new boundaries could not
only provide insights into improving local mobility but also help eliminate unneeded TAZs to
improve computational efficiency when modeling transportation. For built facilities or functional

16
regions, the method could be used to validate whether they are serving residents as planned by
checking the sub-regions they belong to.
The hierarchical polycentric structure and the explanations of its underlying mechanisms from
the land use aspect could also contribute to transportation planning. The sub-regional borders
identify the most influential areas of local centers, and policies could be made to improve
accessibility to local centers or reduce the total amount of travel. Taxis are an important
supplement for other means of public transportation in Shanghai. Given the fixed stops of buses
and metros, taxi flows can highlight the areas where traffic demand exceeds the current service
levels. Bus route modifications and metro line extensions, especially to local centers, might meet
the traffic demands and improve accessibility. Because land use has a strong relation with the
travel behaviors of residents, travel amount could also be reduced by modifying land use of L1Zs
and their centers. For example, L1Z 11 covers a hi-tech industrial park, and the center contains an
important transfer metro station. Large amounts of local flows are generated by people who live
in places far from the industrial part and come to the station by taxi after work for cheaper
long-distance travels. Planning new residential areas in L1Z 11 could help reduce traffic flows
resulting from work–home separation. Moreover, suburban centers in residential areas that
contain transfer facilities such as metro stations may also have the potential to be developed into
sub-commercial centers. Thus, some long-distance trips could be turned into short local trips,
thereby reducing the total travel distance.
The urbanization process in China is rapid, and urban structures of world-level cities such as
Shanghai are becoming rather complex. Big data provide us with opportunities to conduct
empirical research on residents’ mobility patterns and the corresponding urban structures,
breaking ground for new theoretical studies and contributing to urban and transportation
planning. The methods provided in this study are also suitable for analysis of other cities with
similar data sources. Further studies may expand the data source to include private car, bus, and
metro trips. This combination of diverse data could describe human mobility and urban structure
in more dimensions, providing a multi-faceted picture of urban dynamics. The data source may
also be expanded on the time dimension. The availability of long-period human mobility data
would make it possible to detect the change of the urban structure and validate the effect of
policies.
Acknowledgements
This research was supported by the Natural Science Foundation of China (Grant nos. 41271386,
41371169, and 41428102). Xi Liu would like to thank Xize Wang for his helpful suggestions.
References
Batty, M., 2013. The New Science of Cities. Cambridge, MA: MIT Press.
Berry, B.J., 1968. Interdependency of spatial structure and spatial behavior: a general field theory

17
formulation. Papers in Regional Science 21, 205-227.
Burgess, E.W., 1925. The growth of the city: an introduction to a research project. Chicago: University
of Chicago Press.
Blondel, V.D., Guillaume, J.-L., Lambiotte, R., Lefebvre, E., 2008. Fast unfolding of communities in large
networks. Journal of Statistical Mechanics: Theory and Experiment 2008, P10008.
Brockmann, D., Hufnagel, L., Geisel, T., 2006. The scaling laws of human travel. Nature 439, 462-465.
Cho, E., Myers, S.A., Leskovec, J., 2011. Friendship and mobility: user movement in location-based
social networks. In: Proceedings of the 17th ACM SIGKDD international conference on
Knowledge discovery and data mining. ACM, pp. 1082-1090.
Christaller, W., 1966. Central places in southern Germany. London: Prentice-Hall.
Clauset, A., Newman, M., Moore, C., 2004. Finding community structure in very large networks.
Physical Review E 70, 066111.
De Montis, A., Barth‚lemy, M., Chessa, A., Vespignani, A., 2007. The structure of interurban traffic: a
weighted network analysis. Environment and Planning B: Planning and Design 34, 905-924.
De Montis, A., Caschili, S., Chessa, A., 2013. Commuter networks and community detection: a method
for planning sub regional areas. European Physical Journal Special Topics 215, 75-91.
Fang, Z., Shaw, S.-L., Tu, W., Li, Q., Li, Y., 2012. Spatiotemporal analysis of critical transportation links
based on time geographic concepts: a case study of critical bridges in Wuhan, China. Journal of
Transport Geography 23, 44-59.
Fortunato, S., 2010. Community detection in graphs. Physics Reports 486, 75-174.
Freeman, L.C., 1977. A set of measures of centrality based on betweenness. Sociometry, 35-41.
Gao, S., Wang, Y., Gao, Y., Liu, Y., 2013. Understanding urban traffic-flow characteristics: a rethinking of
betweenness centrality. Environment and Planning B: Planning and Design 40, 135-153.
Girvan, M., Newman, M.E., 2002. Community structure in social and biological networks.
Proceedings of the National Academy of Sciences 99, 7821-7826.
Goddard, J.B., 1970. Functional regions within the city centre: a study by factor analysis of taxi flows in
central London. Transactions of the Institute of British Geographers, 161-182.
González, M.C., Hidalgo, C.A., Barabási, A.-L., 2008. Understanding individual human mobility patterns.
Nature 453, 779-782.
Guo, D., Zhu, X., Jin, H., Gao, P., Andris, C., 2012. Discovering spatial patterns in origin-destination
mobility data. Transactions in GIS 16, 411-429.
Handy, S., 1996. Methodologies for exploring the link between urban form and travel behavior.
Transportation Research Part D: Transport and Environment 1, 151-165.
Kang, C., Sobolevsky, S., Liu, Y., Ratti, C., 2013. Exploring human movements in Singapore: A
comparative analysis based on mobile phone and taxicab usages. In: Proceedings of the 2nd ACM
SIGKDD International Workshop on Urban Computing. ACM, no. 1.
Li, Q., Zhang, T., Wang, H., Zeng, Z., 2011. Dynamic accessibility mapping using floating car data: a
network-constrained density estimation approach. Journal of Transport Geography 19, 379-393.
Liang, X., Zheng, X., Lv, W., Zhu, T., Xu, K., 2012. The scaling of human mobility by taxis is exponential.
Physica A: Statistical Mechanics and its Applications 391, 2135-2144.
Liu, Y., Kang, C., Gao, S., Xiao, Y., Tian, Y., 2012a. Understanding intra-urban trip patterns from taxi
trajectory data. Journal of Geographical Systems 14, 463-483.
Liu, Y., Wang, F., Xiao, Y., Gao, S., 2012b. Urban land uses and traffic ‘source-sink areas’: evidence from
GPS-enabled taxi data in Shanghai. Landscape and Urban Planning 106, 73-87.

18
Liu, Y., Sui, Z., Kang, C., Gao, Y., 2014. Uncovering patterns of inter-urban trip and spatial Interaction
from social media check-in data. PLOS ONE 9, e86026.
Lowry, J. H., Lowry, M.B., 2014. Comparing spatial metrics that quantify urban form. Computers,
Environment and Urban Systems 44, 59-67.
Lu, Y., Liu, Y., 2012. Pervasive location acquisition technologies: opportunities and challenges for
geospatial studies. Computers, Environment and Urban Systems 36, 105-108.
Qi, G., Li, X., Li, S., Pan, G., Wang, Z., Zhang, D., 2011. Measuring social functions of city regions from
large-scale taxi behaviors. In: 2011 IEEE International Conference on Proceeding of Pervasive
Computing and Communications Workshops (PERCOM Workshops), IEEE, pp. 384-388.
Ratti, C., Sobolevsky, S., Calabrese, F., Andris, C., Reades, J., Martino, M., Claxton, R., Strogatz, S.H.,
2010. Redrawing the map of Great Britain from a network of human interactions. PLOS ONE 5,
e14248.
Reades, J., Calabrese, F., Ratti, C., 2009. Eigenplaces: analysing cities using the space-time structure of
the mobile phone network. Environment and Planning B: Planning and Design 36, 824-836.
Rosvall, M., Bergstrom, C.T., 2008. Maps of random walks on complex networks reveal community
structure. Proceedings of the National Academy of Sciences of the United States of America 105,
1118-1123.
Roth, C., Kang, S.M., Batty, M., Barthélemy, M., 2011. Structure of urban movements: polycentric
activity and entangled hierarchical flows. PLOS ONE 6, e15923.
Schneider, C.M., Belik, V., Couronne, T., Smoreda, Z., Gonzalez, M.C., 2013. Unravelling daily human
mobility motifs. Journal of the Royal Society Interface 10, 20130246.
Schwanen, T., Dijst, M., Dieleman, F.M., 2004. Policies for urban form and their impact on travel: the
Netherlands experience. Urban Studies 41, 579.
Sobolevsky, S., Szell, M., Campari, R., Couronné, T., Smoreda, Z., Ratti, C., 2013. Delineating
geographical regions with networks of human interactions in an extensive set of countries. PLOS
ONE 8, e81707.
Song, C., Koren, T., Wang, P., Barabási, A.-L., 2010. Modelling the scaling properties of human mobility.
Nature Physics 6, 818-823.
Song, Y., Merlin, L., Rodriguez, D., 2013. Comparing measures of urban land use mix. Computers,
Environment and Urban Systems 42, 1-13.
Stead, D., Marshall, S., 2001. The relationships between urban form and travel patterns. An
international review and evaluation. European Journal of Transport and Infrastructure Research 1,
113-141.
Tanahashi, Y., Rowland, J.R., North, S., Ma, K.-L., 2012. Inferring human mobility patterns from
anonymized mobile communication usage. In: Proceedings of the 10th International Conference
on Advances in Mobile Computing & Multimedia. ACM, pp. 151-160.
Thiemann, C., Theis, F., Grady, D., Brune, R., Brockmann, D., 2010. The structure of borders in a small
world. PLOS ONE 5, e15422.
Timmermans, H., Arentze, T., Joh, C.-H., 2002. Analysing space-time behaviour: new approaches to old
problems. Progress in human geography 26, 175-190.
Toole, J.L., Ulm, M., González, M.C., Bauer, D., 2012. Inferring land use from mobile phone activity. In:
Proceedings of the ACM SIGKDD International Workshop on Urban Computing. ACM, pp. 1-8.
Veloso, M., Phithakkitnukoon, S., Bento, C., 2011. Sensing urban mobility with taxi flow. In:
Proceedings of the 3rd ACM SIGSPATIAL International Workshop on Location-Based Social

19
Networks. ACM, no. 2.
Wasserman, S., 1994. Social network analysis: Methods and applications. U.K., Cambridge: Cambridge
university press.
Yuan, J., Zheng, Y., Xie, X., 2012. Discovering regions of different functions in a city using human
mobility and POIs. In: Proceedings of the 18th ACM SIGKDD international conference on
Knowledge discovery and data mining. ACM, pp. 186-194.
Yue, Y., Lan, T., Yeh, A.G., Li, Q., 2014. Zooming into individuals to understand the collective: A review
of trajectory-based travel behaviour studies. Travel Behaviour and Society 1, 69-78.
Yue, Y., Wang, H., Hu, B., Li, Q., Li, Y., Yeh, A.G.O., 2012. Exploratory calibration of a spatial interaction
model using taxi GPS trajectories. Computers, Environment and Urban Systems 36, 140-153.
Zheng, Y., Liu, Y., Yuan, J., Xie, X., 2011. Urban computing with taxicabs. In: Proceedings of the 13th
international conference on Ubiquitous computing. ACM, pp. 89-98.

20
Appendix
To interpret the factors influencing intra-city travel patterns and the formation of the polycentric
city structure, the land use, or the function in the city system, of centers should be explored. The
land uses of most centers are hard to directly identify because land uses are mixed and the
center functions are a combination of many factors. Given that the temporal variations of taxi
pick-up and drop-off points strongly correlate with the area’s function (Liu et al., 2012b), we tried
to infer land uses of L1Z centers with temporal pick-up and drop-off volumes. We computed the
total number of pick-up and drop-off points of each center for each hour of the day and plotted
the results in Fig. A2. Detailed pick-up and drop-off point locations and empirical knowledge of
the area were also taken into consideration. For simplicity, in this section, the center of a L1Z is
still defined as the node with the highest strength value. This simplification is reasonable because
most double/triple centers of the same L1Z are adjacent or have similar functions. The land uses
of emerging L2Z centers are easy to identify because they represent important transportation
terminals. The centers are depicted in Fig. A1, and the most traffic-influential facilities in each
center are listed in Table A1.
Fig. A1. The centers of selected L1Zs and L2Zs.
Table A1. Land uses of centers
Center
s
Corresponding
sub-regions
Most traffic-influential facilities Land use
1 L1Z 1 and L2Z I Government Building; Nanjing Road;
People’s Square
Business and commercial
area
2 L1Z 2 Wujiaochang Commercial and business
area
3 L1Z 3 New Century Plaza; Shanghai Mart Business and commercial
area
4 L1Z 4 Nanfang Friendship Shopping Center; Commercial and business

21
Lianhua RD Metro Station area
5 L1Z 5 and L2Z
II
New Shanghai Commercial Area Commercial and business
area
6 L1Z 6 Caoyang Shopping Mall; The Central
Hospital of Putuo District
Commercial area
7 L1Z 7 Residential Areas; Tongji Hospital Mixed residential area
8 L1Z 8 Residential Areas; Malls; Schools Mixed residential area
9 L1Z 9 Yaohua Rd Metro Station Transportation
10 L1Z 10 and L2Z
III
Xinzhuang Metro Station Transportation
11 L1Z 11 Zhangjiang Hi-tech Park Metro
Station
Transportation
12 L1Z 12 Residential Areas; Malls; Schools Mixed residential area
13 L1Z 13 South Waigaoqiao Free Trade Zone
Metro Station
Transportation
14 L1Z 14 Qibao Mall; Residential Areas Mixed residential area
15 L1Z 15 Residential Areas; Malls Mixed residential area
16 L2Z I Shanghai Railway Station Transportation
17 L2Z I Shanghai Hongqiao International
Airport
Transportation
18 L2Z III Shanghai South Railway Station Transportation
19 L2Z IV Pengpu Xincun Rd Metro Station Transportation
We first analyzed centers located in urban L1Zs. The center of L1Z 1 lies in the central district of
Shanghai containing the city government, famous commercial areas, and important office
buildings, and thus, high levels of taxi flows result during the daytime. The number of pick-up
points overwhelms the drop-off points in the evening, demonstrating the trend of people leaving
the commercial and business areas. Major functions of L1Z centers 2 to 6 are also commercial
and business areas, leading to more people traveling to these regions in the morning and leaving
them in the evening. The curves may have different detailed trends and peaks because the ratios
between business and commercial areas vary. Some centers also have hospitals or metro stations
with high volumes whose influences are also contained in the curves. The center of L1Z 7 is
dominated by residential land use mixed with small commercial regions. Because residential
areas generate traffic flows in the morning and attract traffic flows in the evening while
commercial areas influence traffic in an almost opposite way, people come in and out of this
region throughout the day with almost equivalent numbers, leading to two relatively similar
curves. The peak of drop-off points in the morning mainly results from the presence of a hospital.
Unlike most centers in urban areas, which act as local commercial and business centers, suburban
centers are strongly influenced by residential land use and metro stations. Centers of L1Zs 8, 12,
14, and 15 are residential areas mixed with some commercial areas and public places, such as
schools. Similar to the center of L1Z 7, the pick-up point and drop-off point curves closely match
each other. Centers of L1Zs 9 and 10 contain metro stations surrounded by residential areas,
resulting in peak drop-off points in the morning as residents transfer to metro—the cheaper

22
mode for long-distance travels—and then travel to central urban areas or other places.
Conversely, pick-up points continue to grow throughout the daytime and peak in the evening as
residents take taxis to leave the terminal and go home. In the center of L1Z 10, the number of
people arriving throughout the day is much higher than the number of people leaving because
the metro station in L1Z 10 belongs to an integrated public transport terminal. Many people
arrive by taxi and transfer to continue their travels. L1Zs 11 and 13 comprise a hi-tech industrial
area and a free trade zone, with centers of those two L1Zs both containing important metro
stations. People utilize these areas for work and business in the daytime, many of whom tend to
take the subway to the stations in these areas and then transfer to taxis to reach their
destinations; thus, the pick-up point curve peaks in the morning and then begins to decrease.
After work or business, people take taxis to the metro stations and leave the areas, leading to the
peaks of drop-off point curves in the afternoon. The higher drop-off point numbers in L1Z 11 may
result from the combination of research buildings and commercial centers near the metro station.
Furthermore, the higher pick-up numbers in L1Z 13 may result from the limited time budgets of
people before business, resulting in the preference to travel by taxi to save time.

23
Fig. A2. Temporal variations of pick-up and drop-off points of centers in each L1Z.
Being the center of the entire city, center of L1Z 1 also enjoys intense interaction with cells in
nearby L1Zs and continues acting as the center of L2Z I. In addition, the Shanghai Railway Station
and Hongqiao International Airport emerge as new centers, given their irreplaceable roles in
Shanghai’s transportation system and their strong abilities in attracting and generating
long-distance trips. The center of L1Z 5 contains the most influential commercial and business
zone in the eastern part of Shanghai, thus being the center of L2Z II. Given that L2Z III primarily
covers suburban areas, the center of L1Z 10, with the integrated transport hub, still has broad
influence and acts as a center. Shanghai South Railway Station also emerges as a center in L2Z III.
The original L1Z centers still act as centers in L2Z IV. Because L1Zs in L2Z IV are primarily
residential areas, the cell containing a crucial metro station also emerges as a new center.