revelstoke cougar ecology and predation in the columbia ... · cougar ecology, predation, and ......
TRANSCRIPT
Cougar Ecology, Predation, and Caribou in the Columbia Mountains
of British Columbia
Photo by C Bird
Prepared for
Fish and Wildlife Compensation Program – Columbia Basin
By
Corey Bird1, Ross Clarke2, Dave Lewis3 and Robert Serrouya4
March 2010
1Corey Bird & Associates, PO Box 2652, Revelstoke, BC, V0E 2S0
2R Clarke Environmental Services, 663 Parkview Rd, Nelson, BC, V1L 6H6
3Dave Lewis, PO Box 269, Edgewater, BC V0A 1E0
4 Columbia Mountains Caribou Project, RPO#3, Box 9158, V0E 3K0, [email protected]
i
Abstract
Much of the recent decline of mountain caribou (Rangifer tarandus) populations in BC has been attributed to an increase of other large ungulates and their predators following broad‐scale habitat modification. In response to the decline of caribou in the Columbia Mountains (CM), the Fish and Wildlife Compensation Program began studying cougars in 2006 to: 1) determine their distribution, 2) quantify their overlap with mountain caribou, and 3) determine their prey selection and kill rates. Between 2006 and 2008, we monitored 3 GPS‐collared cougars (1 adult male, 1 adult female, and 1 sub‐adult male) as well as 1 VHF‐collared cougar (an adult female). We used GPS data to investigate 200 of a total 634 multiple‐point cluster locations and found prey remains at 101 of those clusters. Cougar kill rates were determined empirically where we assigned ‘sessions’ to time periods where, through our investigations, we assumed had complete account of what cougars had been eating. Kill rates were then calculated for each session and averaged across all sessions to estimate a kill rate for each cougar. We summarized data for individual cougars by prey species and age class at 2 time scales: a complete summary of kills, as well as a seasonal summary. To quantify overlap with caribou, we used seasonal caribou resource selection functions (RSF) and overlaid cougar GPS locations as well as the location of each non‐caribou kill site. Although our cougar sample was small, we found that caribou comprised of a small proportion (3 of 101 total kills) of the cougar diet and that alternate prey such as deer, moose, elk, and beaver were the predominant prey species selected by cougars. However, this amount of predation can still be sufficient to negatively affect small (i.e. < 20 individuals) caribou populations that live in the study area. In quantifying cougar overlap with caribou habitat, we found that cougars spent the largest proportion of time in lower quality caribou habitat for all seasons but that there was overlap with higher quality habitat during the spring, summer, and early winter suggesting a relatively higher predation risk to caribou during those seasons. A similar pattern was seen in the overlap of non‐caribou cougar kills, where non‐caribou prey were killed in higher quality caribou habitat during the spring, summer, and early winter. The overlap was greater with male cougars in our study which may be attributable to the location and size of male home ranges, or may be because our female home range was south of more populated caribou areas. Although our sample size was small, it represented a significant proportion of the cougars in the study area (3 of 6‐7cougars). In this context, our dataset suggests that alternate prey make up the predominant prey species for cougars in this area which suggest at least partial credence to the apparent competition hypothesis. Compared to other areas, cougar densities are low in the study area, but there are currently sufficient densities of alternate prey to sustain cougars in this area. We recommend continued monitoring of cougar densities and continued reductions of non‐caribou prey to minimize cougar overlap with caribou populations.
ii
Table of Contents 1.0 Introduction......................................................................................................................................................... 1
2.0 Project Area ......................................................................................................................................................... 3
3.0 Methods .............................................................................................................................................................. 5
3.1 Data Collection ................................................................................................................................................ 5
3.2 Data Analysis ................................................................................................................................................... 6
4.0 Results ................................................................................................................................................................. 8
4.1 Cougar home ranges........................................................................................................................................ 8
4.2 Cougar overlap with mountain caribou habitat. ............................................................................................. 8
4.3 Prey species summary. .................................................................................................................................. 13
4.4 Cougar Kill Rates ............................................................................................................................................ 19
4.5 Univariate and multivariate selection of habitat types................................................................................. 21
5.0 Discussion .......................................................................................................................................................... 27
6.0 Acknowledgements ........................................................................................................................................... 30
7.0 References ......................................................................................................................................................... 31
Photo by C Bird
iii

List of Figures
Figure 1. Approximate areas occupied by Mountain Caribou populations in the northern Columbia Mountains. . 2
Figure 2. Project study area as well as the Wildlife Management Units within the Revelstoke area....................... 4
Figure 3. Proportion of cougar locations in the different caribou RSF classes coloured by season for Dennis........ 9
Figure 4. Proportion of cougar locations in the different caribou RSF classes coloured by season for Penelope.... 9
Figure 5. Proportion of cougar locations in the different caribou RSF classes coloured by season for MG. .......... 10
Figure 6. A seasonal proportion of 49 cougar kills in different caribou RSF classes by for the adult male Dennis. 11
Figure 7. A seasonal proportion of 30 cougar kills in different caribou RSF for the adult female Penelope. ......... 11
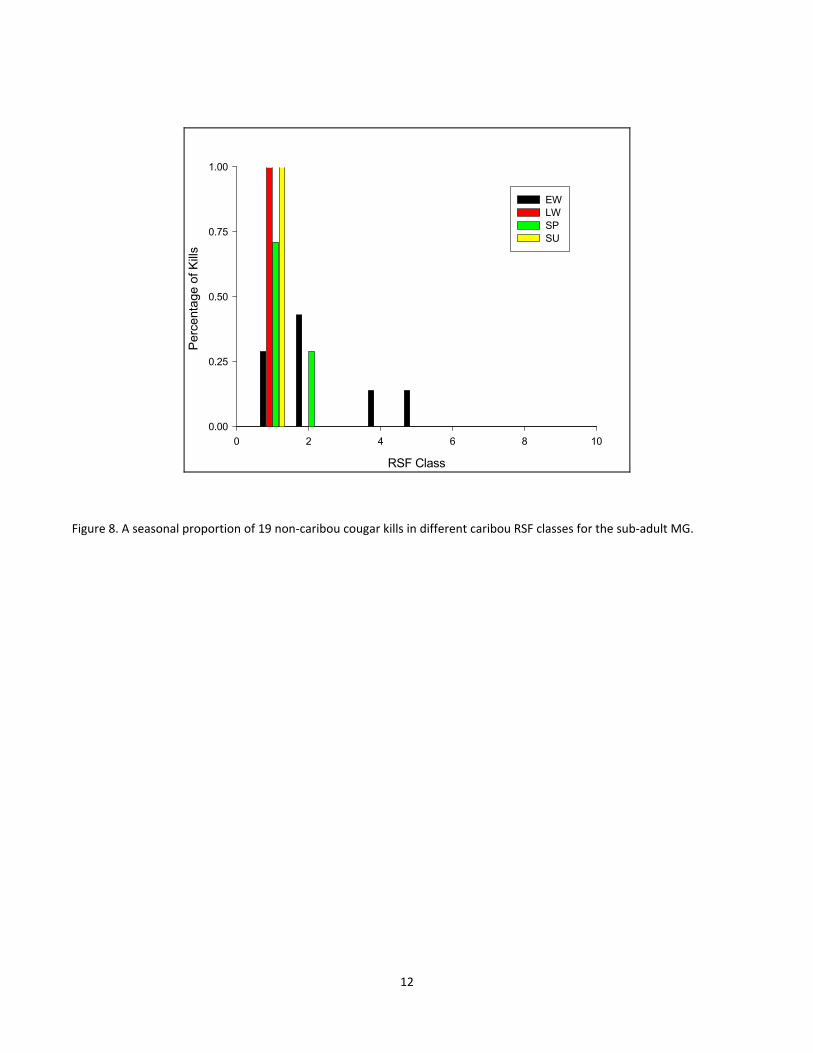
Figure 8. A seasonal proportion of 19 non‐caribou cougar kills in different caribou RSF classes for the sub‐adult
MG. .......................................................................................................................................................................... 12
Figure 9. Photographs of cougar kill sites. Clockwise from top left: a bull elk killed by Dennis north of Highway 1
east of Revelstoke, cow moose found during cougar capture near Crawford Creek, juvenile black bear killed by
MG, and a deer killed by Penelope near Shelter Bay. ............................................................................................. 13
Figure 13: Proportion of kill sites, random locations, and selection for four classes of distance to early seral (< 30
yr) vegetation by the adult male cougar Dennis during summer and early winter. Selection is gauged by Ivlev’s
electivity index (Ivlev 1961). Error bars are bootstrapped 95% CIs. ....................................................................... 21
Figure 14. Proportion of kill sites, random locations, and selection for four classes of distance to early seral (<30
yr) vegetation by the female cougar Penelope during summer and early winter. Selection is gauged by Ivlev’s
electivity index (Ivlev 1961). Error bars are bootstrapped 95% CIs. ....................................................................... 22
Figure 15. Proportion of kill sites, random locations, and selection for four classes of distance to early seral (<30
yr) vegetation by the sub‐adult male MG during summer and early winter. Selection is gauged by Ivlev’s
electivity index (Ivlev 1961). Error bars are bootstrapped 95% CIs. ....................................................................... 22
Figure 16. Proportion of kill sites, random locations, and selection for four classes of distance to early seral (<30
yr) vegetation by the adult male cougar Dennis during late winter and spring. Selection is gauged by Ivlev’s
electivity index (Ivlev 1961). Error bars are bootstrapped 95% CIs. ....................................................................... 23
Figure 17. Proportion of kill sites, random locations, and selection for four classes of distance to early seral (<30
yr) vegetation by the female cougar Penelope during late winter and spring. Selection is gauged by Ivlev’s
electivity index (Ivlev 1961). Error bars are bootstrapped 95% CIs. ....................................................................... 23
Figure 18. Proportion of kill sites, random locations, and selection for four classes of distance to early seral
(<30yr) vegetation by the sub‐adult male MG during late winter and spring. Selection is gauged by Ivlev’s
electivity index (Ivlev 1961). Error bars are bootstrapped 95% CIs. ....................................................................... 24
iv

Figure 19. Proportion of kill sites, random locations, and selection for four forest age classe for all cougars during
the summer/early winter season. Selection is gauged by Ivlev’s electivity index (Ivlev 1961). Error bars are
bootstrapped 95% CIs. ............................................................................................................................................ 25
Figure 20. Proportion of kill sites, random locations, and selection for four forest age classes for all cougars
during the late‐winter/spring season. Selection is gauged by Ivlev’s electivity index (Ivlev 1961). Error bars are
bootstrapped 95% CIs. ............................................................................................................................................ 25
Figure A3‐1. Frequency distribution of 219 multiple point clusters for Dennis by cluster size showing the total
number of clusters, the total investigated and the total kills found....................................................................... 37
Figure A3‐2. Frequency distribution of 194 multiple point clusters for Penelope by cluster size showing the total
number of clusters, the total investigated and the total kills found....................................................................... 37
Figure A3‐3. Frequency distribution of 221 multiple point clusters for MG by cluster size showing the total
number of clusters, the total investigated and the total kills found....................................................................... 38
v

List of Tables
Table 1: Percent of total predation events by predator. Only events that were classified as predation with a
moderate to high level of confidence are included. Of the unknown cases, 1 was a suspected wolf kill (2002) and
2 were suspected wolverine kills (1997,2003), but confidence in these assessments was low (from Furk et al.,
2009).......................................................................................................................................................................... 2
Table 2. 95 Adaptive Kernel home‐range estimates (km2) for EW (early‐winter, Oct 22nd ‐ Jan 11th), LW (late‐
winter, Jan 12th ‐ Apr 22nd), SP (spring, Apr 23rd – May28th), and SU (summer, May 29th ‐ Oct21st) with sample
size (n) for Dennis, Penelope, and MG. ..................................................................................................................... 8
Table 3. Kill summary for Dennis showing the number of identified kills by species, summarized by age class... 14
Table 4. A more in‐depth summary of 30 kills for Dennis showing the number of identified kills by species and
age class summarized by season with the number of kills corrected by season length (i.e. the number of days per
season)..................................................................................................................................................................... 15
Table 5. A summary of 30 kills for Penelope showing the number of identified kills by species, summarized by
age class for all seasons........................................................................................................................................... 16
Table 6. A more in‐depth summary of 30 kills for Penelope showing the number of identified kills by species and
age class summarized by season with the number of kills corrected by season length (i.e. the number of days per
season)..................................................................................................................................................................... 16
Table 7. A summary of 22 kills for MG showing the number of identified kills by species, summarized by age
class. ........................................................................................................................................................................ 17
Table 8. A more in‐depth summary of 30 kills for MG showing the number of identified kills by species and age
class summarized by season with the number of kills corrected by season length (i.e. the number of days per
season)..................................................................................................................................................................... 18
Table 9. Kill rate summary for Dennis showing the kill rate of individual sessions as well as the average kill rate
among sessions in days/kill and kills/100 days. ...................................................................................................... 19
Table 10. Kill rate summary for Penelope showing the kill rate of individual sessions as well as the average kill
rate among sessions in days/kill and kills/100 days. ............................................................................................... 19
Table 11. Kill rate summary for MG showing the kill rate of individual sessions as well as the average kill rate
among sessions in days/kill and kills/100 days. ...................................................................................................... 20
Table 12. Variables used for multivariate modelling............................................................................................... 26
Table 13. Results of logistic regression analyses of cougar kill locations compared to random sites for the
summer/early winter season. Models are sorted by increasing AIC values, and direction of parameter estimates
shown in brackets.................................................................................................................................................... 26
vi

vii
Table 14. Results of logistic regression analyses of cougar kill locations compared to random sites for the late‐
winter/spring season. Models are sorted by increasing AIC values. All parameter estimates were negative. ..... 27

1.0 Introduction Mountain caribou (Rangifer tarandus) are distinguished from other caribou because they are obligate foragers of arboreal lichen during winter and thus, select foraging habitats with maximal snow accumulation during the winter season to increase their foraging opportunities. Mountain caribou habitat extends from central British Columbia (BC) into Idaho, USA, but their distribution has contracted considerably since Europeans first settled western Canada (Bergerud 1974). Today, they are almost entirely confined to the interior “wet belt” mountains of BC. Much of the recent decline of mountain caribou populations in British Columbia has been linked to the numerical increase of other large ungulates and the predators following broad‐scale habitat modification (Seip 1992, Wittmer et al. 2005a, Apps and McLellan 2006, Wittmer et al. 2007). It is believed that the fragmentation and loss of habitat (primarily old growth habitat on which the mountain caribou depend) has created favourable habitat conditions for alternate ungulates such as deer and moose and has resulted in an increase in these species (Wittmer 2004). The “apparent‐competition hypothesis” (Bergerud 1974; Holt 1977; Seip 1992; Bergerud 1996; Bergerud and Elliot 1998) predicts that increasing alternate ungulate populations (moose, elk, or deer) support higher predator densities which, in turn, lead to higher incidental predation on caribou. Climate change is also thought to play an important role by: 1) facilitating over‐winter survival of deer, moose, and to a lesser extent, elk and 2) potentially increasing the fire frequency in forests that historically burned infrequently. There are 5 caribou subpopulations in the Columbia Forest District (CFD, Figure 1) including, the Columbia North (CN), the Columbia South (CS), the Frisby‐Boulder (FB), the South Monashee (SM), and the Central Rockies (CR). These subpopulations have declined from an estimated 385 animals (206, 114, 36, 10, 19 for the CN, CS, FBQ, SM, and CR respectively), in 1994 to 206 animals (166, 20, 12, 5, and 3 for the CN, CS, FBQ, SM, and CR respectively) in 2008 (McLellan et al 2008). During this time, predation has accounted for 62% of collared caribou mortalities with cougars accounting for 20% (Table 1). In response to the caribou decline, the Fish and Wildlife Compensation Program began studying cougar ecology and predation in the Columbia Mountains around Revelstoke in 2006. The Revelstoke Cougar Ecology and Predation project (2006 – 2009) was created in an effort to learn what sustains cougars in the Columbia Mountains and to determine also how cougar ecology (predation and habitat‐use) relate to or impact mountain caribou. The primary objectives of this project were to:
1. Determine the distribution and movement patterns of cougars in the Columbia Mountains (CM). 2. Quantify the overlap in seasonal and combined‐season habitat use of cougar and caribou 3. Investigate cougar kill sites to quantify prey selection and kill frequency to estimate cougar kill rates 4. Quantify the habitats used by cougars in killing prey.
1
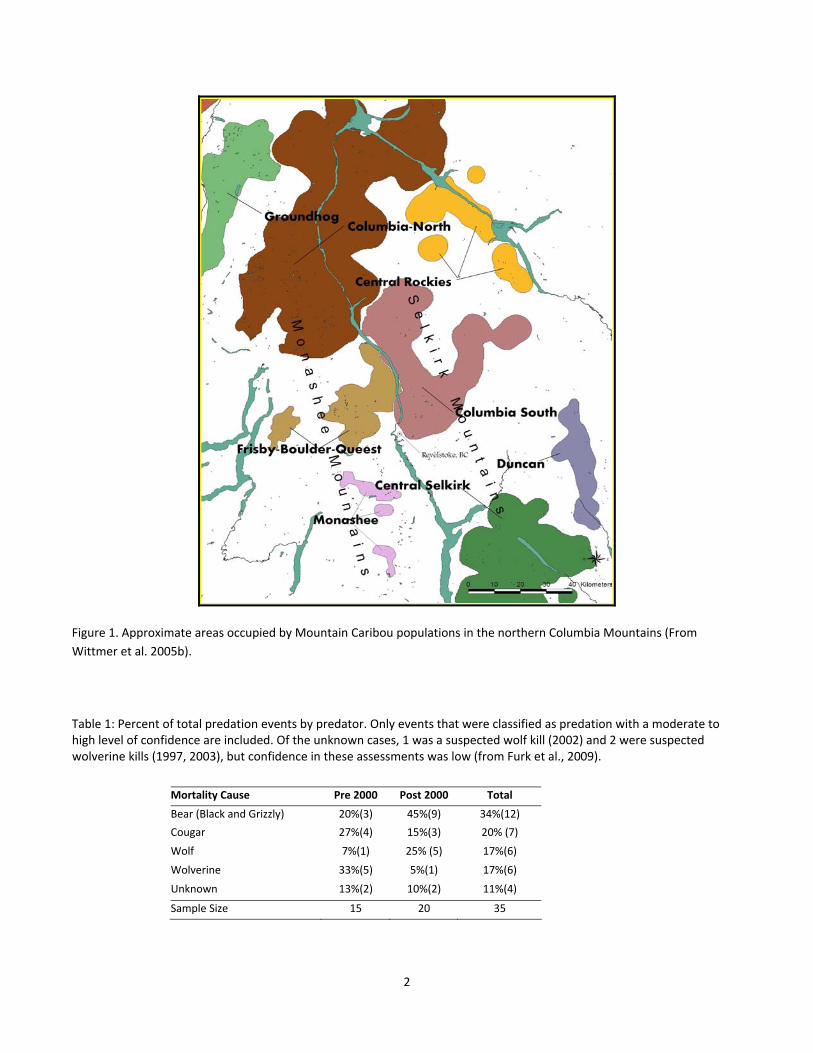
Figure 1. Approximate areas occupied by Mountain Caribou populations in the northern Columbia Mountains (From
Wittmer et al. 2005b).
Table 1: Percent of total predation events by predator. Only events that were classified as predation with a moderate to high level of confidence are included. Of the unknown cases, 1 was a suspected wolf kill (2002) and 2 were suspected wolverine kills (1997, 2003), but confidence in these assessments was low (from Furk et al., 2009).
Mortality Cause Pre 2000 Post 2000 Total
Bear (Black and Grizzly) 20%(3) 45%(9) 34%(12)
Cougar 27%(4) 15%(3) 20% (7)
Wolf 7%(1) 25% (5) 17%(6)
Wolverine 33%(5) 5%(1) 17%(6)
Unknown 13%(2) 10%(2) 11%(4)
Sample Size 15 20 35
2
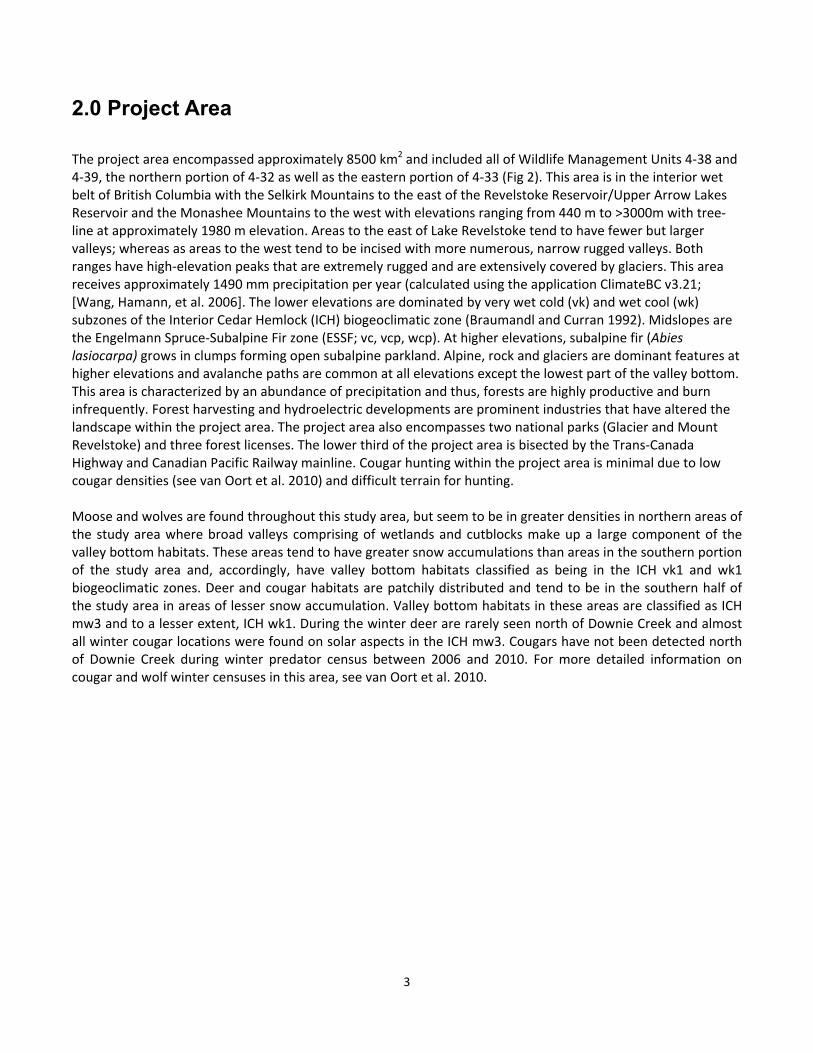
2.0 Project Area The project area encompassed approximately 8500 km2 and included all of Wildlife Management Units 4‐38 and 4‐39, the northern portion of 4‐32 as well as the eastern portion of 4‐33 (Fig 2). This area is in the interior wet belt of British Columbia with the Selkirk Mountains to the east of the Revelstoke Reservoir/Upper Arrow Lakes Reservoir and the Monashee Mountains to the west with elevations ranging from 440 m to >3000m with tree‐line at approximately 1980 m elevation. Areas to the east of Lake Revelstoke tend to have fewer but larger valleys; whereas as areas to the west tend to be incised with more numerous, narrow rugged valleys. Both ranges have high‐elevation peaks that are extremely rugged and are extensively covered by glaciers. This area receives approximately 1490 mm precipitation per year (calculated using the application ClimateBC v3.21; [Wang, Hamann, et al. 2006]. The lower elevations are dominated by very wet cold (vk) and wet cool (wk) subzones of the Interior Cedar Hemlock (ICH) biogeoclimatic zone (Braumandl and Curran 1992). Midslopes are the Engelmann Spruce‐Subalpine Fir zone (ESSF; vc, vcp, wcp). At higher elevations, subalpine fir (Abies lasiocarpa) grows in clumps forming open subalpine parkland. Alpine, rock and glaciers are dominant features at higher elevations and avalanche paths are common at all elevations except the lowest part of the valley bottom. This area is characterized by an abundance of precipitation and thus, forests are highly productive and burn infrequently. Forest harvesting and hydroelectric developments are prominent industries that have altered the landscape within the project area. The project area also encompasses two national parks (Glacier and Mount Revelstoke) and three forest licenses. The lower third of the project area is bisected by the Trans‐Canada Highway and Canadian Pacific Railway mainline. Cougar hunting within the project area is minimal due to low cougar densities (see van Oort et al. 2010) and difficult terrain for hunting. Moose and wolves are found throughout this study area, but seem to be in greater densities in northern areas of the study area where broad valleys comprising of wetlands and cutblocks make up a large component of the valley bottom habitats. These areas tend to have greater snow accumulations than areas in the southern portion of the study area and, accordingly, have valley bottom habitats classified as being in the ICH vk1 and wk1 biogeoclimatic zones. Deer and cougar habitats are patchily distributed and tend to be in the southern half of the study area in areas of lesser snow accumulation. Valley bottom habitats in these areas are classified as ICH mw3 and to a lesser extent, ICH wk1. During the winter deer are rarely seen north of Downie Creek and almost all winter cougar locations were found on solar aspects in the ICH mw3. Cougars have not been detected north of Downie Creek during winter predator census between 2006 and 2010. For more detailed information on cougar and wolf winter censuses in this area, see van Oort et al. 2010.
3
Wildlife Management Units
Project Area (8568km2)
Figure 2. Project study area as well as the Wildlife Management Units within the Revelstoke area.
4
3.0 Methods
3.1 Data Collection We used GPS data from 3 cougars (1 adult male = Dennis, 1 adult female = Penelope, and 1 sub‐adult male = MG) as well as VHF data from 1 cougar (adult female = Delilah) captured during the winters of 2005‐2006, 2006‐2007, and 2007‐2008 respectively. Cougar tracking, trailing, and capture (using hounds to tree cougars) was carried out by project staff and local houndsmen from the Revelstoke area. A “Houndsmen Protocol” detailing safe handling and responsibilities was prepared prior to the start of the project (Clarke 2003). An “Immobilization Protocol”, developed for the South Selkirk Cougar Project (Clarke 2003), was utilized for the safe handling of the cougars and the safety of personnel in the field. Cougars were immobilized with Telezol at a concentration of 7mg/kg using a 3cc dart with a ½” barbless needle. Delivery of the drug was carried out using a “Cap Chur” dart‐gun with a brown charge. Provisions were made to lower immobilized cougars out of a tree if necessary with the use of climbing spurs and ropes. At capture, cougars were ear‐tagged in both ears with numbered rototags (NASCO; Modesto, Calif., USA), sexed, and examined for reproductive status and general condition. Cougar age classes were classified (kitten, adult and sub‐adult) by size, color, and tooth wear (Laundre et al. 2000). We fitted cougars with Lotek 4400S GPS radio‐collars (Lotek Engineering, Inc. Newmarket, Ontario), each programmed with a four‐hour mortality delay. Of the 5 GPS collars deployed, 1 was programmed at 4‐hr intervals, 3 were programmed at 3‐hour intervals, and 1 had 8 hr programming from March 1st‐April 21st, 2‐hr programming from May 20th‐June 15th, and 3‐hr programming from February 3rd‐29th, April 22nd‐ May 19th, and June 16th‐January 22nd. To conserve batteries on GPS collars, the VHF signal was programmed to be active from 0800 to 1700 hrs each day.
We attempted to locate cougars from the air every 2‐4 weeks (depending on weather and flying conditions) using a Cessna 337 and we downloaded GPS collar data every 4‐6 weeks with the use of a “Handheld Control Unit” (Lotek Engineering, Inc. Newmarket, Ontario). Downloaded data was examined prior to field investigations using Geographic Information Systems (Arcview 3.3) to delineate clusters of points based on the spatial and temporal distribution of GPS point data. Clusters are groups of locations that occur at a similar time and place. In this case, we defined clusters as being ≥2 points, 200m and 24‐hours from consecutive locations (consistent with that used by Anderson and Lindzey (2003), and Knopff et al. (2009) except that they expanded their cluster definition to include all points within a 6‐day period). In order to differentiate GPS locations into clusters, we used a procedure whereby all points within the defined time space parameters were identified and given the same cluster membership. To do this, the first location in the cluster became the root‐location and each of the following locations within the cluster adopted the cluster membership of this earliest location. For example, if the first location at a given cluster (within 200 m and 24 hours of all other locations) was point number 626, each of the following locations adopted this membership. Field investigations of clusters were done by investigating a sample of clusters over a period of time or “tracking session” in attempt to estimate cougar kill rates from empirical cougar kill data (methodology similar to that used by Hebblewhite et al. 2003). For the field investigations, all downloaded cougar locations were loaded into hand‐held GPS units. At each cluster, we searched the area surrounding the highest density of points (i.e. areas where most of the points making up the cluster were congregated) in an effort to find prey remains. If no kill evidence or prey remains were discovered upon this initial investigation, a search of the remaining points in the cluster was performed. Kills were confirmed by the presence of prey remains (buried hair pile and bone fragments) consistent with the time that the cougar was in the area. During the season when Grizzly bears (Ursus arctos) and black bears (Ursus americanus) were active, no kill site investigations were made earlier than 21 days from the last known cougar location at the site. A safety protocol was followed when approaching all cluster/potential kill site locations
5
(Lewis and Clarke 2007). If a kill was located, we attempted to identify the species, sex, age, and condition of the prey species. We collected jaw bones and teeth for aging, hair for species identification and isotope analysis, and un‐cracked leg bones to measure condition (ideally femur or humerus). Hair from all unknown prey species were sent for DNA analysis to have the species identified (Wildlife Genetics International, Nelson, BC).
3.2 Data Analysis For each GPS collared cougar, we used 95% adaptive kernels (ADK, Worton 1989) to calculate both seasonal and combined (i.e. all seasons) homeranges. For our seasonal homerange estimates, we used caribou seasons which represent the periods of greatest elevational change for caribou. The dates used for this analysis were: early‐winter (EW) Oct 23rd ‐ Jan 11th , late‐winter (LW) Jan 12th ‐ Apr 22nd, spring (SP) Apr 23rd‐ May 28th), and summer (SU) May 29th‐ Oct 22nd)(dates from Apps. et al. 2001). Due to few locations, we used a minimum convex polygon (MCP) to estimate home range for our VHF collared cougar, Delilah.
To quantify the overlap of cougars with caribou habitat, we overlaid cougar GPS locations onto caribou resource selection function data (RSF) and extracted the RSF value for each cougar location. The caribou RSF is a model of predicted habitat selection based on biophysical GIS map layers. The output is a seasonal map of 250 m2 pixels that range in values from 0 – 1, (i.e. the probability of detecting a caribou at a particular location using radio‐telemetry, Apps et al. 2006). Using this data, we assigned seasonal caribou RSF probabilities to every cougar location for each corresponding season. Once caribou RSF data were assigned to cougar locations we grouped data into 9 categories based on their RSF probabilities (i.e. class 1 = 0‐0.11, 2 = 0.112‐0.22, 3 = 0.223‐0.33, 4 = 0.334‐0.44, 5 = 0.445‐0.55, 6 = 0.556‐0.66, 7 = 0.667‐0.77, 8 = 0.778‐0.88, and 9 = 0.889‐1.0) and summarized data for each cougar using a frequency distribution.
We used data from 101 investigated cougar kills (49, 30, and 22 for Dennis, Penelope, and MG respectively) and summarized data by prey species and age class (<6 months, 6‐18 months, > 18 months, unknown age). For each cougar, we provide 2 prey species summaries: the first, a combined‐season summary of all species killed, and the second, a seasonal summary of prey species. To determine cougar kill rates for each cougar, we assigned ‘sessions’ to periods that, through our investigations, we thought had a complete, empirical account of what the cougars had been eating. Kill rates were then calculated for each session and averaged across all sessions to come up with a kill rate for each cougar (based on methods used by Hebblewhite et al. 2003).
To quantify the habitats selected by cougars for killing their prey, we conducted univariate summaries and multivariate modeling by comparing kill sites to random locations at several spatial scales. We restricted these analyses to ungulate prey excluding mountain caribou, because caribou were a small component of their diet, have a negligible influence on cougar population dynamics (Wittmer et al. 2005a, 2007), and unlike moose, elk, or deer, are not “early‐seral” ungulates. For the univariate analyses, we present proportions of habitat classes where kill sites occurred, proportions of random locations, then gauged selection using Ivlev’s electivity index. Selection is use that is disproportionate to what is available on the landscape, and Ivlev’s index measures this using the following formula: (U – A) / (U + A), where U is the proportion used (in this case kill sites), and A is the proportion available. Positive values indicate preference, negative values indicate avoidance. The scale we used to define available habitats for the univariate analyses was based on seasonal home ranges for each cougar. Random locations were generated for each season for each individual, and these were compared to the kill sites during that season. Seasonal home ranges were based on a 95% adaptive kernel, and the number of random locations was chosen by iteratively increasing the number of locations until the proportions among habitat types no longer varied.
6

We first analyzed kill sites as a function of distance to human‐cause early seral vegetation, and after exploratory analyses decided to do this for each cougar that was fitted with a GPS collar. Because of limited sample sizes, we grouped the summer and early winter seasons, and also grouped the late winter and spring seasons because cougars were at similar elevations within these time periods. The second variable we analyzed was stand age, but we analyzed all 3 cougars together, again because exploratory analyses suggested similar patterns across individuals. We divided stand age into 4 classes, 0‐30 (early seral), 30 – 80 (mid seral), 80 – 140 (mature), and > 140 (old).
For the multivariate analyses, we used a different scale of analysis by comparing kill sites to random locations across the composite multi‐season and multi‐cougar home ranges. Based on our knowledge of cougar ecology from the literature and fieldwork, we developed a set of 9 candidate models and used logistic regression to model the selection of kill sites vs random locations. We grouped all 3 cougars together for this analysis but used the STRATA function in SAS to account for the variability among cougars. We treated candidate models as hypotheses and used Akaike’s information criteria to gauge the relative support for each of these models, because AIC provides an index of parsimony, which can be best explained as a tradeoff between bias (too few parameters) and variance (too many parameters). A lower AIC score indicates more parsimony. We screened all variables for multicollinearity and did not include those that were correlated beyond an r of 0.7, and retained those with greater biological relevance. Our models used various combinations of the variables shown in Table 12 but because of low sample size, we used a maximum of 2 variables in each model. We present the results for all candidate models but only consider those within 2 AIC units of the top model as worthy of considerations (Burnham and Anderson 1998), and present fit statistics (r2 values) for each model.
7
4.0 Results
4.1 Cougar home ranges Between February 5th, 2006 and January 20th, 2009, GPS collars collected data for 619, 338, and 341 days and provided us with 3213, 1487, and 1706 GPS fix locations for the adult male Dennis, the adult female Penelope, and the sub‐adult male MG respectively. Using this data, 95% Adaptive Kernel home ranges were estimated for each cougar by season as well as for all combined seasons (Table 2).
Table 2. 95 Adaptive Kernel home‐range estimates (km2) for EW (early‐winter, Oct 22nd ‐ Jan 11th), LW (late‐winter, Jan 12th ‐ Apr 22nd), SP (spring, Apr 23rd – May28th), and SU (summer, May 29th ‐ Oct21st) with sample size (n) for Dennis, Penelope, and MG.
Season Dennis Penelope MG
EW 1096 (193) 493 (316) 203 (431)
LW 715 (893) 33 (222) 531 (222)
SP 1459 (740) 321 (372) 1457 (388)
SU 1019 (1387) 339 (577) 1897 (665)
Combined Seasons 1296 (3213) 398 (1487) 1129 (1706)
For the other adult female, Delilah, we collected only 21 useable VHF telemetry locations from the air and thus (due to too few locations), used a minimum convex polygon to estimate home range resulting in an approximate combined home range of 183km2.
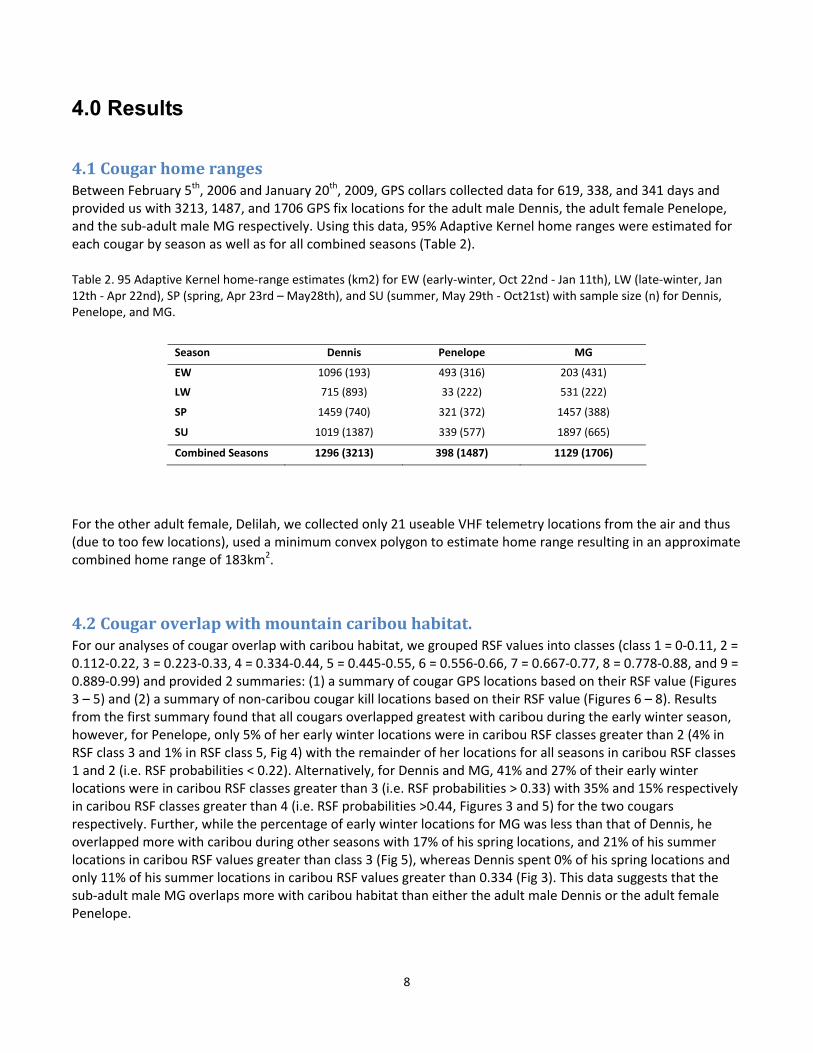
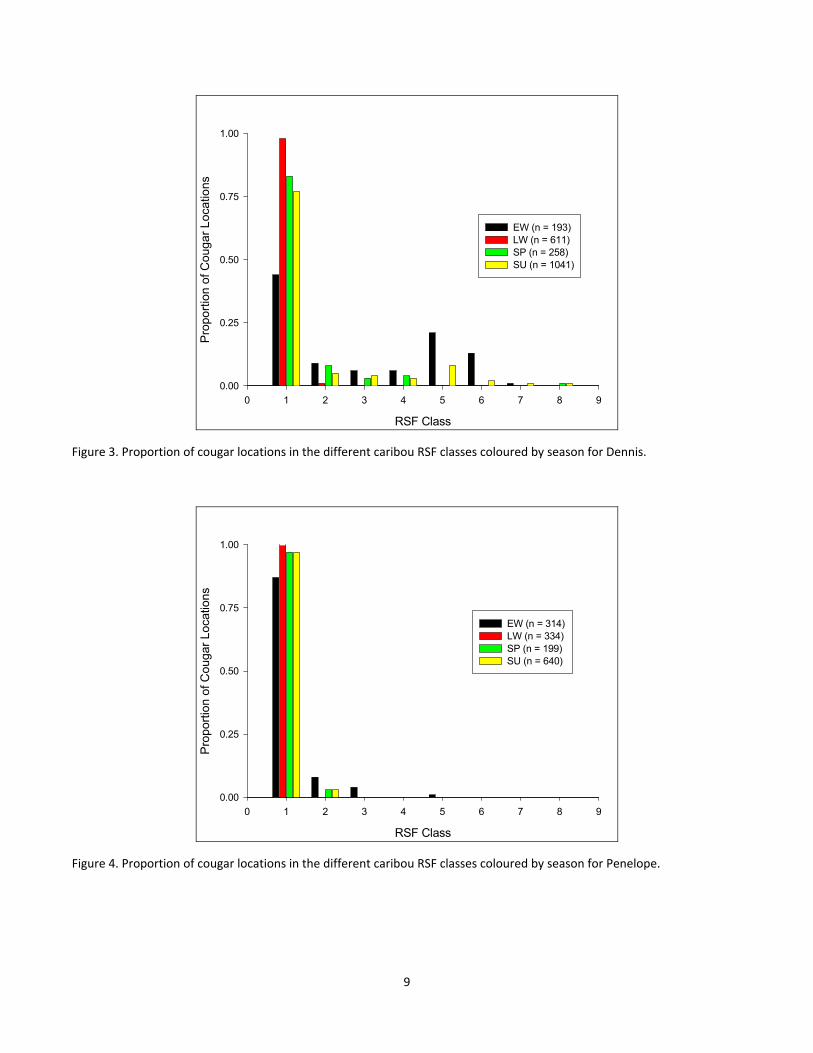
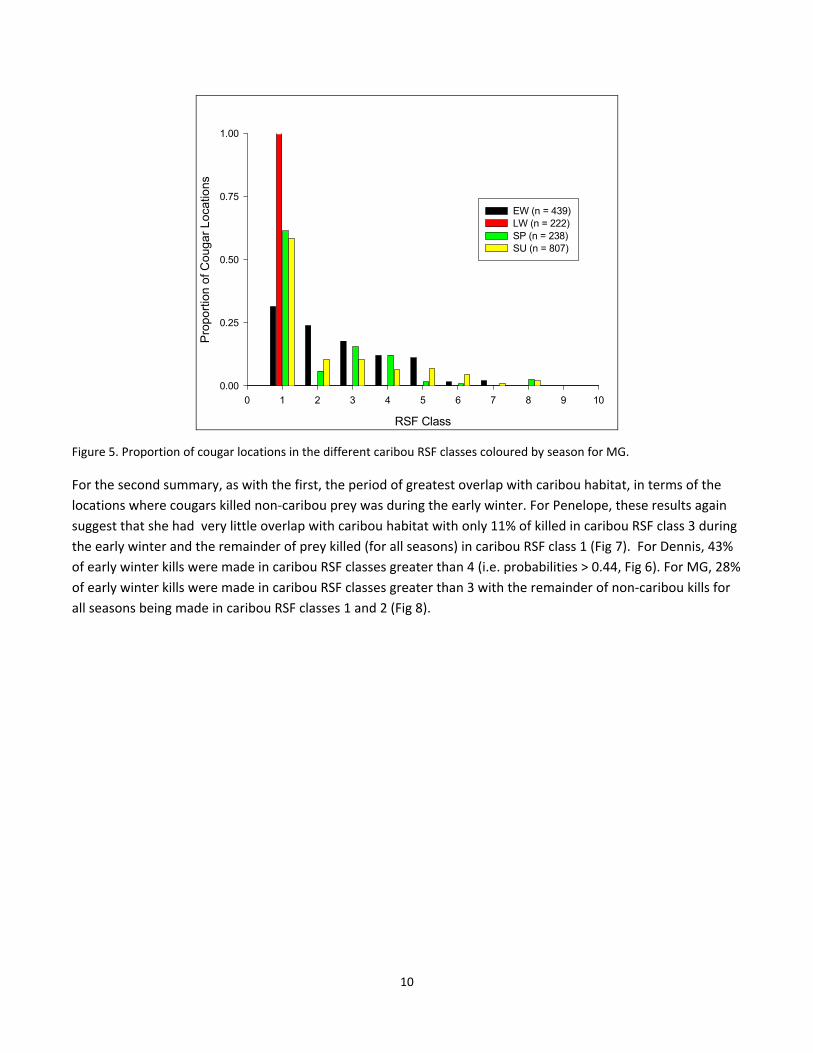
4.2 Cougar overlap with mountain caribou habitat. For our analyses of cougar overlap with caribou habitat, we grouped RSF values into classes (class 1 = 0‐0.11, 2 = 0.112‐0.22, 3 = 0.223‐0.33, 4 = 0.334‐0.44, 5 = 0.445‐0.55, 6 = 0.556‐0.66, 7 = 0.667‐0.77, 8 = 0.778‐0.88, and 9 = 0.889‐0.99) and provided 2 summaries: (1) a summary of cougar GPS locations based on their RSF value (Figures 3 – 5) and (2) a summary of non‐caribou cougar kill locations based on their RSF value (Figures 6 – 8). Results from the first summary found that all cougars overlapped greatest with caribou during the early winter season, however, for Penelope, only 5% of her early winter locations were in caribou RSF classes greater than 2 (4% in RSF class 3 and 1% in RSF class 5, Fig 4) with the remainder of her locations for all seasons in caribou RSF classes 1 and 2 (i.e. RSF probabilities < 0.22). Alternatively, for Dennis and MG, 41% and 27% of their early winter locations were in caribou RSF classes greater than 3 (i.e. RSF probabilities > 0.33) with 35% and 15% respectively in caribou RSF classes greater than 4 (i.e. RSF probabilities >0.44, Figures 3 and 5) for the two cougars respectively. Further, while the percentage of early winter locations for MG was less than that of Dennis, he overlapped more with caribou during other seasons with 17% of his spring locations, and 21% of his summer locations in caribou RSF values greater than class 3 (Fig 5), whereas Dennis spent 0% of his spring locations and only 11% of his summer locations in caribou RSF values greater than 0.334 (Fig 3). This data suggests that the sub‐adult male MG overlaps more with caribou habitat than either the adult male Dennis or the adult female Penelope.
8
RSF Class
0 1 2 3 4 5 6 7 8 9
Pro
port
ion
of C
ouga
r L
ocat
ions
0.00
0.25
0.50
0.75
1.00
EW (n = 193)LW (n = 611)SP (n = 258)SU (n = 1041)
Figure 3. Proportion of cougar locations in the different caribou RSF classes coloured by season for Dennis.
RSF Class
0 1 2 3 4 5 6 7 8 9
Pro
port
ion
of C
ouga
r L
ocat
ions
0.00
0.25
0.50
0.75
1.00
EW (n = 314)LW (n = 334)SP (n = 199)SU (n = 640)
Figure 4. Proportion of cougar locations in the different caribou RSF classes coloured by season for Penelope.
9
RSF Class
0 1 2 3 4 5 6 7 8 9 10
Pro
port
ion
of C
ouga
r L
ocat
ions
0.00
0.25
0.50
0.75
1.00
EW (n = 439)LW (n = 222)SP (n = 238)SU (n = 807)
Figure 5. Proportion of cougar locations in the different caribou RSF classes coloured by season for MG.
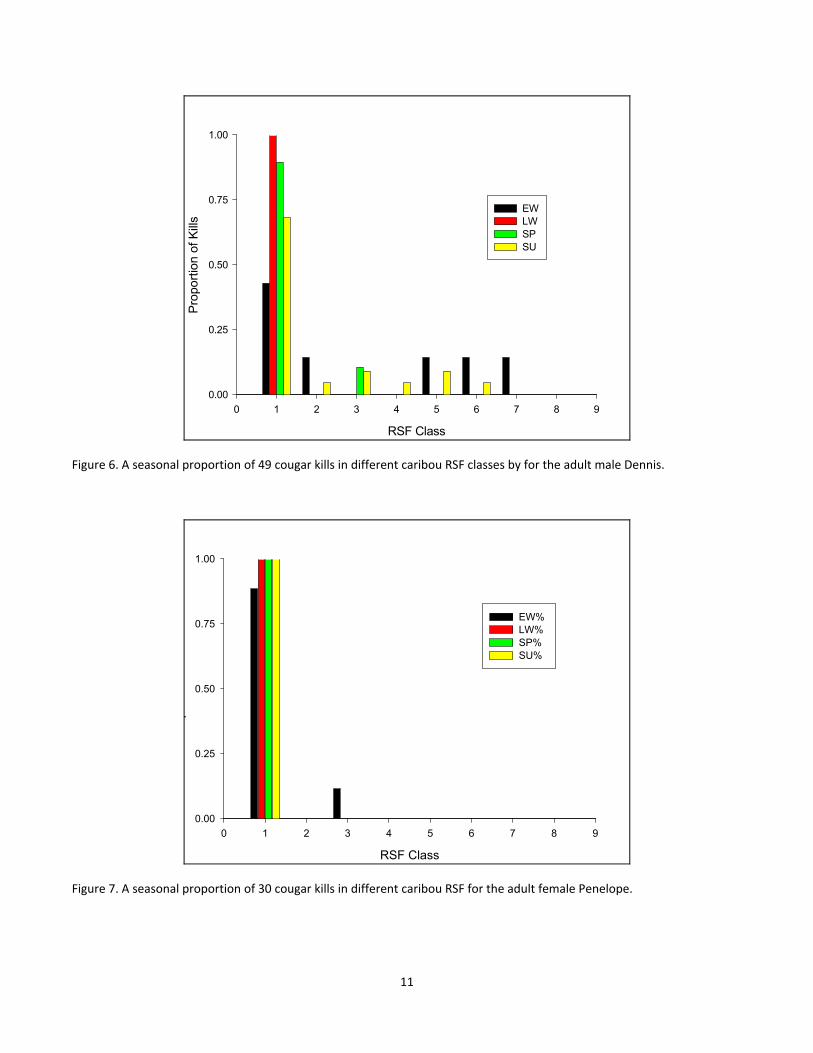
For the second summary, as with the first, the period of greatest overlap with caribou habitat, in terms of the
locations where cougars killed non‐caribou prey was during the early winter. For Penelope, these results again
suggest that she had very little overlap with caribou habitat with only 11% of killed in caribou RSF class 3 during
the early winter and the remainder of prey killed (for all seasons) in caribou RSF class 1 (Fig 7). For Dennis, 43%
of early winter kills were made in caribou RSF classes greater than 4 (i.e. probabilities > 0.44, Fig 6). For MG, 28%
of early winter kills were made in caribou RSF classes greater than 3 with the remainder of non‐caribou kills for
all seasons being made in caribou RSF classes 1 and 2 (Fig 8).
10
RSF Class
0 1 2 3 4 5 6 7 8 9
Pro
port
ion
of K
ills
0.00
0.25
0.50
0.75
1.00
EWLWSPSU
Figure 6. A seasonal proportion of 49 cougar kills in different caribou RSF classes by for the adult male Dennis.
RSF Class
0 1 2 3 4 5 6 7 8 9
p
0.00
0.25
0.50
0.75
1.00
EW% LW% SP% SU%
Figure 7. A seasonal proportion of 30 cougar kills in different caribou RSF for the adult female Penelope.
11
RSF Class
0 2 4 6 8 1
Per
cent
age
of K
ills
0
0.00
0.25
0.50
0.75
1.00
EWLWSPSU
Figure 8. A seasonal proportion of 19 non‐caribou cougar kills in different caribou RSF classes for the sub‐adult MG.
12
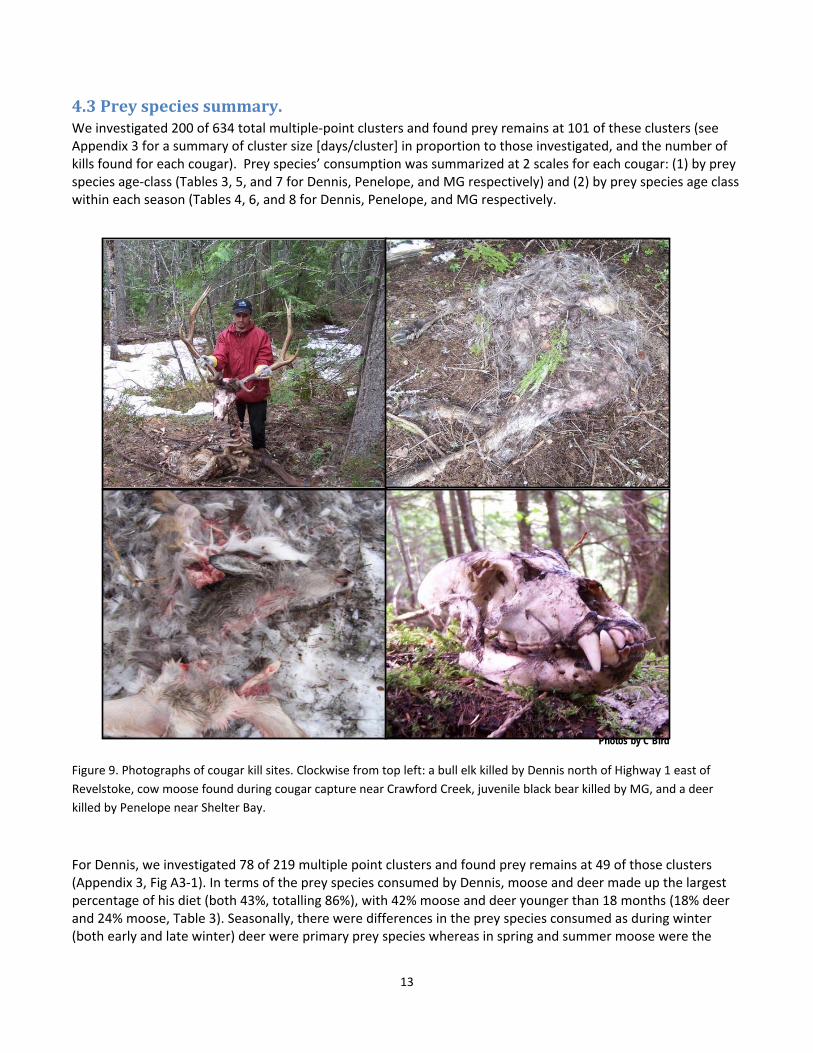
4.3 Prey species summary. We investigated 200 of 634 total multiple‐point clusters and found prey remains at 101 of these clusters (see Appendix 3 for a summary of cluster size [days/cluster] in proportion to those investigated, and the number of kills found for each cougar). Prey species’ consumption was summarized at 2 scales for each cougar: (1) by prey species age‐class (Tables 3, 5, and 7 for Dennis, Penelope, and MG respectively) and (2) by prey species age class within each season (Tables 4, 6, and 8 for Dennis, Penelope, and MG respectively.
Photos by C Bird
Figure 9. Photographs of cougar kill sites. Clockwise from top left: a bull elk killed by Dennis north of Highway 1 east of
Revelstoke, cow moose found during cougar capture near Crawford Creek, juvenile black bear killed by MG, and a deer
killed by Penelope near Shelter Bay.
For Dennis, we investigated 78 of 219 multiple point clusters and found prey remains at 49 of those clusters (Appendix 3, Fig A3‐1). In terms of the prey species consumed by Dennis, moose and deer made up the largest percentage of his diet (both 43%, totalling 86%), with 42% moose and deer younger than 18 months (18% deer and 24% moose, Table 3). Seasonally, there were differences in the prey species consumed as during winter (both early and late winter) deer were primary prey species whereas in spring and summer moose were the
13
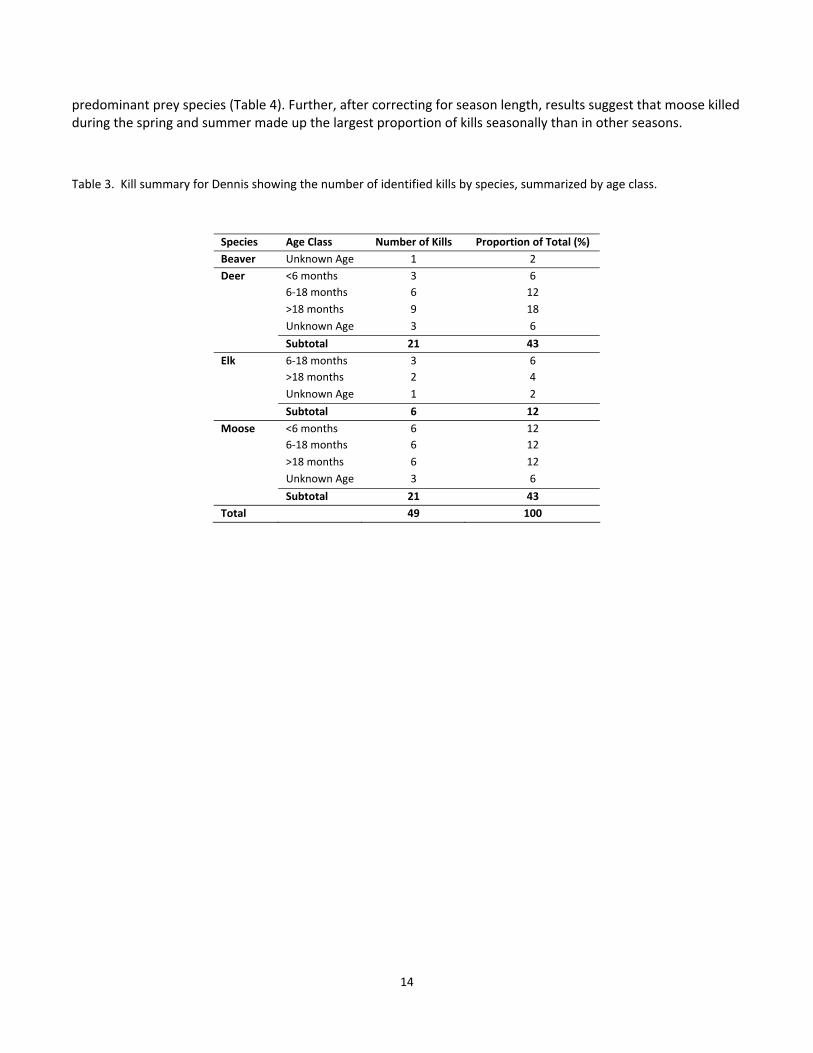
predominant prey species (Table 4). Further, after correcting for season length, results suggest that moose killed during the spring and summer made up the largest proportion of kills seasonally than in other seasons.
Table 3. Kill summary for Dennis showing the number of identified kills by species, summarized by age class.
Species Age Class Number of Kills Proportion of Total (%)
Beaver Unknown Age 1 2
Deer <6 months 3 6
6‐18 months 6 12
>18 months 9 18
Unknown Age 3 6
Subtotal 21 43
Elk 6‐18 months 3 6
>18 months 2 4
Unknown Age 1 2
Subtotal 6 12
Moose <6 months 6 12
6‐18 months 6 12
>18 months 6 12
Unknown Age 3 6
Subtotal 21 43
Total 49 100
14
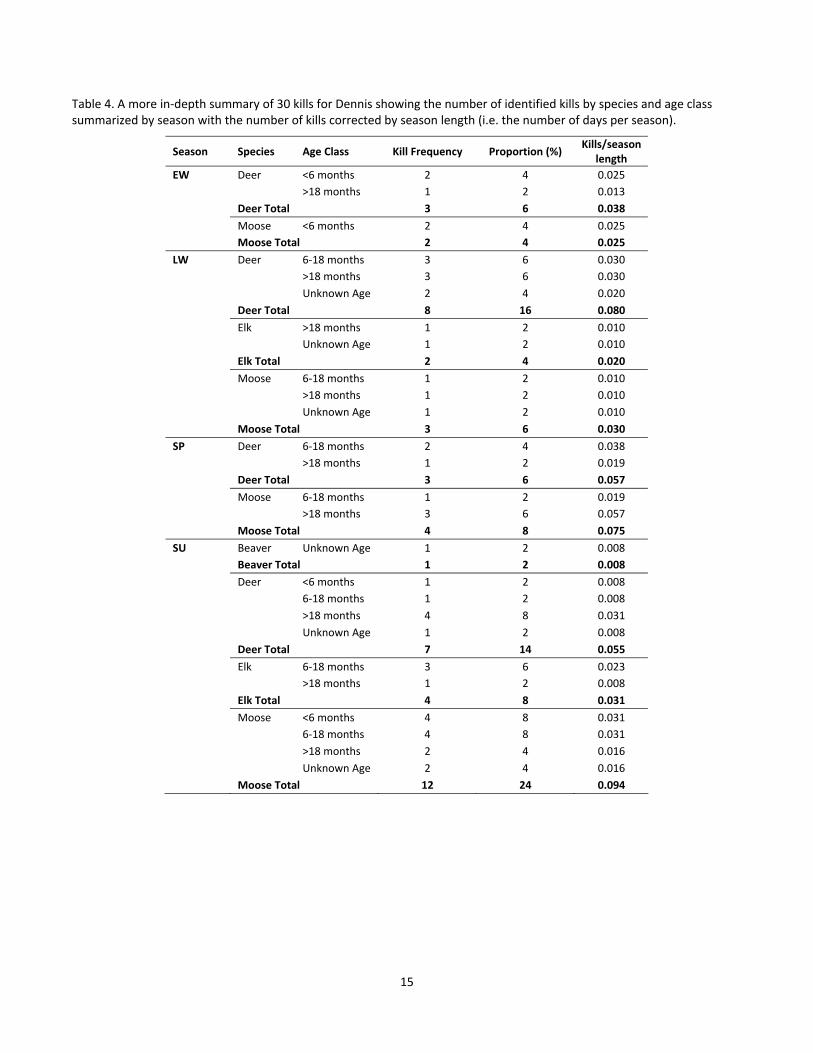
Table 4. A more in‐depth summary of 30 kills for Dennis showing the number of identified kills by species and age class summarized by season with the number of kills corrected by season length (i.e. the number of days per season).
Season Species Age Class Kill Frequency Proportion (%) Kills/season
length
EW Deer <6 months 2 4 0.025
>18 months 1 2 0.013
Deer Total 3 6 0.038
Moose <6 months 2 4 0.025
Moose Total 2 4 0.025
LW Deer 6‐18 months 3 6 0.030
>18 months 3 6 0.030
Unknown Age 2 4 0.020
Deer Total 8 16 0.080
Elk >18 months 1 2 0.010
Unknown Age 1 2 0.010
Elk Total 2 4 0.020
Moose 6‐18 months 1 2 0.010
>18 months 1 2 0.010
Unknown Age 1 2 0.010
Moose Total 3 6 0.030
SP Deer 6‐18 months 2 4 0.038
>18 months 1 2 0.019
Deer Total 3 6 0.057
Moose 6‐18 months 1 2 0.019
>18 months 3 6 0.057
Moose Total 4 8 0.075
SU Beaver Unknown Age 1 2 0.008
Beaver Total 1 2 0.008
Deer <6 months 1 2 0.008
6‐18 months 1 2 0.008
>18 months 4 8 0.031
Unknown Age 1 2 0.008
Deer Total 7 14 0.055
Elk 6‐18 months 3 6 0.023
>18 months 1 2 0.008
Elk Total 4 8 0.031
Moose <6 months 4 8 0.031
6‐18 months 4 8 0.031
>18 months 2 4 0.016
Unknown Age 2 4 0.016
Moose Total 12 24 0.094
15

For Penelope, we investigated 51 of 194 clusters and found prey remains at 30 clusters (see Appendix 3, Fig A3‐2 for cluster summary). In terms of the prey species consumed by Penelope, deer made up the predominant prey species (87%) of the confirmed kill sites we investigated, and to a lesser extent, young neonate moose < 6 months old (10%). Seasonally, young deer less than 18 months appear to be the predominant prey in spring and summer, whereas deer older than 18 months comprise the larger proportion of prey during the winter (both early and late winter, Table 6).
Table 5. A summary of 30 kills for Penelope showing the number of identified kills by species, summarized by age class for all seasons.
Species Species (Age l )
Number of Kills Proportion (%)
Deer <6 months 1 3
6‐18 months 8 27
>18 months 7 23
Unknown Age 10 33
Subtotal 26 87
Moose <6 months 3 10
>18 months 1* 3
Subtotal 4 13
Total 30 100
*scavenge of a road‐killed moose
Table 6. A more in‐depth summary of 30 kills for Penelope showing the number of identified kills by species and age class summarized by season with the number of kills corrected by season length (i.e. the number of days per season).
Season Species Age Class # of Kills Proportion (%) kills/season
length
EW Deer 6‐18 months 1 3.3 0.013
Deer Unknown Age 6 20.0 0.075
Deer Total 7 23.3 0.088
Moose >18 months 1* 3.3 0.013
Moose Total 1 3.3 0.013
LW Deer 6‐18 months 1 3.3 0.010
Deer >18 months 3 10.0 0.030
Deer Total 4 13.3 0.040
SP Deer 6‐18 months 6 20.0 0.113
Deer >18 months 4 13.3 0.075
Deer Unknown Age 2 6.7 0.038
Deer Total 12 40.0 0.226
Moose < 6 months 1 3.3 0.019
Moose Total 1 3.3 0.019
SU Deer < 6 months 1 3.3 0.008
Deer Unknown Age 2 6.7 0.016
Deer Total 3 10.0 0.023
Moose < 6 months 2 6.7 0.016
Moose Total 2 6.7 0.016
*scavenge of a road‐killed moose
16
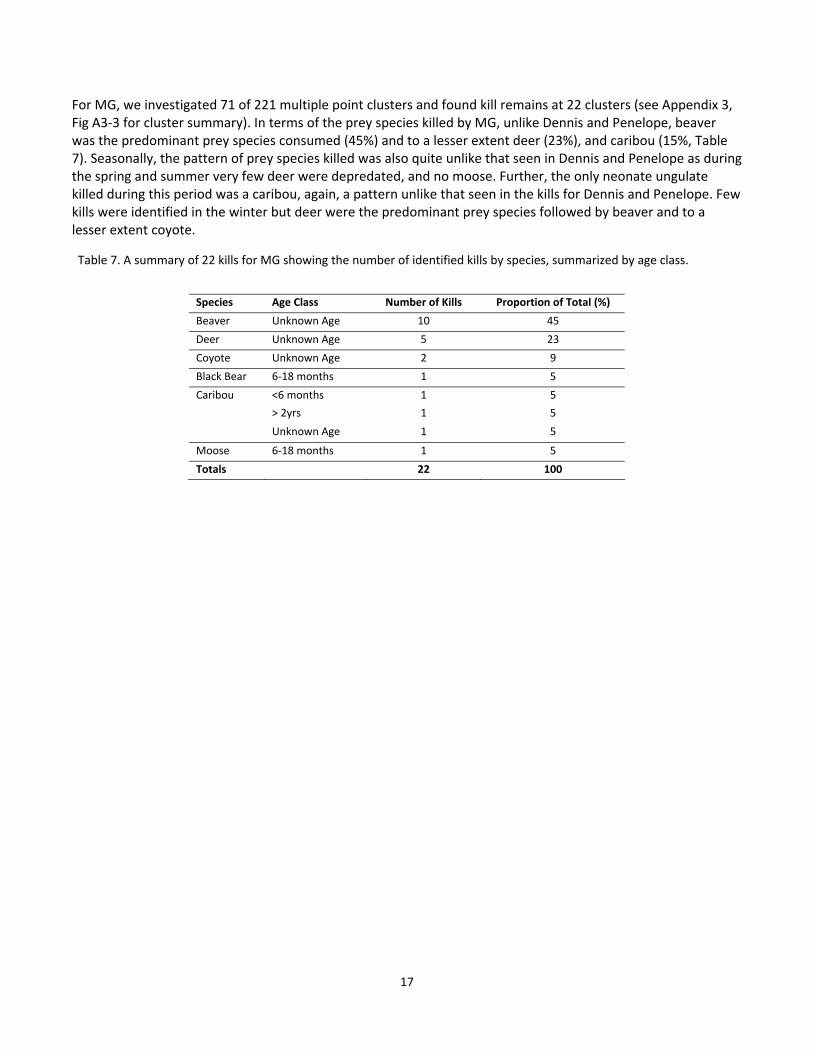
For MG, we investigated 71 of 221 multiple point clusters and found kill remains at 22 clusters (see Appendix 3, Fig A3‐3 for cluster summary). In terms of the prey species killed by MG, unlike Dennis and Penelope, beaver was the predominant prey species consumed (45%) and to a lesser extent deer (23%), and caribou (15%, Table 7). Seasonally, the pattern of prey species killed was also quite unlike that seen in Dennis and Penelope as during the spring and summer very few deer were depredated, and no moose. Further, the only neonate ungulate killed during this period was a caribou, again, a pattern unlike that seen in the kills for Dennis and Penelope. Few kills were identified in the winter but deer were the predominant prey species followed by beaver and to a lesser extent coyote.
Table 7. A summary of 22 kills for MG showing the number of identified kills by species, summarized by age class.
Species Age Class Number of Kills Proportion of Total (%)
Beaver Unknown Age 10 45
Deer Unknown Age 5 23
Coyote Unknown Age 2 9
Black Bear 6‐18 months 1 5
Caribou <6 months 1 5
> 2yrs 1 5
Unknown Age 1 5
Moose 6‐18 months 1 5
Totals 22 100
17
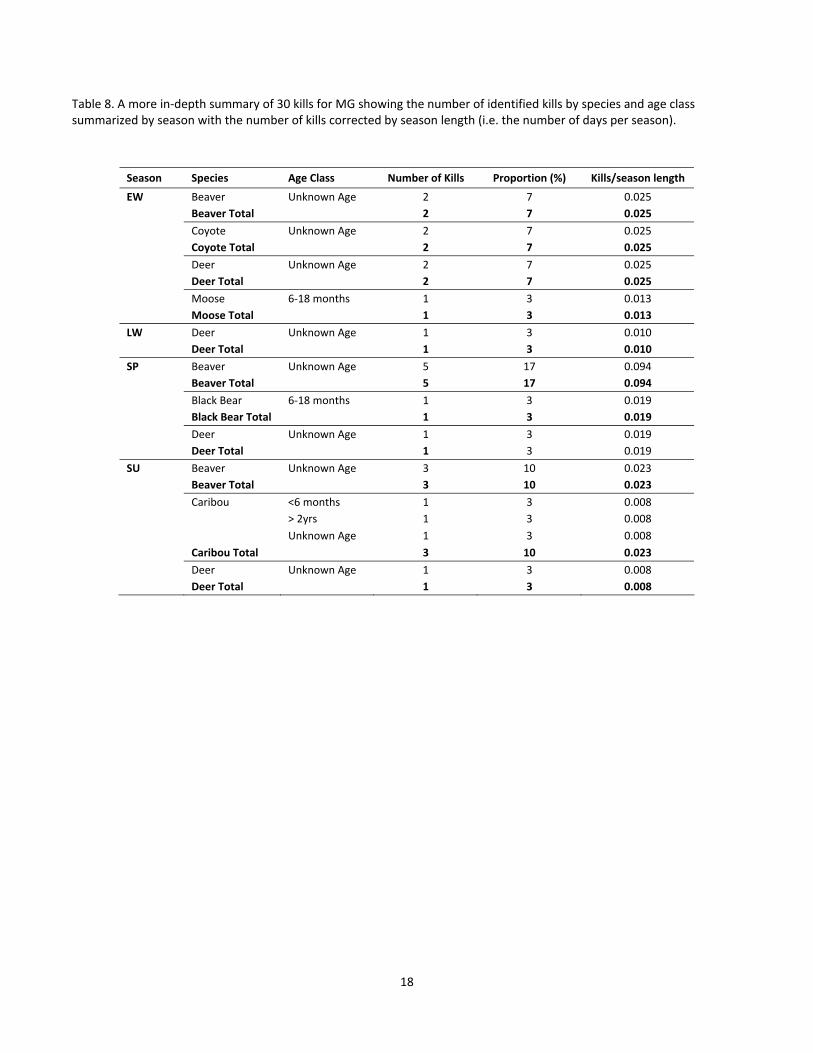
Table 8. A more in‐depth summary of 30 kills for MG showing the number of identified kills by species and age class summarized by season with the number of kills corrected by season length (i.e. the number of days per season).
Season Species Age Class Number of Kills Proportion (%) Kills/season length
EW Beaver Unknown Age 2 7 0.025
Beaver Total 2 7 0.025
Coyote Unknown Age 2 7 0.025
Coyote Total 2 7 0.025
Deer Unknown Age 2 7 0.025
Deer Total 2 7 0.025
Moose 6‐18 months 1 3 0.013
Moose Total 1 3 0.013
LW Deer Unknown Age 1 3 0.010
Deer Total 1 3 0.010
SP Beaver Unknown Age 5 17 0.094
Beaver Total 5 17 0.094
Black Bear 6‐18 months 1 3 0.019
Black Bear Total 1 3 0.019
Deer Unknown Age 1 3 0.019
Deer Total 1 3 0.019
SU Beaver Unknown Age 3 10 0.023
Beaver Total 3 10 0.023
Caribou <6 months 1 3 0.008
> 2yrs 1 3 0.008
Unknown Age 1 3 0.008
Caribou Total 3 10 0.023
Deer Unknown Age 1 3 0.008
Deer Total 1 3 0.008
18
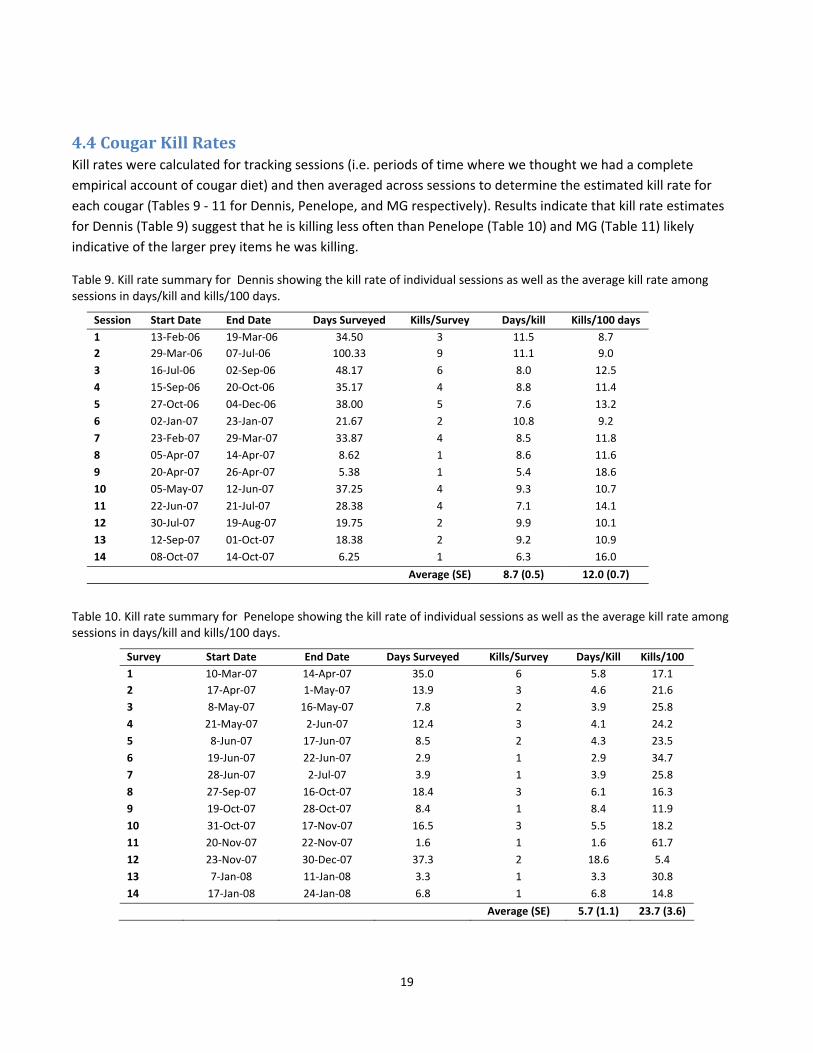
4.4 Cougar Kill Rates Kill rates were calculated for tracking sessions (i.e. periods of time where we thought we had a complete
empirical account of cougar diet) and then averaged across sessions to determine the estimated kill rate for
each cougar (Tables 9 ‐ 11 for Dennis, Penelope, and MG respectively). Results indicate that kill rate estimates
for Dennis (Table 9) suggest that he is killing less often than Penelope (Table 10) and MG (Table 11) likely
indicative of the larger prey items he was killing.
Table 9. Kill rate summary for Dennis showing the kill rate of individual sessions as well as the average kill rate among sessions in days/kill and kills/100 days.
Session Start Date End Date Days Surveyed Kills/Survey Days/kill Kills/100 days
1 13‐Feb‐06 19‐Mar‐06 34.50 3 11.5 8.7
2 29‐Mar‐06 07‐Jul‐06 100.33 9 11.1 9.0
3 16‐Jul‐06 02‐Sep‐06 48.17 6 8.0 12.5
4 15‐Sep‐06 20‐Oct‐06 35.17 4 8.8 11.4
5 27‐Oct‐06 04‐Dec‐06 38.00 5 7.6 13.2
6 02‐Jan‐07 23‐Jan‐07 21.67 2 10.8 9.2
7 23‐Feb‐07 29‐Mar‐07 33.87 4 8.5 11.8
8 05‐Apr‐07 14‐Apr‐07 8.62 1 8.6 11.6
9 20‐Apr‐07 26‐Apr‐07 5.38 1 5.4 18.6
10 05‐May‐07 12‐Jun‐07 37.25 4 9.3 10.7
11 22‐Jun‐07 21‐Jul‐07 28.38 4 7.1 14.1
12 30‐Jul‐07 19‐Aug‐07 19.75 2 9.9 10.1
13 12‐Sep‐07 01‐Oct‐07 18.38 2 9.2 10.9
14 08‐Oct‐07 14‐Oct‐07 6.25 1 6.3 16.0
Average (SE) 8.7 (0.5) 12.0 (0.7)
Table 10. Kill rate summary for Penelope showing the kill rate of individual sessions as well as the average kill rate among sessions in days/kill and kills/100 days.
Survey Start Date End Date Days Surveyed Kills/Survey Days/Kill Kills/100
1 10‐Mar‐07 14‐Apr‐07 35.0 6 5.8 17.1
2 17‐Apr‐07 1‐May‐07 13.9 3 4.6 21.6
3 8‐May‐07 16‐May‐07 7.8 2 3.9 25.8
4 21‐May‐07 2‐Jun‐07 12.4 3 4.1 24.2
5 8‐Jun‐07 17‐Jun‐07 8.5 2 4.3 23.5
6 19‐Jun‐07 22‐Jun‐07 2.9 1 2.9 34.7
7 28‐Jun‐07 2‐Jul‐07 3.9 1 3.9 25.8
8 27‐Sep‐07 16‐Oct‐07 18.4 3 6.1 16.3
9 19‐Oct‐07 28‐Oct‐07 8.4 1 8.4 11.9
10 31‐Oct‐07 17‐Nov‐07 16.5 3 5.5 18.2
11 20‐Nov‐07 22‐Nov‐07 1.6 1 1.6 61.7
12 23‐Nov‐07 30‐Dec‐07 37.3 2 18.6 5.4
13 7‐Jan‐08 11‐Jan‐08 3.3 1 3.3 30.8
14 17‐Jan‐08 24‐Jan‐08 6.8 1 6.8 14.8
Average (SE) 5.7 (1.1) 23.7 (3.6)
19
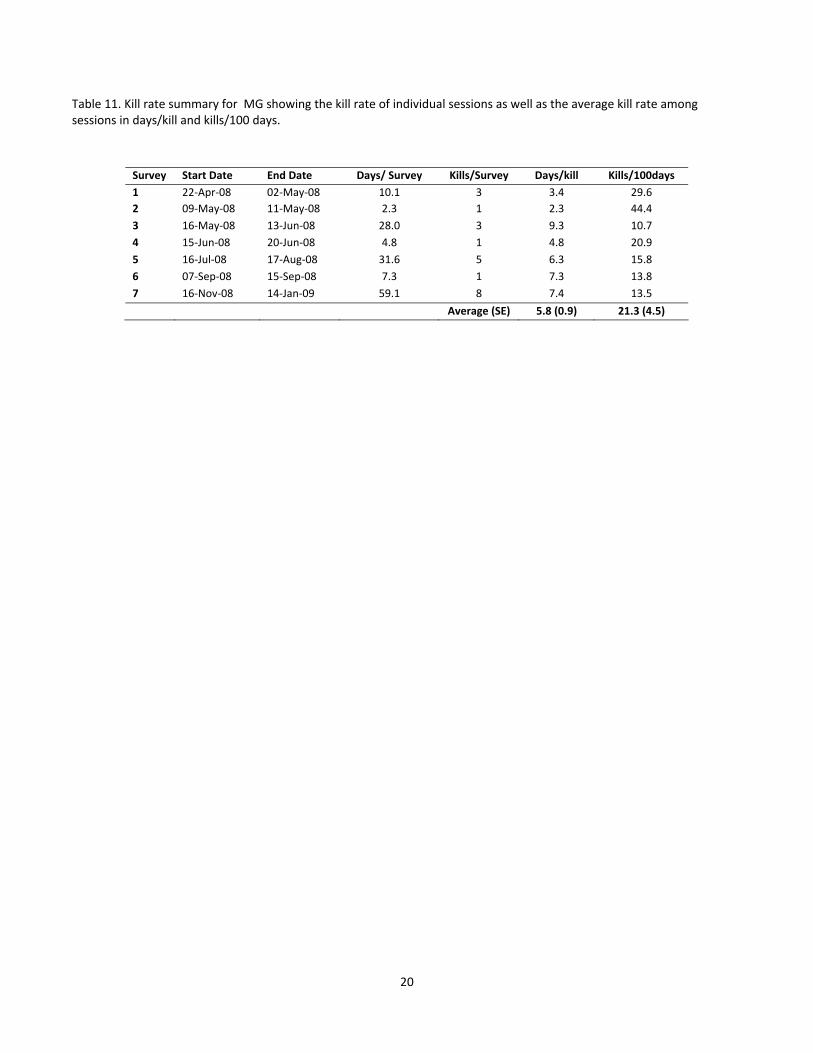
Table 11. Kill rate summary for MG showing the kill rate of individual sessions as well as the average kill rate among sessions in days/kill and kills/100 days.
Survey Start Date End Date Days/ Survey Kills/Survey Days/kill Kills/100days
1 22‐Apr‐08 02‐May‐08 10.1 3 3.4 29.6
2 09‐May‐08 11‐May‐08 2.3 1 2.3 44.4
3 16‐May‐08 13‐Jun‐08 28.0 3 9.3 10.7
4 15‐Jun‐08 20‐Jun‐08 4.8 1 4.8 20.9
5 16‐Jul‐08 17‐Aug‐08 31.6 5 6.3 15.8
6 07‐Sep‐08 15‐Sep‐08 7.3 1 7.3 13.8
7 16‐Nov‐08 14‐Jan‐09 59.1 8 7.4 13.5
Average (SE) 5.8 (0.9) 21.3 (4.5)
20
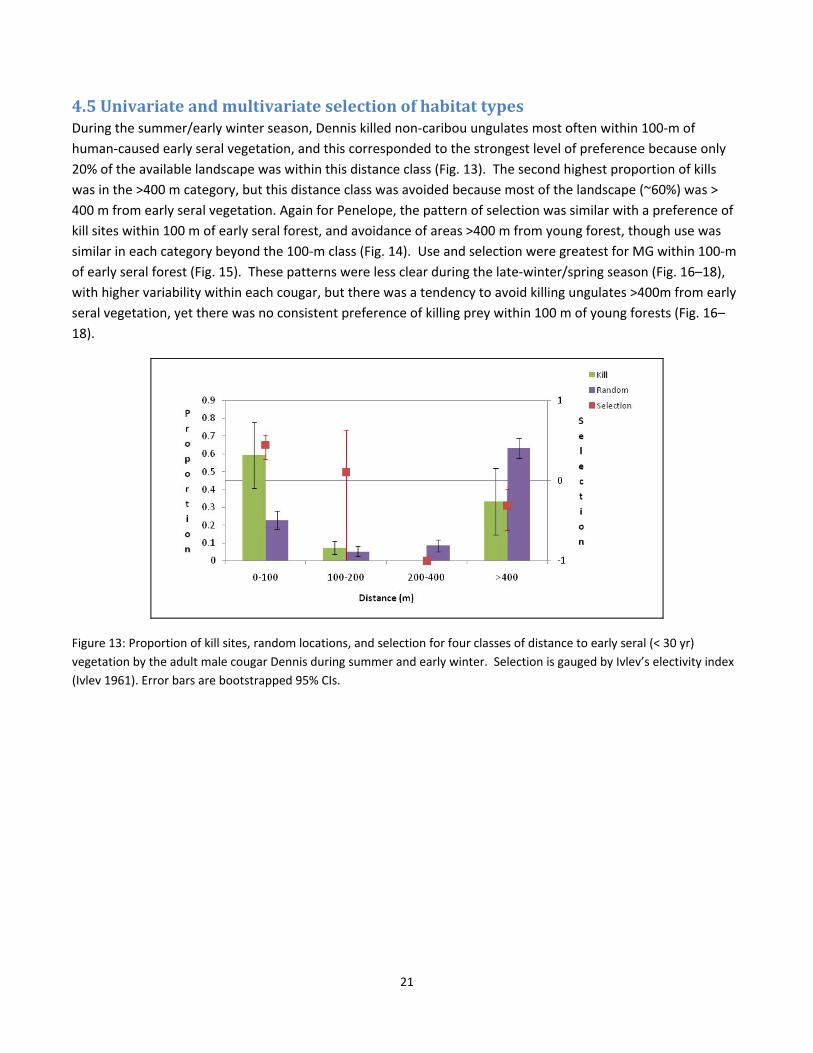
4.5 Univariate and multivariate selection of habitat types During the summer/early winter season, Dennis killed non‐caribou ungulates most often within 100‐m of
human‐caused early seral vegetation, and this corresponded to the strongest level of preference because only
20% of the available landscape was within this distance class (Fig. 13). The second highest proportion of kills
was in the >400 m category, but this distance class was avoided because most of the landscape (~60%) was >
400 m from early seral vegetation. Again for Penelope, the pattern of selection was similar with a preference of
kill sites within 100 m of early seral forest, and avoidance of areas >400 m from young forest, though use was
similar in each category beyond the 100‐m class (Fig. 14). Use and selection were greatest for MG within 100‐m
of early seral forest (Fig. 15). These patterns were less clear during the late‐winter/spring season (Fig. 16–18),
with higher variability within each cougar, but there was a tendency to avoid killing ungulates >400m from early
seral vegetation, yet there was no consistent preference of killing prey within 100 m of young forests (Fig. 16–
18).
Figure 13: Proportion of kill sites, random locations, and selection for four classes of distance to early seral (< 30 yr)
vegetation by the adult male cougar Dennis during summer and early winter. Selection is gauged by Ivlev’s electivity index
(Ivlev 1961). Error bars are bootstrapped 95% CIs.
21

Figure 14. Proportion of kill sites, random locations, and selection for four classes of distance to early seral (<30 yr)
vegetation by the female cougar Penelope during summer and early winter. Selection is gauged by Ivlev’s electivity index
(Ivlev 1961). Error bars are bootstrapped 95% CIs.
Figure 15. Proportion of kill sites, random locations, and selection for four classes of distance to early seral (<30 yr)
vegetation by the sub‐adult male MG during summer and early winter. Selection is gauged by Ivlev’s electivity index (Ivlev
1961). Error bars are bootstrapped 95% CIs.
22
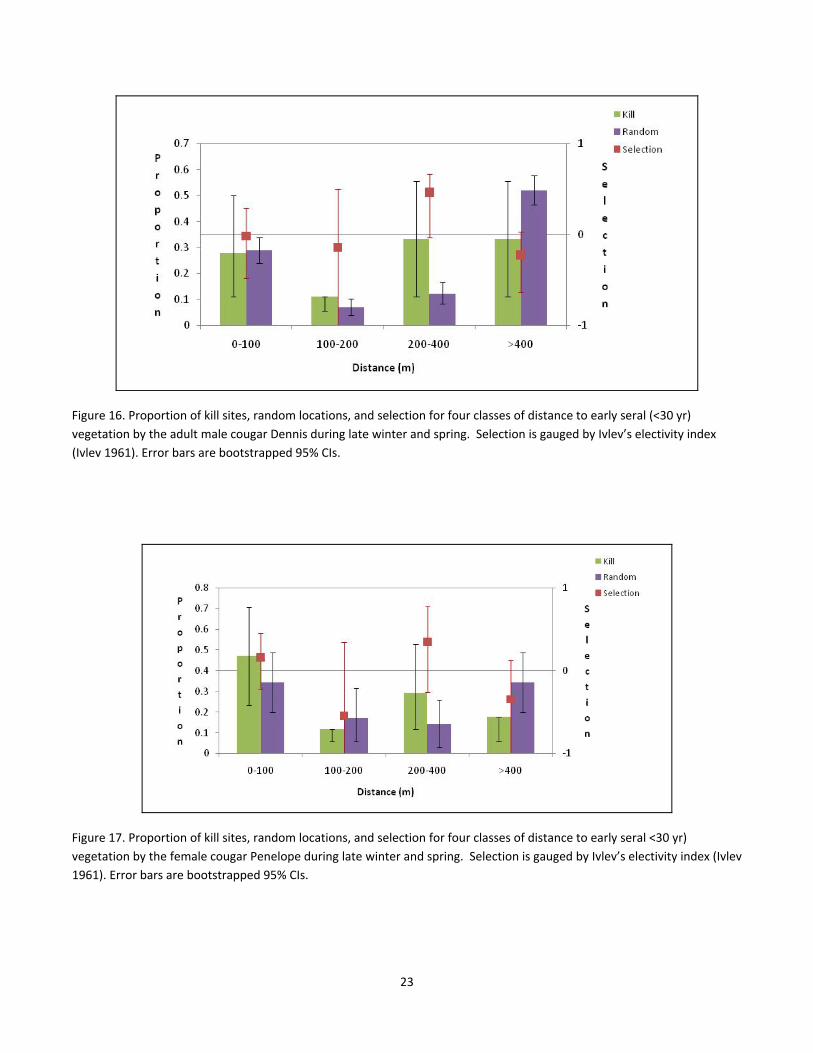
Figure 16. Proportion of kill sites, random locations, and selection for four classes of distance to early seral (<30 yr)
vegetation by the adult male cougar Dennis during late winter and spring. Selection is gauged by Ivlev’s electivity index
(Ivlev 1961). Error bars are bootstrapped 95% CIs.
Figure 17. Proportion of kill sites, random locations, and selection for four classes of distance to early seral <30 yr)
vegetation by the female cougar Penelope during late winter and spring. Selection is gauged by Ivlev’s electivity index (Ivlev
1961). Error bars are bootstrapped 95% CIs.
23
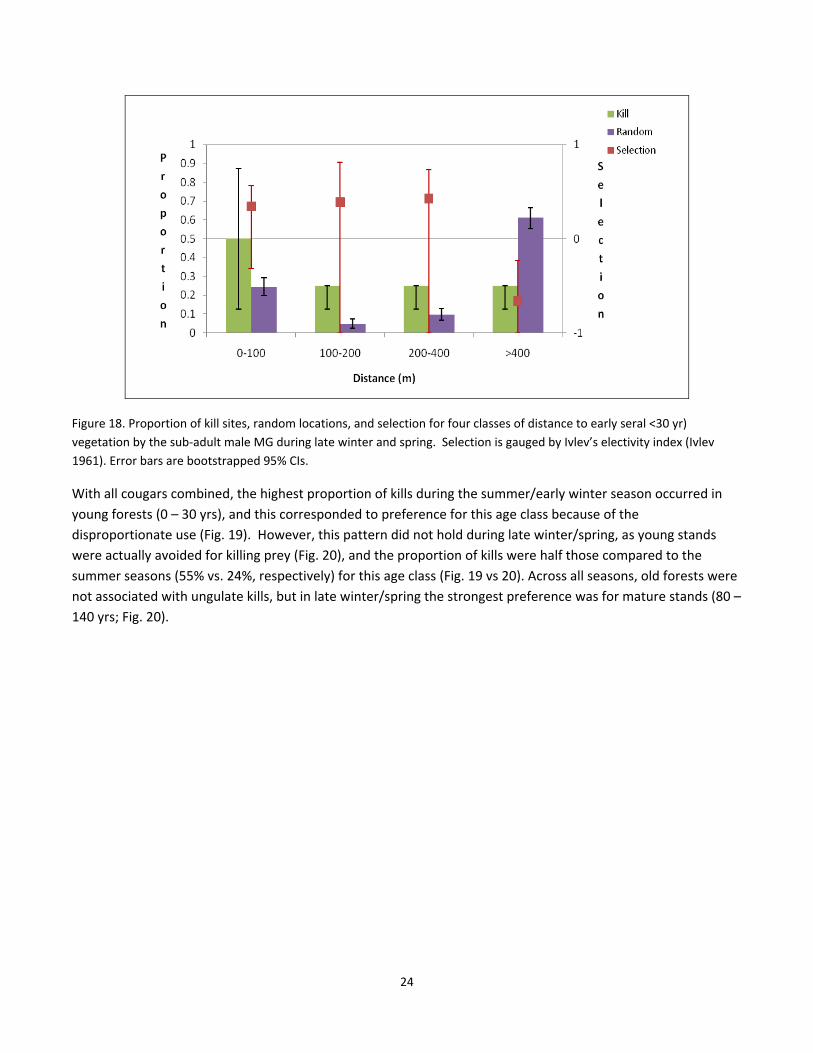
Figure 18. Proportion of kill sites, random locations, and selection for four classes of distance to early seral <30 yr)
vegetation by the sub‐adult male MG during late winter and spring. Selection is gauged by Ivlev’s electivity index (Ivlev
1961). Error bars are bootstrapped 95% CIs.
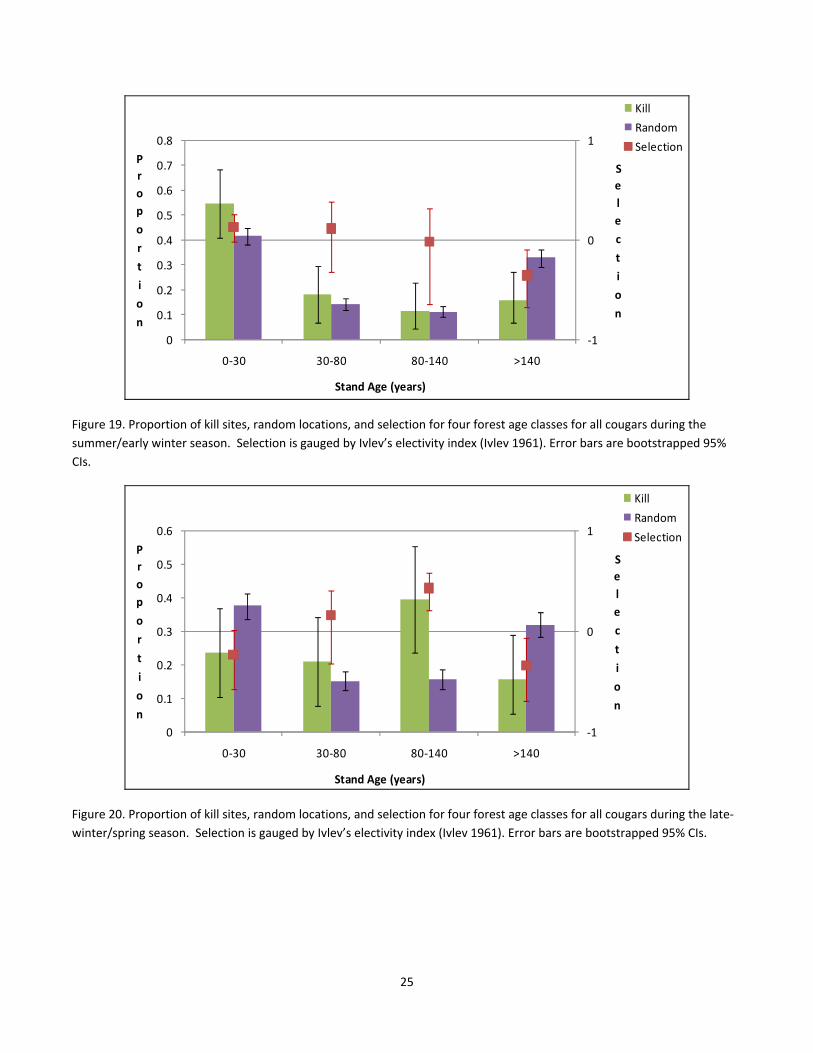
With all cougars combined, the highest proportion of kills during the summer/early winter season occurred in
young forests (0 – 30 yrs), and this corresponded to preference for this age class because of the
disproportionate use (Fig. 19). However, this pattern did not hold during late winter/spring, as young stands
were actually avoided for killing prey (Fig. 20), and the proportion of kills were half those compared to the
summer seasons (55% vs. 24%, respectively) for this age class (Fig. 19 vs 20). Across all seasons, old forests were
not associated with ungulate kills, but in late winter/spring the strongest preference was for mature stands (80 –
140 yrs; Fig. 20).
24
‐1
0
1
0
0.1
0.2
0.3
0.4
0.5
0.6
0.7
0.8
0‐30 30‐80 80‐140 >140
S
e
l
e
c
t
i
o
n
P
r
o
p
o
r
t
i
o
n
Stand Age (years)
Kill
Random
Selection
Figure 19. Proportion of kill sites, random locations, and selection for four forest age classes for all cougars during the
summer/early winter season. Selection is gauged by Ivlev’s electivity index (Ivlev 1961). Error bars are bootstrapped 95%
CIs.
‐1
0
1
0
0.1
0.2
0.3
0.4
0.5
0.6
0‐30 30‐80 80‐140 >140
S
e
l
e
c
t
i
o
n
P
r
o
p
o
r
t
i
o
n
Stand Age (years)
Kill
Random
Selection
Figure 20. Proportion of kill sites, random locations, and selection for four forest age classes for all cougars during the late‐
winter/spring season. Selection is gauged by Ivlev’s electivity index (Ivlev 1961). Error bars are bootstrapped 95% CIs.
25
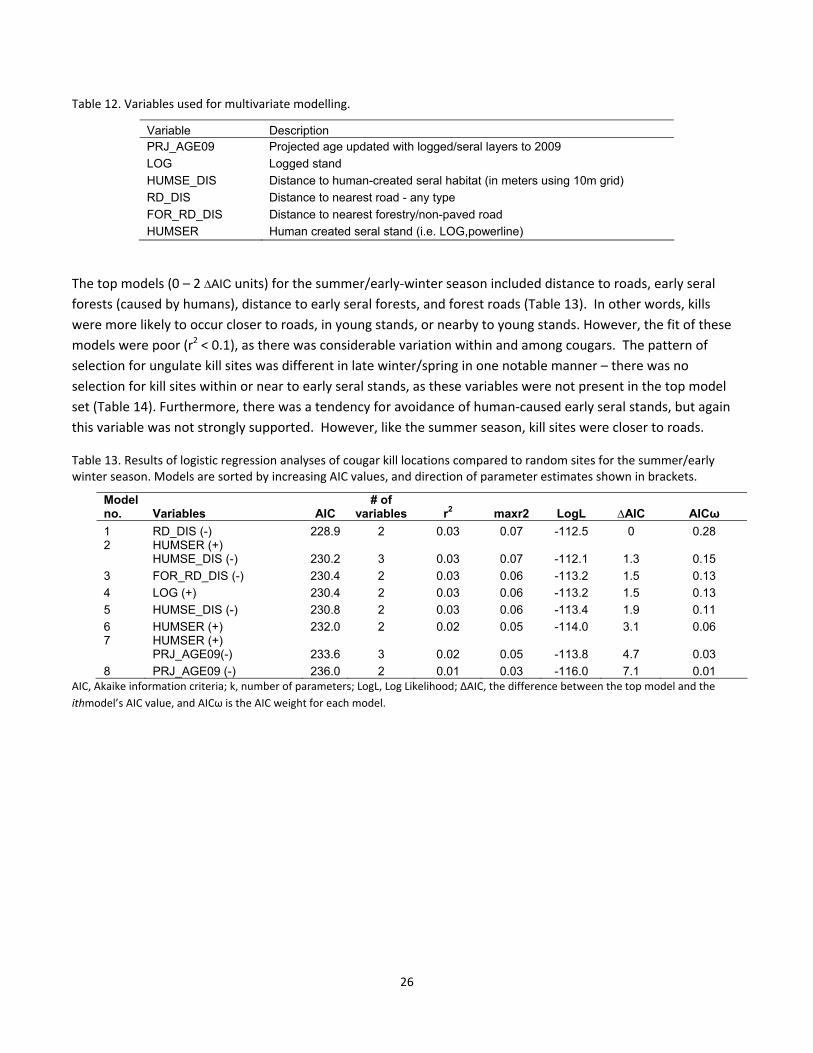
Table 12. Variables used for multivariate modelling.
Variable Description PRJ_AGE09 Projected age updated with logged/seral layers to 2009
LOG Logged stand
HUMSE_DIS Distance to human-created seral habitat (in meters using 10m grid)
RD_DIS Distance to nearest road - any type
FOR_RD_DIS Distance to nearest forestry/non-paved road
HUMSER Human created seral stand (i.e. LOG,powerline)
The top models (0 – 2 ∆AIC units) for the summer/early‐winter season included distance to roads, early seral
forests (caused by humans), distance to early seral forests, and forest roads (Table 13). In other words, kills
were more likely to occur closer to roads, in young stands, or nearby to young stands. However, the fit of these
models were poor (r2 < 0.1), as there was considerable variation within and among cougars. The pattern of
selection for ungulate kill sites was different in late winter/spring in one notable manner – there was no
selection for kill sites within or near to early seral stands, as these variables were not present in the top model
set (Table 14). Furthermore, there was a tendency for avoidance of human‐caused early seral stands, but again
this variable was not strongly supported. However, like the summer season, kill sites were closer to roads.
Table 13. Results of logistic regression analyses of cougar kill locations compared to random sites for the summer/early winter season. Models are sorted by increasing AIC values, and direction of parameter estimates shown in brackets.
Model no. Variables AIC
# of variables r2 maxr2 LogL ∆AIC AICω
1 RD_DIS (-) 228.9 2 0.03 0.07 -112.5 0 0.28 2 HUMSER (+)
HUMSE_DIS (-) 230.2 3 0.03 0.07 -112.1 1.3 0.15
3 FOR_RD_DIS (-) 230.4 2 0.03 0.06 -113.2 1.5 0.13
4 LOG (+) 230.4 2 0.03 0.06 -113.2 1.5 0.13
5 HUMSE_DIS (-) 230.8 2 0.03 0.06 -113.4 1.9 0.11
6 HUMSER (+) 232.0 2 0.02 0.05 -114.0 3.1 0.06 7 HUMSER (+)
PRJ_AGE09(-) 233.6 3 0.02 0.05 -113.8 4.7 0.03
8 PRJ_AGE09 (-) 236.0 2 0.01 0.03 -116.0 7.1 0.01 AIC, Akaike information criteria; k, number of parameters; LogL, Log Likelihood; ∆AIC, the difference between the top model and the
ithmodel’s AIC value, and AICω is the AIC weight for each model.
26
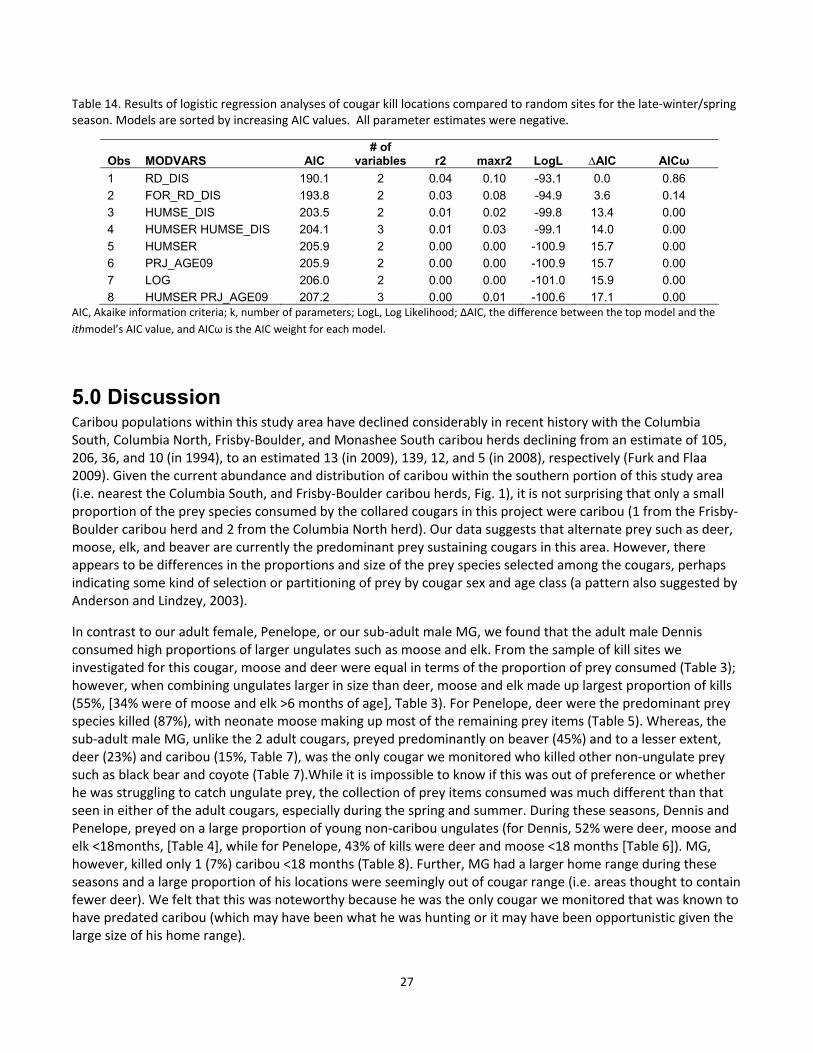
Table 14. Results of logistic regression analyses of cougar kill locations compared to random sites for the late‐winter/spring season. Models are sorted by increasing AIC values. All parameter estimates were negative.
AIC, Akaike information criteria; k, number of parameters; LogL, Log Likelihood; ∆AIC, the difference between the top model and the
ithmodel’s AIC value, and AICω is the AIC weight for each model.
Obs MODVARS AIC # of
variables r2 maxr2 LogL ∆AIC AICω
1 RD_DIS 190.1 2 0.04 0.10 -93.1 0.0 0.86
2 FOR_RD_DIS 193.8 2 0.03 0.08 -94.9 3.6 0.14
3 HUMSE_DIS 203.5 2 0.01 0.02 -99.8 13.4 0.00
4 HUMSER HUMSE_DIS 204.1 3 0.01 0.03 -99.1 14.0 0.00
5 HUMSER 205.9 2 0.00 0.00 -100.9 15.7 0.00
6 PRJ_AGE09 205.9 2 0.00 0.00 -100.9 15.7 0.00
7 LOG 206.0 2 0.00 0.00 -101.0 15.9 0.00
8 HUMSER PRJ_AGE09 207.2 3 0.00 0.01 -100.6 17.1 0.00
5.0 Discussion Caribou populations within this study area have declined considerably in recent history with the Columbia South, Columbia North, Frisby‐Boulder, and Monashee South caribou herds declining from an estimate of 105, 206, 36, and 10 (in 1994), to an estimated 13 (in 2009), 139, 12, and 5 (in 2008), respectively (Furk and Flaa 2009). Given the current abundance and distribution of caribou within the southern portion of this study area (i.e. nearest the Columbia South, and Frisby‐Boulder caribou herds, Fig. 1), it is not surprising that only a small proportion of the prey species consumed by the collared cougars in this project were caribou (1 from the Frisby‐Boulder caribou herd and 2 from the Columbia North herd). Our data suggests that alternate prey such as deer, moose, elk, and beaver are currently the predominant prey sustaining cougars in this area. However, there appears to be differences in the proportions and size of the prey species selected among the cougars, perhaps indicating some kind of selection or partitioning of prey by cougar sex and age class (a pattern also suggested by Anderson and Lindzey, 2003).
In contrast to our adult female, Penelope, or our sub‐adult male MG, we found that the adult male Dennis consumed high proportions of larger ungulates such as moose and elk. From the sample of kill sites we investigated for this cougar, moose and deer were equal in terms of the proportion of prey consumed (Table 3); however, when combining ungulates larger in size than deer, moose and elk made up largest proportion of kills (55%, [34% were of moose and elk >6 months of age], Table 3). For Penelope, deer were the predominant prey species killed (87%), with neonate moose making up most of the remaining prey items (Table 5). Whereas, the sub‐adult male MG, unlike the 2 adult cougars, preyed predominantly on beaver (45%) and to a lesser extent, deer (23%) and caribou (15%, Table 7), was the only cougar we monitored who killed other non‐ungulate prey such as black bear and coyote (Table 7).While it is impossible to know if this was out of preference or whether he was struggling to catch ungulate prey, the collection of prey items consumed was much different than that seen in either of the adult cougars, especially during the spring and summer. During these seasons, Dennis and Penelope, preyed on a large proportion of young non‐caribou ungulates (for Dennis, 52% were deer, moose and elk <18months, [Table 4], while for Penelope, 43% of kills were deer and moose <18 months [Table 6]). MG, however, killed only 1 (7%) caribou <18 months (Table 8). Further, MG had a larger home range during these seasons and a large proportion of his locations were seemingly out of cougar range (i.e. areas thought to contain fewer deer). We felt that this was noteworthy because he was the only cougar we monitored that was known to have predated caribou (which may have been what he was hunting or it may have been opportunistic given the large size of his home range).
27
In addition to the 3 known caribou kills from MG in this study, our data also suggests that the cougars we monitored did in fact overlap with caribou habitat during certain periods of the year based on the caribou RSF (Figures 3 – 8). The caribou RSF is based on VHF and GPS telemetry locations from radio‐collared caribou (collected between 1992 and 2007) and is considered a relative ranking of habitat quality for caribou during a certain period of the year. Higher RSF classes represent specific habitats that have a greater probability of containing caribou and thus, may be considered as being higher quality or more preferred by caribou during certain periods of the year. Hence, overlaying cougar GPS location data provided us with the means of determining the relative overlap with caribou habitat as well as the relative predation risk to caribou in those habitats for a given season. Furthermore, overlaying the locations of our (non‐caribou) cougar kills provides us with the means of determining where alternative prey are being killed in relation to caribou habitat quality for a given season. By overlaying cougar locations on the caribou RSF maps (Fig. 3 – 5), we see that the majority of locations for all seasons are in lower‐quality caribou habitat. However, our data also suggests that the period of greatest overlap is the early winter, and to a lesser extent, the spring and summer, (Fig. 3 ‐ 5) which, suggests that caribou are at risk of being predated during those seasons. By monitoring radio‐collared caribou in our study area, Wittmer et al. (2005) also found that caribou died from predation most often during the non‐winter seasons, reflecting the greatest degree of overlap between predators and caribou during these seasons. One may also infer from this data that cougars are searching for caribou in these areas during certain seasons and, given the 3 confirmed kills by our sub‐adult male MG, this may be the case. However, given the low abundances of caribou in many areas within the home ranges of the collared cougars in this study, this appears unlikely as there are so few caribou remaining in these areas for cougars to hunt. What seems more plausible is that cougars are searching for alternate prey species in higher quality caribou habitat, a theory which may be partially supported through our overlay of non‐caribou cougar kill locations with caribou RSF data.
Our data suggests that the larger proportion of non‐caribou cougar kill locations are in lower quality caribou habitat, but that prey are in fact being killed in higher quality caribou habitat during certain seasons. Again, our data for this comparison suggests that the period of greatest overlap with cougars killing non‐caribou prey is during the early‐winter and to a lesser extent, the summer (primarily for the adult male Dennis, Fig. 6). Furthermore, the pattern seems again to be more prevalent with our male cougars, Dennis and MG (Fig. 6 and 8 respectively), than with our female, Penelope (Fig. 7). While this difference between sexes may seem significant or even likely given the larger home ranges of the collared males, it may just be coincidental given the location of Penelope’s home range. The GPS locations for Penelope (Appendix 1, Fig. A1‐2), almost entirely consists of low‐elevation habitats southwest of Revelstoke BC, and very few of her locations are near to the area thought to be occupied by the Monashee caribou subpopulation. In addition to suggesting that cougars prey predominantly on alternative prey, our data also provides insight into the type of habitats cougars select for in killing prey.
While based on a limited number of cougars, our data suggests that cougars select younger forests as well as areas close to young forests (i.e. cutting units) during certain periods for killing prey. In summer/early‐winter the highest proportion of non‐caribou ungulate kills occurred in forests less than 30 years of age (Fig. 19) or in stands within 100 m of these young forests (Fig. 13‐15), and a pattern of avoidance of areas greater than 400m from young forests as shown through our univariate comparisons. This pattern was strongly consistent among cougars for the SU/EW season, but not so for the LW/SP seasons where results were more variable, but during all seasons cougars avoided killing prey in old (>140 yr) forests. Moose and deer are not often found in old forests because of a lack of forage (Serrouya and D’Eon 2002, 2008). Furthermore, our multivariate modelling revealed that kills were more likely to occur in areas close to roads, in cutting units, and near young forests (Table 13) during the summer/early winter season. Again though, this pattern was less clear during the late‐winter/spring season, were cougars were not killing their ungulate prey near or in cutting units but were killing them near roads. The highest proportion of ungulate kills during late winter/spring occurred in stands that were 80‐140 yr old. During the deep snow periods that correspond to the late winter season, Serrouya and
28

D’Eon (2008) found that deer were rarely found in cutting units but instead were found in mature stands. Therefore, the monitoring of predator kills sites confirms what was found by other research that focussed on monitoring prey. In summary, deer and moose in summer are often found in early seral stands (i.e. cutting units and hydroelectric powerlines), and this is where they were killed by cougars, but in winter, deer in particular are found in mature stands (80 – 140 yr), and this is where we found most cougar kills during this deep‐snow season.
Given that we are summarizing data for only 3 GPS collared cougars, each in a unique age or sex class (i.e. 1 adult male, 1 adult female/family group, and 1 sub‐adult male) we feel it difficult to make conclusive inferences as to how cougar populations interact with the various caribou sub‐populations in the Columbia Mountains. Further, since much of the caribou decline and extirpation from areas within the study area had occurred prior to this research (McLellan et al. 2008), our insight as to how cougars interact with caribou and their habitat becomes retrospective in nature. Nonetheless, we feel that we that we have gained insight into what sustains cougar populations in this area. While small, our dataset suggests that alternate ungulates make up the predominant prey species for cougars in this area which suggest at least partial credence to the “apparent‐competition hypothesis” (Bergerud 1974; Seip 1992; Bergerud 1996; Bergerud and Elliot 1998). Even though caribou make up a small proportion of the cougars’ diet, this low predation rate on caribou can still be enough to negatively impact caribou because cougar numbers are decoupled from caribou abundance, as expected from the apparent competition hypothesis. Further, while we consider cougar densities to be low in this area, there are currently sufficient densities of alternate prey to sustain cougars. Also, even one specialist cougar can have significant impacts on small ungulate populations such as sheep or caribou once a search image is developed (Festa‐Bianchet et al. 2006). We believe that further monitoring of cougar densities in this area is necessary to determine the long‐term trend of cougar populations and that significant reductions to alternate prey would be required if the goal is to keep cougars out of caribou habitat.
29
6.0 Acknowledgements This project has been funded by the Fish & Wildlife Compensation Program – Columbia Basin with cash support
from the Columbia Mountains Caribou Recovery Research Project. Special thanks to Dave Mair of Silvertip
Aviation for locating the collared cougars and enabling the collection of GPS collar download data. John Krebs,
Gary Pavan, Harry van Oort, Kelsey Furk, and John Flaa for technical and logistical assistance and advice. Thanks
to Sheri and Gerald Fulco, for special care of our hounds and to Thomas Hill, Patrick Stent, and John Townley for
their field assistance as well as our hounds Emmitt and April for taking their jobs seriously in all conditions.
Thanks also to Gary Pavan and Amy Waterhouse for GIS support and Beth Woodbridge for administrative
support.
Photo by C. Bird
30
7.0 References . Anderson, C.R. and F.G. Lindzey. 2003. Estimating cougar predation rates from GPS location clusters. Journal of
Wildlife Management 67(2): 307‐316. Apps, C.D., B.N. McLellan, T.A. Kinley, and J.P. Flaa. 2001. Scale‐dependent habitat selection by Mountain
Caribou, Columbia Mountains, British Columbia. Journal of Wildlife Management. 65(1): 65‐77.
Apps, C.D. and B.N. McLellan. 2006. Factors influencing the dispersion and fragmentation of endangered mountain caribou populations. Biological Conservation. 130 (1): 84 – 97.
Bergerud, A.T. 1974. Decline of caribou in North America following settlement. Journal of Wildlife Management
38(4):757‐770. Bergerud, A.T. 1996.Evolving perspectives on caribou population dynamics, have we got it right yet? Rangifer
Spec. Issue, 9:95‐116. Bergerud, A.T. and J.P. Elliot. 1998. Wolf predation in a multiple‐ungulate system in northern British Columbia.
Canadian Journal of Zoology 76(8):1551‐1569. Braumandl, T.F. and M.P. Curran. 1992. A field guide for site identification and interpretation for the Nelson
Forest Region. Research Branch, BC Ministry of Forests, Victoria, B.C. 311pp. Clarke, R.S., R.D. Lewis, and C.E. Bird. 2007. Revelstoke cougar ecology and predation 2006‐2007 progress
report. Report prepared for the Columbia Basin Fish and Wildlife Compensation Program. Nelson, BC.
Clarke, R.S. 2003. Characteristics of a hunted population of cougars in the South Selkirk Mountains of British
Columbia. Report prepared for the Columbia Basin Fish and Wildlife Compensation Program. Nelson, BC.
Festa‐Bianchet, M., Coulson, T., Gaillard J. M., Hogg, J. T., & Pelletier, F. 2006. Stochastic predation events and
population persistence in bighorn sheep. – Proceedings of the Royal Society B‐Biological Sciences 273:
1537–1543.
Furk, K and J.P. Flaa. 2009. Population censuses of caribou in the north Columbia Mountains, Columbia South
subpopulation. Report prepared for Parks Canada.
Furk, K. M. McLellan, R. Serrouya. 2009. Condition indices of caribou (Rangifer tarandus caribou) found at
mortality sites in the North Columbia Mountains of British Columbia. Prepared for the Ministry of
Forests and Range, Revelstoke, BC.
Hebblewhite, M., P.C. Paquet, D.H. Pletscher, R.B. Lessard, and C.J. Callaghan. 2003. Development and Application of a Ratio Estimator to Estimate Wolf Kill Rates and Variance in a Multiple‐Prey System. Wildlife Society Bulletin, 31(4): 933‐946.
Holt, R. D. 1977. Predation, apparent competition and the structure of prey communities. Theoretical Population Biology 12:197–229.
31
Knopff, K.H., A.A. Knopff, M.B. Warren, and M.S. Boyce. Evaluating Global Positioning System Telemetry
Techniques for Estimating Cougar Predation Parameters. 2009. Journal of Wildlife Management.73(4):
586‐597.
Lewis, R.D. 2008. Cougar and cougar track investigations in Valemount British Columbia in early January 2008.
Report prepared for the Columbia Basin Fish and Wildlife Compensation Program. Nelson, BC.
Lewis, R.D. and R.S. Clarke. 2007. Revelstoke cougar project procedures and safety. Report prepared for the
Columbia Basin Fish and Wildlife Compensation Program. Nelson, BC.
McLellan, B. R. Serrouya, and K.Furk. 2008. Population censuses of caribou in the North Columbia Mountains. April 2008. Prepared for the Ministry of Environment, Nelson, BC.
Seip, D.R. 1992. Factors limiting woodland caribou populations and their interrelationships with wolves and
moose in southeastern British Columbia. Canadian Journal of Zoology 70(8):1494‐1503. Serrouya, R. and R.G. D’Eon. 2002. Moose habitat selection in relation to forest harvesting in a deep snow zone
of British Columbia. Downie Sawmills Ltd. Serrouya, R. 2004. Draft Revelstoke caribou recovery research
project – research and monitoring plan. Internal Report. Revelstoke, BC.
Serrouya, R., and R.G. D’Eon. 2008. The influence of forest cover on mule deer habitat selection, diet, and nutrition during winter in a deep‐snow ecosystem. Forest Ecology and Management, 256:452–461.
Wang, T., A. Hamann, D.L. Spittlehouse and S.N. Aitken. 2006. Development of scale‐free climate data for
western Canada for use in resource management. Intl. J. Climatology, 26 (3): 383‐397.
Wittmer, H.U. 2004. Mechanisms underlying the decline of mountain caribou (Rangifer tarandus caribou) in British Columbia [Ph.D.]. Vancouver: University of British Columbia. 104pp.
Wittmer, H.U., A.R.E. Sinclair, and B.N. McLellan. 2005a. The role of predation in the decline and extirpation of
woodland caribou. Oecologia 144: 257‐267. Wittmer, H.U., McLellan, B.N., Seip, D.R., Young, J.A., Kinley, T.A., Watts, G.S., & Hamilton, D. 2005b. Population
dynamics of the endangered mountain ecotype of woodland caribou (Rangifer tarandus caribou) in British Columbia, Canada. Canadian Journal of Zoology 83, 407–418.
Wittmer, H.U., B.N. McLellan, R. Serrouya, C.D. Apps. 2007. Changes in landscape composition influence the
decline of a threatened woodland caribou population. Journal of Animal Ecology. 76 (3): 568 – 579. Worton, B.J. 1989. Kernel methods for estimating the utilization distribution in home‐range studies. Ecology 70:
164‐168.
Van Oort, H., C.E. Bird, G. Mowat. 2010. Winter predator census results in the Kootenay‐Columbia Caribou
Recovery Areas from 2006 to 2009. Prepared for the Ministry of Envirnment, Nelson, BC.
32
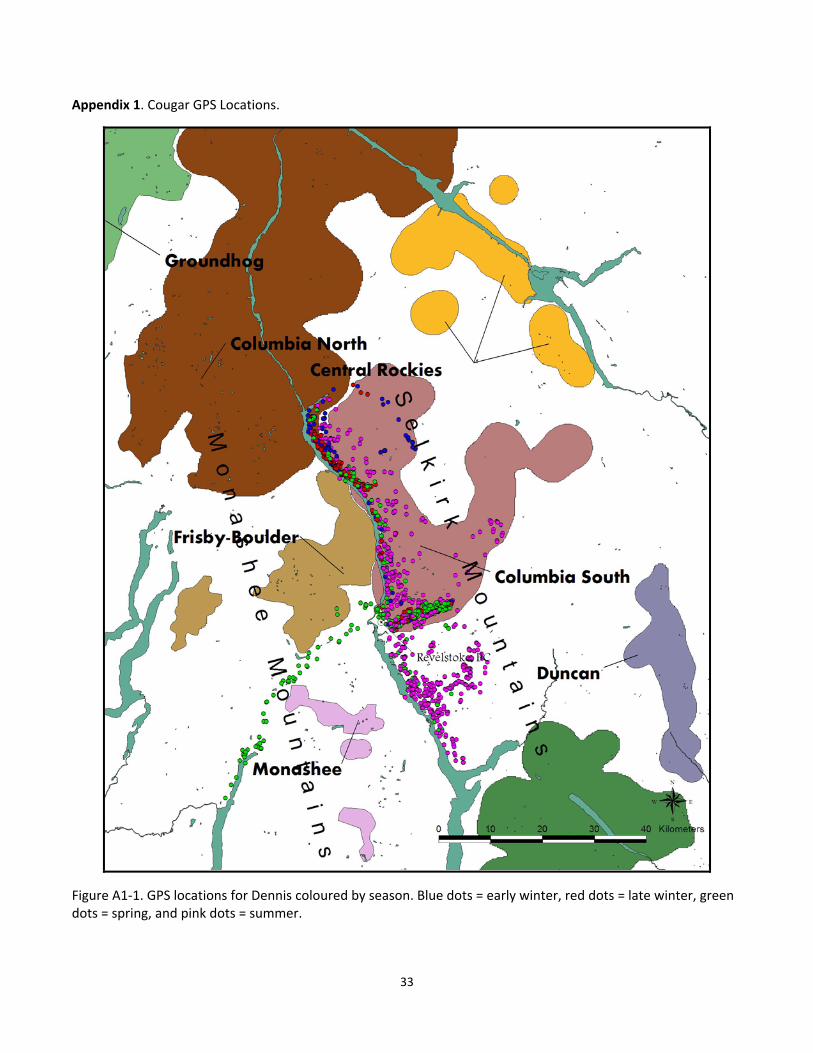
Appendix 1. Cougar GPS Locations.
Figure A1‐1. GPS locations for Dennis coloured by season. Blue dots = early winter, red dots = late winter, green dots = spring, and pink dots = summer.
33
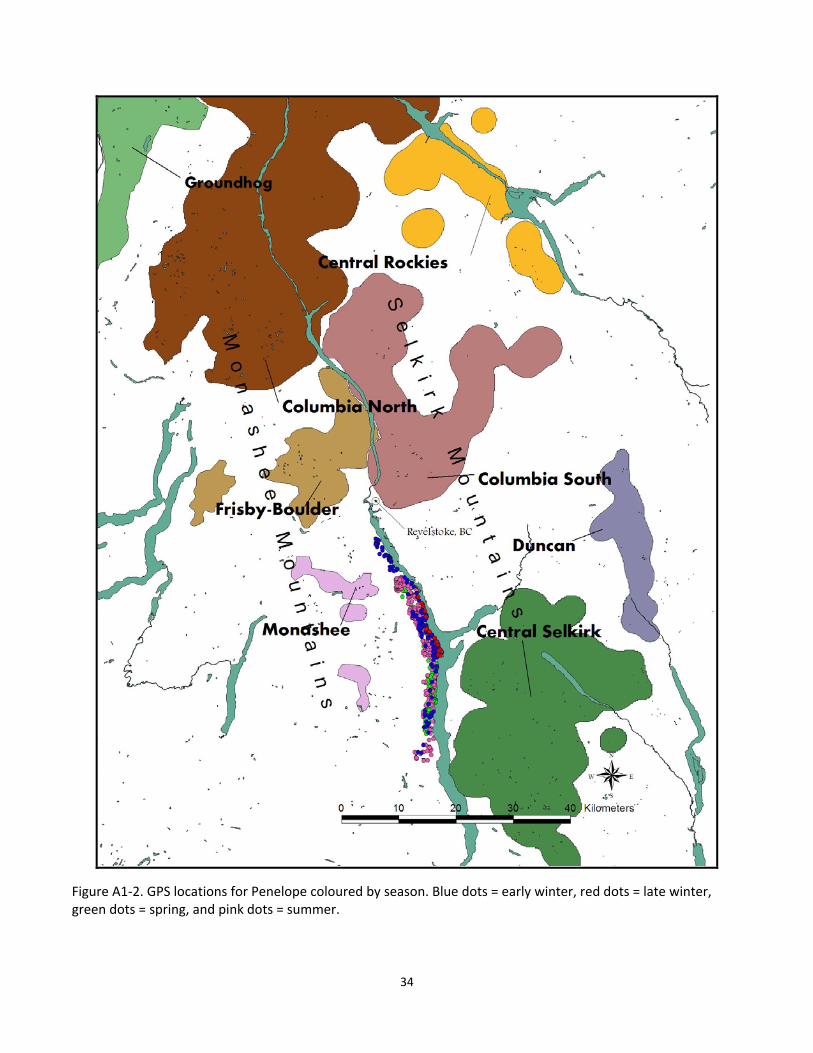
Figure A1‐2. GPS locations for Penelope coloured by season. Blue dots = early winter, red dots = late winter, green dots = spring, and pink dots = summer.
34
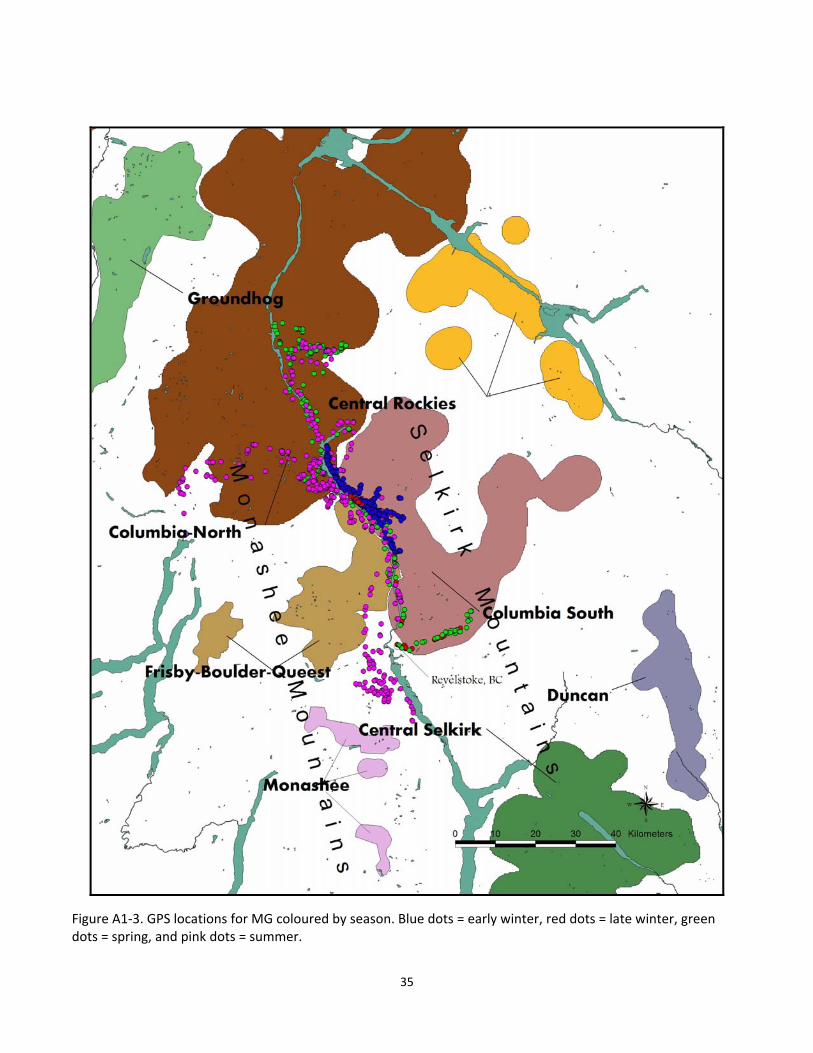
Figure A1‐3. GPS locations for MG coloured by season. Blue dots = early winter, red dots = late winter, green dots = spring, and pink dots = summer.
35
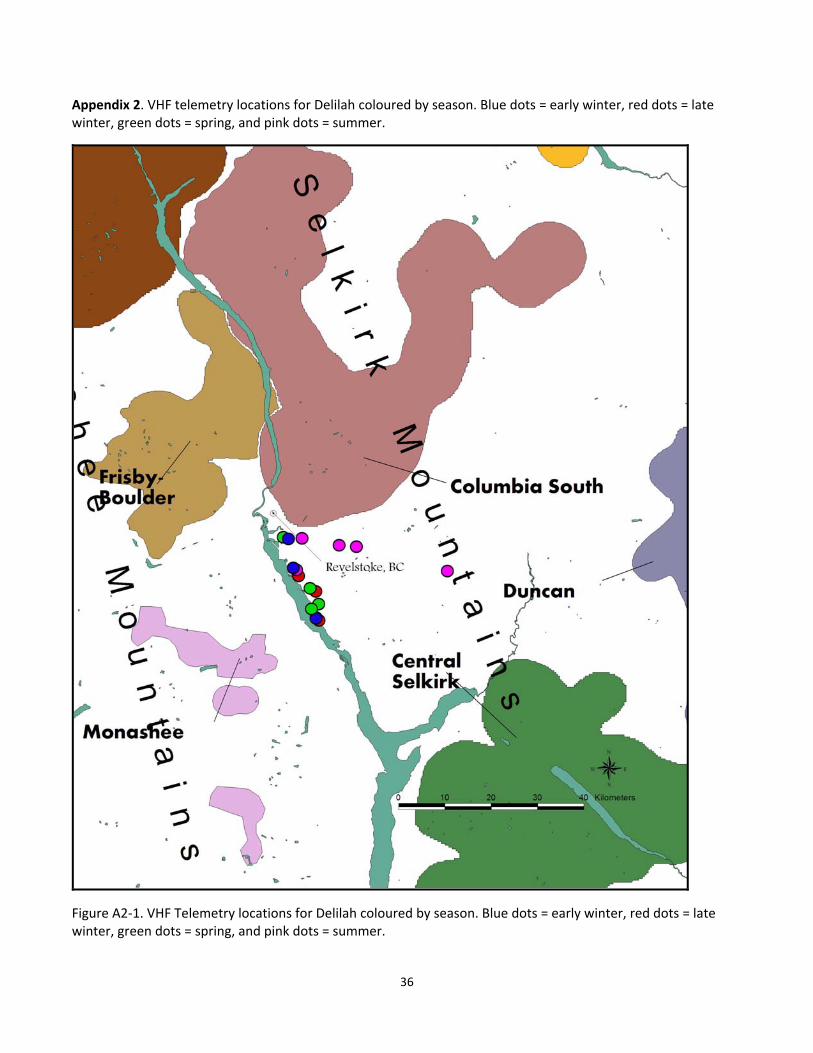
Appendix 2. VHF telemetry locations for Delilah coloured by season. Blue dots = early winter, red dots = late winter, green dots = spring, and pink dots = summer.
Figure A2‐1. VHF Telemetry locations for Delilah coloured by season. Blue dots = early winter, red dots = late winter, green dots = spring, and pink dots = summer.
36
Appendix 3
Cluster Size (days/cluster)0-0.5 0.5-1.0 1-2 2-3 3-4 4-5 5-6 6-7 7-11
# of
clu
ster
s
0
20
40
120
140
160
Total Clusters Total Investigated Clusters Total Kills Found
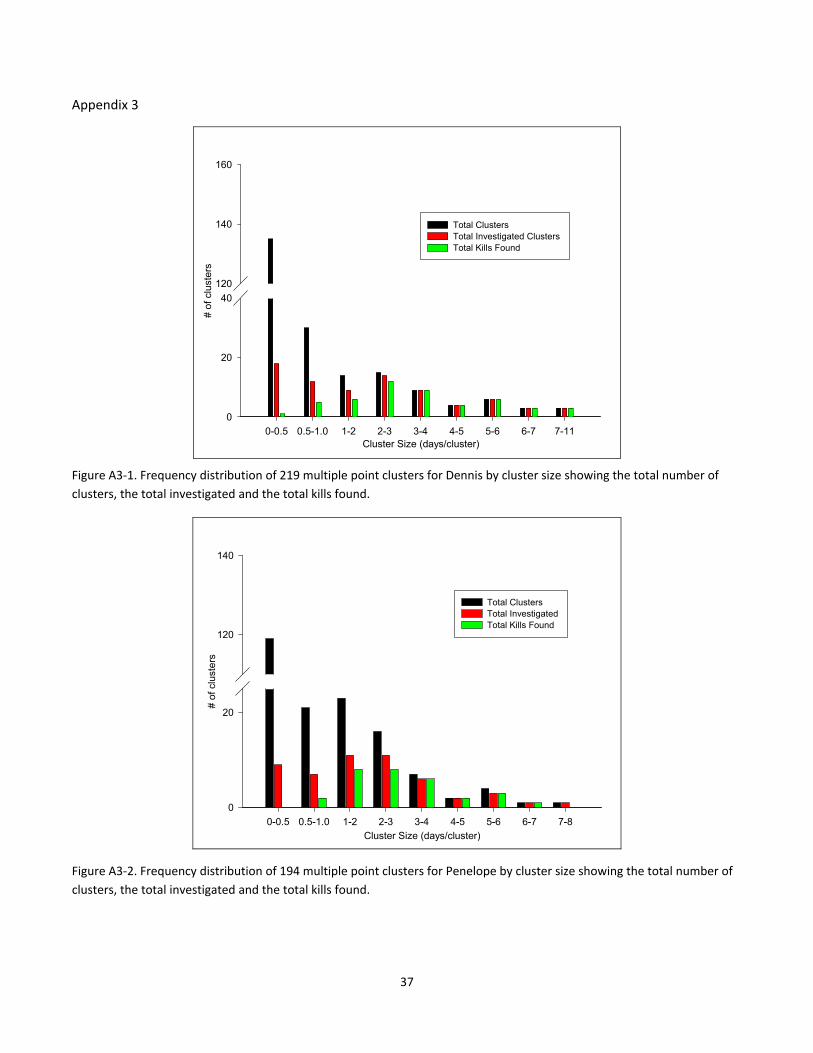
Figure A3‐1. Frequency distribution of 219 multiple point clusters for Dennis by cluster size showing the total number of
clusters, the total investigated and the total kills found.
Cluster Size (days/cluster)
0-0.5 0.5-1.0 1-2 2-3 3-4 4-5 5-6 6-7 7-8
# o
f cl
uste
rs
0
20
120
140
Total Clusters Total Investigated Total Kills Found
Figure A3‐2. Frequency distribution of 194 multiple point clusters for Penelope by cluster size showing the total number of
clusters, the total investigated and the total kills found.
37
Cluster Size (days/cluster)
0-0.5 0.5-1.0 1-2 2-3 3-4 5-6 7-8
# of
clu
ster
s
0
20
40
160
Total Clusters Total Investigated Total Kills Found
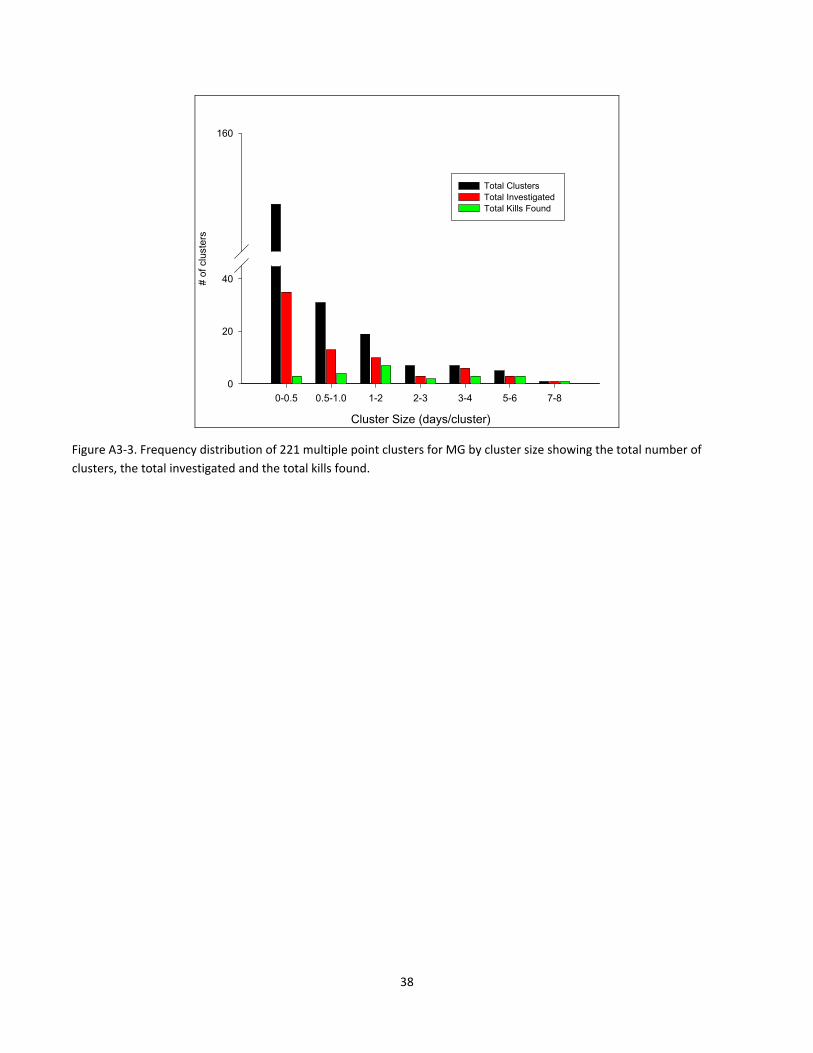
Figure A3‐3. Frequency distribution of 221 multiple point clusters for MG by cluster size showing the total number of
clusters, the total investigated and the total kills found.
38