review and cost analysis of reverse osmosis and
TRANSCRIPT
Review and cost analysis of reverse osmosis and ultrafiltration
A Senior Project
presented to
Dr. Bruce Golden of Dairy Science
California Polytechnic State University, San Luis Obispo
In Partial Fulfillment
of the Requirements for the Degree
Bachelor of Dairy Science
by
Jared De Groot
March, 2013
© 2013
ii
Abstract
The aim in this study was to determine whether implementing an on farm ultrafiltration
system was profitable. Ultrafiltration was researched to reduce the amount of milk
hauled from producer to processor. An ultrafiltration system involved milk that flowed
through a semi-permeable membrane. Through this process water and small amounts of
calcium and ash were pressured through the semi-permeable membrane. This permeate
would then be able to feed heifers. The protein, fat, solids nonfat, and small amounts of
calcium and ash were retained by the membrane. Through the process of ultrafiltration,
raw milk was concentrated to three times its original concentration. With the use of
ultrafiltration, the dairyman would need to one load of ultrafiltration milk instead of three
loads of raw milk. The reduction in the cost of milk hauled and the feed presented to the
heifers were the advantages in ultrafiltration. With the saved money on hauling and
feeding of heifers, the initial costs of the system and the annual maintenance cost of the
system exceed the benefits if implemented on De Groot Dairies. For the on farm
ultrafiltration system to break even in ten years, the producer would need to be paid an
additional $1.05 /cwt of retentate. This price included the reduced hauling cost and the
money saved on the heifer ration. The difference in net present values on the costs of the
system and the savings in permeate and hauling were -$5,072,770.24 over a 20 year
period. Due to 87% water in milk, ultrafiltration needed to be examined. A dairyman
should always look at his or her option to save money, wherever possible. With the data
received from De Groot Dairies, the on-site ultrafiltration system would not be profitable
when implementing the propose system at this time.
Keywords: reverse osmosis, ultrafiltration, retentate, permeate, membrane filtration
iii
Table of Contents
Abstract .......................................................................................................................................................................... ii
LIST OF TABLES ..................................................................................................................................................... v
LIST OF FIGURES ................................................................................................................................................. vi
Introduction ................................................................................................................................................................ 1
LITERATURE REVIEW ............................................................................................................................................ 3
History of Membrane Filtration ............................................................................................................................. 3
Types of Membrane Filtration ................................................................................................................................ 3
Reverse Osmosis and Ultrafiltration .................................................................................................................... 5
Process of RO and UF .......................................................................................................................................... 5
Dealing with Fouling ............................................................................................................................................ 7
Components RO and UF Retentate and Permeate ....................................................................................... 7
Membrane Filters ........................................................................................................................................................ 9
Waste water after RO and UF .............................................................................................................................. 11
UF Filtration .............................................................................................................................................................. 11
Legal Requirements for on farm RO and UF ................................................................................................. 12
Before operating RO or UF ............................................................................................................................. 12
Items needed to operate RO or UF ................................................................................................................ 13
Pool accounting and payment requirements ............................................................................................... 13
Reporting and Paying of Producer Assessments on Bulk Milk ........................................................... 14
Reporting and Paying of Handler Assessments on Bulk milk .............................................................. 14
Hilarides Farms ........................................................................................................................................................ 14
Clean In Place (CIP) for UF ............................................................................................................................ 17
Maintenance of Hilarides Dairy UF .............................................................................................................. 17
Benefits of UF...................................................................................................................................................... 18
Materials and Methods ........................................................................................................................................ 18
Initial Costs .......................................................................................................................................................... 20
About the proposed UF system ................................................................................................................... 20
Additional equipment needed ..................................................................................................................... 22
Yearly Costs ......................................................................................................................................................... 23
SAVINGS .................................................................................................................................................................. 26
Results ......................................................................................................................................................................... 26

iv
Discussion .................................................................................................................................................................. 29
Conclusion ................................................................................................................................................................ 31
WORKS CITED ......................................................................................................................................................... 32

v
LIST OF TABLES
Table 1. Typical component levels in 3x reverse osmosis product ……………………..11
Table 2. Size of milk components: water, lactose, casein proteins, and fat ……………..14
Table 3. Initial Startup Cost of UF System………………………………………....……22
Table 4. Yearly Cost of the UF System……...……………………………………….….23
Table 5. Ultrafiltration System running balance of costs………………………………..27
Table 6. Feed and transportation savings………………………………………………...28
vi
LIST OF FIGURES
Figure 1. Pressure causing reverse osmosis. ....................................................................... 4
Figure 2. Filtration processes and components were organized in order of size, pressure,
and weight. Provided by GEA Process Engineering, Inc. …………………………….....9
Figure 3. Four types of membranes were presented in picture format. …………………10
Figure 4. Hilarides Dairy, milk barn. ……………………………………………………15
Figure 5. Ultrafiltration unit. …………………………………………………………….15
Figure 6. 20,000 gallon bulk tank for UF permeate. …………………………………….16
Figure 7. Permeate water trough for Jersey heifer cows. ……………………………….16
Figure 8. Last plate cooler before retentate bulk milk storage. …………………………16
Figure 9. Ultrafiltration membranes, permeate exiting through clear hose. …………….17
Figure 10. Ultrafiltration system provided by GEA Process Engineering Inc. …………20
Figure 11. Process Engineering Inc. logo. ………...…………………………………….21
Figure 12. List of components in milk and the percent concentration in feed, concentrate,
and permeate……………………………………………………………………………..21
1
Introduction
Since 2006 the California diary industry has been struggling to make a profit,
especially producers. From 2008 to January of 2012, around 300 dairies have gone out of
business (Woziacka, 2012). I could not find a reputable source to indicate the amount of
dairies in financial trouble in 2012, but the times have not gotten better. With dairymen
struggling, it is necessary to find ways to save, or make more money and gain equity
back. My parents own 4,000 milking cows and their dairy, like most, is struggling.
I wanted to find something that could have an opportunity to help save costs and
possibly create a value added product. This was the driving force in my decision to
research on farm reverse osmosis and ultrafiltration. With milk being around 87-88%
water, it makes sense to filter out the water. Raw milk, with its 88% water, was shipped
to a processor and dependent on what type of processing plant received the milk. That
processor may remove the water for powder or cheese. I saw it as a waste to haul water if
it was going to be removed as soon as it gets to the processing plant. Sustainability was a
factor when I considered the research of on reverse osmosis and ultrafiltration. In
ultrafiltration and reverse osmosis, most water in milk was removed. This reduced the
amount of loads hauled to the processer from three loads to one. This resulted in less
traveling and less emissions produced.
The dairyman had to pay for milk hauled per cwt. In essence the dairyman paid
the trucking company to haul water, a product not needed when sending to certain plants.
Logic would say that reducing the amount of unneeded product would benefit the
producer and processor. This was why I chose to research reverse osmosis and
ultrafiltration.
2
When input cost, such as, feed and labor, exceed income, every option needs to be
explored. This was another reason to research ultrafiltration and reverse osmosis. I had
hoped to find a way to save costs and present a better quality product that may be worth
more than regular raw milk. Reduced water in milk allowed for the processor to have one
less step in production, thus I believe that the concentrated milk provided by the
ultrafiltration or reverse osmosis system was a value added product and should receive a
higher price. A higher price for milk would help any dairyman in times of high feed
costs. However, my thought proved to be wrong. I was unable find the price that the
processors were willing to pay for retentate or concentrated milk.
In Yves Pouliot’s (2008) conclusion on Membrane processes in dairy technology-
From a simple idea to worldwide panacea, he suggested that the identity of milk may be
challenged because many of the components can be selectively removed. He then
continued to counter his argument suggesting that it could be the beginning of a new
technology that may help develop the industry further. An example he gave was from
about a century ago when the centrifugal separations helped processing. I believe that
reverse osmosis and ultrafiltration along with all membrane filtrations should be
considered in milk processing. It has the ability to change processing protocols.
3
LITERATURE REVIEW
In this paper I briefly reviewed the four main types of membrane filtration. Then
focused on reverse osmosis (RO) and ultrafiltration (UF) to describe the two processes in
more detail. I chose to focus on RO and UF systems because I believed that it was the
most used membrane filtration systems in the dairy industry.
There are four main types of membrane filtration techniques: reverse osmosis
(RO), nanofiltration, ultrafiltration (UF), and microfiltration. The smallest pore size is
reverse osmosis then nanofiltration, followed by Ultrafiltration. The largest pore size of
the four is microfiltration (Barbano, D. 2013). Reverse osmosis is a concentration
processes while nanofiltration, ultrafiltration and microfiltration are fractional processes.
In any of these four processes the material that does not pass through the membrane filter
is called retentate while the fluid that does pass through the membrane filter is called
permeate (Fleming, 1999).
History of Membrane Filtration
The Dairy industry has seen membrane filtration systems since the 1970’s. The
first on farm ultrafiltration (UF) or reverse osmosis (RO) membrane systems
implemented in the 1980’s (Pouliot, 2008). In 1996, an ultrafiltration system was built
on a farm near Roswell, New Mexico. This on farm plant processed milk at temperatures
below 45 degrees Fahrenheit (Flemming, 1999). When milk was put through the system
under 45 °F it reduced fouling of the membrane. When the milk was heated to pass
through the membrane it burned the milk and compromised the flavor. Having milk flow
through the membrane filter cold had allowed for a more consistent product.
Types of Membrane Filtration
Nanofiltration’s pore si
larger and allows for salts to pass through the semi
used when a processor wishes
Engineering. Membrane Filtration.
(Kosikowski, 1973). This concentration process would be best utilized when shipping to
a cheese plant (GEA Process Engineering. Membrane Filtration. Reverse
Mircrofiltration has been
protein that is left in the retentate after processing was
permeate is serum protein. To recover the serum protein that was forced through the
semi-permeable membrane, RO
Membrane Filtration. Reverse, 2013
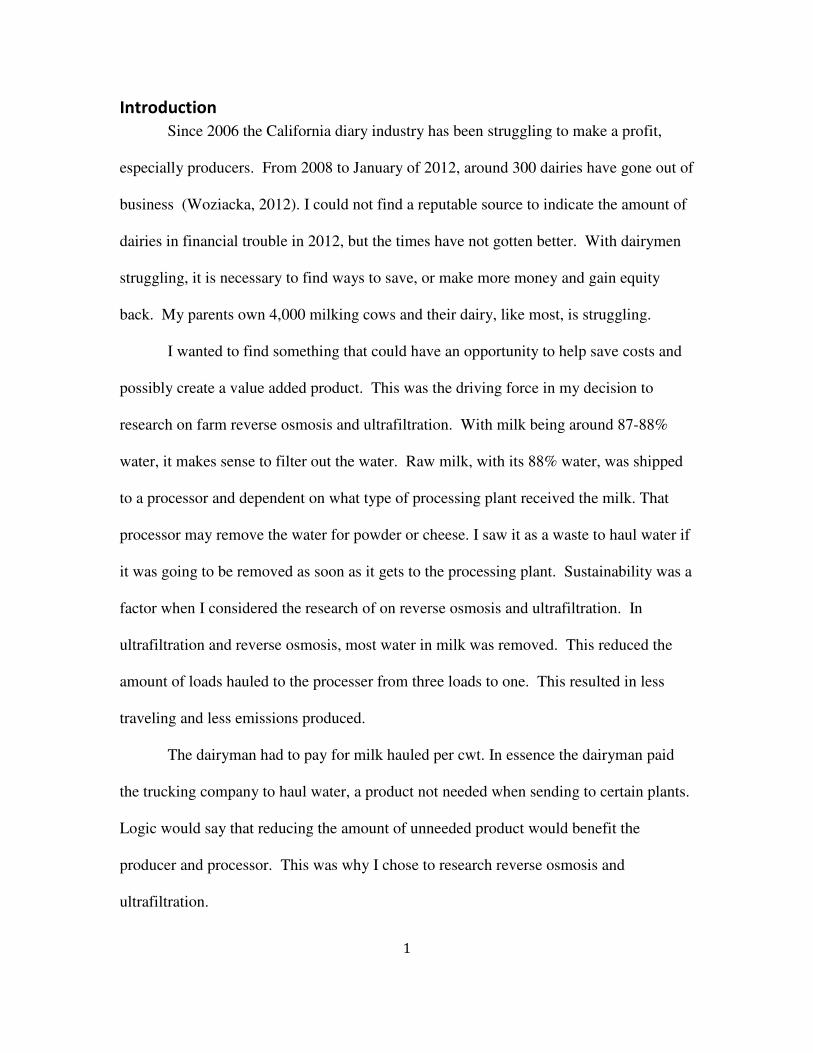
Figure 1. Pressure causing reverse osmosis.
4
Nanofiltration’s pore size is comparable to RO. However, the pore is slightly
larger and allows for salts to pass through the semi-permeable membrane. This process is
wishes to de-ash the dairy product at hand (GEA Process
Engineering. Membrane Filtration. Reverse, 2013).
Ultrafiltration is used in
processing dairy liquids to produce
different kinds of
cheeses such as cheddar or cottage.
Ultrafiltration had worked good for
cheese making because
ultrafiltration allowed for more
cheese production than traditional
processes when given the same
volume of milk. Ultrafiltration
retains α-lactalbumin, and
lactoglobulin in the retentate
This concentration process would be best utilized when shipping to
GEA Process Engineering. Membrane Filtration. Reverse, 2013
Mircrofiltration has been used when wanting to fractionate the protein. The
he retentate after processing was casein. The protein left in the
permeate is serum protein. To recover the serum protein that was forced through the
permeable membrane, RO or UF could be used (GEA Process Engineering.
Membrane Filtration. Reverse, 2013).
. Pressure causing reverse osmosis.
ze is comparable to RO. However, the pore is slightly
permeable membrane. This process is
GEA Process
Ultrafiltration is used in
processing dairy liquids to produce
cheeses such as cheddar or cottage.
worked good for
cheese making because
ultrafiltration allowed for more
cheese production than traditional
when given the same
volume of milk. Ultrafiltration
lactalbumin, and β-
retentate
This concentration process would be best utilized when shipping to
, 2013).
used when wanting to fractionate the protein. The
casein. The protein left in the
permeate is serum protein. To recover the serum protein that was forced through the
GEA Process Engineering.
5
In reverse osmosis, only water passes through the semi-permeable membrane.
There is no difference in the composition of condensed milk and reverse osmosis
processed milk. The only difference was that condensed milk was heat-treated and has a
subtle cooked flavor. Reversed osmosis milk is utilized in the making of ice cream,
yogurt or fortifying fluid milk. Reverse osmosis took less energy and lower cost than
evaporation. This made it a great alternative for concentrating the milk(GEA Process
Engineering. Membrane Filtration. Reverse, 2013).
Reverse Osmosis and Ultrafiltration
In reverse osmosis only water and a portion of non-protein nitrogen pass through
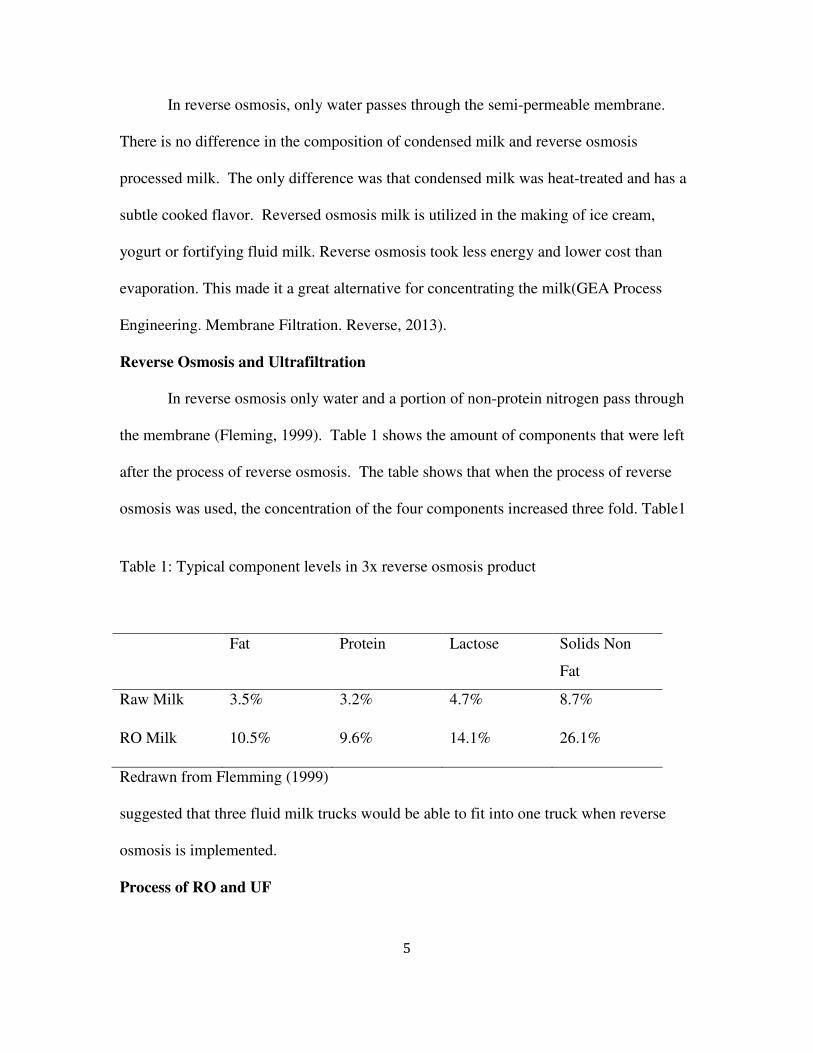
the membrane (Fleming, 1999). Table 1 shows the amount of components that were left
after the process of reverse osmosis. The table shows that when the process of reverse
osmosis was used, the concentration of the four components increased three fold. Table1
Redrawn from Flemming (1999)
suggested that three fluid milk trucks would be able to fit into one truck when reverse
osmosis is implemented.
Process of RO and UF
Table 1: Typical component levels in 3x reverse osmosis product
Fat Protein Lactose Solids Non
Fat
Raw Milk 3.5% 3.2% 4.7% 8.7%
RO Milk 10.5% 9.6% 14.1% 26.1%
6
In a reverse osmosis system, raw milk is pumped into a semi-permeable
membrane. The membrane has a very small pore size that will only allow the water to
continue through the system. The pressure added to the inlet side is raised above the
osmotic pressure; this forces the water through the membrane (Wichell and Hammond,
1984). Osmotic pressure is the minimum amount of pressure desired to stop osmosis. In
reverse osmosis and nanofiltration, the largest amounts of pressure were observed. This
was due to the small pore size of the semipermeable membrane. The osmotic pressure in
RO or NF was high compared to MF or UF. The pressure applied must exceed the
osmotic pressure (Pouliot, 2008).
In an ultrafiltration system, the process was much like that of RO. The main
difference was pore size UF was larger than RO. Being that UF had larger pores, it
allowed for more than just water to pass through. The permeate of UF milk consists of
water, soluble salts, lactose and soluble nonprotein nitrogen (Kosikowski, 1973). The
osmotic pressure will be lower than that of RO or NF as seen in figure 2. This was
because the larger pore size in UF allowed for the fluid to flow easier through the
membrane.
There are two primary determinants of how efficient the milk flows through the
system or commonly known as flux. First is temperature, to increase the flux, the
temperature should also be increased. However, the membranes are very vulnerable at
high temperatures and tend to deteriorate. Adding pressure to the inlet will also cause an
increase in flux. Too much pressure may cause damage to the membrane. The
concentration of fluid also affected the amount of flux created. Appling more pressure on
the flow of milk through the membrane than the osmotic pressure allowed for the solvent
7
to pass through the semi-permeable membrane. Osmotic pressure was also related to the
solutions concentration. (Wichell and Hammond, 1984).
Dealing with Fouling
Fouling of the membrane has always been a concern when running a reverse
osmosis system or ultrafiltraiton system. Fouling was caused when microorganisms grew
on the semipermeable membrane. These microorganisms caused a biofilm on the
membrane pores, which caused a reduction in the amount of flux. This biofilm reduced
the efficiency of the system and there was an increase chance for the product to get
contaminated which caused an economic loss (Tang et al, 2009). J. Hiddink et al. in
Reverse Osmosis of Dairy Liquids (1985), found that Gouda whey fouled at a
temperature of 30 degrees Celsius, because the Ca-phosphate precipitation. On the other
hand, he stated that skim milk fouled because of the protein involved. To prevent fouling,
CIP is used. However, cleaning the RO or UF system could be a challenge. The
membrane filter of the system is sensitive to temperatures above 113 °F, high and low
pH, do not have great physical strength and membranes need to be wet at all times
(Wichell and Hammond, 1984).
Components RO and UF Retentate and Permeate
There are many components that make up milk. Each component had a different
particle size. Particle size had a huge impact of what pore size was desired for the semi-
permeable membrane. To make things simple, table 2 taken from Calvin Covington
(2004) presentation on membrane filtration of milk, milk is divided into four components.
The table shows the average dimension of milk components. As seen from the table 2,
water had the smallest dimension.

8
Redrawn from Calvin Covington’s (2004) presentation.
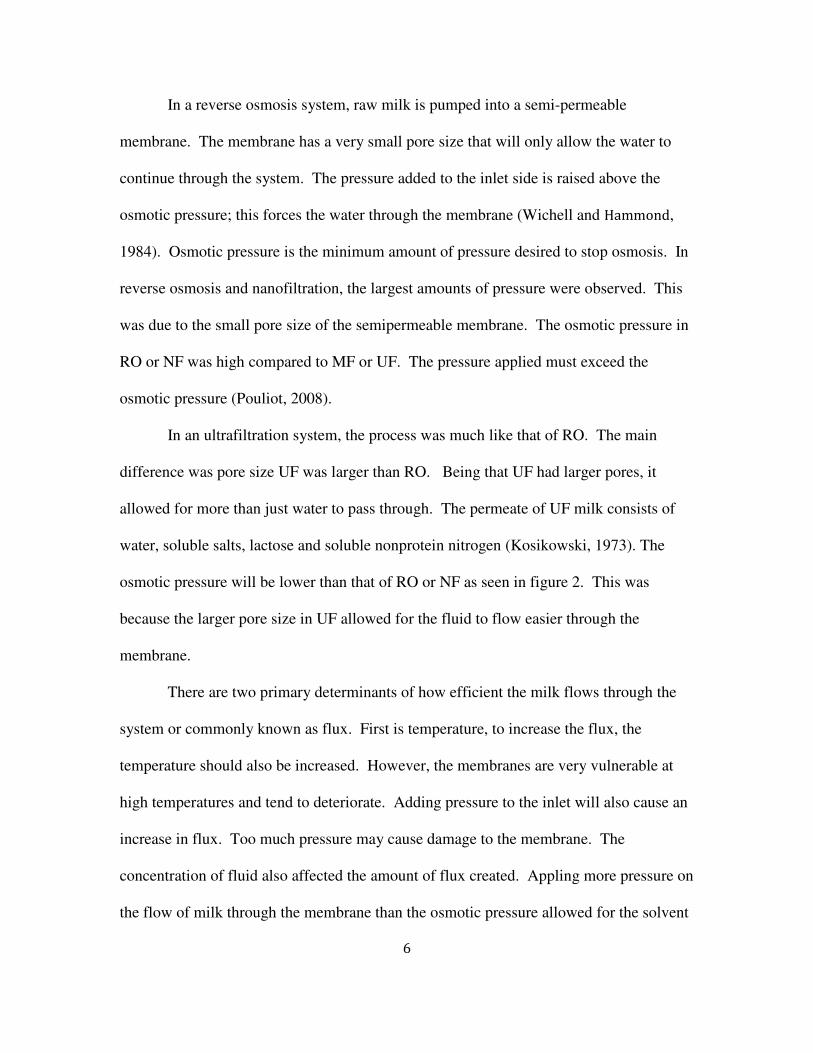
For RO to work properly, the membrane needed to have a pore size smaller than
lactose. GEA Process Engineering, created figure 2 that displays the four processes of
membrane filtration. Figure 2 gave five filtration processes, RO, nano-filtration, UF,
micro-filtration and particle filtration. The filtration processes were in order of pore size,
with RO was the smallest and Particle filtration was the largest. At the bottom of the
figure was a measurement of how large the particles were. The particles were measured
in microns. Above the measurements was the amount of pressure needed to push the
solution through the membrane. Above pressure were the molecular weight of the
solutions components. Above molecular weight were the components. The components
were in order of size, pressure needed, and molecular weight.
The main difference between RO and UF was that UF concentrates proteins,
insoluble salts, and fat, while RO concentrates total solids (Kosikowski, 1973). The two
processes did have at least one thing in common; they both permit undenatured proteins
to remain undenatured when pumped through the membrane (Kosikowski, 1973).
Table 2. Size of milk components: water, lactose, casein proteins, and fat
Component in Milk Average Dimension (nm)
Water 0.2
Lactose 0.5
Casein Proteins 2.0-4.0
Fat 1,000-10,000
9
Figure 2. Filtration processes and components were organized in order of size, pressure,
and weight. Provided by GEA Process Engineering, Inc.
Membrane Filters
There were two different types of membranes, Polymeric and inorganic. Spiral
wound, hollow fiber and flat sheet membranes make up the polymeric membranes. On
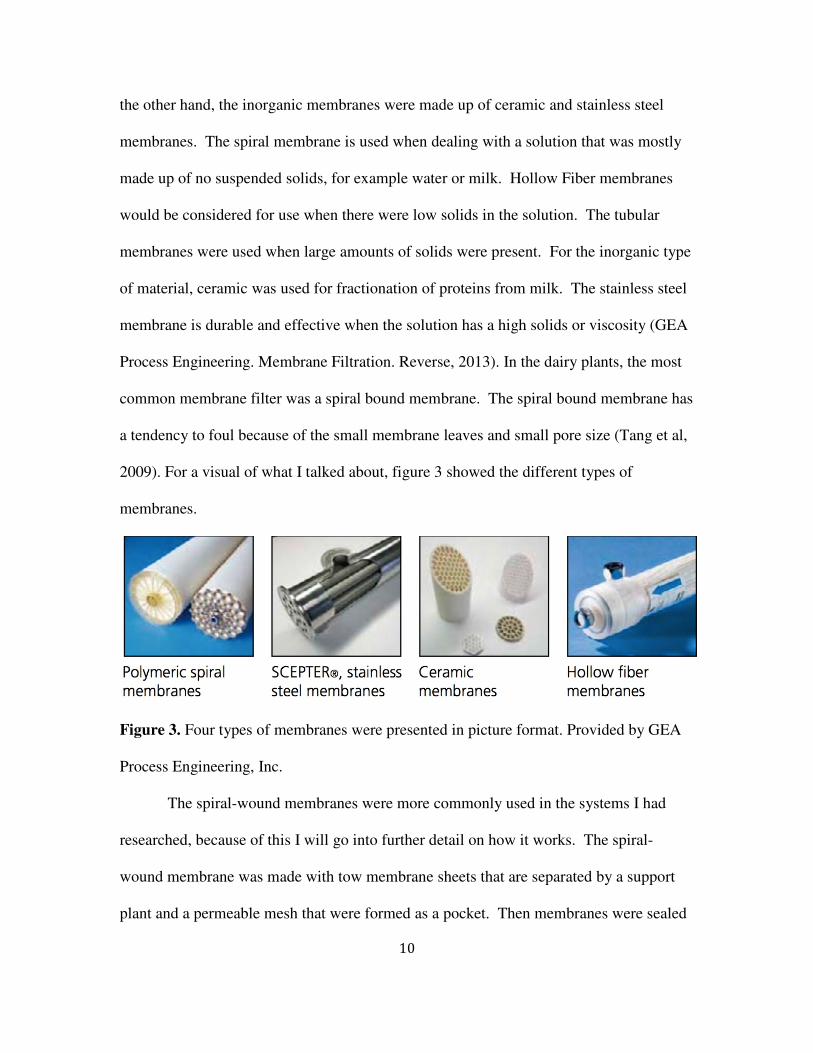
10
the other hand, the inorganic membranes were made up of ceramic and stainless steel
membranes. The spiral membrane is used when dealing with a solution that was mostly
made up of no suspended solids, for example water or milk. Hollow Fiber membranes
would be considered for use when there were low solids in the solution. The tubular
membranes were used when large amounts of solids were present. For the inorganic type
of material, ceramic was used for fractionation of proteins from milk. The stainless steel
membrane is durable and effective when the solution has a high solids or viscosity (GEA
Process Engineering. Membrane Filtration. Reverse, 2013). In the dairy plants, the most
common membrane filter was a spiral bound membrane. The spiral bound membrane has
a tendency to foul because of the small membrane leaves and small pore size (Tang et al,
2009). For a visual of what I talked about, figure 3 showed the different types of
membranes.
Figure 3. Four types of membranes were presented in picture format. Provided by GEA
Process Engineering, Inc.
The spiral-wound membranes were more commonly used in the systems I had
researched, because of this I will go into further detail on how it works. The spiral-
wound membrane was made with tow membrane sheets that are separated by a support
plant and a permeable mesh that were formed as a pocket. Then membranes were sealed
11
with adhesive. There were many of these spirally wound pockets that were put around
one central tube. The spiral wound membranes were then placed in either a plastic or
stainless steel tube that were to be pressurized. At both ends, an antitelescoping device
was placed so that the spiral in the tube would remain constant when processed (Kuan et
al, 1998). The milk was then pushed through the membrane and as the milk flowed
through the membrane, the permeate flowed through the pores and collected at the end of
the tube. The spiral wound membranes had an increase in effectiveness with packing
density, low energy cost and effective mass transfer characteristics. The disadvantage
was high probability of fouling of the membrane and was difficult to clean (Kuan et al,
1998).
Waste water after RO and UF
Reverse Osmosis contains retentate and permeate. The permeate is mostly water.
The question at hand is what to do with the waste water. Flemming (1999) suggested to
run the permeate through the RO system again to increase the concentration of lactose
and minerals. If given a 100,000 lbs of permeate, processing it through the reverse
osmosis system again will increase the amount of lactose in the retentate. This retentate
consist of 33,333 lbs of which 14 percent lactose and 1.5 percent mineral. The retentate
could then be fed to the cows. The lactose almost has the same nutritional value as corn
and around 2 lbs/day/animal could be substituted (Flemming, 1999).
UF Filtration
Lactose and minerals like calcium were removed from milk in an ultrafiltration
system (Vyas and Tong, 2003). In Vyas and Tong’s (2003) article, Process for calcium
retention during skim milk ultrafiltration, they studied processing skim milk using
12
ulrafiltraion through a 10-kDA membrane at a 4x concentration. After the UF process,
they used heat treatment, pH adjustment, or both processes on the retentate and permeate
to determine the amount of calcium, lactose, ash, total solids, and total nitrogen. The
study found that about 16% of calcium was found in the permeate of skim milk and 76%
of lactose was also found in the permeate.
When shipping to a cheese plant, UF has benefits compared to conventional
cheese processing. As stated above, in the types of membrane filtrations, all milk
proteins remain in the retentate (Maubois and Mocquot, 1974). In Maubois and
Mocquot’s (1974) journal article, Application of membrane ultrafiltration to preparation
of various types of cheese, he showed that the cheese yield when using UF is increased
by 16 to 20%. Maubois and Mocquot came to their conclusion because in every 100g of
nitrogenous milk substances used, around 94-95 g remained in the cheese.
Legal Requirements for on farm RO and UF
California Department of Food and Agricultrure (CDFA) provided all information
in this section. What is written is not a complete list of all the regulations that are
required; rather it is a guide for a California dairyman who is considering implementing
an on farm ultrafiltration or reverse osmosis system.
Before operating RO or UF
When an on farm system is installed, the dairyman would then be considered
producer-handler. However, before the producer-handler can begin using their
ultrafiltration or reverse osmosis system, he or she will need to get permission from the
Food and Drug Administration about the proposed plan. The producer handler would

13
also need a Milk Products Plant License. There would also need to be an inspection of
the facilities.
Items needed to operate RO or UF
A producer-handler would need a permit of market milk being produced and Milk
Products Plant license with a Grade A Milk Processing Permit. There also needs to be a
qualified industry supervisor to test for drug residue, and a licensed weighmaster and
sampler to measure and sample the milk before processing. The producer-handler’s farm
would need to be on the Grade A raw milk list provided by Interstate Milk Shippers
program. The RO or UF Facility would also require a separate title in the Interstate Milk
Shippers program. When shipping the retentate of RO or UF milk, there needs to be a
valid contract with handler. The handler needs to be bonded and licensed as well.
Pool accounting and payment requirements
If retentate was shipped as Class 1 or Class 2, the producer-handler would then be
considered a pool plant and Handlers Monthly report is needed. If the retentate were not
distributed to Class 1 or Class 2, then the producer-handler would be considered a
nonpool plant, and must file Nonpool Plant Receipts and a Usage report. However, if
quota was owned, the producer-handler must be a qualifying pool plant.
For payment, the contracted handler must purchase the retentate from the on farm
UF or RO system at the minimum class price. If you are sending retentate to a Class 1 or
Class 2 facility and were considered a pool plant, then you will have a pool commitment
for all bulk milk at the minimum class price. This entitles the producer-handler to pool
credits depicted from pool prices and the amount of quota. When the producer-handler’s
sold retentate to a handler, the Milk Producer Security Trust Fund may cover the retentate

14
on two conditions. First, the retentate was sold to a licensed and bonded milk handler.
Second, a file must be kept with the Dairy Marketing Branch of the contract for the sold
retentate.
Reporting and Paying of Producer Assessments on Bulk Milk
The producer-handler will be responsible for paying and reporting any producer
assessment on bulk milk that goes into RO or UF. Some include, Pool Administration
Fee (For those considered a pool plant), Dairy Council, Milk and Dairy Foods Control
Fee, Market Milk Administration Fee, and Market order.
Reporting and Paying of Handler Assessments on Bulk milk
The producer-handler will be accountable for reporting and paying handler
assessments on bulk milk that is put through RO or UF. These contain, Market Milk
Administration Fee, Dairy Council, Milk and Dairy Foods Control Fee, and California
Milk Processor Board.
Hilarides Farms
On February 14, 2013 I visited Hilarides Dairy located in Lindsay, CA. Hilarides
Dairy has 9,100 Jersey milk cows averaging 48,000 gallons per day. Hilarides Dairy has
an on farm ultrafiltration system. I got the privilege of touring the system from Dan
Hilarides, who is involved in managing the ultrafiltration facility and the methane
digester facility. I was able to connect my research with the actual process and make
connections.
15
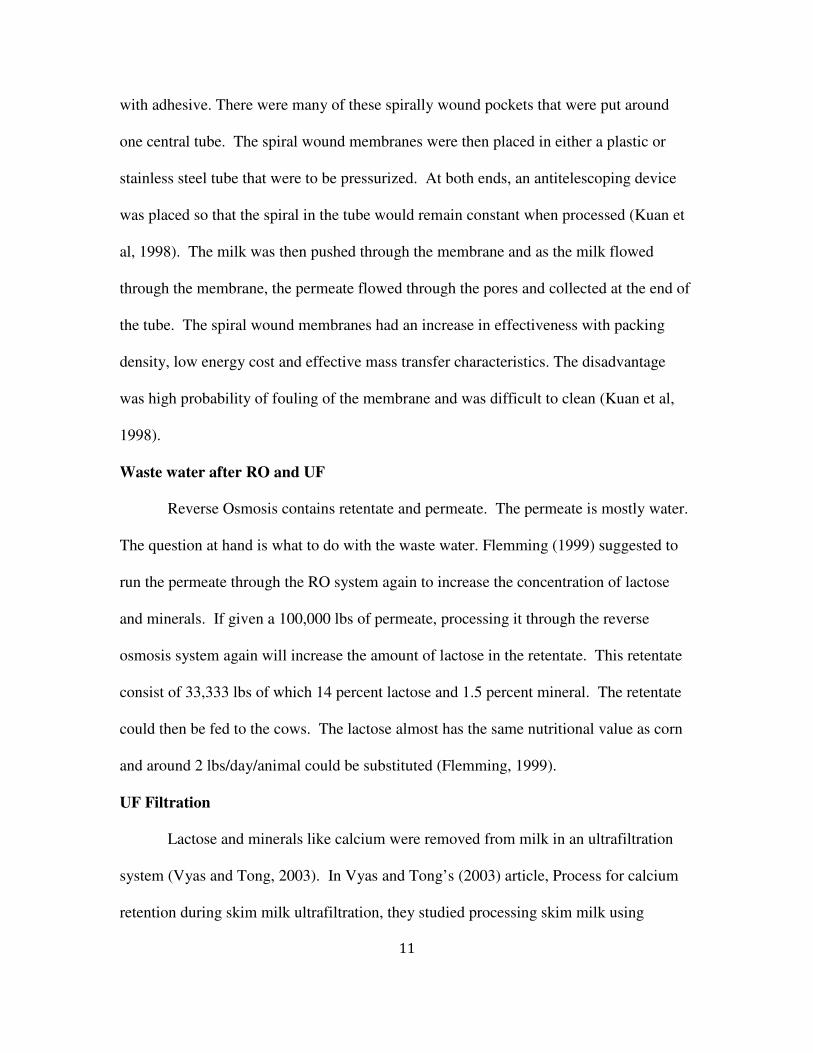
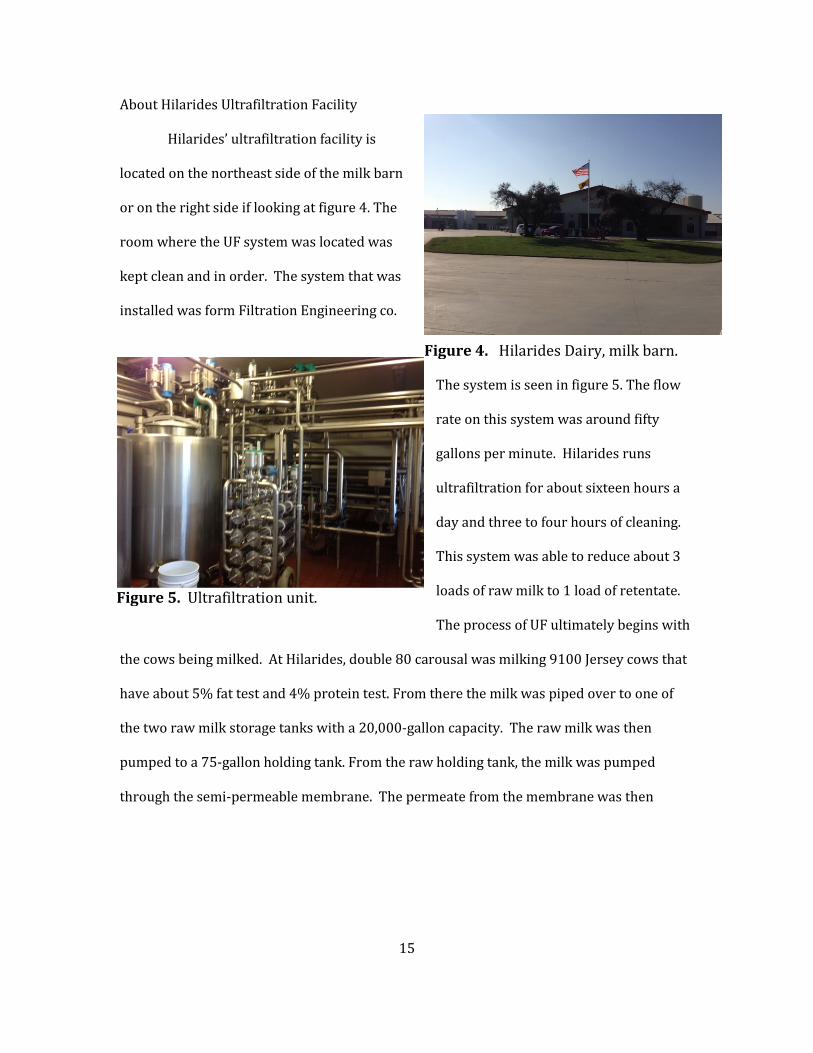
About Hilarides Ultrafiltration Facility
Hilarides’ ultrafiltration facility is
located on the northeast side of the milk barn
or on the right side if looking at figure 4. The
room where the UF system was located was
kept clean and in order. The system that was
installed was form Filtration Engineering co.
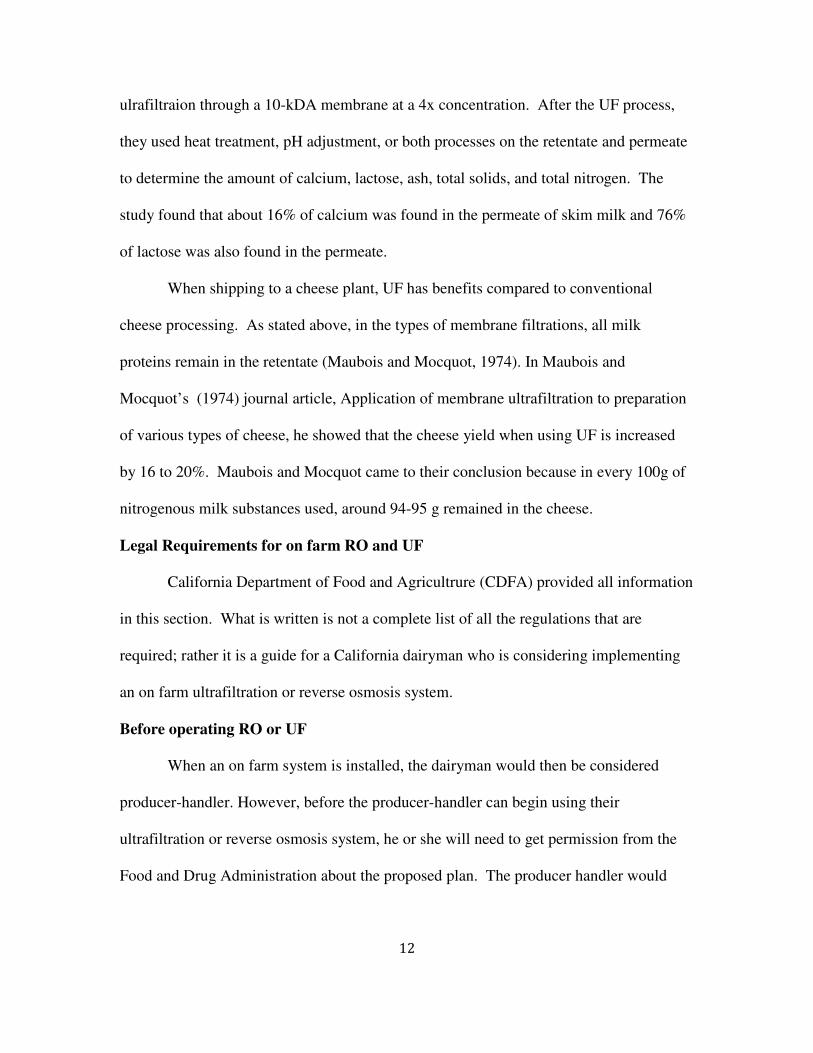
The system is seen in figure 5. The flow
rate on this system was around fifty
gallons per minute. Hilarides runs
ultrafiltration for about sixteen hours a
day and three to four hours of cleaning.
This system was able to reduce about 3
loads of raw milk to 1 load of retentate.
The process of UF ultimately begins with
the cows being milked. At Hilarides, double 80 carousal was milking 9100 Jersey cows that
have about 5% fat test and 4% protein test. From there the milk was piped over to one of
the two raw milk storage tanks with a 20,000-gallon capacity. The raw milk was then
pumped to a 75-gallon holding tank. From the raw holding tank, the milk was pumped
through the semi-permeable membrane. The permeate from the membrane was then
Figure 4. Hilarides Dairy, milk barn.
Figure 5. Ultrafiltration unit.
16
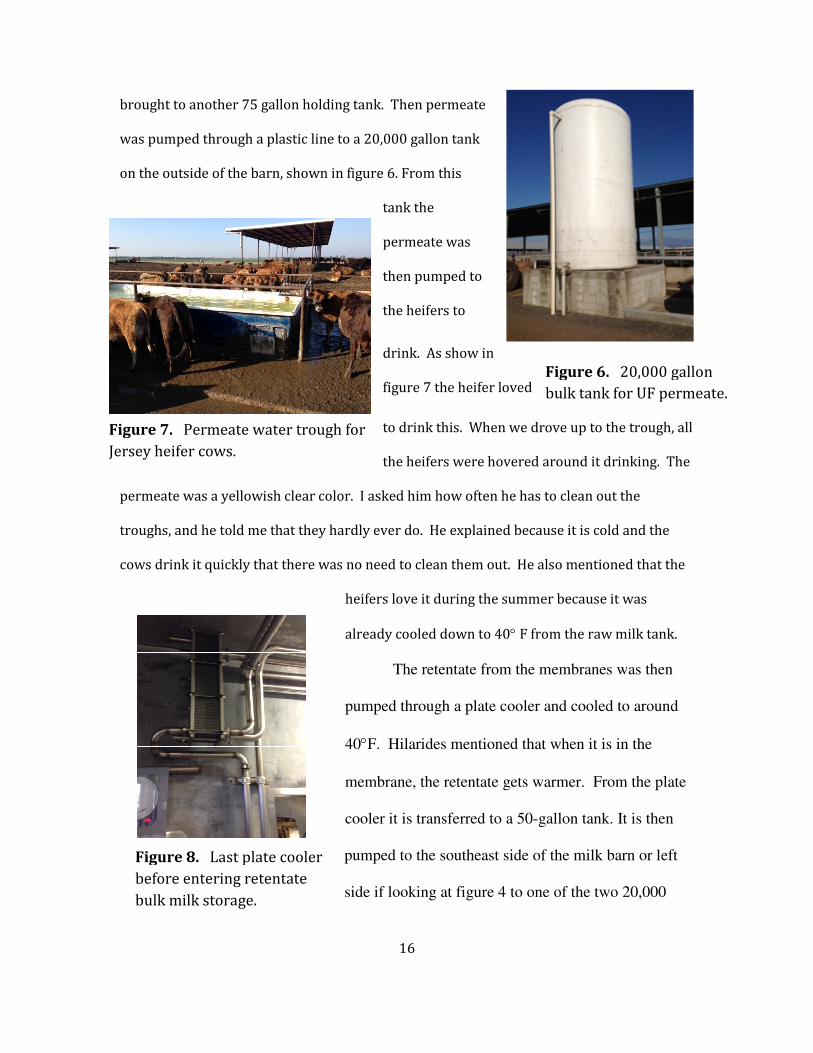
brought to another 75 gallon holding tank. Then permeate
was pumped through a plastic line to a 20,000 gallon tank
on the outside of the barn, shown in figure 6. From this
tank the
permeate was
then pumped to
the heifers to
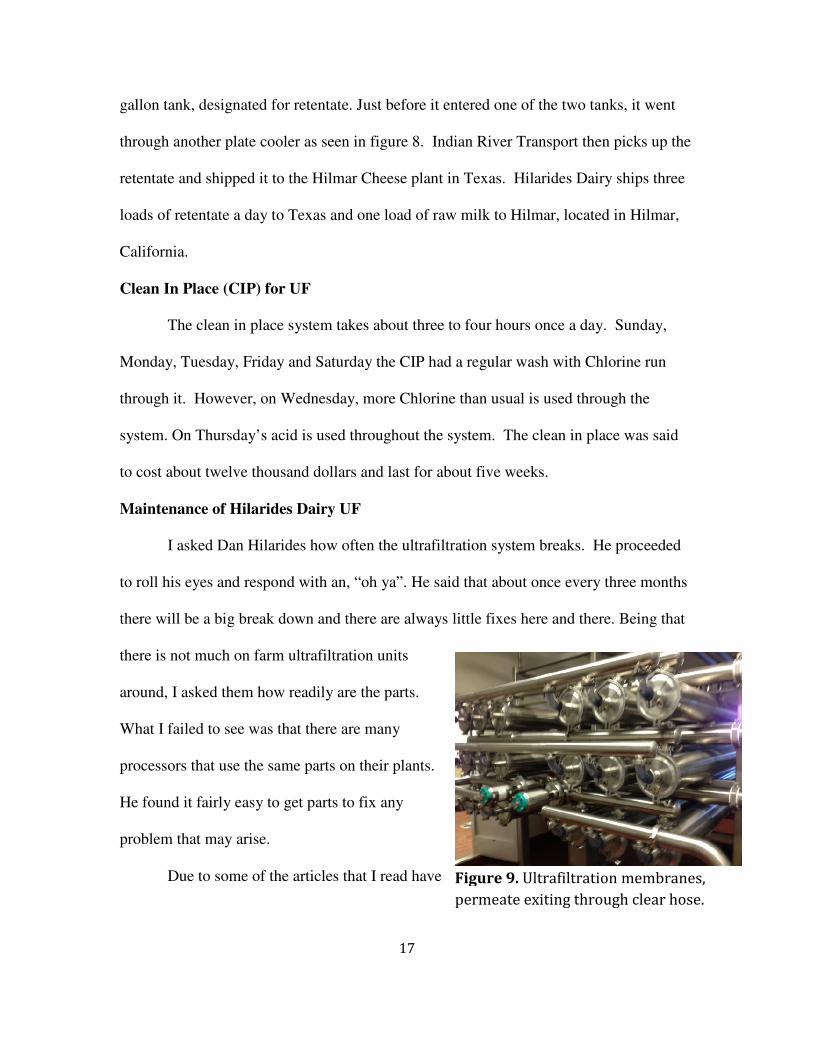
drink. As show in
figure 7 the heifer loved
to drink this. When we drove up to the trough, all
the heifers were hovered around it drinking. The
permeate was a yellowish clear color. I asked him how often he has to clean out the
troughs, and he told me that they hardly ever do. He explained because it is cold and the
cows drink it quickly that there was no need to clean them out. He also mentioned that the
heifers love it during the summer because it was
already cooled down to 40° F from the raw milk tank.
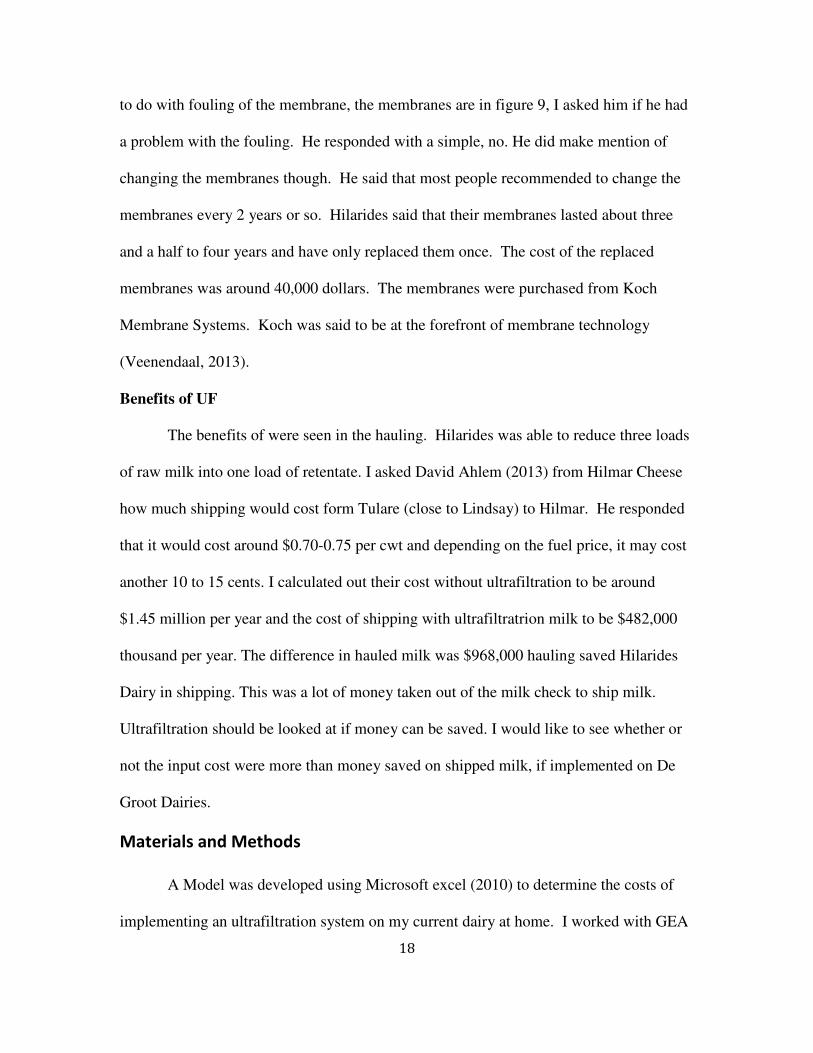
The retentate from the membranes was then
pumped through a plate cooler and cooled to around
40°F. Hilarides mentioned that when it is in the
membrane, the retentate gets warmer. From the plate
cooler it is transferred to a 50-gallon tank. It is then
pumped to the southeast side of the milk barn or left
side if looking at figure 4 to one of the two 20,000
Figure 6. 20,000 gallon
bulk tank for UF permeate.
Figure 7. Permeate water trough for
Jersey heifer cows.
Figure 8. Last plate cooler
before entering retentate
bulk milk storage.
17
gallon tank, designated for retentate. Just before it entered one of the two tanks, it went
through another plate cooler as seen in figure 8. Indian River Transport then picks up the
retentate and shipped it to the Hilmar Cheese plant in Texas. Hilarides Dairy ships three
loads of retentate a day to Texas and one load of raw milk to Hilmar, located in Hilmar,
California.
Clean In Place (CIP) for UF
The clean in place system takes about three to four hours once a day. Sunday,
Monday, Tuesday, Friday and Saturday the CIP had a regular wash with Chlorine run
through it. However, on Wednesday, more Chlorine than usual is used through the
system. On Thursday’s acid is used throughout the system. The clean in place was said
to cost about twelve thousand dollars and last for about five weeks.
Maintenance of Hilarides Dairy UF
I asked Dan Hilarides how often the ultrafiltration system breaks. He proceeded
to roll his eyes and respond with an, “oh ya”. He said that about once every three months
there will be a big break down and there are always little fixes here and there. Being that
there is not much on farm ultrafiltration units
around, I asked them how readily are the parts.
What I failed to see was that there are many
processors that use the same parts on their plants.
He found it fairly easy to get parts to fix any
problem that may arise.
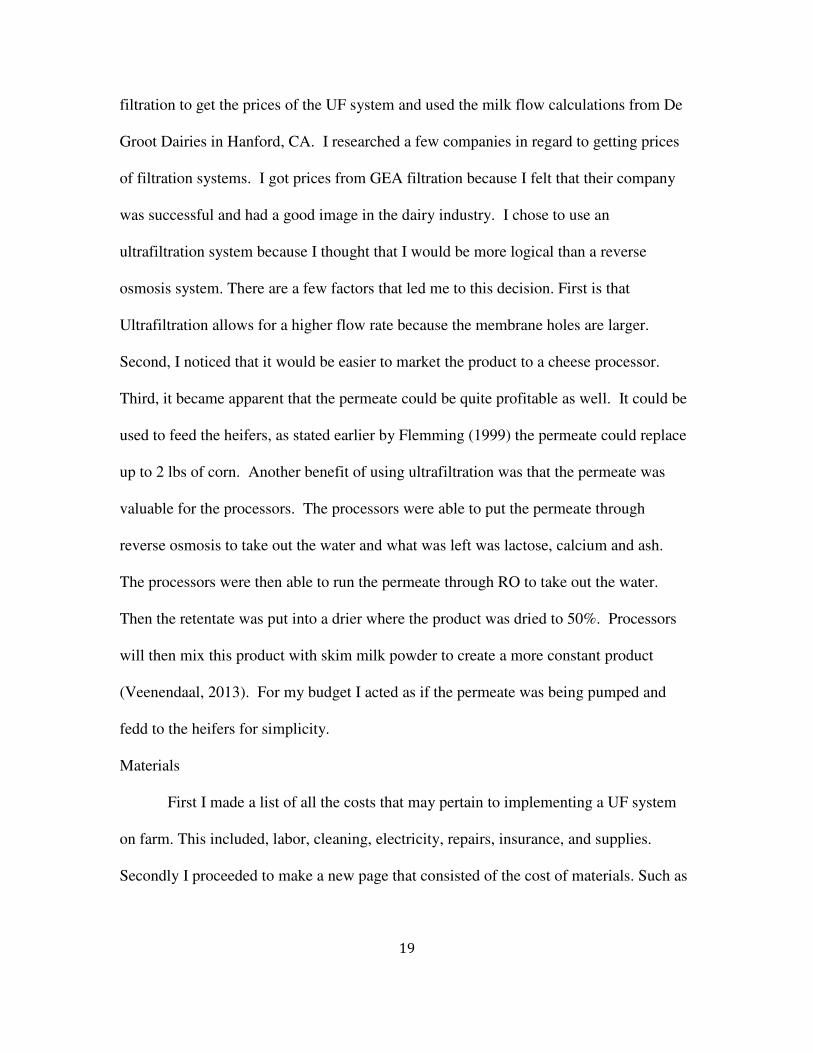
Due to some of the articles that I read have Figure 9. Ultrafiltration membranes,
permeate exiting through clear hose.
18
to do with fouling of the membrane, the membranes are in figure 9, I asked him if he had
a problem with the fouling. He responded with a simple, no. He did make mention of
changing the membranes though. He said that most people recommended to change the
membranes every 2 years or so. Hilarides said that their membranes lasted about three
and a half to four years and have only replaced them once. The cost of the replaced
membranes was around 40,000 dollars. The membranes were purchased from Koch
Membrane Systems. Koch was said to be at the forefront of membrane technology
(Veenendaal, 2013).
Benefits of UF
The benefits of were seen in the hauling. Hilarides was able to reduce three loads
of raw milk into one load of retentate. I asked David Ahlem (2013) from Hilmar Cheese
how much shipping would cost form Tulare (close to Lindsay) to Hilmar. He responded
that it would cost around $0.70-0.75 per cwt and depending on the fuel price, it may cost
another 10 to 15 cents. I calculated out their cost without ultrafiltration to be around
$1.45 million per year and the cost of shipping with ultrafiltratrion milk to be $482,000
thousand per year. The difference in hauled milk was $968,000 hauling saved Hilarides
Dairy in shipping. This was a lot of money taken out of the milk check to ship milk.
Ultrafiltration should be looked at if money can be saved. I would like to see whether or
not the input cost were more than money saved on shipped milk, if implemented on De
Groot Dairies.
Materials and Methods
A Model was developed using Microsoft excel (2010) to determine the costs of
implementing an ultrafiltration system on my current dairy at home. I worked with GEA
19
filtration to get the prices of the UF system and used the milk flow calculations from De
Groot Dairies in Hanford, CA. I researched a few companies in regard to getting prices
of filtration systems. I got prices from GEA filtration because I felt that their company
was successful and had a good image in the dairy industry. I chose to use an
ultrafiltration system because I thought that I would be more logical than a reverse
osmosis system. There are a few factors that led me to this decision. First is that
Ultrafiltration allows for a higher flow rate because the membrane holes are larger.
Second, I noticed that it would be easier to market the product to a cheese processor.
Third, it became apparent that the permeate could be quite profitable as well. It could be
used to feed the heifers, as stated earlier by Flemming (1999) the permeate could replace
up to 2 lbs of corn. Another benefit of using ultrafiltration was that the permeate was
valuable for the processors. The processors were able to put the permeate through
reverse osmosis to take out the water and what was left was lactose, calcium and ash.
The processors were then able to run the permeate through RO to take out the water.
Then the retentate was put into a drier where the product was dried to 50%. Processors
will then mix this product with skim milk powder to create a more constant product
(Veenendaal, 2013). For my budget I acted as if the permeate was being pumped and
fedd to the heifers for simplicity.
Materials
First I made a list of all the costs that may pertain to implementing a UF system
on farm. This included, labor, cleaning, electricity, repairs, insurance, and supplies.
Secondly I proceeded to make a new page that consisted of the cost of materials. Such as
the actual UF system and milk receiving tank. Third, I considered the amount of milk
that would be able to be processed in one day.
For my materials I needed to get prices for implementing an Ultrafiltration
on farm. My numbers came from a number of different sources, including Hilmar
Cheese, Hilarides Dairy, De Groot Dairy, Jam Construction, Sousa and Company, and
GEA Process Engineering, Inc
installed and then how much it would cost to maintain every year after that.
Initial Costs
My initial costs that I found were $653,170.00
ultrafiltration system provided by
expaned cooling system, installation and taxes.
accommodating to my questions and was very help
was quoted was a complete system,
including membranes, electric set up,
small holding tanks, and pumps.
About the proposed UF system
Figure 10 was a blue print of
the proposed UF system by GEA
Process Engineering, Inc. This system
was meant to run milk through twenty
hour per day and four hours a day are designated for cleaning the system. The UF system
was built to meet the current 3A and USDA standards.
20
the actual UF system and milk receiving tank. Third, I considered the amount of milk
that would be able to be processed in one day.
For my materials I needed to get prices for implementing an Ultrafiltration
on farm. My numbers came from a number of different sources, including Hilmar
Cheese, Hilarides Dairy, De Groot Dairy, Jam Construction, Sousa and Company, and
GEA Process Engineering, Inc. I wanted to find the initial cost of the whole system
talled and then how much it would cost to maintain every year after that.
at I found were $653,170.00. This included the cost of the
ultrafiltration system provided by GEA Process Engineering, Inc., building, bulk tanks,
expaned cooling system, installation and taxes. GEA Process Engineering, Inc.
accommodating to my questions and was very helpful with my project. The system that
was quoted was a complete system,
including membranes, electric set up,
pumps.
About the proposed UF system
a blue print of
the proposed UF system by GEA
This system
was meant to run milk through twenty
hour per day and four hours a day are designated for cleaning the system. The UF system
was built to meet the current 3A and USDA standards. The flow rate of the ultrafiltration
Figure 10. Ultrafiltration system provided by
GEA Process Engineering, Inc.
the actual UF system and milk receiving tank. Third, I considered the amount of milk
For my materials I needed to get prices for implementing an Ultrafiltration system
on farm. My numbers came from a number of different sources, including Hilmar
Cheese, Hilarides Dairy, De Groot Dairy, Jam Construction, Sousa and Company, and
. I wanted to find the initial cost of the whole system
talled and then how much it would cost to maintain every year after that.
. This included the cost of the
, building, bulk tanks,
GEA Process Engineering, Inc. was very
The system that
hour per day and four hours a day are designated for cleaning the system. The UF system
The flow rate of the ultrafiltration
Ultrafiltration system provided by

system that was quoted was 17,680 lbs per
The concentrate quantity was 5,880 lbs per
and produced total solids of 25.92%.
the permeate quantity was 11,800 lbs per hour
with a total solids of 5.77%.
This UF system is designed to use clean in place (CIP). There are four steps in
the cleaning process. First, the cleaning c
cleaning solution is heated. Third, the chemicals were pumped through for a certain
amount of time. Fourth, water was flushed through the system.
The system required power to function. The power needed to run the system was
680 Kwh/d. As well as power, the system also needed 328 scf of air, 960 lb/d of steam
and 2,810 gal/d of water for the fourth step in the CIP process. These factors play a rol
in determining the price of operating thus it was needed.
installation cost of the system to get a price on the total initial costs.
Figure 12.
concentration in feed, concentrate, and permeate.
Taken form GEA Process Engineering
21
as 17,680 lbs per hour.
The concentrate quantity was 5,880 lbs per hour
total solids of 25.92%. Whereas
the permeate quantity was 11,800 lbs per hour
This UF system is designed to use clean in place (CIP). There are four steps in
the cleaning process. First, the cleaning chemicals are manually added. Second, the
cleaning solution is heated. Third, the chemicals were pumped through for a certain
Fourth, water was flushed through the system.
The system required power to function. The power needed to run the system was
680 Kwh/d. As well as power, the system also needed 328 scf of air, 960 lb/d of steam
and 2,810 gal/d of water for the fourth step in the CIP process. These factors play a rol
in determining the price of operating thus it was needed. I also needed to find the
installation cost of the system to get a price on the total initial costs.
List of components in milk and the percent
concentration in feed, concentrate, and permeate.
Taken form GEA Process Engineering
Figure 11. GEA Process Engineering Inc.
logo
This UF system is designed to use clean in place (CIP). There are four steps in
hemicals are manually added. Second, the
cleaning solution is heated. Third, the chemicals were pumped through for a certain
The system required power to function. The power needed to run the system was
680 Kwh/d. As well as power, the system also needed 328 scf of air, 960 lb/d of steam
and 2,810 gal/d of water for the fourth step in the CIP process. These factors play a role
I also needed to find the
GEA Process Engineering Inc.
22
Additional equipment needed
There were a few pieces of equipment needed to accommodate the UF system.
The first was two 7,000-gallon bulk tanks for the retentate or concentrate to be stored
until taken to the creamery. The tanks were $85,000. This price came from Todd Jones
(2013) owner operator of Jam Construction. Another additional cost needed was the
building where the UF system would be installed. I also thought that it would have been
beneficial to have a plate cooler for the retentate before it enters the bulk tank. This was
brought to my attention when visiting Hilarides dairy, at Hilarides, the retentate was
cooled twice before it went into the bulk tank. I believe that one plate cooler will suffice.
Depending on what size pump was on the exit of the raw milk bulk tanks, another pump
may be needed. However, the pumps on De Groot Dairies were of sufficient size.
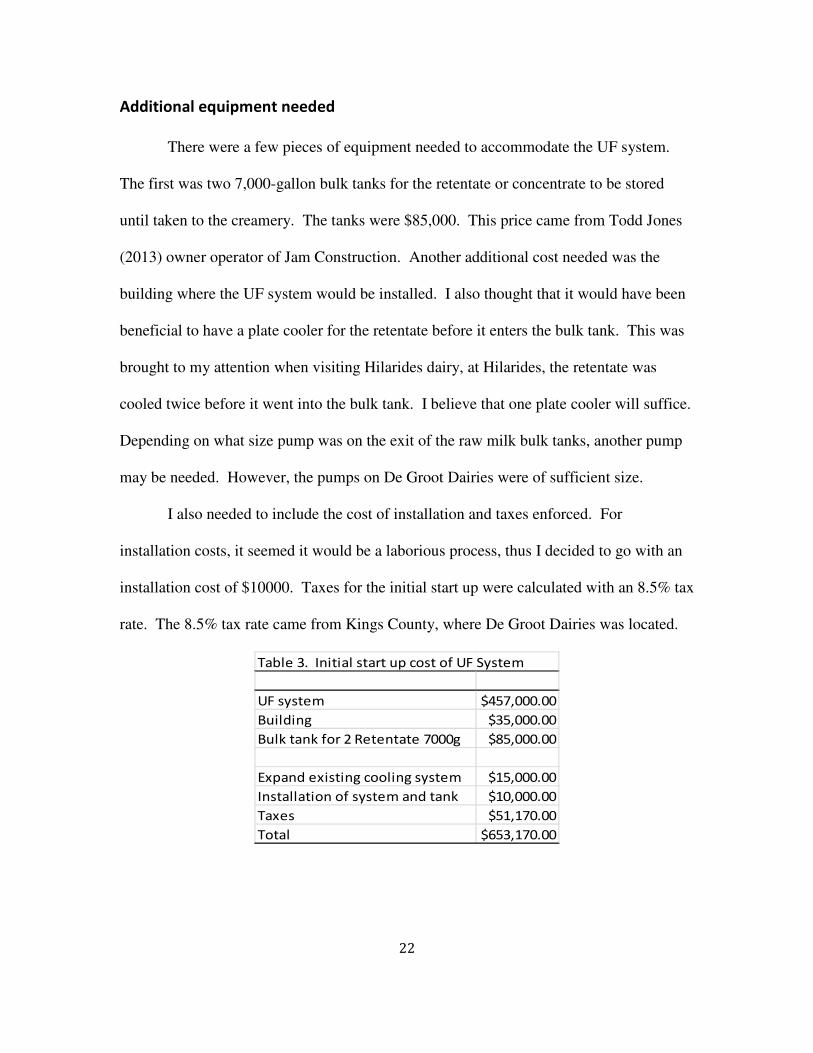
I also needed to include the cost of installation and taxes enforced. For
installation costs, it seemed it would be a laborious process, thus I decided to go with an
installation cost of $10000. Taxes for the initial start up were calculated with an 8.5% tax
rate. The 8.5% tax rate came from Kings County, where De Groot Dairies was located.
Table 3. Initial start up cost of UF System
UF system $457,000.00
Building $35,000.00
Bulk tank for 2 Retentate 7000g $85,000.00
Expand existing cooling system $15,000.00
Installation of system and tank $10,000.00
Taxes $51,170.00
Total $653,170.00
23
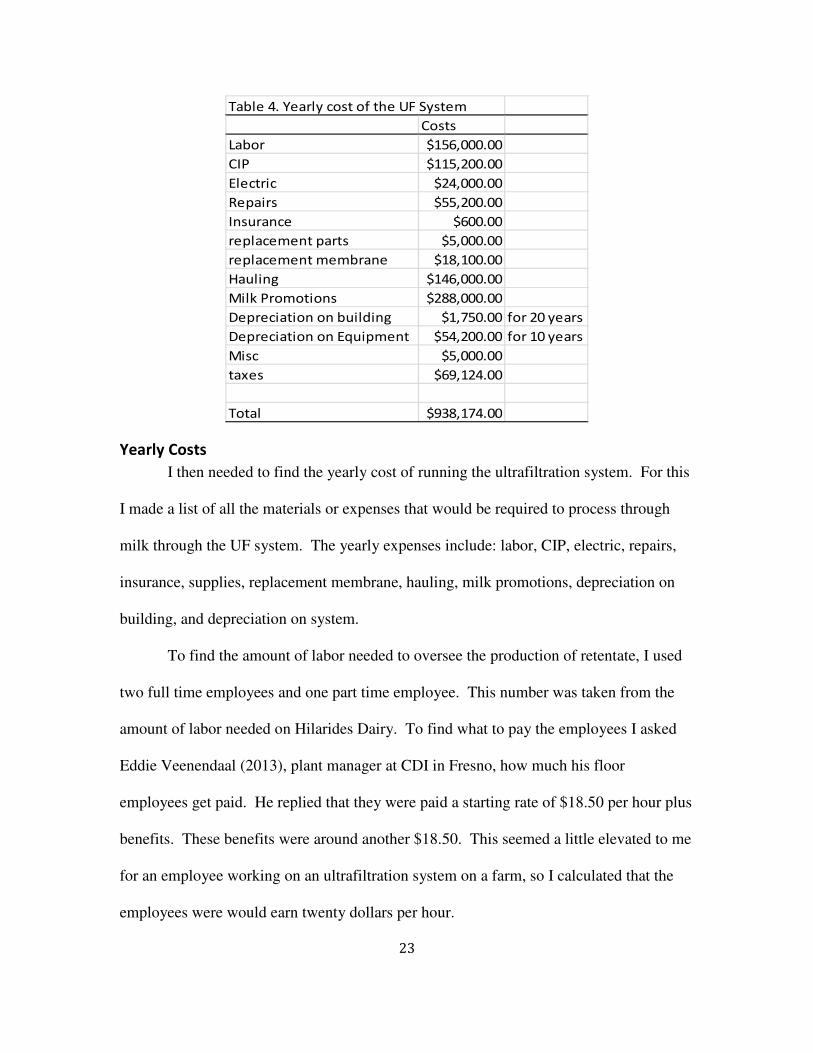
Table 4. Yearly cost of the UF System
Costs
Labor $156,000.00
CIP $115,200.00
Electric $24,000.00
Repairs $55,200.00
Insurance $600.00
replacement parts $5,000.00
replacement membrane $18,100.00
Hauling $146,000.00
Milk Promotions $288,000.00
Depreciation on building $1,750.00 for 20 years
Depreciation on Equipment $54,200.00 for 10 years
Misc $5,000.00
taxes $69,124.00
Total $938,174.00
Yearly Costs
I then needed to find the yearly cost of running the ultrafiltration system. For this
I made a list of all the materials or expenses that would be required to process through
milk through the UF system. The yearly expenses include: labor, CIP, electric, repairs,
insurance, supplies, replacement membrane, hauling, milk promotions, depreciation on
building, and depreciation on system.
To find the amount of labor needed to oversee the production of retentate, I used
two full time employees and one part time employee. This number was taken from the
amount of labor needed on Hilarides Dairy. To find what to pay the employees I asked
Eddie Veenendaal (2013), plant manager at CDI in Fresno, how much his floor
employees get paid. He replied that they were paid a starting rate of $18.50 per hour plus
benefits. These benefits were around another $18.50. This seemed a little elevated to me
for an employee working on an ultrafiltration system on a farm, so I calculated that the
employees were would earn twenty dollars per hour.
24
To clean the system a CIP was used, every day chemicals were used. The
chemicals were not cheap. According to Dan Hilaredes (2013), his chemicals run about
$12,000 for 5 weeks of cleaning. To get the price of chemicals needed for one year I
took 12000/5 to find the amount of dollars per week then times by 52 to find the cost for
the full year. This cost can be seen on table 5 under CIP.
The system would require electricity run. According to GEA Process
Engineering, Inc., the system takes 680 Kwh/d. To find the electricity cost, I looked up a
previous bill from Southern California Edision (2013) and found what it had cost for one
Kwh. Multiplied 680 times 365 to get how many Kwh/yr. then multiplied that by the
price of one Kwh.
Similar to any system on a dairy, there were breakdowns. This area was harder to
calculate the cost of because it was unsure what part needed to be replaced or modified.
For my calculations I looked at how much De Groot Dairies were spending on repairs
each month. This past year was a big year for repairs due to pumps going out. I thought
that $55,200 would be sufficient for money set aside.
The ultrafiltration needs to be insured. To do this I found what it currently costs
De Groot Dairies to insure their milk barn which was around 4000 for the full year. Then
I found what the initial cost had been for the milk barn and found a ratio of initial cost to
insurance cost. The ratio gave me a cost of $600.
I estimated the cost of replacement parts to be $5,000. This was because I felt
that throughout the year parts will wear out eventually. These parts needed would be
considered almost like maintenance parts. The system was still functioning, but the part
needed to be replaced to let the system be more efficient, or to prevent a larger repair.
25
The system had spiral bound membranes. Those membranes were susceptible to
fouling. The pores on the membrane would overtime become corrupted and the
efficiency of the system will decline. GEA Process Engineering, Inc. recommended that
the filter be replaced every year. The cost of the membranes was $18,100 to replace.
The milk was hauled three times less than if no ultrafiltration was present. To
find the hauling I took the price of hauling for the full year of 2012. This was $438,000.
I then divided that by three because it would be one load of retentate to three loads of raw
milk. That would be the cost of hauling UF milk.
Milk promotions cost consist of many different fees. The fees include Dairy
Council, Regional Quota Adj, National Dairy Promotion, Market Milk, Dairy Food
Control Fee, Market order, Inspection fee, and Pac Contribution. These costs would not
be different. Milk promotions will cost the same for raw milk and retentate. The cost of
De Groot Dairies milk promotions was $288,000.
Over time most equipment or buildings lose their value. For this reason I
included a depreciation cost for the building and the UF system. To find the depreciation
cost of a building I called Sousa and Company (2013). They informed me that a building
depreciates at 1/20 for 20 years. This means that every year the building decreases in
value by $1,750.
The depreciation of the system was said to be 1/10 for 10 years. The one tenth
came from Sousa and Company who was certified public accountants and consultants. I
used Sousa and Company because they helped consult with De Groot Dairies and their
budgets.

26
I also included a miscellaneous cost. I thought that it would was necessary
because sometimes problems arise and it might not fit as a cost in another category. In a
way it is an insurance policy.
Taxes were then added with an 8.5% rate. This 8.5% came from the taxes in
Kings County, where the proposed facility is located.
SAVINGS
I then proceeded to find the money that would be saved, by the implementation of
the ultrafiltration system. Hauling milk was reduced to one load instead of three loads.
For this I used De Groot Dairies cost of hauling milk per year and times it by 2/3 to find
how much they would save on hauling.
The other factor that I calculated in finding the money saved on the
implementation of the ultrafiltration system was the savings in the heifer ration when
permeate was fed. I then found the amount of heifers on De Groot Dairies, which was
3,677. According to Flemming (1999) when permeate was fed it replaces two pounds of
corn per day per cow. I then took the price of earlage which was valued at $200 per ton.
To find how much earlage would be replaced I used 3677 heifers times by 2 lbs per day
times by 365 days and then divided it by 200 to get how many tons were consumed per
year. I then calculated the savings with all heifers for the entire year to get a savings of
$268,421.
Results
For the results of my project, I made a running balance for all the costs involved
with the ultrafiltration system, this included the yearly and initial cost. The running costs
are shown in table 4.
27
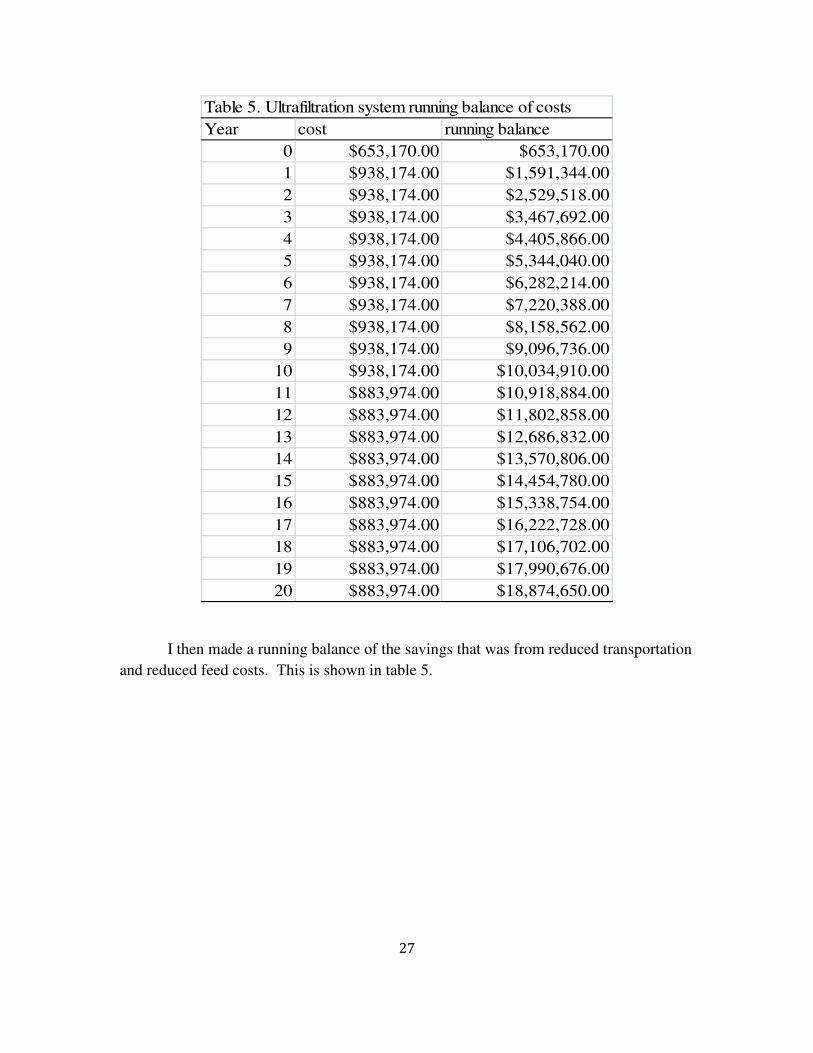
Table 5. Ultrafiltration system running balance of costs
Year cost running balance
0 $653,170.00 $653,170.00
1 $938,174.00 $1,591,344.00
2 $938,174.00 $2,529,518.00
3 $938,174.00 $3,467,692.00
4 $938,174.00 $4,405,866.00
5 $938,174.00 $5,344,040.00
6 $938,174.00 $6,282,214.00
7 $938,174.00 $7,220,388.00
8 $938,174.00 $8,158,562.00
9 $938,174.00 $9,096,736.00
10 $938,174.00 $10,034,910.00
11 $883,974.00 $10,918,884.00
12 $883,974.00 $11,802,858.00
13 $883,974.00 $12,686,832.00
14 $883,974.00 $13,570,806.00
15 $883,974.00 $14,454,780.00
16 $883,974.00 $15,338,754.00
17 $883,974.00 $16,222,728.00
18 $883,974.00 $17,106,702.00
19 $883,974.00 $17,990,676.00
20 $883,974.00 $18,874,650.00
I then made a running balance of the savings that was from reduced transportation
and reduced feed costs. This is shown in table 5.
28
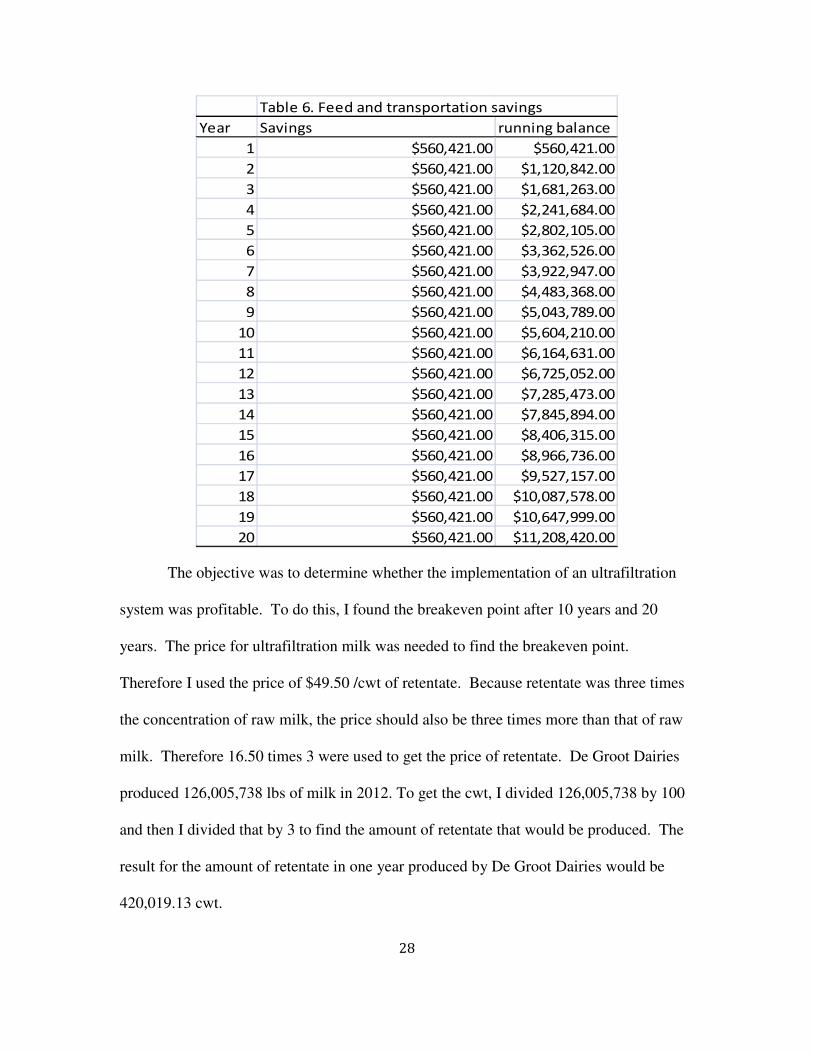
Table 6. Feed and transportation savings
Year Savings running balance
1 $560,421.00 $560,421.00
2 $560,421.00 $1,120,842.00
3 $560,421.00 $1,681,263.00
4 $560,421.00 $2,241,684.00
5 $560,421.00 $2,802,105.00
6 $560,421.00 $3,362,526.00
7 $560,421.00 $3,922,947.00
8 $560,421.00 $4,483,368.00
9 $560,421.00 $5,043,789.00
10 $560,421.00 $5,604,210.00
11 $560,421.00 $6,164,631.00
12 $560,421.00 $6,725,052.00
13 $560,421.00 $7,285,473.00
14 $560,421.00 $7,845,894.00
15 $560,421.00 $8,406,315.00
16 $560,421.00 $8,966,736.00
17 $560,421.00 $9,527,157.00
18 $560,421.00 $10,087,578.00
19 $560,421.00 $10,647,999.00
20 $560,421.00 $11,208,420.00
The objective was to determine whether the implementation of an ultrafiltration
system was profitable. To do this, I found the breakeven point after 10 years and 20
years. The price for ultrafiltration milk was needed to find the breakeven point.
Therefore I used the price of $49.50 /cwt of retentate. Because retentate was three times
the concentration of raw milk, the price should also be three times more than that of raw
milk. Therefore 16.50 times 3 were used to get the price of retentate. De Groot Dairies
produced 126,005,738 lbs of milk in 2012. To get the cwt, I divided 126,005,738 by 100
and then I divided that by 3 to find the amount of retentate that would be produced. The
result for the amount of retentate in one year produced by De Groot Dairies would be
420,019.13 cwt.
29
This 420,019.13 cwt was multiplied by the price of $49.50 cwt, which would be
the same as the price of raw milk and not using the ultrafiltration system. This was
needed to find how much more of a bonus or premium was needed to break even with all
the added costs of running the system minus the benefits of feed and transportation.
I wanted to find the breakeven point at ten years and twenty years. To do this I
took the running balance of the costs at 10 years minus the savings in feed and
transportation at 10 years and determined costs exceeded feed and hauling savings by
$4,430,700. Then I divided it by 10 because I wanted to find the loss per year, which
gave me $443,070. The next step was to find how much more per hundred weight of
retentate was needed to break even. For this I took $443,070 divided by the amount of
retentate produced in a year which was 420019.13, which equals $1.05 cwt of retentate.
This means that in order to breakeven after 10 years, the price of retentate would need to
be $50.55 cwt. I followed the same steps to find the breakeven price at 20 years and
needed an additional price of $0.91 cwt. The final price needed to break even after 20
years was $50.41 cwt of retentate.
Net present value (NPV) was also calculated for the costs and the savings of the
system. The net present value of costs after 20 years given a rate of 5% was
$12,056,854.63. NPV shows the present value of future money today, in this case, 20
years in the future. The NPV for the savings was $6,984,084.38. This shows that in 20
year, the dairyman will loose $5,072,770.24a in today’s value of money. This was
calculated by taking $12,056,854.63 – $6,984,084.38 = $5,072,770.24.
Discussion
30
There were many different variables in calculating the costs of the system. The
system chosen will have an impact on the initial price of the system. The system was
designed for De Groot Dairies and their milk flow. Every dairy was different and needs to
be looked at individually.
There are many dairies that may have a long haul to the processing plant. The
ultrafiltration and reverse osmosis would be a great tool to reduce the hauling cost. To
find the savings on hauling, divide the current hauling cost of the dairy at hand by three.
This would calculate new cost of shipping retentate. Then subtract the old cost by the
new cost to find the savings. The longer the haul, the more likely the system will be able
to pay for itself.
It was difficult to find the price given for UF milk. I emailed David Ahlem
(2013) from Hilmar Cheese asking for the price, however, he replied saying that they do
not share their pay formula because it is proprietary. I also contacted California Dairies
Inc. to find the price, however they said that they do not have customers with UF milk,
thus they do not have a price. That was why I had to use the regular price of $16.50 for
regular raw milk and multiplied it by three, for being three times concentrated.
If done again I would change a few things. The first would be to install a larger
system. I would want the system to process all of the milk and clean up in half the time.
It was seen that the labor costs are high. The Implementation of a larger system will
allow for one less employee needed to run the system. Secondly I would research the
rules and regulations more in depth. The CDFA website had a good start, but I believe
that a more in depth look at the regulations would be beneficial. Third, I would try
harder to get a hold of the price that processors give for UF milk or retentate.
31
Conclusion
The results of my partial budget for ultrafiltration milk showed that when an on
farm UF system was implemented, the dairyman would get a hauling and feed benefit.
However when I calculated the costs saved, the input and yearly costs outweighed the
benefits. All research done was according to De Groot Dairies projected milk weights
and milk price. I would recommend that if researching on farm ultrafiltration, that the
data is changed to match the proposed dairy. I would conclude that at this point in time,
on farm ultrafiltration was not a viable option for a dairyman to implement.
32
WORKS CITED
Ahlem, D. (2013, February 22). Interview by J De Goot [Personal Interview]. Receiving of
ultrafiltration milk.
Arndt, D. (2013, February 8). Interview by J De Goot [Personal Interview]. Ultrafiltration system
information and pricing.
Barbano, D. M., and D. G. Bynum. 1984. Whole milk reverse osmosis retentates for cheddar
cheese manufacture: cheese composition and yield. J. Dairy Sci. 67:2839-2849.
Barbano, D. Potential impacts of new processing technologies on milk marketing. Accessed Jan.
31, 2013
California Department of Food and Agriculture. 1999. Reverse osmosis and ultrafiltration.
Accessed Jan. 17, 2013. www.cdfa.ca.gov/dairy/ro_ultrafiltration.html.
Covington, C. 2004. Membrane filtration of milk. Accessed Jan31, 2013.
http://www.southerndairyconference.com/Documents/2004%20Covington.pdf
Fleming, R. 1999. On-farm concentration of milk. Pages 49-54 in Western Dairy Management
Conference., Las Vegas, NA.
GEA Process Engineering. Membrane Filtration. Reverse osmosis, nanofiltration, ultrafiltration
and microfiltration. Accessed Jan31, 2013. http://www.gea-
wiegand.com/geawiegand/cmsresources.nsf/filenames/Membrane_Filtration_EN2012.pdf
/$file/Membrane_Filtration_EN2012.pdf.
Hiddink, J., R. de Boer, and P. F. C. Nooy. 1979. Reverse osmosis of dairy liquids. J. Dairy Sci.
63:204-214.
Hilarides, D. (2013, February 14). Interview by J. De Goot [Personal Interview]. On farm
ultrafiltratin system.
33
Jones, T. (2013, February 15). Interview by J. De Goot [Personal Interview]. Equipment pricing.
Kosikowski, F. V., 1973. Cheesemaking by ultrafiltration. J. Dairy Sci. vol. 57. No.4.
Kuan, R., C. Hunt, C Perkins. 1998. Ultafiltration. Accessed Feb. 7, 2013.
http://www.calpoly.edu/~ceenve/enve/jsczechowski/enve436/projects/Uf/Ultrafiltration.h
tml
Maubois, J. L., and G. Mocquot. 1974. Application of membrane ultrafiltration to preparation of
various types of cheese. J. Dairy Sci. Vol. 58, No.7.
Microsoft. (2010). Microsoft Excel [computer software]. Redmond, Washington: Microsoft.
Southern California Edison. January 2013. Electric Bill. De Groot Dairies. Accessed February
15, 2013.
Pouliot, Y.. 2008. Membrane processes in diary technology-from simple idea to worldwide
panacea. International Dairy Journal. Doi: 10.1016/j.idairyj.2008.03.005.
Sousa and Company. (2013, February 15). Interviewed by J. De Groot [Personal Interview]
Depreciation costs.
Tang, X., S.H. Flint, J. D. Brooks and R.J. Bennett. 2009. Factors Affecting the attachment of
micro-organisms isolated from ultrafiltration and reverse osmosis membranes in dairy
processing plants. Journal of Applied Microbiology. Doi:10.1111/j.1365-
2672.2009.04214.x.
Veenendaal, E. (2013, January 26). Interview by J. De Groot [Personal Interview]. Reverse
osmosis and ultrafiltration.
Vyas H. K., and P.S. Tong. 2003. Process for calcium retention during skim milk ultrafiltration.
J. Dairy Sci. Vol. 86, No. 9, 2003
34
Wichell, E. H., and J. W. Hammond. 1984. An analysis of marketing cost impact of reverse
osmosis concentration of milk. Pages 1- 57 in Economic report ER84-1. University of
Minnesota
Wikipedia. 2013. Osmotic pressure. Accessed Jan. 31, 2013.
http://en.wikipedia.org/wiki/Osmotic_pressure
Wozniacka, G. 2012. Calif dairies going broke due to feed, milk prices. Accessed Feb. 20, 2013.
http://finance.yahoo.com/news/calif-dairies-going-broke-due-feed-milk-prices-
163004062--finance.html.