review of an empirical turbine noise prediction method
TRANSCRIPT

A Review of an Empirical Turbine Noise Prediction MethodNoise Prediction Method
Kyle GroseKyle GroseAAE 615

ObjectiveInvestigate the physics behind the empirical turbine noise prediction method presented by Bruce Morin and Oliver Atassi at the 2008 AARC Turbine Noise and Oliver Atassi at the 2008 AARC Turbine Noise WorkshopCompare against the popular G E empirical turbine Compare against the popular G.E. empirical turbine predictionInvestigate how the Morin‐Atassi Prediction Model gcompares against measured data.

Why is Turbine Noise Important?As noise reduction technology has progressed, once dominant noise sources that used to mask lesser noise sources have become suppressed.
Lesser noise sources, such as the turbine, are now significant contributors to community noise especially in the approach condition
Typical Engine Noise Component DistributionApproach Condition Figure from Mathews Combustion
And Turbine Noise Work at Pratt &WhitneyPresented at Core Noise Workshop in Phoenix, AZFebruary 2003

Turbine Noise Generation MechanismsThere are two types of generation mechanisms for turbine noise: potential field interactions and blade‐wake interactions
Figure from Morin and Atassi An Empirical ModelFor Turbine Noise Prediction presented at AARC Turbine Noise Workshop in Vancouver, BCMay 2008

Potential Field InteractionsPotential Field Interactions
Solid bodies in free stream flow create potential fieldsPotential fields can travel and interact with other objects or other flow jphenomenaFlow passing by a stator will cause a potential field that can travel upstream and impinge upon the upstream rotor row causing pressure fluctuations th f ti itherefore generating noisePotential field tends to decay rapidly and because of blade spacing in turbine stages the potential fields cause weak excitations
Blade‐wake Interactions are often seen as the dominant noise generation mechanism of turbine noise

Blade‐wake InteractionsBlade‐wake interactions occur when viscous wakes are shed off of either rotor blades or stator vanes and interact with either stator or rotor blades next to it.
Th k i i i th bl d t d lift f th bl d The wakes impinging on the blade cause unsteady lift forces on the blade which generates noise
Viscous wakes do not decay as fast as a potential field. Viscous wakes are the dominant noise sourcethe dominant noise source.
Figure from M.J.T. Smith Aircraft Noise, Cambridge University Press, New York, 1989

M i At i M d lMorin‐Atassi ModelOAPWL Due to Airfoil Row
Morin‐Atassi model assumes turbine noise is dominated by blade wakesF i l f i f il h d d d i For a single row of airfoils the sound power produced is dependent on the following:
Sound Power
Upwash
Pressure Loss Factor
Spacing/Chord Ratio
Annulus Area
Temperature
Upwash
Duct Mach NumberPressure
p, q, and r are empirical constants

M i A i M d lMorin‐Atassi ModelWhere do the Parameters Come From
Even though this is an empirical model there needs to be rationale behind the parameters chosen
Curle’s Equation
Pressure is dependent upon the forceWhat is the force due to a viscous wake on a blade?What is the force due to a viscous wake on a blade?

Unsteady Forces on a Blade Due toUnsteady Forces on a Blade Due to Viscous Wake
Kemp and Sears wrote a paper “Unsteady Forces Due to Viscous Wakes in Turbomachinery” (1955)
Described the upwash on a blade due to a viscous wake as dependent upon drag coefficient (CD) and
h d ( b) bl flspacing/chord ratio (s/b) in an incompressible flow
Lift is dependent upon the upwashp p p
Therefore unsteady force dependent upon CD and ( b)(s/b)
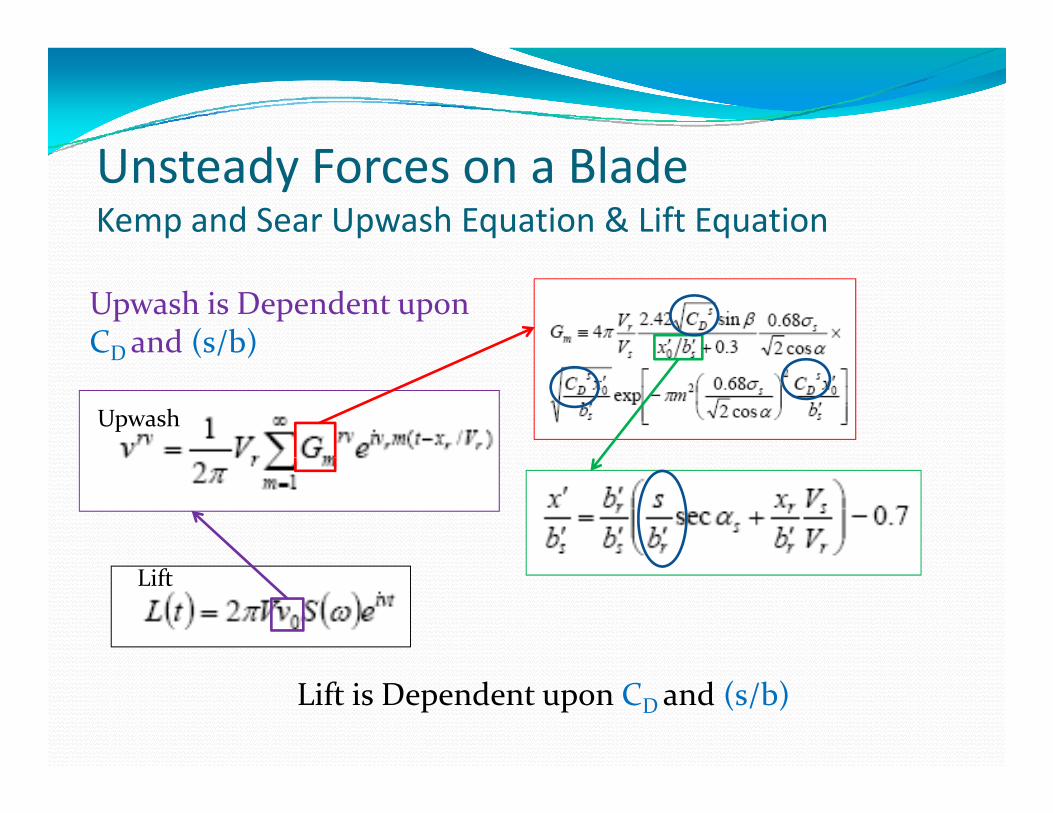
U d F Bl dUnsteady Forces on a BladeKemp and Sear Upwash Equation & Lift Equation
Upwash is Dependent upon CDand (s/b)
Upwash
D ( / )
Lift
Lift is Dependent upon CDand (s/b)

M i A iMorin‐Atassi Kemp and Sears Contribution
Simplified CD = Pressure Loss Coefficient (ξ)
Kemp‐Sear’s Lift Model
Where Do TheseCome From?
W = P*A(assuming free‐field)

U d F Bl dUnsteady Forces on a BladeOsborne Compressible Model
Osborne wrote a paper “Compressible Unsteady Interactions Between Blade Rows” (1972)
C ibili i I Th i i ifi Compressibility is Important. There is significant impact on lift fluctuations by varying Mach number
Lift Model for Compressible FlowLift Model for Compressible FlowUpwash from Sears‐Kemp
RTp ρ=)sqrt( RTc
McVγ=
=
Lift dependent upon T1/2, p, M, (s/b), and ξ)sqrt( RTc γ=

M i At i M d lMorin‐Atassi ModelOAPWL for Turbine Stage
OAPWL before described for a single airfoil, the OAPWL for a turbine stage is the following:
Upstream Vane Wake/BladeInteraction
Blade Wake/Downstream VaneInteraction

OAPWL f T bi SOAPWL for Turbine StageAdditional Terms
Along with the superposition of blade‐wake interactions, there is also the inclusion of K,C, and τ
K Modal Cut On/Cut Off ParameterK – Modal Cut‐On/Cut‐Off ParameterNot all modes creating from interaction couple with duct modeIf mode is “cut‐on” K = 1, if “cut‐off” K=0.
τ – Transmission Loss CoefficientModes propagating downstream will interact with other blade row
Energy may get scatteredT i i ffi i t i th ti f th i iti l t d Transmission coefficient is the portion of the initial energy generated by the blade‐wake interaction that makes it to the farfield
C – Additional Empirical Coefficientp

OAPWLOAPWLDiscrete Frequency and “Haystack” Components
OAPWL represents both the discrete frequency and broadband levelT bi iTwo components to turbine noise
Discrete Frequency (turbine tones)Broadband (Haystacks)Broadband (Haystacks)
Figure from Mathews CombustionAnd Turbine Noise Work at Pratt & WhitneyPresented at Core Noise Workshop in Phoenix, AZFebruary 2003

Turbine Tones and Haystack GenerationTurbine Tones
Turbine tones occur because of the periodic interaction of the rotating rotor blades with h the stator vanes
Fi HaystacksHaystacks occur external to the turbineAs the tone propagates out the exhaust, it
Fig. 1
p p g ,moves through the fan/ambient shear layerTurbulence in this layer causes the tone to modulate and spectrally spread out.
“Haystacks” are generatedFigure 2 from Mathews CombustionAnd Turbine Noise Work at Pratt & WhitneyPresented at Core Noise Workshop in Phoenix, AZFebruary 2003
Fig. 2
Figure 1 from M.J.T. Smith Aircraft Noise, Cambridge University Press, New York, 1989

OAPWLOAPWLTonal and Haystack Level
Tonal level is found by directly applying the OAPWL modelBecause of complexity of the tonal modulation, an envelope was empirically derived to describe the haystack envelope was empirically derived to describe the haystack spectral shape.
Measured data was analyzed and a mean curve was created for the Haystack envelope
Figure from Morin and Atassi An Empirical ModelFor Turbine Noise Prediction presented at AARC Turbine Noise Workshop in Vancouver, BCMay 2008

G.E. Empirical ModelKazin and Matta formulated an empirical model for turbine prediction in the 1970’s. It is still popular and found in many papersfound in many papers.
SPL prediction for both tonal and broadband levelsHave another equation for the peak SPL level (tonal Have another equation for the peak SPL level (tonal component)
Subtract the peak SPL from the OASPL to find pbroadband level

Morin‐Atassi vs. Kazin‐MattaMorin‐Atassi
X XKazin‐Matta
X
Kazin‐Matta recognized significance in blade spacing but did not include it in
)1/−)−=Δ γγξ (^/1(1/TT
Kazin Matta recognized significance in blade spacing but did not include it in their modelKazin‐Matta rely on the relative blade velocity as opposed the duct Mach number in the Morin‐Atassi modelEven though they both attempt to predict the same thing there are major Even though they both attempt to predict the same thing, there are major differences between the two

M i A iMorin‐AtassiPrediction vs. Measured
Used Pratt & Whitney measured data to obtain empirical constants and “haystack” spectral shapesI f d i i l ffi i f h i Inferred transmission loss coefficients for the various turbine stagesObtained good Obtained good correlation between the measured and predicted results
Figure from Morin and Atassi An Empirical ModelFor Turbine Noise Prediction presented at AARC Turbine Noise Workshop in Vancouver, BCMay 2008

Comparison of Different EmpiricalComparison of Different Empirical Methods
In 1975, Mathews and Nagel conducted a review of turbine noise prediction methods used at NASA, G.E., Pratt & Whitney and Rolls‐Royce
d h h d f l dDiscovered that the prediction for a single engine varied widely across the groups involved in the reviewThough the Morin‐Atassigmethod might correlate well with P&W data, it might not work as well might not work as well when predicting turbine noise for a different engine
Figure from Mathews, et al “Review of Theoryand Methods for Turbine Noise Prediction,”AIAA Paper No. 75‐540, 1975

ConclusionsMorin‐Atassi method appears to have strong ties to blade‐wake interaction theoryB f d fi i i l i b d h Before a definitive conclusion can be made on the accuracy of the model, the model needs to be validated against a variety of enginesvalidated against a variety of engines.

References