review of retail floorspace demand
TRANSCRIPT
Directions for Bay Street Review of Retail Floorspace Demand
City of Port Phillip December 2008

This Report has been prepared for:
This report has been prepared by: SGS Economics and Planning Pty. Ltd.
ACN 007 437 729
5th Floor, 171 Latrobe Street,
Melbourne Victoria 3000
phone: 61 3 8616 0331
fax: 61 3 8616 0332
email: [email protected]
web: www.sgsep.com.au
Offices in Melbourne, Sydney, Brisbane, Hobart, Canberra
Table of Contents
20082125 Future Directions for Bay Street_04_Final.doc
Table of Contents
Executive Summary ..................................................................... 1
1 Introduction ........................................................................ 3
1.1 Background ............................................................................................................ 3 1.2 Task ...................................................................................................................... 4 1.3 Study Area ............................................................................................................. 5
2 Retail Floor Space Demand Analysis ....................................... 7
2.1 Available Retail Expenditure ...................................................................................... 7 2.2 Bay Street Activity Centre Turnover ............................................................................ 9 2.3 Bay Street Floorspace Demand ................................................................................ 10 2.4 Impact Assessment ............................................................................................... 13
2.4.1 Scenario 1 ............................................................................................... 14 2.4.2 Scenario 2 ............................................................................................... 14 2.4.3 Impact Analysis Results ............................................................................. 14 2.4.4 Comparison of Results ............................................................................... 17
3 The Strategic Context for Bay Street .................................... 18
3.1 'City to Bay Boulevard' Plan in 1980s ........................................................................ 18 3.2 Inner Melbourne Action Plan (IMAP).......................................................................... 21 3.3 International Interest in Public Transport Boulevards ................................................... 26 3.4 Prospects for a Bay Street Boulevard Today ............................................................... 27
3.4.1 Urban Form of Boulevard ........................................................................... 30 3.5 Planning and Design of Bay Street, Port Melbourne ..................................................... 32
3.5.1 Niches for Bay Street................................................................................. 32
Appendix .................................................................................. 36
Economic and Social Order in Retailing and Shopping .................................................. 36
Tables
Table 1: National Retail Expenditure Per Capita (2006$) ......................................................... 8 Table 2: Bay Street Household Expenditure Variation by Income (2003 $) ................................. 8 Table 3: Retail Expenditure in Bay Street by residents in Bay Street and surrounding areas 2006 to
2021 ............................................................................................................... 9 Table 4: Retail Turnover of Bay Street Activity Centre 2006 to 2021 ......................................... 9 Table 5: Business as Usual Forecast RTD ........................................................................... 10 Table 6: Bay Street Retail Floorspace 2008 ........................................................................ 10 Table 7: Standard RTD (2006$) ....................................................................................... 11
Table of Contents
20082125 Future Directions for Bay Street_04_Final.doc
Table 8: Bay Street Floorspace Demand ............................................................................ 12 Table 9: Williamstown Road Development Assumptions (Zone 80) ......................................... 14 Table 10: Impact Assessment for Bay Street - Summary ...................................................... 16 Table 11: Future Directions Strategy Paper January 2006 Results Vs. 2008 Retail Forecasts ....... 17
Figures
Figure 1: Bay Street Context ............................................................................................. 5 Figure 2: National Retail Spending per Capita ....................................................................... 7 Figure 3: Competing Centre for Impact Assessment. ............................................................ 13 Figure 4: Impact on Turnover in Bay Street ........................................................................ 15 Figure 5: Physical Framework (Fig.15) ............................................................................... 19 Figure 6: Development Proposals (Fig.16) .......................................................................... 20 Figure 7: Multiple Links (neither fig number cited nor key provided) ....................................... 21 Figure 8: Portland Metro Corridor Concept Diagram ............................................................. 26 Figure 9: Portland Metro Corridor Map ............................................................................... 27 Figure 10: Bay Street – North View ................................................................................... 28 Figure 11: Bay Street – South View .................................................................................. 28 Figure 12: Southbank to the Bay Link................................................................................ 29 Figure 13: Typical Boulevard Profile ................................................................................... 30 Figure 14: City of Melbourne: Swanston Street profile with tram tracks and ‘Copenhagen’ bicycle
lanes ............................................................................................................ 31 Figure 15: Profile of Typical Boulevard in Portland (Oregon) .................................................. 31

Future Directions for Bay Street / Retail Floorspace Review
20082125 Future Directions for Bay Street_04_Final.doc P. 1
Executive Summary
Bay Street is a designated ‘major’ activity centre under Melbourne 2030 and subsequently in
planning must be consistent with the metropolitan strategy. The Inner Melbourne Action Plan
(IMAP) is a joint venture of the municipalities of Melbourne, Port Phillip, Yarra and Stonnington to
achieve cooperation and plan coordination between themselves in implementing Melbourne 2030.
Given the rapid growth of residential development over the last 10 years in Port Melbourne, in and
around Bay Street, the retail growth potential is quite significant. SGS estimates show Bay Street
will have a retail turnover of $142.4 million by 2021 (a 3.3% growth from 2006), led by the
Supermarkets commodity sector, Hospitality and Services and Other Food. The growth in turnover
is translated into a demand for retail floorspace of 10,343 sqm. With respect to
accommodating the floorspace demand in Bay Street, it is important to look at the overall strategic
direction as SGS’s conclusion is that Bay Street should be recognised and planned as one of
Melbourne’s strategic boulevards that combined with its extension along City Road radiate from the
City to the Bay.
Currently the model of a boulevard that serves as a major transportation conduit is popular
internationally for restructuring established urban areas to be more pedestrian and public transport
friendly. These boulevards are commonly planned and developed as transport conduits with higher
density housing along them, rather like what is already being developed along Bay Street.
An appropriate way of identifying the niches to be introduced or strengthened along Bay Street is
to identify existing magnet destinations around which complementary dependent businesses can be
clustered. Bay Street has several magnet facilities with varying degrees of drawing power and
potential:
• Beach destination and scene: foreshore of Port Philip Bay. The iconic entertainment
venue of Circus Oz is part of this
• Food-for-the-home: supermarkets
• Government services: especially local government such as public library, community
centre.
The precinct between Rouse Street and Beach Street (and along Beach Street) has special
potential because of its proximity to the foreshore and the Bay. This precinct could and should be
developed as a tourist/day tripping destination to rival Acland Street. There is a need for some
urban design branding that could and should be used to make this south precinct distinctive from
the remainder of Bay Street.
The waterfront around Station Pier is already evolving into a substantial tourist destination and
this could be reinforced by creative redevelopment of the south end of Bay Street and the
foreshore area between the two along Beach Street. This could be provided in the form of
entertainment venues to complement the pubs in the south end, and establishing more prominent
hospitality and services to entice visitors from the Pier, to venture to Bay Street.
‘Food for the home' is a very important and very large niche: the basic essentials in any
community. Most of the food-for-the-home businesses are located between Rouse Street and
Future Directions for Bay Street / Retail Floorspace Review
20082125 Future Directions for Bay Street_04_Final.doc P. 2
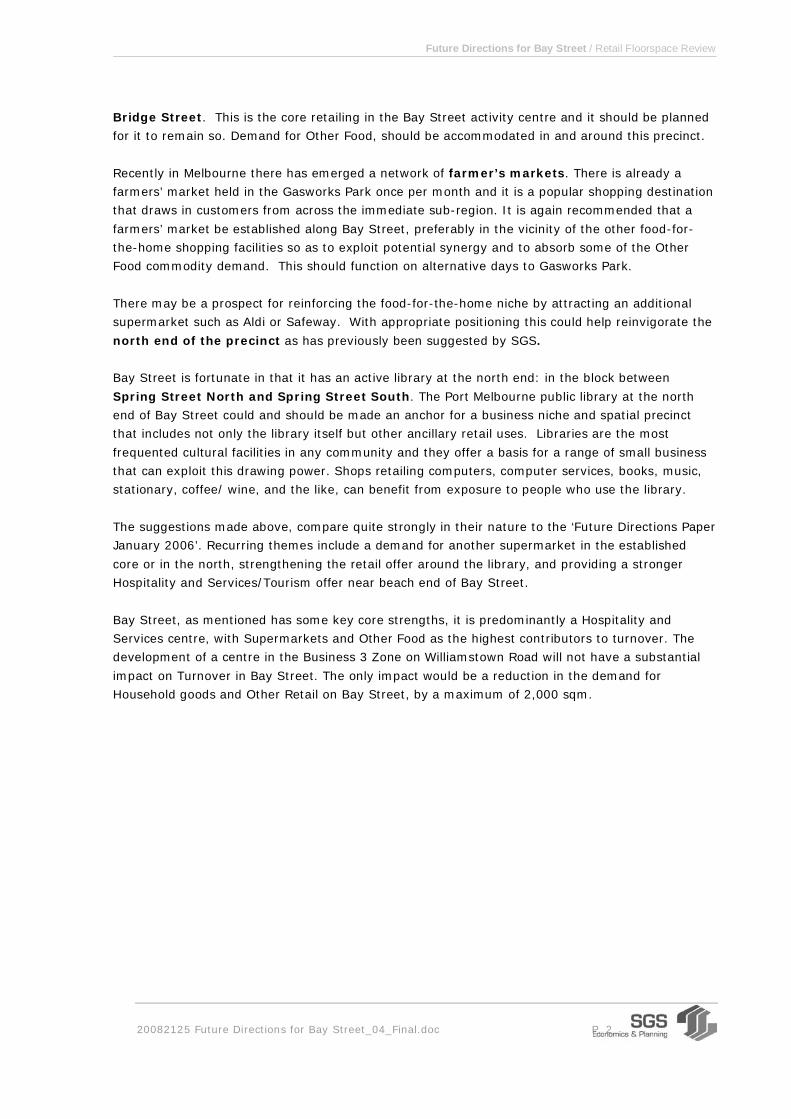
Bridge Street. This is the core retailing in the Bay Street activity centre and it should be planned
for it to remain so. Demand for Other Food, should be accommodated in and around this precinct.
Recently in Melbourne there has emerged a network of farmer’s markets. There is already a
farmers’ market held in the Gasworks Park once per month and it is a popular shopping destination
that draws in customers from across the immediate sub-region. It is again recommended that a
farmers’ market be established along Bay Street, preferably in the vicinity of the other food-for-
the-home shopping facilities so as to exploit potential synergy and to absorb some of the Other
Food commodity demand. This should function on alternative days to Gasworks Park.
There may be a prospect for reinforcing the food-for-the-home niche by attracting an additional
supermarket such as Aldi or Safeway. With appropriate positioning this could help reinvigorate the
north end of the precinct as has previously been suggested by SGS.
Bay Street is fortunate in that it has an active library at the north end: in the block between
Spring Street North and Spring Street South. The Port Melbourne public library at the north
end of Bay Street could and should be made an anchor for a business niche and spatial precinct
that includes not only the library itself but other ancillary retail uses. Libraries are the most
frequented cultural facilities in any community and they offer a basis for a range of small business
that can exploit this drawing power. Shops retailing computers, computer services, books, music,
stationary, coffee/ wine, and the like, can benefit from exposure to people who use the library.
The suggestions made above, compare quite strongly in their nature to the ‘Future Directions Paper
January 2006’. Recurring themes include a demand for another supermarket in the established
core or in the north, strengthening the retail offer around the library, and providing a stronger
Hospitality and Services/Tourism offer near beach end of Bay Street.
Bay Street, as mentioned has some key core strengths, it is predominantly a Hospitality and
Services centre, with Supermarkets and Other Food as the highest contributors to turnover. The
development of a centre in the Business 3 Zone on Williamstown Road will not have a substantial
impact on Turnover in Bay Street. The only impact would be a reduction in the demand for
Household goods and Other Retail on Bay Street, by a maximum of 2,000 sqm.

Future Directions for Bay Street / Retail Floorspace Review
20082125 Future Directions for Bay Street_04_Final.doc P. 3
1 Introduction
Given the growth in residential apartment development over the last 10 years and limited potential
development sites in Bay Street, City of Port Phillip has commissioned SGS to update the
information, statistics and estimates of the Activity Centres Review – Future Directions Strategy
Paper January 2006 to inform the background research for a structure plan for Bay Street.
1.1 Background
As identified in Future Directions Paper January 2006, Bay Street’s:
Strengths include:
• Coles supermarket providing a major retail anchor in the street.
• Heritage buildings providing character to an attractive streetscape.
• A diverse range of retail tenants.
• Day and night activity contributed to by Bay Street’s proximity to Station Pier and the
foreshore.
• A variety of residential accommodation and housing forms.
Weaknesses include:
• Insufficient retail along parts of the south side of Bay Street.
• Public transport along Bay Street, no train and no foreshore transit based connection to
St.Kilda.
• New development impacting on heritage built form.
• Use of lanes to link pedestrians to Bay Street.
As a designated major activity centre, Bay Street needs to position itself to respond to:
• A 64.6% increase in residential population over the last 10 years in Port Melbourne
(Census data 2006).
• An increase in the mix and diversity of retail opportunities.
• Providing a connectedness between Station Pier and the foreshore and the retail corridor.
• Improving the pedestrian experience into and out of the street by utilising existing lanes
and encouraging “through block” access in new developments. The key strategic directions for Bay Street Port Melbourne aim to:
• Strengthen the physical, visual and active connections between the waterfront, Bay Street
and Station Pier
• Increase visitor shopping activity and visitor facilities and services in Waterfront Place and
Beach Street
• Maintain and extend the mix and integration of land uses and activity in Bay Street
Future Directions for Bay Street / Retail Floorspace Review
20082125 Future Directions for Bay Street_04_Final.doc P. 4
• Protect the local urban character and townscape image
• Reinforce the current supermarket complex as the retail core
• Encourage pedestrian movement in surrounding streets
1.2 Task
• Use 2006 census data to review statistics and document findings in relation to:
-Retail turnover
-Projected turnover (to 2021)
-Projected net retail growth (to 2021)
-Retail floor space demand
• As it is not clear if there are any potential development sites available in Bay Street and/or
located in the Business 1 Zone and given the rapid growth of residential development over
the last 10 years in Port Melbourne, in and around Bay Street, where will the projected
total floor space demand of 21,727sqm (Jan 2006) or a revised projection as per above, be
accommodated?
• Highlight any changes in business/retail type and/or use that are documented in the Future
Directions Paper January 2006 for different precincts.
• Investigate the impact of a retail centre in the Business 3 Zone on Williamstown Road to
the north west of Bay Street. (Eg. Bunnings has now established on Williamstown Road.
This is not an activity centre and relies on car based visitation).
Future Directions for Bay Street / Retail Floorspace Review
20082125 Future Directions for Bay Street_04_Final.doc P. 5
1.3 Study Area
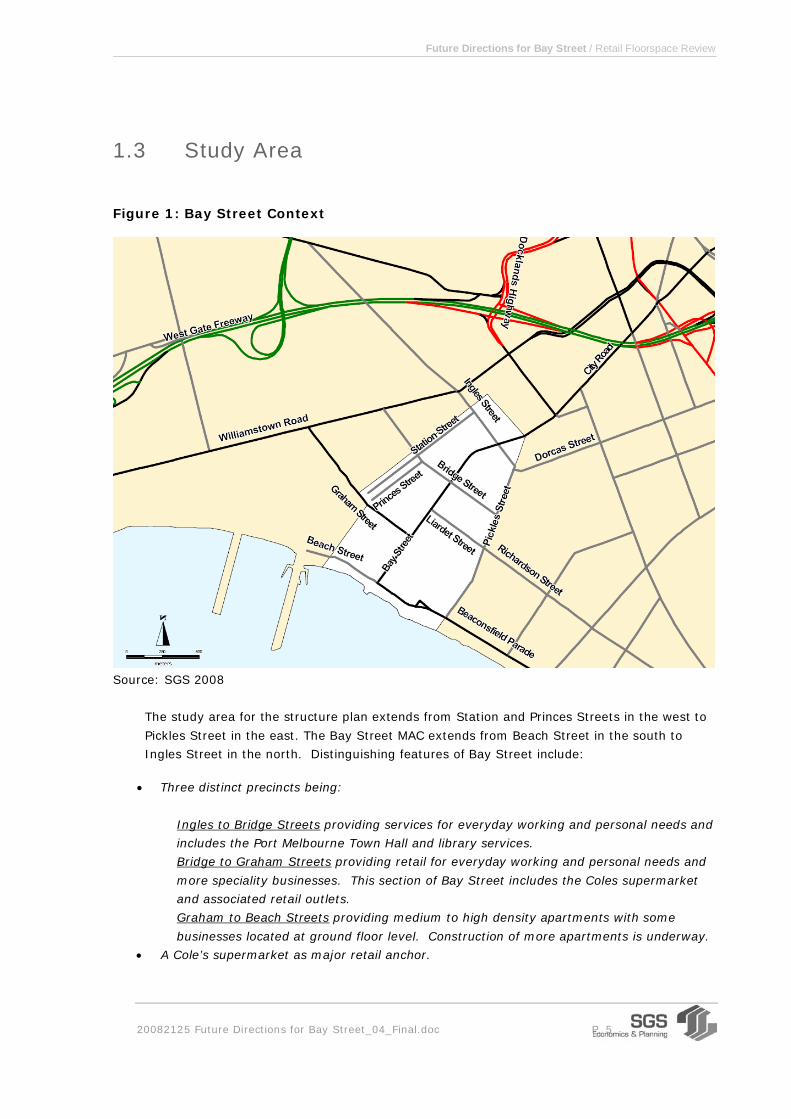
Figure 1: Bay Street Context
Source: SGS 2008
The study area for the structure plan extends from Station and Princes Streets in the west to
Pickles Street in the east. The Bay Street MAC extends from Beach Street in the south to
Ingles Street in the north. Distinguishing features of Bay Street include:
• Three distinct precincts being:
Ingles to Bridge Streets providing services for everyday working and personal needs and
includes the Port Melbourne Town Hall and library services.
Bridge to Graham Streets providing retail for everyday working and personal needs and
more speciality businesses. This section of Bay Street includes the Coles supermarket
and associated retail outlets.
Graham to Beach Streets providing medium to high density apartments with some
businesses located at ground floor level. Construction of more apartments is underway.
• A Cole’s supermarket as major retail anchor.
Future Directions for Bay Street / Retail Floorspace Review
20082125 Future Directions for Bay Street_04_Final.doc P. 6
• A proliferation of businesses between Ingles and Beach Streets with an increased number
of beauty salons, hairdressers, real estate and travel agents indicating an increased
affluence in the area.
• An attractive streetscape.
Future Directions for Bay Street / Retail Floorspace Review
20082125 Future Directions for Bay Street_04_Final.doc P. 7
2 Retail Floor Space Demand Analysis
2.1 Available Retail Expenditure
The latest population projections were obtained from the DSE on an SLA basis across Victoria.
These projections are based on the 2001 ABS Census, and take into account policies such as
Melbourne 2030. These population projections were then adapted to Journey to Work Travel Zone
(2001) based on land availability (as published in the 2006 Urban Development Program by the
DSE) and ABS ERP figures for 2006, for use in retail modeling.
To estimate the changing patterns of retail expenditure, regression analysis was performed on data
from 1983 to 2007 as published in the ABS Retail Trade publication (8501.0). This enabled an
estimate of how the real growth in national retail expenditure per capita has changed over time
and is expected to trend into the future. Results of the regression analysis are shown in the figure
below.
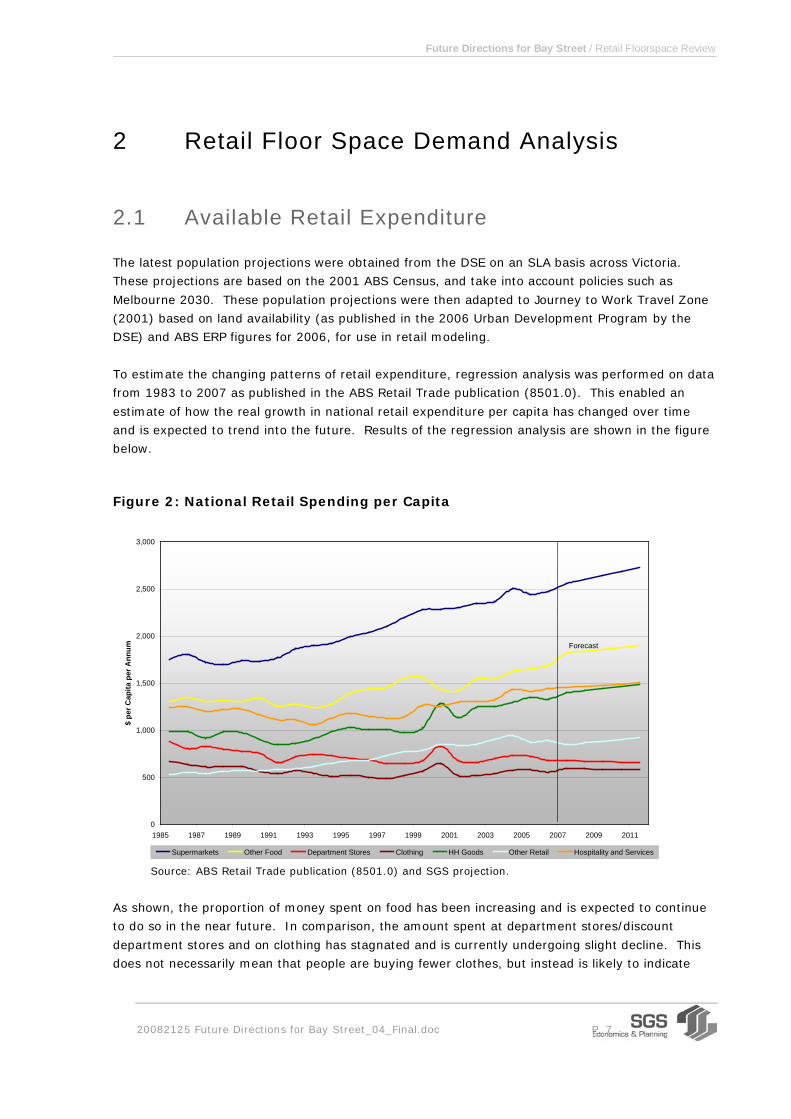
Figure 2: National Retail Spending per Capita
0
500
1,000
1,500
2,000
2,500
3,000
1985 1987 1989 1991 1993 1995 1997 1999 2001 2003 2005 2007 2009 2011
$ pe
r Cap
ita p
er A
nnum
Supermarkets Other Food Department Stores Clothing HH Goods Other Retail Hospitality and Services
Forecast
Source: ABS Retail Trade publication (8501.0) and SGS projection.
As shown, the proportion of money spent on food has been increasing and is expected to continue
to do so in the near future. In comparison, the amount spent at department stores/discount
department stores and on clothing has stagnated and is currently undergoing slight decline. This
does not necessarily mean that people are buying fewer clothes, but instead is likely to indicate
Future Directions for Bay Street / Retail Floorspace Review
20082125 Future Directions for Bay Street_04_Final.doc P. 8
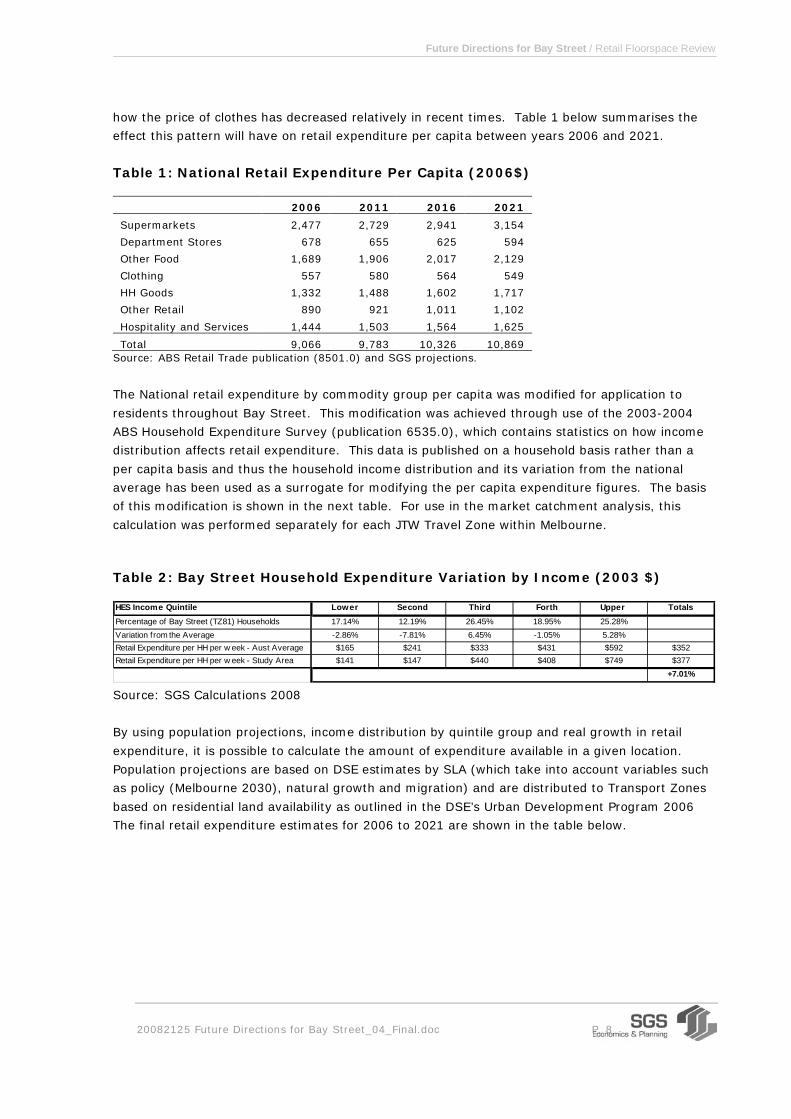
how the price of clothes has decreased relatively in recent times. Table 1 below summarises the
effect this pattern will have on retail expenditure per capita between years 2006 and 2021.
Table 1: National Retail Expenditure Per Capita (2006$)
2006 2011 2016 2021
Supermarkets 2,477 2,729 2,941 3,154
Department Stores 678 655 625 594
Other Food 1,689 1,906 2,017 2,129
Clothing 557 580 564 549
HH Goods 1,332 1,488 1,602 1,717
Other Retail 890 921 1,011 1,102
Hospitality and Services 1,444 1,503 1,564 1,625
Total 9,066 9,783 10,326 10,869 Source: ABS Retail Trade publication (8501.0) and SGS projections.
The National retail expenditure by commodity group per capita was modified for application to
residents throughout Bay Street. This modification was achieved through use of the 2003-2004
ABS Household Expenditure Survey (publication 6535.0), which contains statistics on how income
distribution affects retail expenditure. This data is published on a household basis rather than a
per capita basis and thus the household income distribution and its variation from the national
average has been used as a surrogate for modifying the per capita expenditure figures. The basis
of this modification is shown in the next table. For use in the market catchment analysis, this
calculation was performed separately for each JTW Travel Zone within Melbourne.
Table 2: Bay Street Household Expenditure Variation by Income (2003 $)
HES Income Quintile Lower Second Third Forth Upper TotalsPercentage of Bay Street (TZ81) Households 17.14% 12.19% 26.45% 18.95% 25.28%Variation from the Average -2.86% -7.81% 6.45% -1.05% 5.28%Retail Expenditure per HH per w eek - Aust Average $165 $241 $333 $431 $592 $352Retail Expenditure per HH per w eek - Study Area $141 $147 $440 $408 $749 $377
+7.01% Source: SGS Calculations 2008
By using population projections, income distribution by quintile group and real growth in retail
expenditure, it is possible to calculate the amount of expenditure available in a given location.
Population projections are based on DSE estimates by SLA (which take into account variables such
as policy (Melbourne 2030), natural growth and migration) and are distributed to Transport Zones
based on residential land availability as outlined in the DSE’s Urban Development Program 2006
The final retail expenditure estimates for 2006 to 2021 are shown in the table below.

Future Directions for Bay Street / Retail Floorspace Review
20082125 Future Directions for Bay Street_04_Final.doc P. 9
Table 3: Retail Expenditure in Bay Street by residents in Bay Street and surrounding areas 2006 to 2021
Expenditure 2006 2011 2016 2021Net Retail Growth
Annual Avg Growth (2006-
2021) Supermarkets $23.3m $28.3m $34.7m $43.5m $20.2m 4.2%Department Stores $6.6m $8.0m $8.5m $9.5m $2.9m 2.5%Other Food $15.9m $19.3m $24.2m $29.8m $13.9m 4.3%Clothing $5.4m $6.6m $7.7m $8.7m $3.2m 3.1%HH Goods $12.8m $15.5m $19.3m $24.1m $11.4m 4.3%Other Retail $8.6m $10.5m $12.0m $15.4m $6.8m 3.9%Hospitality and Services $14.3m $17.4m $20.1m $24.3m $10.0m 3.6%Total $86.9m $105.6m $126.5m $155.3m $68.4m 3.9% Source: SGS 2008
To calculate required retail floorspace in the future, it is assumed that Bay Street would maintain
its current market share within Melbourne, as the population grows and the retail offer in Bay
Street naturally adapts to accommodate extra demand. The combination of growth in population,
growth in average retail spends per capita and income distribution for residence in the Bay Street
and the surrounding areas will determine the predicted future demand for retail expansion along
Bay Street.
2.2 Bay Street Activity Centre Turnover
Retail Employment for each 2001 Journey-to-Work Travel Zone (a geographic term used to define
a small area) in Victoria was calculated using ABS Census Journey-to-Work Data, 2006. The
number of retail jobs was then used to estimate the size of retail centres within each Travel Zone
and thus the total turnover for each Zone across Metropolitan Melbourne. This information was
then supplemented by known floorspace and turnover data as published by the various reports
such as the Victorian Shopping Centres directory as published by the Property Council of Australia.
The SGS retail model was then used to approximate the market shares for these Travel Zones
based on their estimated turnover. The table below summarises the initial and forecast turnover of
the Bay Street centre as defined by Travel Zone 81 (see Figure 1).
Table 4: Retail Turnover of Bay Street Activity Centre 2006 to 2021
Turnover 2006 2011 2016 2021Net Retail Growth
Annual Avg Growth (2006-
2021) Supermarkets $28.4m $33.5m $40.3m $49.2m $20.8m 3.7%Department Stores $0.4m $0.5m $0.5m $0.5m $0.1m 2.1%Other Food $13.7m $16.1m $19.8m $23.7m $10.0m 3.7%Clothing and Soft Goods $2.8m $3.3m $3.8m $4.1m $1.3m 2.5%Household Goods $4.2m $5.0m $6.1m $7.4m $3.1m 3.8%Other Retail $9.4m $11.1m $12.5m $15.4m $5.9m 3.3%Hospitality and Services $28.4m $32.7m $36.6m $42.1m $13.7m 2.7%Total $87.3m $102.3m $119.4m $142.4m $55.1m 3.3%
In order to estimate the required floor space within an activity centre it is first necessary to
determine the amount of turnover a shopping centre generates per sqm of floor space (known as
the retail turnover density or RTD). It should be noted that the RTDs can vary substantially from
centre to centre; for example, past studies have shown that the RTDs achieved by a supermarket
in a regional shopping centre may be as high as $9,500 whereas specialty shops in minor shopping
strips can survive on an RTD of $2,500 due to the lower rents that prevail in such locations. An
Future Directions for Bay Street / Retail Floorspace Review
20082125 Future Directions for Bay Street_04_Final.doc P. 10
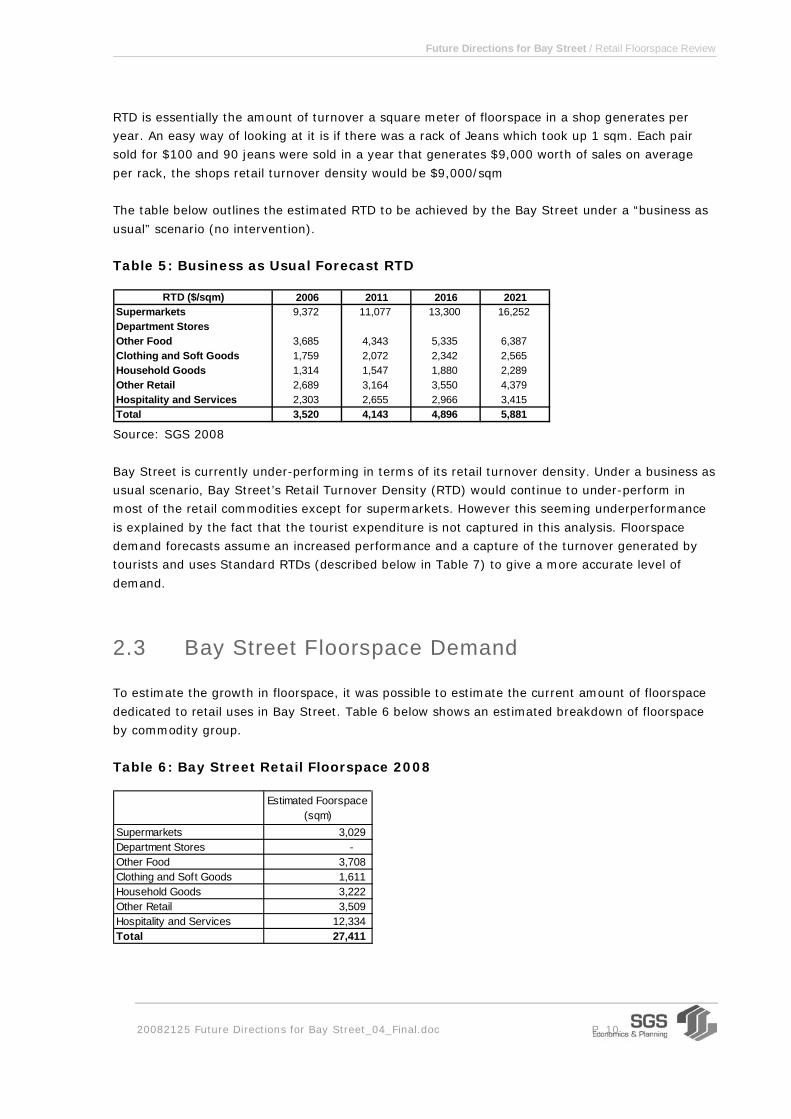
RTD is essentially the amount of turnover a square meter of floorspace in a shop generates per
year. An easy way of looking at it is if there was a rack of Jeans which took up 1 sqm. Each pair
sold for $100 and 90 jeans were sold in a year that generates $9,000 worth of sales on average
per rack, the shops retail turnover density would be $9,000/sqm
The table below outlines the estimated RTD to be achieved by the Bay Street under a “business as
usual” scenario (no intervention).
Table 5: Business as Usual Forecast RTD
RTD ($/sqm) 2006 2011 2016 2021Supermarkets 9,372 11,077 13,300 16,252Department StoresOther Food 3,685 4,343 5,335 6,387Clothing and Soft Goods 1,759 2,072 2,342 2,565Household Goods 1,314 1,547 1,880 2,289Other Retail 2,689 3,164 3,550 4,379Hospitality and Services 2,303 2,655 2,966 3,415Total 3,520 4,143 4,896 5,881 Source: SGS 2008
Bay Street is currently under-performing in terms of its retail turnover density. Under a business as
usual scenario, Bay Street’s Retail Turnover Density (RTD) would continue to under-perform in
most of the retail commodities except for supermarkets. However this seeming underperformance
is explained by the fact that the tourist expenditure is not captured in this analysis. Floorspace
demand forecasts assume an increased performance and a capture of the turnover generated by
tourists and uses Standard RTDs (described below in Table 7) to give a more accurate level of
demand.
2.3 Bay Street Floorspace Demand
To estimate the growth in floorspace, it was possible to estimate the current amount of floorspace
dedicated to retail uses in Bay Street. Table 6 below shows an estimated breakdown of floorspace
by commodity group.
Table 6: Bay Street Retail Floorspace 2008
Estimated Foorspace (sqm)
Supermarkets 3,029 Department Stores - Other Food 3,708 Clothing and Soft Goods 1,611 Household Goods 3,222 Other Retail 3,509 Hospitality and Services 12,334 Total 27,411
Future Directions for Bay Street / Retail Floorspace Review
20082125 Future Directions for Bay Street_04_Final.doc P. 11
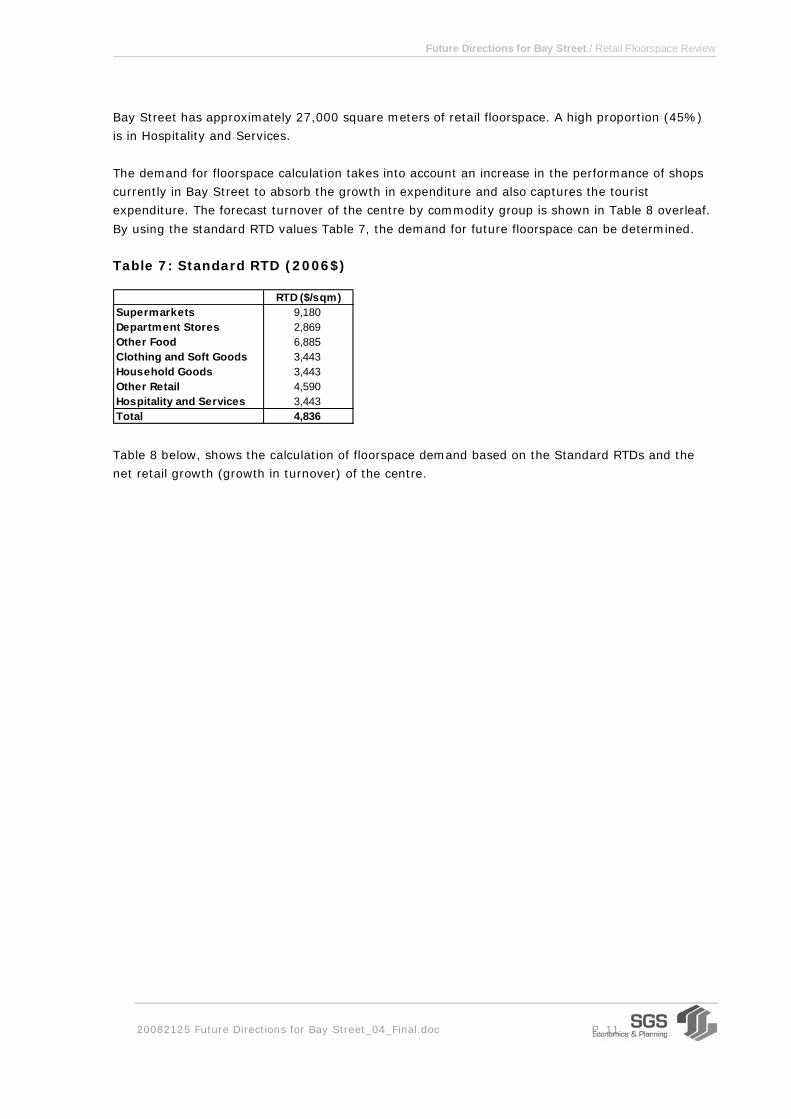
Bay Street has approximately 27,000 square meters of retail floorspace. A high proportion (45%)
is in Hospitality and Services.
The demand for floorspace calculation takes into account an increase in the performance of shops
currently in Bay Street to absorb the growth in expenditure and also captures the tourist
expenditure. The forecast turnover of the centre by commodity group is shown in Table 8 overleaf.
By using the standard RTD values Table 7, the demand for future floorspace can be determined.
Table 7: Standard RTD (2006$)
RTD ($/sqm)Supermarkets 9,180Department Stores 2,869Other Food 6,885Clothing and Soft Goods 3,443Household Goods 3,443Other Retail 4,590Hospitality and Services 3,443Total 4,836
Table 8 below, shows the calculation of floorspace demand based on the Standard RTDs and the
net retail growth (growth in turnover) of the centre.

Future Directions for Bay Street / Retail Floorspace Review
20082125 Future Directions for Bay Street_04_Final.doc P. 12
Table 8: Bay Street Floorspace Demand
Commodity 2006 Turnover 2011 Turnover 2016 Turnover 2021 Turnover Estimated Foorspace 2006
Growth In Turnover (2006-2021)
Standard RTD (2006$/sqm)
Floorspace Demand (2006 - 2021)
Supermarkets $28.4m $33.5m $40.3m $49.2m 3029 sqm $20.8m $9,180 2270 sqm
Department Stores $0.4m $0.5m $0.5m $0.5m 0 sqm $0.1m $2,869 51 sqm
Other Food $13.7m $16.1m $19.8m $23.7m 3708 sqm $10.0m $6,885 1455 sqm
Clothes and Soft Goods $2.8m $3.3m $3.8m $4.1m 1611 sqm $1.3m $3,443 377 sqm
Household goods and Hardw are (Bulky Goods) $4.2m $5.0m $6.1m $7.4m 3222 sqm $3.1m $3,443 912 sqm
Other Retail $9.4m $11.1m $12.5m $15.4m 3509 sqm $5.9m $4,590 1292 sqm
Hospitality and Services $28.4m $32.7m $36.6m $42.1m 12334 sqm $13.7m $3,443 3986 sqm
Total Turnover $87.3m $102.3m $119.4m $142.4m 27411 sqm $55.1m $4,836 10343 sqm
The demand for floorspace in Bay Street is estimated to be 10,343 square meters. Hospitality and Services represents about 38% of total demand.
Other Food is also in strong demand, followed by other retail (not including supermarkets).
The following section looks at the impacts on floorspace demand in Bay Street, if a competing centre is developed in a Business 3 Zone off
Williamstown Road, north-west of Bay Street.

Future Directions for Bay Street / Retail Floorspace Review
20082125 Future Directions for Bay Street_04_Final.doc P. 13
2.4 Impact Assessment
Given that a Bunnings has recently located on Williamstown Road near Bay Street, there is a
potential for a complementary retail offer in the same location. Figure 3 below presents a context
map of the location of the ‘competing centre’ located in the geographic definition Travel Zone 80
(TZ 80). Bay Street shopping precinct is in (TZ 81).
Figure 3: Competing Centre for Impact Assessment.
Source: SGS 2008
As the location of the Bunnings is within a Business 3 Zone (B3Z), there are several restrictions
regarding the development of retail in such zones. Namely retail premises are restricted to large
floorspace areas that are much greater than a “normal shop”. In the B3Z, a premises needs to
have a floor area of at least 1000sqm. This can include things such as camping equipment,
electric light fittings, equestrian supplies, floor coverings, furnishings, furniture, swimming pools,
etc. Places like Harvey Norman, Rays Outdoor/ Tent City. A supermarket use falls within a “shop”
definition and by definition is a prohibited use in a B3Z.
Future Directions for Bay Street / Retail Floorspace Review
20082125 Future Directions for Bay Street_04_Final.doc P. 14
2.4.1 Scenario 1
This scenario assumes that 22,000 sqm of retail floorspace will be accommodated in the Business
3 Zone located off Williamstown Road by 2021. The estimated turnover of this centre is calculated
according to the standard RTD’s and estimated increase in floorspace. The assumptions are
detailed in section 2.4.3
2.4.2 Scenario 2
This scenario assumes 90,000 sqm, which is the entire area of the Business 3 Zone, will be
offered as retail (however this offer would be restricted under the current zoning as mentioned
above).
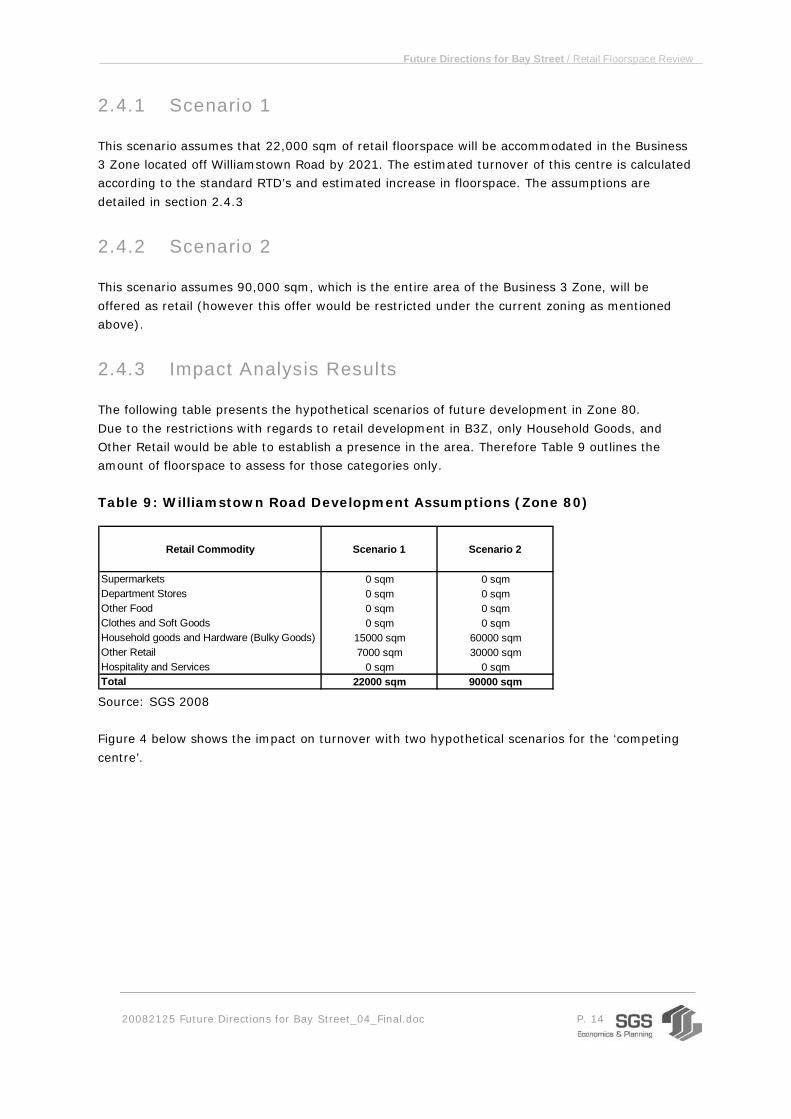
2.4.3 Impact Analysis Results
The following table presents the hypothetical scenarios of future development in Zone 80.
Due to the restrictions with regards to retail development in B3Z, only Household Goods, and
Other Retail would be able to establish a presence in the area. Therefore Table 9 outlines the
amount of floorspace to assess for those categories only.
Table 9: Williamstown Road Development Assumptions (Zone 80)
Retail Commodity Scenario 1 Scenario 2
Supermarkets 0 sqm 0 sqmDepartment Stores 0 sqm 0 sqmOther Food 0 sqm 0 sqmClothes and Soft Goods 0 sqm 0 sqmHousehold goods and Hardware (Bulky Goods) 15000 sqm 60000 sqmOther Retail 7000 sqm 30000 sqmHospitality and Services 0 sqm 0 sqmTotal 22000 sqm 90000 sqm Source: SGS 2008
Figure 4 below shows the impact on turnover with two hypothetical scenarios for the ‘competing
centre’.

Future Directions for Bay Street / Retail Floorspace Review
20082125 Future Directions for Bay Street_04_Final.doc P. 15
Figure 4: Impact on Turnover in Bay Street
$0.0m
$20.0m
$40.0m
$60.0m
$80.0m
$100.0m
$120.0m
$140.0m
$160.0m
Supermarkets Department Stores
Other Food Clothes and Soft Goods
Household goods and Hardware
(Bulky Goods)
Other Retail Hospitality and Services
Total
2021Turnover - Base 2021 Turnover -Scenario 1 2021 Turnover -Scenario 2
Source: SGS 2008
The development of a centre in the Business 3 Zone on Williamstown Road, will not have a
substantial impact on Turnover in Bay Street. This is because Bay Street is predominantly a
Hospitality and Services centre, with Supermarkets and Other Food as the highest contributors to
turnover.
Future Directions for Bay Street / Retail Floorspace Review
20082125 Future Directions for Bay Street_04_Final.doc P. 16
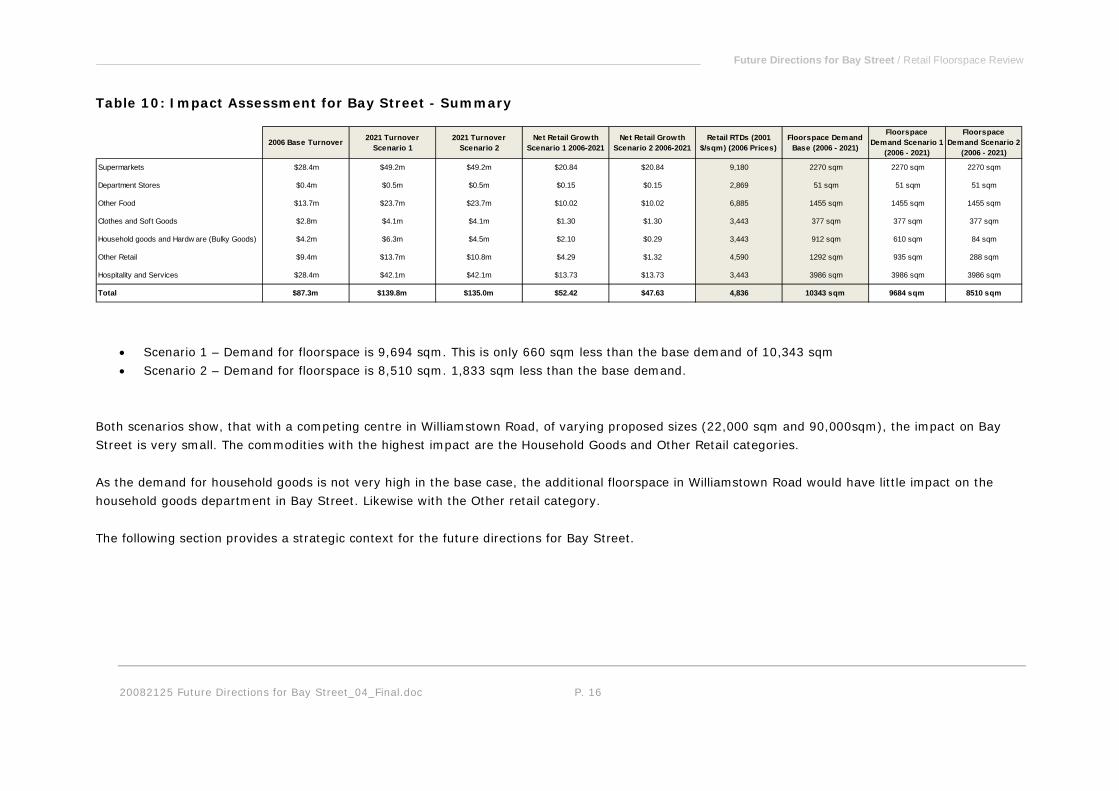
Table 10: Impact Assessment for Bay Street - Summary
2006 Base Turnover 2021 Turnover Scenario 1
2021 Turnover Scenario 2
Net Retail Growth Scenario 1 2006-2021
Net Retail Growth Scenario 2 2006-2021
Retail RTDs (2001 $/sqm) (2006 Prices)
Floorspace Demand Base (2006 - 2021)
Floorspace Demand Scenario 1
(2006 - 2021)
Floorspace Demand Scenario 2
(2006 - 2021)
Supermarkets $28.4m $49.2m $49.2m $20.84 $20.84 9,180 2270 sqm 2270 sqm 2270 sqm
Department Stores $0.4m $0.5m $0.5m $0.15 $0.15 2,869 51 sqm 51 sqm 51 sqm
Other Food $13.7m $23.7m $23.7m $10.02 $10.02 6,885 1455 sqm 1455 sqm 1455 sqm
Clothes and Soft Goods $2.8m $4.1m $4.1m $1.30 $1.30 3,443 377 sqm 377 sqm 377 sqm
Household goods and Hardw are (Bulky Goods) $4.2m $6.3m $4.5m $2.10 $0.29 3,443 912 sqm 610 sqm 84 sqm
Other Retail $9.4m $13.7m $10.8m $4.29 $1.32 4,590 1292 sqm 935 sqm 288 sqm
Hospitality and Services $28.4m $42.1m $42.1m $13.73 $13.73 3,443 3986 sqm 3986 sqm 3986 sqm
Total $87.3m $139.8m $135.0m $52.42 $47.63 4,836 10343 sqm 9684 sqm 8510 sqm
• Scenario 1 – Demand for floorspace is 9,694 sqm. This is only 660 sqm less than the base demand of 10,343 sqm
• Scenario 2 – Demand for floorspace is 8,510 sqm. 1,833 sqm less than the base demand.
Both scenarios show, that with a competing centre in Williamstown Road, of varying proposed sizes (22,000 sqm and 90,000sqm), the impact on Bay
Street is very small. The commodities with the highest impact are the Household Goods and Other Retail categories.
As the demand for household goods is not very high in the base case, the additional floorspace in Williamstown Road would have little impact on the
household goods department in Bay Street. Likewise with the Other retail category.
The following section provides a strategic context for the future directions for Bay Street.
Future Directions for Bay Street / Retail Floorspace Review
20082125 Future Directions for Bay Street_04_Final.doc P. 17
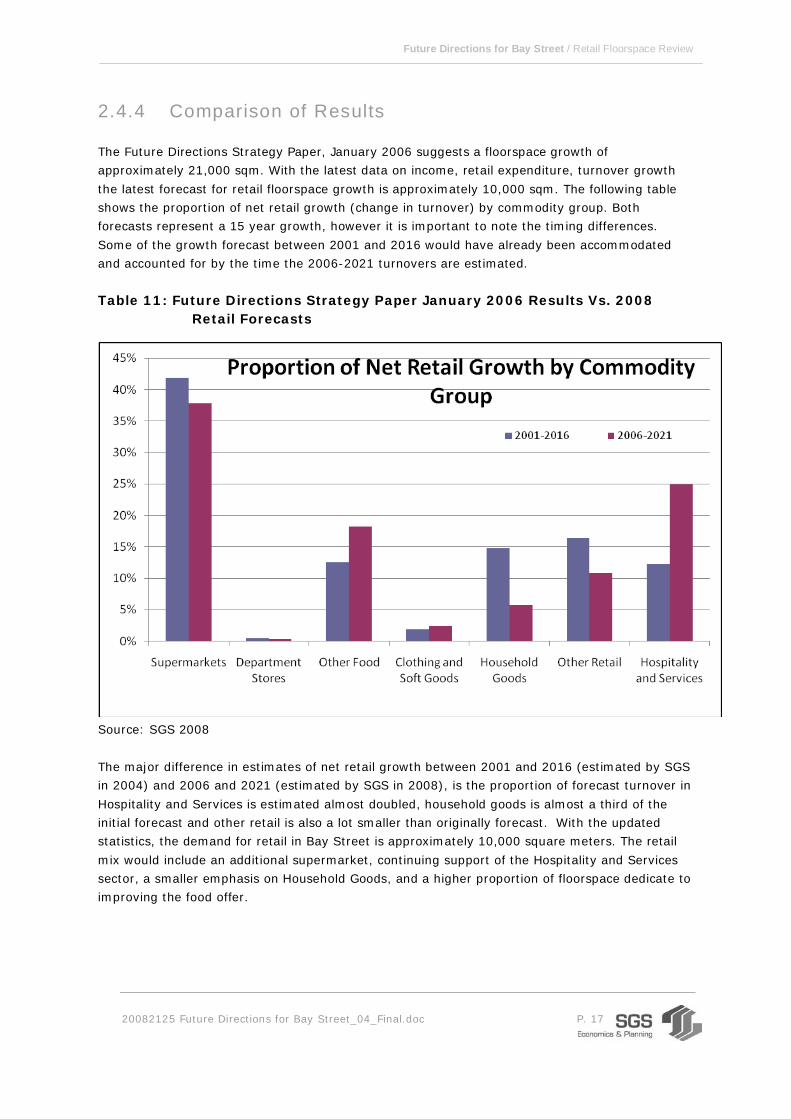
2.4.4 Comparison of Results
The Future Directions Strategy Paper, January 2006 suggests a floorspace growth of
approximately 21,000 sqm. With the latest data on income, retail expenditure, turnover growth
the latest forecast for retail floorspace growth is approximately 10,000 sqm. The following table
shows the proportion of net retail growth (change in turnover) by commodity group. Both
forecasts represent a 15 year growth, however it is important to note the timing differences.
Some of the growth forecast between 2001 and 2016 would have already been accommodated
and accounted for by the time the 2006-2021 turnovers are estimated.
Table 11: Future Directions Strategy Paper January 2006 Results Vs. 2008 Retail Forecasts
Source: SGS 2008
The major difference in estimates of net retail growth between 2001 and 2016 (estimated by SGS
in 2004) and 2006 and 2021 (estimated by SGS in 2008), is the proportion of forecast turnover in
Hospitality and Services is estimated almost doubled, household goods is almost a third of the
initial forecast and other retail is also a lot smaller than originally forecast. With the updated
statistics, the demand for retail in Bay Street is approximately 10,000 square meters. The retail
mix would include an additional supermarket, continuing support of the Hospitality and Services
sector, a smaller emphasis on Household Goods, and a higher proportion of floorspace dedicate to
improving the food offer.

Future Directions for Bay Street / Retail Floorspace Review
20082125 Future Directions for Bay Street_04_Final.doc P. 18
3 The Strategic Context for Bay Street
Bay Street is a designated ‘major’ activity centre under Melbourne 2030 and subsequently its
planning must be consistent with the metropolitan strategy. IMAP is a joint venture of the
municipalities of Melbourne, Port Phillip, Yarra and Stonnington to achieve cooperation and plan
coordination between themselves in implementing Melbourne 2030.
It is important that the Bay Street Activity Centre is based on a strongly supported context plan
so as to fully exploit its potential to service its immediate Port Melbourne trade area, that of the
wider Port Phillip Municipality and even Metropolitan Melbourne.
The following section suggests a strategic context for the planning and development of Bay Street
based on a previous plans for the area and on trends in cities overseas.
Since this study was first commenced it has come to the notice of SGS that the Inner Melbourne
Action Plan (IMAP) has been adopted by Council. Clearly any structure plan for Bay Street should
be consistent with that plan. Although detailed analysis of the content of IMAP has not been
undertaken as part of this project IMAP does suggest a context that is in line with that suggested
herein. A brief understand of the thrust of IMAP that affects Bay Street can be obtained from
IMAP maps 1, 2, 3 and 7 in particular.
SGS’s conclusion is that Bay Street should be recognised and planned as one of Melbourne’s
major boulevards that combined with its extension along City Road radiate from the City to the
Bay. This would put it in the same category as St Kilda Road, Royal Parade, Flemington Road,
and the likes.
3.1 'City to Bay Boulevard' Plan in 1980s
Creation of such a boulevard was the official policy and plan of the Cain Labor Government in the
1980s: Central Melbourne, Framework for the Future - No 6. Land Use and Development Strategy
(Department of Planning & Environment, 1984). That plan was also the subject of a video that
explains the concepts of the City to Bay Boulevard (Melbourne’s Best, DVD – available from SGS
or DPCD).
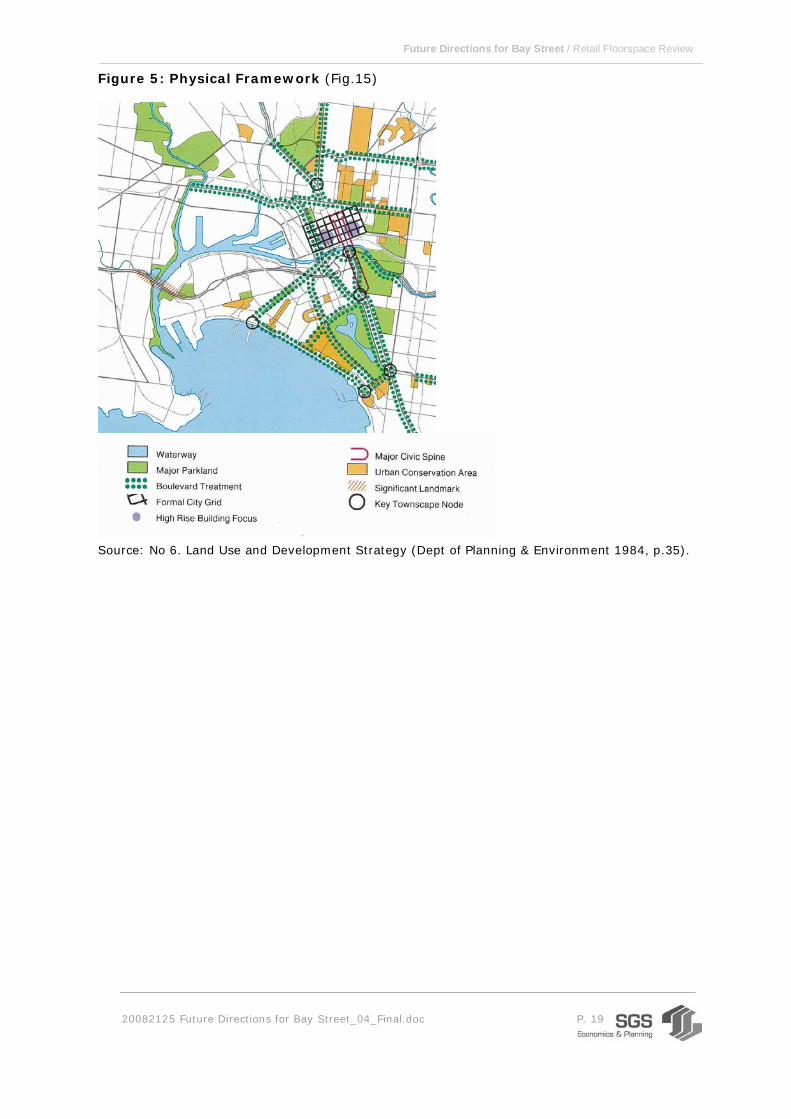
The plan was implemented substantially and it changed the fundamental function and form of
Southbank for the better. However, it did not deliver on the concept for an iconic boulevard from
St Kilda Road to the Bay (along City Road). This plan should be re-examined with the intention of
up-dating it and using it as Bay Street’s sub-regional strategy. Note that the following diagrams are synoptic only and the original document should be read for
any detail required.
Future Directions for Bay Street / Retail Floorspace Review
20082125 Future Directions for Bay Street_04_Final.doc P. 19
Figure 5: Physical Framework (Fig.15)
Source: No 6. Land Use and Development Strategy (Dept of Planning & Environment 1984, p.35).

Future Directions for Bay Street / Retail Floorspace Review
20082125 Future Directions for Bay Street_04_Final.doc P. 20
Figure 6: Development Proposals (Fig.16)
Source: No 6. Land Use and Development Strategy (Dept of Planning & Environment 1984).
Note that Bay Street is not the actual subject of the boulevard in the Cain Government plan; it is
the Beacon Cove tramway line. It did make sense to activate the Beacon Cove railway track as a
dedicated light rail; as it does to maintain it. However, under the circumstances there was never
a prospect of using it as a stimulus for major renewal and rejuvenation of the retail and
commercial infrastructure of the area, as the situation is with Bay Street.
Future Directions for Bay Street / Retail Floorspace Review
20082125 Future Directions for Bay Street_04_Final.doc P. 21
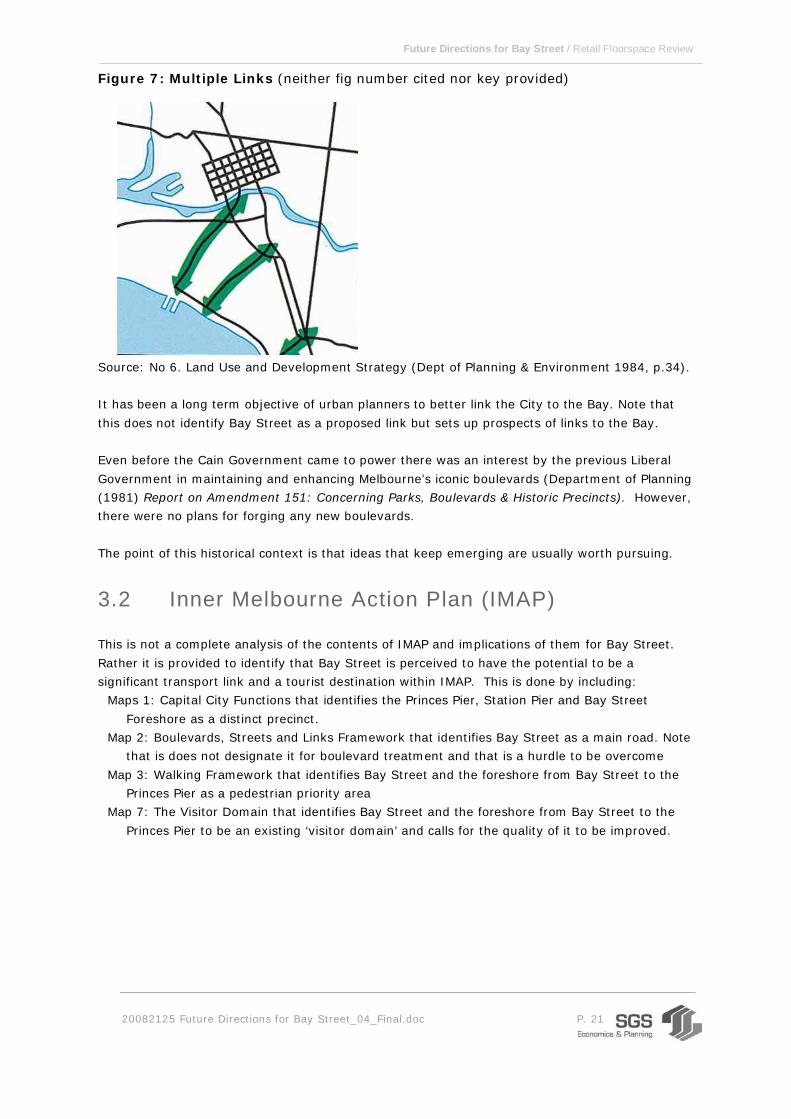
Figure 7: Multiple Links (neither fig number cited nor key provided)
Source: No 6. Land Use and Development Strategy (Dept of Planning & Environment 1984, p.34). It has been a long term objective of urban planners to better link the City to the Bay. Note that
this does not identify Bay Street as a proposed link but sets up prospects of links to the Bay. Even before the Cain Government came to power there was an interest by the previous Liberal
Government in maintaining and enhancing Melbourne’s iconic boulevards (Department of Planning
(1981) Report on Amendment 151: Concerning Parks, Boulevards & Historic Precincts). However,
there were no plans for forging any new boulevards.
The point of this historical context is that ideas that keep emerging are usually worth pursuing.
3.2 Inner Melbourne Action Plan (IMAP)
This is not a complete analysis of the contents of IMAP and implications of them for Bay Street.
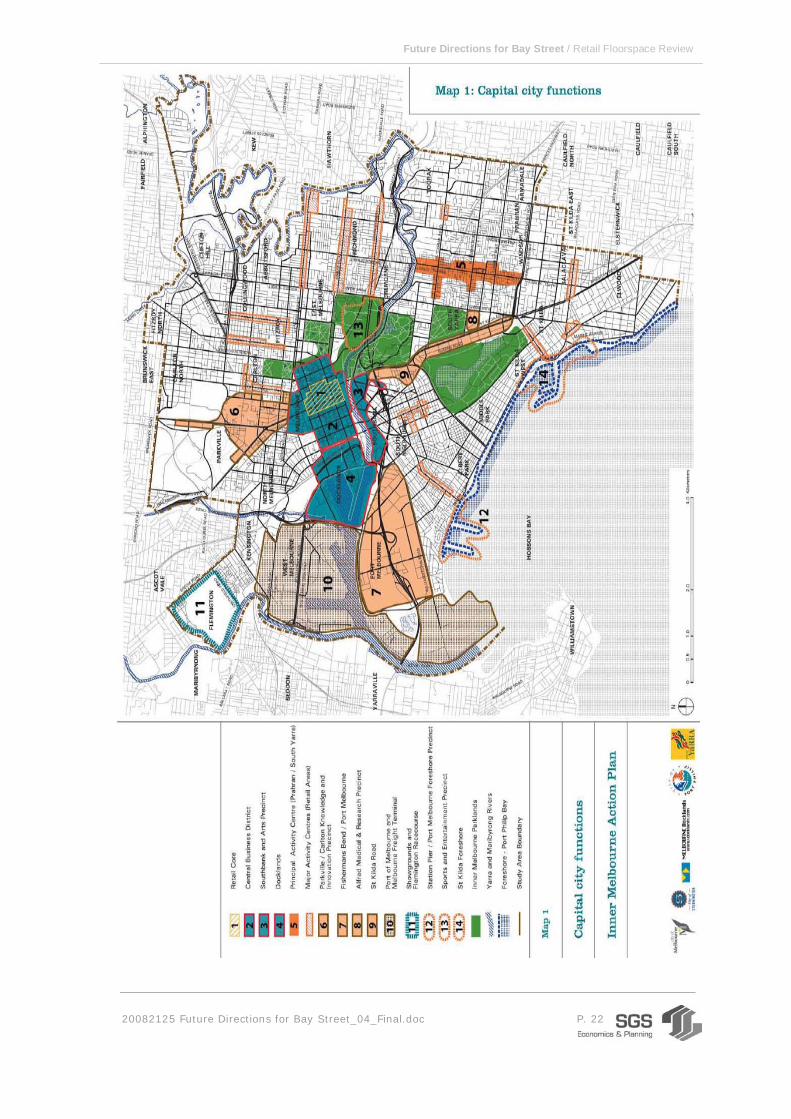
Rather it is provided to identify that Bay Street is perceived to have the potential to be a
significant transport link and a tourist destination within IMAP. This is done by including:
Maps 1: Capital City Functions that identifies the Princes Pier, Station Pier and Bay Street
Foreshore as a distinct precinct.
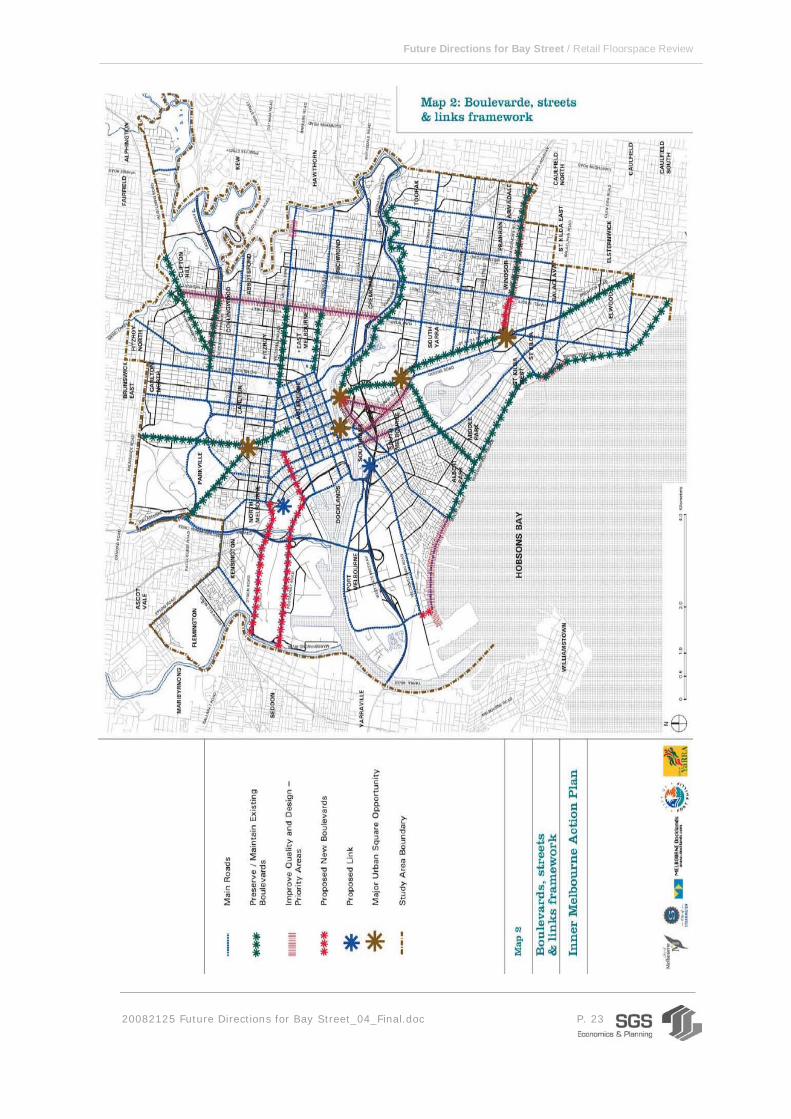
Map 2: Boulevards, Streets and Links Framework that identifies Bay Street as a main road. Note
that is does not designate it for boulevard treatment and that is a hurdle to be overcome
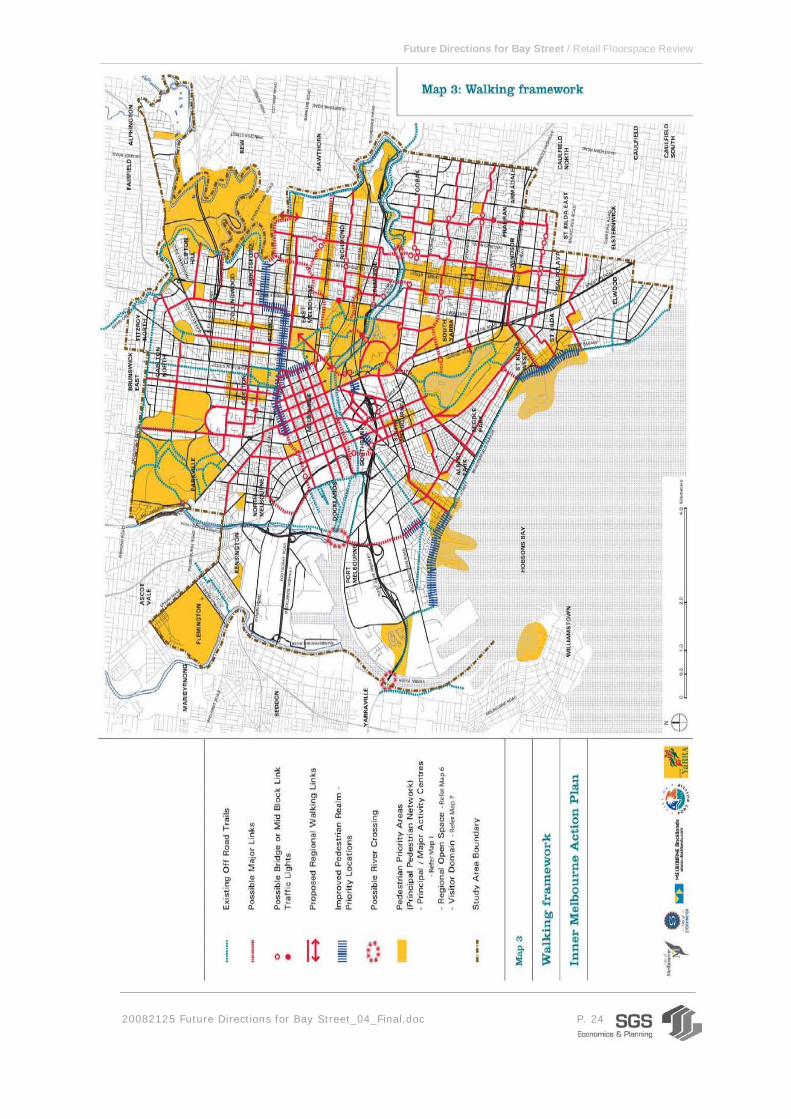
Map 3: Walking Framework that identifies Bay Street and the foreshore from Bay Street to the
Princes Pier as a pedestrian priority area
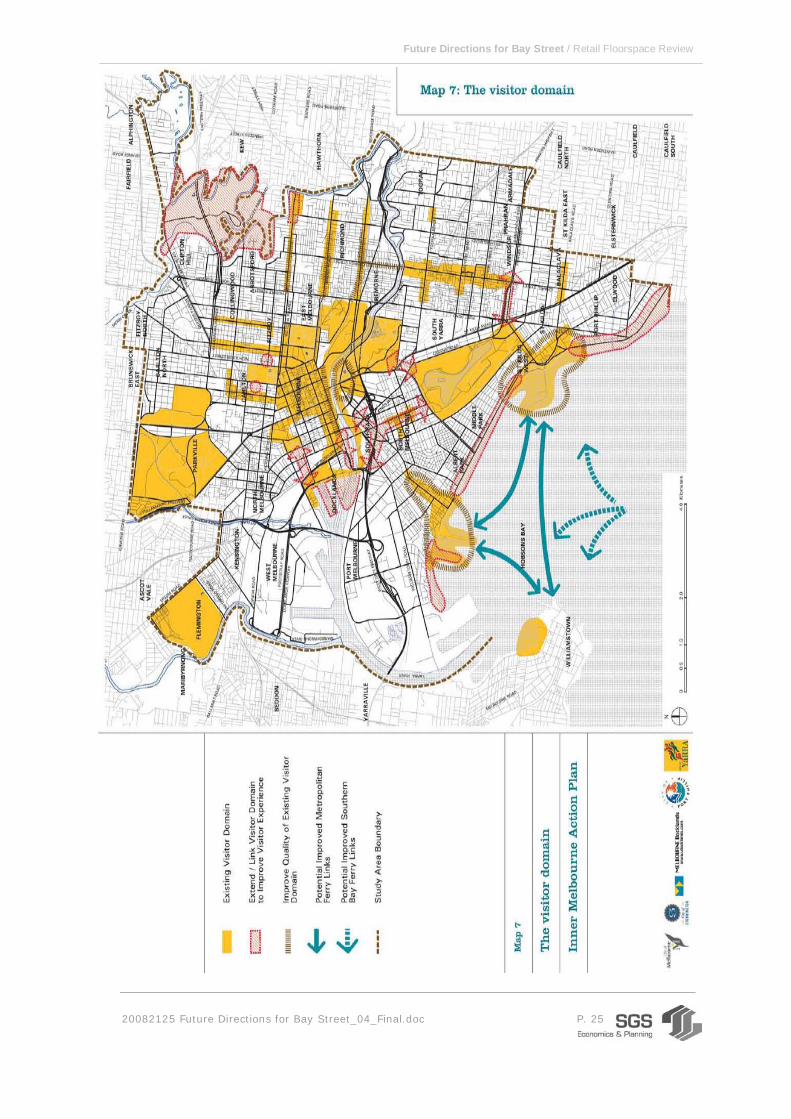
Map 7: The Visitor Domain that identifies Bay Street and the foreshore from Bay Street to the
Princes Pier to be an existing ‘visitor domain’ and calls for the quality of it to be improved.
Future Directions for Bay Street / Retail Floorspace Review
20082125 Future Directions for Bay Street_04_Final.doc P. 22
Future Directions for Bay Street / Retail Floorspace Review
20082125 Future Directions for Bay Street_04_Final.doc P. 23
Future Directions for Bay Street / Retail Floorspace Review
20082125 Future Directions for Bay Street_04_Final.doc P. 24
Future Directions for Bay Street / Retail Floorspace Review
20082125 Future Directions for Bay Street_04_Final.doc P. 25
Future Directions for Bay Street / Retail Floorspace Review
20082125 Future Directions for Bay Street_04_Final.doc P. 26
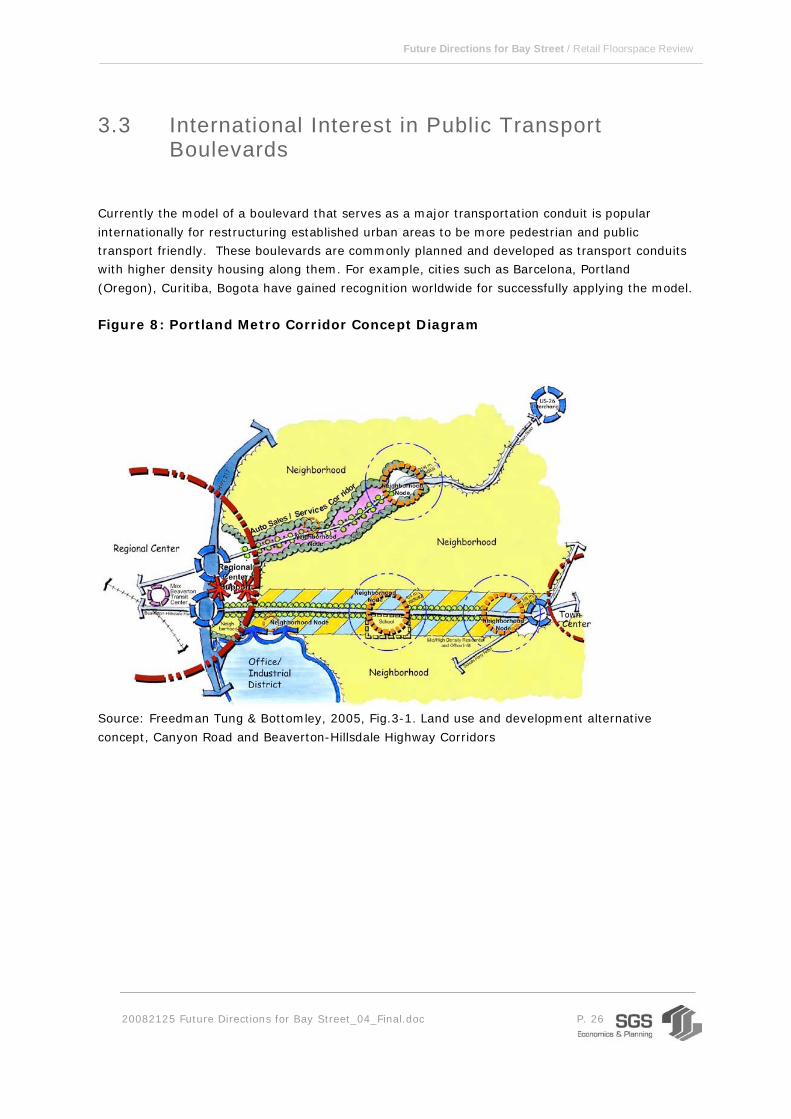
3.3 International Interest in Public Transport Boulevards
Currently the model of a boulevard that serves as a major transportation conduit is popular
internationally for restructuring established urban areas to be more pedestrian and public
transport friendly. These boulevards are commonly planned and developed as transport conduits
with higher density housing along them. For example, cities such as Barcelona, Portland
(Oregon), Curitiba, Bogota have gained recognition worldwide for successfully applying the model.
Figure 8: Portland Metro Corridor Concept Diagram
Source: Freedman Tung & Bottomley, 2005, Fig.3-1. Land use and development alternative
concept, Canyon Road and Beaverton-Hillsdale Highway Corridors

Future Directions for Bay Street / Retail Floorspace Review
20082125 Future Directions for Bay Street_04_Final.doc P. 27
Figure 9: Portland Metro Corridor Map
Source: Metro Data Resource Centre (DRC) 2004. Fig.1: Corridor case study area, Beaverton-
Hillsdale Highway & Canyon Road.
Part of the dividend from the application of the model is that it creates potential for increasing
residential density along major arterial roads, especially those that also serve as public transport
routes.
The model is now being talked about in Australia. Rob Adams, MCC, recently gave a presentation
in the Department of Transport on the preparation of a concept plan to increase housing density
along main arterial roads within the City of Melbourne.
3.4 Prospects for a Bay Street Boulevard Today
Bay Street would be a good test case for such a model of development. As indicated previously,
Bay Street already has many of the characteristics of a boulevard by virtue of it having had a
cable tram line in an earlier era of its development. Note that in Central Melbourne: Framework
for the Future (1984) Bay Street was not identified for Boulevard treatment but rather Pickles
Street was.
It is recommended that City of Port Phillip makes contact with the City of Melbourne to see how
they can co-operate on such concepts to their mutual advantage.
Within the area surrounding Bay Street the housing market is already implementing such
concepts, if not to a formal plan, with housing already intensifying at both ends of the Bay Street/
City Road link:
• At Beach Road end of bay street there are Bayview Apartments, Westpoint Apartments,
and the Atlantis Apartments
• At the City Road end (Southbank) there are several residential and commercial complexes
that includes the Eureka Tower

Future Directions for Bay Street / Retail Floorspace Review
20082125 Future Directions for Bay Street_04_Final.doc P. 28
Figure 10: Bay Street – North View
Figure 11: Bay Street – South View
Source: SGS 2008
There are numerous older poor quality industrial/ showroom buildings along City Road in the
Southbank area that are ripe for renewal. These could be developed as mixed use complexes
with residential and commercial above retail and commercial uses that are pedestrian friendly and
celebrate the linear form of the new boulevard.
The prospect of a new tram line being developed along Bay Street/ City Road should be explored
as part of a City to Bay Boulevard.
It would be exciting if there could be a tram line put back along Bay Street/ City Road to
Queensbridge Street, through the proposed new public square at Southbank and into Market/
William Streets.
Future Directions for Bay Street / Retail Floorspace Review
20082125 Future Directions for Bay Street_04_Final.doc P. 29
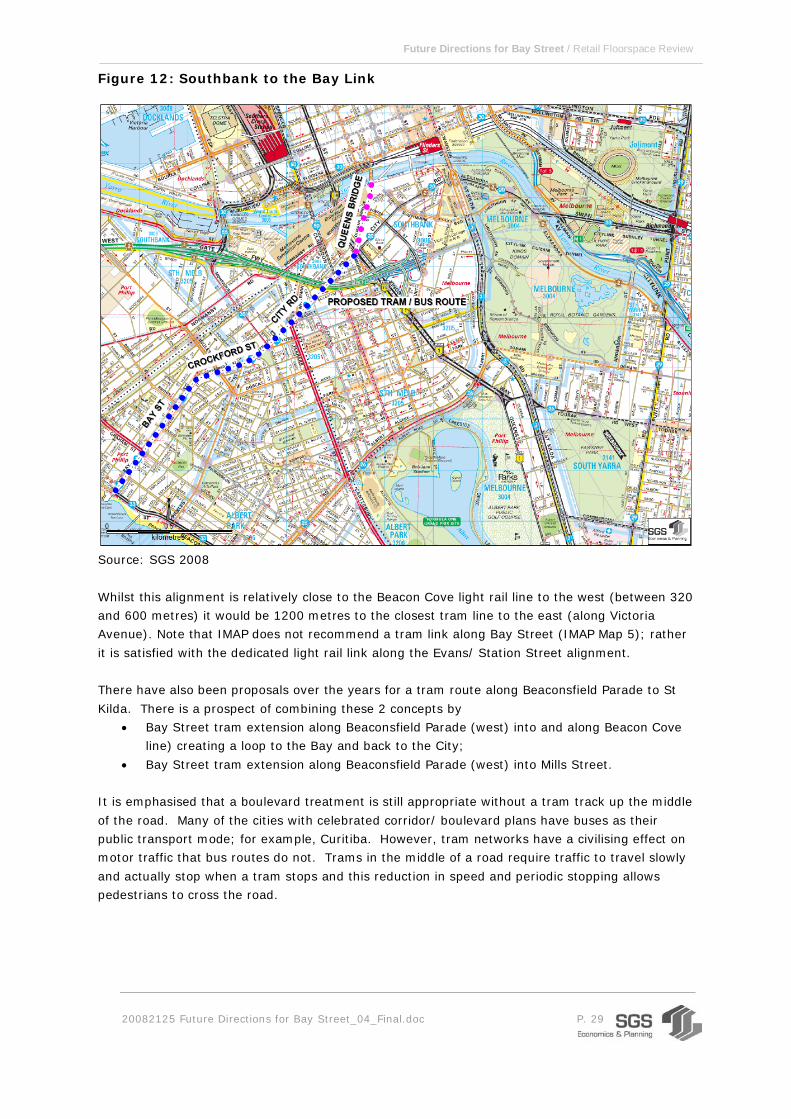
Figure 12: Southbank to the Bay Link
Source: SGS 2008
Whilst this alignment is relatively close to the Beacon Cove light rail line to the west (between 320
and 600 metres) it would be 1200 metres to the closest tram line to the east (along Victoria
Avenue). Note that IMAP does not recommend a tram link along Bay Street (IMAP Map 5); rather
it is satisfied with the dedicated light rail link along the Evans/ Station Street alignment.
There have also been proposals over the years for a tram route along Beaconsfield Parade to St
Kilda. There is a prospect of combining these 2 concepts by
• Bay Street tram extension along Beaconsfield Parade (west) into and along Beacon Cove
line) creating a loop to the Bay and back to the City;
• Bay Street tram extension along Beaconsfield Parade (west) into Mills Street.
It is emphasised that a boulevard treatment is still appropriate without a tram track up the middle
of the road. Many of the cities with celebrated corridor/ boulevard plans have buses as their
public transport mode; for example, Curitiba. However, tram networks have a civilising effect on
motor traffic that bus routes do not. Trams in the middle of a road require traffic to travel slowly
and actually stop when a tram stops and this reduction in speed and periodic stopping allows
pedestrians to cross the road.
Future Directions for Bay Street / Retail Floorspace Review
20082125 Future Directions for Bay Street_04_Final.doc P. 30
3.4.1 Urban Form of Boulevard
Magnificent boulevards were the normal way of doing things in Melbourne since the days of
‘marvellous Melbourne’ when transport conduits like St Kilda Road, Victoria Parade, Royal Parade
and the likes were laid out with magnificent mansions along their length. They have subsequently
been redeveloped, sometimes several times over, with higher density and high rise buildings of
varied qualities. However, despite the lack of overall planning and coordination they remain as
the most memorable streets of Melbourne.
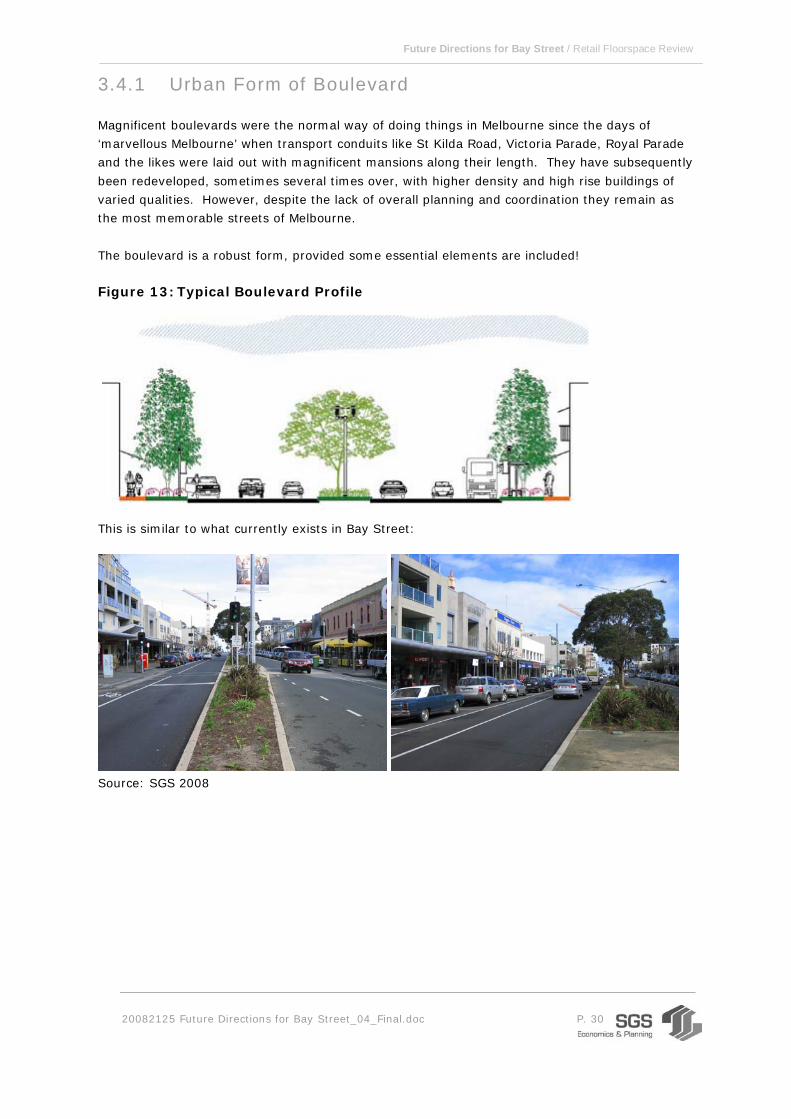
The boulevard is a robust form, provided some essential elements are included! Figure 13: Typical Boulevard Profile
This is similar to what currently exists in Bay Street:
Source: SGS 2008
Future Directions for Bay Street / Retail Floorspace Review
20082125 Future Directions for Bay Street_04_Final.doc P. 31
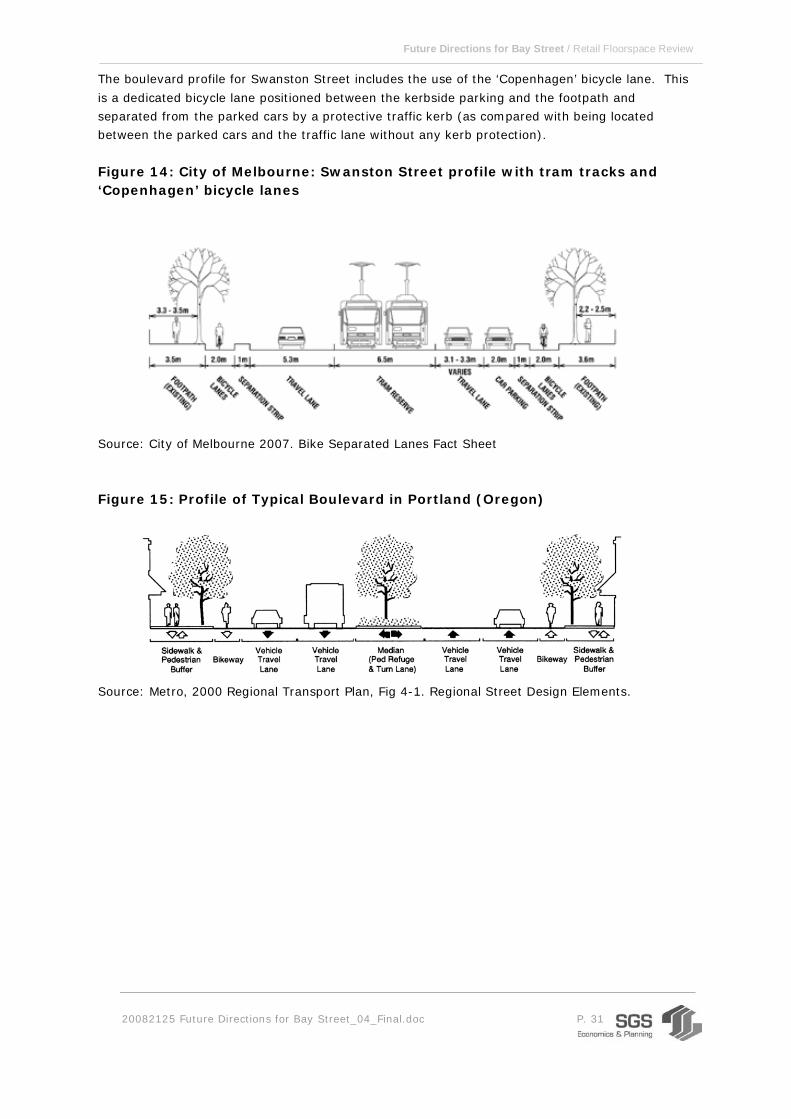
The boulevard profile for Swanston Street includes the use of the ‘Copenhagen’ bicycle lane. This
is a dedicated bicycle lane positioned between the kerbside parking and the footpath and
separated from the parked cars by a protective traffic kerb (as compared with being located
between the parked cars and the traffic lane without any kerb protection).
Figure 14: City of Melbourne: Swanston Street profile with tram tracks and ‘Copenhagen’ bicycle lanes
Source: City of Melbourne 2007. Bike Separated Lanes Fact Sheet
Figure 15: Profile of Typical Boulevard in Portland (Oregon)
Source: Metro, 2000 Regional Transport Plan, Fig 4-1. Regional Street Design Elements.
Future Directions for Bay Street / Retail Floorspace Review
20082125 Future Directions for Bay Street_04_Final.doc P. 32
3.5 Planning and Design of Bay Street, Port Melbourne
3.5.1 Niches for Bay Street
An appropriate way of identifying the niches to be introduced or strengthened along Bay Street is
to identify existing magnet destinations around which complementary dependent businesses can
be clustered.
Bay Street has several magnet facilities with varying degrees of drawing power and potential:
• Food-for-the-home: supermarkets
• Beach destination and scene: foreshore of Port Philip bay
• Iconic entertainment venue: Circus Oz
• Government services: especially local government such as public library, community
centre.
There are other possible niches that do exist along Bay Street but not to any great extent. The
population profile of the immediate area suggests that these could be supported.
• Health, fitness, well-being: gymnasiums, youth clubs, community centres
• Medical services: general practitioners, dentists, opticians, physiotherapists
• Popular entertainment: reception/ entertainment centres, night clubs
Although these niches do not necessarily need to be set in specific precincts along Bay Street it is
likely that they will be identifiable particular locations and areas of the street. (Please refer to
Appendix for the contextual description of each of the following)
Food-for-the-Home Niche
This is the most important niche to pursue in strengthening the overall shopping district, for the
reasons expressed below.
‘Food for the home' is a very important and very large niche. Overwhelming evidence indicates
that shopping is done as two consecutive food and non-food expeditions even when occurring in
the same shopping destination.
There are numerous social and economic reasons for retaining food shopping. First, food shops
generally, and supermarkets in particular, are major attractors of shoppers and there are
prospects for flow-on expenditure to any specialty shops nearby, including specialist food.
Second, food shopping is a frequently repeated activity, commonly at least weekly, so that it
helps community development. Third, there are usually some remnants of resident population
that need servicing and it is important to overall street vitality that they be encouraged to remain
as residents.
Future Directions for Bay Street / Retail Floorspace Review
20082125 Future Directions for Bay Street_04_Final.doc P. 33
The effect of a supermarket is similar to a cluster of individual shops selling complementary food
commodities and can be recreated with an equivalent mix of individual shops. However, within a
supermarket, shoppers are assured that the different products will be conveniently clustered
within easy sight and walking distance and this is difficult to recreate in shopping districts.
A full-line supermarket in a shopping district inevitably results in competition for traders on the
street selling vegetable/ fruit produce, meat and delicatessen items. A smaller range
supermarket such as Aldi may be preferred, since it leaves opportunities for small independent
traders; however, it will be successfully as a collective only if the small traders are located
nearby.
The 'food-for-the-home' Niche is already a major strength of the Bay Street shopping district.
There are 4 major supermarket brands in Victoria: Coles, Safeway, IGA and Aldi, and Bay Street
already has 2 of them: Coles, located on the corner of Liardet Street and Bay Street and IGA,
located near the corner of Rouse Street and Bay Street.. It makes sense to encourage clustering
most of the food-for-the-home outlets in the blocks between Rouse Street and Liardet Street.
It is unlikely that there is the market demand in the area of Bay Street to support all 4 types of
Australian supermarkets at this time. However, with the redevelopment of higher density housing
along Bay Street it may only be a matter of time before there is sufficient demand.
The major advantage of a linear form for a shopping district (as opposed to a point centre) is that
a new shopping destination can be developed anywhere along its length so that it serves an
adjacent primary trade area but is still readily accessible to residents along the length of Bay
Street/ City Road. Aldi operates a different retailing model from the other three, provides a
different offering and would be a valuable addition. An Aldi supermarket as an anchor north of
Liardet Street may well be a possibility and that could stimulate development of more
independent food-for-the-home outlets. Whilst government has difficulty controlling retailing activities on privately owned land it has
virtually absolute control over what happens on public land within shopping districts: streets,
parks and the likes. Trading on publically owned land is an old and honourable retailing form that
can be an effective means of introducing specific merchandise or tenants. Street trading can
provide a service not offered in shops; for example, for 'shopping on the run'. Ironically, it can
also help the trading in adjacent shops by slowing pedestrians to a browsing pace, and initial
stops at stalls can result in sales for adjacent shops. Traders also perform simple janitorial tasks
in going about their business. In these ways, street trading can be an effective means of
influencing the vitality and viability of a shopping district. Recently in Melbourne there has emerged a network of farmer’s markets. Farmers markets, a USA concept, enable farmers to sell their produce direct to consumers. The tendency in Australia is to locate
farmer’s markets away from a major activity centre, out-of-centre, in a park or sports oval
setting. This means that any potential synergy between the farmers market and the nearest
activity centre is almost certainly irrelevant because it need a car trip to move from one to the
other. In-centre locations enable the farmer’s markets to act as major draw-cards (anchors or
magnet) for the more conventional shopping in the adjacent business district.
Future Directions for Bay Street / Retail Floorspace Review
20082125 Future Directions for Bay Street_04_Final.doc P. 34
There is already a farmers’ market held in the Gasworks Park once per month and it is a popular
shopping destination that draws in customers from across the immediate sub-region.
It is recommended that a farmers’ market be established along Bay Street, preferably in the
vicinity of the other food-for-the-home shopping facilities so as to exploit potential synergy.
Initially this should be on a monthly basis with the intention of holding it more frequently,
possibly even 3-4 weeks a month (on the weeks that the Gasworks Farmers Market is not
operating). There are several locations that could be considered. There may be a prospect of
locating a farmers’ market in and around the small public park in Liardet Street (Olives Corner),
the Liardet Community Centre and the Neighbourhood House complex that extends back to Nott
Street.
Beach Destination and Scene
The precinct between Rouse Street and Beach Street (and along Beach Street) has special
potential because of its proximity to the foreshore and the Bay. Water frontage of any type is
especially appealing for locals, tourists and day trippers. However, unlike streets in a similar
situation such as Acland Street it has not managed to forge a role as a tourist destination.
This precinct could and should be developed as a tourist/day tripping destination to rival Acland
Street. It already has the basis of a tourism destination: Circus Oz headquarters, a couple of
historic pubs, several heritage buildings with prospects for creative reuse, and views to the
foreshore and Port Phillip Bay. There is a need for some urban design branding that could and
should be used to make this south precinct distinctive from the remainder of Bay Street.
The waterfront around Station Pier is already evolving into a substantial tourist destination and
this could be reinforced by creative redevelopment of the south end of Bay Street and the
foreshore area between the two along Beach Street. Note that IMAP map 7 suggest that the area
from Princes Pier to Bay Street (including all of the Bay Street shopping street) be developed as a
major ‘Visitor Domain’.
Currently the War Memorial and the Port Melbourne Yacht Club are located on the foreshore
immediately across from the end of Bay Street (at the junction of Beach Street and Bay Street).
There is some benefit in creating a better sense of place at this junction. This should make a
better connection between Bay Street and the Bay, visual and physical, and attract more people
across from Bay Street onto the foreshore, and vice versa.
Public Community Hub
Government is limited in its influence on the business mix of shopping districts unless it owns
business premises to lease to preferred businesses on conditions to attract them. However,
government does own buildings for the delivery of a large number of services that are virtual
monopolies, such as libraries, health centres. Many of these are accessed in a similar way as
shops and have similar location requirements. Although they do not make sales in the
conventional manner they can be effective anchors for concomitant shopping destinations. Public libraries are particularly popular and inclusive destinations: there are effective anchors for a
shopping district. Bay Street is fortunate in that it has an active library at the north end: in the

Future Directions for Bay Street / Retail Floorspace Review
20082125 Future Directions for Bay Street_04_Final.doc P. 35
block between Spring Street North and Spring Street South. Libraries increase the cultural
opportunities for local residents and are important community facilities for that reason alone.
However, they are also used by the widest cross section of society: by all ages, by both genders,
by all education levels and by all ethnic groups. More importantly a large percentage of the
Australian population use libraries: Australia has a participation rate of over 30% and on average
Australians access a library 5 times per year (Australian Bureau of Statistics).
A library can be a compelling reason for shoppers to go to a shopping district and a point of
difference from other shopping destinations without a library. Local governments often overlook
the significance of libraries to the economic viability and social vitality of shopping districts. They
often prefer out-of-centre locations surrounded with car parking because of the cost saving. This
removes an important magnet for the shopping district but also may reduce library usage.
Ironically, corporate shopping centres recognise the importance of libraries as magnets and are
prepared to provide space for them at peppercorn rents. For example, the City of Maribyrnong
(Metropolitan Melbourne) has a branch library in Highpoint City, Melbourne’s largest shopping
centre, for a rent of $50/ annum on a 30 year lease. The City of Knox has a library in Knox City
Shopping Centre for $1/ annum.
The Port Melbourne public library at the north end of Bay Street could and should be made an
anchor for a business niche and spatial precinct that includes not only the library itself but other retail uses. Libraries appropriately located within a shopping district can serve an anchor role that is only surpassed in drawing power by the supermarkets. A good library can stimulate the establishment of
commercial businesses selling: books and magazines, stationary goods, computers, coffee and
other refreshments, travel products and the likes. This precinct of Bay Street is not very vital and
it is in need of a major injection of public funds to stimulate private sector investment and
business change. Note that if the existing library is deemed unsuitable there may be prospects
for developing a bigger and better one at the south end of Bay Street as part of the tourist,
entertainment precinct.
Libraries are becoming increasingly wide in the scope of their services. Some libraries have
meeting rooms, theatres, exhibition spaces, coffee shops, cafes, telephones and public notice
boards all of which draw in potential shoppers to the district. Some are organisers of community
events such as art exhibitions, talks, demonstrations and public meetings. As such, they make a
significant contribution to community building.

Future Directions for Bay Street / Retail Floorspace Review
20082125 Future Directions for Bay Street_04_Final.doc P. 36
Appendix
Economic and Social Order in Retailing and Shopping
Behind the apparent haphazard mixture and location of shops and services on traditional shopping
streets, there is an underlying economic and social order that is analysable.
Agglomeration Forces in the Clustering of Shops
Shopping is commonly multi-purpose: several commodities are purchased on one shopping trip.
Consumers choose a shopping destination from competing destinations according to the likelihood
of obtaining all required goods and the attractiveness of any shopping destination is largely a
function of the range of goods on offer at competitive prices.
Consumer choice of goods tends to increase directly with the number of shops clustered and
agglomeration provides a greater probability of getting needs satisfied. The agglomeration gives
customers a greater opportunity for choosing their requirements within a given expenditure of
time and money: it reduces the travel and search costs of shopping.
Furthermore, purchase of some goods creates demand for other goods with which they have an
affinity. For example, a purchase of a new shirt induces demand for a tie or a new dress induces
demand for shoes and purchase of meat induces demand for vegetables to complete a menu.
In this there are major advantages in retail businesses clustering together (rather than
dispersing), even with those with which they are in direct competition and business entrepreneurs
respond appropriately. Most empirical studies on the location of shopping outlets indicate strong
propensity to agglomerate. However, this tendency appears to vary with the particular functions
and the extent to which it occurs remains a contentious issue.
Although retailing is primarily an economic phenomenon, it is also a social one. Shopping
destinations commonly offer more than standard commodities: they offer a range of opportunities
such as personal services, entertainment and cultural activities. In making choices about a
shopping destination, shoppers are influenced by the availability of facilities such as libraries,
coffee shops, entertainment complexes and health centres.
Future Directions for Bay Street / Retail Floorspace Review
20082125 Future Directions for Bay Street_04_Final.doc P. 37
Synergy, Externalities and Critical Mass in Retail Clustering.
There is an observable phenomenon in shopping in which the drawing power and trading
performance of a group of shops is greater than that of the sum of the individual shops. This
accumulative effect is referred to as synergy
Synergy is a medical term, which refers to coordination in the action of muscles, organs or drugs.
The term is used in retail planning in reference to the coexistence of two, or more, shopping/
business activities that are mutually supportive.
Critical mass, another jargon term, is the size and functional composition at which synergy or
symbiosis occurs, usually measured as floorspace.
Synergy and critical mass are concepts not only of interdependence and size of uses but also of
their placement and compactness. Synergy and shoppers' perception of critical mass tend to be
fostered by agglomeration of uses and to be nullified by their dispersion. The terms are used
conceptually rather than empirically and few planners or researchers are able to define them
specifically. They serve to emphasise that shopping centres and streets function as accumulative
entities and the importance of choosing merchandise/ tenants to complement and reinforce the
whole entity.
The fundamental principle in the planning of corporate shopping centres is to provide and locate a
mix of merchandise/ tenants to maximise synergy. It is much easier to generate synergy in
shopping centres than in shopping streets because of the ability to achieve a more precise
functional composition. However, the same economic forces are in place and the same principles
apply.
Some retail businesses have characteristics of use or built form that has an effect on the
efficiency and attractiveness of adjacent businesses. Synergy is created, or destroyed, by such
characteristics and they have an economic effect on neighbouring businesses and the whole
business district. This is the externality effect, so called.
An externality is an economics term referring to the effect of one business on the economic
performance of another without any monetary transaction occurring between them. An
externality can be positive: conferring benefits and appreciating synergy. For example, the
operation of a noted department store increasing the trading potential of a fashion boutique next
door. Alternatively, an externality can be negative: imposing costs and depreciating synergy. For
example, the operations of an adult sex aid shop decreasing the trading potential of a fashion
boutique next door.
Fundamentally, it is advantageous to minimise negative externalities and to maximise positive
externalities. This can be done by separating those uses and built forms which cause negative
externalities and clustering together those which provide positive externality effects.
It is inherently desirable for shopping centres and streets to make decisions that increase positive
externalities and reduce negative externalities so that synergy in the shopping environment is
maximised.
Future Directions for Bay Street / Retail Floorspace Review
20082125 Future Directions for Bay Street_04_Final.doc P. 38
Magnet and Dependent Relationships in Clustered Shops
Distinction can be made in shopping destinations between shops with a high profile and drawing
power and those with a low profile and drawing power.
High profile shops are those that are highly recognised in their retail environment, are major
shopping destination and draw customers to themselves in their own right. These magnet or
anchor shops develop their high public profile and drawing power from consistent advertising,
record of quality goods and service, and the likes. Department stores, such as Myer or Target are
the ultimate magnets in Melbourne.
At the other extreme, there are dependent shops that have a low profile in their retail
environment, have a small drawing power and depend on passing custom attracted by the
magnet shops. Dependent shops make different degrees of contribution, according to their type,
quality and public profile. For example, many of the chains of small shops such as Country Road
and Body Shop, have a high public profile generated over an extensive period of service and
advertising and are minor attractions in their own right. Others are almost totally dependent on
the drawing power of the magnets; for example, confectionary shops.
The planning and design of corporately owned shopping centres is based on such principles with
small shops subsidising the rents of their larger magnet shops. For example, department stores
pay less rent per sq metre than the small shops clustered around them. This same retail affinity
between magnet and dependent shops exists along shopping streets. However, it is not so
formalised nor are there any means of collecting revenue for externalities bestowed and using it
to subsidise the establishment of the magnets.
The overall status and drawing power of any shopping entity is determined largely by the quality
of its magnets. The distinction between magnet and dependent shops is not absolute: there are
degrees in the profile level and drawing power of shops. For example large supermarkets also
have a high profile and acknowledged drawing power but not as large as that of a major
department store.
It is unlikely that Bay Street can ever attract a major department store when other major
shopping destinations such as High Street, Armadale and Chapel Street cannot. A supermarket is
likely to be that best that can be achieved as a primary magnet. However, there may be
prospects for also attracting second string discount department stores such as Dimmeys selling
general personal goods.
Application of retail principles to drive and appropriate business mix
The most significant component in the appeal of any shopping destination: corporate shopping
centre or traditional shopping district is the range of goods on offer at competitive prices: the
business mix.
The function/ tenancy mix component of a business plan sets out a preferred and proposed
functional composition for a shopping district. It is an identification of appropriate businesses to
Future Directions for Bay Street / Retail Floorspace Review
20082125 Future Directions for Bay Street_04_Final.doc P. 39
be targeted for modification, expansion, contraction, recruitment, and the like. The end result
should be a schedule of existing and proposed functions together with a statement of their future
state. For example:
• ‘food: organic fresh food business to be developed or recruited’; or
• ‘restaurants/ cafes: one of existing restaurants/ cafes to be encouraged to increase its
status and service to cater for a higher quality and cost niche’.
It is acknowledged that under current planning legislation it is simply not possible to regulate the
actual business or tenancy mix within Business1 zones: a shop= a shop, of whatever type.
However, in subsequent recruitment efforts it is important to have a clear understanding of what
is and is not sought and favoured.
The importance of having complementary non-retail uses is acknowledged and consequently the
schedule should include any non-retail uses to be developed.
It is important that any list of optimum functions and tenants be tempered with pragmatism
because it needs to be implementable. Consequently, it should propose an optimum, not in the
‘ideal’ sense, but the ‘best possible’ in recognition of constraints identified in audits done
previously.
The SWOT concept and terminology is used widely in planning for the revitalisation of shopping
districts. For example, it pervades much of the literature of the UK’s Association of Town Centre
Management. It is common in literature on marketing where it is applied to the analysis of the
competitiveness of individual companies. It is an acronym of the four components of the
analysis:
• strengths;
• weaknesses;
• opportunities;
• threats. The intention of a business function/ tenancy audit is to identify the strengths and weaknesses in
the performance of an existing function/ tenancy mix to assist in deriving a better functional
composition. In turn, this is a means to the identification of functions to be introduced, deleted,
expanded and reduced from a shopping district; which is part of a business plan. Consequently, it
is particularly useful to identify those functions and tenancies that are lacking in a shopping
district or in competing shopping destinations.
Economic Clusters or Niches
Whilst it is clearly advantageous to have a major new injection of a generative business or
magnet complex to ‘kick start’ any shopping district revitalisation, the opportunity does not
emerge often. Fortunately, it is possible to generate considerable drawing power by creating a
critical mass of small shops directed at a particular customer segment or niche.
In devising a function/ tenancy plan it is important not only to specify commodities individually
but also as clusters based on economic themes or niches. For example, appropriate clothing,
shoes, cosmetics, jewellery, hair dressings are economically linked in a 'ladies’ fashion' niche.

Future Directions for Bay Street / Retail Floorspace Review
20082125 Future Directions for Bay Street_04_Final.doc P. 40
There are examples in Melbourne where revitalisation of shopping districts has happened with
clusters of specialist shops. Bridge Road, Richmond, was once a dilapidated shopping district
today it is a major shopping destination for ladies fashion: a niche serving the metropolitan-wide
role. Similarly, Victoria Street Collingwood is a revitalised strip centre based on the needs of
ethnic Vietnamese customers.
The purpose of auditing, discussed previously, is to assist with identification of niches that are
particular significant in a trade area and that need to be given additional support. Any commodity
gaps in existing niches represent a prospect for recruitment and business success since there is
already an established customer base.
The end result of any business plan is the improvement of the business turnover of a shopping
district as an entity. Increased shopper expenditure has to be accommodated by targeting
businesses to improve the performance of shopping districts, achievable through:
• restructuring existing businesses in existing, expanded or relocated businesses;
• attraction of new businesses and premises.
Generally the revitalisation of a shopping district involves attracting new traders and new real
estate and plans should acknowledge this. However, change and growth can also occur with
existing traders and real estate. Revitalisation policies and programs based on improvement to
the existing business environment are often more appropriate, easier to implement and more cost
effective. In particular, it is more difficult to mount opposition against policies and programs to
improve business efficiency than it is to do so against those promoting new development.
Business targeting decisions tend to include a measure of both new and existing businesses.
However, again many strategies place undue emphasis on the introduction of new businesses
whereas there are advantages in improving the sales turnover of existing businesses. For
example, existing traders may feel aggrieved or threatened by an influx of new businesses, some
of which may be in competition with them.
The prospects for success are enhanced by including the business community, in all its various
parts. It is recommended that tenant search and recruitment, in particular, be undertaken by a
committee comprising the various components of the business community and public sector:
traders, bankers, real estate agents, government officials, etc.