review of the environmental impact survey - eia copam ... · review of the environmental impact...
TRANSCRIPT
REVIEW OF THE ENVIRONMENTAL IMPACTSURVEY - EIA
COPAM PROCESS Nº 01403/2002/002/2002PIEDADE SHS – MARCH/2007
VOLUME I/II – TEXT

Revisão do Estudo de Impacto Ambiental – EIA - PCH Piedade – Março/2007, Pág. 2
VOLUME I/II – TEXT ..................................................................................
PRESENTATION ..........................................................................................
COMPANY RESPONSIBLE FOR THE SURVEY .....................................
TECHNICAL TEAM.....................................................................................
66
8
91 PROJECT ........................................................................................ 101 .1 Project Description ....................................................................................................... 101.1.1 River Diversion............................................................................................................................ 101.1.2 Spillway.......................................................................................................................................... 111.1.3 Earth Dams ................................................................................................................................... 111. 1 .4 Environmental Flow Control Equipment – Diffusion Valve ..........................................1 11.1.5 Generating Circuit...................................................................................................................... 111.1.6 Transmission System .................................................................................................................. 121. 1 .7 Summary of the Technical Record – PIEDADE SHS ....................................................... 131 .2 River Flow....................................................................................................................... 171 .3 Project Maximum Flow Levels .................................................................................. 251.4 Reservoir Silting and Working Life ......................................................................... 251 .5 Reservoir Filling ............................................................................................................ 282 GENERAL METHODOLOGY...................................................... 292.1 DEFINING SURVEY AREAS........................................................ 292.2 Natural Environment ................................................................................................... 292.2.1 Sphere of Influence ..................................................................................................................... 292.2.2 Surrounding Area........................................................................................................................ 302.2.3 Directly Affected Area ............................................................................................................... 302.3 Social and Economic Considerations ....................................................................... 302.3.1 Sphere of Influence ..................................................................................................................... 302.3.2 Surrounding Area........................................................................................................................ 312.3.3 Directly Affected Area ............................................................................................................... 313 PHYSICAL ENVIRONMENT ....................................................... 323 .1 Climate ............................................................................................................................ 323.1.1 Methodology ................................................................................................................................. 32

Revisão do Estudo de Impacto Ambiental – EIA - PCH Piedade – Março/2007, Pág. 3
3.1.2 AI and ADA Diagnosis ................................................................................ 323 .2 Hydrography ............................................................................................................ 353.2.1 METHODOLOGY...................................................................................... 353.2.2 AI and ADA Diagnosis ................................................................................ 353 .3 GEOLOGY ............................................................................................................... 363.3.1 Methodology .......................................................................................................................... 363.3.2 AI Diagnosis ............................................................................................... 363.3.3 Legal Status of Minerals .................................................................................................... 383 .4 Geomorphology ........................................................................................................ 383.4.1 Methodology .......................................................................................................................... 383.4.2 AI Diagnosis ............................................................................................... 383.4.3 AE and ADA Diagnosis ............................................................................... 393 .5 PEDOLOGY ................................................................................ 463.5.1 Methodology .......................................................................................................................... 463 .6 AI Diagnosis .................................................................................... 473.6.1 Description of Soil Classes, Grouped in the 1st Level Category
(Orders)...................................................................................................... 473.6.2 AE and ADA Diagnosis ............................................................................... 483 .7 WATER QUALITY..................................................................... 493. 7. 1 INTRODUCTION ...................................................................................... 493.8 Data Analysis Methodology................................................................................... 523.8.1 RESULTS AND DISCUSSIONS ................................................................. 533 .9 NATURAL HERITAGE ............................................................. 673.9.1 METHODOLOGY...................................................................................... 673.9.2 AI and ADAE Diagnosis............................................................................. 683. 9.3 Archeological Heritage ...................................................................................................... 753. 9.4 Sites in the Surrounding Area - AE ............................................................... 963.9.5 CONCLUSION........................................................................................... 98
4 SOCIAL AND ECONOMIC ENVIRONMENT...........................100
4.1 Surrounding Area and Influence.............................................................................100
4.1.1 SOCIAL INFRASTRUCTURE....................................................................... 102

Revisão do Estudo de Impacto Ambiental – EIA - PCH Piedade – Março/2007, Pág. 4
4.1.2 ECONOMIC INFRASTRUCTURE ............................................................... 111
4.1.3 PRODUCTION INFRASTRUCTURE............................................................113
4.2 Directly Affected Area ...............................................................................................114
4.2.1 Individual Description of Farming Establishments ....................................................... 117
4.2.2 Downstream Area – Low Flow Section/Adduction Channel/ElectricityCenter............................................................................................................................................121
4.2.3 Downstream Area – Low Flow Section/Adduction Channel ....................................... 132
5 BIOTIC ENVIRONMENT ............................................................137
5 .1 Description of the survey area.................................................................................13 7
5 .2 FLORA...........................................................................................................................137
5.2.1 Introduction ............................................................................................................................... 137
5.2.2 Methodology ..............................................................................................................................138
5.2.3 Regional Classification ..........................................................................................................138
5.2.4 Local Description.....................................................................................................................141
5.2.5 Grazing biotypes.......................................................................................................................143
5.2.6 Reservoir..................................................................................................................................... 144
5.2.7 Adduction channel ...................................................................................................................146
5.2.8 Final Considerations............................................................................................................... 147
5 .3 MAMMALS .................................................................................................................148
5.3.1 Introduction ...............................................................................................................................148
5.3.2 Methodology ..............................................................................................................................148
5.3.3 Environmental Diagnosis ......................................................................................................150
5.3.4 Final Considerations............................................................................................................... 154
5 .4 Birdlife ...........................................................................................................................154
5.4.1 Introduction ............................................................................................................................... 154
5.4.2 Methodology .............................................................................................................................. 154
5.4.3 Environmental Diagnosis ...................................................................................................... 155
5.4.4 Final Considerations............................................................................................................... 162
5 .5 HERPETOFAUNA .......................................................................................................163
5.5.1 Introduction ...............................................................................................................................163
5.5.2 Methodology ..............................................................................................................................163

Revisão do Estudo de Impacto Ambiental – EIA - PCH Piedade – Março/2007, Pág. 5
5.5.3 Environmental Diagnosis............................................................. 1645.5.4 Final Considerations..................................................................... 1665 .6 Fish ............................................................................................ 1665.6.1 Introduction...................................................................................... 1665.6.2 Methodology .................................................................................... 1675.6.3 Environmental Diagnosis............................................................. 1705.6.4 Final Considerations..................................................................... 1726 ENVIRONMENTAL IMPACTS ...................... 1736.1 Physical Environment........................................................... 173
6.1.1 Loss of Natural Heritage Locally from FillingThe Reservoir and Creating the TVR................................................................ 173
6.1.2 WATER QUALITY ................................................................................................................... 174
6.2 BIOTIC ENVIRONMENT ...................................................................................... 183
6.2.1 Loss of Habitats for Martin Specieis (STREPTOPROCNE ZONARIS
and CYPSELOIDES SENEX) ................................................................................. 184
6.2.2 Social and Economic Environment ..................................................................................... 184
7 BIBLIOGRAPHIC REFERENCES ..............................................185

Revisão do Estudo de Impacto Ambiental – EIA - PCH Piedade – Março/2007, Pág. 6
VOLUME I/II – TEXT
PRESENTATIONThis document was prepared to align the Environmental Impact Study for the Piedade SHS with the newproject engineering layout.
The basic, consolidated 2000 project and engineering surveys for Piedade SHS were carried out by RAEngenharia e Consultoria and contracted by Piedade Usina Geradora de Energia SA. The project surveyswere prepared according to the instructions issued for developing SHS projects and ANEEL regulations,specific Brazilian regulations and guided by previous studies of the area.
After field investigations and analysis of existing surveys, we can safely say that the location specified forthe respective SHS works are in good condition for deployment, within the criteria established by ANEELand FEAM.
The proposed hydroelectric project, to generate electricity, is located on the Piedade river, with a dam 50.40km from its mouth, in the municipal region of Monte Alegre de Minas, with the dam at latitude 18° 41’20”and longitude 49°03’48” (Drawing PIE-LOC-001).
The hydroelectric project is characterized as a water level plant with a regulating reservoir of water level atan elevation of 650 m, covering an approximate area of 1.5 square kilometers with a volume of 17.52 x 10⁶
at maximum normal N.A., as presented in drawing PI-MA-006.
This study is separated into two volumes, with volume 1 containing the text in volume 2 the exhibits(Drawings).
Chapter 1 presents the main engineering characteristics for the project and Chapter 2 presents the generalmethodology used to prepare the document. Description of the Physical, Social and Economic and BioticEnvironments is conducted in chapters 3, 4 and 5, respectively, alongside alignment with the new design.
Chapter 6 comments on the possible, new environmental impacts caused by alterations to the engineeringdesigns. Please note that the environmental impacts forecast in preceding studies remain valid.
Volume 2 contains the following exhibits:
Exhibit 1 - Drawings
PI-MA-001 – GENERAL LAYOUT - PLANT
PI-MA-002 – GENERAL LAYOUT - DAM PI-MA-003 – GENERAL LAYOUT – DAM – PROFILE - TYPICAL SECTIONS ANDDETAILS
PI-MA-004 – RIVER DIVERSION SEQUENCE – 1ST PHASE

Revisão do Estudo de Impacto Ambiental – EIA - PCH Piedade – Março/2007, Pág. 7
PI-MA-005 - RIVER DIVERSION SEQUENCE – 2nd PHASE PI-MA-006 –RESERVOIRS GROUND PLAN - CHARACTERISTICS OF THE FLOODED
AREA - HEIGHT OF 650 M PI-MA-007 – PIEDADE RIVER DROP PARTICIPATION
PI-MA-008 –ELECTRICAL CENTRE–GENERAL LAYOUT–TRANSVERSAL CROSS-SECTION
PIE-LOC-001 –ACCESS ROUTE MAP
PIE-VEG-002 – VEGETATION
PIE-PAF-001 –FAUNA SAMPLING POINTS
PIE-LMA-001 –SOCIAL AND ECONOMIC ENVIRONMENT INFLUENCE AREA
PIE-GEM-001 - GEOMORPHOLOGY
PIE-PED-001 - PEDOLOGY
PIE-PAA-001 –WATER QUALITY SAMPLING POINTS
PIE-PTN-001 –NATURAL HERITAGE POINTS
PIE-PRO-002 –REGISTERED PROPERTIES

Revisão do Estudo de Impacto Ambiental – EIA - PCH Piedade – Março/2007, Pág. 8
COMPANY RESPONSIBLE FOR THE SURVEYFounded in 1991, Limiar Engenharia Ambiental is an environmental consultancy and managementcompany.
The company develops projects for the correct use of natural resources and continued improvement ofenvironmental quality It studies, evaluates, innovates and manages the relationship between organizationsand the environment in terms of their physical, biotic and social aspects.
The Limiar environmental management service covers:
Consultancy for project amendment or compliance with applicable environmental regulationsand laws;
Preparation of studies, plans and environmental reports for project licensing; Execution of environmental programs for physical, biotic and socioeconomic environment; Environmental Management.
Av. Luis Paulo Franco, 500/9º andar BelvedereBelo Horizonte – MG, CEP: 30320-570
TeleFax: (031) 3286-3007

Revisão do Estudo de Impacto Ambiental – EIA - PCH Piedade – Março/2007, Pág. 9
TECHNICAL TEAMBelow is the Limiar Engenharia Ambiental technical team and the collaborators responsible for preparing thePiedade SHS Environmental Impact Study Review.
General ManagementVirgínia Campos Sanitary Engineer - CREA 26714/D
Technical Team EducationProfessional Registration Responsibility
Rogério Yukio SuzukiChemical Engineer -CRQ 02301399 2ªR
Technical Management
Lucas Grandinetti Amado de Sousa Biologist - CRBio 44067/4-D Final Integration and ReviewFlávia Lima Dolabella Teixeira daCosta
Chemical Engineer -CRQ 02301439 2ªR
Water Quality
Charles Pierre ParreirasSociologistMSc in Sociology
Socio-economic issues
Michel Kazuo Takahashi Obara Biologist - CRBio 49074/4-D Fauna integration
Raphael MedinaForestry Engineer –CREA 91739/D
Flora integration
Raphael RomanizioAdvertising and SocialCommunication -MT46211.003395/00- 37
Archaeological Coordination
Rodrigo Augusto Ferreira Draftsman Drawings
Simone Valéria Passos Pessoa Geographer - CREA 76880/DClimate, Hydrography, Natural Heritage andIntegration with the Physical Environment
Collaborators EducationProfessional Registration
Responsibility
Edward Karel Maurits Koole(MC Archaeology)
Archaeologist Archaeology

Revisão do Estudo de Impacto Ambiental – EIA - PCH Piedade – Março/2007, Pág. 10
1 PROJECT1.1 Project Description
The Piedade SHS deployment project involves the following structures: Works to divert the river along the left bank comprising the diversion channel with a diversion
gallery in concrete and upstream and downstream cofferdams for construction of the dam onthe river bed.
Dam, comprising an earth them on the river bed and abutment on the right bank and other smallclosing down on the left bank.
Still way with a free-flowing weir inside walls in rolled concrete as part of the dam which willbe located on the left bank.
Generating circuit comprising the water intake, water channel, penstock, power station andtailrace encompassing a group of independent works located along the right abutment at aheight of 650 m, on the right bank of the river, except the power station and the penstockswhich will be at elevations of 525 m (PH) and 525-650 m (penstock) thereby allowingexecution of the respective works at any time of the year.
69 kV conventional pumping substation, with a single bus and two input bays and two line bayslocated on the left-hand side of the power station, in unavailable area of approximately 420square meters, at an elevation of 525 m.
69 KV Transmission Line running approximately 11 km linking the Piedade SHS substation tothe Avatinguara substation in the municipal region of Canápolis.
The general layout and location of the works can be seen in drawing PI-MA-001.
The following is a brief description of the structures:
1.1.1 River Diversion
The river diversion was conceived in order to enable construction of the dam without the presence of waterand is a simple, low-cost diversion.
The river diversion will be carried out using a concrete diversion gallery comprising a cell 3 m wide by 3 mtall, which will be built on the left bank of the river. The river will be closed off during the dry period usingrock and earth cofferdams upstream and downstream from the spillway, both built on the river bed.
These structures were scaled in order to provide a flow of 19m3/s, which corresponds to a flow with a 25year return period and total length of 32.40, with a floor level at an elevation of 521 m. The portal will havegrooves in order to close the metal cut-off floodgate.
The cofferdams built an elevation of 625 m, with a crest width of 6.00 m, will be comprised of rip-rap andtransitions with external sealant using clay soil. Between the ground and the rip-rap

Revisão do Estudo de Impacto Ambiental – EIA - PCH Piedade – Março/2007, Pág. 11
filters and transitions will be built using granular material obtained in the region.
1.1.2 Spillway
The spillway will be a free-flow type 118.5 m total length and will have a spillway weir 30 m long and crestat an elevation of 650 m, which corresponds to the normal water level for hydroelectric usage.
The concrete sidewalls along the left and right banks of the River will crest at an elevation of 563 m, totaling88.5 m in length with a vertical upstream face and downstream face with an incarnation of 0.75H:1.0V.Maximum foundation height will be 25 m for walls and 22 m for the spillway.
Alongside the left-hand concrete sidewall devices will be installed to ensure sanitary flow of 0.65 m3/s.
The spillway will allow passage of maximum flooding levels, whose peak value is equivalent to 121 m3/s.The downstream face, in a step design, will dissipate most of the energy from the excess flow.
1. 1.3 Earth Dams
The earth dams on the right and left banks in compacted earthworks and rip-rap will crest at an elevation of653 m.
The main dam on the river bed and right-hand bank will total 294 m in length, with inclinations upstreamand downstream at an inclination of 1.0V:2.0H. Maximum foundation height will be 32 m.
The small dam closing off the left-hand bank will be 40 m long and will complete the Piedade River dam.
1. 1.4 Environmental Flow Control Equipment – Diffusion Valve
Diffusion valve with a flow of 0.65 m3/s will be installed in the structure of the concrete wall on the leftbank, guaranteeing the environmental flow required downstream from the dam according to the flowcalculation Q7-10. Upstream, the diffusion valve will be installed in a cut-off floodgate in order to be able tomaintain the diffusion valve.
1.1.5 Generating Circuit
The generating circuit to be deployed in the abutment on the right bank downstream from the dam willcomprise the following structures: Water intake, water channel, penstock, covered power station andtailrace.
The water channel, which has a water level elevation of 650 m, with a 6 m base trapezoid cross-section

Revisão do Estudo de Impacto Ambiental – EIA - PCH Piedade – Março/2007, Pág. 12
and approximate area of 20 square meters, was designed so that flow speeds would not exceed 1 m/s anddoes not include a concrete lining. The water channel will be approximately 6920 m long, excavated out ofthe ground, and in some sections small dikes will need to be executed using compact earthworks.
The water intake will be a gravity type concrete structure, with groups to install emergency, cofferdam typefloodgates and protection and cleaning gratings. The structure will have a height of around 20 m.
The penstock, diameter 2.4 m, anchored on anchoring blocks and supported by supporting blocks, will beapproximately 620 m long up to the bifurcation upon arrival at the power station. The two distributionbifurcation penstocks, 2.8 m in diameter, will be around 30 m long.
The internal operation power station on the right-hand bank of the river was designed to contain two turbogenerators with Francis Horizontal turbines providing 8.0 MW power each and output of 16.0 MW.
Total length of the power station is 16 m and width is 32.6 m, including the assembly area. The electricaland mechanical galleries, as well as the control room, are located beside the units and will be supported bymetallic structures.
Downstream, there will be a set of cofferdam floodgates activated by a motorized pulley system to close theunit suction tubes.The tailrace was designed based on the hydraulic conditions, the size of the power station alongside theturbine suction tube and the topographic characteristics in the deployment area. The trapezoid channel willbe 20 m wide at the mouth and around 45 m long.
1.1.6 Transmission System
The associated transmission system will comprise a 6.9 x 6.9 kV pumping substation and 69 kVtransmission line.
The substation will be conventional, single bus with two entry and two line bays. The substation patio willbe located on the left-hand side of the power station at an elevation of 525 m, in an open area coveringapproximately 420 square meters, protected by a fence.
The transmission line, connected to the Avatinguara substation, will be approximately 11 km long.
Revisão do Estudo de Impacto Ambiental – EIA - PCH Piedade – Março/2007, Pág. 13
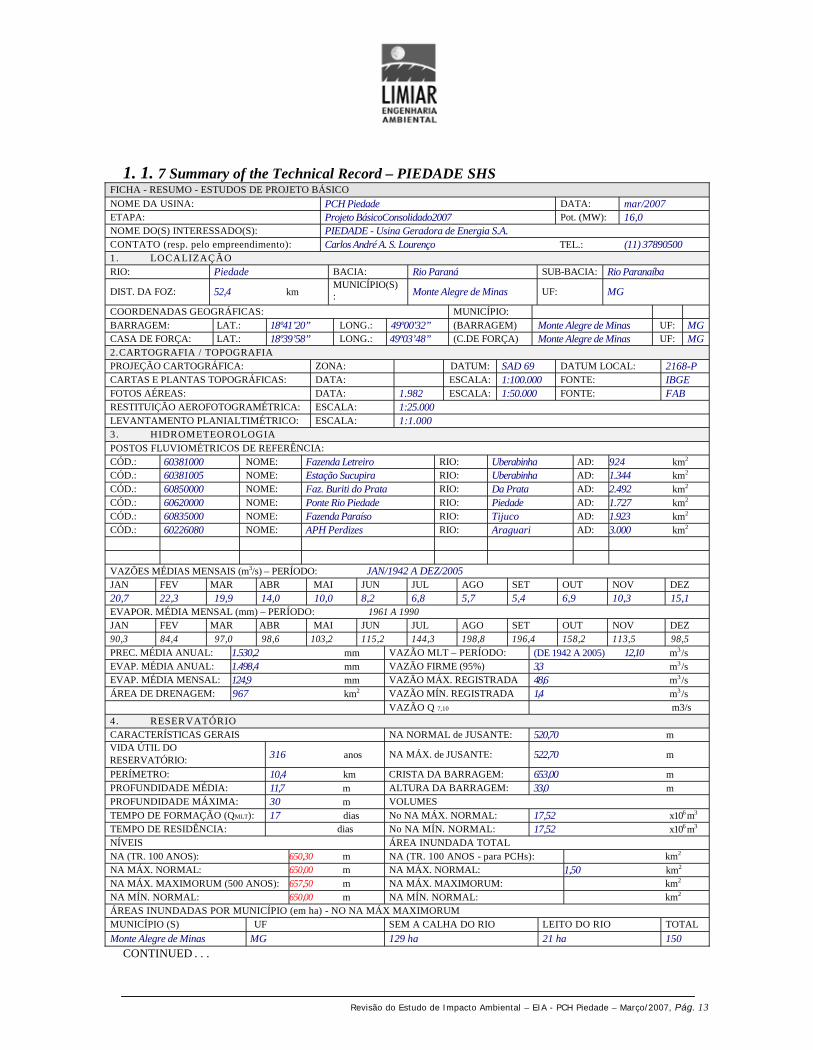
1. 1. 7 Summary of the Technical Record – PIEDADE SHSFICHA - RESUMO - ESTUDOS DE PROJETO BÁSICO
NOME DA USINA: PCH Piedade DATA: mar/2007ETAPA: Projeto BásicoConsolidado2007 Pot. (MW): 16,0NOME DO(S) INTERESSADO(S): PIEDADE - Usina Geradora de Energia S.A.CONTATO (resp. pelo empreendimento): Carlos André A. S. Lourenço TEL.: (11) 378905001. LOCALIZAÇÃORIO: Piedade BACIA: Rio Paraná SUB-BACIA: Rio Paranaíba
DIST. DA FOZ: 52,4 kmMUNICÍPIO(S): Monte Alegre de Minas UF: MG
COORDENADAS GEOGRÁFICAS: MUNICÍPIO:BARRAGEM: LAT.: 18º41’20” LONG.: 49º00'32” (BARRAGEM) Monte Alegre de Minas UF: MGCASA DE FORÇA: LAT.: 18º39’58” LONG.: 49º03’48” (C.DE FORÇA) Monte Alegre de Minas UF: MG2.CARTOGRAFIA / TOPOGRAFIAPROJEÇÃO CARTOGRÁFICA: ZONA: DATUM: SAD 69 DATUM LOCAL: 2168-PCARTAS E PLANTAS TOPOGRÁFICAS: DATA: ESCALA: 1:100.000 FONTE: IBGEFOTOS AÉREAS: DATA: 1.982 ESCALA: 1:50.000 FONTE: FABRESTITUIÇÃO AEROFOTOGRAMÉTRICA: ESCALA: 1:25.000LEVANTAMENTO PLANIALTIMÉTRICO: ESCALA: 1:1.0003. HIDROMETEOROLOGIAPOSTOS FLUVIOMÉTRICOS DE REFERÊNCIA:CÓD.: 60381000 NOME: Fazenda Letreiro RIO: Uberabinha AD: 924 km2
CÓD.: 60381005 NOME: Estação Sucupira RIO: Uberabinha AD: 1.344 km2
CÓD.: 60850000 NOME: Faz. Buriti do Prata RIO: Da Prata AD: 2.492 km2
CÓD.: 60620000 NOME: Ponte Rio Piedade RIO: Piedade AD: 1.727 km2
CÓD.: 60835000 NOME: Fazenda Paraíso RIO: Tijuco AD: 1.923 km2
CÓD.: 60226080 NOME: APH Perdizes RIO: Araguari AD: 3.000 km2
VAZÕES MÉDIAS MENSAIS (m3/s) – PERÍODO: JAN/1942 A DEZ/2005JAN FEV MAR ABR MAI JUN JUL AGO SET OUT NOV DEZ20,7 22,3 19,9 14,0 10,0 8,2 6,8 5,7 5,4 6,9 10,3 15,1EVAPOR. MÉDIA MENSAL (mm) – PERÍODO: 1961 A 1990JAN FEV MAR ABR MAI JUN JUL AGO SET OUT NOV DEZ90,3 84,4 97,0 98,6 103,2 115,2 144,3 198,8 196,4 158,2 113,5 98,5PREC. MÉDIA ANUAL: 1.530,2 mm VAZÃO MLT – PERÍODO: (DE 1942 A 2005) 12,10 m3/sEVAP. MÉDIA ANUAL: 1.498,4 mm VAZÃO FIRME (95%) 3,3 m3/sEVAP. MÉDIA MENSAL: 124,9 mm VAZÃO MÁX. REGISTRADA 48,6 m3/sÁREA DE DRENAGEM: 967 km2 VAZÃO MÍN. REGISTRADA 1,4 m3/s
VAZÃO Q 7,10 m3/s4. RESERVATÓRIOCARACTERÍSTICAS GERAIS NA NORMAL de JUSANTE: 520,70 mVIDA ÚTIL DORESERVATÓRIO: 316 anos NA MÁX. de JUSANTE: 522,70 m
PERÍMETRO: 10,4 km CRISTA DA BARRAGEM: 653,00 mPROFUNDIDADE MÉDIA: 11,7 m ALTURA DA BARRAGEM: 33,0 mPROFUNDIDADE MÁXIMA: 30 m VOLUMESTEMPO DE FORMAÇÃO (QMLT): 17 dias No NA MÁX. NORMAL: 17,52 x10⁶ m3
TEMPO DE RESIDÊNCIA: dias No NA MÍN. NORMAL: 17,52 x10⁶ m3
NÍVEIS ÁREA INUNDADA TOTALNA (TR. 100 ANOS): 650,30 m NA (TR. 100 ANOS - para PCHs): km2
NA MÁX. NORMAL: 650,00 m NA MÁX. NORMAL: 1,50 km2
NA MÁX. MAXIMORUM (500 ANOS): 657,50 m NA MÁX. MAXIMORUM: km2
NA MÍN. NORMAL: 650,00 m NA MÍN. NORMAL: km2
ÁREAS INUNDADAS POR MUNICÍPIO (em ha) - NO NA MÁX MAXIMORUMMUNICÍPIO (S) UF SEM A CALHA DO RIO LEITO DO RIO TOTAL
Monte Alegre de Minas MG 129 ha 21 ha 150
CONTINUED . . .

. . .
Revisão do Estudo de Impacto Ambiental – EIA - PCH Piedade – Março/2007, Pág. 14
5. TURBINASTIPO: Francis Horizontal QUEDA DE REFERÊNCIA: 123,70 mNÚMERO DE UNIDADES: 2 VAZÃO NOMINAL UNITÁRIA: 7,5 m3/sPOTÊNCIA UNIT.NOMINAL: 8.247 kW RENDIMENTO MÁXIMO: 92 %
ROTAÇÃO SÍNCRONA: 720 r.p.m. PESO TOTAL POR UNIDADE: kN6. G ERADORESPOTÊNCIA UNITÁRIA NOMINAL: 8.899 kVA RENDIMENTO MÁXIMO: 97,0 %TENSÃO NOMINAL: 6,9 kV PESO DO ROTOR: kNFATOR DE POTÊNCIA: 0,907. INSTALAÇÕES DE TRANSMISSÃO DE INTERESSE RESTRITO À CENTRAL GERADORASUBESTAÇÃO ELEVADORA - DADOS DO TRANSFORMADOR SUBESTAÇÃO DE INTERLIGAÇÃO - BAY DE ENTRADANÚMERO DE UNIDADES: 1 A CONSTRUIR ? (sim ou não): SimPOTÊNCIA UNITÁRIA NOMINAL: 18.000 kVA NOME: AvatinguaraTENSÃO ENR. PRIM.: 6,9 kV CONCESSIONÁRIA: CEMIGTENSÃO ENR. SEC.: 69 kV NÚMERO DE UNIDADES: 1LINHA DE TRANSMISSÃO POTÊNCIA UNITÁRIA NOMINAL: 18.000 kVAEXTENSÃO: 11 km TENSÃO ENR. PRIM.: kVTENSÃO: 69 kV TENSÃO ENR. SEC.: kVCIRCUITO (Simples ou Duplo): Simples
8. ESTUDOS ENERGÉTICOSQUEDA BRUTA: 129,30 m REND. DO CONJ. TURBINA/GERADOR: 89,2 %PERDA HIDRÁULICA: 4,3 % VAZÃO REMANESCENTE: 0,65 m3/sFATOR DE INDISP. FORÇADA: 0,01 - ENERGIA GERADA: 83.947 MWhFATOR DE INDISP. PROGRAMADA: 0,02 - ENERGIA ASSEGURADA: 9,583 MW médios9.CUSTOSOBRAS CIVIS: 24.948,22 X 103 R$ SIST. DE TRANSMISSÃO ASSOCIADO: 1.663,75 X 103 R$EQ. ELETROMECÂNICOS: 25.772,67 X 103 R$ JUROS ANUAIS: 10 %MEIO AMBIENTE: 533,50 X 10³ R$ PERÍODO DE UTILIZAÇÃO DA USINA: 30 anosSUBESTAÇÃO: 1.155,00 X 103 R$ C.O.M. ANUAL: 1.007.37 X 103 R$CUSTO DIRETO TOTAL: 52.409,40 X 103 R$ CUSTO DA ENERGIA GERADA: 95,97 R$/MWhCUSTOS INDIRETOS: 6.475,68 X 103 R$CUSTO TOTAL S/ JDC: 58.885,08 X 103 R$ DATA DE REFERÊNCIA: Janeiro/2007CUSTO TOTAL C/ JDC: 64.773,58 X 103 R$ TAXA DE CÂMBIO: 2,18 R$/US$10. IMPACTOS SÓCIO-AMBIENTAISPOPULAÇÃO ATINGIDA (N° HABITANTES): FAMÍLIAS ATINGIDAS:URBANA: URBANA:RURAL: RURAL:TOTAL: 0,00 TOTAL: 0 ,00QUANTIDADE DE NÚCLEOS URBANOS ATINGIDOS:INTERFERÊNCIA EM ÁREAS LEGALMENTE PROTEGIDAS ? (sim ou não)INTERFERÊNCIA EM ÁREAS INDÍGENAS ? (sim ou não) Não TRIBO (S):RELOCAÇÃO DE ESTRADAS ? (sim ou não) Não EXTENSÃO: kmRELOCAÇÃO DE PONTES ? (sim ou não) Não EXTENSÃO: kmEMPREGOS GERADOS DURANTE A CONSTRUÇÃO:DIRETOS: INDIRETOS:11. CRONOGRAMA - PRINCIPAIS FASESINÍCIO DAS OBRAS ATÉ O DESVIO: 11 meses TOTAL: 19 mesesDESVIO ATÉ O FECHAMENTO: 7 meses MONTAGEM ELETROMECÂNICA (1° UNID.): 14 mesesFECHAMENTO ATÉ GERAÇÃO (1° UNID.): 0,6 meses OPERAÇÃO PRIMEIRA UNIDADE: 18,6 meses12. ASPECTOS CRÍTICOS DO EMPREENDIMENTOPARQUES NACIONAIS ? (sim ou não) Não (especificar, quando for o caso)ÁREAS DE PROTEÇÃO AMBIENTAL - APA ? (sim ou não) Não (especificar, quando for o caso)RESERVAS ECOLÓGICAS ? (sim ou não) Não (especificar, quando for o caso)RESERVAS MINERAIS ? (sim ou não) Não (especificar, quando for o caso)
SÍTIOS ARQUEOLÓGICOS ? (sim ou não) Não (especificar, quando for o caso)

Revisão do Estudo de Impacto Ambiental – EIA - PCH Piedade – Março/2007, Pág. 15
CAVERNAS ? (sim ou não) Não (especificar, quando for o caso)CANOAGEM NO LEITO DO RIO ? (sim ou não) Não (especificar, quando for o caso)OUTROS ? (sim ou não) Não (especificar, quando for o caso)13. DESCRIÇÃO SOBRE OS OUTROS USOS DA ÁGUANAVEGAÇÃO (sim ou não) Não (especificar, quando for o caso)ABASTECIMENTO PÚBLICO (sim ou não) Não (especificar, quando for o caso)TURISMO LOCAL (sim ou não) Não (especificar, quando for o caso)LAZER (sim ou não) Não (especificar, quando for o caso)OUTROS (sim ou não) Sim Dessedentação animal14. OBSERVAÇÕES
DADOS DE ARRANJO15. DESVIOTIPO: Adufa ESCAVAÇÃO COMUM: 15.242 m3
VAZÃO DE DESVIO: (TR = 10 anos estiagem) 19,00 m3/s ESC. EM ROCHA A CÉU ABERTO: 3771 m3
NÚMERO DE UNIDADES: 1 ESC. EM ROCHA ALTERADA: m3
SEÇÃO: 9,0 m2 CONCRETO (CONVENCIONAL): 230 m3
COMPRIMENTO: 32,40 m ENSECADEIRA: 13.103 m3
16. BARRAGEMTIPO DE ESTRUTURA / MATERIAL: terra e enrocamento FILTROS E TRANSIÇÕES: 30.800 m3
COMPRIMENTO TOTAL DA CRISTA: 294 m CONCRETO CONVENCIONAL: m3
ENROCAMENTO: 8.600 m3 CONC. COMPACTADO A ROLO-CCR: m3
ATERRO COMPACTADO: 432.000 m3 VOLUME TOTAL: m3
17. DIQUESTIPO DE ESTRUTURA / MATERIAL: ATERRO COMPACTADO: m3
COMPRIMENTO TOTAL DA(S) CRISTA(S): m FILTROS E TRANSIÇÕES: m3
ALTURA MÁXIMA: m CONCRETO CONVENCIONAL: m3
COTA DA CRISTA: m CONC. COMPACTADO A ROLO-CCR: m3
ENROCAMENTO: m3 VOLUME TOTAL: m3
18. VERTEDOUROTIPO: Soleira Livre CONCRETO (CONVENCIONAL): 2100 m3
VAZÃO DE PROJETO: (TR = 500 ANOS) 121,00 m3/s COMPORTAS:COTA DA SOLEIRA: 650,00 m TIPO:COMPRIMENTO TOTAL: 30,00 m ACIONAMENTO:NÚMERO DE VÃOS: - LARGURA: MLARGURA DO VÃO: m ALTURA: mESCAVAÇÃO COMUM: 2.410 m3
ESCAVAÇÃO EM ROCHA A CÉU ABERTO: 600 m3
ESCAVAÇÃO EM ROCHA ALTERADA: m3
19. SISTEMA ADUTORCANAL DE ADUÇÃO: TOMADA D'ÁGUA:COMPRIMENTO: 6.920,00 m TIPO:LARGURA DA BASE / SEÇÃO: 6,0 / 20,80 m / m2 COMPRIMENTO TOTAL: 12,75 mESCAVAÇÃO COMUM: 963.000 m3 NÚMERO DE VÃOS: 1 -ESC. EM ROCHA A CÉU ABERTO: m3 ESCAVAÇÃO COMUM: 2.100 m3
ESC. EM ROCHA ALTERADA: m3 ESC. EM ROCHA A CÉU ABERTO: 600 m3
CONCRETO PROJETADO: 1.100 m3 ESC. EM ROCHA ALTERADA: m3
CONDUTO FORÇADO: CONCRETO: 960 m3
NÚMERO DE UNIDADES: 1 COMPORTAS:DIÂMETRO INTERNO: 2,40 m TIPO: EnsecadeiraCOMPRIMENTO MÉDIO: 630 m ACIONAMENTO: TalhaDIÂMETRO APÓS DERIVAÇÃO 1,70 m LARGURA: 2,40 mDIÂMETRO DA VÁLVULA BORBOLETA 1,20 m ALTURA: 2,40 m20. CASA DE FORÇA / CANAL DE FUGATIPO: Abrigada ESCAVAÇÃO COMUM: 5.181 m3
NÚMERO DE UNIDADES: 2 ESC. EM ROCHA A CÉU ABERTO: 10.400- m3
LARGURA DOS BLOCOS: 10,00 m ESC. EM ROCHA ALTERADA: 2.410 m3
CONTINUED . . .

Revisão do Estudo de Impacto Ambiental – EIA - PCH Piedade – Março/2007, Pág. 16
ALTURA DOS BLOCOS: 15,50 m CONCRETO: 1.145 m3
COMPRIMENTO DOS BLOCOS: 32.40 m21. OBRAS ESPECIAISTIPO: ESC. EM ROCHA A SUBTERRÂNEA: m3
ESCAVAÇÃO COMUM: m3 CONCRETO CONVENCIONAL: m3
ESC. EM ROCHA A CÉU ABERTO: m3 CONC. COMPACTADO A ROLO - CCR: 4.692 m3
22 . VOLUMES TOTAISESCAVAÇÃO COMUM: 1.055.330 m3 ATERRO COMPACTADO: 432.000 m3
ESC. EM ROCHA A CÉU ABERTO: 25.711 m3 CONCRETO CONVENCIONAL: 8.390 m3
ESC. EM ROCHA ALTERADA: 27.600 m3 CONC. COMPACTADO A ROLO - CCR: 13.202 m3
ENROCAMENTO: 8.800 m3 TRANSIÇÕES 42.700 m3
The Piedade river basin is almost completely within the municipal region of Monte Alegre de Minas,covering a total surface area of 2607 square kilometers.
The Piedade river basin region is relatively homogeneous from a climatic standpoint, and can be classified ashumid and tropical; there are reasonable seasonal variations, with well-defined seasons. According to therainfall information from the Uberaba station, the period between October and March represents around 83%of total precipitation, and the driest quarter between June and August represents only 3%. Consultation of theMinas Gerais State Climate Atlas shows that the basin is located along the 1400 mm contour line, and it isinteresting to note that annual totals grow towards the east, towards Araxá, reaching around 1700 mm, andalso to the west, towards Ituiutaba, reaching levels of around 1500 mm.
The weather characteristics allow us to classify it as AW in the Köppen classification. It presents highsummer temperatures, with average temperatures of around 22°C. This average is slightly lower in thewinter, July being the coldest month, with minimum temperatures reaching 12°C. Rainfall distribution andhigh temperatures are responsible for the occurrence of a shortfall period followed by another with excessivewater in the ground.
Systems affecting the area include Polar Front disturbed circulation which modifies the stability in theregion, with discontinuity generated by the meeting of the polar and tropical air masses. This front, which isvery mobile and affects almost the entire country, exerts its greatest effect during winter and spring. Thedisturbances from this front cause rain and, after it has passed, the polar mass following behind is responsiblefor good, dry weather, clear skies and significant temperature falls, especially during winter.
The flow regime study for Piedade SHS includes: rainfall/river characteristics, defining average monthlyflow series, drawing up permanence curves, maximum discharge frequency studies and analysis ofsedimentation.
For a comparative analysis, we also used data from the Araguari River (APH Perdizes) and and theintermediate area between the Cachoeira Dourada and Itumbiara UHEs, based on SIPOT information.

Revisão do Estudo de Impacto Ambiental – EIA - Piedade SHS – Março/2007, Pág.17
The average monthly flow series extended back to 1942, using correlations and relations between drainageareas. Floodwater flow was defined using a regional analysis of extremes, based on a statistical analysis ofdaily information from various river flow points available.
In the Basic Project Consolidation phase, new bathymetric and topographic surveys were carried out in thedam and power station region, in addition to a survey and demarcation of the reservoir water line. Two staffgauges were installed, one upstream from the axis of the dam and another downstream from the tailrace tomeasure the flow and take water readings, from which we were able to determine the discharge flow at theplant's tailrace outlet.
In order to establish the necessary coherence, the hydrological surveys for this consolidation were based onthe information contained in the original Basic project reports, only updating the monthly average flowseries, according to data available from the basin.
1.2 River Flow
In order to obtain the monthly average flow series on the Piedade SHS axis, we collected data fromfluviometric stations along the Piedade river and neighboring basins and, when possible, from areas with thesame physical and climate characteristics. Table 1.1 contains information on the main flow measurementstations in the relevant area and surrounding areas, whose data was obtained from the ANEEL/ANAdatabase.
Table 1.1Flow Measurement
Posts
In general, faults were detected in records from the stations used, especially: at Fazenda Letreiro, data ismissing in the months of August and September, 1975, October to December 1978; several months in 1987and nine months in 1988; at Fazenda Buriti do Prata, data is missing in January, February and March 1943,March 1946, January 1948; debris of 1950 to December of 1954, July and August 1955, March to August1959, October 1960 to August 1962, December 1962, March to December 1965, April to June 1966, Januaryto March 1969, January 1974, made to August 1980, June and December 1987, June, July, October andNovember 1988, January 1989, January and February 1990 and October 1990 to May 1991; at FazendaParaíso, data is missing in August and September 1954, from January 1958 to July 1962, from March 1963to February 1964, from January 1965 to July 1966, from December 1968 August 1969, April 1970, fromNovember 1972 January 1971, October 1974, April and August 1975, from September 1990 to May 1991and from September 1991 to December 1994; at Ponte Rio Piedade,

Revisão do Estudo de Impacto Ambiental – EIA - Piedade SHS – Março/2007, Pág.18
As the base station for the current study, information is missing from January to March 1952, from February1958 to February 1959, August 1959, May 1960 to February 1962, November and December 1963 andFebruary 1964.
The monthly average flow series for the Ponte Rio Piedade station can be extended by around 10 yearsbecause they were daily measurements available up to 1985, although the data available on ANA ends in1975. Because of the inconsistencies from the Estação de Sucupira station on the Uberabinha river, it wasnot included in the study, opting to work with the Fazenda Letreiro data from the same river.
In order to standardize the information, all of the drainage areas were recalculated on the same cartographicbasis, obtaining different figures for the Fazenda Paraiso stations, which increased from 1469 squarekilometers to 1923 square kilometers and Fazenda Buriti do Prata, which fell from 2526 square kilometers to2492 square kilometers. The original values from Ponte rio Piedade and Fazenda Letreiro were maintained,1727 square kilometers and 924 square kilometers respectively.
The SIPOT database was used to obtain monthly average flows, covering the period between 1931/1994, forthe UHE Cachoeira Dourada and UHE Itumbiara, on the Paranaíba river and UHEs Perdizes, Pai Joaquim,Nova Ponte, Miranda and Capim Branco II on the Araguari river.
The Piedade river basin presents a strange isohyetal configuration which may explain its lower specificcontribution in comparison with neighboring rivers, for example the Prata, Uberabinha and Araguari. Thetotal precipitation chart indicated in the Minas Gerais Climate Atlas shows increasing rainfall isobarstowards the east, rising from 1400 mm at the source of the Piedade river to 1600 mm on the Araguari river.In the other direction, West, the isobars also grow in value from 1400 mm at the left bank of the TijucoRiver to 1500 mm. This means that the Piedade river basin is indeed the sector with the lowest rainfallthroughout the Minas Gerais triangle. Although the difference is not very big, it may justify the lower wateryields of the Piedade River presented by the fluviometric data from the station of the same name.
On the Piedade river, the station capable of providing flow information at the project site is Ponte RioPiedade (code 60620000), situated upstream from the BR-153 highway bridge, which crosses the river on itsdownstream stretch. The average monthly flow information initially obtained, covering a short period ofhistorical time (1952 to 1975, with several missing sections and only 16 complete years) and includinghighly critical years such as 1953 to 1956, 1971 and 1972, result in a specific average contribution of 8.8l/s.km2, a low value and clearly not representative of the long-term average in dislocation, even consideringthe aforementioned isohyetal peculiarities.
Several analysis were carried out in order to increase the range available at the Ponte Rio Piedade station asfar as possible, including layout and comparison of daily river heights, monthly hydrographs andcorrelations between monthly average flow and neighboring stations. Subsequently, the flows from thestation were transferred to possible uses locations on the Piedade River based on a simple relationshipbetween the drainage areas, based on the proximity of the Andusa. However, certain aspects
Review of the Environmental Impact Study – EIA - Piedade SHS – March/2007, P. 19
had to be taken into account as follows:
Initially, we attempted to increase the flow series from the Ponte rio Piedade station, using the average dailyriver heights available for the period between 1976 and 1985, which had not yet been processed. Based onthe discharge measurements obtained from ANEEL, we can draw the station discharge curve finding that thecurve is unique and covers measurements carried out in the aforementioned period. The equation obtainedfor the discharge curve was:
Q = 0,03657 . (H – 50)1,45531
where:
H = height in cmQ = flow in m3/s
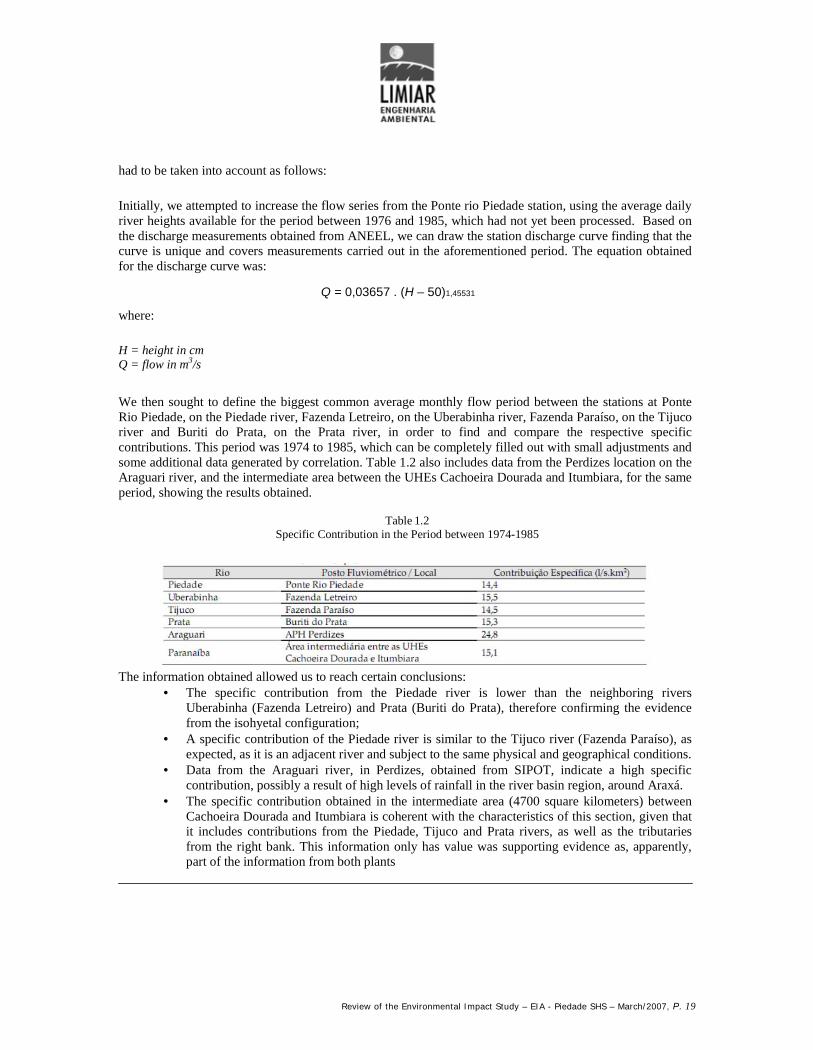
We then sought to define the biggest common average monthly flow period between the stations at PonteRio Piedade, on the Piedade river, Fazenda Letreiro, on the Uberabinha river, Fazenda Paraíso, on the Tijucoriver and Buriti do Prata, on the Prata river, in order to find and compare the respective specificcontributions. This period was 1974 to 1985, which can be completely filled out with small adjustments andsome additional data generated by correlation. Table 1.2 also includes data from the Perdizes location on theAraguari river, and the intermediate area between the UHEs Cachoeira Dourada and Itumbiara, for the sameperiod, showing the results obtained.
Table 1.2Specific Contribution in the Period between 1974-1985
The information obtained allowed us to reach certain conclusions: The specific contribution from the Piedade river is lower than the neighboring rivers
Uberabinha (Fazenda Letreiro) and Prata (Buriti do Prata), therefore confirming the evidencefrom the isohyetal configuration;
A specific contribution of the Piedade river is similar to the Tijuco river (Fazenda Paraíso), asexpected, as it is an adjacent river and subject to the same physical and geographical conditions.
Data from the Araguari river, in Perdizes, obtained from SIPOT, indicate a high specificcontribution, possibly a result of high levels of rainfall in the river basin region, around Araxá.
The specific contribution obtained in the intermediate area (4700 square kilometers) betweenCachoeira Dourada and Itumbiara is coherent with the characteristics of this section, given thatit includes contributions from the Piedade, Tijuco and Prata rivers, as well as the tributariesfrom the right bank. This information only has value was supporting evidence as, apparently,part of the information from both plants

Revisão do Estudo de Impacto Ambiental – EIA - Piedade SHS – Março/2007, Pág.20
Is based on flow rate reconstitution using reservoir operation data;
The specific contribution values indicated in the table are valid for the period stated are notrepresentative of longer periods.
The next step was to complete the monthly average flow rates series for the Ponte rio Piedade station for theperiod preceding 1952 and fill gaps between this date and 1964.
An exhaustive analysis was conducted, which included comparison of daily hydrographs in order toestablish possible information for months without any data, based on the relationship between the drainageareas and neighboring stations, subsequently defining the following hierarchy:
The priority station used is Fazenda Paraíso, on the Tijuco river, because of its proximity andsimilarity with the rainfall and flow rate regime. With the information from the station wecould have filled out the Ponte Rio Piedade series up to 1949 if it were not for several gaps,especially between 1958 and 1966;
Then, in months where data is missing from Fazenda Paraiso, we used data from the FazendaLetreiro station, on the Uberabinha river. In this case, the list of drainage areas was affected bythe ratio between the respective specific contributions;
We then used data from the Buriti do Prata station on the Prata river; Finally, for the remaining months that needed filling in, and to complete the series from the
Ponte Rio Piedade between 1941 and 1931, we used information from Perdizes on the Araguaririver. In this case, the list of drainage areas was also affected by the ratio between the respectivespecific contributions;
This procedure allowed us to complete a series of monthly average flow rates at the Ponte Rio Piedadestation, encompassing the period between 1931 and 2005. Below is a list of the months which were filled in,the base stations used and the respective equations.
At Ponte Rio Piedade, the months of 01/86 208/90, 06/91 to 08/91, 01/95 to 12/01 and 05/49 to 03/52 werefilled in using the Fazenda Paraíso station, on the Tijuco river, based on the expression QPIE = 0,898.QPAR,which represents the simple ratio between the drainage areas of both stations. The Fazenda Letreiro stationwas used for the months 09/90 to 05/91, 09/91 to 12/94 and 01/02 and 12/02 with the expression QPIE =1,731.QLET, where the ratio between drainage areas is affected by the ratio between the respective specificcontributions, 14.4 and 15.5 l/s.km2. The months 02/3802/59, 05/6009/60, 11/63 to 12/63, 05/64, 11/41 to12/42, 04/43 to 02/47, 04/47 to 12/47 and 02/4804/49 were filled in using the Buriti do Prata station, on thePrata river, using the equation QPIE = 0,693.QBUR, representing the simple ratio between the drainageareas. Finally, the additional months of 01/43 to 03/43, 03/47, 01/48, 08/59, 10/60 to 02/62 and also theperiod between 01/31 and 10/41, were completed using the local flow rates data from UHE Perdizes, on theAraguari river, based on the expression QPIE = 0,334.QPER, where the drainage area ratio between bothareas is affected by the ratio between the respective specific contributions, 14.4 and 24.8 l/s.km2.

Review of the Environmental Impact Study – EIA - Piedade SHS – March/2007, P. 21
Table 1.3 shows the monthly average flow rates series for the Ponto Rio Piedade station in the periodbetween 1931/2005, obtained as described. Average flow rate is 20.95 m3/s, which for a drainage area of1727 square kilometres represents a specific contribution of 12.13 l/s.km2, a coherent value in light of thespecific nature of the rainfall and river flow in the river basin.
On the other hand, the period between 1931 in 1941 depended entirely on the Perdizes location on theAraguari river, therefore at the Ponte Rio Piedade location we decided to use only the series of figures from1942 to 2005, which presents a substantial period of time (64 years), including the data from the interlinkedsystem and missing information was provided by neighbouring stations. Table 1.4 presents the series fromthe Ponte Rio Piedade station between 1942 and 2005. All the following calculations therefore cover theseries from this period, which was believed to be more reliable, with average flow rate of 21.59 m3/s, whichrepresents a contribution of 12.5 l/s.km2.
Table 1.5 shows the average monthly flow rates series at Piedade SHS, obtained from the drainage area ratiowith the Ponte Rio Piedade station. Figure 1.1 we have the monthly average flow rate permanence curve atPiedade SHS.

Revisão do Estudo de Impacto Ambiental – EIA - Piedade SHS – Março/2007, Pág.22
Table 1.3PIEDADE RIVER AT PONTE RIO PIEDADE (AD = 1.727 KM2) MONTHLY AVERAGE FLOW SERIES - PERIOD 1.931-2005.
Ano Jan Fev Mar Abr Mai Jun Jul Ago Set Out Nov Dez Média1931 38,40 67,50 67,80 49,80 26,80 17,70 15,90 13,60 13,30 13,00 13,20 17,90 29,581932 15,30 39,70 30,60 20,70 14,40 13,70 11,30 8,40 6,10 10,10 13,10 30,10 17,791933 50,40 41,80 30,10 27,70 18,00 13,90 10,20 9,00 8,10 10,00 11,70 23,40 21,191934 28,50 22,30 22,20 17,40 12,20 6,80 5,50 4,40 5,30 7,20 6,30 10,00 12,341935 39,70 48,10 28,30 42,80 26,00 16,10 11,60 10,10 5,60 9,30 10,40 17,50 22,131936 18,20 12,00 35,40 24,40 15,10 9,80 8,60 6,50 5,60 5,80 8,60 13,60 13,631937 29,50 12,20 16,10 18,70 13,20 11,10 7,70 5,70 5,00 5,90 14,10 28,00 13,931938 32,20 22,20 22,20 18,00 10,60 8,90 8,30 5,20 4,00 3,60 7,70 23,60 13,881939 35,10 36,40 16,00 13,50 11,50 9,60 6,90 6,00 4,50 4,90 9,60 13,60 13,971940 24,40 43,80 38,10 19,00 14,60 11,00 8,20 4,60 4,70 5,60 17,60 15,30 17,241941 30,30 19,90 17,00 20,50 10,30 8,10 6,80 5,10 5,10 6,50 21,40 18,50 14,131942 17,40 24,60 36,70 24,69 15,81 10,51 7,49 5,41 5,91 5,30 8,71 22,41 15,411943 57,11 52,40 46,40 23,10 14,59 11,90 8,30 6,21 5,10 15,40 22,80 19,61 23,581944 17,70 25,91 33,40 22,19 11,29 8,30 6,21 4,60 3,69 8,71 16,00 15,90 14,491945 15,00 48,60 37,40 31,29 16,90 12,29 8,90 6,21 4,69 15,31 29,10 40,30 22,171946 45,00 36,70 52,70 29,21 19,50 15,50 16,59 10,60 8,60 15,40 15,31 22,91 24,001947 41,69 43,19 61,50 28,80 22,00 16,90 14,59 12,10 15,90 17,31 13,70 48,49 28,011948 36,40 54,90 43,69 27,40 19,61 15,70 13,40 11,01 8,99 10,51 29,40 22,60 24,471949 32,40 54,90 35,70 20,00 22,80 14,01 10,90 7,90 5,99 23,80 14,20 22,60 22,101950 25,10 47,49 44,41 23,00 16,40 13,01 9,71 6,80 5,69 9,30 32,51 31,79 22,101951 52,60 56,20 50,70 26,10 19,61 15,90 12,01 9,30 7,30 10,10 11,40 15,40 23,881952 29,90 35,50 42,91 20,30 12,01 10,79 8,60 6,90 5,91 11,79 13,81 12,01 17,541953 10,01 11,90 20,70 16,40 9,90 7,60 6,80 5,30 6,40 12,29 9,30 17,70 11,191954 9,40 21,69 11,29 10,79 11,01 6,80 5,10 3,69 3,00 2,50 5,69 7,60 8,211955 23,19 13,60 11,79 10,79 5,80 4,80 3,69 6,80 4,00 5,00 4,00 20,70 9,511956 19,30 15,81 23,91 11,51 11,90 16,50 8,80 7,80 6,30 5,69 9,90 14,70 12,681957 25,91 26,99 22,80 31,29 18,50 13,10 11,20 7,60 8,80 4,60 9,79 16,90 16,461958 43,00 57,20 44,69 35,59 30,40 21,80 20,20 12,90 14,09 14,81 13,90 29,21 28,151959 50,01 37,09 39,11 17,59 13,29 11,51 11,60 11,20 9,79 7,21 11,60 20,80 20,071960 29,60 47,21 25,91 16,31 13,40 12,79 8,80 6,10 4,60 12,01 27,10 41,41 20,441961 67,49 68,80 59,11 30,70 29,60 20,20 16,70 14,31 12,10 11,20 16,90 15,90 30,251962 38,39 53,40 36,09 22,60 19,30 16,90 13,01 11,10 10,51 17,00 12,01 48,60 24,911963 41,00 40,00 22,80 18,31 14,50 12,60 11,60 10,21 8,40 6,80 9,10 5,30 16,721964 22,00 65,00 15,50 14,09 12,10 8,49 7,99 6,10 5,10 13,70 17,20 34,50 18,481965 37,89 41,11 41,61 24,30 19,39 15,00 13,40 10,40 8,80 15,09 18,70 25,10 22,571966 25,80 39,50 38,89 24,10 22,00 15,20 12,70 10,10 9,10 15,00 18,31 22,69 21,121967 28,40 35,00 28,30 21,91 16,81 13,90 10,90 9,10 10,51 11,01 18,80 28,49 19,431968 26,49 36,90 32,51 21,39 16,31 12,79 11,10 9,79 8,90 13,20 16,09 35,90 20,111969 32,70 28,10 18,31 17,20 11,79 9,60 8,49 6,99 6,21 11,10 23,91 15,59 15,831970 26,80 36,50 23,69 16,90 11,70 9,71 8,49 6,99 7,90 9,40 9,79 9,40 14,771971 8,40 9,60 11,01 6,99 5,10 5,19 3,91 3,60 3,10 4,69 8,49 22,91 7,751972 13,51 20,61 15,09 9,79 7,40 5,91 6,80 5,10 5,41 15,90 20,89 20,30 12,231973 25,71 29,79 38,70 26,10 16,09 12,90 10,60 8,60 8,10 12,51 20,80 23,41 19,441974 24,10 16,90 31,79 26,49 16,00 13,29 10,51 9,21 6,99 10,70 10,40 22,69 16,591975 27,21 19,50 16,81 20,89 12,20 9,49 10,10 7,21 5,60 9,10 18,39 26,71 15,271976 19,39 33,01 25,30 22,11 13,60 11,60 9,60 8,99 11,29 16,50 19,39 38,39 19,101977 40,20 29,10 22,30 23,60 17,09 14,31 10,90 8,99 9,60 11,01 25,41 31,79 20,361978 49,90 25,19 23,60 20,50 16,31 15,90 12,10 10,51 9,71 16,59 33,60 38,00 22,661979 40,00 44,00 30,01 25,00 23,69 20,80 18,50 14,81 20,20 13,60 21,69 24,80 24,761980 46,80 42,30 27,30 32,10 25,60 21,61 18,89 15,90 16,31 17,00 24,30 33,01 26,761981 42,50 25,71 28,10 19,00 17,00 15,90 13,51 12,10 9,90 19,39 23,50 31,51 21,511982 51,51 42,19 45,10 40,39 31,70 28,21 23,91 21,20 18,20 21,11 22,00 38,89 32,031983 74,81 69,79 76,20 48,80 33,81 30,70 26,99 22,80 24,41 29,60 32,60 53,10 43,631984 40,50 36,09 28,99 29,10 23,60 19,20 17,70 18,61 18,50 16,00 24,50 30,70 25,291985 52,20 48,90 54,70 39,89 26,49 22,69 21,00 18,61 17,81 17,09 20,11 23,30 30,231986 36,59 35,70 36,09 22,00 21,61 12,51 12,79 13,10 8,30 10,01 9,60 34,59 21,071987 41,91 51,20 47,99 27,40 22,50 15,59 11,70 9,21 8,49 7,90 23,91 34,31 25,181988 31,10 66,71 36,50 41,00 23,50 17,20 12,29 9,71 7,49 15,50 20,89 29,30 25,931989 34,20 56,90 40,39 21,00 15,81 13,01 10,79 12,60 11,29 7,60 12,79 27,10 21,961990 30,60 16,31 19,11 22,19 15,09 9,40 8,40 7,71 10,10 8,99 7,60 13,20 14,061991 27,90 51,20 57,50 63,50 20,00 18,50 14,81 10,10 8,71 10,90 12,79 26,71 26,891992 52,40 72,01 45,99 34,90 23,80 17,20 16,31 13,01 16,50 21,50 59,20 37,31 34,181993 27,60 54,31 39,89 45,30 22,60 25,30 16,81 14,20 15,81 18,39 20,50 28,10 27,401994 60,20 26,90 45,99 28,49 21,91 15,81 13,90 12,79 10,90 12,01 15,59 32,60 24,761995 23,91 50,40 42,69 26,10 11,60 15,59 19,61 11,51 9,10 14,09 13,10 20,30 21,501996 29,51 26,90 36,70 23,60 16,50 15,40 12,60 10,90 14,09 9,49 21,50 20,20 19,781997 80,23 30,21 45,73 24,39 16,98 22,37 13,45 10,28 9,06 12,22 16,88 40,30 26,841998 33,74 44,51 29,92 19,50 21,84 13,01 9,03 10,38 5,91 12,04 18,06 27,60 20,461999 63,66 30,83 39,75 19,82 12,58 11,15 8,81 6,71 9,12 5,82 7,15 14,50 19,162000 53,36 74,45 65,33 29,56 17,52 13,63 11,97 9,72 15,66 7,74 19,71 23,68 28,532001 14,75 12,90 18,95 12,76 8,78 6,82 5,21 4,75 4,67 8,53 9,22 15,22 10,212002 73,40 60,75 36,72 18,91 14,67 11,74 10,69 9,71 9,97 8,28 19,75 43,44 26,502003 86,69 61,99 50,38 31,36 25,35 18,56 15,60 14,93 15,69 15,23 41,03 40,47 34,772004 28,42 39,15 27,73 31,95 21,11 20,13 16,15 12,10 8,04 13,57 21,99 37,97 23,192005 42,92 38,60 26,89 21,62 19,34 17,94 14,87 13,48 12,98 8,13 21,23 36,16 22,85
Mínima 8,40 9,60 11,01 6,99 5,10 4,80 3,69 3,60 3,00 2,50 4,00 5,30 2,50Média 35,63 38,89 34,55 24,89 17,46 14,12 11,72 9,67 9,15 11,62 17,48 25,85 20,95
Máxima 86,69 74,45 76,20 63,50 33,81 30,70 26,99 22,80 24,41 29,60 59,20 53,10 86,69

Revisão do Estudo de Impacto Ambiental – EIA - Piedade SHS – Março/2007, Pág.23
QUADRO 1.4RIO PIEDADE EM PONTE RIO PIEDADE (AD = 1.727 KM2)SÉRIE DE VAZÕES MÉDIAS MENSAIS - PERÍODO 1.942-2.005
Ano Jan Fev Mar Abr Mai Jun Jul Ago Set Out Nov Dez Média1942 17.40 24.60 36.70 24.69 15.81 10.51 7.49 5.41 5.91 5.30 8.71 22.41 15.411943 57.11 52.40 46.40 23.10 14.59 11.90 8.30 6.21 5.10 15.40 22.80 19.61 23.581944 17.70 25.91 33.40 22.19 11.29 8.30 6.21 4.60 3.69 8.71 16.00 15.90 14.491945 15.00 48.60 37.40 31.29 16.90 12.29 8.90 6.21 4.69 15.31 29.10 40.30 22.171946 45.00 36.70 52.70 29.21 19.50 15.50 16.59 10.60 8.60 15.40 15.31 22.91 24.001947 41.69 43.19 61.50 28.80 22.00 16.90 14.59 12.10 15.90 17.31 13.70 48.49 28.011948 36.40 54.90 43.69 27.40 19.61 15.70 13.40 11.01 8.99 10.51 29.40 22.60 24.471949 32.40 54.90 35.70 20.00 22.80 14.01 10.90 7.90 5.99 23.80 14.20 22.60 22.101950 25.10 47.49 44.41 23.00 16.40 13.01 9.71 6.80 5.69 9.30 32.51 31.79 22.101951 52.60 56.20 50.70 26.10 19.61 15.90 12.01 9.30 7.30 10.10 11.40 15.40 23.881952 29.90 35.50 42.91 20.30 12.01 10.79 8.60 6.90 5.91 11.79 13.81 12.01 17.541953 10.01 11.90 20.70 16.40 9.90 7.60 6.80 5.30 6.40 12.29 9.30 17.70 11.191954 9.40 21.69 11.29 10.79 11.01 6.80 5.10 3.69 3.00 2.50 5.69 7.60 8.211955 23.19 13.60 11.79 10.79 5.80 4.80 3.69 6.80 4.00 5.00 4.00 20.70 9.511956 19.30 15.81 23.91 11.51 11.90 16.50 8.80 7.80 6.30 5.69 9.90 14.70 12.681957 25.91 26.99 22.80 31.29 18.50 13.10 11.20 7.60 8.80 4.60 9.79 16.90 16.461958 43.00 57.20 44.69 35.59 30.40 21.80 20.20 12.90 14.09 14.81 13.90 29.21 28.151959 50.01 37.09 39.11 17.59 13.29 11.51 11.60 11.20 9.79 7.21 11.60 20.80 20.071960 29.60 47.21 25.91 16.31 13.40 12.79 8.80 6.10 4.60 12.01 27.10 41.41 20.441961 67.49 68.80 59.11 30.70 29.60 20.20 16.70 14.31 12.10 11.20 16.90 15.90 30.251962 38.39 53.40 36.09 22.60 19.30 16.90 13.01 11.10 10.51 17.00 12.01 48.60 24.911963 41.00 40.00 22.80 18.31 14.50 12.60 11.60 10.21 8.40 6.80 9.10 5.30 16.721964 22.00 65.00 15.50 14.09 12.10 8.49 7.99 6.10 5.10 13.70 17.20 34.50 18.481965 37.89 41.11 41.61 24.30 19.39 15.00 13.40 10.40 8.80 15.09 18.70 25.10 22.571966 25.80 39.50 38.89 24.10 22.00 15.20 12.70 10.10 9.10 15.00 18.31 22.69 21.121967 28.40 35.00 28.30 21.91 16.81 13.90 10.90 9.10 10.51 11.01 18.80 28.49 19.431968 26.49 36.90 32.51 21.39 16.31 12.79 11.10 9.79 8.90 13.20 16.09 35.90 20.111969 32.70 28.10 18.31 17.20 11.79 9.60 8.49 6.99 6.21 11.10 23.91 15.59 15.831970 26.80 36.50 23.69 16.90 11.70 9.71 8.49 6.99 7.90 9.40 9.79 9.40 14.771971 8.40 9.60 11.01 6.99 5.10 5.19 3.91 3.60 3.10 4.69 8.49 22.91 7.751972 13.51 20.61 15.09 9.79 7.40 5.91 6.80 5.10 5.41 15.90 20.89 20.30 12.231973 25.71 29.79 38.70 26.10 16.09 12.90 10.60 8.60 8.10 12.51 20.80 23.41 19.441974 24.10 16.90 31.79 26.49 16.00 13.29 10.51 9.21 6.99 10.70 10.40 22.69 16.591975 27.21 19.50 16.81 20.89 12.20 9.49 10.10 7.21 5.60 9.10 18.39 26.71 15.271976 19.39 33.01 25.30 22.11 13.60 11.60 9.60 8.99 11.29 16.50 19.39 38.39 19.101977 40.20 29.10 22.30 23.60 17.09 14.31 10.90 8.99 9.60 11.01 25.41 31.79 20.361978 49.90 25.19 23.60 20.50 16.31 15.90 12.10 10.51 9.71 16.59 33.60 38.00 22.661979 40.00 44.00 30.01 25.00 23.69 20.80 18.50 14.81 20.20 13.60 21.69 24.80 24.761980 46.80 42.30 27.30 32.10 25.60 21.61 18.89 15.90 16.31 17.00 24.30 33.01 26.761981 42.50 25.71 28.10 19.00 17.00 15.90 13.51 12.10 9.90 19.39 23.50 31.51 21.511982 51.51 42.19 45.10 40.39 31.70 28.21 23.91 21.20 18.20 21.11 22.00 38.89 32.031983 74.81 69.79 76.20 48.80 33.81 30.70 26.99 22.80 24.41 29.60 32.60 53.10 43.631984 40.50 36.09 28.99 29.10 23.60 19.20 17.70 18.61 18.50 16.00 24.50 30.70 25.291985 52.20 48.90 54.70 39.89 26.49 22.69 21.00 18.61 17.81 17.09 20.11 23.30 30.231986 36.59 35.70 36.09 22.00 21.61 12.51 12.79 13.10 8.30 10.01 9.60 34.59 21.071987 41.91 51.20 47.99 27.40 22.50 15.59 11.70 9.21 8.49 7.90 23.91 34.31 25.181988 31.10 66.71 36.50 41.00 23.50 17.20 12.29 9.71 7.49 15.50 20.89 29.30 25.931989 34.20 56.90 40.39 21.00 15.81 13.01 10.79 12.60 11.29 7.60 12.79 27.10 21.961990 30.60 16.31 19.11 22.19 15.09 9.40 8.40 7.71 10.10 8.99 7.60 13.20 14.061991 27.90 51.20 57.50 63.50 20.00 18.50 14.81 10.10 8.71 10.90 12.79 26.71 26.891992 52.40 72.01 45.99 34.90 23.80 17.20 16.31 13.01 16.50 21.50 59.20 37.31 34.181993 27.60 54.31 39.89 45.30 22.60 25.30 16.81 14.20 15.81 18.39 20.50 28.10 27.401994 60.20 26.90 45.99 28.49 21.91 15.81 13.90 12.79 10.90 12.01 15.59 32.60 24.761995 23.91 50.40 42.69 26.10 11.60 15.59 19.61 11.51 9.10 14.09 13.10 20.30 21.501996 29.51 26.90 36.70 23.60 16.50 15.40 12.60 10.90 14.09 9.49 21.50 20.20 19.781997 80.23 30.21 45.73 24.39 16.98 22.37 13.45 10.28 9.06 12.22 16.88 40.30 26.841998 33.74 44.51 29.92 19.50 21.84 13.01 9.03 10.38 5.91 12.04 18.06 27.60 20.461999 63.66 30.83 39.75 19.82 12.58 11.15 8.81 6.71 9.12 5.82 7.15 14.50 19.162000 53.36 74.45 65.33 29.56 17.52 13.63 11.97 9.72 15.66 7.74 19.71 23.68 28.532001 14.75 12.90 18.95 12.76 8.78 6.82 5.21 4.75 4.67 8.53 9.22 15.22 10.212002 73.40 60.75 36.72 18.91 14.67 11.74 10.69 9.71 9.97 8.28 19.75 43.44 26.502003 86.69 61.99 50.38 31.36 25.35 18.56 15.60 14.93 15.69 15.23 41.03 40.47 34.772004 28.42 39.15 27.73 31.95 21.11 20.13 16.15 12.10 8.04 13.57 21.99 37.97 23.192005 42.92 38.60 26.89 21.62 19.34 17.94 14.87 13.48 12.98 8.13 21.23 36.16 22.85
Mínima 8.40 9.60 11.01 6.99 5.10 4.80 3.69 3.60 3.00 2.50 4.00 5.30 2.50Média 36.84 39.86 35.43 24.91 17.77 14.57 12.16 10.10 9.68 12.33 18.40 26.99 21.59
Máxima 86.69 74.45 76.20 63.50 33.81 30.70 26.99 22.80 24.41 29.60 59.20 53.10 86.69

Revisão do Estudo de Impacto Ambiental – EIA - Piedade SHS – Março/2007, Pág.24
Table 1.5PIEDADE River at PIEDADE SHS (AD = 967 KM2) MONTHLY AVERAGE FLOW SERIES - PERIOD 1.942-2.005
Ano Jan Fev Mar Abr Mai Jun Jul Ago Set Out Nov Dez Média1942 9.75 13.79 20.57 13.84 8.86 5.89 4.2 3.03 3.31 2.97 4.88 12.56 8.641943 32.01 29.37 26.01 12.95 8.18 6.67 4.65 3.48 2.86 8.63 12.78 10.99 13.211944 9.92 14.52 18.72 12.44 6.33 4.65 3.48 2.58 2.07 4.88 8.97 8.91 8.121945 8.41 27.24 20.96 17.54 9.47 6.89 4.99 3.48 2.63 8.58 16.31 22.59 12.421946 25.22 20.57 29.54 16.37 10.93 8.69 9.3 5.94 4.82 8.63 8.58 12.84 13.451947 23.37 24.21 34.47 16.14 12.33 9.47 8.18 6.78 8.91 9.7 7.68 27.18 15.71948 20.4 30.77 24.49 15.36 10.99 8.8 7.51 6.17 5.04 5.89 16.48 12.67 13.711949 18.16 30.77 20.01 11.21 12.78 7.85 6.11 4.43 3.36 13.34 7.96 12.67 12.391950 14.07 26.62 24.89 12.89 9.19 7.29 5.44 3.81 3.19 5.21 18.22 17.82 12.391951 29.48 31.5 28.42 14.63 10.99 8.91 6.73 5.21 4.09 5.66 6.39 8.63 13.391952 16.76 19.9 24.05 11.38 6.73 6.05 4.82 3.87 3.31 6.61 7.74 6.73 9.831953 5.61 6.67 11.6 9.19 5.55 4.26 3.81 2.97 3.59 6.89 5.21 9.92 6.271954 5.27 12.16 6.33 6.05 6.17 3.81 2.86 2.07 1.68 1.4 3.19 4.26 4.611955 13 7.62 6.61 6.05 3.25 2.69 2.07 3.81 2.24 2.8 2.24 11.6 5.331956 10.82 8.86 13.4 6.45 6.67 9.25 4.93 4.37 3.53 3.19 5.55 8.24 7.11957 14.52 15.13 12.78 17.54 10.37 7.34 6.28 4.26 4.93 2.58 5.49 9.47 9.231958 24.1 32.06 25.05 19.95 17.04 12.22 11.32 7.23 7.9 8.3 7.79 16.37 15.781959 28.03 20.79 21.92 9.86 7.45 6.45 6.5 6.28 5.49 4.04 6.5 11.66 11.251960 16.59 26.46 14.52 9.14 7.51 7.17 4.93 3.42 2.58 6.73 15.19 23.21 11.451961 37.83 38.56 33.13 17.21 16.59 11.32 9.36 8.02 6.78 6.28 9.47 8.91 16.961962 21.52 29.93 20.23 12.67 10.82 9.47 7.29 6.22 5.89 9.53 6.73 27.24 13.961963 22.98 22.42 12.78 10.26 8.13 7.06 6.5 5.72 4.71 3.81 5.1 2.97 9.371964 12.33 36.43 8.69 7.9 6.78 4.76 4.48 3.42 2.86 7.68 9.64 19.34 10.361965 21.24 23.04 23.32 13.62 10.87 8.41 7.51 5.83 4.93 8.46 10.48 14.07 12.651966 14.46 22.14 21.8 13.51 12.33 8.52 7.12 5.66 5.1 8.41 10.26 12.72 11.841967 15.92 19.62 15.86 12.28 9.42 7.79 6.11 5.1 5.89 6.17 10.54 15.97 10.891968 14.85 20.68 18.22 11.99 9.14 7.17 6.22 5.49 4.99 7.4 9.02 20.12 11.281969 18.33 15.75 10.26 9.64 6.61 5.38 4.76 3.92 3.48 6.22 13.4 8.74 8.871970 15.02 20.46 13.28 9.47 6.56 5.44 4.76 3.92 4.43 5.27 5.49 5.27 8.281971 4.71 5.38 6.17 3.92 2.86 2.91 2.19 2.02 1.74 2.63 4.76 12.84 4.341972 7.57 11.55 8.46 5.49 4.15 3.31 3.81 2.86 3.03 8.91 11.71 11.38 6.851973 14.41 16.7 21.69 14.63 9.02 7.23 5.94 4.82 4.54 7.01 11.66 13.12 10.91974 13.51 9.47 17.82 14.85 8.97 7.45 5.89 5.16 3.92 6 5.83 12.72 9.31975 15.25 10.93 9.42 11.71 6.84 5.32 5.66 4.04 3.14 5.1 10.31 14.97 8.561976 10.87 18.5 14.18 12.39 7.62 6.5 5.38 5.04 6.33 9.25 10.87 21.52 10.711977 22.53 16.31 12.5 13.23 9.58 8.02 6.11 5.04 5.38 6.17 14.24 17.82 11.411978 27.97 14.12 13.23 11.49 9.14 8.91 6.78 5.89 5.44 9.3 18.83 21.3 12.71979 22.42 24.66 16.82 14.01 13.28 11.66 10.37 8.3 11.32 7.62 12.16 13.9 13.881980 26.23 23.71 15.3 17.99 14.35 12.11 10.59 8.91 9.14 9.53 13.62 18.5 151981 23.82 14.41 15.75 10.65 9.53 8.91 7.57 6.78 5.55 10.87 13.17 17.66 12.061982 28.87 23.65 25.28 22.64 17.77 15.81 13.4 11.88 10.2 11.83 12.33 21.8 17.951983 41.93 39.12 42.71 27.35 18.95 17.21 15.13 12.78 13.68 16.59 18.27 29.76 24.461984 22.7 20.23 16.25 16.31 13.23 10.76 9.92 10.43 10.37 8.97 13.73 17.21 14.181985 29.26 27.41 30.66 22.36 14.85 12.72 11.77 10.43 9.98 9.58 11.27 13.06 16.951986 20.51 20.01 20.23 12.33 12.11 7.01 7.17 7.34 4.65 5.61 5.38 19.39 11.811987 23.49 28.7 26.9 15.36 12.61 8.74 6.56 5.16 4.76 4.43 13.4 19.23 14.111988 17.43 37.39 20.46 22.98 13.17 9.64 6.89 5.44 4.2 8.69 11.71 16.42 14.541989 19.17 31.89 22.64 11.77 8.86 7.29 6.05 7.06 6.33 4.26 7.17 15.19 12.311990 17.15 9.14 10.71 12.44 8.46 5.27 4.71 4.32 5.66 5.04 4.26 7.4 7.881991 15.64 28.7 32.23 35.59 11.21 10.37 8.3 5.66 4.88 6.11 7.17 14.97 15.071992 29.37 40.36 25.78 19.56 13.34 9.64 9.14 7.29 9.25 12.05 33.18 20.91 19.161993 15.47 30.44 22.36 25.39 12.67 14.18 9.42 7.96 8.86 10.31 11.49 15.75 15.361994 33.74 15.08 25.78 15.97 12.28 8.86 7.79 7.17 6.11 6.73 8.74 18.27 13.881995 13.4 28.25 23.93 14.63 6.5 8.74 10.99 6.45 5.1 7.9 7.34 11.38 12.051996 16.54 15.08 20.57 13.23 9.25 8.63 7.06 6.11 7.9 5.32 12.05 11.32 11.091997 44.97 16.93 25.63 13.67 9.52 12.54 7.54 5.76 5.08 6.85 9.46 22.59 15.051998 18.91 24.95 16.77 10.93 12.24 7.29 5.06 5.82 3.31 6.75 10.12 15.47 11.471999 35.68 17.28 22.28 11.11 7.05 6.25 4.94 3.76 5.11 3.26 4.01 8.13 10.742000 29.91 41.73 36.62 16.57 9.82 7.64 6.71 5.45 8.78 4.34 11.05 13.27 15.992001 8.27 7.23 10.62 7.15 4.92 3.82 2.92 2.66 2.62 4.78 5.17 8.53 5.722002 41.14 34.05 20.58 10.6 8.22 6.58 5.99 5.44 5.59 4.64 11.07 24.35 14.852003 48.59 34.74 28.24 17.58 14.21 10.40 8.75 8.37 8.80 8.54 23.00 22.69 19.492004 15.93 21.94 15.54 17.91 11.83 11.28 9.05 6.78 4.51 7.61 12.32 21.28 13.002005 24.06 21.64 15.07 12.12 10.84 10.06 8.34 7.55 7.28 4.56 11.90 20.27 12.81
Mínima 4.71 5.38 6.17 3.92 2.86 2.69 2.07 2.02 1.68 1.40 2.24 2.97 1.40Média 20.65 22.34 19.86 13.96 9.96 8.17 6.81 5.66 5.42 6.91 10.31 15.13 12.10
Máxima 48.59 41.73 42.71 35.59 18.95 17.21 15.13 12.78 13.68 16.59 33.18 29.76 48.59

Revisão do Estudo de Impacto Ambiental – EIA - Piedade SHS – Março/2007, Pág.25
Figure 1.1: Piedade River Permanence Curve at the PIEDADE SHS
1.3 Project Floods
The flood study presented in the original Basic Project did not undergo any significant alterations based onthe updated hydrological data, therefore this consolidation uses Table 1.6, summarizing the project anddiversion floods as well as other Piedade SHS location characteristics.
Table 1.6Spillway Project and Diversion Floods
1.4 Reservoir Silting and Working Life
In light of the general characteristics of the project, with a lateral water channel and small flooded area (andvolume), the reservoir silting surveys were simplified, however they were complied based on therecommendations in “Practical Hydrosedimentology” (Carvalho, N.O., 1994).
In order to estimate the specific minimum production of material in suspension, given the absence of directmeasurements, as a benchmark we adopted the information from “Diagnosis of Sedimentary Conditions inthe Main Brazilian Rivers” (CPRM/Eletrobrás, 1.992). It was therefore found, based on characteristics of thehydrosedimentology zoning, that the Piedade river basin presents and average level of erosion, based on theWishmeier erosion coefficient of the soil
47,5
45,0
42,5
40,0
27,5
25,0
22,5
20,0
37,5
35,0
32,5
30,0
1 7,5
1 5,0
12,5
1 0,0
2,5
7,5
5,0
0,00 5 1 0 1 5 2 0 2 5 3 0 3 5 4 0 4 5 5 0 5 5 6 0 6 5 7 0 7 5 8 0 8 5 9 0 9 5 1 0 0
Tempo (%)
Q 5%= 28,87 m 3/sQ10%= 23,37 m3/sQ15%= 20,46 m3/sQ20%= 1 7,28 m3/sQ25%= 1 5,36 m3/sQ30%= 1 3,68 m3/sQ35%= 1 2,67 m3/sQ40%= 1 1 ,66 m3/sQ45%= 1 0,59 m3/sQ 50%= 9,47 m 3 /sQ 55%= 8,86 m 3 /sQ 60%= 8,13 m 3 /sQ 65%= 7,29 m 3 /sQ 70%= 6,67 m 3 /sQ75%= 6,1 1 m 3/sQ 80%= 5,49 m 3 /sQ 85%= 4,99 m 3 /sQ 90%= 4,26 m 3 /sQ 95%= 3,26 m 3 /s

Revisão do Estudo de Impacto Ambiental – EIA - Piedade SHS – Março/2007, Pág.26
with specific solids discharge at around 50 to 100 t/km2/year. Based on on-site observations in the areaupstream from the relevant section, we found that despite anthropic activity, vegetation coverage and the useof appropriate soil handling and occupation techniques have minimized the erosion process. We thereforedecided that a level of 50 t/km2/year would be appropriate to represent the annual average solid load flowingtowards the dam sections.
In order to evaluate silting volume, we need to transform the solids discharge calculated in t/year intom3/year, which only requires finding out the specific weight of the solid material will be deposited in thereservoir. Because of a lack of more detailed information regarding this material, the method proposed byLane and Koelzer was used, which is based on portions of sand, silt and clay comprising sediment as well asthe compactness and/or density level of these materials, which are evaluated based on the length of time theyspend in the reservoirs and submerged (at various levels). In order to simplify this process and adopting theguidance in “Practical Hydrosedimentology”, we decided to adopt the apparent specific weightcorresponding to 100 years.
The formula proposed by Lane and Koelzer to calculate the specific weight of each of the sedimentcomponents is as follows:
P = Po + B x log T, where:
P = specific weight after T years, inkgf/m3 Po = initial specific weight inkgf/m3;T = permanence, in years, andB = coefficient (from the table).
As data on the composition of the transported material is not available, we adopted the assumption of 30%silt, 30% clay and 40% sand, values which can be inferred based on field investigations and geological --geotechnical studies carried out.
For these three types of materials, according to the table prepared by Lane and Koelzer for a situation whereplant operation normally maintains sediment submerged, the values for Po and B were obtained and areshown in table 1.7:
Table 1.7Values for PO E
B
Based on these values, the following equation is used to calculate the specific weight:
P = 0.40 x (1,490) + 0.30 x (1,041 + 91.3 x logT) + 0.30 x (481 + 256.3 x logT) P = 1,052.6 + 104.28 x logT
Using the annual average load of total solids transported by the Piedade River, we obtained the

Revisão do Estudo de Impacto Ambiental – EIA - Piedade SHS – Março/2007, Pág.27
corresponding volumes for a permanence period of 100 years, reaching a value of 1261 kgf/m3. Table 1.8was drawn up based on this value and considering the specific load of 50 t/km2/year.
Table 1.8Calculation of Annual Sediment
Load
We now have to add the retention percentage, defined as the ratio between sediment deposited and totalsediment flow, in order to estimate the percentage of sediment retained in the reservoir. This evaluation iscarried out by applying the empirical method specified by Gunnar Brune, which presents a curved graphobtained from surveys of areas reservoirs, where retention efficiency is a function of the reservoirs capacityat maximum normal N.A. (Vta) and annual average flow volume (Vaf). Based on the data from the fiveprojects, we calculated the Vta/Vaf ratios and using the Brune retention curve method, we obtained theretention percentages shown in Table 1.9.
Table 1.9RetentionEfficiency
Finally, in order to evaluate the working life of the reservoirs, simply divides the available volume up to thebase of the water channel by the volume of flow sediment, affected by the retention index, stating thenumber of years as shown below. The annual volume of sediment was multiplied by 1.5 to incorporate apossible increase in sediment production over time, which means that this is a very conservativemeasurements.
n = (Vol. Disp)/(1,5 x Vol. Sed. x Er), where:
Vol. Disp is the available volume (106 m3) to the base of the water channel, obtained in the height-volume curve;
Vol. Sed.is the annual affluent volume of sediment (106 m3/year);
Er is the retention efficiency (%)
Table 1.10 presents the results obtained, an analysis of which shows that the reservoirs has a working life ofaround 100 years, even based on the most conservative assumptions we have adopted.
Table 1.10Silting Time

Revisão do Estudo de Impacto Ambiental – EIA - Piedade SHS – Março/2007, Pág.28
1.5 Reservoir Filling
According to the works timetable, January was selected to close off the river and start filling the reservoir.Based on the historical average flow for the month of January, according to table 1.5, which is 20.7 m3/s, theenvironment flow rate of 0.65 m3/s and the height -- volume curve for the reservoir, the resulting reservoirfilling time is 10.1 days. However, when based on average long-term flow rates the reservoir will take a17.7days to fill.

Revisão do Estudo de Impacto Ambiental – EIA - Piedade SHS – Março/2007, Pág.29
2 GENERAL METHODOLOGYThis survey was based on information contained in the Environmental Impact Study (EIA) at Piedade SHS(CEMA, 2001), Additional EIA Information (LIMIAR, 2003), LP Conditions (LIMIAR, 2004),Environmental Control Plan for the Piedade SHS (LIMIAR, 2004) and Characteristics of the new project forPiedade SHS (RA Engenharia, 2007).
In order to verify whether the information available in the aforementioned documents is applicable to thenew engineering project, an on-site survey was conducted by a multidisciplinary technical team in March2007.
During the visit to Piedade SHS, priority was given to inspecting new areas directly affected by the project,especially the dam and reservoir at Piedade SHS. Available project data was compiled in additioninformation on the area in which Piedade SHS is located, updating information as required.
The project layout changes did not undermine the environmental impact evaluation producedby CEMA (2001) and other studies concluded during the project environmental licensingstages. Therefore, only new environmental impacts arising from amendments to the project are evaluated inthis document, in order to fully align the study to the new Piedade SHS characteristics.
2.1 DEFINING STUDY AREASThe areas studied for the Piedade SHS Incremental Impact Study were divided into: DirectlyAffected Area – ADA;Surrounding Area – AE;Sphere of Influence – AI.
The following definitions of each of these areas which, based on the specific issues investigated, differencein the Natural Environment, comprising the Physical and Biotic Environments, and the SocioeconomicEnvironment.
2.2 Natural Environment 1Sphere of Influence
In the natural environment, the Sphere of Influence (AI) was defined as the watercourse micro-basins whichdirectly contribute to the Piedade river in the project region. These include, for example, the Boa Vista,Cachoeirinha and Valinhos streams.
In terms of water quality, the AI was considered to be the drainage basin upstream from the future dam,because of its direct influence on the quality of reservoir water, in addition to the entire section with reducedflow rate and a section of the river in the reconstituted flow rate section.
As a Hydroelectric Power Station can interfere with fish movements (causing effects upstream anddownstream from the plant) the AI took into account the entire Piedade river basin when considering fish.

Revisão do Estudo de Impacto Ambiental – EIA - Piedade SHS – Março/2007, Pág.30
2.2.2 Surrounding Area
In the Physical and Biotic Environments, the Surrounding Area (AE) extended to the first peaks of bankslopes along the future reservoirs and the dam and auxiliary structures, representing a surface level whichhas a close relationship with the project. Therefore, the AE boundary varies in distance from the Piedaderiver within the project area according to the natural characteristics of local topography.
2.2.3 Directly Affected Area
The Directly Affected Area (ADA) covers all the locations which will be directly affected by the project,including the following main areas:
The dam construction area;
The area to be occupied by the reservoir in the future: including the section of land to beflooded and the natural river bed;
The area which will be occupied by construction sites; The area which will be occupied by the power station;
The area to be occupied by the substation;
Leased land area;
Stone storage area (quarry);
Access routes that will be flooded by the reservoir and relocated;
The area which will be occupied by the water channel system;
Permanent Preservation Area – APP: Based on the characteristics of the projects and the area in which it islocated the APP corresponds to a strip of land 30 m wide around the future reservoirs. Please note that thewidth of the APP may change when preparing the Reservoir Master Plan, complying with CONAMAResolution No. 302, dated March 20, 2002 and IEF Directive No. 054, dated April 14, 2004.
Specifically in terms of aquatic ecosystems, the ADA refers to the Piedade river section located between thebeginning of the future reservoirs backwater area and part of the reconstituted flow section. This definitiontakes into account the section of the river where its dynamic will be effectively modified, based ontransformation of the upstream section from the dam into a lake or semi-lake system.
2.3 Social and Economic Environment
2.3.1 Area of Influence
The AI socioeconomic environment was defined as the municipal region of Monte Alegre de Minas, a citywithin whose territory this project will be deployed.

Revisão do Estudo de Impacto Ambiental – EIA - Piedade SHS – Março/2007, Pág.31
The AI boundaries refer to the municipal region as a political and administrative unit, a definition which islinked to the effects of the project will have on social and economic factors, including jobs, income and taxrevenues.
Attached to this document is drawing MIN-LMA-001 which represents the boundaries of the Monte Alegrede Minas municipal region.
2 3.2 Surrounding Area
The AE includes the urban area of the municipal region of Monte Alegre de Minas. The social and economicties of the ADA population, according to new field studies carried out, are basically linked to the urban areaof the municipal region, which offers basic goods and services to fulfill the needs of this population.
2.3.3 Directly Affected Area
The project Directly Affected Area (ADA) is defined by the group of rural properties, all within themunicipal region of Monte Alegre de Minas, along the banks of the Piedade river, which will be directlyaffected by the installation of various project structures, including the dam, water channel, power station andreservoirs, as well as support works, such as construction sites, waste sites, leased land, access ways andservice routes, among others, as well as the commercial establishments located on the banks of the Piedaderiver in the reduced flow section.
Drawing PIE-PRO-002, attached to this document, contains the property registered in the Piedade SHSADA.

Revisão do Estudo de Impacto Ambiental – EIA - Piedade SHS – Março/2007, Pág.32
3 Physical Environment3.1 Climate
3.1.1 Methodology
The methodology used to study the climate involved the following steps: Collating the prevailing thermal, rainfall and relative humidity conditions in the geographic
region, including the project Area of Influence; Use of secondary data as the climate study requires a substantial dataset and wide ranging
sampling networks, which lie outside the environmental objectives of this study.
Therefore, the analysis of weather characteristics in the Piedade river basin was carried out based on existingdata from the Uberaba weather station, code number 83577, monitored by INMET.
3.1.2 AI and ADA Diagnosis
"The climate of the southeast region is the most diverse in terms of temperature, as well as spatialdistribution of rainfall. In order to understand the climate processes in this region, we initially need tounderstand a variety of factors, some statistical and others dynamic. They all act simultaneously and areconstantly interacting, but will be described below individually (IBGE, 1996)”.
Statistical Factors
Position
In this factor, two important aspects must be highlighted which are the latitude and the position on thewestern shore of the Atlantic Ocean. Therefore, the southeast region is located between the 14th and 25thsouthern parallels, therefore almost all of its land mass is located within the tropical zone.
Mountainous Topography
The relief in the southeastern region offers the biggest morphological contrasts in Brazil. This topographiccharacteristic favors rainfall as it increases air turbulence because of orographic wind patterns especiallyunsettled currents of wind.
Dynamic Factors
These factors represent:
Semi-fixed anticyclone in the South Atlantic;
Unsettled wind currents from the S; Unsettled wind currents from the W; Unsettled wind currents from the E;

Revisão do Estudo de Impacto Ambiental – EIA - Piedade SHS – Março/2007, Pág.33
Figure 3.1 shows the action of unsubtle wind currents in the state of Minas Gerais.
Figure 3.1: Action of unsettled wind currents in the state of Minas Gerais
The mass of tropical Atlantic air of is created by the East and North-East winds, arising from highsubtropical pressure, in other words the semi-fixed anticyclone in the South Atlantic, or variable winds fromoccasional high-pressure spots in the interior. It has more or less high temperatures, based on intense solarradiation in the tropical latitudes and strong specific humidity, the result of intense maritime evaporation(Nimer, 1977).
However, because of the subsequent thermal inversion, humidity is limited to the surface which makes ithomogeneous and stable. However, despite the thermal inversion, the effects of this anticyclone maintainstable and sunny weather, only affected by the arrival of turbulent wind currents.
The turbulent wind currents from the south or the Atlantic polar mass come from the icy surface of the polarregion, comprising the Antarctic content and the fixed ice sheet This zone creates polar winds whichperiodically reach the state of Minas Gerais, coming from the South, accompanied by frontal instabilitiescausing swift falls in temperature (Nimer, 1977).
The turbulent currents from the West occur in the middle of spring and autumn, generating wind from theWest which comes in a long tropical instability lines which are also known as barometric depressions. Theyseemed to originate from the wave movement along the polar front when it comes into contact with the hotair in the tropical zone. These fronts cause the so-called summer rains which generally fall at the end of theafternoon or in the early morning (Nimer, 1977).
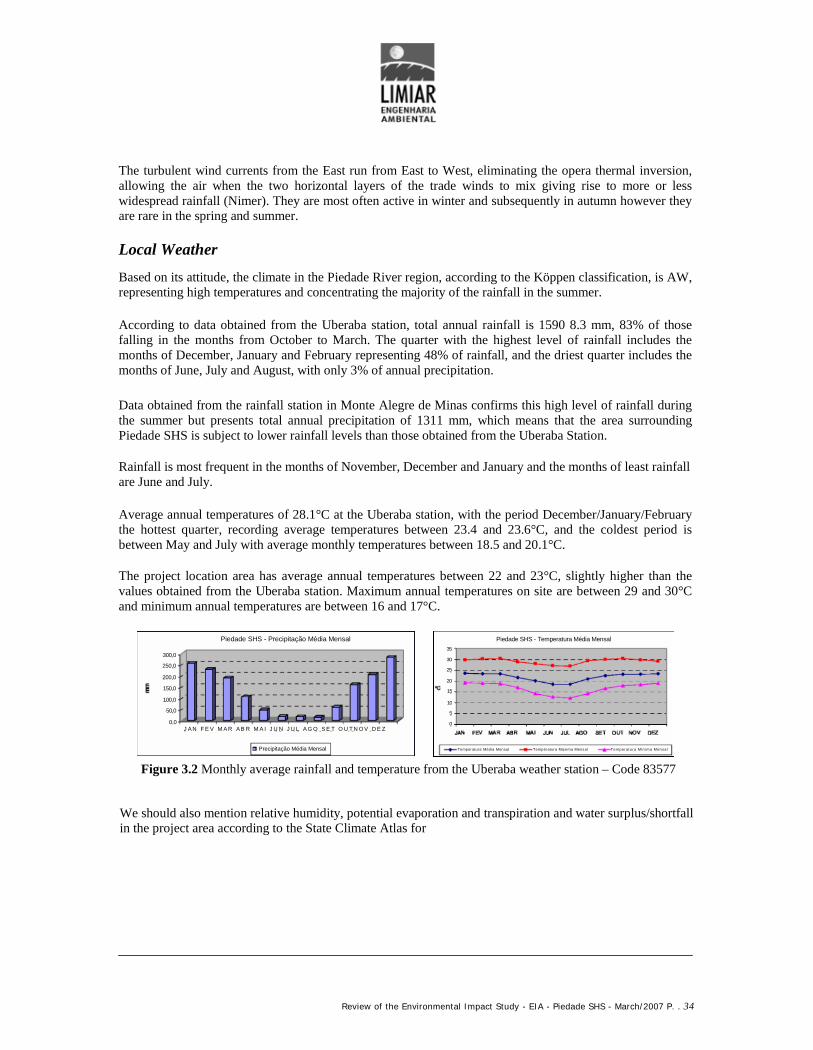
Review of the Environmental Impact Study - EIA - Piedade SHS - March/2007 P. . 34
The turbulent wind currents from the East run from East to West, eliminating the opera thermal inversion,allowing the air when the two horizontal layers of the trade winds to mix giving rise to more or lesswidespread rainfall (Nimer). They are most often active in winter and subsequently in autumn however theyare rare in the spring and summer.
Local Weather
Based on its attitude, the climate in the Piedade River region, according to the Köppen classification, is AW,representing high temperatures and concentrating the majority of the rainfall in the summer.
According to data obtained from the Uberaba station, total annual rainfall is 1590 8.3 mm, 83% of thosefalling in the months from October to March. The quarter with the highest level of rainfall includes themonths of December, January and February representing 48% of rainfall, and the driest quarter includes themonths of June, July and August, with only 3% of annual precipitation.
Data obtained from the rainfall station in Monte Alegre de Minas confirms this high level of rainfall duringthe summer but presents total annual precipitation of 1311 mm, which means that the area surroundingPiedade SHS is subject to lower rainfall levels than those obtained from the Uberaba Station.
Rainfall is most frequent in the months of November, December and January and the months of least rainfallare June and July.
Average annual temperatures of 28.1°C at the Uberaba station, with the period December/January/Februarythe hottest quarter, recording average temperatures between 23.4 and 23.6°C, and the coldest period isbetween May and July with average monthly temperatures between 18.5 and 20.1°C.
The project location area has average annual temperatures between 22 and 23°C, slightly higher than thevalues obtained from the Uberaba station. Maximum annual temperatures on site are between 29 and 30°Cand minimum annual temperatures are between 16 and 17°C.
Figure 3.2 Monthly average rainfall and temperature from the Uberaba weather station – Code 83577
We should also mention relative humidity, potential evaporation and transpiration and water surplus/shortfallin the project area according to the State Climate Atlas for
250,0
200,0
300,0
150,0
100,0
50,0
0,0J A N F E V M A R A B R M A I J U N J U L A G O S E T O U T N O V D E Z
Piedade SHS - Precipitação Média Mensal
Precipitação Média Mensal
35
30
25
20
15
10
5
0
Temperatura Méd ia Mensal Températura Máxima Mensal Temperatu ra Mín ima Mensal
Piedade SHS - Temperatura Média Mensal

Review of the Environmental Impact Study - EIA - Piedade SHS - March/2007 P. . 35
Minas Gerais State. Relative humidity in the project area presents average annual values between 70 and75%, with averages in excess of 80% between December and March and lower than 65% in the months ofAugust and September.
In terms of potential evaporation, annual averages in the project area between 1000 and 1100 mm, with thegreatest losses in the months of November, December and January, when average values exceed 100 mm. Inthe months of June and July, evaporation is on average between 50 and 60 mm. Water surpluses areprevalent between October and April, with water shortfalls in the other five months (May to September).
In general, the regional climate can be considered stable and uniform because of the predominantly tropicalclimate. Furthermore, it does not present general, intense and persistent cyclonic phenomena or their effects(tropical cyclones, extra tropical cyclones and occlusions). The region is only subject to the effects of a fewclimate phenomena, which are strictly localized and short lived, such as convection-orgraphic thunderstormswhich are common and frequent in the rainy season. The generalized and migratory phenomena from otherlatitudes affecting the region are the cold fronts which come from the south and the lines of instability fromthe West.
3.2 Hydrography
3.2.1 Methodology
The methodology used to study the hydrographic involved the following steps: Bibliographic research, in order to obtain information on the River basin, using secondary data; Interpreting the results obtained.
3.2.2 AI and AE Diagnosis
The Paranaiba river basin extends through three states: Minas Gerais, Goiás and Mato Grosso do Sul. Thedraining area in the Minas section of the basin is approximately 32.1% of the total area. Alongside theGrande river, they form the torrential Paraná river. The Parnaiba river runs longitudinally for around 1,120km, approximately 680 km being used as the frontier between the states of Minas Gerais, Goiás and MatoGrosso do Sul”.
The Piedade river drainage basin is wholly within the territory of Minas Gerais. It comprises the PousoAlegre stream which, after collecting the waters from the Andorinha stream, becomes the Piedade river.From this point, there are various tributaries over 120 km including the Bebedouro river and the Valinhosstream, both on the left, and the Pântano brook and Passa Três stream on the left. The drainage basin area is1861 km2.
The stretch with the biggest slopes stretches around 30 km from the Bebedouro stream, located in the middlestretch of the basin, and the height difference is around 210 m. The valley is surrounded with slopingembankments, which continually change the direction of the

Review of the Environmental Impact Study - EIA - Piedade SHS - March/2007 P. . 36
river.
The Piedade river already has one hydroelectric project: The SHS Santa Luzia, recently rehabilitated byCEMIG, with an output of 0.45 MW located on a lower section of the river.
The structural control of the drainage area can be seen in the straight segments of the rivers, the quick curvesand the general occurrence of white water and waterfalls.
3.3 Geology
3.3.1 Methodology
The methodology used for the geology study attempted to describe the relief and morphology of the PiedadeSHS sphere of influence. We attempted to show the risk of instability in the natural environment along thebanks of the future dam, as well as areas that could suffer changes because of plant construction andoperation.
Below is a presentation of the methodology used in order to reach the proposed objectives, in successive andcomplementary stages:a) Survey, analysis and compilation of bibliography, maps and aerial photographs;
b) On-site work:
Geological characteristics;
Morphological evaluation of the area;
Photographic record.c) Process and interpret the data obtained;
Preparing an environmental diagnosis;
d) Write and illustrate the final report.
3.3.2 AI Diagnosis
Stratigraphy and Lithology
Regional geology is represented by a Pre-Cambrian bedrock, São Bento Group, Bauru Group and Lateritic-Detritus Cover, summarized below.
The Pre-Cambrian Bedrock, present mainly in the northeast and east of the region, is represented by theAraxá Group (Arx), which belongs to the Brasilia Range. This group presents a metamorphized volcanosedimentary stack, with green shale facies and amphibole facies. It is comprised of granite and graphitemica schists with interspersed layers of quartzite, ortho-amphiboles, acid metavulcanites, gneisses andferrous formations. Dating indicates a Superior Proterozoic age. In the Araxá Group there are small post-tectonic intrusive granite bodies, syntectonic granitoids and complex polydiapiric granitoids (ã1) related tothe presence of casseterite.

Review of the Environmental Impact Study - EIA - Piedade SHS - March/2007 P. . 37
In the Minas Triangle region, the São Bento Group is only represented by the General Range Formation(JKsg) as a foundation in all locations for use to build the hydroelectric power station components. The bedof the Piedade river in this section of the Piedade SHS runs directly on the rocky bed composed of basalts inthis rock formation.
The General Range Formation comprises mainly a group of outpourings mainly made of basalt, interspersedwith intertrappean rocks represented by fine sandstone. Most of the intracontinental basin volcanicphenomena are between 140 and 100 million years old.
The Bauru Group overrides the erosion in the General Range Formation and, in this study, is subdivided intotwo formations, Adamantine at the base and Marilia at the top, both from the Cretaceous age.
The Adamantine Formation (Ka) is located mainly to the south of the Piedade River. It contains fine to veryfine cream, grey-brown and grey-green sandstones, as well as cream-purple siltites and claystone. It has flat-parallel and crossed, small to medium stratification with conglomeratic and carbonatic levels. The trend toconcretion and presence of clay balls are common in this unit, which may also be silicified. Thedisintegration of these rocks creates large and deep sandy areas.
The Marilia Formation (Km), located mainly to the north of the Piedade river, can be subdivided into twomembers in this region: The Galga Range Member (base) and Ponte Alta Member (top). The formercontains sandstones and immature conglomeratic sandstones, with a pallid yellow to reddish hue, located inlenticular strata, with frequent crossed stratification with small or medium tabulation or ribbing. The PonteAlta Member contains immature sandstones and conglomerate and laminate lenses, all strongly cementedwith carbonate, grey in color and generally uniform (solid). The Marilia Formation is around 200 m thickand in exposed areas has steep and well-defined escarpments.
Layers of Tertiary Lateritic-Detritus and Quaternary Non-Differentiated Covers (TQdl) cover the BauruGroup on the tops of hills to the east and south-east of the project area, more common on flat surfaces above800 m. These layers are currently pedogenized in predominantly red latosols, with a clay texture andhorizontal limonite concretions. Under this we can see sandy, sand-clay and clay sediments, with rare layersof conglomerates.
TectonicsDeforming tectonic activity in the Bauru Basin was considered insignificant for a long time. Apart from alack of more refined structural analyses, another two factors can explain this approach: Low rock cohesion,supposedly absorbing or dissipating deformation effects, making it hard to register, and the type of tectonicevolution in the basin, mainly based on subsidence lenses, without major vertical movement.

Review of the Environmental Impact Study - EIA - Piedade SHS - March/2007 P. . 38
In addition to common fracturing, on occasion we can find faults in the neocretaceous sedimentary cover. Inthe regional substrate, formed by the older units of the Paraná Basin, we can see three important structuraldirections associated with faults: NW, NE and EW. In structural geological surveys, groups of differentdirections have been noted showing brittle structures related to different stratification units: NW, ENE andNE fractures in basalts in the General Range Formation, NW and NNW in the Superior Cretaceous rocksand normal faults with cracks running for tens of meters in the NW direction, in paleozoic units. In generalthe main directions are observed in all units. Apparently, the different directions are related to the differentstructural domains and not specific geological units.
3.3.3 Legal Status of Minerals
Following consultation with the National Department of Mineral Production – DNPM, in March 2007, therewas no evidence of any mining in the Piedade SHS Surrounding Area and Directly Affected Area.
3.4 Geomorphology
3.4.1 Methodology
The methodology used for the geomorphology study attempted to describe the relief and morphology of thePiedade SHS sphere of influence, surrounding and directly affected areas. We attempted to show the risk ofinstability in the natural environment along the banks of the future dam, as well as areas that could sufferchanges because of plant construction and operation.
Below is a presentation of the methodology used in order to reach the proposed objectives, in successive andcomplementary stages:a) Survey, analysis and compilation of bibliography, maps and aerial photographs;b) On-site work:
Geomorphological characteristics;
Photographic record.c) Process and interpret the data obtained;
Preparing an environmental diagnosis;
Mitigating or offsetting measures proposed.
Proposal to implement, evaluate and monitor measures.
d) Write and illustrate the final report.
3.4.2 AI Diagnosis
Piedade SHS is located in a region known for its relief as "Northern Plain of the Paraná Basin",characterized by its great length (North of the State of Sao Paulo, Minas Triangle and Southern Goiás). Theplains adjoin in the northeast with the “Lower Goiania Plain” and the Alto-Tocantins-Paranaiba Plain”. Inthe north, it reaches the “Guiamaráes Plain” (Cliffs) and part of the Araguiaua Depression (MT/MS) and thePeripheral Depression (SP).

Review of the Environmental Impact Study - EIA - Piedade SHS - March/2007 P. . 39
The Northern Plain of the Paraná Basin has two different topographic areas: On higher, between 650 and1000 m, and another lower, between 350 and 650 m in altitude.
The higher section is dispersed in an irregular manner in the middle of the lower section. Its largest and mostconnected area is in the north of the plains. The other areas are smaller and are intermittent, varying in size.One of the areas, of greatest interest to the project, is the Minas Triangle, drained by the Uberabinha,Piedade and Tijuco rivers. In this higher section, the relief is mainly dissected into wide, tabular shapes, withsubordinated smaller spaces.
Along the edge of the foregoing areas there are structural or erosive escarpments, although mainly an area ofBauru Group sandstones, the escarpments show the following layering from the base to the top: AraxáGroup pre-Cambrian rock (predominantly mica schists and quartzite), intertrappean basalts and sandstonesfor the General Range Formation and Cretaceous sandstones for the Bauru Group.
3.4.3 AE and ADA Diagnosis
The Directly Affected Area is defined by straight lines of the Piedade river bed, noting a certain adaptationof the river course either by the lithology and repeated basalt outcrops or by structural alignmentperpendicular to its flow.
The rocky substrate is mainly comprised of solid and altered basalt rocks, structured in horizontal, tabularoutcrops. The aggressive erosion makes the river narrower depending on how easy or difficult it is toexcavate the successive outcrops, performing waterfalls as it finds difficulty excavating the upper outcropcompared with the lower one. This dynamic erosion is the principal mechanism of regional morphology.
The local relief is generally separated into tabular tops, convex and sloping shapes with average slopes ofbetween 15 and 30%.
In the backwater of the future Piedade SHS reservoirs family is more open and the slopes adjacent to theriver banks are not so steep and alluvial terraces are covered by riparian forest. From the waterfall located onthe property of Mr. João Vicente de Vasconcelos, the Piedade river becomes narrower and the sides presentaverage slopes on both banks. The alluvial terraces are present at the foot of the slopes and are used as cattlepasture.
Along the first part of the reduced flow section the slopes are not steep and culminate in the alluvial terraces,facilitating cattle access to the river. This section extends to de waterfall located on the property of Mr.Roosevelt Guimarães, known as the Usina Velha waterfall. From this point up to the power station, we findthat the slopes become steeper, narrowing the river bed.

Review of the Environmental Impact Study - EIA - Piedade SHS - March/2007, Pág. 40
Photo 3.1 Piedade River in the backwater of the future reservoir. Observe theriparian forest on both sides and white water
Photo 3.2 Low, undulating incline on the right bank of the river, in thebackwater area of the future reservoir
.
.Photo 3.3 Aerial view of the future location of Piedade SHS. On both sides ofthe river, the incline become steeper and at the foot of the inclines we can see
the alluvial terraces.
Photo 3.4 Aerial view of the future reservoir for Piedade SHS. Note the averageincline of the gradient and below the alluvial terraces on both sides of the river.
Photo 3.5 In the foreground, the gradient on the right bank and in thebackground the gradient for the left bank of the Piedade River, close to thefuture power station. Below, the alluvial terrace on the right bank of the river
Photo 3.6 Incline of the right bank gradient of the Piedade river close to thefuture power station.

Revisão do Estudo de Impacto Ambiental – EIA - Piedade SHS – Março/2007, Pág.41
The structural control of the drainage area can be seen in the straight segments of the rivers and the generaloccurrence of white water and waterfalls.
Photo 3.7 Piedade River waterfall in the area of the future reservoir. Photo 3.8 White water on the Piedade river in the reduced flowsection.
The focus point of the erosion are compatible with the inclines along the slopes, represented by massmovement, laminar erosion and linear erosion, the latter represented by furrows and ravines. This naturalpropensity for erosion and subsequent silting of the Piedade river valley is accentuated by intensivedeforestation in the area, leading to a gradual substitution of the natural vegetation by farming and grazingareas.
Photo 3.9 Furrow erosion on the left bank of the river, in the areaof the future reservoir.
Photo 3.10 Furrow erosion on the left bank of the river, in the areaof the future reservoir.
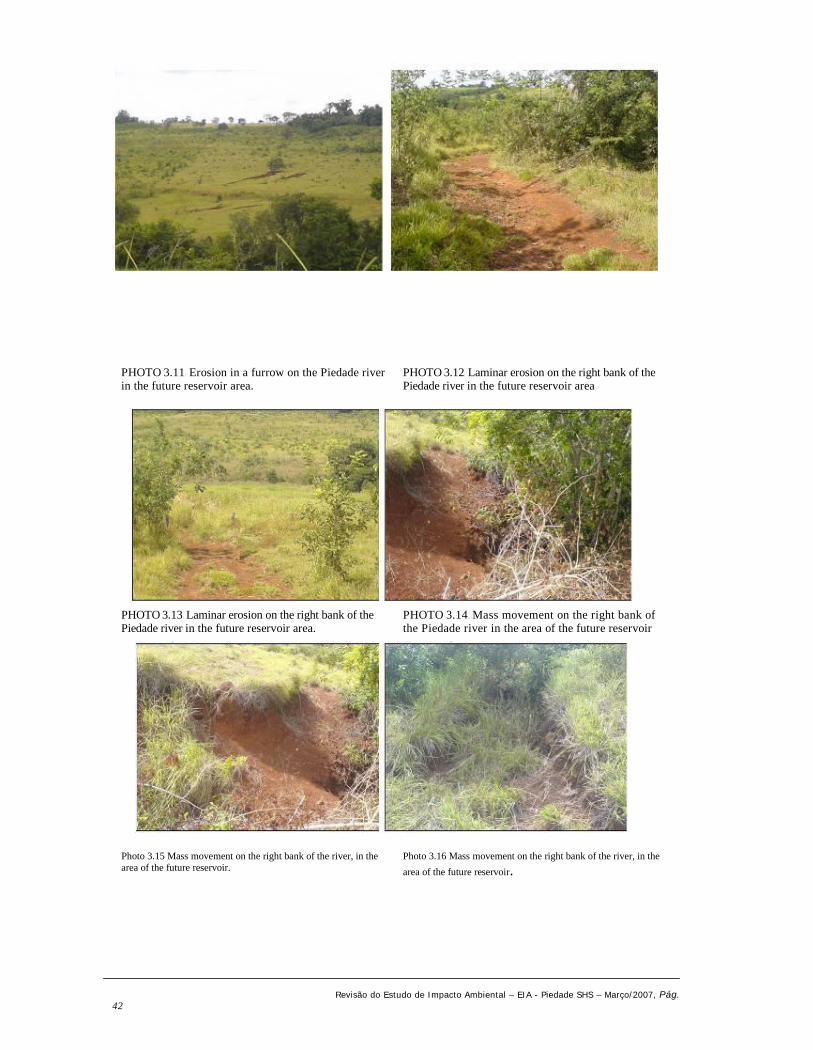
Revisão do Estudo de Impacto Ambiental – EIA - Piedade SHS – Março/2007, Pág.42
Photo 3.15 Mass movement on the right bank of the river, in thearea of the future reservoir.
Photo 3.16 Mass movement on the right bank of the river, in the
area of the future reservoir.
PHOTO 3.11: Erosion in a furrow on the Piedade riverin the future reservoir area.
PHOTO 3.13: Laminar erosion on the right bank of thePiedade river in the future reservoir area.
PHOTO 3.12: Laminar erosion on the right bank of thePiedade river in the future reservoir area
PHOTO 3.14: Mass movement on the right bank ofthe Piedade river in the area of the future reservoir

Revisão do Estudo de Impacto Ambiental – EIA - Piedade SHS – Março/2007, Pág.43
Photo 3.19 Laminar erosion on the right bank of thePiedade river, in the area of the future reservoir.
Photo 3.20 Laminar erosion on the right bank of the Piedaderiver, in the area of the future reservoir.
Photo 3.21 Laminar erosion on the left bank of thePiedade river, in the area of the future reservoir.
Photo 3.22 Laminar erosion on the right bank of thePiedade river, in the area of the future reservoir
PHOTO 3.17: Laminar erosion on the right bank of thePiedade river in the future reservoir area.
PHOTO 3.18: Laminar and ravine erosion on the rightbank of the Piedade river in the future reservoir area.

Revisão do Estudo de Impacto Ambiental – EIA - Piedade SHS – Março/2007, Pág.44
Photo 3.25 Laminar and furrow erosion on the left bank ofthe Piedade river, in the area of the future reservoir.
Photo 3.26 Mass movement and laminar erosion on the left
bank of the Piedade river, in the area of the future reservoir.
Photo 3.27 Mass movement and laminar erosion on the leftbank of the Piedade river, in the area of the future reservoir.
Photo 3.28 Mass movement and laminar erosion on the leftbank of the Piedade river, in the area of the future reservoir.
PHOTO 3.23 : Laminar and furrow erosion on the leftbank of the Piedade river in the future reservoir area.
PHOTO 3.24 : Laminar and furrow erosion on the leftbank of the Piedade river in the future reservoir area.

Revisão do Estudo de Impacto Ambiental – EIA - Piedade SHS – Março/2007,Pág. 45
Photo 3.31 Mass movement and laminar erosion on the leftbank of the Piedade river, in the area of the future reservoir.
Photo 3.32 Laminar erosion on the left bank of the Piedaderiver, in the area of the future reservoir.
Photo 3.33 Mass movement and laminar erosion on the leftbank of the Piedade river, in the area of the future reservoir.
Photo 3.34 Mass movement and laminar erosion on the leftbank of the Piedade river, in the area of the future reservoir.
PHOTO 3.29: Mass movement and laminar erosion on theleft bank of the Piedade river, in the area of the futurereservoir.
PHOTO 3.30: Laminar and furrow erosion on the left bankof the Piedade river in the future reservoir area.

Revisão do Estudo de Impacto Ambiental – EIA - Piedade SHS – Março/2007, Pág.46
Photo 3.35 Ravine located on the right bank of the Piedaderiver, in the reduced flow section. Note the presence ofJaraguá grass.
Photo 3.36 Laminar erosion caused by cattle trampling onthe right bank of the Piedade river, in the low flow section.
Note the beginning of furrow formation.
Drawing PIE-GEM-001 is attached to this document.
3.5 Pedology
3.5.1 Methodology
The methodology used for the geology study attempted to describe the relief and morphology of the PiedadeSHS sphere of influence, surrounding and directly affected areas. We attempted to show the risk ofinstability in the natural environment along the banks of the future dam, as well as areas that could sufferchanges because of plant construction and operation.
Below is a presentation of the methodology used in order to reach the proposed objectives, in successive andcomplementary stages:a ) On-site work:b ) Process and interpret the data obtained;
Pedological description of the area Photographic record.
d) Write and illustrate the final report.
Preparing an environmental diagnosis; Mitigating or offsetting measures proposed.
Proposal to implement, evaluate and monitor measures.
In the pathology evaluation, the soil found was classified according to the Brazilian Soil ClassificationSystem (Embrapa, 1999) up to the second level category.
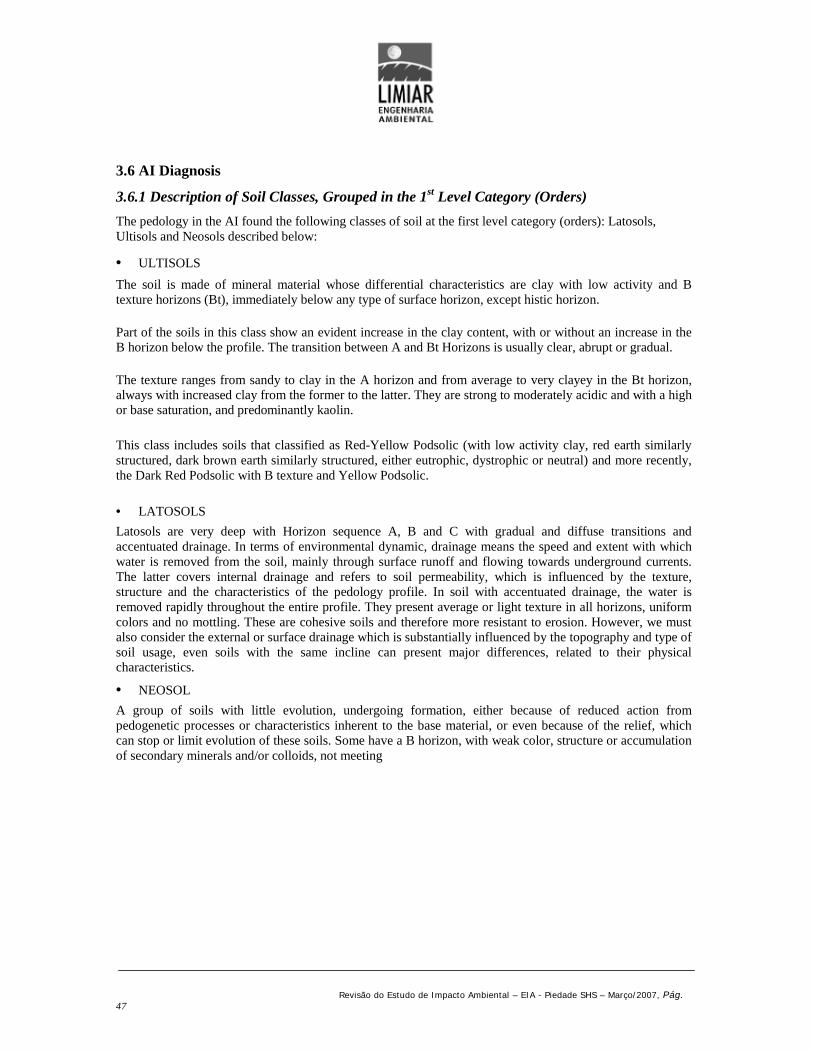
Revisão do Estudo de Impacto Ambiental – EIA - Piedade SHS – Março/2007, Pág.47
3.6 AI Diagnosis
3.6.1 Description of Soil Classes, Grouped in the 1st Level Category (Orders)
The pedology in the AI found the following classes of soil at the first level category (orders): Latosols,Ultisols and Neosols described below:
ULTISOLS
The soil is made of mineral material whose differential characteristics are clay with low activity and Btexture horizons (Bt), immediately below any type of surface horizon, except histic horizon.
Part of the soils in this class show an evident increase in the clay content, with or without an increase in theB horizon below the profile. The transition between A and Bt Horizons is usually clear, abrupt or gradual.
The texture ranges from sandy to clay in the A horizon and from average to very clayey in the Bt horizon,always with increased clay from the former to the latter. They are strong to moderately acidic and with a highor base saturation, and predominantly kaolin.
This class includes soils that classified as Red-Yellow Podsolic (with low activity clay, red earth similarlystructured, dark brown earth similarly structured, either eutrophic, dystrophic or neutral) and more recently,the Dark Red Podsolic with B texture and Yellow Podsolic.
LATOSOLS
Latosols are very deep with Horizon sequence A, B and C with gradual and diffuse transitions andaccentuated drainage. In terms of environmental dynamic, drainage means the speed and extent with whichwater is removed from the soil, mainly through surface runoff and flowing towards underground currents.The latter covers internal drainage and refers to soil permeability, which is influenced by the texture,structure and the characteristics of the pedology profile. In soil with accentuated drainage, the water isremoved rapidly throughout the entire profile. They present average or light texture in all horizons, uniformcolors and no mottling. These are cohesive soils and therefore more resistant to erosion. However, we mustalso consider the external or surface drainage which is substantially influenced by the topography and type ofsoil usage, even soils with the same incline can present major differences, related to their physicalcharacteristics.
NEOSOL
A group of soils with little evolution, undergoing formation, either because of reduced action frompedogenetic processes or characteristics inherent to the base material, or even because of the relief, whichcan stop or limit evolution of these soils. Some have a B horizon, with weak color, structure or accumulationof secondary minerals and/or colloids, not meeting
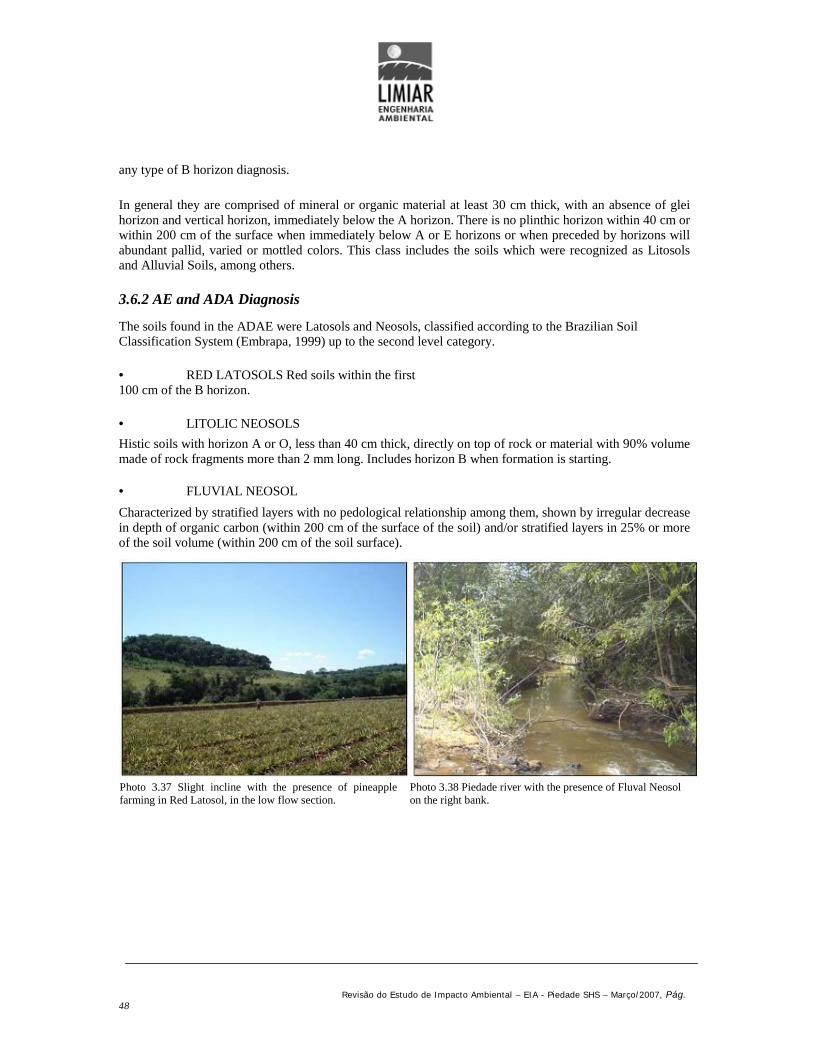
Revisão do Estudo de Impacto Ambiental – EIA - Piedade SHS – Março/2007, Pág.48
any type of B horizon diagnosis.
In general they are comprised of mineral or organic material at least 30 cm thick, with an absence of gleihorizon and vertical horizon, immediately below the A horizon. There is no plinthic horizon within 40 cm orwithin 200 cm of the surface when immediately below A or E horizons or when preceded by horizons willabundant pallid, varied or mottled colors. This class includes the soils which were recognized as Litosolsand Alluvial Soils, among others.
3.6.2 AE and ADA Diagnosis
The soils found in the ADAE were Latosols and Neosols, classified according to the Brazilian SoilClassification System (Embrapa, 1999) up to the second level category.
RED LATOSOLS Red soils within the first100 cm of the B horizon.
LITOLIC NEOSOLS
Histic soils with horizon A or O, less than 40 cm thick, directly on top of rock or material with 90% volumemade of rock fragments more than 2 mm long. Includes horizon B when formation is starting.
FLUVIAL NEOSOL
Characterized by stratified layers with no pedological relationship among them, shown by irregular decreasein depth of organic carbon (within 200 cm of the surface of the soil) and/or stratified layers in 25% or moreof the soil volume (within 200 cm of the soil surface).
Photo 3.37 Slight incline with the presence of pineapplefarming in Red Latosol, in the low flow section.
Photo 3.38 Piedade river with the presence of Fluval Neosolon the right bank.

Revisão do Estudo de Impacto Ambiental – EIA - Piedade SHS – Março/2007, Pág.49
Photo 3.39 Litolic Neosol in the future Piedade SHS
reservoir area, covered with pasture.
Drawing PIE-GEM-001 is attached to this document and shows the soil distribution.
3.7 WATER QUALITY
3.7.1 INTRODUCTION
CampaignsThe Water Quality diagnosis for the Piedade river, in the sphere of influence created by the project, wascarried out using four sampling campaigns covering one hydrological cycle.
The first field campaign was carried out between 9 and 12 December 2003. Samples were collected on the10th at points PIE-01, PIE-02 e PIE-04, and on the 11th at PIE-03. While sampling, the weather was good,with rainfall less than 72 hours previously.
The first field campaign was carried out between 9 and 12 December 2003. The weather conditions on thepreceding days were unstable, rainfall in the preceding 48 hours. On the sampling day, April 20,temperatures varied between 27 and 33°C. The river water volume was high, because of the rainfall whichcontinued in the region. At the end of the afternoon, after collection, there was heavy rainfall in the region.
The third field campaign was carried out between September 28 and 29th 2004. The weather conditions onthe previous days were stable, and according to local information, it had not rained in the region for morethan 30 days. On the sample day (29/9), temperatures varied between 30 and 35ºC.
The fourth and last field campaign took place between January 18 and 20, 2005, with collection carried outon the 19th. The weather conditions on the preceding days were unstable, with a lot of rainfall on the daybefore sampling. Temperatures varied between 23 and 25°C.

Revisão do Estudo de Impacto Ambiental – EIA - Piedade SHS – Março/2007, Pág.50
Sampling PointsThe description and location (UTM coordinates) of the water quality sampling points in the four campaignsare presented in table 3.1. Drawing PIE-PAA-001, attached, presents the location of the monitoring pointswithin the previous and current context, in other words within the two layouts.
Table 3.1Description and location of the four campaign sampling points
Table 3.2 contains a description of the river banks at the sampling points, as well as the water flow.
Collection points PIE-01 and PIE-03 are difficult to access, passing through dirty pasture, plantation andfairly dense forest. Collection point PIE-01 presents a predominance of grasses and plantations. On the left-hand bank the riparian forest has been preserved for about 15 m. Collection points PIE-02 and PIE-03located close to the main building on Mr. Roosevelt’s property. The collection points are well preserved,with the presence of well tended riparian forest. The PIE-04 collection point is located downstream from thefuture power station, under a wooden bridge.
Table 3.2Sampling point characteristics
Parameters DefinedFor the first (December 2003) and third (September 2004) campaigns, the following parameters defined:
Physical And Chemical Properties: Total acidity in CaCO3, total alkalinity in CaCO3, lead,chlorides (only in the third campaign), copper, electrical conductivity, color, biochemical oxygendemand

Revisão do Estudo de Impacto Ambiental – EIA - Piedade SHS – Março/2007, Pág.51
(DBO5 dias), chemical demand for oxygen (DQO), total hardness in CaCO3, phenols, soluble iron,total iron, total phosphate, mercury, nitrate, nitride, ammonia nitrogen, total nitrogen, oils andfats, orthophosphates, dissolved oxygen, pH, total dissolved solids, solids in suspension,sedimentary solids, total solids, water and air temperature, turbidity and zinc.
Bacteriology and Hydrobiology: Qualitative and quantitative fecal coliforms, total coliforms,phytoplankton, zoobenthics and zooplankton.
Additionally, the December 2003 campaign analyzed the presence of organic chlorates andorganophosphorus because these are compounds which can be carried to the river by rain, if being used onplantations, and can be observed in the smell of the water.
For the second (April 2004) and fourth (January 2005) campaigns, the following parameters were defined:
Physical And Chemical Properties: Total acidity in CaCO3, total alkalinity in CaCO3, chlorides,electrical conductivity, color, biochemical oxygen demand (DBO5 days), chemical demand foroxygen (DQO), total hardness in CaCO3, soluble iron, total iron, total phosphate, nitrate, nitride,ammonia nitrogen, total nitrogen, oils and fats, orthophosphates, dissolved oxygen, pH, totaldissolved solids, solids in suspension, sedimentary solids, total solids, water and air temperatureand turbidity.
Bacteriology and Hydrobiology: Qualitative and quantitative fecal coliforms, total coliforms,phytoplankton, zoobenthics and zooplankton.
Sampling and Analysis Specifications
Physical, chemical and bacteriological: Surface sampling. References for the analysis methods: StandardMethods for the Examination of Water and Wastewater (APHA, 1998) e Manual of Analytical Methods forthe Analysis of Pesticide Residues in Human and Environmental Samples, U.S. EPA. The Sampling andAnalysis of Water for Pesticides (Section-10).
Phytoplankton: In the quality of sample, a 25 µm mesh net was placed against the current 15 minutes, andthe quality of sampling 1 L of “natural” water was collected 20 cm from the surface. References for theanalysis methods: Standard Methods for the Examination of Water and Wastewater (APHA, 1995) – 10.200C; 10.200 F (Utermohl chamber counting) and methodology of accounting cyanobacteria in cells/mL (Jardimet al, 2002).
Zooplankton: In the quality of sample, a 68 µm mesh net was placed against the current 15 minutes, and thequality of sampling 200 L of “natural” water was filtered through a 68 µm mesh net. References for theanalysis methods: Standard Methods for the Examination of Water and Wastewater (APHA, 1995) – 10.200C; 10.200 F (Utermohl chamber counting).
Zoobenthic: 1st sample – quantitative sampling was carried out using a ladle and the dipping method andqualitative sampling use the net, applying the kicking method. Sampling area: 0.018 m2. Other samples –the qualitative and quantitative sampling was carried out using the kick sampling method. Samples werecarried out on the main substrates in the collection area. References for the analysis methods:

Revisão do Estudo de Impacto Ambiental – EIA - Piedade SHS – Março/2007, Pág.52
Standard Methods for the Examination of Water and Wastewater (APHA, 1995) – 10.500
The first campaign samples were sent for analysis at the Limnos Hidrobiologia e Limnologia Ltda laboratoryand the others were sent to the Visão Ambiental Ltda laboratory. The results are attached.
3.8 Data Analysis Methodology
The Piedade river is an affluent of the Paranaiba river which alongside the Grande river is one of thetributaries of the Parana river. The Piedade river drainage basin, measuring 1861 square kilometers, is whollywithin the territory of Minas Gerais.
The results were evaluated based on the main natural and anthropic variables detected in this subbasement,compared with the standards established by federal legislation, CONAMA Resolution number 337, datedMarch 2005, for results subject to legislated levels. Where the resolution fails to define conditions or qualitystandards, we adopted the limits established in COPAM Directive 10/86.
As the sub basin of the Piedade River was not studied to analyze the compliance of its waters, the resolutionestablishes that:
“Art. 42. While the respective classifications are not approved, fresh water shall be consideredclass two, briny and seawater class one, except when the current quality conditions are better,which result in application of the correspondingly higher class.”
Within this context, the waters of the Piedade river were evaluated according to the class 2 classificationlimits. The standards and/or conditions of water quality class two, according to current environmentallegislation, are included in the results table (Table 3.1 to Table 3.5).
Article 2 of the resolution states that “ XXXVII – virtually absent: that cannot be perceived by vision, smellor taste” and in article 39 that “the relevant environmental organs, when required, shall define the pollutionvalues which will be considered virtually absent”. As COPAM does not establish limits for virtually absentpollutants, with regard to oils and fats, in this study all values equal to or lower than 0.5 milligrams/liter wereconsidered virtually absent.
Results analysis also use the water quality index (IQA) developed by the National Sanitation Foundation(USA), based on an opinion poll that involved 142 environmental professionals. Water quality, indicated bythe IQA, on a scale of 0 to 100, can be classified in ranges as follows:
0 ≤ IQA < 25: very poor water;
25 ≤ IQA < 50: poor water;
50 ≤ IQA < 70: average water;
70 ≤ IQA < 90: good water; 90 ≤ IQA < 100: excellent water.

Revisão do Estudo de Impacto Ambiental – EIA - Piedade SHS – Março/2007, Pág.53
The phyto and zooplankton communities were evaluated for their abundance, density and diversity, alsostudying the presence of taxonomic groups which indicate water quality. The zoobenthic community wasevaluated for the taxonomic number and individual number present in the samples. These parameters for thethree communities were related to physical, chemical and hydrological variables in an attempt to betterunderstand how this ecosystem functions.
3. 8. 1 RESULTS AND DISCUSSIONS
Physical, chemical and bacteriological properties:
River water quality is often associated with the composition, usage and occupation of drainage basin land,because it is affected by surface run-off resulting from atmospheric precipitation. Therefore, the physical,chemical and bacteriological results may be related to specific regional issues, described briefly below.Know that the first (December 2003) and the fourth (January 2005) campaigns were conducted during therainy period, while the others, carried out in April and September 2004, were in periods of transition betweenthe dry end the drought season respectively.
In the project region there are mainly dystrophic Red Latosols and eutrophic Litolic Soils.
The eutrophic Litolic Soil, present mainly on the banks of the river, is shallow. As we move further awayfrom the river the soil becomes deeper and its classification changes gradually towards dystrophic RedLatosol.
The areas covered with dystrophic Red Latosols and eutrophic Litolic Soils may have a sandy endplatetexture to clay and silky texture, are red in color with pebbles up to blocks of quartz and basalt. Basaltdecomposition produces a reddish clay which creates fertile soil (red land).
On the Piedade River, in the area which will be affected by the project, before the waterfall section, on thebanks of the river on the banks of its main tributary is there is dystrophic Red Latosol which is characterizedas a mineral, non-hydromorphic soil with Fe2O3 in excess of 18%.
In escarpment areas and areas with steep inclines or relief we find soil classified as eutrophic Litolic Soil,which represents mineral, shallow and very undeveloped soil with depths of around 20 cm and texturevarying from sandy to clay with or without larger fragments (gravel, pebbles and boulders).
The main activity in the ADA is cattle farming which is carried out in several different ways. Thepredominance of cattle farming is cleared reflected in the structure of land usage. Pastureland dominates.Crops are represented by temporary and permanent farms, especially those involving pineapple, banana, cornand manioc.
In terms of the use of inputs, according to updated details on affected properties,

Revisão do Estudo de Impacto Ambiental – EIA - Piedade SHS – Março/2007, Pág.54
soil correction techniques were recorded at four farms, fertilizers at nine and the use of seeds and seedlingson eight properties. However, the use of pesticides is not widespread, and was only declared by oneinterviewee.
The physical, chemical and bacteriological results of the four campaigns carried out in the Piedade SHS areaof influence are presented in the following table. The outlying results are highlighted.
Table 3.1Physical, chemical and bacteriological results, December 2003.
RESULTADOSPARÂMETROS UNIDADES LIMITES *
PIE-01 PIE-02 PIE-03 PIE-04
Acidez mg/L CaCO3 --- 1,99 2,99 1,99 3,98
Alcalinidade total mg/L CaCO3 --- 29,0 33,0 36,0 33,0
Chumbo total mg/L Pb 0,01 < 0,02 < 0,02 < 0,02 < 0,02
Cobre total mg/L Cu 0,02** < 0,01 < 0,01 < 0,01 < 0,01
Condutividade elétrica µS/cm --- 24 24,8 27,2 25,6
Cor aparente mg/L Pt 75 15 15 15 20
Demanda bioquímica de oxigênio mg/L O2 5 1,51 1,43 1,75 1,45
Demanda química de oxigênio mg/L O2 --- < 5,00 < 5,00 < 5,00 < 5,00
Dureza total mg/L CaCO3 --- 13 13 15 14
Fenóis mg/L C6H5OH 0,003 < 0,001 0,005 0,001 0,005
Ferro solúvel (dissolvido) mg/L Fe 0,3 < 0,01 0,290 0,303 0,288
Ferro total mg/L Fe --- 2,102 2,481 2,588 3,467
Fósforo total mg/L P 0,1 0,035 0,031 0,031 0,043
Mercúrio total mg/L Hg 0,0002 < 0,0001 < 0,0001 < 0,0001 < 0,0001
Nitrato mg/L N 10 0,2 0,2 0,3 0,4
Nitrito mg/L N 1,0 < 0,005 < 0,005 < 0,005 0,005
Nitrogênio amoniacal (total) mg/L N *** 0,25 0,36 0,39 0,47
Nitrogênio total mg/L N --- 0,7 0,6 0,7 0,9
Odor --- VA Ausente Ausente Ausente Ausente
Óleos e graxas totais mg/L VA < 1 < 1 < 1 < 1
Ortofosfatos mg/L P --- 0,023 0,021 0,032 0,029
Oxigênio dissolvido mg/L O2 > 5,0 7,21 7,21 7,21 7,00
pH in natura --- 6,0 - 9,0 7,21 7,85 7,87 7,60
Sólidos dissolvidos totais mg/L 500 19 25 32 38
Sólidos sedimentáveis mL/L --- < 0,20 < 0,20 < 0,20 < 0,20
Sólidos suspensos totais mg/L --- 13 11 15 18
Sólidos totais mg/L --- 32 36 47 56
Temperatura da água °C --- 22,0 23,0 23,0 23,0
Temperatura do ar °C --- 23,0 26,0 26,0 27,0
Turbidez FTU 100 6,7 7,1 7,2 7,5
Zinco total mg/L Zn 0,18 < 0,01 0,017 < 0,01 0,014
Coliformes fecais org/100 mL 1000 250 240 200 60
Coliformes totais org/100 mL 5000** 21600 19200 24000 89000
Key: * Standards pursuant to CONAMA Resolution No. 357/05, for class 2 water. ** Standards pursuant toCOPAM Decision No. 10/86, for class 2 water. ***Total ammonia nitrogen: 3.7mg/L N. for pH ≤ 7.5; 2.0mg/L N. for 7.5 < pH ≤ 8.0; 1.0 mg/L N. for 8.0 < pH ≤ 8.5; 0.5 mg/L N. for pH > 8.5. VA = virtually absent.

Revisão do Estudo de Impacto Ambiental – EIA - Piedade SHS – Março/2007, Pág.55
Table 3.2Organochloride and organophosphate results, December 2003.
Organochlorides
Aldrin Aldrin + Dieldrin: 0,005 sg/L < 0,002 < 0,002 < 0,002 < 0,002
OP DDE < 0,80 < 0,80 < 0,80 < 0,80
PP DDE < 0,80 < 0,80 < 0,80 < 0,80
OP DDD < 0,80 < 0,80 < 0,80 < 0,80
PP DDD < 0,80 < 0,80 < 0,80 < 0,80
OP DDT < 0,002 < 0,002 < 0,002 < 0,002
PP DDT
DDT (p,p’-DDT + p,p’-DDE + p,p’-DDD): 0,002 sg/L
< 0,002 < 0,002 < 0,002 < 0,002
Mirex Dodecacloro pentaciclodecano: 0,001 sg/L < 0,001 < 0,001 < 0,001 < 0,001
Gama BHC < 0,002 < 0,002 < 0,002 < 0,002
Delta BHCHexaclorobenzeno: 0,0065 sg/L
< 0,002 < 0,002 < 0,002 < 0,002
Heptacloro epóxido Heptacloro epóxido + Heptacloro: 0,01 sg/L < 0,001 < 0,001 < 0,001 < 0,001
Dieldrin Aldrin + Dieldrin 0,005 sg/L < 0,002 < 0,002 < 0,002 < 0,002
Endrin 0,004 sg/L < 0,004 < 0,004 < 0,004 < 0,004
Endosulfan I < 0,056 < 0,056 < 0,056 < 0,056
Endosulfan II < 0,056 < 0,056 < 0,056 < 0,056
Endosulfan SO4 - 2
Endossulfan ( a + 1 3 + sulfato): 0,056 sg/L
< 0,056 < 0,056 < 0,056 < 0,056
Metoxicloro 0,03 sg/L < 0,30 < 0,30 < 0,30 < 0,30
Organophosphates
Paration Metílico < 0,04 < 0,04 < 0,04 < 0,04
Paration EtílicoParation: 0,04 sg/L
< 0,04 < 0,04 < 0,04 < 0,04
Malation 0,1 sg/L < 0,1 < 0,1 < 0,1 < 0,1
Phorate < 0,20 < 0,20 < 0,20 < 0,20
Diazinon < 0,20 < 0,20 < 0,20 < 0,20
Ethion
Organosfosforados e carbamatos totais: 10 sg/L**
< 0,20 < 0,20 < 0,20 < 0,20
Key: * Standards pursuant to CONAMA Resolution No. 357/05, for class 2 water. ** Standards pursuant to COPAMDecision No. 10/86, for class 2 water.
As mentioned previously, in the first campaign, carried out during the rainy season, organochlorides andorganophosphates. None of the samples found concentrations in excess of those established byenvironmental legislation. Notes that the analysis method detection limits for certain compounds exceedsthe water quality standard in Resolution 357/05.
VALOR MÁXIMO *PIE-01
PARÂMETROS RESULTADOS (sg/L)
PIE-02 PIE-03 PIE-044
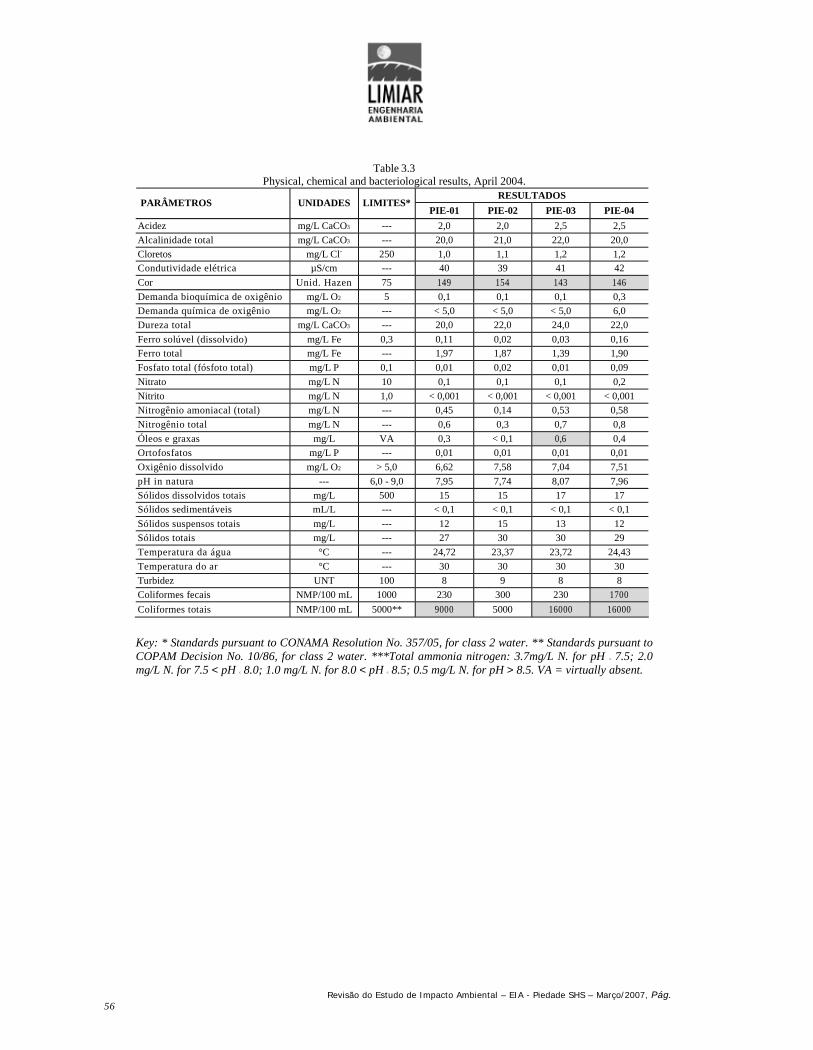
Revisão do Estudo de Impacto Ambiental – EIA - Piedade SHS – Março/2007, Pág.56
Table 3.3Physical, chemical and bacteriological results, April 2004.
RESULTADOSPARÂMETROS UNIDADES LIMITES*
PIE-01 PIE-02 PIE-03 PIE-04
Acidez mg/L CaCO3 --- 2,0 2,0 2,5 2,5
Alcalinidade total mg/L CaCO3 --- 20,0 21,0 22,0 20,0
Cloretos mg/L Cl- 250 1,0 1,1 1,2 1,2Condutividade elétrica µS/cm --- 40 39 41 42
Cor Unid. Hazen 75 149 154 143 146
Demanda bioquímica de oxigênio mg/L O2 5 0,1 0,1 0,1 0,3
Demanda química de oxigênio mg/L O2 --- < 5,0 < 5,0 < 5,0 6,0
Dureza total mg/L CaCO3 --- 20,0 22,0 24,0 22,0
Ferro solúvel (dissolvido) mg/L Fe 0,3 0,11 0,02 0,03 0,16Ferro total mg/L Fe --- 1,97 1,87 1,39 1,90
Fosfato total (fósfoto total) mg/L P 0,1 0,01 0,02 0,01 0,09
Nitrato mg/L N 10 0,1 0,1 0,1 0,2
Nitrito mg/L N 1,0 < 0,001 < 0,001 < 0,001 < 0,001
Nitrogênio amoniacal (total) mg/L N --- 0,45 0,14 0,53 0,58
Nitrogênio total mg/L N --- 0,6 0,3 0,7 0,8
Óleos e graxas mg/L VA 0,3 < 0,1 0,6 0,4
Ortofosfatos mg/L P --- 0,01 0,01 0,01 0,01
Oxigênio dissolvido mg/L O2 > 5,0 6,62 7,58 7,04 7,51
pH in natura --- 6,0 - 9,0 7,95 7,74 8,07 7,96
Sólidos dissolvidos totais mg/L 500 15 15 17 17Sólidos sedimentáveis mL/L --- < 0,1 < 0,1 < 0,1 < 0,1
Sólidos suspensos totais mg/L --- 12 15 13 12
Sólidos totais mg/L --- 27 30 30 29
Temperatura da água °C --- 24,72 23,37 23,72 24,43
Temperatura do ar °C --- 30 30 30 30
Turbidez UNT 100 8 9 8 8
Coliformes fecais NMP/100 mL 1000 230 300 230 1700
Coliformes totais NMP/100 mL 5000** 9000 5000 16000 16000
Key: * Standards pursuant to CONAMA Resolution No. 357/05, for class 2 water. ** Standards pursuant toCOPAM Decision No. 10/86, for class 2 water. ***Total ammonia nitrogen: 3.7mg/L N. for pH ≤ 7.5; 2.0mg/L N. for 7.5 < pH ≤ 8.0; 1.0 mg/L N. for 8.0 < pH ≤ 8.5; 0.5 mg/L N. for pH > 8.5. VA = virtually absent.
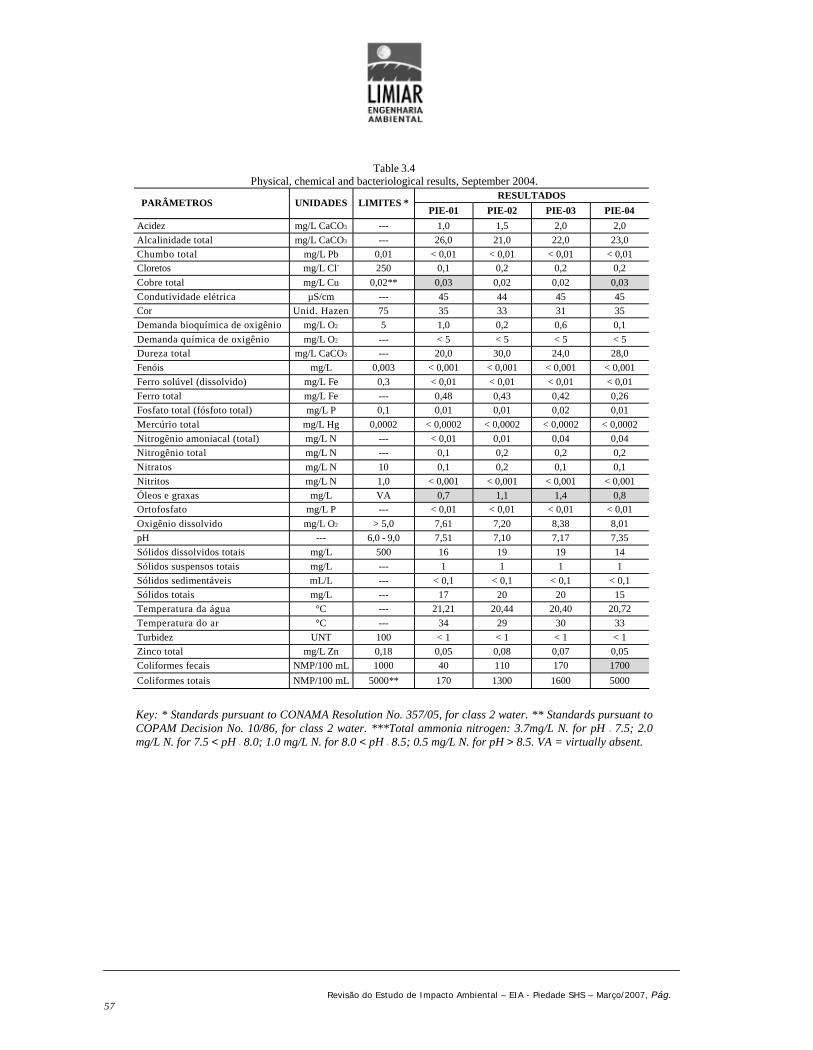
Revisão do Estudo de Impacto Ambiental – EIA - Piedade SHS – Março/2007, Pág.57
Table 3.4Physical, chemical and bacteriological results, September 2004.
RESULTADOSPARÂMETROS UNIDADES LIMITES *
PIE-01 PIE-02 PIE-03 PIE-04
Acidez mg/L CaCO3 --- 1,0 1,5 2,0 2,0
Alcalinidade total mg/L CaCO3 --- 26,0 21,0 22,0 23,0
Chumbo total mg/L Pb 0,01 < 0,01 < 0,01 < 0,01 < 0,01Cloretos mg/L Cl- 250 0,1 0,2 0,2 0,2
Cobre total mg/L Cu 0,02** 0,03 0,02 0,02 0,03
Condutividade elétrica µS/cm --- 45 44 45 45
Cor Unid. Hazen 75 35 33 31 35
Demanda bioquímica de oxigênio mg/L O2 5 1,0 0,2 0,6 0,1
Demanda química de oxigênio mg/L O2 --- < 5 < 5 < 5 < 5Dureza total mg/L CaCO3 --- 20,0 30,0 24,0 28,0
Fenóis mg/L 0,003 < 0,001 < 0,001 < 0,001 < 0,001
Ferro solúvel (dissolvido) mg/L Fe 0,3 < 0,01 < 0,01 < 0,01 < 0,01
Ferro total mg/L Fe --- 0,48 0,43 0,42 0,26
Fosfato total (fósfoto total) mg/L P 0,1 0,01 0,01 0,02 0,01
Mercúrio total mg/L Hg 0,0002 < 0,0002 < 0,0002 < 0,0002 < 0,0002
Nitrogênio amoniacal (total) mg/L N --- < 0,01 0,01 0,04 0,04
Nitrogênio total mg/L N --- 0,1 0,2 0,2 0,2
Nitratos mg/L N 10 0,1 0,2 0,1 0,1
Nitritos mg/L N 1,0 < 0,001 < 0,001 < 0,001 < 0,001
Óleos e graxas mg/L VA 0,7 1,1 1,4 0,8Ortofosfato mg/L P --- < 0,01 < 0,01 < 0,01 < 0,01
Oxigênio dissolvido mg/L O2 > 5,0 7,61 7,20 8,38 8,01
pH --- 6,0 - 9,0 7,51 7,10 7,17 7,35
Sólidos dissolvidos totais mg/L 500 16 19 19 14
Sólidos suspensos totais mg/L --- 1 1 1 1
Sólidos sedimentáveis mL/L --- < 0,1 < 0,1 < 0,1 < 0,1
Sólidos totais mg/L --- 17 20 20 15
Temperatura da água °C --- 21,21 20,44 20,40 20,72
Temperatura do ar °C --- 34 29 30 33
Turbidez UNT 100 < 1 < 1 < 1 < 1
Zinco total mg/L Zn 0,18 0,05 0,08 0,07 0,05
Coliformes fecais NMP/100 mL 1000 40 110 170 1700
Coliformes totais NMP/100 mL 5000** 170 1300 1600 5000
Key: * Standards pursuant to CONAMA Resolution No. 357/05, for class 2 water. ** Standards pursuant toCOPAM Decision No. 10/86, for class 2 water. ***Total ammonia nitrogen: 3.7mg/L N. for pH ≤ 7.5; 2.0mg/L N. for 7.5 < pH ≤ 8.0; 1.0 mg/L N. for 8.0 < pH ≤ 8.5; 0.5 mg/L N. for pH > 8.5. VA = virtually absent.
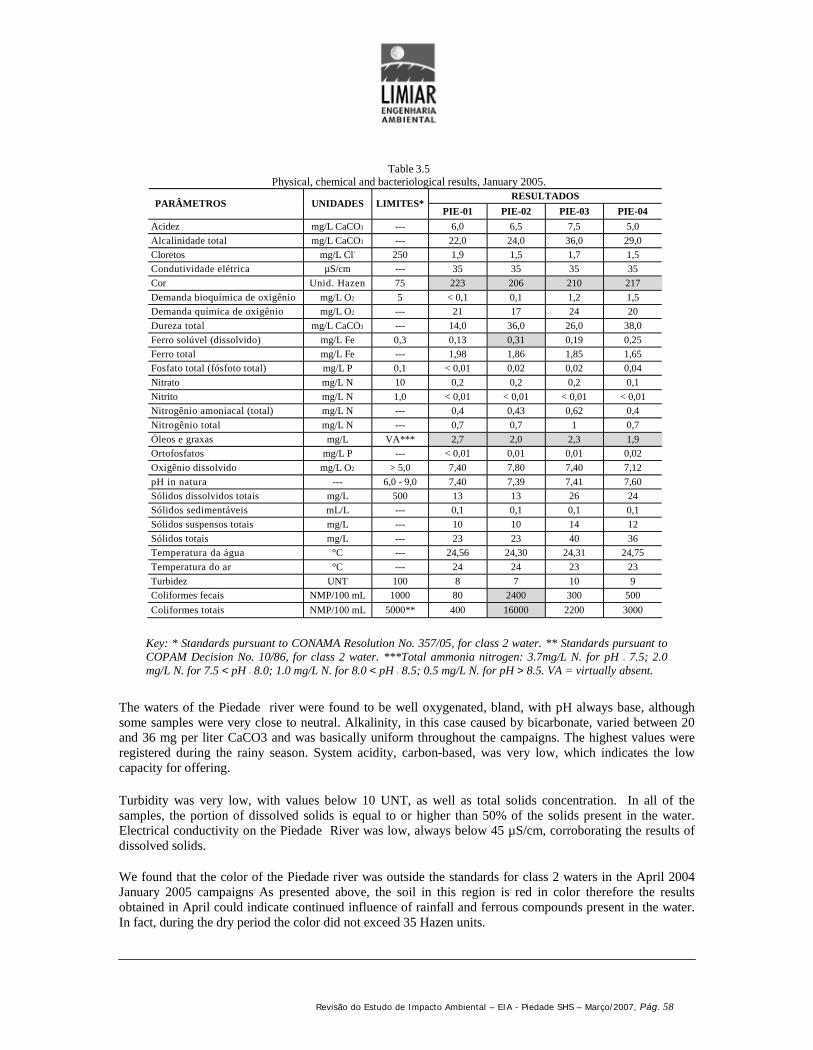
Revisão do Estudo de Impacto Ambiental – EIA - Piedade SHS – Março/2007, Pág. 58
Table 3.5Physical, chemical and bacteriological results, January 2005.
RESULTADOSPARÂMETROS UNIDADES LIMITES*
PIE-01 PIE-02 PIE-03 PIE-04
Acidez mg/L CaCO3 --- 6,0 6,5 7,5 5,0
Alcalinidade total mg/L CaCO3 --- 22,0 24,0 36,0 29,0
Cloretos mg/L Cl- 250 1,9 1,5 1,7 1,5
Condutividade elétrica µS/cm --- 35 35 35 35
Cor Unid. Hazen 75 223 206 210 217
Demanda bioquímica de oxigênio mg/L O2 5 < 0,1 0,1 1,2 1,5
Demanda química de oxigênio mg/L O2 --- 21 17 24 20
Dureza total mg/L CaCO3 --- 14,0 36,0 26,0 38,0
Ferro solúvel (dissolvido) mg/L Fe 0,3 0,13 0,31 0,19 0,25
Ferro total mg/L Fe --- 1,98 1,86 1,85 1,65
Fosfato total (fósfoto total) mg/L P 0,1 < 0,01 0,02 0,02 0,04
Nitrato mg/L N 10 0,2 0,2 0,2 0,1
Nitrito mg/L N 1,0 < 0,01 < 0,01 < 0,01 < 0,01
Nitrogênio amoniacal (total) mg/L N --- 0,4 0,43 0,62 0,4
Nitrogênio total mg/L N --- 0,7 0,7 1 0,7
Óleos e graxas mg/L VA*** 2,7 2,0 2,3 1,9
Ortofosfatos mg/L P --- < 0,01 0,01 0,01 0,02
Oxigênio dissolvido mg/L O2 > 5,0 7,40 7,80 7,40 7,12
pH in natura --- 6,0 - 9,0 7,40 7,39 7,41 7,60
Sólidos dissolvidos totais mg/L 500 13 13 26 24
Sólidos sedimentáveis mL/L --- 0,1 0,1 0,1 0,1
Sólidos suspensos totais mg/L --- 10 10 14 12
Sólidos totais mg/L --- 23 23 40 36
Temperatura da água °C --- 24,56 24,30 24,31 24,75
Temperatura do ar °C --- 24 24 23 23
Turbidez UNT 100 8 7 10 9
Coliformes fecais NMP/100 mL 1000 80 2400 300 500
Coliformes totais NMP/100 mL 5000** 400 16000 2200 3000
Key: * Standards pursuant to CONAMA Resolution No. 357/05, for class 2 water. ** Standards pursuant toCOPAM Decision No. 10/86, for class 2 water. ***Total ammonia nitrogen: 3.7mg/L N. for pH ≤ 7.5; 2.0mg/L N. for 7.5 < pH ≤ 8.0; 1.0 mg/L N. for 8.0 < pH ≤ 8.5; 0.5 mg/L N. for pH > 8.5. VA = virtually absent.
The waters of the Piedade river were found to be well oxygenated, bland, with pH always base, althoughsome samples were very close to neutral. Alkalinity, in this case caused by bicarbonate, varied between 20and 36 mg per liter CaCO3 and was basically uniform throughout the campaigns. The highest values wereregistered during the rainy season. System acidity, carbon-based, was very low, which indicates the lowcapacity for offering.
Turbidity was very low, with values below 10 UNT, as well as total solids concentration. In all of thesamples, the portion of dissolved solids is equal to or higher than 50% of the solids present in the water.Electrical conductivity on the Piedade River was low, always below 45 µS/cm, corroborating the results ofdissolved solids.
We found that the color of the Piedade river was outside the standards for class 2 waters in the April 2004January 2005 campaigns As presented above, the soil in this region is red in color therefore the resultsobtained in April could indicate continued influence of rainfall and ferrous compounds present in the water.In fact, during the dry period the color did not exceed 35 Hazen units.

Revisão do Estudo de Impacto Ambiental – EIA - Piedade SHS – Março/2007, Pág.59
In January, the river color was notably higher, with values of around 200 Hazen units, which confirms theinfluence of rainfall on water quality.
The levels of soluble eye and found can be associated with the types of rocks and soils diagnosed for theRiver hydrographic basin, where we found a clear correlation between rocky substrate, relief and soilcoverage. in December, soluble iron concentration at PIE-03 was 0.003 mg per liter Fe above the permittedlevel and in January, 0.01 mg per liter at PIE-02. In the dry season, the levels of dissolved iron were lowerthan the analysis method detection limit, therefore we can infer that they arrive at the river carried by therains and are not directly placed into the river.
The DBO values were always below 1.75 mg per liter O2, demonstrating the good water quality for thisparameter. DQO was only higher in January, in other words during the high rainfall period and when a largequantity of material is carried to the watercourse.
The influence of the rain on the nutrient concentration can be seen in the data analysis. The Piedade river, ingeneral, has a low level of nutrients such as phosphorus and nitrogen.
Total phosphorus concentrations are within the new standard for class two bodies of water, although we mustbear in mind that the river will be dammed and that standards will be more restrictive. Orthophosphateconcentrations were, except for the samples collected in December, equal to or lower than 0.01 mg per literP. Notes the soluble phosphorus is directly available for biological metabolism without need for conversioninto simpler forms.
The standard of total phosphate for the watercourse was considered an intermediary environment, in otherwords a residual time of between two and 40 days, and up to 0.05 milligrams per liter P. For this project, wefound that all of the samples of the points which will become lentic met the standard.
In terms of nitrogen, we found that all of the samples, especially total ammonia nitrogen, were within thewater quality standard in CONAMA Resolution 307/05.
According to the new legislation, phenol concentration exceeded standards at PIE-02 and PIE-04 during theDecember 2003 rainy period and could have entered the body of water through sanitary effluent andvegetable decomposition in the soil and water, mainly wood. In the dry season, phenols present very lowlevels, always below the method detection limit.
In terms of substances that could potentially damage the environment and the biota, mercury and lead werewithin permitted limits, with values below the analysis method detection limit. The new legislation,CONAMA resolution 357/05, establishes a water quality standard with a maximum concentration ofdissolved copper and no longer total copper. Based on this and according to the fact that the analysis werecarried out before this resolution came into effect, the results were compared with DN COPAM 10/86standards. Total copper concentration exceeded the limit in the aforementioned

Revisão do Estudo de Impacto Ambiental – EIA - Piedade SHS – Março/2007, Pág.60
legislation at PIE-01 and PIE-04 during the dry period. We can therefore infer that copper does not reach thewaters of the river because of the action of rainfall. The concentration of total zinc, in the rainy and dryseasons, was lower than the quarter quality standard.
In this study, concentrations of oils and fats below or equal to 0.5 mg/L are considered virtually absent. Inthe second campaign, only PIE-03 presented concentrations in this parameter above permitted levels. In thetwo following campaigns, during the dry and rainy season respectively, the entire section monitored wasfound to be contaminated by oils and fats.
The bacteriological quality was satisfactory in the majority of samples. At PIE-04, densities of fecalcoliforms were recorded above 1000 NMP/100mL on two occasions, April and September 2004. However,this point is located downstream from the power station, where the water will flow. In January, PIE-02presented the highest concentration of fecal coliforms registered during monitoring (2400 NMP/100mL).
As with copper, the CONAMA Resolution does not stipulate a maximum value for total coliformconcentration in water. According to DN COPAM 10/86, for samples presented unsatisfactoryconcentrations: PIE-01, PIE-03 and PIE-04 in April and PIE-02 in January.
The results obtained may be related to land occupation and usage, after finding that the main activity withinthe ADA is farming of different varieties.
he Water Quality Index – IQA reflects interference of sanitary sewage and other organic materials, nutrientsand solids present in the water course. Figure 3.3 shows the water quality situation using the IQAenvironmental index, calculated for the Piedade rigorous stretching the area directly affected by PiedadeSHS.
Figure 3.3 Water quality index - PIEDADE SHS.

Review of the Environmental Impact Study - EIA - Piedade SHS - March/2007, Pág. 61
In analyzing the graph, we can see that the waters of the River Piedade along the SHS section are of goodquality during the first rainy season sampled (December/03), despite the water being slightly enriched withphosphorous. Notes that the water quality was uniform throughout the stretch monitored, varying from 76 to80. In January 2005, the level was a little lower at most points, classifying the water as average quality atPIE-02 ( 69.7). The point located furthest upstream at the highest quality because of the low level of fecalcoliforms on greater oxygenation of the water.
During what are considered transition periods, although the month of September can be considered a dryperiod, because there was no rain prior to the collection date, the river waters present good quality alongpractically the entire SHS ADA stretch.
In April, PIE-04, downstream from the future power station, presented average quality water because of fecalcoliform counts of 1700 NMP/100 mL. Note that the water quality was uniform throughout the stretchmonitored, with a small variation downstream. In the dry period, water quality at PIE-02 and PIE-03 wasvery similar, and the river presented a slight fall in quality between upstream and downstream.
PIE-04, downstream from the future power station, had a lower average quality level (73.5) although it is stillclassified as good quality. Periods with lower flows were most critical, especially because of fecal coliformcounts.
PhytoplanktonSelected In terms of the phytoplankton community (figure 3.4) we can say that a low number of species werefound; the maximum abundance was only 15 species at PIE-03 in September 2004. Algae density was alsolow, except in the September/2004 campaign, when PIE-01, PIE-02 and PIE-04 reached density is equal toor higher than 80 ind/mL. In the other campaigns, the highest value was just 44 ind/mL at PIE-03, duringthe April/04 campaign.
Figure 3.4 Abundance and density of the phytoplankton community in the Piedade river during the hydrologicalcycle between December 2003 and January 2005.

Revisão do Estudo de Impacto Ambiental – EIA - Piedade SHS – Março/2007, Pág.62
As a result, community diversity was also lower than expected for this environment, with density at variouspoints lower than 1, which is characteristic in environments that have suffered a strong impact (figure 3.5).
These low diversity values, calculated using the Shannon Weaver species diversity index (1949), were foundmainly in campaign points in December 2003 and at all campaign points in January 2005, contrasting withboth campaigns in the dry period (April/04 and September/04), when practically every collection point fordiversity level in excess of 1, remaining within the typical range of environments suffering moderateimpacts.
Figure 3.5 Abundance and density of the phytoplanktoncommunity in the Piedade river during the hydrologicalcycle between december 2003 and january 2005.
In December 2003, only three taxonomies were found in the quantitative samples: cyanobacteria of the genusLyngbya sp., diatoms of the Pennales order and an unidentified phytoflagellate. In all three cases, density waslow, with a maximum 11 ind/mL for phytoflagellates. In qualitative samples, there were other phytoplanktongroups such as Volvocales, Euglena and the genuses Cosmarium and Gonatozygon.
In April 2004, five taxonomies were found within the division of the cyanophycea, although two of theseoccurred only in the qualitative samples. The others remained at low densities to the extent that they cause noconcern from a sanitary standpoint. CONAMA resolution 357/05 allows for a cyanobacteria density of up to50,000 cells/mL in class to watercourses. At the full collection points, the algae Cryptomonas sp.(Pyrrophyta divisions) was a numerically dominant species, with densities occurring between eight and 18ind/mL, followed by the cyanophycea Nostocaceae.
In September/2004, diamotic alga was much more extensive than the other types in the waters of the RiverPiedade. Especially the genuses Cyclotella sp.; Fragilaria sp.; Gomphonema sp.; Navicula sp.; Surirella sp.and Synedra sp.; with densities of at least 20 ind/mL at some sampling points. In addition to the diatoms,cyanophycea Pseudanabaena sp. Also occurred in the quantitative samples at PIE-02, at a density of 180cell/mL. Only these two species of chlorophycea were detected in the quantitative samples: Crucigeniatetrapedia at PIE-01 and Monoraphidium sp. at PIE-03.

Revisão do Estudo de Impacto Ambiental – EIA - Piedade SHS – Março/2007, Pág.63
The low abundance and density in the January 2005 campaign were probably accentuated by the rainfall.Only three types could be found in the quantitative samples: Cryptomonas sp. (Pyrrophyta divisions), whosedensity varied at the four points between two and three ind/mL, ad diatoms Eunotia sp. and Ephitemia sp.The highest density was registered for Eunotia sp., 5 ind/mL at PIE-04.
The phytoplankton community in the system is highly susceptible to seasonal environmental variations,shown by alterations in the community structure. These alterations, however, take place as expected, in otherwords during the intense rainy period there is a further reduction in abundance and scarcity and consequentlydiversity, which is natural in tropical water habitats.
Zooplankton
Contrary to phytoplankton, the parameters for this community did not follow the normally expected seasonalinfluences so closely. There was no clear change in the density values between December 2003and April 2004 (figure 3.6); from then on throughout the dry period, density values increasedexpressively in September 2004. With the arrival of another rainy period in January 2005, densitydropped significantly at two points (PIE-01 and PIE-02) and remained practically constant at the other two.
Diversity, calculated using the Shannon Weaver species diversity index (1949) was the most constantparameter over time. The maximum value (2.55; PIE-03) and the minimum value (1.33; PIE-02) wererecorded in January 2005. In most of the samples diversity was equal to or greater than 2.
In the first two campaigns, we found that the waters in the river Piedade had lower densities of zooplankton.PIE-01 and PIE-02 presented an abundance considered scarce and the other two, very scarce, inferior to 1.0org/l.
However, diversity in April was always higher than diversity in December, because of the number of speciespresent (greater abundance).
In December, the rotifers Bdelloidea were present at every point at relatively high densities. These organismswere numerically dominant at PIE-02 and PIE-04. At PIE-01, there was a participation of micro-crustaceansin the community, reaching a density of 0,408 org/L. In the following campaign, the protozoa will not onlymore abundant they were also numerically dominant, representing around 70% of the entire community at allfour points. In contrast, the micro-crustaceans were few and far between, registering only twotaxonomies (Alona sp. and Nauplius Cyclopoida), both with a maximum density of 0.1 org/L, at PIE-01.

Revisão do Estudo de Impacto Ambiental – EIA - Piedade SHS – Março/2007, Pág.64
Figure 3.6 Diversity, abundance and density of the zooplanktoncommunity in the Piedade river during the hydrological cyclebetween December 2003 and January 2005.
Keen September 2004, the rotifer species Lecane lunaris was numerically more dominant at three points.The exception was PIE-02 where the organism with the highest density was the protozoa Arcella vulgaris.Crustaceans were not very representative in this campaign and were absent in the samples from PIE-02 andPIE-04. PIE-01 registered the greatest abundance in the system, 19 taxonomies, especially because of thelarge number of species of protozoa. At the same point, we also recorded the highest density of totalorganisms, 14.46 org/L, of which a little over half were protozoa.
In the January campaign, the greatest abundance of zooplankton as well as the highest density was found atPIE-03. Protozoa were the most abundant organisms, especially Centropyxis aculeata which was thedominant species at PIE-01 and Difflugia lobostoma which was the dominant species at the other threepoints. Each point recorded representatives from the

Revisão do Estudo de Impacto Ambiental – EIA - Piedade SHS – Março/2007, Pág.65
crustacean class, although they were not very abundant The presence of Bdelloidea was not recorded amongrotifers, although it had been very abundant during the previous rainy season.
Benthic community
The zoobenthic community is capable of integrating and reflecting the state of conversational degradation ofan ecosystem and organisms which are very sensitive to the effects of even an older or relatively non-seriousimpact. This is because benthic organisms not only detect physical and chemical alterations in the water butthey are also affected by modifications to the structure of their habitat, for example removal of nativevegetation from the river banks, deposits of fine sediment on the substrate, less shade along the river banks,the introduction of exotic species etc.
In general terms, we can characterize good quality water environments as those with a large variety oforganisms in abundance numbers which are well balanced between species, representing high levels ofdiversity. Environment is not highly influenced by human activity, we can find organisms with very differentlifestyles (sedentary, swimmers, aquatic plants miners etc) and various types of feeding. When there is infact from human activity, the abundance and diversity of river life tends to fall and the most sensitive speciesat the first to disappear. In highly degraded environment, with very low water quality, the number of speciesis small, mainly presenting a single type of animal.
In the December 2003 campaign, the abundance of zoobenthic organisms was especially high at PIE-04,where 14 types were found. The lowest abundance was at PIE-03 with just seven types, although this is areasonable number considering that the campaign represents the rainy season (table 3.6).
Earthworms (Annelidae), believed to indicate polluted water because they are extremely tolerant ofenvironmental degradation, was the dominant organisms at PIE-01 and PIE-03. The two other points werealso dominated numerically by indicators of poor water quality, but in this case the most abundant organismswere immature forms of diptera from the Chironomidae family.
However, we also found some organisms believed to indicate good quality water, because they are extremelysensitive to changes in environment quality. This was the case with ephemeroptera of the genus Baetis,present at all four points from dragon-flies the Libellulidae, Gomphidae and Calopterygidae families (thelatter present only at PIE-04) and the caddis fly from the Glossosomatidae family alongside the stonefly fromthe Perlidae family at PIE-04.
In April/2004, the zoobenthic community showed slightly greater abundance to collection points along thePiedade river (PIE-01 and PIE-03). The lowest abundance was at PIE-02, where

Revisão do Estudo de Impacto Ambiental – EIA - Piedade SHS – Março/2007, Pág.66
only five types were registered (table 2.6). Even at this point, there was a notable presence of organismsindicating good water quality, such as the Marilia genus caddis fly and the mayfly of the genus Thraulodes.The latter was also present at PIE-04. Despite the level of these organisms along the section analyzed, weshould point out the high dominance of a single type that PIE-01 and PIE-04, where the lovers of the dipterafrom the Chironomidae family, which indicate poor environmental quality, represented over 50% of theentire community and were present in great abundance (117 larva at PIE-01 and 91 at PIE-04).
TABLE 3.6Zoobenthic organism community parameters in the Piedade river waters
CAMPANHA PONTO AMOSTRATIPO DE
SUBSTRATO Nº DE TAXA Nº DE INDIVÍDUOS *
PIE-01 1 --- 8 8 473 473PIE-02 1 --- 8 8 322 322PIE-03 1 --- 7 7 303 303
Dezembro/03
PIE-04 1 --- 14 14 246 246PIE-01 1 A 12 12 213 213PIE-02 1 A 5 5 28 28PIE-03 1 A 9 9 72 72
1 B 7 70
Abril/04
PIE-042 A 11
1157
127
1 A 12 213PIE-01
2 B 819
180393
1 A 5 28PIE-02
2 B 1112
5785
1 A 9 72PIE-03
2 B 913
82154
1 B 7 70
Setembro/04
PIE-042 A 11
1185
155
1 B 8 20PIE-01
2 A 513
2242
1 B 7 36PIE-02
2 A 614
3268
1 B 5 20PIE-03
2 A 611
3252
1 B 7 72
Janeiro/05
PIE-042 A 8
1468
140
Note: Type of Substrate: A – Substrate with predominance of Leaves, Branchesand Roots. B – Substrate with predominance of Silt/FineSand.
* In the December/2003 campaign, the total abundance of organisms was given inind./m2; in the others as ind. in the sample.
In the substrates sampled at the first three points in the sampling networks, upstream and downstream, therewas a predominance of leaves, branches and roots (substrate A). PIE-04, located at a wooden bridge, therewas additionally a second substrate with a predominance of fine sand and silt (substrate B). Note that therewas no presence of any taxonomy in the sand and silt substrate (substrate B) and that the leaf, branch andgroup substrate was richer but there was no abundance of organisms (substrate A).
Despite representing very diverse habitats, it is not always possible to discriminate different communities inthe A and B substrates. The physical proximity of the two substrates and the ability for organisms to movebetween them means that the fauna between one location and the other overlaps.

Revisão do Estudo de Impacto Ambiental – EIA - Piedade SHS – Março/2007, Pág.67
The greatest wealth from the September/274 campaign was recorded at PIE-1 (19 types) where the numberof individuals was also especially high (292 individuals, of which 187 Chironomidae larva and 52 Hirudineabloodsuckers) and the lowest at PIE-04 (11 taxonomies). The point with the least abundance was PIE-02(85 individuals, of which 30 Chironomidae larva). Despite the fact that Chironomidae lava were veryabundant at every point, especially PIE-01, there was also an abundance of several Dragonfly species,belonging to the three families. At PIE-02 and PIE-04, mayfly pupae (family Leptophlebiidae, genusThraulodes sp.) and at PIE-02 we also found caddis fly pupae (family Odontoceridae, genus Marilia sp.).
Also in September 2004, no consistent pattern was found representing a community in one or other type ofsubstrate, as both the number of taxonomies and individuals was very similar in both. At PIE-02 we found adifference in taxonomy abundance between one type of substrate and the other, with substrate A presentingfive taxonomies and substrate
B 11.
When the rains came, the January 2005 campaign showed a zoobenthic organism community which wasmuch less abundant in the previous campaign and with much less significant dominance. The samples fromsubstrate B from all points contain organisms indicating degradation (Oligochaeta and Chironomidae) andthey were not found in substrate A. However, substrate B also presented mayfly pupae (Leptophlebiidaefamily) at every point, showing that the environment has not seriously degraded. The samples from substrateA were comparatively rich in organisms indicating good quality (mayflies from the Baetidae family anddragonflies from the Gomphidae family).
3.9 NATURAL HERITAGE3.9.1 METHODOLOGY
The evaluation of the Natural Heritage was carried out between August 14 and 18 2006, complying with LICondition No. 3.5, which states: "Present additions and alterations to the scope of the Natural HeritageRegistration Program guaranteeing a visual record of the ADA prior to any project intervention affectingHeritage, and cartographic and visual records of remaining natural heritage in the municipal region ofMonte Alegre de Minas, characterization of its support capabilities as well as the products associated withthe service – Book and CD-ROM, which must be distributed to the community and City Hall. Deadline: 30days.”
In the municipal region we therefore identified and registered nine waterfalls including the two located onthe low flow section of Piedade SHS, also interviewing Mrs. Francinete, an employee at the MunicipalCulture and Tourism Department in Monte Alegre de Minas, to identify possible areas of natural heritage inthe region.

Revisão do Estudo de Impacto Ambiental – EIA - Piedade SHS – Março/2007, Pág.68
3. 9.2 AI and ADAE Diagnosis
The Constitution of the State of Minas Gerais, Title IV, Chapter I, Section IV, Article 208 (MINASGERAIS, CONSTITUTION, 1989) defines natural heritage within cultural heritage, as follows:
"The cultural heritage of Minas comprises the material and nonmaterial natural assets, jointly orindividually, which make a reference to the identity, actions and memory of different groups forming StatesSociety, which include: ...
...V - urban areas and sites of historical, natural beauty, artistic, archaeological, spelean, palaeontological,ecological and scientific value”
According to UNESCO (1997) "Natural Heritage refers to the physical, biological or geological formationswhich are considered exceptional, threatened animal and vegetable habitats and areas with scientific,conservation or aesthetic value."
Monte Alegre de Minas has great potential for tourism with innumerable waterfalls and watercourses whichcan be used for rappel and rafting.
Furthermore, according to the employee Francinete, the town hall intends to implement the "Heads andMemories Project of Monte Alegre de Minas” which aims to protect local heritage by protecting historicaland architectural assets on farms in the municipal region and at the same time implementer tourism toleverage natural resources in Monte Alegre de Minas.
The City Hall has a leisure area known as the Historic Monument to the Lake Heroes where there is amausoleum and the reservoirs used for bathing by the local population. The location has infrastructures suchas benches, tables and mains/women's toilets, and inoperative bar, gym football pitch and car park.
Photo 3.40 Historic Monument to the Laguna Heroes Photo 3.41 Mausoleum containing the mortal remains ofsoldiers killed in the Laguna battle

Revisão do Estudo de Impacto Ambiental – EIA - Piedade SHS – Março/2007, Pág.69
Photo 3.42 Reservoirs used by the local population forleisure purposes located within the Monument area
Photo 3.43 Infrastructure on the banks of the reservoirswithin the Monument area
Photo 3.44 Football pitch Photo 3.45 Car park within the Monument area
The Babilônia river, which flows into the Tijuco river, passes through the Monte Alegre municipal region insoutheast and north-west direction and its main natural attractions are the waterfalls at Usina Velha, theBabilônia Bar and a beach area.
The beach area is around 10 km from the city and is often used by the local population, especially on warmdays. This is a very shallow stretch of the Babilônia River with a weak current and no visible sources ofpollution.

Revisão do Estudo de Impacto Ambiental – EIA - Piedade SHS – Março/2007, Pág. 70
Photo 3.46 Baber's car is parked close to the right bank ofthe Babilônia river
Photo 3.47 Small beach, located on the Babilônia river, usedfor leisure purposes by the local population
The Usina Velha waterfall is located on the Babilônia farm, owned by Mr. Carlitão, and was given its namebecause of the ruins of the old factory that used to stand there. Because it is on private land it is not used bythe city population for leisure activities and according to the owner it is only used infrequently for fishing,because bathing is dangerous based on the depth of the river at this point.
Photo 3.48 Usina Velha waterfall located on the BabilôniaRiver
Photo 3.49 Ruins of the former factory, on the Babilôniafarm, on the right bank downstream from the waterfall ofthe same name.
The Pouso Alegre stream, on the boundary between a municipal regions of Monte Alegre de Minas andTupaciguara, is where we find the Cachoeira dos Costas or Cachoeirinha. Around 35 km from the city ofMonte Alegre de Minas, the waterfall is well known by the local population There is a beach on the left-hand side and a hydrometeorological station run by ANA.

Revisão do Estudo de Impacto Ambiental – EIA - Piedade SHS – Março/2007, Pág. 71
Photo 3.50 CACHOEIRA DOS COSTAS OR CACHOEIRINHA,located on the upper course of the Piedade river, on the boundary between a
municipal regions of MONTE ALEGRE DE MINAS and TUPACIGUARA.
Photo 3.51 Hydrometeorological station operated by ANA,located on the upper course of the Piedade river, downstream
from the Costas waterfall or Cachoeirinha.
The other waterfalls identified, located and registered were on property belonging to Messrs. José Roberto,Ciro, Nogueira and Vasco; in addition to the Lobo and Onça waterfalls all on private property.
Photo 3.52 CACHOEIRA DA SANGRA, located on the property of
Mr. JOSÉ ROBERTO BASÍLIO.Photo 3.53 CACHOEIRA DO VASCO located in the property of Mr.VASCO, on the TIJUCO river, dividing the Municipal regions of MONTE
ALEGRE DE MINAS and PRATA.

Revisão do Estudo de Impacto Ambiental – EIA - Piedade SHS – Março/2007, Pág. 72
Photo 3.54 Waterfall located on the Lobo stream Photo 3.55 Waterfall located on the property of Mr. CIRO,on the PÂNTANO stream.
Photo 3.56 Waterfall located on the Onça stream Photo 3.57 Waterfall located on the property of Mr.NOGUEIRA.
The Sangra waterfall, located on the Babilônia river, on a farm belonging to Mr. José Roberto Basílio, hasoften been used for bathing by the people living on the property and the local population. According toreports from the housekeeper, Mrs. Juliana, the pool which was previously used for bathing has sunk andhas caused whirlpools, making the place extremely dangerous for bathing.
The Vasco waterfall is located on the Cachoeira farm, on the Tijuco river at the border between the MonteAlegre de Minas and Prata municipal regions. As it is around 45 km from the city, and difficult to access, itis not used by the local population, only by the people who live on the farm who make sporadic use of it.

Revisão do Estudo de Impacto Ambiental – EIA - Piedade SHS – Março/2007, Pág. 73
The waterfall on the Pantano stream, owned by Mr. Ciro, is not often used by the owner and people living onthe farm for leisure activities. There is a barbecue area, with some wooden and cement benches as well as awooden table. According to reports from the housekeeper, third parties appear sporadically on the farm touse the waterfall
The waterfalls on the Lobo and Pantano stream is owned by Dr Nogueira are difficult to access and are notused by people living there or the local population for leisure activities.
The ADA identified and registered five waterfalls which will be affected by the project, three located in thereservoir and 2 on the low flow section.
The waterfalls in the reservoirs are located on the Piedade river and on the unnamed and Boa Vista streams,which feed into the right-hand bank of the Piedade river. These waterfalls are within the normal, forecastN.A. (650 m elevation) and will disappear when the reservoir is formed.
As the located on private property they are not used for leisure activities, even by their owners, because ofdifficult access, the absence of a pool for bathing and in the case of the Erson Waterfall located on thePiedade river, the rocky outcrops as well as the strong currents make bathing impossible.
Photo 3.58 Waterfall located on the Boa Vista stream,which feeds into the right-hand side of the Piedade
river.
Photo 3.59 Waterfall located on the unnamed stream,which feeds into the right-hand side of the Piedade
river.

Revisão do Estudo de Impacto Ambiental – EIA - Piedade SHS – Março/2007, Pág. 74
Photo 3.60 Waterfall located on the Piedade river,known as Erson Waterfall.
Photo 3.61 Details of the falls at the Erson Waterfall onthe Piedade river.
At the Erson waterfall, the only leisure activity reported was fishing, carried out sporadically by the ownerand third parties.
On the low flow section, we registered the current characteristics of the waterfalls on the area owned byFrancisco Carlos Vieira and the waterfall known as Usina Velha and Guimarães, located on property ownedby Mr. Roosevelt Guimarães. These waterfalls will not be submerged, but there are flows will be reduced,mainly in the dry season.
Photo 3.62. Waterfall located on the Piedade river on theproperty of Mr. FRANCISCO CARLOS VIEIRA, on the lowflow section
Photo 3.63 Usina Velha or Guimarães waterfall located on thePiedade river on the property of Mr. ROOSEVELTGUIMARÃES JR, on the low flow section

Revisão do Estudo de Impacto Ambiental – EIA - Piedade SHS – Março/2007, Pág. 75
On the left-hand bank we identified around 4 springs which will be submerged by the lake created by thePiedade SHS. The sprinter located on the property owned by Mr. João Vicente de Vasconcelos.
Photo 3.64 One of the springs which will be submerged by the future reservoir,located on the left bank of the Piedade River, on the property of Mr. João Vicente
de Vasconcelos.
Drawing PIE-PTN-001 is attached with the location of the waterfalls.
3.9.3. ARCHEOLOGICAL HERITAGE
INTRODUCTION
This report intended to carry out a new archaeological survey of the areas which will be affected byconstruction of the Piedade Small Hydroelectric Power Station. The Piedade SHS is located in the municipalregion of Monte Alegre de Minas, in Minas Gerais.
Because of geological issues related to rock fragmentation under the surface of the water channel location,the entire project had to be altered. A new dam and a new water channel will have to be built on another partof the Piedade river valley. The new dam will be built upstream from the previous dam and the easement forthe new water channel, also on the right-hand side of the Piedade river, will be further from the riverbankthan the previously planned channel. This additional distance from the riverbank substantially reducespossible effects on archaeological sites, however the depletion area of the new dam is much wider than theprevious one and in this case, the occurrence of sites is much more likely. Therefore, a new archaeologicalstudy is required because the region is rich in archaeological artifacts and sites.
The new dam's flood area is much larger than the previous one because of local topography. The previousdam would hold back the waters in a section where the valley is more restricted, however by altering theproject location, the new dam will flood a much larger area, because the topography of the land along thebanks of the Piedade river is much flatter and the gradients are much lower.

Revisão do Estudo de Impacto Ambiental – EIA - Piedade SHS – Março/2007, Pág. 76
LEGAL ASPECTS AND GROUNDS
Brazilian legislation establishing the criteria, procedures and authority for archaeological diagnostic,survey, prospecting and protection stages involves several laws, constitutional articles, resolutions anddirectives. Below we will present only those which refer specifically to cultural and archaeological heritageas required to produce an EIA-RIMA.
The Federal Constitution of October 5, 1998 establishes the concepts of cultural heritage and the need topreserve it in articles 215 and 216, reproduced in part below:
Article 216. The cultural heritage of Brazil comprises the material and nonmaterial natural assets, jointlyor individually, which make reference to the identity, actions and memory of different groups formingBrazilian Society, which include:I - forms of expression; II - methods of creating, doing and living; III - scientific, artistic andtechnological creation; IV - works, objects, documents, buildings and other spaces for artistic andcultural manifestations; V - urban areas and sites of historic, natural beauty, artistic, archaeological,palaeontological, ecological and scientific value.
Law number 3924, dated July 26, 1961, states that all types of archaeological vestige (sites, the remains ofcultural material, structures altering the landscape) which represent testimony of past cultures in Brazil areconsidered heritage sites and are therefore subject to protection.
Environmental evaluations were created in Brazil in law 6398 dated September 31, 1981, which governsNational Environmental Policy and created the National Environmental Council (CONAMA). Thisorganization was created with the specific purpose of establishing regulations, criteria and conduct whenlicensing activities with an effective or potential impact, determining surveys of environmentalconsequences and alternatives to protect such areas.
The inclusion of an archaeologist in environmental evaluation works was required as of Resolution number001, issued by CONAMA and signed on February 23rd 1986; it states that archaeological sites must beevaluated alongside subsequent recommendation of mitigating and/or offsetting measures to balance thenegative impacts on archaeological heritage.
IPHAN directive number 230, dated December 17, 2002, defines the environmental licensing procedures,detailing the archaeological research stages: Prospecting, protecting, laboratory, preparing and filing reportson projects that could possibly affect archaeological heritage, as partially reproduced below:
Prior a licensing phase (EIA/RIMA)Article 1 - in this phase, archaeological and no historical contextualization must be conducted in the area influenced bythe project, based on an exhaustive study of secondary data and on-site archaeological survey.Article 2 - when relating to projects affecting areas which are archaeologically unexplored or not very well-known,which failed to provide any inference regarding the effects of the project, and on-site archaeological survey must beconducted covering at least the area of direct influence. The survey shall include all of the significant environmentalcompartments within the general context of the area to be affected and shall include a prospecting survey beneath thesurface.I - the final and expected result is a report characterizing and evaluating the current situation of architectural heritagein the area studied, which will be named a Diagnosis.Article 3 - evaluation of projects impacts on the regional archaeological heritage will be carried out based on a detaileddiagnosis, analysis of thematic environmental charts (including geology, geomorphology, hydrographics, declivity and
vegetation) and on the technical details of the works. Article 4 - based on the diagnosis and evaluation of the impact, the

Revisão do Estudo de Impacto Ambiental – EIA - Piedade SHS – Março/2007, Pág. 77
Prospecting and Protection Programs will be drawn up and aligned with the works timetable and the environmentallicensing faces for the project in order to ensure the integrity of cultural heritage in the area.
Therefore, any project which has an direct or indirect impact on cultural (archaeological) assets must bepreceded by an archaeological survey and, if required, subsequent protection of such assets. In this specificcase, the archaeological survey aims to complement the Environmental Impact Study (EIA) for the area inquestion.
OBJECTIVES
The objectives of this report are split into three topics: Locate and describe the archaeological sites and events which appear within the area directly
affected by the new reservoirs and water channel for Piedade SHS.
Identify the importance and conservation of archaeological sites and events which may be found.
Propose recommendations to protect or save them, as required.
METHODOLOGICAL PROCEDURES
In order to conduct an archaeological diagnosis of the area in question, we have defined the followingmethodology:
A survey of bibliographic sources available for the region, especially archaeological surveys thathave already been carried out; the surveys in item 5 prehistoric history of the region.
An oral survey, when possible, based on interviews with people who know the area in order togain information on archaeological traces and/or sites and their possible location. Nobody foundduring the process was able to tell us of any sites in the directly affected area. In fact,observation of sites with chipped stone remains, such as those found in the previous survey, isnot obvious to the lay person.
Systematic survey: a survey on foot of the entire directly affected area, based on cartographicdocuments, locating appropriate areas for human occupation and observing the presence ofarchaeological material on the surface. This survey is carried out using maps, GPS (GlobalPositioning System) digital camera and a notebook. When travelling through the area, specialattention was given to locations where the surface is exposed, providing a better view ofarchaeological material, mainly in eroded areas.
PREHISTORIC PERIOD IN THE REGION
Archaeological surveys began in the Paranaiba river basin in the Minas Triangle, in 1980 withthe Projeto Quebra Anzol (Broken Hook project). This project, developed by researchers from theEthnology and Archaeology Museum from the University of São Paulo, was based on a program ofprospecting and systematic excavation which resulted in the excavation of six archaeological sites. The sitesare on hillsides and a plateau, with rivers and streams at their bases (Alves, 1992).

Revisão do Estudo de Impacto Ambiental – EIA - Piedade SHS – Março/2007, Pág. 78
Important discoveries were made in the valley of the Piedade river, close to the mouth on the Paranaibariver, on the Rezende farm, 3 km from the city of Centralina/MG. At the site, Alves (1992) identified variousarchaeological structures, including: spots in the soil referring to the floors of prehistoric dwellings,concentrations of stone artifacts, concentrations of ceramic fragments, fires and director burials. This siteprovided important dates which helped assemble a timeline of human prehistoric occupation of the Piedaderiver valley.
Table 3.3Dating the Resende archaeological site:
Z o n a Fogueira Profundidade (cm ) D a ta (A P ) Laboratório
5 S1 ---- 1190 +- 60 CENA*
1 1 90/100 4250 +- 50 Gif.-sur-Yvette**
1 2 110/120 4950 +- 70 CENA
2 1 85 5620 +- 70 CENA
2 3 95 6110 +- 70 CENA
2 2 100/105 6950 +- 80 CENA
2 4 125/130 7300 +- 80 CENA
* Centre for Nuclear Energy in Agriculture/University of SãoPaulo ** Laboratoire de Faibles Radioactivités/Gif-sur-Yvette
According to Alves (1992:37) the Rezende site was occupied by the first human groups arriving in theMinas Triangle region more than 7000 years ago. The remains from these groups are chipped stone tools,such as arrowheads, scrapers and borers, as well as fires used to prepare food. These groups remained in theregion for various millennia, with no significant changes to their social and economic organization.
From the VIII century of Christian era, the region was subject to transformations that completely changedthe daily lives of the groups of humans living there. Ceramic production began and everything indicates thishappened alongside horticulture (Alves 2000). New artifacts appear for processing plants that can becultivated, made of basalt rock and produced by polishing, resulting in tools that resisted the laborious andrepetitive work of chopping down forests, grindstones and mortars to grind grain, mud is used to makeceramic spindles to spin cotton as well as vessels to cook vegetables such as corn and beans. There is asubstantial growth in population which is reflected in the large number of sites which have been identified asbeing formed by these populations, called ceramic horticulturalists.
The historical data reveals that the region comprising the “lower Tietê river, towards Mato Gross andGoiás”, in other words including the current Minas Triangle, was known by explorers as the "region of thebilreiros or caiapós" (Taunay 1975). There are innumerable references indicating that the Triangle was anarea of influence for the Kayapó do Sul groups. In 1817, Spix (1981:212) mentions the presence of isolatedand rebel Kayapós "bands" in the western part of the province of Minas “ on the other side of the SanFrancisco River". According to Ribeiro (1996:87) “Caiapônia”, the Kayapó do Sul land, belonging to thelinguistic family Jê, corresponds to the entire territory currently encompassing southern Goiás, southeastMato Grosso, the Minas Triangle and northeastern Sao Paulo.

Revisão do Estudo de Impacto Ambiental – EIA - Piedade SHS – Março/2007, Pág. 79
The Triangle region was travelled by explorers coming from the south from the 17th century. The firstdocumented expedition which probably came through the current Triangle territory was the Pero Dominguesexpedition which, in 1613, left Sao Paulo and arrived at the confluence of the rivers Araguaia and Tocantins.Various other explorers followed them. After gold was discovered in Goiás in the 18th century, the regionbecame a mandatory route for miners and cattle drivers, increasing pressure on local indigenous groups.
Gradually, despite all of their efforts, the Kayapós lost territory, initially to the explorers who went into thebackwards in search of slaves in gold and then in the 19th century, to farming expansion in Minas Geraisand São Paulo. Territorial expansion initially began in the current district of Sacramento (Desemboque)located to the south of Araxá. This was the starting point for expeditions which discovered the entire extentof the Farinha Podre (Barbosa, 1971:160-162) jungle. In 1816 this entire region became part of Minas Geraisinstead of Goiás following an order issued by D. João, following interference from the inhabitants in SãoDomingos do Araxá (Barbosa, 1971:523-526). In the 19th century, the Kayapós were prisoners and intruderson what had been their ancestors land. Their decline culminated in the 20th century when the last grouprecorded included a little over 30 survivors residing along the banks of the Rio Grande in SaltoVermelho/SP.
The history of Monte Alegre de Minas is linked to the expeditionary routes which explored the MinasTriangle giving rise to various population centers from which cities like Araxá, Uberaba, Prata and othersgrew. In Prata, the São Francisco das Chagas de Monte Alegre settlement appeared. It was emancipated in1880 and then changed its name to Toribatê. The current name was given in 1948.
The occurrence of this settlement occurred when a large local family, led by Martins Pereira, moved to theregion to take possession of unoccupied land in Goiás, at the beginning of the 19th century. Travelling in acaravan, one of the group became seriously ill, forcing a stopover lasting several months where the city ofMonte Alegre currently stands. Because of the lack of medicine, the group's leader, a worshipper of SãoFrancisco das Chagas, promised the construction of the chapel. Once the cure was granted, they decided tostay there until the promise had been fulfilled.
Other adventurers arrived and end up building simple farms close to the rivers with good quality water, asdid the Martins Pereira family. After building the São Francisco das Chagas chapel, its name was used inconnection with the São Francisco das Chagas market.
The families living there married their children to one another and the village group. Until the ParaguayanWar and the Laguna Retreat affected the inhabitants in this region, when a column of the Brazilian armyarrived to recruit young men to reinforce the National Volunteers in 1865.
After returning from the battles, the heroes of the Laguna company returns to the region of Prata and MonteAlegre, reoccupying the area.

Revisão do Estudo de Impacto Ambiental – EIA - Piedade SHS – Março/2007, Pág. 80
SYSTEMATIC SURVEY
Below, we will present to the waypoints in the archaeological survey and the result obtained and then presentthese points in a table with their respective coordinates.
The on-site portion was carried out in the month of March when two areas related to the Piedade SHS wereinspected:
The area that will be covered by the reservoir of water, covering both sides of the riverside areas.Both sides could be accessed from the bridge over the River Piedade, going downstream.
The area where the water channel will be built.
Two on-site teams were mobilized for this project, comprising an archaeologist and a few assistants in eachteam.
Photo 3.65 Member of the team next to a stake showing the depletion boundary (left); view of the pineapple plantation on theopposite side of the river (right).
During the itinerary, various archaeological sites were identified in the directly affected area of the project.The ADA is considered the areas which will be flooded by the dam and the new transect where the newwater channel will pass through. Archaeological sites and occurrences located outside these areas fall withinthe surrounding area (AE) of the development.
Archaeological traces found were marked with flanks to identify locations with the greatest concentration ofsites and facilitate observation from the photographs.
15 sites were identified in the directly affected area and all of them have similar characteristics. They areStone Age sites of pre-ceramic groups occupying the region almost always located next to rocky outcrops.The raw material is mainly comprised of brown and grey blue silicified sandstone however we alsoencountered flint, chalcedony and hyaline quartz. Most of the stone material found includes chips, cores andreworked artifacts. All of the sites are close to the banks of the River Piedade, and the main differencesbetween the topographic variations, the quantity of material found in the variations in the proportion of rawmaterial.

Revisão do Estudo de Impacto Ambiental – EIA - Piedade SHS – Março/2007, Pág. 81
The flaking technology is very similar and a variety of types of flaking are related to the different quality ofraw material. Groups of hunter gatherers chose these locations for their stonework because raw material waspresent. In other words, the rocky outcrops were used as deposits and the local areas for testing the flaking.Two of the sites also contain the presence of physical structures in the ruins of farms and traces of ceramic,glass and iron objects, related to the historical occupation of the region.
Right Bank – ADA – Depletion Area
1 – Island Site
Stone Age Site
Coordinates UTM 22K 0713761 \ 7931354
Photo 3.66 Few of the site on the right bank of the River Piedade (top right), remains identified as flanks located in a smalldrainage ditch (top left) brown sandstone core (lower right), and chips of blue sandstone (lower left).
The Island Site is located on the right bank of the River Piedade, upstream from the new dam and around 150m from the bridge with a highway crosses the river. The topography has a slight gradient towards the riverand the archaeological material is in a swathe less than 15 m from the current bank. Around 5 m from theriver bank, there is a steep bank approximately 90 cm high,

Revisão do Estudo de Impacto Ambiental – EIA - Piedade SHS – Março/2007, Pág. 82
a result of the seasonal water level variation. The erosion caused by the river Piedade on the embankment isbroadly evidence of underground archaeological remains. The Island site is around 10 m in diameter.
Vegetation is low-lying and not dense, mainly grasses and small shrubs. No riparian forest was found in thissection. The sediment is exposed over most of the site, which made it easier to find the remains. The StoneAge remains were found in the section where the small drainage ditch feet into the River Piedade. The samedrainage ditch has a rocky outcrop which was probably used as raw material by the hunter gatherer groups topractice their stone chipping techniques.
The site has Stone Age remains on the surface, but in no greater density. Some stone chips and one core wereidentified in the area. The raw material observed on the site is silicified sandstone which is brown and greyblue in color. The entire site will be submerged by the SHS.
2 – Barranquinho Site
Stone Age Site
Coordinates UTM 22K 0713596 \ 7931368
Photo 3.67 Remains marked with flags (top left); view of the site on the banks of the Piedade river (topright), sandstone chips (below).

Revisão do Estudo de Impacto Ambiental – EIA - Piedade SHS – Março/2007, Pág. 83
The Barranquinho site is located 170 meters from the island site and as no material was found between them,it was deemed to be a new archaeological site. However, prospecting work under the surface andarchaeological protection could accurately identify their boundaries or any connection between them.
This site is very close to the water and has similar characteristics to the Island. The topography presents asmooth incline and the river has eroded the embankment. This is a rocky outcrop and some remains aredeposited on it.The vegetation is comprised of grasses and shrubs. At the location of the remains there is an interruption inthe riparian forest, the river probably removed the overhanging forest as it eroded the bank.The Barranquinho site is about 10 meters in diameter, but holds more material than the Island site. However,the density of visible archaeological material is also low. We found chips and cores of brown and blue-greysandstone. The entire site is in the depletion area.
3 - Queda d´água Site
Stone Age Site
Coordinates UTM 22K 0713407 \ 7931595
Photo 3.68 View of the site with the waterfall in the background (top left), remains marked with flags (top right), chipped,semi-buried sandstone (bottom left), fragments of plano-convex artifact (lower right);

Revisão do Estudo de Impacto Ambiental – EIA - Piedade SHS – Março/2007, Pág. 84
This is a Stone Age site close to the right bank next to the largest waterfall observed in the area affected bythe project along the Piedade river. This site is located in an almost flat area close to the bank, from wherewe see an abrupt incline. The Queda D’Água site has a radius of approximately 20 meters where we seearchaeological material on the surface.
The vegetation is comprised of grasses and along the bank there is an overhanging forest. Where thesediment was exposed, we could see chips and cores of silicified brown and blue sandstone as well as afragment of a plano-convex artifact. The archaeological artifacts were found inside and outside the ADA.The density of archaeological artifacts is low, not exceeding 60 items.
The Queda DÁgua site also has a rocky outcrop with the presence of basalt and brown sandstone blocks.
Most of the site (80%) will be submerged and the remainder will be located on the side of the dam lake.
4 – Linha d´água Site
Stone Age Site
Coordinates UTM 22K 0713353 \ 7931831

Revisão do Estudo de Impacto Ambiental – EIA - Piedade SHS – Março/2007, Pág. 85
Photo 3.69 Location of the site with visible remains where the sediment is exposed (top left), concentration of remainsidentified by flags (top right), plano-convex artifacts known as slugs (below).
The Linha D’Agua site has a large number of archaeological sites dispersed over an area 170 meters long by40 meters wide, parallel to the Piedade river. Some points have a greater material concentration, especially atthe extremities. Remains are found from the river bank up to the steep hillside. Site topography is varied, atsome points the hillside is abrupt and at others it is less steep.
Vegetation is comprised of grasses and small shrubs and at some points, riparian forest can be seen, withvariable thickness.
The remains found were dozens of chips, some reworked, cores and four plano-convex instruments. A brownsandstone outcrop can be seen and around it waste chips. A large chip showed signs of chipping for a perfectfit with the brown sandstone block which was semi-buried, confirming its origin. The raw material observedon the site is silicified sandstone which is brown and grey blue in color.

Revisão do Estudo de Impacto Ambiental – EIA - Piedade SHS – Março/2007, Pág. 86
The site presents a wide variety of archaeological remains, especially finished artifacts known as plano-convex. Most of the site will be flooded by the new SHS waters and only a small part (less than 10%) willremain above water.
5 – Morrote Site
Stone Age Site
Coordinates UTM 22K 0712666 \ 7931721
Photo 3.70 View of the site left of the hill in the center of the image (top left), archaeological remains identified (top right),chalcedony chip (bottom left) and silicified sandstone chip (bottom right).
This site is in the river lowland, alongside a meander and a small rocky, oval hill. The vegetation iscomprised of grasses and some mid-size trees. This site is on a rocky outcrop where we can find basalt andsandstone.
This site is small, around 20 meters in diameter, with average density of archaeological material.

Revisão do Estudo de Impacto Ambiental – EIA - Piedade SHS – Março/2007, Pág. 87
The remains are chips and cores, raw material is brown and grey-blue silicified sandstone and chalcedony.
The Morrote site will be completely destroyed by the reservoir. 6 – MeanderSite
Stone Age Site
Coordinates UTM 22K 0711973 \ 7931447
Photo 3.71 Concentration of visible material where there is no low-lying vegetation (top left), archaeological material rolledand polished, amidst accumulated pebbles, next to waterfall (top right), sandstone chip (bottom left) and reworked artifact(lower right).
The site has a high density of archaeological material dispersed over an area of 150 meters following theriver, varying in width by up to 15 meters from the bank.Topography is varied, from almost flat lowland to a hillside of average gradient. Vegetation also variesbetween grasses and riparian forest. The site also presents rocky outcrops of basalt and sandstone and it is inthe outcrop areas the most remains can be found.

Revisão do Estudo de Impacto Ambiental – EIA - Piedade SHS – Março/2007, Pág. 88
The remains are located in denser and more disperse concentrations. There is a high volume of material andhundreds of chips, cores and reworked artifacts.
There was a concentration of chips and artifacts deposited on a pile of pebbles on the river bank, alongside awaterfall; some of these remains showed marks of abrasion. In other words, positive and negative marks ofchipping and retouching were polished by the action of the river water. The raw material used to make theinstruments is silicified sandstone in brown, blue-grey and green.
The site will be completely destroyed by the development.
7 – Canindé Site
Stone Age Site
Coordinates UTM 22K 0710656 \ 7932447
Photo 3.72 Material dispersion on the site (left), silicified sandstone chip (right).
A small site, around 15 meters in diameter, located in the middle of a mid-gradient slope. It is more than 150meters from the river and vegetation is low-lying, with grasses and pasture.
Over 20 brown, silicified sandstone chips were found and a white chalcedony chip. The material wasconcentrated and found in exposed sediment amongst the vegetation. Archaeological material density is lowand no more than 50 items, however it will be completely covered by the water line.

Revisão do Estudo de Impacto Ambiental – EIA - Piedade SHS – Março/2007, Pág. 89
Left Bank – ADA – Depletion Area
8 – Ficus Site
Historical Stone Age site
Coordinates UTM 22K 0713700 \ 7931171
Photo 3.73 Few of the site where we can see a line of coconut trees (top left), historical remains with ceramic and brick(top right), concentration of Stone Age material on the banks above a rocky outcrop (bottom left) and a reworked artifactof green silicified sandstone (bottom right).
The site has two distinct areas which shall widely separated in terms of chronology. The first period ischaracterized by a series of reoccupation despite pre-ceramic groups who left a great quantity of Stone Ageremains in the second period is identified as a historical occupation that left ruins of physical farm structuresin the remains of everyday objects such as ceramics, glass and iron pans.
The Fícus site is on a hillside with a low gradient and follows the course of the river Piedade. In this area wecan find dry and active drainage ditches. The site is large and was estimated at 400 m long by 70 m widefrom the bank. Vegetation is low-lying with the presence of grasses and pasture, alongside large shrubs andtrees such as the ficus, coconut trees and mango trees. The latter were planted by the occupants of the oldfarm, which can be detected from the alignment of the coconut trees.

Revisão do Estudo de Impacto Ambiental – EIA - Piedade SHS – Março/2007, Pág. 90
which are perpendicular to the river, parallel to the stone structures. Along certain sections we can see thepresence of riparian forest which varies in thickness, and brushwood along certain sections further from theriver.
The historical remains are mainly stone containment walls for flooring and platforms, fragments ofdecorated and decorated ceramics, iron pans, wooden remains used for building, ceramic flooring, bricks,glass; in addition to changes in the landscape such as earthmoving and tree planting. Note that the locationalso housed a large farm with some housing structures and that there was architectural and landscapingplanning.
There are a lot of Stone Age remains located at specific points throughout the area. Hundreds of chips,cores, artifacts, plano-convexes and their raw material was found almost always made of brown, green andgrey blue silicified sandstone. There were also chalcedony chips and cores. Alongside the road parallel tothe river we found an archaeological layer exposed in the embankment, with a large number of blue-greysandstone chips.
Most of the site is not in the depletion area (80%) and only part of it will be submerged. Part of the sitewhich will be destroyed should be excavated on the part outside the water should be protected.
9 – Carneiro Site
Historical and Stone Age site.
Coordinates UTM 22K 0713324 \ 7931612

Revisão do Estudo de Impacto Ambiental – EIA - Piedade SHS – Março/2007, Pág. 91
Photo 3.74 View of the historical wall close to the canal where the water activated the flywheel (top left), detail of the ironflywheel for pumping water (top right), concentration of Stone Age remains in the middle of a basalt outcrop (bottom left),plano-convex instrument (bottom right).
The Carneiro site was also occupied during two different periods: first by hunter gatherers and thenthousands of years later, by historical occupants.
The site is about 200 m long by 80 m wide. Its topography presents an abrupt incline close to the waterfallwhich becomes flat as it moves away from river and in the downstream direction, the same incline presents adecreasing gradient.
The historical site presents ruins of housing which are located in the AE, however the water channel toactivate the iron flywheel and all the support structure, such as walls and wooden beams, will be in theflooded area.
The Stone Age site has many cores and chips, some reworked instruments and a plano-convex artifact. Theraw material is silicified sandstone of various colors and chalcedony. The site has a basalt block outcrop andit is at this point that more Stone Age remains are found. The site has an average density of archaeologicalmaterial and almost all of it (90%) is below the waterline, the remainder (10%) will be within the area isflooded by the dam lake.

Revisão do Estudo de Impacto Ambiental – EIA - Piedade SHS – Março/2007, Pág. 92
10 – Pedra Verde Site
Ceramic-Stone Age site
Coordinates UTM 22K 0712489 \ 7931487
Photo 3.75 Concentration of material in a drainage ditch with the river Piedade in the background (top left), and decoratedceramic remains (top right), reworked artifact in green silicified sandstone (bottom left), chips of brown sandstone and whitechalcedony (bottom right).
The Pedra Vale site is around 90 m long by 20 m wide, following the course of the river. Its topography hasan average gradient which becomes steeper as it follows the river downstream. Visitation is overhangingforest which, at some point, joins the brushwood; only at the beginning of the site, in the eastern section, canwe see low-lying vegetation and the slope with a low gradient. Ceramic remains were found at this point.
The Stone Age remains are mainly located at two points at either end of the site. Both were revealed by theaction of water in drainage ditches. The downstream concentration is located alongside an outcrop of greenrock, including silicified sandstone and flint, showing that the deposit was used for flaking the raw materialBetween these two concentrations are Stone Age remains visible in the embankment, even in the steepergradient. We found cores, chips and some reworked items. The raw material used was sandstone,

Revisão do Estudo de Impacto Ambiental – EIA - Piedade SHS – Março/2007, Pág. 93
and flint.
Near the upstream concentration of Stone Age remains we found fragments of undecorated ceramicapparently coming from the same recipient. These remains indicate the presence or subsequent passage ofceramic groups, however the small volume of fragments makes it difficult to reach a conclusion.
The site will be completely submerged by the development.
11 – Pineapple Site
Stone Age Site
Coordinates 22K 0711784 \ 7932147
Photo 3.76 Expose Stone Age remains exposed on the contour line in the middle of the pineapple farm (left), plano-convexinstrument made of silicified sandstone (right).
This site is located 20 m from the left bank of the River Piedade on a pineapple plantation. The topographyhas a slight gradient towards the river. The contour line, where the land is exposed, we found evidence ofsilicified sandstone chips, a plano-convex tool and a fragment of ceramic.
The density of archaeological material is slow and is probably less than 40 objects. Note that the compactingon the site is high because of the fact that land is used for planting, therefore the position of the remains hasprobably been altered. However, the site will be completely destroyed by the development.
12 –Ladeira Site
Stone Age Site
Coordinates UTM 22K 0712391 \ 7931512

Revisão do Estudo de Impacto Ambiental – EIA - Piedade SHS – Março/2007, Pág. 94
Photo 3.77 View of the site in a drainage ditch surrounded by brushwood (left), Chip and reworked artifact made of sandstone(right).
The Stone Age site is located among brushwood, presenting a very steep drainage ditch. The Ladeira site hasan estimated area of 40 m in length by 20 m wide, totaling 800 square meters. The largest concentration ofarchaeological material is 30 m from the left bank of the River where we found chips, cores and reworkedobjects in flint, silicified sandstone and chalcedony in various colors. There is a high density ofarchaeological material on the site will be completely covered by the Piedade SHS.
Water Channel - ADA
13 – Dam Site
Stone Age Site
Coordinates UTM 22 0710032 \ 7932624
Photo 3.78 Sampling hole which showed evidence of archaeological material in the water channel (left), sandstone chip (right).
Stone Age site is located where the new water channel will be built and where the developer made a rectangularexcavation (9 m by 6 m) 7 meters deep. The topography of the land is on average gradient with low-lyingvegetation and occasional

Revisão do Estudo de Impacto Ambiental – EIA - Piedade SHS – Março/2007, Pág. 95
medium-sized shrubs and trees. The hole was made near an access highway and is surrounded by barbedwire fence, properly to avoid cattle accidents.
The material was broadly buried and found because of sedimentary movement while excavating the hole.Please note that the excavation moved the remains out of their original context. They were found in an area10 m around the hole. We identified brown silicified sandstone chips. The site has a low density ofarchaeological material, but is exactly on the transect of the new water channel.
14 – Estrelinha Site
Stone Age Site
Coordinates UTM 22K 0709428 \ 7932063
Photo 3.79 Stone Age remains identified by yellow flags (left), reworked artifacts made of brown sandstone (right).
Stone Age site on the water channel, located on a mid-level gradient with low-lying vegetation includinggrass and pasture. Some medium-sized and large trees are present around the site. The Stone Age remainswere located because of the cattle trail which cleared the surface vegetation. The site is traversed by thewater line and covers an estimated 80 square meters. It is approximately 100 m from the river Piedade.
The remains found mostly sandstone chips, but we also found a silicified grey green sandstone core. The sitehas a low density of archaeological material.
15 – Buraco Seco Site
Stone Age Site
Coordinates UTM 22K 0706522 \ 7934652

Revisão do Estudo de Impacto Ambiental – EIA - Piedade SHS – Março/2007, Pág. 96
Photo 3.80 Stone Age remains identified by yellow flags (left), white translucid chalcedony chip (right).
Site located in brushwood near the drainage ditch. The slope has a low gradient. The site is about 200 msquare, 20 m long and 10 m wide.We identified reworked and unworked chips of silicified sandstone and chalcedony, and some cores of thesame material. The site presents an average density of archaeological material, however the water channelworks will have an impact on this site.
3. 3.9.4 Sites in the Surrounding Area - AE
1 – Cobra Amarelo Site
Ceramic-Stone Age site
Coordinates UTM 22K 0713588 \ 7931449
Photo 3.81 Ceramic remains marked by flanks (left), polished axe blade (right).
Ceramic Stone Age site is located outside of the directly affected area. The slope has a low gradient and iscovered by low-lying vegetation and small shrubs.

Revisão do Estudo de Impacto Ambiental – EIA - Piedade SHS – Março/2007, Pág. 97
The archaeological material was found in an area of approximately 6 m in radius, with some thick ceramicfragments without decoration and a polished axe blade. These remains represents a site occupied by ceramicmakers are produced not only the ceramic fragments but also the polished Stone Age artifacts. The sitelocation is within the pattern chosen by ceramic makers. The area is almost flat, close to the river, but notalong its banks like the pre-ceramic occupants.
The density of archaeological material is slow and this site will not suffer direct impact.Archaeological Occurrences – OA.
Occurrence 1
Coordinates UTM 22K 0712739 \ 7931926
Brown silicified sandstone core
Occurrence 2
Coordinates UTM 22K 0712646 \ 7931828
Brown silicified sandstone chip
Occurrence 3
Coordinates UTM 22K 0712541 \ 7931827
One core and two brown sandstone chips
Occurrence 4
Coordinates UTM 22K 0712285 \ 7931928
Brown sandstone chip
Occurrence 5
Coordinates UTM 22K 0711197 \ 7932515
Sandstone and chalcedony chips
Occurrence 6
Coordinates UTM 22K 0711528 \ 7932360
Two brown silicified sandstone chips
Occurrence 7
Coordinates UTM 22K 0709222 \ 7932845
Sandstone chip
Occurrence 8
White chalcedony chip

Revisão do Estudo de Impacto Ambiental – EIA - Piedade SHS – Março/2007, Pág. 98
Occurrence 9
Coordinates UTM 22K 0708637 \ 7933088
Two sandstone and two chalcedony chips
Occurrence 10
Coordinates UTM 22K 0710968 \ 7932299
Two brown silicified sandstone chips
Occurrence 11
Coordinates UTM 22K 0711576 \ 7932143
Brown sandstone chip
Occurrence 12
Coordinates UTM 22K 0711952 \ 7931656
Sandstone and chalcedony chips
Occurrence 13
Coordinates UTM 22K 0711214 \ 7932165
Grey sandstone chip
Occurrence 14
Coordinates UTM 22K 0706647 \ 7934535
Brown sandstone chip
Occurrence 15
Coordinates UTM 22K 0706368 \ 7934809
Chalcedony chip
Occurrence 16
Coordinates UTM 22K 0705249 \ 7935342
Three brown silicified sandstone chips
3.9.5 CONCLUSION
The Piedade SHS deployment area is very rich in archaeological sites and remains, especially Stone Ageartifacts. Where we find the presence of rocky outcrops in the raw material is good quality for chipping, suchas silicified sandstone, we almost always find archaeological remains.
The large number of archaeological sites and occurrences found suggests that the Piedade river valley wasoccupied and travelled by groups of hunter gatherers who looked for untested raw materials to obtain thetools they needed for their survival, using chipping techniques. 15 archaeological sites were found in theADA and 01 in the AE. However, we should point out that in many areas we were unable to locatearchaeological remains on the surface because of the vegetation,

Revisão do Estudo de Impacto Ambiental – EIA - Piedade SHS – Março/2007, Pág. 99
especially pasture. In these locations, we recommend conducting underground sampling to verify thepresence or absence of archaeological remains (prospecting for underground survey on both banks and onthe new route of the water channel). Underground sampling is also recommended to detect the boundaries ofthe sites horizontally and vertically.
Historical sites are also present, however the level of the development impact on them is lower, becausemost of the physical structures and ruins outside the flooded area.
Excavation of all of the sites in the ADA is very important in order to understand the way of life of huntergatherer groups occupying the region in ancient times.

Revisão do Estudo de Impacto Ambiental – EIA - Piedade SHS – Março/2007, Pág.100
4 SOCIAL AND ECONOMIC ENVIRONMENT4.1 Area of Influence and Surroundings
As highlighted in the document containing Additional Information for the Piedade SHS EIA/RIMA,November 2003, the area of influence adopted for the project is the municipal region of Monte Alegre deMinas and the city’s Surrounding Area.
In this document, would provide information on the city of Monte Alegre de Minas and, when available onthe official websites, this information has been updated.
Monte Alegre de MinasPopulation
Presentation of the population dynamics in Monte Alegre de Minas was based on demographic data for thecity collected by the IBGE between 1991 and 2000, as well as estimates calculate by the Institute for 2006.
According to census data from the IBGE, presented in table 4.1, between 1991 and 2000, population in themunicipal region of Monte Alegre de Minas remained practically stable, adding only 87 inhabitants, whichrepresents an average annual growth rate of 0.06%. The urban population in this period grew 0.77% perannum, while rural population decreased at 0.01% per annum.
Table 4.1Population evolution– 1991, 2000, 2006*
1991 2000 2006Location
Total Urban Rural Total Urban Rural TotalMonte Alegre de Minas 17,919 11,819 6,100 18,006 12,673 5,333 18,070Minas Gerais 15,731,961 11,766,538 3,955,423 17,891,494 14,671,828 3,219,666 19,237,450
Source: IBGE. Demographic census 2000. Estimate for 2006 (up to July 1).* The difference between rural and urban for the year 2006 is not available. The information is an estimate.
In 2000, the municipal population represented 0.10% of the population in the state and, in 2006, 0 .09%. In
light of this, we can see that the municipal region of Monte Alegre de Minas has stagnated in terms of the
number of inhabitants with virtually zero growth in this period (0.84%).
Between 1991 in 2000, the region had a demographic density of around 6.8 inhabitants per square
kilometer, well below the state average. In terms of spatial distribution, there is a prevalence of the urban
population, with urbanization in 1991 of 65.9% and in 2000 70.4%, levels well below the state average in
these two years. Table 4.2 contains this information.Table 4.2
Population Indices, MONTE ALEGRE DE MINAS – 1991/2000Demographic Density (D.D.) Level of Urbanization (LU)Location Area (km2)
1991 2000 1991 2000Monte Alegre de Minas 2.615,1 6,85 6.88 65,9 70,4Minas Gerais 582.586 27,0 30,7 74,8 82,0
Source: IBGE, 1991 and 2000.
Revisão do Estudo de Impacto Ambiental – EIA - Piedade SHS – Março/2007, Pág.101
In terms of population distribution by sex, Table 4.3 shows that in 1991 and in 2000 the male population
was slightly superior in this period, representing, respectively, 51.89% and 51.54% of the total population.
A similar analysis could not be conducted in the 2000/2006 period because the IBGE did not issue forecasts
separated by gender.
Table 4.3Population Distribution by Sex, MONTE ALEGRE DE MINAS – 1991/2000
1991 2000LocationTotal Men Women Total Men Women
Monte Alegre de Minas 17.919 9.298 8.621 18.006 9.281 8.725Minas Gerais 15.731.961 7.803.384 7.939.768 17.891.494 8.851.587 9.039.907
Source: IBGE, 1991 and 2000.
In terms of age distribution, in table 4.6 we can see a significant portion of the population is of working age.
Table 1.2Age Range, MONTE ALEGRE DE MINAS – 1991/2000
1991 2000Nº % Nº %
Less than 15 5.632 31,4 4.826 26,815 to 64 years 11.220 62,6 11.794 65,565 or older 1.067 6,0 1.386 7,7Total 17.919 100 18.006 100Dependency ratio - 59,7 - 52,7
SOURCE: Fundação João Pinheiro, 2000.
In terms of the Economically Active Population (EAP), according to the information presented in table 4.7,
in 2000, farming activities, the basis of the city's economy, absorbed 42.1% of the EAP. Services
represented 33.1% with a significant participation from government administration, according to
information from the City Hall.
Table 1.5Economically Active Population (EAP), MONTE ALEGRE DE MINAS – 1991/2000
EAPIndustriesNº %
Farming, vegetation extraction and fishing 3.208 42,1Industrial 857 11,2Trade 1.036 13,6Services 2.522 33,1TOTAL 7.623 100
Source: IBGE, 2000.
The city also reveals that municipal unemployment is seasonal and, although not want to fight, is low and is
directly related to the main crops of municipal farm products, such as pineapple, soybeans, corn, oranges
and sugarcane.
The City Hall has been deploying it to it is to generate jobs such as the "Income Generation Centre" which is
an incubator for small and medium-size companies, and the Solidarity Project.
Revisão do Estudo de Impacto Ambiental – EIA - Piedade SHS – Março/2007, Pág.102
Additionally, the Municipal Job Commission asked the SINE to set up a unit in the region. In terms of
specialization, courses are mainly offered by EMATER, CDL and the Rural Union.
4.1.1 SOCIAL INFRASTRUCTURE
Housing
Based on the city, we see that in Monte Alegre de Minas there is predominately horizontal, single-family
housing, generally built alongside the roads in the urban centre.
In general terms, the housing is well built, although there is some poorer housing normally belonging to the
lower-income populations. According to the City Hall, no areas have been invaded and there are no slums in
the municipal region which has space for urban expansion.
The City Hall has no official data on the housing deficit, but it has taken action to improve housing by
building bathrooms in houses that don't have them.
Table 1.6 shows the number of private houses in Monte Alegre de Minas according to the period between
1991 and 2000.
Table 1.6Private, permanent homes by location – 1991/2000
1991 2000Location:
No. of homes % No. of homes %Urban 3.138 65,18 3.835 69,93Rural 1.676 34,82 1.649 30,07Total 4.814 100 5.484 100
Source: IBGE, Demographic Census 1991 and 2000.
In terms of the local population dynamics, between 1991 and 2000 we found that the number of homes in a
rural area had fallen and there was a consequent increase in the number of urban homes. However, the
number of rural homes fell by 27 units, in other words 1.6%, while the urbanized section grew 18.2%, or by
697 new dwellings. In light of this, we can see that the rise in the number of homes was greater than the
population growth in this period. Between 1991 and 2000, while population rose the equivalent of 87 new
residents, housing growth was much higher. This therefore means that in Monte Alegre de Minas many
more inhabitants were acquiring their own dwellings.
Table 1.7 shows the population's access to services and durable goods according to the 2000 Demographic
Census.

Revisão do Estudo de Impacto Ambiental – EIA - Piedade SHS – Março/2007, Pág.103
Table 1.7Existence of Services and Durable Goods - 2000
Services and durable goods No. of homes %Trash collection 3,935 71.75Lighting 5,275 96.2Telephone line installed 1,897 34.6Microwave oven 301 5.49Fridge and freezer 4,641 84.62Washing Machine 770 14.04Air conditioning 97 1.77Radio 4,736 86.36Television 4,910 89.54Video cassette 1,096 19.99Computer 193 3.53Car for private use 2,079 37.9Total 5,484 100
Source: IBGE, Demographic Census, 2000.
According to the data, practically the entire municipal population (96.2%) has electrical lighting at home.
Trash collection is not so prevalent, at 71.75%. Furthermore, a significant proportion of the inhabitants in
Monte Alegre de Minas have basic durable goods such as refrigerators or freezers, radios and televisions.
Basic Sanitation
The City Hall is responsible for water supplies. Water is collected from an Artesian well and distributed
without going through the water treatment station, as there is none in the city. According to information
from the City Hall, this supply system meets around 99% of local demand.
In terms of sewage, this is also an area that the City Hall is responsible for. There Is No Effluent Treatment
Station (ETS) in the city and the waste is pumped directly into the water course which runs alongside the
city. The City Hall was unable to estimate the current level of sewage collected by the network.
According to the Demographic Census in 2000, the last census year for which this data is available, water
supply and sewage services in Monte Alegre de Minas are presented in table 1.8.
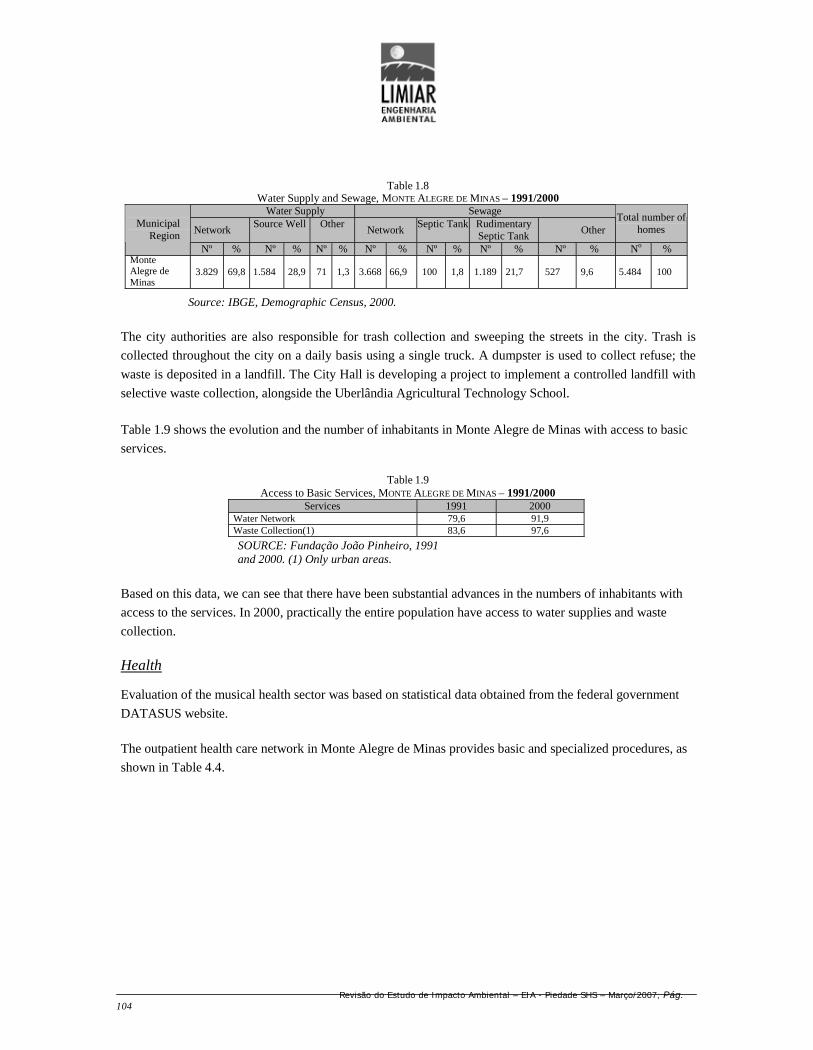
Revisão do Estudo de Impacto Ambiental – EIA - Piedade SHS – Março/2007, Pág.104
Table 1.8Water Supply and Sewage, MONTE ALEGRE DE MINAS – 1991/2000
Water Supply Sewage
NetworkSource Well Other
NetworkSeptic Tank Rudimentary
Septic TankOther
Total number ofhomes
MunicipalRegion
Nº % Nº % Nº % Nº % Nº % Nº % Nº % No %MonteAlegre deMinas
3.829 69,8 1.584 28,9 71 1,3 3.668 66,9 100 1,8 1.189 21,7 527 9,6 5.484 100
Source: IBGE, Demographic Census, 2000.
The city authorities are also responsible for trash collection and sweeping the streets in the city. Trash is
collected throughout the city on a daily basis using a single truck. A dumpster is used to collect refuse; the
waste is deposited in a landfill. The City Hall is developing a project to implement a controlled landfill with
selective waste collection, alongside the Uberlândia Agricultural Technology School.
Table 1.9 shows the evolution and the number of inhabitants in Monte Alegre de Minas with access to basic
services.
Table 1.9Access to Basic Services, MONTE ALEGRE DE MINAS – 1991/2000
Services 1991 2000Water Network 79,6 91,9Waste Collection(1) 83,6 97,6
SOURCE: Fundação João Pinheiro, 1991and 2000. (1) Only urban areas.
Based on this data, we can see that there have been substantial advances in the numbers of inhabitants with
access to the services. In 2000, practically the entire population have access to water supplies and waste
collection.
Health
Evaluation of the musical health sector was based on statistical data obtained from the federal government
DATASUS website.
The outpatient health care network in Monte Alegre de Minas provides basic and specialized procedures, as
shown in Table 4.4.

Revisão do Estudo de Impacto Ambiental – EIA - Piedade SHS – Março/2007, Pág.105
Table 4.4Outpatient Health Care
Number and percentage of procedures - 2005Procedure category Nº %Basic healthcare procedures 129.066 87.2Nursing/other mid-level healthcare 35.561 24.0Basic medical activities 21.374 14.4Basic dental activities 29.604 20.0Actions carried out by others University Level Professional 5.215 3.5Basic sanitation procedures 37.312 25.2Specialized procedures 18.936 12.8Spec. Health. Proc., Oth. Level. Sup. Phys. 4.605 3.1Specialized outpatient surgical procedures 185 0.1Trauma -- orthopedic procedures 8 -Clinical pathology 9.975 6.7X-rays 1.484 1.0Ultrasound 138 0.1Diagnostics 332 0.2Physiotherapy (per session) 2.209 1.5Total 148.002 100
Source: SIA/SUS - 2005
The specialized procedures include physiotherapy sessions, trauma and orthopedics, clinical pathology, x-
ray diagnosis, ultrasound exams, diagnostics, all of which are offered within the Monte Alegre de Minas
healthcare system. More complex cases are sent to the Uberlândia health service which is a reference centre.
According to the National Register of Health Care Establishments, the Monte Alegre de Minas health care
establishments are represented in table 4.5 below
Table 4.5Healthcare establishments - 2003
Description NºHealth center/Basic unit 3Specialized clinic/Specialized outpatient clinic 1Single clinic 5General Hospital 2Polyclinic 1Diagnostic and Therapy support unit 1Mobile Ground unit 1TOTAL 14
Source: DATASUS, 2003.

Revisão do Estudo de Impacto Ambiental – EIA - Piedade SHS – Março/2007, Pág.106
Of the fourteen establishments listed above, 11 belong to the city and 3 are private.
In addition to the physical and human health network in the city, Table 4.6 shows the number of medical
clinics and dental teams available in the city per 10,000 inhabitants.
Table 4.6Medical Clinics and Dental Teams
MONTE ALEGRE DE MINAS - 2003
Type Number: No. per 10,000inhab.
Medical clinics 9 5.0Dental teams 6 3.3
Source: SIA/SUS – 2003
According to the data, there are 9 medical clinics and 6 dental teams in the city. This is equivalent to 5
clinics and 3.3 teams, on average, per 10,000 inhabitants. Healthcare professionals in the city include: 2
pediatricians, 2 gynecologists, 3 general physicians and 1 anesthetist.
In Monte Alegre de Minas, there is only 1 hospital unit, Santa Casa da Misericórida – a philanthropic entity
with just 23 beds, according to Table 4.7.
Table 4.7Number of Hospitals and beds per Specialty
MONTE ALEGRE DE MINAS - 2003beds
Type HospitalsTotal Surgical Obstetric Clinical Chronic/FPT Psychiatric Pediatric
Philanthropic 1 23 3 10 7 1 1 1
Source: SIA/SUS – 2003
The 23 beds in the hospital attend the entire municipal population, which amounts to 1.3 beds per 10,000
inhabitants. This level is much lower than the national average of 2.6 beds per 10,000 inhabitants.
Table 4.8 shows admittances are mainly clinical (41.8%), obstetric (28%) and surgical (25.5%). The longest
average stay (in days) is clinical treatment (3.6 days) as well as deaths related to hospital care exclusively
for this specialty.

Revisão do Estudo de Impacto Ambiental – EIA - Piedade SHS – Março/2007, Pág.107
Table 4.8Number of Admittances, Average Stay, Deaths by Specialty
MONTE ALEGRE DE MINAS - 2005Specialty Admittances % Deaths
Clinical surgery 172 25.5Average stay (days)
1.9-
Obstetrics 189 28.0 1.4 -Health Clinic 282 41.8 3.6 12
Pediatric 32 4.7 2.8 -Total 675 100 2.5 12
Source: SIH/SUS, 2005.
In relation to evolution and appearance of illnesses, especially STDs, Table 4.9 shows the AIDS distribution
in the Monte Alegre de Minas region by age between 2000 and 2005.
Table 4.9Frequency by age by diagnosis year - AIDS
MONTE ALEGRE DE MINAS – 2000-2005Diagnosis age <5 years 13-19 20-24 25-29 30-34 35-39 50-59 60 + Total
2000 0 0 0 1 0 0 0 0 12001 0 0 0 0 0 1 0 0 12002 1 0 0 0 1 0 0 0 22003 0 0 3 0 0 0 1 0 42004 0 1 0 0 0 0 0 0 12005 0 0 0 0 1 1 0 1 3Total 1 1 3 1 2 2 1 1 12
Source: DATASUS, 2006.
According to the foregoing data, we can see a rise in diagnoses over the period except in 2004. 2003 had the
highest level, 4 cases, followed by 2005, registering 3 cases in the municipal region. Note that the age range
most affected by the disease is youngsters between 20 and 24 years of age.
The municipal region is part of the CISAMVAP – Consórcio Intermunicipal de Saúde da Microrregião do
Vale do Paranaíba, founded on August 11 1995 and based in Uberlândia.
According to the information collected, only cases requiring special care are sent to Uberlândia. The
municipal region has 2 ambulances and mobile ICU unit to transport patients.
Between 1991 and 2000, the infant mortality rate fell 8.48%, from 29.92 (per thousand live births) in 1991
to 27.40 (per thousand live births) in 2000, and life expectancy rose 2.58 years from 67.84 years in 1991 to
70.42 in 2000, showing an improvement in local quality of life (Table 4.10 below).

Revisão do Estudo de Impacto Ambiental – EIA - Piedade SHS – Março/2007, Pág.108
Table 4.10Longevity, mortality and fertility indices, 1991 and 2000
Indicators 1991 2000Mortality to 1 year of age (per 1000 live births) 29,9 27,4Life expectancy at birth 67,8 70,4Total Fertility rate (children per woman) 2,9 2,5
SOURCE: Fundação João Pinheiro, 2000.
Table 4.11 shows the level of admittances, mortality rates and deaths per type of disease diagnosed in 2005
in Monte Alegre de Minas,
Table 4.11Admittances, deaths and mortality by type of disease - 2005
CID Chapter Admittances Deaths Mortality RateI. Some infections and parasitic diseases 14 0 0II. Neoplasia (tumors) 108 0 0III. Illnesses of the blood, organs and immune system 31 0 0IV. Nutritional and metabolic nutritional diseases 46 4 8,7VI. Nervous system diseases 2 2 100IX. Circulatory diseases 84 2 2,38X. Respiratory diseases 114 11 9,65XI. Digestive diseases 141 1 0,71XII. Skin and subcutaneous diseases 44 1 2,27XIII. Osteomuscular and joint tissue diseases 7 0 0XIV. Genital and urinary diseases 60 2 3,33XV. Pregnancy, birth and puerperium 426 0 0XV I . Illnesses originating in the perinatal period 39 0 0XVII. Congenital deformity and chromosome anomalies 8 0 0XVIII. Clinical and Laboratory symptoms 134 6 4,48XIX. Poisoning and other external causes 8 0 0Total 1.266 29 -
Source: DATASUS, 2005.
In 2005, 1266 people were admitted mainly for neoplasia (8.53%), respiratory diseases (9%), digestive
diseases (11.13%), abnormal signs and symptoms (10.58%) and mainly pregnancy, birth and puerperium
(33.64%).
Regarding deaths, there were 29 in 2005 and the situation compared with admittances varied little.
Respiratory diseases, second place in admittance in the region, led deaths in 37.93% of cases. Following
this are abnormal signs and symptoms with 20.68% and finally untraditional and metabolic endocrinal
diseases with 13.8%.
Analysis of mortality rates draw attention to the number of deaths in nervous system diseases. In 2005, the
two cases led to two deaths, representing a 100% mortality rate that year. In second place are respiratory
diseases with a 9.65% rate.
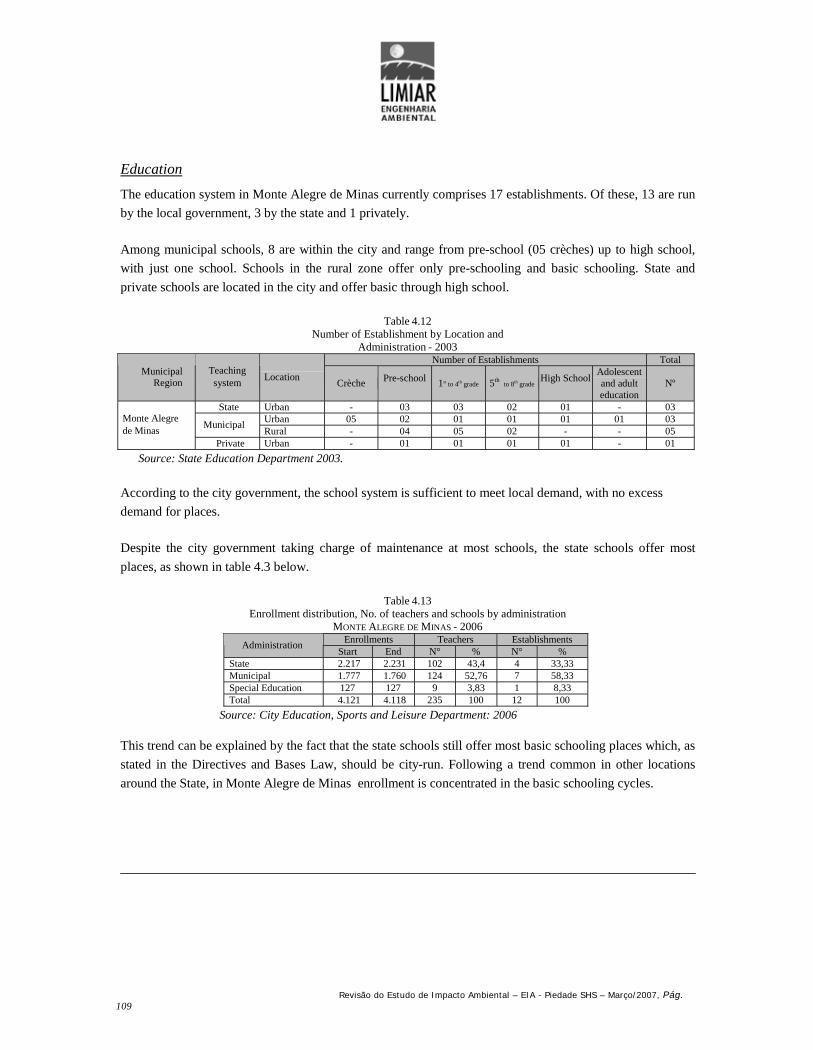
Revisão do Estudo de Impacto Ambiental – EIA - Piedade SHS – Março/2007, Pág.109
Education
The education system in Monte Alegre de Minas currently comprises 17 establishments. Of these, 13 are run
by the local government, 3 by the state and 1 privately.
Among municipal schools, 8 are within the city and range from pre-school (05 crèches) up to high school,
with just one school. Schools in the rural zone offer only pre-schooling and basic schooling. State and
private schools are located in the city and offer basic through high school.
Table 4.12Number of Establishment by Location and
Administration - 2003Number of Establishments Total
MunicipalRegion
Teachingsystem
LocationCrèche Pre-school 1st to 4th grade 5th
to 8th gradeHigh School
Adolescentand adulteducation
Nº
State Urban - 03 03 02 01 - 03Urban 05 02 01 01 01 01 03
MunicipalRural - 04 05 02 - - 05
Monte Alegrede Minas
Private Urban - 01 01 01 01 - 01
Source: State Education Department 2003.
According to the city government, the school system is sufficient to meet local demand, with no excess
demand for places.
Despite the city government taking charge of maintenance at most schools, the state schools offer most
places, as shown in table 4.3 below.
Table 4.13Enrollment distribution, No. of teachers and schools by administration
MONTE ALEGRE DE MINAS - 2006Enrollments Teachers Establishments
AdministrationStart End N° % N° %
State 2.217 2.231 102 43,4 4 33,33Municipal 1.777 1.760 124 52,76 7 58,33Special Education 127 127 9 3,83 1 8,33Total 4.121 4.118 235 100 12 100
Source: City Education, Sports and Leisure Department: 2006
This trend can be explained by the fact that the state schools still offer most basic schooling places which, as
stated in the Directives and Bases Law, should be city-run. Following a trend common in other locations
around the State, in Monte Alegre de Minas enrollment is concentrated in the basic schooling cycles.

Revisão do Estudo de Impacto Ambiental – EIA - Piedade SHS – Março/2007, Pág.110
We should point out that despite the state schools representing 54.17% of enrollments in 2006, this figure is
not reflected among teachers and schools. The city manages 52.76% of teachers, and 58.33% of schools.
Analysis of 1999 data, compared with 2006 figures, shows that enrollment distribution in the region
followed the population changes in recent years.
The number of enrollments has fallen in Monte Alegre de Minas in recent years. In 1999, 5,238 students
were enrolled in the Pre-School, Basic and High School systems. Note that the population in this period was
18.380 inhabitants, almost the same as today. In 2006, the municipal system enrolled 4,118 students at the
end of the year. The number of municipal teachers also fell from 286 in 1999 to 235 in 2006.
Analysis of educational figures shows a similar scenario among the Monte Alegre de Minas population.
Alongside the population, there has been a certain stagnation in the teaching system, with a significant fall
this year in the number of enrollments, which can be explained by the change in population age ranges. This
means that the population is not growing, and as it ages there are fewer people of school age.
Students in rural areas are transported by the City Hall to urban areas to continue their studies.
Human Development Index - HDI
According to the Human Development Atlas in Brazil (HDI-M) 1991-2000, “in the period between 1991-
2000, the Municipal Human Development Index (HDI-M) for Monte Alegre de Minas grew 6.90%, from
0.710 in 1991 to 0.759 in 2000.”
Table 4.14Municipal Human Development Index (IDH-M) -1991 and 2000
Social indicators 1991 2000Municipal Human Development Index 0,710 0,759Education 0,755 0,845Longevity 0,714 0,757Income 0,660 0,676
SOURCE: Fundação João Pinheiro
The area with greatest contribution to this growth was Education, as shown in the following graph, with
60.4%, followed by longevity, with 28;9% and Income with 10.7%.”

Revisão do Estudo de Impacto Ambiental – EIA - Piedade SHS – Março/2007, Pág.111
“In this period the human development gap (distance between the municipal HDI and the maximum HDI
limit, 1 – HDI) was closed by 16;9%.”
“If the HDI-M growth rate is maintained, the region will take 24.8 years to reach São Caetano do Sul (SP),
the municipality with the best HDI-M index in Brazil (0.919) and 13.3 years to reach Poços de Caldas
(MG), the city with the best State HDI-M (0.841).”
“In 2000, the Municipal Human Development Index for Monte Alegre de Minas is 0.759. According to thePNUD classification, the municipality is among regions deemed average in terms of human development
(HID between 0.5 and 0.8).”
“In terms of other Brazilian municipalities, Monte Alegre de Minas is in good standing: It is in 1604thposition, with 1603 better (29.1%) and 3903 (70.9%) in an equivalent or worse situation."
“In terms of other state municipalities, Monte Alegre de Minas is in good standing: It is in 215th position,
with 214 better (25.1%) and 638 (74.9%) in an equivalent or worse situation."
4.2.1 ECONOMIC INFRASTRUCTURE
A can make infrastructure encompasses aspects linked to electricity, adjudication and transportation and
aims to provide a picture of the scope of the services within the area being studied, as an important indicator
measuring the economic level and quality of life locally.
Electricity
Electrical services in Monte Alegre de Minas delivered by Companhia Energética do Estado de Minas
Gerais (CEMIG), serving various types of consumption are shown in table 4.15, referring to the years 1999
and 2003.
Contribuição para o crescimento do IDH
%
80
60
40
20
0Educação Longevidade Rend a

Revisão do Estudo de Impacto Ambiental – EIA - Piedade SHS – Março/2007, Pág.112
Table 4.15Electricity Consumption by Class -1999 and 2003
Class 1999 2003
Consumption(KWh)
738.421 562.163Industrial
No. of consumers 47 50Consumption
(KWh)2.705.288 2.391.178
Commercial
No. of consumers 488 529Consumption
(KWh)6.519.148 5.402.238
Residential
No. of consumers 4.074 4.572Consumption
(KWh)10.645.486 12.056.923
Rural
No. of consumers 1.097 1.329Consumption
(KWh)3.108.104 2.990.218
Others
No. of consumers 79 79Consumption
(KWh)23.716.447 23.402.720
Total
No. of consumers 5.785 6.559Source: CEMIG 1997 and 2001
Based on this data we can see that the most relevant class of consumption in the municipal region is rural.
Curiously, this class covers only 20.26% of total consumers in Monte Alegre de Minas, but in terms of
consumption it represents more than half of the energy consumed, 51.51%.
In the two years survey, the quantities expressed in table 4.15 indicate a high level of consumption only in
the rural class. Any other classes, consumption did not increase.
According to information from the Fundãção João Pinheiro, in 2000, electricity was available to 96.2% of
the population.
The municipal region also has public lighting along most streets in the city. Services are considered of good
quality.
Communications
CTBC – Companhia Telefônica do Brasil Central is the local telephone utility, offering long-distance and
international services. According to city representatives, there are sufficient telephone lines to meet demand.
Public services are provided through payphones installed at strategic points throughout the Oban area.
The Empresa Brasileira de Correios e Telégrafos (EBCT) is responsible for sending and receiving
correspondence and similar services.
The municipal region has a local radio station and one newspaper.
Transport
The state capital can be accessed along BR-365, a highway, which is taken up to the intersection at the city
of Uberlândia. From there, take BR 452 to the Araxá junction, and from here to Belo Horizonte, take BR

Revisão do Estudo de Impacto Ambiental – EIA - Piedade SHS – Março/2007, Pág.113
262.
The city has a bus station with regular lines to various cities, especially Uberlândia. From here it is possible
to take road transport to the other major centers in Minas Gerais and other states.
Monte Alegre de Minas, based on its location alongside the BR-365, also benefits from other bus lines from
neighboring municipal regions.
There is no rail or commercial air transport serving the city.
Services and Commerce
Commercial and service activities are adequate to meet the basic demands of the population which goes to
Uberlândia for more specialized goods and services. The city has branches of Banco do Brasil,
BRADESCO S.A. and Caixa Econômica Federal banks.
Table 4.16 shows the number of companies in each industry and employees. The data is from the CEMPRE
(Central Company Register) from the IBGE for 2003.
Table 4.16General company data according to activity and personnel employed
MONTE ALEGRE DE MINAS - 2003Activity Number of units People employed
Agriculture, fishing, forestry and forest exploration 29 221Mining industry 1 not availableTransformation industries 46 114Construction 10 7Commerce (repairing cars, personal objects and home appliances) 399 790Housing and food 22 32Transport, storage and communications 73 80Financial intermediation 13 45Real estate and rental activities and services provided to companies 41 99Public administration, defense and social security 3 559Education 5 22Health and social services 8 40Other collective, social and personal services 104 219
Source: IBGE, Central Company Register, 2003.
4. 1.3 PRODUCTION STRUCTURE
The importance of farming in the Monte Alegre de Minas production base can be seen from the PEA data
presented previously.
In fact, the GDP information presented in table 4.17 proves that farming is relevant accounting for over
50% of total income generated, during the period between 1998 and 2002.

Revisão do Estudo de Impacto Ambiental – EIA - Piedade SHS – Março/2007, Pág.114
Table 4.17Gross Domestic Product (GDP), at current prices, MONTE ALEGRE DE MINAS 1998-2002
Farming Industry Service TotalYears
R$ % R$ % R$ %
1998 53.074 59,8 4.312 4,9 31.303 35,3 88.6891999 56.406 60,5 4.473 4,8 32.324 34,7 93.2032000 51.264 52,66 7.377 7,57 38.708 39,76 97.3492001 54.895 51,46 6.625 6,21 45.142 42,32 106.6622002 72.485 56,43 6.321 4,92 49.636 38,64 128.442
SOURCE: Fundação João Pinheiro, Centre for Statistics and Information (CEI), 2002.
The industrial sector is incipient and city administration highlighted only the presence of one low
technology factory producing rum.
In terms of farming, Monte Alegre de Minas is considered the Brazilian capital of pineapple, which is the
main product among local crops.
Table 4.18 below present farm production for the year 2002.
Table 4.18Main products produced - 2002
Product Harvested area (ha) Production (t) Average Yield (kg/ha)Pineapple (1) 3.000 90.000 30.000Cotton (seed) 200 480 2.400Peanuts (unshelled) 600 1.200 2.000Upland rice 500 900 1.800Low land rice 200 600 3.000Banana (2) 187 2.805 15.000Sugarcane 2.000 140.000 70.000Coffee 520 936 1.800Beans (2nd crop) 100 180 1.800Oranges (1) 1.060 16.960 16.000Manioc 400 6.400 16.000Corn 6.000 25.200 4.200Soybeans 23.200 69.600 3.000Sorghum (2nd crop) 330 198 600
SOURCE: IBGE, 2006.(1) Production of 1000 fruit and yield in fruit/hectare(2) Production of 1000 bunches and yield in bunches/hectare
In terms of cattle farming, beef cattle represent the main activity and are widely farmed. The municipal herd
was composed of 137,500 head of cattle in 2000, according to information from the IBGE.
4.2 DIRECTLY AFFECTED AREA
The Directly Affected Area (ADA) according to the original project would affect 15 rural properties (nine
on the right bank and six on the left) all located in the municipal region of Monte Alegre de Minas on the
banks of the River Piedade, according to table 4.19

Revisão do Estudo de Impacto Ambiental – EIA - Piedade SHS – Março/2007, Pág.115
Table 4.19List of ADA Properties for the Piedade SHS – Original Project, 2003
Property number UnderStructure or element of the project affecting the
propertyRIGHT BANK
01MD Régis Vieira Santos Reservoir02MD Gerson Faria Diniz Reservoir03MD Francisco Carlos Vieira Reservoir and Dam04MD Roosevelt Guimarães Diniz Water channel05MD Leri Parreira Diniz Water channel06MD Dalgiza Teodora dos Reis Water channel07MD Diógenes Coelho Nogueira Water channel and power house08MD Valda Water channel09MD Leonardo Ferreira de Faria Water channel and water intake
LEFT BANK01ME Antônio Kehdes Sobrinho Reservoir and Dam02ME Áurea Diniz Evangelhista Low flow section03ME Luiz Carlos da Silva Low flow section04ME José Ferreira de Menezes Low flow section05ME José Antônio de Faria Low flow section06ME Jomilton Ferreira de Menezes Low flow section
Source: EIA/RIMA Additional Information for Piedade SHS, 2003.
Of these, 2 will only be affected by the reservoir, 2 by the reservoir and dam. The remainder, 11 ruralproperties, all located on the low flow section (LFS), 4 of which will be affected by the water channel, 1 bythe water channel and powerhouse and 1 by the water channel and water intake.
Because of the changes to the construction design, the total number of properties affected rose to 21 (13 onthe right bank and 8 on the left) as described in table 4.20.
Table 4.20List of ADA Properties for the Piedade SHS – Current Project, 2007
Propertynumber
OwnerStructure or element of the project
affecting the propertyInterviewed in
03/2007RIGHT BANK
01MD Juvenil M. Guimarães e Fernando Reservoir Y02MD Antônio Ferreira Diniz Reservoir Y03MD Francisco Ferreira Faria Reservoir Y04 MD Gerson Faria Diniz Reservoir and Dam N05MD Francisco Carlos Vieira Water channel Y06MD Robson Pereira Guimarães Water channel Y07 MD Roosevelt Guimarães Diniz (Estate) Water channel Y08 MD Leri Parreira Diniz Water channel Y09MD Dalgiza Teodora dos Reis (Dil Vilela) Water channel Y10 MD Diógenes Coelho Nogueira Water channel Y11 MD Valda Pereira de Faria Water channel Y12 MD Leonardo Ferreira de Faria Water channel and water intake Y13 MD Vanderlan Pereira de Faria Water channel and power house Y
Continued…. . .
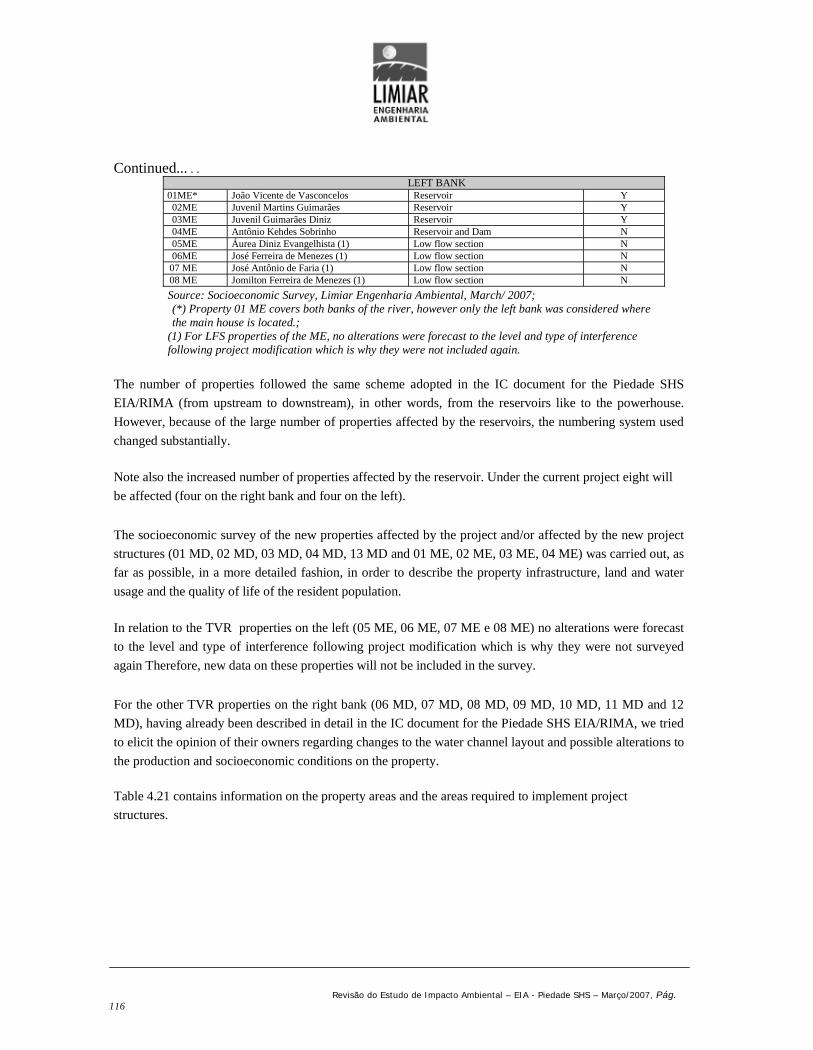
Revisão do Estudo de Impacto Ambiental – EIA - Piedade SHS – Março/2007, Pág.116
Continued... . .LEFT BANK
01ME* João Vicente de Vasconcelos Reservoir Y02ME Juvenil Martins Guimarães Reservoir Y03ME Juvenil Guimarães Diniz Reservoir Y04ME Antônio Kehdes Sobrinho Reservoir and Dam N05ME Áurea Diniz Evangelhista (1) Low flow section N06ME José Ferreira de Menezes (1) Low flow section N
07 ME José Antônio de Faria (1) Low flow section N08 ME Jomilton Ferreira de Menezes (1) Low flow section N
Source: Socioeconomic Survey, Limiar Engenharia Ambiental, March/ 2007;(*) Property 01 ME covers both banks of the river, however only the left bank was considered wherethe main house is located.;
(1) For LFS properties of the ME, no alterations were forecast to the level and type of interferencefollowing project modification which is why they were not included again.
The number of properties followed the same scheme adopted in the IC document for the Piedade SHS
EIA/RIMA (from upstream to downstream), in other words, from the reservoirs like to the powerhouse.
However, because of the large number of properties affected by the reservoirs, the numbering system used
changed substantially.
Note also the increased number of properties affected by the reservoir. Under the current project eight will
be affected (four on the right bank and four on the left).
The socioeconomic survey of the new properties affected by the project and/or affected by the new project
structures (01 MD, 02 MD, 03 MD, 04 MD, 13 MD and 01 ME, 02 ME, 03 ME, 04 ME) was carried out, as
far as possible, in a more detailed fashion, in order to describe the property infrastructure, land and water
usage and the quality of life of the resident population.
In relation to the TVR properties on the left (05 ME, 06 ME, 07 ME e 08 ME) no alterations were forecast
to the level and type of interference following project modification which is why they were not surveyed
again Therefore, new data on these properties will not be included in the survey.
For the other TVR properties on the right bank (06 MD, 07 MD, 08 MD, 09 MD, 10 MD, 11 MD and 12
MD), having already been described in detail in the IC document for the Piedade SHS EIA/RIMA, we tried
to elicit the opinion of their owners regarding changes to the water channel layout and possible alterations to
the production and socioeconomic conditions on the property.
Table 4.21 contains information on the property areas and the areas required to implement project
structures.

Revisão do Estudo de Impacto Ambiental – EIA - Piedade SHS – Março/2007, Pág.117
Table 4.21List of Properties by Area – 2007
Propertynumber
Owner Total area (ha)Area of Interest (ha)
RIGHT BANK01MD Juvenil M. Guimarães e Fernando 80.0 (2)02MD Antônio Ferreira Diniz 145.0 33.9403MD Francisco Ferreira Faria 140.0 18.3004 MD Gerson Faria Diniz (2) (2)05MD Francisco Carlos Vieira 242.0 (3) 3.7006MD Robson Pereira Guimarães 85.0 3.8507 MD Roosevelt Guimarães Diniz (Espólio) 55.0 2.9608 MD Leri Parreira Diniz 72.60 (3) 5.9509MD Dalgiza Teodora dos Reis (Dil Vilela) 72.60 (3) 2.9810 MD Diógenes Coelho Nogueira 99.22 (3) 2.7111 MD Valda Pereira de Faria (2) 0.7812 MD Leonardo Ferreira de Faria 62.92 (3) 5.1213 MD Vanderlan Pereira de Faria 95.0 4.0
LEFT BANK01ME* João Vicente de Vasconcelos 580.0 25.5702ME Juvenil Martins Guimarães 29.0 (2)03ME Juvenil Guimarães Diniz 411.0 (2)04ME Antônio Kehdes Sobrinho 871.20 (3) 20.2605ME Áurea Diniz Evangelhista (2) (2)06ME José Ferreira de Menezes 11.32 (3) -07 ME José Antônio de Faria 58.08 (3) -08 ME Jomilton Ferreira de Menezes 60.50 (3) -
Source: Socioeconomic Survey, Limiar Engenharia Ambiental, November/2003 andMarch/ 2007; (*) the property extends along both banks of the River Piedade, but the main house is onthe left-hand side;(1) No changes were forecast on these properties with regard to the level and type of
interference from the new project, which is why they were not surveyed again;(2) No information;(3) Information from the IC document for the Piedade SHS EIA/RIMA, November/2003.
Drawing PIE-PRO-002, attached to this document, contains the properties registered in the Piedade SHS
ADA.
4.2.1 Individual Description of Farming Establishments
Right Bank
Reservoirs and Dam Area
Owners: JUVENIL M. GUIMARÃES E FERNANDO
PROPERTY 01 MD: Piedade Farm
The property is located on the right bank of the River Piedade. The Piedade Farm covers an area of
approximately 80 ha and was created following purchase of land from the former estate of Mr. Nelson
Diniz. The property will be affected only by the reservoir.
The purchasers were Mrs. Juvenil M. Guimarães (owner of another property on the opposite side of the
river which will also be affected by the reservoirs) and her brother-in-law Mr. Fernando. The former resides
on another property in the ADA, belonging to her father; the latter in a municipal region of Monte Alegre de
Minas. There is nobody on the property, either family members or full-time staff. Mr. Juvenil is responsible
Revisão do Estudo de Impacto Ambiental – EIA - Piedade SHS – Março/2007, Pág.118
for the economic activity conducted on the farm
Note that there are no improvements on site or any sanitation infrastructure (water, sewage and energy)
Land usage is predominantly pasture, in line with the main economic activity, cattle farming, as described
below:
Pasture: 70.0 ha
Forest and brush wood: 10 ha.
No crops are farmed on the property. According to Mr. Juvenil Guimarães, around 50 head of cattle were on
the farm at the time of the socioeconomic survey.
The Piedade river is used on the rural property exclusively for animal drinking water.
Mr. Juvenil M. Guimarães was asked about the dam construction and the project's repercussion on his
property. He said that construction of the hydroelectric power station is a negative event, because it will use
part of his productive land. He also believes the land closest to the riverbed is the best quality and will be
covered by the reservoir. Based on this, his cattle farming will suffer.
Despite this negative scenario, if negotiating with the developer, he believes that the best solution will be to
negotiate only the area affected by the reservoir.
Owners: ANTÔNIO FERREIRA DINIZ
PROPERTY 02 MD: CACHOEIRINHA Farm
The Cachoeirinha Farm is on the right bank of the Piedade river covering an area of around 145 ha. The
property will be affected only by the reservoir.
The property owner lives in Uberlândia, travelling to the farm at the weekends. In the city, Mr. Antonio
owns a bread shop and a restaurant which are his main sources of income.
The farm is run by two full-time staff (Mr. Clediomar and Mrs. Aparecida) who live on site and look after
the crops, cattle and the home. Temporary staff are hired in March and June, but the number varies
depending on their requirements. In addition to these workers, there are three partners (Mr. Sebastião,
“Lipe” and “Branco”), who have a half interest with the owner planting soybeans. Mr. Antônio Ferreira,who was interviewed, was unable to say what soybean production was during the last crop.
As pointed out above, the main activities are cattle and crop farming. These are the main areas of land usage
as described below:
Pasture: 64 ha

Revisão do Estudo de Impacto Ambiental – EIA - Piedade SHS – Março/2007, Pág.119
Temporary crops: 81 ha.
According to information provided by the owner, the soybean and manioc crops are the main activities on
the farm. Soybeans account for approximately 60 ha, the largest area. The soybeans are sold to companies
in the Minas Triangle region to make oil, while manioc is sold to Ceasa in Uberlândia. Additionally, they
have also been cattle farming. The cattle is sold to regional traders.
At the time of the on-site survey, the cattle herds totaled 180 head. Other animals are also bred, to a lesser
extent, such as hogs (20 head) and poultry (200). Three horses are on the farm and are used to help carry out
everyday activities.
Cattle farming is extensive and no type of pasture has been planted on the farm.
In terms of crop farming, especially soybeans, more sophisticated production techniques are used such as a
mechanical tractor to plough the land and plant seeds, as well as a harvester. The crop also benefits from
chemical fertilizers.
The Piedade river is used on the property for animal drinking water and leisure purposes (especially
weekend fishing).
In terms of infrastructure, the property has: One main house, two outhouses, three pigsties, one chicken
house, for material storage warehouses, one corral and one store house.
The main house is only occupied at the weekend by the owner. This is a brick construction with 10 rooms,
internal and external finishing and a ceramic floor. Water comes from a spring on the property, the sewage
system uses a septic tank and energy is provided from the public electricity network.
The full-time workers (Mr. Clediomar and Mrs. Aparecida) reside in one of the outhouses which is supplied
by the same spring, septic tank and electricity network.
Asked about the possibility of building a hydroelectric power station, the owner said he was hearing about
it for the first time from the consultancy contracted for the socioeconomic survey.
Because this was news to him, he did not feel secure enough to say whether this was a good or bad thing,
although he accepts his property will suffer in terms of production capacity because the area covered by
farmland will fall.
If there are any negotiations regarding the land, he demonstrated that he intends to sell only the part affected
by the project.

Revisão do Estudo de Impacto Ambiental – EIA - Piedade SHS – Março/2007, Pág.120
Owner: FRANCISCO FERREIRA FARIA PROPERTY 03
MD: BOA VISTA DO PÂNTANO Farm
The Boa Vista do Pântano Farm is on the right bank of the Piedade river covering an area of around 140.0
ha. The property will be affected only by the reservoir. The property owner lives in Uberlândia, travelling to
the farm at the weekends. Mr. Francisco Ferreira Faria’s main income is from transporting schoolchildren.
Work on the property is carried out by the interviewee at the weekends. Sometimes, temporary workers are
hired, especially in March, for clearing and other services.
Main activities are crop and cattle farming. Land usage is predominantly for pasture:
Pasture: 115 ha
Temporary crops: 5 ha
Forest and brush wood: 20 ha.
As stated by the owner, a small part of his land is used for pineapple farming, sold to traders in Monte
Alegre de Minas. The cattle is for breeding and beef, and sold to city traders.
At the time of the on-site survey, the cattle herds totaled 130 head. Three horses are on the farm and are
used to help carry out everyday activities.
Cattle farming is carried out on an off-farm basis, however the cattle is vaccinated and wormed.
Farming activities use a mechanical tractor. The pineapple crop requires application of limestone and the
use of chemical fertilizers. The land, in the crop area and pasture area, follows the same contour lines.
The Piedade river is used on the property for animal drinking water and leisure purposes (especially
weekend fishing). Note that the owner mentioned he intends to increase the pineapple production area next
year and if so, he intends to use water from the Piedade river for irrigation.
In terms of infrastructure, the property has: One main house, two outhouses, one pigsty, one chicken house,
two corrals, one store house and two milking areas.
The main house is only occupied at the weekend by the owner. This is a brick construction with 07 rooms,
internal and external finishing and a cement floor. Water is provided from a spring and are well on the
property, while energy is provided by the

Revisão do Estudo de Impacto Ambiental – EIA - Piedade SHS – Março/2007, Pág.121
public utility.
Asked about possible construction of a hydroelectric power station, the owner said he had been approached
by representatives from Construtora Gomes Lourenço last year and this person had provided him with
preliminary information on changes to the power station project.
Based on this information, Mr. Francisco believes the construction of the power station will be a negative
event, because the reservoir will cover part of his most productive land, the low-lying land, closest to the
river. Based on this, cattle farming will suffer as all project to expand pineapple farming.
If there is any negotiation regarding the land, he demonstrated that he intends to sell only the part affected
by the project.
Owner: GERSON FARIA DINIZ PROPERTY
04 MD: Boa Vista Farm
As highlighted in the IC document for the EIA/RIMA, the Boa Vista Farm is located on the right bank of
the Piedade river and will be affected both by the reservoir and the dam. The owner is a bank employee
living in the city of Osasco/SP, and the property is managed by his cousin, Mr. Régis Vieira Santos.
Noticeably area of the property was expanded when it incorporated part of the property which belonged to
Mr. Régis Vieira Santos.
During the fuel survey, the socio-economic information enabled us to review/update the data because
nobody was residing on site. Furthermore, attempts to contact the owner by telephone were unsuccessful.
4.2.2 Downstream Area – Low Flow Section/Adduction Channel/PowerStation
As highlighted the beginning of this item describing the ADA properties in this document, the properties 05
MD, 06 MD, 07 MD, 08 MD, 09 MD, 10 MD, 11 MD, 12 MD had already been described in the IC
document for the EIA/RIMA at Piedade SHS. Therefore, the main objective was to obtain the opinion of the
owners regarding implications of the changes of the water channel route on the production capabilities of
the properties and the existing socioeconomic relationships.
We must point out that these owners have renegotiated land with Construtora Gomes Lourenço. Currently,
the main concern relates to the solutions which were presented by the company to renegotiate the new areas
which will be affected by the new water channel route.

Revisão do Estudo de Impacto Ambiental – EIA - Piedade SHS – Março/2007, Pág.122
A meeting was held with these owners at the works site for the Piedade SHS on 14/03/2007, when they were
presented with questionnaires on their attitude towards the changes in the water channel route.
Photo 4.1 Meeting with the owner of the TVR MD Photo 4.2 Meeting with the owner of the TVR MD -presenting the new route
Only property 13 MD underwent a more detailed survey because this property was not affected by the
original Piedade SHS project.
Owner: FRANCISCO CARLOS VIEIRA PROPERTY 05 MD:
BOA VISTA DO PÂNTANO Farm
The owner, Mr. Francisco Carlos Vieira, has been living in the city of Monte Alegre de Minas with his
family where he has a store which, alongside the farm, are his two sources of income.
Mr. Francisco travels at the weekends to the property and with his brother, who resides on a neighboring
property, takes care of all the chores. They have no full-time staff. In the months of October to April, they
usually hire temporary workers from the region for general services such as fixing fences and clearing the
pasture.
In terms of the land negotiation conducted prior to the changes in the project, the interviewee said he
received for payment for the sale and used the money to invest in his store and on the property.
He said he was not satisfied, but that he also did not lose out from the negotiation, because he did not intend
to sell the entire property. On the other hand, he acknowledges that the Piedade SHS construction will
benefit the municipal region.
Regarding changes to the project, the owner said that based on the location of the new channel, Construtora
Gomes Lourenço will have to build bridges for cattle and machinery. Furthermore,

Revisão do Estudo de Impacto Ambiental – EIA - Piedade SHS – Março/2007, Pág.123
fences will need to be built so that the cattle do not cross the Piedade river.
Mr. Francisco also mentioned his concern regarding new negotiations for the land which will be used by the
water channel, because the land purchased previously represented a larger area and now this area will be
much smaller.
Owner: ROBSON PEREIRA GUIMARÃES PROPERTY 06
MD: BOA VISTA DO PÂNTANO Farm
The owner resides on the farm with his family, which is main source of income. He and one other employee
carry out all of the farming activities on the property. Once every year they hire around three temporary
workers to clear the pasture and fix fences.
Mr. Robson, who was interviewed, said that he had received the payment for the land he had sold and that
the money was invested in property. In his opinion, the negotiation was just reasonable.
In terms of changes to the project, he believes that this will not affect him to a great extent if Construtora
Gomes Lourenço does not want the land below the channel, acquired during the first negotiation. He would
be in favor of exchanging the land purchased for the land that will need to be used by the water channel.
However, if Construtora Gomes Lourenço also needs the land below the channel, he said that no further
work would be possible on his property.
In addition to this negotiation, they will also need to be some sort of passageway over the water channel (for
cattle and machinery) and even drinking areas for the cattle at other locations around the property. He was
concerned about the possibility of cattle crossing the Piedade river asking that Construtora Gomes Lourenço
build fences along the Piedade river to cut off access.
Owner: ROOSEVELT GUIMARÃES DINIZ (Estate)
PROPERTY 07 MD: BOA VISTA DO PÂNTANO Farm
Based on the latest information obtained on site, the sole beneficiary of the estate of Mr. Roosevelt
Guimarães Diniz was his son, Mr. Roosevelt Guimarães Diniz Júnior.
Mr. Roosevelt Jr lives with his family in the city of Monte Alegre de Minas and travels every day to work
on the property, which is his main source of income.
On being interviewed, he said that he has no full-time workers and hides a maximum of three temporary
employees for two or three months every year for clearing pasture and fixing fences.
When asked whether he had received payment following the land negotiation, he said

Revisão do Estudo de Impacto Ambiental – EIA - Piedade SHS – Março/2007, Pág.124
he had, using the cash on the farm.
He said he was not satisfied with the previous negotiations, but that he also did not lose out from the
negotiation, because he did not intend to sell the entire property.
In terms of the project amendments, Mr. Roosevelt Jr. said that the changes were good because the new
channel route would affect nonproductive land, but would affect one water source and a small lake. He also
said that the solution for the loss of the water would be another water option and he would need a
passageway for cattle and machinery over the channel to his more productive farmland, and the need to
fence off the Piedade river to stop cattle from crossing.
Mr. Roosevelt Jr also asked us to look into the issue of his father's property, which belonged to Mr.
Roosevelt Guimarães, encompassing the Piedade and Boa Vista do Pantano Farms. Gomes Lourenço
considered this to be a single farm and in the deeds did not find that the channel would also pass through the
Piedade farm.
Today, the owner, Mr. Roosevelt Guimarães, is deceased and his land was split between his children. The
Boa Vista do Pântano farm was divided between the children Robson Pereira Diniz (85 ha) and Roosevelt
Jr. (12 ha), the remainder was sold to third parties, but will not be affected by the Piedade SHS. Mr.
Roosevelt Jr. received the remainder of the estate (23 ha).
Owner: LERI PARREIRA DINIZ
Property 08 MD: Pântano Aguadinha Farm
The owner, Mr. Leri Parreira Diniz, resides at the farmhouse with his wife. Economic activity on the
property, along with his pension, are his main source of income.
Farm work is carried out by the owner and members of his family. They have no permanent employees, but
usually higher temporary workers once a year for pasture clearing and fence fixing.
Mr. Leri, who was interviewed, said that he had received the payment for the land he had sold and believes
that the negotiation had been reasonable. He acknowledges that Construtora Gomes Lourenço paid market
values. The cash was invested on the property.
In terms of the project amendments, Mr. Leri said that he was concerned about machine and cattle access to
the land which will be below the water channel, adding that there should be individual passages, one for
each property. This means he would have his own bridge for cattle and machinery.

Revisão do Estudo de Impacto Ambiental – EIA - Piedade SHS – Março/2007, Pág.125
Owner: DALGIZA TEODORO DOS REIS (DIL VILELA)
PROPERTY 09 MD: PÂNTANO Farm
The owner, Mrs. Dalgiza Teodora dos Reis, lives in the state of São Paulo, and the property is managed by
Mr. Dil Vilela dos Reis, who resides with his family on the property.
According to Mr. Dil, the property represents his main source of income. He said that he has no full-time
employees and does not higher temporary workers.
In terms of the sale of the land, Mr. Dil said he had received his payment that negotiation was reasonable,
preferred not to say how the money was spent.
Regarding the changes to the project, he said that the new route for the water channel will destroy his
cashew trees and a spring and he will need a crossing over the water channel for cattle and wells, as the area
below the channel has increased considerably.
Owner: DIÓGENES COELHO NOQUEIRA
PROPERTY 10 MD: MANSSAMBARÁ Farm
The owner, Mr. Diógenes Coelho Noqueira, resides with his family on another rural property outside the
project area. The properties are his two main sources of income.
Mr. Diogenes has no full-time staff, but hires one temporary worker for pasture clearing, harvesting, fixing
fences, etc.
In terms of the negotiation, he said he received the entire payment for the sale of land and alleged that
Construtora Gomes Lourenço "paid a cheap price for land". The cash from the transaction was invested on
both properties.
Regarding changes to the project, the owner sent that the new water channel route will go through his best
land, part of his banana plantation and a spring. He said that he will therefore need a crossing for cattle and
machinery over the water channel.
He highlighted that in the previous agreement, Construtora Gomes Lourenço was supposed to arrange for a
well which is now very important, because he will have no water for his cattle. Mr. Diogenes also
demonstrated his concern regarding the possibility of cattle crossing the Piedade river. In this case, he asked
the construction company to take the necessary measures to ensure that this does not occur.
He also said that he authorised Construtora Gomes Lourenço to open up an access road to the power station
on his land, but so far the construction company has taken no steps to legalize the situation.

Revisão do Estudo de Impacto Ambiental – EIA - Piedade SHS – Março/2007, Pág.126
Owner: VALDA PEREIRA DE FARIA PROPERTY
11 MD: MANSSAMBARÁ Farm
The owner, Mrs. Valda Pereira, lives in the city of Monte Alegre de Minas and the property is managed by
her son, Vanderlan Ferreira de Faria, who owns a property in the ADA, where he lives (see MD 13).
Income from the property and a pension are the owner's main source of income.
Mr. Vanderlan, who provided us with information on the property, said that it has no full-time staff. Once a
year, he hires a temporary worker to clear the pasture.
He said that he had received the payment for the land he had sold and that the money was invested in
property. He said that his mother was happy with the transaction.
In terms of changes to the project, he said that the property needs a crossing over the water channel for
cattle and that he had previously agreed a well with Construtora Gomes Lourenço.
Owner: LEONARDO FERREIRA DE FARIA
PROPERTY 12 MD: MASSAMBARÁ Farm
The owner, Mr. Leonardo, resides with his family on another rural property outside the project area. These
two properties and his pension are his main source of income.
Farm work is carried out by the owner and members of his family. They have no permanent employees, but
usually higher temporary workers once a year for pasture clearing and fence fixing.
The owner said that he had received the payment for the land he had sold and believes that the negotiation
had been reasonable. He acknowledges that Construtora Gomes Lourenço paid market values. The cash was
invested on the property.
In terms of changes to the project, the owner said that the new water channel route would affect his
farmland and two springs would be damaged, expressing his concern with the cattle's access to water and
subsequent reduction of the water from his springs. He pointed out that offence would be required to avoid
the cattle crossing the river.
Mr. Leonardo said he is aware of the need for a new negotiation because of the land affected and said he
will wait for contact from Construtora Gomes Lourenço representatives.

Revisão do Estudo de Impacto Ambiental – EIA - Piedade SHS – Março/2007, Pág.127
Owner: VANDERLAN FERREIRA DE FARIA
PROPERTY 13 MD: Piedade Farm
The Piedade Farm is on the right bank of the Piedade river covering an area of around 95.0 ha. Of this area,
approximately 13 ha were recently acquired from his mother, Mrs. Valda Pereira de Faria. This is why the
property will be affected by the water channel at two different locations and by the power station.
The owner, Mr. Vanderlan Ferreira de Faria, resides on the property with his wife and he is responsible for
farming activity on site. He said that no permanent and/or temporary workers are hired. There are no leases
or partnerships for agricultural production on his property.
He mainly farms beef cattle. He also produces milk and sugar cane on a non-commercial basis.
The land on the property is subdivided as follows:
Pasture: 72.0 ha
Temporary crops: 2.0 ha
Forest and brush wood: 21.0 ha.
At the time of the on-site survey, the cattle herds totaled 100 head. Most of the herd is for breeding/beef.
The cattle are sold within the municipal region. The owner also reported low-level milk production, around
10 L per day, used for his own consumption and by neighbors.
A mechanical tractor is used to farm sugarcane and apply chemical fertilizer. According to the owner, soil
conservation techniques are used all over the property using terraces and pasture rest areas.
The Piedade river is used on the rural property exclusively for animal drinking water.
In terms of infrastructure, the property has: One main house, two pigsties, one chicken house, one material
deposit, 1 warehouse, three corrals, one store house and one milking area.
The main house is only occupied at the weekend by the owner. This is a brick construction with 10 rooms,
internal and external finishing, ceramic flooring with water from a spring on the property and energy from
the local utility company.
Asked about a possible construction of a hydroelectric power station, the owner said he had heard about it in
the region.

Revisão do Estudo de Impacto Ambiental – EIA - Piedade SHS – Março/2007, Pág.128
According to Mr. Francisco, construction of the power station will be a positive event, because this will
improve local roads. Regarding possible modifications to his property, he believes that there will be no
negative effects provided that during the land negotiation process, his requests are met by the developer.
In terms of the land negotiation, the owner had no opinion.
Left Bank
Reservoirs and Dam Area
Owner: JOÃO VICENTE DE VASCONCELOS
PROPERTY 01 ME: Piedade Farm
The Piedade Farm is on the left bank of the Piedade river covering an area of around 580 ha. The main house
is on the left bank of the Piedade river and will only be affected by the reservoir.
Of this total, approximately 120 acres have been leased to Mr. Domingos. The lessee plants soybeans and
does not reside on the property.
Photo 4.3 Main house on the Piedade Farm Photo 4.4: Pasture and corral on the Piedade Farm
One of the sons of the owner of the Piedade farm, Mr. Erson de Vasconcelos, lives of the main house on the
property with his wife. He is responsible for farm activity on the site. Economic activity on the property,
along with his pension, are his main source of income.
The main activity on the property is milk and beef cattle farming.
Taking into account the entire area covered by the property, including the leased area, land usage is divided
as follows:
Pasture: 242.0 ha

Revisão do Estudo de Impacto Ambiental – EIA - Piedade SHS – Março/2007, Pág.129
Temporary crops: 125.0 ha
Forest and brush wood: 213.0 ha.
At the time of the on-site survey, the cattle herds totaled 200 head. The cattle is sold within the municipal
region. The interviewee, Mr. Erson, reported a little milk production, around 50 L per day, which is also
sold to traders in Monte Alegre de Minas. He also said that some chickens (30) are raised for his own
consumption and three horses are on site which are used for everyday activities.
In addition to the soybean plantation on the leased area, a small area is planted with sugarcane. This area,
covering around half a hectare, is used to produce inputs to complement cattle feed.
According to the owner, soil conservation techniques are used all over the property using terraces and
pasture rest areas.
The Piedade river is used on the rural property for animal drinking water and leisure (fishing).
In terms of infrastructure, the property has: One main house, one outhouse, one pigsty, one chicken house,
one corral, one store house and one water tank.
The main house on the property is occupied by Mr. Erson and his wife. This is a brick construction with 07
rooms, internal and external finishing and a cement floor. Water is supplied from an artesian well on the
property, electricity from the local utility.
Asked about a possible construction of a hydroelectric power station, the owner said he had heard about it in
the region but that nobody from Construtora Gomes Lourenço had approached him.
According to the owner, the hydroelectric power station will have a negative effect. He said that the
reservoirs will flood the properties low lying land, which is the most productive area.
In terms of the land negotiation, the owner had no opinion. Additionally, property belonged to his father,
Mr. João V. de Vasconcelos, who will be directly involved in the negotiation process.
Owner: JUVENIL MARTINS GUIMARÃES
PROPERTY 02 ME: Piedade Farm
The Piedade Farm is on the left bank of the Piedade river covering an area of around 29.0 ha. The property
will be affected only by the reservoir.

Revisão do Estudo de Impacto Ambiental – EIA - Piedade SHS – Março/2007, Pág.130
The person interviewed, Mr. Juvenil Martins Guimarães, is the owner of this property and one other in
partnership with his brother in law, on the other bank. Economic activity on the properties is his main source
of income.
Piedade farm was created from a plot of land acquired with his father, Mr. Juvenil Guimarães Diniz.
Nobody lives on site and there are no improvements and no sanitation infrastructure (water, sewage) or
electricity.
The owner resides on the property with his father, wife and son.
The main activity on the property is beef cattle farming. Mr. Juvenil is the person in charge of working
with the animals. Sometimes, in the months of May and June, temporary workers are required to clear the
pasture.
The entire property is covered with pasture:
Pasture: 29.0 ha
At the time of the on-site survey, the cattle herds totaled 30 head. The cattle are sold within the municipal
region.
The Piedade river is used on the rural property for animal drinking water and leisure (fishing). Note that the
cattle also use a small spring on the property as a source of drinking water.
Asked about a possible construction of a hydroelectric power station, the owner said he had heard about it in
the region but that nobody from Construtora Gomes Lourenço had approached him.
According to the owner, the hydroelectric power station will have a negative effect. He said that the
reservoir will "take over" the best land on his property.
If there is any negotiation regarding the land, he said that he intends to sell only the part affected by the
project.
Owner: JUVENIL GUIMARÃES DINIZ
PROPERTY 03 ME: Piedade Farm
The Piedade Farm is on the right bank of the Piedade river covering an area of around 411.0 ha. The
property will be affected by the reservoir.

Revisão do Estudo de Impacto Ambiental – EIA - Piedade SHS – Março/2007, Pág.131
Photo 4.5 Main house on the Piedade farm Photo 4.6 Machine storage area
The owner, Mr. Juvenil Guimarães Diniz, resides on the property with his wife. His son, Mr. Juvenil Martins
Guimarães, also resides on the property with his family. According to the owner, the farm is his main source
of income.
The main activity on the property is milk and beef cattle farming and crop farming. These activities are
carried out by the owner and his son. In the months of May and June, temporary workers are hired (around 4
every year) to help clear the pasture.
The land on the property is subdivided as follows:
Pasture: 362.0 ha
Temporary crops: 20.0 ha Forest and brush wood: 29.0 ha.
At the time of the on-site survey, the cattle herds totaled 700 head. Part of the cattle is for slaughter and the
other for milk production. The cattle are sold within a municipal region and the daily milk production of
around 300 L is sold to Nestlé in Uberlândia. The farm has a mechanical milking system and the cattle are
vaccinated against disease and worms.
Two types of crops are present on the property: sorghum, covering 15 ha and pineapples covering 5 ha. The
sorghum which is produced is used to feed the cattle and the pineapples are sold to local traders in the city of
Monte Alegre de Minas. During planting, the land is ploughed with a mechanical tractor and the crops
receive chemical fertilizers. According to the owner, soil conservation techniques are used all over the
property using terraces and pasture rest areas.
The Piedade river is used on the property for animal drinking water, crop irrigation and leisure purposes
(fishing). Irrigation is carried out using an aspersion system, with a suction pump and 4 inch pipe. The
equipment is activated every two weeks between May and October.

Revisão do Estudo de Impacto Ambiental – EIA - Piedade SHS – Março/2007, Pág.132
In terms of infrastructure, the property has: Two main houses, one pigsty, one corral, one milking house.
The main house is occupied by the owner. This is a brick construction with 10 rooms, internal and external
finishing and a ceramic and wood floor. Water comes from a spring on the property, the sewage system uses
a septic tank and energy is provided from the local utility.
Asked about a possible construction of a hydroelectric power station, the owner said he had heard about it in
the region.
According to the owner, the hydroelectric power station will have positive and negative effects. It will be
positive because of the electricity generated a negative because it will flood part of his farming area.
In terms of land negotiation, the owner said he had started discussions with Construtora Gomes Lourenço.
Owner: ANTÔNIO KEHDES SOBRINHO
PROPERTY 04 ME: VALINHO Farm
As highlighted in the IC document for the EIA/RIMA, the Valinho Farm is located on the right bank of the
Piedade river and will be affected both by the reservoir and the dam. The owner runs a wholesale company
in Uberlândia, where he resides.
During the field survey we were able to review/update the information. Furthermore, attempts to contact the
owner by telephone were unsuccessful.
Downstream Area – Low Flow Section
The other TVR properties on the right bank will not survey. This is because modifications to the PiedadeSHS project will not interfere with these properties.
4.2.3 Downstream Area – Low Flow Section/Adduction Channel
Owner: FRANCISCO CARLOS VIEIRA PROPERTY 05MD:
BOA VISTA DO PÂNTANO Farm
The owner, resides in the city of Monte Alegre de Minas with his family where he has a store which,
alongside the farm, are his two sources of income.
Mr. Francisco travelled to the property every weekend and with his brother, who resides in a neighboring
property, is responsible for all of the farm work; there are no full-time employees and between October and
April they usually hire temporary workers for general services such as clearing the pasture and fixing
fences.

Revisão do Estudo de Impacto Ambiental – EIA - Piedade SHS – Março/2007, Pág.133
In terms of the land negotiation conducted prior to the changes in the project, the interviewee said he
received for payment for the sale and used the money to invest in his store and on the property.
He said he was not satisfied, but that he also did not lose out from the negotiation, because he did not intend
to sell the entire property, despite recognizing the benefits arising from construction of the Piedade SHS.
Regarding changes to the project, the owner said that based on the location of the new channel, Construtora
Gomes Lourenço will have to build bridges for cattle and machinery. Additionally, fences will need to be
built so that the cattle does not cross the Piedade river.
Mr. Francisco also mentioned his concern regarding new negotiations for the land which will be used by the
water channel, because the land purchased previously represented a larger area and now this area will be
much smaller.
Owner: ROOSEVELT GUIMARÃES DINIZ JR.
PROPERTY 06MD: BOA VISTA DO PÂNTANO Farm
Mr. Roosevelt Jr lives with his family in the city of Monte Alegre de Minas and travels every day to work
on the property, which is his main source of income.
On being interviewed, he said that he has no full-time workers and hides a maximum of three temporary
employees for two or three months every year for clearing pasture and fixing fences.
When asked whether he had received payment following the land negotiation, he said he had, using the
money on the farm.
He said he was not satisfied with the previous negotiations, but that he also did not lose out from the
negotiation, because he did not intend to sell the entire property.
In terms of the project amendments, Mr. Roosevelt Jr. said that the changes were good because the new
channel route would affect nonproductive land, but would lose one water source and a small lake. He also
said that the solution for the loss of the water would be another water option and he would need a
passageway for cattle and machinery over the channel to his more productive farmland, and the need to
fence off the Piedade river to stop cattle from crossing.
Mr. Roosevelt Jr also asked us to look into the issue of his father's property, which belonged to Mr.
Roosevelt Guimarães, encompassing the Piedade and Boa Vista do Pantano Farms. Gomes Lourenço
considered this to be a single farm and in the deeds did not find that the channel would also pass through the
Piedade farm.
Today, the owner, Mr. Roosevelt Guimarães, is deceased and his land was split between his children.

Revisão do Estudo de Impacto Ambiental – EIA - Piedade SHS – Março/2007, Pág.134
The Boa Vista do Pântano farm was divided between the children Robson Pereira Diniz (85 ha) and
Roosevelt Jr. (12 ha), the remainder was sold to third parties, but will not be affected by the Piedade SHS.
Mr. Roosevelt Jr. received the remainder of the estate (23 ha).
Owner: ROBSON PEREIRA DINIZ
PROPERTY 07MD: BOA VISTA DO PÂNTANO Farm
The owner resides with his family on the farm, his main source of income, carrying out all the work on the
property with one full-time member of staff. He normally hires around three temporary workers to clear the
pasture and fix fences.
He said that he has received for payment for the sale of the land and the cash was invested in property. He
believes the negotiation was reasonable, because he wanted a partnership with Construtora Gomes
Lourenço.
In terms of changes to the project, he believes that this will not affect him to a great extent if Construtora
Gomes Lourenço does not want the land below the channel. However, if Construtora Gomes Lourenço also
needs the land below the channel, he said that no further work would be possible on his property.
He said that he would need a passageway over the Channel and drinking areas for cattle and was concerned
about the possibility of the cattle crossing the Piedade river requesting that the building company construct a
fence along the river while providing an access way so that the cattle could drink.
Owner: LERI PARREIRA DINIZ
PROPERTY 08MD: PÂNTANO DA AGUADINHA Farm
The owner resides with his wife at the main house on the farm, which alongside his pension is his main
source of income.
Work on the farm is carried out by the owner and family members, as they have no permanent employees,
but usually higher temporary workers once a year for pasture clearing and fence fixing.
The owner said he had received full payment for sale of the land and believes the negotiation was
reasonable, alleging that Construtora Gomes Lourenço did not pay market values. And the cash was
invested on the property.
In terms of the project amendments, Mr. Leri said that he was concerned about machine and cattle access to
the land which will be below the water channel, adding that there should be individual passages, one for
each property. This means he would have his own bridge for cattle and machinery.
Revisão do Estudo de Impacto Ambiental – EIA - Piedade SHS – Março/2007, Pág.135
Owner: DALGIZA TEODORA DOS REIS (DIL VILELA)
PROPERTY 09MD: PÂNTANO Farm
The owner, Mrs. Dalgiza Teodora dos Reis, lives in a state of São Paulo, and the property is managed by
Mr. Dil Vilela dos Reis, who resigned with his family on the property.
According to Mr. Dil, the property represents his main source of income. He said that he has no full-time
employees and does not hire temporary workers.
In terms of the sale of the land, Mr. Dil said he had received his payment and the negotiation was
reasonable, but preferred not to say how the money was spent.
Regarding the changes to the project, he said that the new route for the water channel will destroy his
cashew trees and a spring and he will need a crossing over the water channel for cattle alongside wells, as
the area below the channel has increased considerably.
Owner: .DIÓGENES COELHO NOGUEIRA
PROPERTY 10MD: MASSAMBARÁ Farm
The owner resides with his family on another rural property outside the project area. These two properties
are his main source of income.
Mr. Diogenes has no full-time staff, but hires one temporary worker for pasture clearing, harvesting, fixing
fences, etc.
In terms of the negotiation, he said he received the entire payment for the sale of land and alleged that
Construtora Gomes Lourenço "paid a cheap price for land". The cash was invested on the property.
Regarding changes to the project, the owner sent that the new water channel route will go through his best
land, part of his banana plantation and a spring. He will also need the crossing for cattle and machinery over
the Channel and that in the previous agreement, Construtora Gomes Lourenço was supposed to arrange for a
well which is now very important, because he will have no water for his cattle. He was also concerned about
cattle crossing the Piedade river, requesting further measures be taken by the construction company to avoid
this happening.
He also said that he authorised Construtora Gomes Lourenço to open up an access road to the power station
on his land, but so far the construction company has taken no steps to legalize the situation.

Revisão do Estudo de Impacto Ambiental – EIA - Piedade SHS – Março/2007, Pág.136
Owner: VALDA PEREIRA DE FARIA
PROPERTY 11MD: BOA VISTA DO PÂNTANO Farm
The owner, Mrs. Valda Pereira, lives in the city of Monte Alegre de Minas and the property is managed by
her son, Vanderlan Ferreira de Faria, who owns a property in the ADA, where he lives.
Income from the property and a pension are the owner's main source of income.
Mr. Vanderlan said the property does not have any full-time staff and he usually hires one temporary worker
to clear the pasture
He said that he had received the payment for the land he had sold and that the money was invested in
property.
In terms of changes to the project, he said that the property needs a crossing over the water channel for
cattle and that he had previously agreed a well with Construtora Gomes Lourenço.
Owner: LEONARDO FERREIRA DE FARIA PROPERTY 12MD:
MASSAMBARÁ DO PÂNTANO Farm
The owner resides with his family on another rural property outside the project area. These two properties
and his pension are his main source of income.
Work on the farm is carried out by the owner and family members, as they have no permanent employees,
but usually higher temporary workers between January and April for pasture clearing.
The owner said he had received full payment for sale of the land and believes the negotiation was
reasonable, alleging that Construtora Gomes Lourenço did not pay market values. The cash was invested on
the property.
In terms of changes to the project, the owner said that the new water channel route would affect his
farmland and two springs would be damaged, expressing his concern with the cattle's access to water and
subsequent reduction of the water from his springs. He pointed out that offence would be required to avoid
the cattle crossing the river.
Mr. Leonardo said he was aware of new negotiations for the new land affected.
Revisão do Estudo de Impacto Ambiental – EIA - Piedade SHS – Março/2007, Pág.137
5 BIOTIC ENVIRONMENT5.1 Description of the survey area
The forecast location for construction of the SHS-Piedade is located in the municipal region of Monte
Alegre de Minas, in the state of Minas Gerais, near the cities of Centralina and Canápolis. It is located in the
southern basin of the Piedade river - basin of the Paranaiba river, a region in the Minas triangle and Alto
Paranaiba - in the extreme west of Minas Gerais. (SEPLAN , 1987). Phytogeographically it is in the Cerrado
biome (BASTOS FILHO, 1974).
The new reservoir is located in the Cerrado Biome, considered one of the 25 top priority areas worldwide
for conservation because of its biological wealth and high anthropic pressure which it is under (Mittermeier
et al., 2000). Covering an area of 204,000,000 ha, equivalent to 23% of Brazilian land mass, the Cerrado is
considered the savannah with the greatest vegetable by diversity in the world, with the presence of various
phytofisionomies, reflecting the substantial diversity of its flora (> 10,000 species of plants, 4400 of which
are endemic). The fauna includes 837 species of bird; 67 genuses of mammals, covering 161 species in 19
of which are endemic; 150 species of amphibian, of which 45 are endemic; 120 species of reptiles, of which
45 are endemic (Myers et al., 2000).
The Cerrado landscape is a mosaic of open environments (cleared fields, savannah fields and other
variations and cerrado in the strict sense) as well as closed environments (thick forest) occupying plateaus
and uplands. They are dry environments with seasonal influences and in the dry season there is desiccation
and leaf loss.
According to VELOSO (in IBGE, 1992), the forest formations are very different, representing seasonal
forests (deciduous and semi-deciduous), riparian forest and flooded forest. The seasonal, deciduous forests
cover sides and tops of hills with litolic soil, with substantial leaf loss in the dry season. Seasonal, semi-
deciduous forests present less leaf loss and appear on plains on more fertile soil. The riparian forest cover is
fertile soil along the banks of water courses and drainage ditches, forming "corridors" of perennial
vegetation. The flooded forests, which are also perennial, can be found at river sources in flatter and more
swampy areas.
In recent decades, this biome has been altered by the expansion of agricultural frontiers and illegal
extraction of vegetation. In this region, there is a predominance of pasture, pineapple plantations (Ananas
sp.) and a narrow strip of riparian forest.
5.2 FLORA
5.2.1 INTRODUCTION
The Piedade SHS reservoir extends 4.42 km from the dam up to the lake, covering anthropized and
degraded land. Crop plantations, landslides areas and buildings are common throughout the reservoir area.
Drawing PIE-VEG-002 is attached to this document describing the vegetation in the project area.

Revisão do Estudo de Impacto Ambiental – EIA - Piedade SHS – Março/2007, Pág.138
Table 5.1Phytofisionomy distribution in the surrounding area and directly affected area (ADAE)
Surrounding Area (AE) (ha) Directly Affected Area(ADA) (ha)
Pasture 3008 113Crops 377 -Cerrado 105 -Riparian forest 23 10Total 3515 123
5.2.2 Methodology
Considering the size of the development, to levels of vegetation coverage were defined as the basis for
evaluating the environmental impacts in this area.
Description of vegetation coverage began by determining the phytogeographic domain in which the Area of
Influence AI is located. In order to define the phytogeographic domain the basic tool used was mapping and
descriptions from the RADAMBRASIL Project (BRASIL, 1983), contained in Folio SE. 22 (Goiânia).
The description of the location was based on observation and data collected in the project location
reconnaissance campaign on 25/07/01.
5.2.3 Regional Classification
Macro scale mapping of the RADAMBRASIL Project (BRASIL, 1983) places the project in the Savannah
Region (Cerrado Latu senso), a biome covering approximately 23% of the Brazilian landmass and presents a
diversified and specific flora. There are approximately 6500 vascular plant species (Mendonça et al. 1998),
the majority endemic to this biome (Myers et al., 2000).
This domain presents a mosaic of different types of vegetation, classified as forest formations (riparian
forest, riverside forest, deciduous seasonal forests, semi-deciduous seasonal forest and Cerradão), savannahs
(Cerrado “sensu stricto”, Parque de Cerrado, Palmeiral and Vereda), and rural (Campo Sujo, CampoRupestre and Campo Limpo), according to the classification proposed by Ribeiro & Walter (1998).
There are few forest formations in the Cerrado and they appear in patches associated with more fertile soils
(deciduous seasonal forest, semi-deciduous seasonal forest and Cerradão) and also a long water courses
(riparian forest and overhanging forest) (Cruzeiro & Schiavini 2001). Forest formations are very important
in the environment and anthropic relations for example in protecting the soil against erosion, regulating the
flow of drainage water, maintaining the nutrient cycle, as a source of food and refuge for animals, forming
ecological corridors, as a supply of wood, etc. (Cardoso et al. 2003). Additionally, they contribute
approximately 40% of the flora diversity in the Cerrado (Mendonça et al. 1998), a substantial contribution
given that they occupy small areas in relation to rural and

Revisão do Estudo de Impacto Ambiental – EIA - Piedade SHS – Março/2007, Pág.139
savannah areas.
The Savannah is defined as xeromorphic vegetation, preferably in a seasonal climate (more or less 6 dry
months), covering lixiviated, aluminized soils, occurring throughout the entire Neotropical Zone.
According to the current Brazilian vegetation coverage map, available at the IBGE website
(www.ibge.gov.br ), the entire Minas Triangle is classified as "Anthropized areas". The background of
economic development in the region is marked by the intensive use of land, mainly for crops and cattle
(Radambrasil, 1983). As a result, there is little remaining native vegetation and the countryside is basically
dominated by vast areas of pasture and crops. The native vegetation still present in the Piedade SHS AI is
very fragmented and comprises mainly fragments of Cerrado “sensu stricto”, Cerradão, Semi-Deciduous
Seasonal Forest and interrupted and narrow bands of Riverside and Riparian Forest long water courses.
According to the descriptions in Folio SE 22 (Goiânia), guidance from the IBGE (1991) and Scolforo and
Tavares (2005), there are four subgroups of formation:
Forested savannah (cerradão)
A formation with a typical and characteristic forestry physiognomy, restricted to lixiviated sandstone areas
with deep soil, occurring in eminently seasonal tropical climates. The height of individual trees varies
between 7 and 15 m and the trunks are not as twisted and do not have as many branches as cerrado-field
trees. Although the crowns of the trees touch, light penetrates inside these forests allowing development of
smaller shrubbery, forming a lower strata which is sometimes very dense.
We can differentiate seasonal forests by the abundant present of typical cerrado tree species such as:Terminalia argentea (capitão), Hymenaea courbaril (jatobá), Salvertis convallariodora (pau-decolher),
Bowdichia virgilioides (sucupira-preta), Pterodon pubescens (sucupira-branca), Dimorphandra mollis(faveiro), Qualea grandiflora (pau-terra-de-folhas-grandes), Qualea parviflora (pau-terra-de-folhas-
miúdas), Anadenanthera peregrina (angico-preto) and Kielmeyera coriaceae (pau-santo), CaryocarBrasiliense (pequi), Xylopia aromática (pimenta-de-macaco), etc.

Revisão do Estudo de Impacto Ambiental – EIA - Piedade SHS – Março/2007, Pág.140
Figure 5.1 General view of a fragment of the cerradão in the AI,
this is one of many fragments that will not be cut down.
Forested savannah (cerrado-countryside)
The Cerrado countryside, either in the Midwest, where we find its core region, or in any other area where it
occurs always presents the same characteristics, in other words low, widely spaced and twisted trees with
very irregular crowns, thick bark covering, leathery and generally hairy leaves. A lot of light hits the ground
which is sometimes there will covered by tufts of grass and scrubby plants, which throughout the drought
present dry branches, leading to fires which may arise from natural or other causes.
The botanical composition, despite similarity with the Forested Savannah (Cerradão), has dominant
ecotypes which characterize environments according to the geographic area, in Minas Gerais citing the
Dimorphandra mollis (faveiro).
This landscape is sometimes interrupted by riverside forests which accompany drainage ditches.
Park Savannah
This vegetation is characterized by vegetation which is essentially open, formed by a carpet of grass with
some trees at an average height of 2 to 3 m almost always of a single type.
The anthropic Park Savannah is found throughout the country and natural only to the Ilha do Marajó,
Pantanal Sul-Mato-Grossense and Depressão do Araguaia.
Grassy-Woody Savannah
In this physiognomy, when naturally occurring, there is a prevalence of grasses interlaced with woody,
scrubby plants which occupy extensive areas dominated by hemicryptophites and which, little by little, when
controlled by a fire or grazing, substituted by geophyes which can be distinguished

Revisão do Estudo de Impacto Ambiental – EIA - Piedade SHS – Março/2007, Pág.141
by their underground stalks which are therefore more resistant to cattle trampling and fire.
The flora is very diversified, with woody plants most representative of the ecotype: Andira humilis(Angelim-do-cerrado), Cassia spp (fedegoso-do-cerrado), Byrsonima spp (murici-rasteiro), Bauhinia spp
(unha-de-vaca), Attalea spp (palmeirinha-do-cerrado); and the grasses: Axonopus spp (grama-do-cerrado),
Andropogon spp (capim-do-cerrado), Aristidia pallens (capim-barba-de-bode), Echinolaena inflexa;
Paspalum spp.
Savannah formations in the region through which the Piedade river passes our accompanied by riversideforests along drainage ditches, beside springs and on wetland. The most common species are Envira(Xylopia sp), ucuuba (Virola sp), pau-pombo (Tapirira sp), jacareúba (Calophyllum sp) and the palmeira
buriti (Mauritia sp).
According to information from Ibama, the Brazilian Cerrado is known as the richest Savannah in the worldin terms of biodiversity, as the very rich flora contains more than 10,000 plant species, 4400 of which areendemic.
RIBEIRO (2001) cites a recent flora survey by EMBRAPA-Cerrados in partnership with other research and
teaching institutions covering only typical Cerrado vegetation (excluding riverside forest and mesophile
forest) involving the Federal District, Minas Gerais, São Paulo, Tocantins, Bahia, Piauí and Maranhão. This
survey identified 542 woody species, none of which were present throughout the entire area studied and 140
of which live only in two of the areas studied. The most commentary was the Qualea grandiflora known as
the pau-terra-defolha-larga, found in 82% of the areas visited.
In the Minas Triangle, most of the natural vegetation has been eliminated by crop farming or replaced bypastures and already presents a substantial degree of degradation. All of this anthropic transformation haschanged the physiognomy of the regional Cerrado.
5.2.4 Local Description
Description the vegetation in the reservoirs and water channel.The vegetation found in the reservoirs can be classified in three distinct phytofisionomies.
Cerrado stricto sensu, which is mostly found at a distance of 20 to 100 m from the riverbank, riparianforest, which extends along the river and has small gaps which vary between five and 10 m wide dependingon the slope of the land and semi-deciduous seasonal forests, quite different from the others, which issubstantially anthropized and appears much less frequently.
The types within the AI are described below, except for the cerradão which was described in the previous
section of the document.

Revisão do Estudo de Impacto Ambiental – EIA - Piedade SHS – Março/2007, Pág.142
Alluvial forests
Forest formations associated with watercourses are divided into two types: Riverside Forests and Riparian
Forests. Riverside Forests follows small streams and the vegetation canopy front opposite banks meets,
forming a gallery. Riparian Forests occurs along the banks of medium and large rivers and the vegetation is
different from Riverside Forests because it is deciduous and the composition of the flora difference. In the
Riparian Forests there are different levels of leaf shedding and the Riverside Forest is perennial (Ribeiro e
Walter 1998).
Riparian forest
In the SHS Piedade AI, this biotype is found along the margins of the River Uberabinha, but it has many
gaps. Largest sections of the riverbank are not covered by Riparian Forest which has been substituted by
pastures.
The fragments visited present a similar structure to that described as Semi-Deciduous Seasonal Forest and isvery similar in flora composition. This results in a dominance of trees like Myracrodruon urundeuva(aroeira), Pterodon pubescens (sucupira-branca), Trichilia clausseni (Catiguá) and Cedrela fissilis (cedro).Some epiphytes were found in this section formation, such as Pleopeltis angusta e Pteris denticulata andpeperômia (Peperomia sp).
Alongside the Uberabinha River, where there is no riparian forest, we found various types of ruderal specieswhich are dominant at these locations. Most common were the lírio-do-brejo (Hedychium coronarium) andcapim-colonião (Urochloa maxima).
Figure 5.2 General view of the fragments of riparian forest in thePiedade SHS ADA.
Riverside forestsA few fragments of this type of forest were visited and most of the streams in the area do not present to their
original vegetation. Riverside forests are characterized as perennial forming enclosed corridors over
watercourses. The trees do not reach more than 20 m, and the main species found include Cecropia
pachystachya (embaúba), Copaifera langsdorffii (paud’óleo), Guarea macrophylla, Hedyosmum
brasiliense, Miconia spp., Sweetia fruticosa (sucupira-amarela).
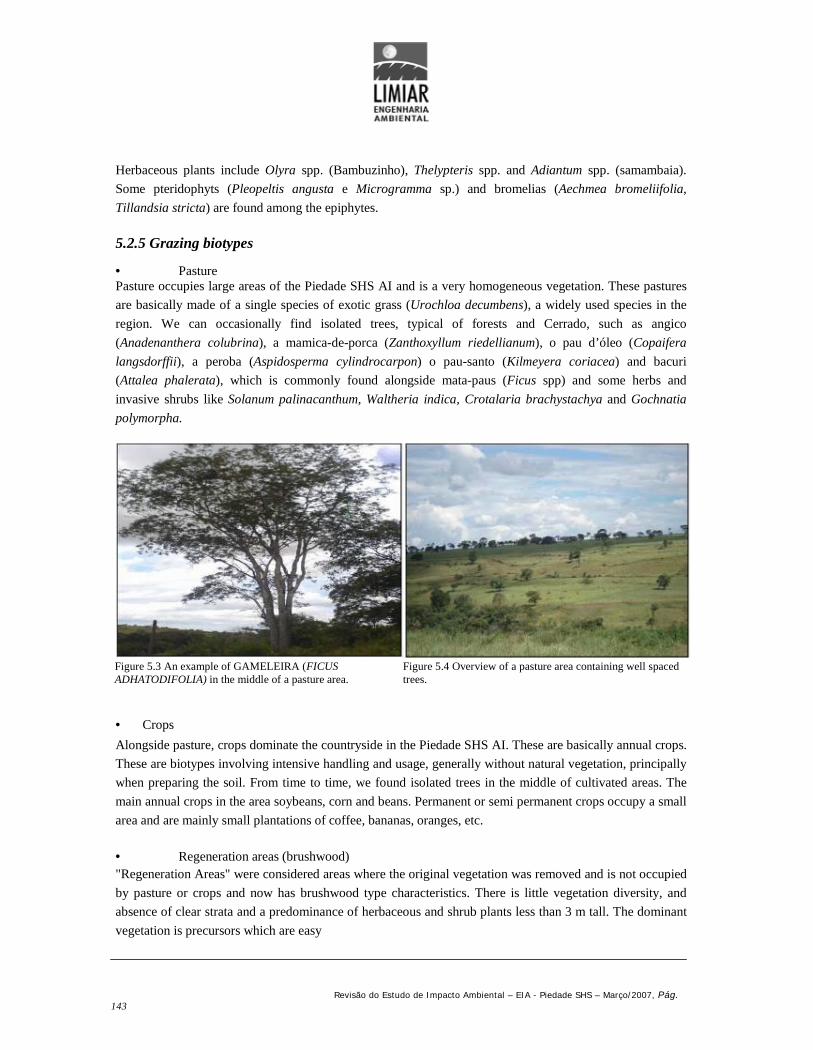
Revisão do Estudo de Impacto Ambiental – EIA - Piedade SHS – Março/2007, Pág.143
Herbaceous plants include Olyra spp. (Bambuzinho), Thelypteris spp. and Adiantum spp. (samambaia).
Some pteridophyts (Pleopeltis angusta e Microgramma sp.) and bromelias (Aechmea bromeliifolia,
Tillandsia stricta) are found among the epiphytes.
5.2.5 Grazing biotypes
PasturePasture occupies large areas of the Piedade SHS AI and is a very homogeneous vegetation. These pastures
are basically made of a single species of exotic grass (Urochloa decumbens), a widely used species in the
region. We can occasionally find isolated trees, typical of forests and Cerrado, such as angico
(Anadenanthera colubrina), a mamica-de-porca (Zanthoxyllum riedellianum), o pau d’óleo (Copaifera
langsdorffii), a peroba (Aspidosperma cylindrocarpon) o pau-santo (Kilmeyera coriacea) and bacuri
(Attalea phalerata), which is commonly found alongside mata-paus (Ficus spp) and some herbs and
invasive shrubs like Solanum palinacanthum, Waltheria indica, Crotalaria brachystachya and Gochnatia
polymorpha.
Figure 5.3 An example of GAMELEIRA (FICUSADHATODIFOLIA) in the middle of a pasture area.
Figure 5.4 Overview of a pasture area containing well spacedtrees.
Crops
Alongside pasture, crops dominate the countryside in the Piedade SHS AI. These are basically annual crops.
These are biotypes involving intensive handling and usage, generally without natural vegetation, principally
when preparing the soil. From time to time, we found isolated trees in the middle of cultivated areas. The
main annual crops in the area soybeans, corn and beans. Permanent or semi permanent crops occupy a small
area and are mainly small plantations of coffee, bananas, oranges, etc.
Regeneration areas (brushwood)"Regeneration Areas" were considered areas where the original vegetation was removed and is not occupied
by pasture or crops and now has brushwood type characteristics. There is little vegetation diversity, and
absence of clear strata and a predominance of herbaceous and shrub plants less than 3 m tall. The dominant
vegetation is precursors which are easy
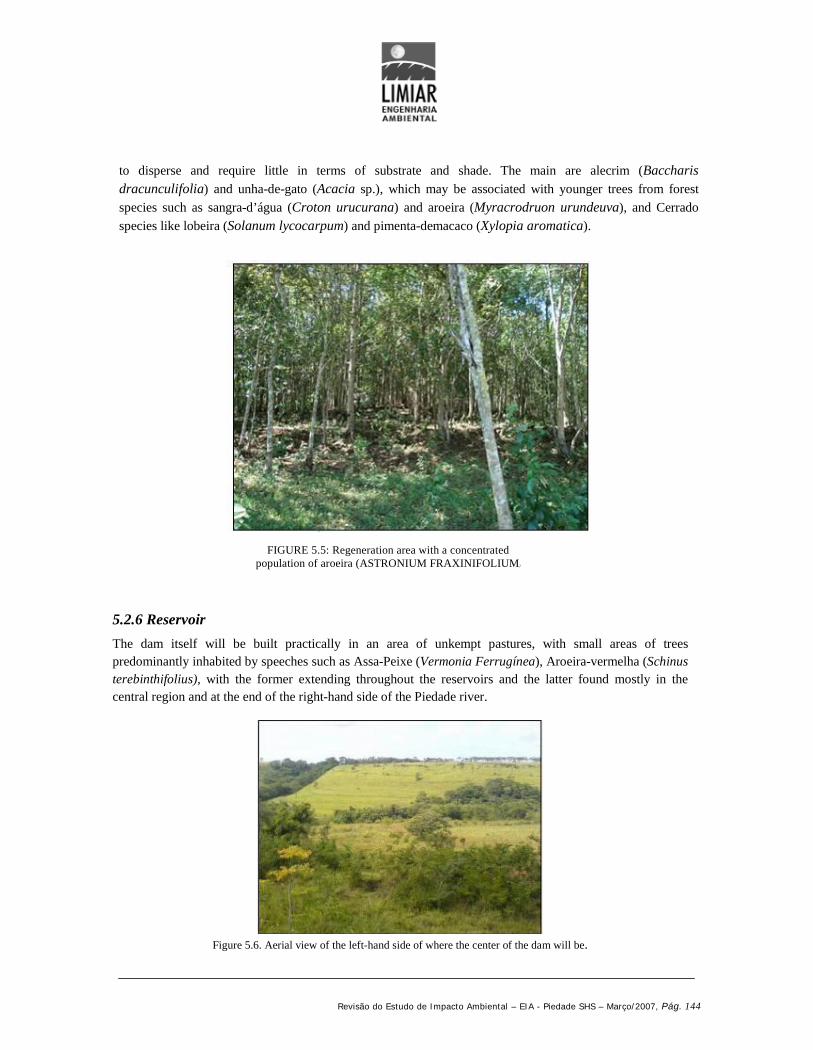
Revisão do Estudo de Impacto Ambiental – EIA - Piedade SHS – Março/2007, Pág. 144
to disperse and require little in terms of substrate and shade. The main are alecrim (Baccharisdracunculifolia) and unha-de-gato (Acacia sp.), which may be associated with younger trees from forest
species such as sangra-d’água (Croton urucurana) and aroeira (Myracrodruon urundeuva), and Cerrado
species like lobeira (Solanum lycocarpum) and pimenta-demacaco (Xylopia aromatica).
5.2.6 Reservoir
The dam itself will be built practically in an area of unkempt pastures, with small areas of treespredominantly inhabited by speeches such as Assa-Peixe (Vermonia Ferrugínea), Aroeira-vermelha (Schinusterebinthifolius), with the former extending throughout the reservoirs and the latter found mostly in thecentral region and at the end of the right-hand side of the Piedade river.
Figure 5.6. Aerial view of the left-hand side of where the center of the dam will be.
FIGURE 5.5: Regeneration area with a concentratedpopulation of aroeira (ASTRONIUM FRAXINIFOLIUM)

Revisão do Estudo de Impacto Ambiental – EIA - Piedade SHS – Março/2007, Pág.145
In this region, there is also riparian vegetation extending 4.42 km, with gaps, up to the reservoirs leak. Thisvegetation various from five to 10 m wide depending on the slope of the land along the riverbank.
There are also large, native trees, generally isolated in degraded pastures with large spaces between them.Some of the tree species observed include: jacarandás (Machaerium spp), pauterra-folha-miúda (Qualeaparviflora), pau-terra-folha-larga (Qualea grandiflora), ipê-caraíba (Tabebuia caraíba), jatobá
(Himenaea stigonocarpa), vinhático (Plathymenia reticulata), lixeira (Curatella americana), Annonaspp, patas-de-vaca (Bauhinia spp), macaúba (Acrocomia sp), aroeira (Astronium sp), Gameleira (Ficusadhatodifolia), etc.
At coordinate X:7932529 and Y: 710469, we can see slightly more exuberant forest because of the greatervolume of water in the soil from a stream flowing into the Piedade river. In this region, we observed certainspecies like: ingá (Inga spp), palmeira-buriti (Mauritia flexuosa), pau-pombo (Tapirira sp), copaíba
(Copafera sp), ucuuba (Virola sp), Xylopia sp, etc.
Figure 5.7 Riparian forest located along the Boa Vistastrain, which flows into the Piedade river
Figure 5.8 View of the interior of the Boa Vista stream
Other affluents can be seen along the Piedade river: Cachoeirinha and another with no name on the rightbank and Valinhos and another two on the left. All of these affluents have very well conserved riparianforest. Species like Campomanesia guaviroba (Guabiroba), Croton urucurana (Sangra-d'água),
Copaifera langsdorffii ,(Maria-pobre), Inga sessilis (Ingá), Myracrodruon urundeuva (Aroeira), Tremamicrantha (Grandiúva), and others are found in these locations.
The vegetation in the middle third of the reservoirs is mostly sparse Cerrado, with trees almost always of the
same species, varying between two and 3 m in height and with a diameter of no more than 8 cm when
measured at chest height (130 cm), pasture and crops.

Revisão do Estudo de Impacto Ambiental – EIA - Piedade SHS – Março/2007, Pág.146
Figure 5.11 Pasture in the intermediate third of thereservoir, a landscape which repeats throughout thereservoirs.
Figure 5.12 View of pasture along the left hand sideof the reservoirs
In the reservoirs lake, at point X: 7931672, Y: 713456, there is a waterfall known as Erson’s waterfall whichwill be totally submerged by the reservoir. There is significant riparian vegetation because of the quantity of
water on site in an environment which is very favorable for species like: Inga sessilis (Ingá), Croton
urucurana (Sangra-d'água), Myracrodruon urundeuva (Aroeira), Trema micrantha (Grandiúva).
5.2.7 Water channel
At this site the landscape is completely anthropízed with tree species spread throughout abundant pasture.
Once again, species like assa-peixe (Vermonia Ferrugínea), Aroeira-vermelha (Schinusterebinthifolius), most common throughout this area.
The SHS water channel will run mainly through pasture areas with some isolated trees, as well as a little
secondary vegetation.
Photo 5.10:Scrubby cerrado in the intermediate level ofthe reservoir, vegetation varying between 2 and 3 meterstall
Photo 5.9 Pineapple plantation, very common in theregion

Revisão do Estudo de Impacto Ambiental – EIA - Piedade SHS – Março/2007, Pág.147
The power station and tailrace will mainly intercept Riverside forest whose physiognomy is at a stage of
natural regeneration.
Tree species found in Riverside Forests include: ingá (Inga spp), palmeira-buriti (Mauritia flexuosa), pau-pombo (Tapirira sp), copaíba (Copaifera sp), ucuuba (Virola sp), Xylopia sp, etc.
5.2. 8. Final Considerations
The area belonging to be Piedade SHS reservoirs contains mainly riparian forests in a secondary stage of
development and covers around 60% of the area surrounding the river, varying between five and 10 m wide,
while we can also find fragments of cerradão, which will not be affected by the flooding. Some semi-
deciduous forests can be found in areas close to the SHS, however these are not within the AI.
Table 5.2List of some species encountered in the Piedade SHS area.
SCIENTIFIC NAME COMMON NAME BOTANICAL FAMILYAnnona Cacans Araticum AnacardiaceaeAstronium fraxynifolium Gonçalo alves AnacardiaceaeBau in some semi-deciduousforests can be found in areasclose to the hina sp.
Unha de vaca Leguminosae
Bowdichia virgilioides Sucupira Preta LeguminosaeByrsonima coccolobifolia Murici-do-cerrado MalpighiaceaeCampomanesia guaviroba Guabiroba MyrtaceaeCasearia sylvestris Guaçatunga FlacourtiaceaCocos nucifera Coqueiro PalmáceaeCecropia pachystachya Embaúba CecropiaceaeCopaifera langsdorffii Copaiba LeguminoseaCoutarea hexandra Quina RubiaceaeCroton urucurana Sangra d'água EuphorbiaceaCuratella americana Sambaíba, Lixeira DileniaceaeDidimopanax morototoni Folheiro branco AraliaceaEriotheca gracilipes Imbiruçu do litoral BombacaceaeErythroxylon sp. Mercúrio ErytrhoxylaceaeEugenia brasiliensis Grumixama MyrtaceaeEugenia leitonii Araçá piranga MyrtaceaeEugenia multicostata Araçá açu MyrtaceaeEugenia pyriformis Uvaia MyrtaceaeEugenia speciosa Laranjinha do mato MyrtaceaeEugenia tomentosa Cabeludinha MyrtaceaeEugenia uniflora Pitanga MyrtaceaeFicus gameleira Gameleira MoraceaeFicus insipida Figueira do brejo MoraceaeHymenaea stigonocarpa Jatobá Leguminosae-CaesalpinoideaeInga uruguensis Ingazeiro Leguminosaea – MimosoideaeInga vera Ingá verde LeguminosaeLithraea malleoides Aroeira Brava AnacardiaceaeLonchocarpus guilleminianus Embira de sapo FabaceaeLonchocarpus subglaucescen Embira LeguminosaeMagonia pubescens Tingui SapindaceaeLuehea divaricata Açoita cavalo TiliaceaeOmosia Arborea Olho-de-Cabra LeguminosaeQualea Grandiflora Pau-Terra VochysiaceaeQualea Multiflora Pau-Terrinha VochysiaceaePlatypodium elegans Jacarandá-do-campo Fabaceae
Continued…. . .

Revisão do Estudo de Impacto Ambiental – EIA - Piedade SHS – Março/2007, Pág.148
Continued... . .
SCIENTIFIC NAME COMMON NAME BOTANICAL FAMILY
Psidim cattleianum Araçá amarelo MyrtaceaePterodon emarginatus Sucupíra Branca FabaceaeRapanea umbellata Pororoca MyrtaceaeSchinus terebenthifollius Aroeira mansa AnacardiaceaeTapira guianensis Tapiriri AnacardiaceaeTerminalia sp. Terminalia marfim CombretaceaeTrema micrantha grandiúva UlmaceaeVernonia sp. Assa Peixe AsteraceaeVirola sebifera Ucuuba MiristicaceaeXylopia sericea Pimenta de macaco Annonaceae
5.3 Mammalian Fauna
5.3.1 INTRODUCTION
The biodiversity in areas altered by anthropic interference is constantly under threat. One of the most
important factors contributing to the situation may be the economic value tribute to the land at areas covered
with natural vegetation generate no financial return for the owners and it is more profitable to convert this
land into pasture or plantations, discouraging their protection.
Vegetation is one of the most important characteristics of the habitat for aerial and terrestrial fauna. Changes
to the vegetation cover direct effect on the entire food chain, altering the diversity of species because it
changes to basic factors: food and shelter (FIRKOWSKI,1990).
More specifically, in terms of this project, fragmentation of regional vegetation (Cerrado, Semi-Deciduous
Seasonal Forest, Riparian Forest), caused by past deforestation to make pasture and crop areas, as had
serious consequences mainly for mammalian species, especially larger ones, a fact we can see from the total
disappearance of some species in certain regions and locations. These factors in conjunction mean that some
species of mammals in these biomes are currently on the official list of Brazilian fauna threatened with
extinction.
5.3.2 METHODOLOGY
Studies on mammalian fauna in the region for the Piedade SHS project were carried out in July 2001,
November 2003 and December 2004.
Surveys were based on indirect evidence (tracks, feces, carcasses and others) and direct evidence
(visualization and/or vocalization).
Bibliographic surveys on regional fauna were used to complement data alongside interviews with local
inhabitants, selecting the information obtained. This methodology was not quantitative. The interview method,
when correctly

Revisão do Estudo de Impacto Ambiental – EIA - Piedade SHS – Março/2007, Pág.149
applied, can be an important tool when building an inventory of species. This method is an essential source
of information on mammals which are easily identified by external characteristics like edentates, carnivores,
primates, ungulates, etc (VOSS & EMMONS, 1996). In this case, interviews were carried out with people
living in the region initially noting the species voluntarily cited by those interviewed.
In the 2004, traps were used to capture live specimens in cages, placed along the transects of the Riparian
Forest, in pasture and brushwood (photo 5.1 to photo 5.5). 10 capture stations were created with two traps
each, totaling 20 traps, located in:
Pasture region (A1) - pasture area located on the left bank of the Piedade River on the farm belonging to Mr.
Roosevelt Guimarães Diniz, whether penstock will be located. 10 capture stations were set up in this area
with two traps each, totaling 20 traps.
Pasture region (A1) - area formed by a fragment of riparian Forest located on the left bank of the Piedade
River on the farm belonging to Mr. Roosevelt Guimarães Diniz, close to the low flow section. 10 capture
stations were set up in this area with two traps each, totaling 20 traps.
Cerrado brushwood (A3) – an area of brushwood located on the left bank of the Piedade River with the
presence of cattle in the future region of the reservoirs on the farm belonging to Mr. Francisco Carlos Vieira.
10 capture stations were set up in this area with two traps each, totaling 20 traps.
Pasture region (A1) - area formed by a fragment of riparian Forest located on the left bank of the Piedade
River on the farm belonging to Mr. Francisco Carlos Vieira, close to the future dam and reservoir. 10 capture
stations were set up in this area with two traps each, totaling 20 traps.
Cerrado brushwood (A1) - brushwood area located on the left bank of the Piedade River on the farm
belonging to Mr. Antônio Kheds Sobrinho, close to the lake of the future reservoir. 15 capture stations were
set up in this area with two traps each, totaling 30 traps.
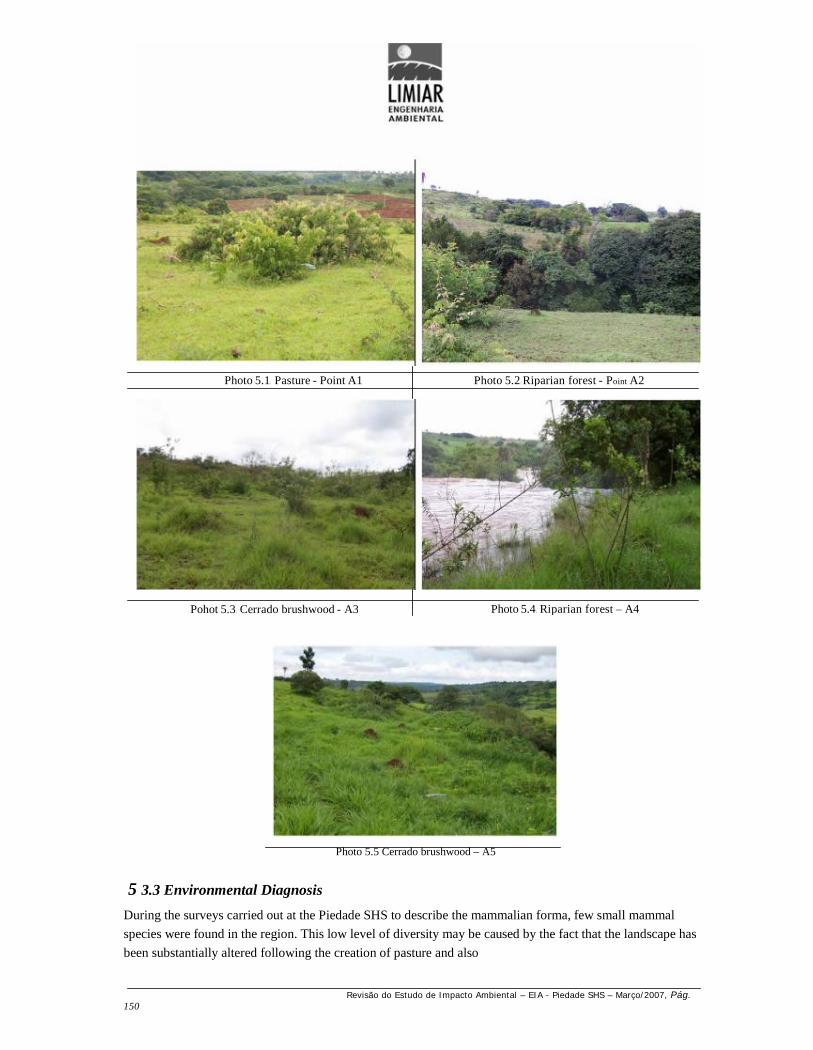
Revisão do Estudo de Impacto Ambiental – EIA - Piedade SHS – Março/2007, Pág.150
Photo 5.5 Cerrado brushwood – A5
5 3.3 Environmental Diagnosis
During the surveys carried out at the Piedade SHS to describe the mammalian forma, few small mammal
species were found in the region. This low level of diversity may be caused by the fact that the landscape has
been substantially altered following the creation of pasture and also
Photo 5.1: Pasture - Point A1 Photo 5.2: Riparian forest - Point A2
Photo 5.4: Riparian forest – A4Pohot 5.3: Cerrado brushwood - A3

Revisão do Estudo de Impacto Ambiental – EIA - Piedade SHS – Março/2007, Pág.151
crops, more specifically pineapples, commonly found along the Piedade River.
Table 5.3List of small mammal species encountered in the Piedade SHS area.
Order Family Species
MARSUPIALIA Família Didelphidae Didelphisalbiventris
RODENTIA Família Muridae Oryzomys subflavusOligoryzomys sp
In the Cerrado region various species of medium-sized and large mammals were found such as the tatu peba
(Euphractus sexcinctus), tatu galinha (Dasypus novencinctus), in semi-fossorial habitats, jaratataca(Conepatus semistriatus), furão (Conepatus sp.), cachorro do mato (Cerdocyon thous) and tapeti (Sylvilagusbrasiliensis). Two species of tamanduá bandeira (Myrmecophaga tridactyla) were observed. There were
also reports of the tamanduá mirim (Tamandua tetradactyla), which is rarer in the region according to local
population. There were various reports of the onça parda or sussuarana (Puma concolor), which, accordingto local inhabitants, is frequently seen..
Photo 5.7: OLIGORYZOMYS SP – RATO DO MATOPhoto 5.6: Captured animal
Photo 5.8: ORYZOMYS SUBFLAVUS – RATO DE CANA Photo 5.9: DIDELPHIS ALBIVENTRIS - GAMBÁ

Revisão do Estudo de Impacto Ambiental – EIA - Piedade SHS – Março/2007, Pág.152
The macaco prego (Cebus apella) was one of the most common mammals in the Semi-Deciduous SeasonalForest areas.
The most frequently seen mammal in riparian forests was the sagui (Calithrix penicillata). Many mammalsare dependent on this type of vegetation, using it for shelter, food, dispersion, etc. These include the capivara(Hydrochaeris hydrochaeris), in semi-aquatic habitats, the mão pelada (Procyon cancrivorus), which feedsoff crustaceans, amphibians and other aquatic animals, the mutum (Crax fasciolata) and tree living specieslike the macaco-prego (Cebus apella) and sagui (Callithrix penicillata). The riparian Forest is fundamentalfor survival of the otter (Lontra longicaudis).
In fact, in terms of mammals, a mosaic of existing forest environments least to the existence of many species
which live indiscriminately among them, such as the veado catingueiro (Mazama guazoubira), coati (Nasua
nasua), paca (Agouti paca), cutia (Dasyprocta sp) and others. The cutia was reported as a rare species in the
region.

Revisão do Estudo de Impacto Ambiental – EIA - Piedade SHS – Março/2007, Pág. 153
Table 5.4List of medium-sized and large mammal species encountered in the Piedade SHS area.
Sighting location: AI: area of influence, AE; surrounding Area – ADA:; directly affected areaFauna status by category: CI: used for hunting; X: for domestication; AM: Threatened with extinction; RA:rare species(locally)Prevalence by type of habitat: C: countryside; FL: forest; DU: fresh water (encompassing species with habitats whichare strictly aquatic or linked to environment such as swamps and marshes).The FL/C and C/FL conventions mean the species inhabits two environments, however the former is the preferredhabitat. Registration method: I: information; D: direct observation (viewed); V: traces

Revisão do Estudo de Impacto Ambiental – EIA - Piedade SHS – Março/2007, Pág. 154
The lower level of diversity in the future Piedade SHS region was expected, as the area is dominated by
anthropized environments. The natural environment has already changed substantially and what remains of
the riparian forest may not be sufficient to support a high level of mammal diversity.
5. 3.4. Final Considerations
Throughout the future deployment area of the Piedade SHS we found regions which have been changed
substantially by man, which may restrict the occurrence of certain mammal species which require preserved
environments for survival. The presence of domestic animals (cattle, horses and dogs) may drive away some
wild mammal species. Because of the substantial anthropic pressure historically present in the area, we can
say that for local mammalian fauna there will be little change. Many sampled species are very generalized
and a highly adaptable in terms of environment, quite capable of adapting to the impact inherent to
deployment of the SHS.
5.4 Birdlife
5.4.1
INTRODUCTION
Birds are one of the major fauna groups in impact evaluation surveys, because we are able to obtain large
volume of data compared with other vertebrates. They are always present with a large number of species and
often many individuals. This makes them easier to identify (most can be identified from visual and/or
audible observation) and are well known in terms of taxonomy. They use various terrestrial and aquatic
habitats and most are diurnal. Finally, several species are subject to environmental restrictions with habitats
requirements that make them good biome indicators.
5.4.2 METHODOLOGY
Studies on birdlife in the region for the Piedade SHS project were carried out in July 2001, and November
2003.
A census technique was used on random transects to create an inventory of the birdlife in the region. This
methodology also attempted to register the presence of indicative, rare, threatened, endemic, migratory,
domesticated, hunted and other species subject to some type of environmental restriction.
The census was also used to evaluate the variety (list of birds observed) and ecological characterization of
the species and their preferred environments/habitat requirements.
The species were observed and identified with the aid of binoculars. Birdcalls were registered using a mini
recorder and identification was based on “Ornitologia Brasileira” (SICK, 1997).

Revisão do Estudo de Impacto Ambiental – EIA - Piedade SHS – Março/2007, Pág. 155
5. 4.3 Environmental Diagnosis
During the surveys carried out in the SHS Piedade area, 138 species of bird were registered, distributed
among 16 Orders and 36 Families (table 5.5). 32 species are sought out for domestication, which include all
of the psitacídeos (parrots, cockatoos, maritacas) as well as many Passeriformes, such as the canário da terra
(Sicalis flaveola) and the azulão (Passerina brissonii).
79 species inhabit countryside landscapes, 32 inhabit forest habitats and 20 species are considered flexible
because they inhabit more than one environment simultaneously. 11 species are connected to freshwater
environments and may have a more direct link with water, such as the martim pescadores, saracuras, or
inhabit hydromorphic areas, such as the tesoura do brejo (Gubernetes yetapa) and noivinha (Arundinicola
leucocephala).
Four species are migratory, citing the falcão de coleira (Falco femoralis) and one is endemic to the Cerrado,
the gralha do campo (Cyanocorax cristatellus). Three species are considered to be threatened with
extinction, the canário da terra (Sicalis flaveola), the mutum de penacho (Crax fasciolata) and the
Barranqueiro-deolho-branco (Automolus leucophthalmus).
One species presumed to be under threat as the azulão (Passerina brissonii). Two species have habitats to
waterfalls, the andorinhão de coleira (Streptoprocne zonaris) and the taperuçu (Cypseloides senex).

Revisão do Estudo de Impacto Ambiental – EIA - Piedade SHS – Março/2007, Pág. 156
Table 5.5List of bird species encountered in the Piedade SHS area.
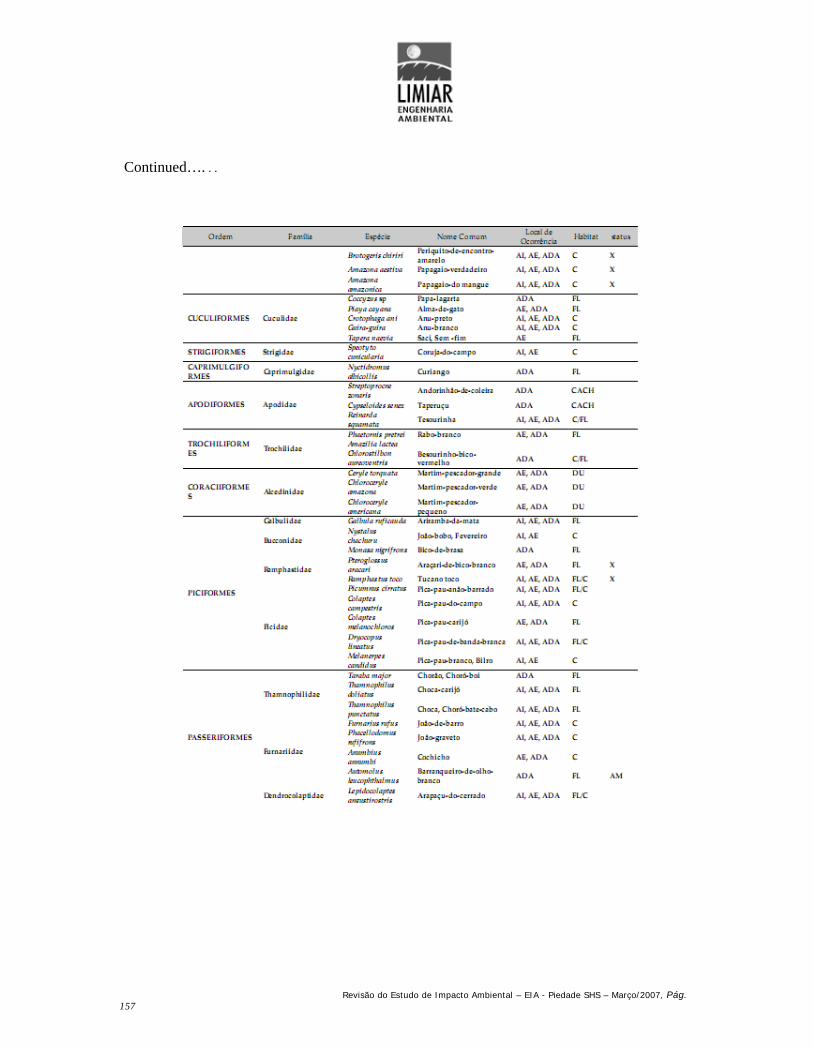
Revisão do Estudo de Impacto Ambiental – EIA - Piedade SHS – Março/2007, Pág.157
Continued…. . .

Revisão do Estudo de Impacto Ambiental – EIA - Piedade SHS – Março/2007, Pág. 158
Continued... . .

Revisão do Estudo de Impacto Ambiental – EIA - Piedade SHS – Março/2007, Pág. 159
Continued…. . .
Sighting location: AI: area of influence, AE; surrounding Area – ADA:; directly affected areaFauna status by category: CI: used for hunting; X: for domestication; M: migratory; AM: Threatened with extinction;EM: endemic species in BrazilPrevalence by type of habitat: C: countryside; FL: forest; DU: fresh water (encompassing species with habitats whichare strictly aquatic or linked to environment such as swamps and marshes). CACH: Species associated with waterfalls.The FL/C and C/FL conventions mean the species inhabits two environments, however the former is the preferred habitat.

Revisão do Estudo de Impacto Ambiental – EIA - Piedade SHS – Março/2007, Pág.160
The Cerrado is normally inhabited by birds with generalist habitats. In countryside areas, common speciesare the seriema (Cariama cristata), codorna mineira (Nothura maculosa), and perdiz (Rinchotus rufescens).The tico-tico rasteiro (Ammodramus humeralis) lives in grassy areas.
In sparser Cerrado areas we find the maria-branca (Xolmis velata) and para-bala (Xolmis cinerea). Wherethere are termites, we can find the coruja buraqueira (Athene cunicularia) and the pica pau do campo(Colaptes campestris), which use these locations to build nests.
Low-lying areas are home to species such as the choca bate-cabo (Tamnophilus punctatus).
In dense Cerrado there are species such as the bem-te-vi (Pitangus sulphuratus), bem-te-vi rajado(Myiodinastes maculatus) and saira-mascarada (Nemosia pileata).
In treetops we observed predatory species such as the gavião-sovi (Ictinia plumbea) (Foto 5.10) and falcão-de-coleira (Falco femoralis) and nesting species such as the Maria-faceira (Syrigma sibilatrix) and pombas(Columba spp.).
Photo 5.10 GAVIÃO SOVI - ICTINIA PLUMBEA
Adult, dead or senile trees provide cavities which are home to many species which nest there, like papagaios(Amazona aestiva, Amazona amazonica) (Foto 5.11) and the pica pau de banda branca (Dryocopus lineatus).

Revisão do Estudo de Impacto Ambiental – EIA - Piedade SHS – Março/2007, Pág.161
Photo 5.11 PAPAGAIO - AMAZONA AESTIVA
The Semi-Deciduous Seasonal Forest provides a wider variety of resources such as flowering and fruit
flowers and also insects. These are important environments for species that need larger areas such as the
mutum-de-penacho (Crax fasciolata), which inhabit areas closer to the ground.
In the middle strata live bird species that feed off insects, such as the pica-pau-anão (Picumnus cirratus),pichito (Basileuterus culicivorus) and omnivorous species like the guaxe (Cacicus haemorrhous). Thehighest strata is inhabited by birds like the tiê-preto (Tachyphonus coronatus).
Deciduous forest can frequently be found on the hillsides adjacent to the Piedade river. One of the mosttypical types of bird in this environment, which inhabits the lower strata of the forest, is the canário-domato(Basileuterus flaveolus). In the middle and high strata there are species of bird including the bem-te-vide-bico-chato (Megarhynchus pitangua) and figuinha (Conirostrum speciosum). The acauã (Herpetotherescachinans) is a predator which lives among the treetops. It is often present, detected because of its calls.
The riparian forest is also home to species which are typical to this environment as well as species frominside and around other types of forests. The most typical species include bico-de-agulha (Galbularuficauda) (Foto 5.12), the garrinchão-de-barrigavermelha (Tryotorus leucotis) and the relógio (Todirostrumcinereum).
Photo 5.12 BICO DE AGULHA - GALBULA RUFICAUDA

Revisão do Estudo de Impacto Ambiental – EIA - Piedade SHS – Março/2007, Pág.162
There are few in backwards along the river banks providing nesting conditions for species such as martins
pescadores.
The embankments are home to ombrophilous species like the soldadinho (Antilophia galeata), or Riversideforest species such as the corocoró (Mesembrinibis cayennensis) and saracuras. The andorinha tesourinha(Reinarda squamata), are totally dependent on riverside areas with the presence of palm trees.
Date palm trees, which formed cavities, or important for nesting among many species of bird, such as thepsitacídeos (papagaios, maritacas, jandaias), pássaros pretos (Gnorimopsar chopi), and even living treeswhere several species nest like the curicaca (Theristicus caudatus).
The brushwood is mainly home to more generalised species like the a juriti (Leptotila spp.), joão-graveto(Phacellodomus rufifrons) and peixe-frito (Tapera naevia).
Anthropic areas are represented by pasture, crops and orchards. Here we find species like the codorna-mineira (Nothura maculosa), inhambu-xororó (Crypturellus parvirostris), tico-ticodo-campo(Ammodramus humeralis), pomba verdadeira (Columba picazzuro), a pomba galega (Columbacayennensis), sanhaçu (Thraupis sayaca), saira-de-bico-fino (Dacnys cayana), periquitos (Brotogerischiriri, Forpus xanthopterygius), avoante (Zenaida auriculata), tiziu (Volatinia jacarina) and papa-capim
(Sporophila nigricollis). The garça vaqueira (Bubulcus ibis) accompanies the cattle in the pastures.
The riparian forest on the Piedade river covers the section between the dam location extending upstream to
the end of the new reservoir. It is linear with a few small areas where the tree canopy has gaps. Although it
is narrow, it has a fundamental role in terms of shelter and as a corridor for dispersion of the resident fauna.
Many species are connected to this habitat, like the bico-de-brasa (Monasa nigrifrons), reloginho
(Todyrostrum cinereum) and bico-de-gulha (Galbula ruficauda), curicaca (Theristicus caudatus), and
bem te vi (Pitangus sulphuratus).
The waterfalls from the dam and the “Guiamrães” (or Piedade) waterfall are highly important locations forseveral species such as the martim-pescadores (Alcedinidae) and garça-real (Pilherodius pileatus). Two
species of andorinhões (Streptoprocne zonaris and Cypseloides senex), both have a highly specificconnection with this habitat because of shelter and nesting, with colonies around the sites.
5. 4.4. Final Considerations
Birdlife species use the riverside forest and large trees in pasture areas around the development area in order
to travel. This group of vertebrates will maybe be the least harmed by installation of the Piedade SHS.

Revisão do Estudo de Impacto Ambiental – EIA - Piedade SHS – Março/2007, Pág.163
5.5 HERPETOFAUNA
5.5.1 INTRODUCTION
Amphibians constitute an animal group with a specific type of biology because, except under certain
circumstances, they depend on water to reproduce and for activity during the larval period (Duellman e
Trueb, 1986). Adaptations related to life in damp environments, like high skin permeability, make
conformable the activity of pollutants in water and the air (Feio et al.,1998). Because of this, this animal
group deserves special attention in areas which may or will be impacted.
Worldwide, 3500 species of frog are known (Class Amphibia: Order Anura) representing the most
widespread group of amphibians. In Brazil, 776 species of amphibian have been registered, one of the
highest levels of diversity worldwide, of which around 60% are endemic, in other words they are only
present on Brazilian territory (Feio et al.,1998).
Brazil has a diverse reptile fauna, with species appearing in several types of vegetation such as the Tropical
Forest, Caatinga, Cerrado and swamps, as well as strictly marine environments. For example, around 400
types of lizard are found in Brazil (Rocha, 1994).
Serpents are a group of reptiles with specific characteristics, such as an elongated body without locomotive
appendages or scapular waist (Ferrarezzi, 1992). Dodd (1987), reveals that 186 species and subspecies of
serpents on Earth are threatened or need some type of control. Wilcox and Murphy (1985) state that the
largest threat to serpents is destruction of their habitat which results not only in the physical destruction of
the animals but also their ecosystems. As the remaining populations are fragmented, they lose potential
genetic diversity.
5.5.2 METHODOLOGY
The campaign to survey herpetofauna was conducted in June 2004 over a period of five days, two of which
were taken up by travel and three involved fieldwork.
Seven collection points were selected around the Piedade river environment, according to the potential for
finding specimens and ease of access. These points represent different types of formations within the survey
area and can be seen on drawing PIE-PAF-001. They are:
P1 (UTM: 7933140 / 22K 0708290): Pasture area cut through by a permanent stream with
separated fragments of riparian forest. Location close to the future power station on property
belonging to Mr. Roosevelt.
P2 (UTM: 7934054 / 22K 0708591): Green area on a higher portion of the land on the same body
of water as P1. Although located on the same body of water is point 1, this can be considered an
independent location because it contains a different type of that nation.
P3 (UTM: 7933252 / 22K 0710395): A dammed stream upstream from the location of the future
power station. In this area, the riparian forest also includes palm trees. Location on property
belonging to Mr Regis.
Revisão do Estudo de Impacto Ambiental – EIA - Piedade SHS – Março/2007, Pág.164
• P4 (UTM: 7934734 / 22K 0707179): Area where a small stream has been dammed creating a
permanent lake. Location on property belonging to Mr Leri, close to the future low flow section.
P5 (UTM: 7935150 / 22K 0705048): Small stream in a fragment of forest and an artificial well
built from the diverted stream. Location on property belonging to Mr. Leonardo, close to the
future power station.
P6 (UTM: 7935105 / 22K 0705105): Small body of water with a small fragment of forest,
creating permanent lakes because of artificial dams. Located on land belonging to Messrs. Dill
and Diógenes, close to the future low flow section.
NOTE: Points P1 to P6 located on the right bank of the Piedade river and all the bodies of water mentioned
flow into the Piedade river.
P7 (UTM: 7935150 / 22K 0705048): Area with two streams (flowing into the Piedade river) with
altered riparian vegetation with riparian vegetation remaining in some sections. There are also
permanent wells in open areas. Located on the left bank of the Piedade river, on property
belonging to Mrs. Áurea, an area which will represent the future banks of the reservoir.
Registration of reptile species was carried out during daytime and nighttime with active searches at each
sampling point (on land and/or bodies of water) and occasional observations, as well as manual captures
using lassoes or garrotes. Amphibian registrations were carried out during nocturnal excursions in the field
actively looking for animals, their calls, direct observation and manually capturing some samples. During
daytime, wells, flooded areas and bodies of water were checked to collect and observe tadpoles and other
evidence of reproduction.
The results of interviews with local inhabitants (when researching the prevalence of serpents, lizards and
amphibians and the frequency they could be seen in the region) were considered indicative of the occurrence
of species or genuses in the area.
5. 5.3 Environmental Diagnosis
The relevance of species inventory surveys for the Minas Triangle region arises from the very sparse
information on local herpetofauna. Therefore, studies of this nature not only provide information for
controlling and conservation of herpetofauna in respective project areas but are also able to increase
knowledge on important species for conservation purposes in the regional environment.
A total of eight amphibian species and to reptile species were registered through direct observation,
collection and/or visualization. Based on interviews with local inhabitants, others species also comprise local
herpetofauna.

Revisão do Estudo de Impacto Ambiental – EIA - Piedade SHS – Março/2007, Pág.165
Table 5.6List of herpetofauna species encountered in the Piedade SHS area.
Voc= Individuals registred by their calls. V=Individuals registred from obersvation. C=Individuals registred by capture.E= Recorded through interviews
The species found are generally typical in Cerrado areas and are frequently found in open areas (forexample: H. albopunctatus, D. minutus e Pseudis sp. e Scinax fuscovarius; Tropidurus cf. torquatus,
Leptodactylus labyrinthicus, Eunectes sp. e Crotalus durissus) or in areas of dense vegetation (ex: H.lundii, Polychrus acutirostris, Ameiva ameiva, Tupnambis sp, Boa constrictor, Bothrops jararacussu).
Some of them are widely distributed throughout Brazil like H. albopunctatus, S. fuscovarius, D. minutus,B. jararacussu, A. alba, T. cf. torquatus e Ameiva ameiva. However, we must note that the amphibian
species L. labyrinthicus, popularly known as the Rã-pimenta, is frequently used as a source of protein byrural populations. Therefore, populations of this species, when found, will have been affected by hunting.
We know that the diversity of a species in a specific area is directly linked to environment availability
(environmental heterogeneity) (Pianka, 1967). Therefore, it is probable that although the area surrounding
the future of Piedade SHS reservoirs has already been changed, the heterogeneous nature of the
environments (Cerrado, riparian forest, fragments of forest, pastures) associated with the high structural
complexity of certain types of habitats, especially fragments of forest, support a larger number of species
than that found in this study.
Revisão do Estudo de Impacto Ambiental – EIA - Piedade SHS – Março/2007, Pág.166
Various components regulate herpetofauna species activity. However, in tropical and subtropical regions
rainfall seems to be the biggest external effect determining species activity (Duellman and Trueb, 1986,
Pombal, 1997, Galdino et al, 2003). It is believed that the low number of species found may be based on the
period the samples were taken, in the middle of the dry season.
5. 5.4. Final Considerations
Based on the results obtained and taking into account this area has been altered, we believe that the impact
from the project will have a minimal impact on local herpetofauna. However, deforestation (partial or total)
of fragments of forest will create more uniform habitats, destroying specialist species and favoring ruderal
and/or generalist species thereby contributing to a reduction in alpha diversity (Woodruff, 2001).
Furthermore, during deforestation and especially during flooding, as the habitats are shrinking there will
probably be a dispersion of individual members of local herpetofauna species.
We know that water quality is an important component affecting the composition of amphibian taxonomy
(Silvano, 1999). We therefore expect anurofauna to be affected as the reservoir eutrophizes, although few
amphibian species use the reservoir for their activities. Reptile species will be little affected by this process
because they are more mobile and can therefore look for free-flowing water in the free-flowing stretch of the
Piedade river and/or in other higher quality bodies of water.
5.6 Fish Life
5.6.1 INTRODUCTION
Reductions in river flow, like the reduction when operating a small hydroelectric power station (SHS),
require a certain level of control in the relevant hydrographic basin. The effect of reducing the flow affects
many aspects of this ecosystem, including the concentration of pollutants, water temperature and thermal
regimes and habitat availability (RICHTER et al., 1996).
Some impact must be considered on the fish. As cited previously, river or flow reduction may increase the
concentration of pollutants, increasing their relative toxicity, increasing water temperature, reducing species
survival capabilities and reducing habitat availability, reducing the local density of fish populations. Other
impacts may arise from alterations to water channel structures, for example, favoring species better adapted
to less intense flows, while harming those which need faster flows in other words there may be a change in
the structure of the community.
The absence of flooding on a periodic basis may eliminate an environmental "signed" which triggers
reproductive behavior in certain species. Increased water visibility because of reduced depth may favor a
nonoriginal species, or even predatory species (ALLAN, 1995).
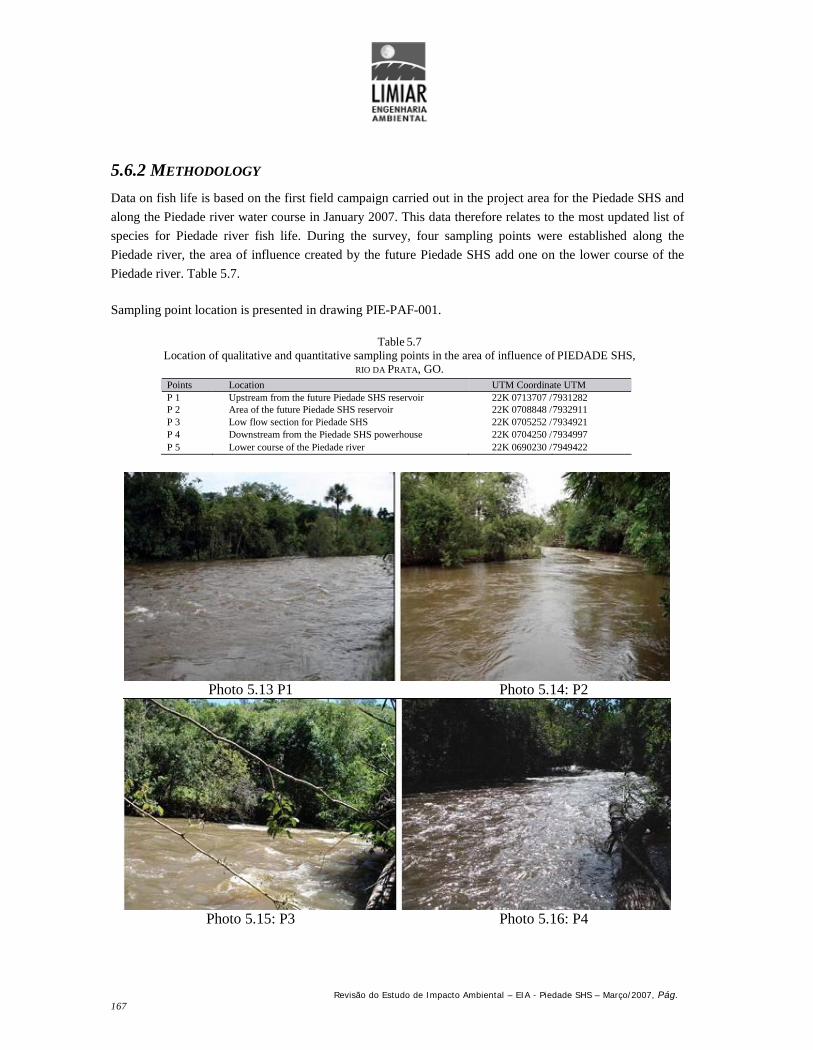
Revisão do Estudo de Impacto Ambiental – EIA - Piedade SHS – Março/2007, Pág.167
5.6.2 METHODOLOGY
Data on fish life is based on the first field campaign carried out in the project area for the Piedade SHS and
along the Piedade river water course in January 2007. This data therefore relates to the most updated list of
species for Piedade river fish life. During the survey, four sampling points were established along the
Piedade river, the area of influence created by the future Piedade SHS add one on the lower course of the
Piedade river. Table 5.7.
Sampling point location is presented in drawing PIE-PAF-001.
Table 5.7Location of qualitative and quantitative sampling points in the area of influence of PIEDADE SHS,
RIO DA PRATA, GO.Points Location UTM Coordinate UTMP 1 Upstream from the future Piedade SHS reservoir 22K 0713707 /7931282P 2 Area of the future Piedade SHS reservoir 22K 0708848 /7932911P 3 Low flow section for Piedade SHS 22K 0705252 /7934921P 4 Downstream from the Piedade SHS powerhouse 22K 0704250 /7934997P 5 Lower course of the Piedade river 22K 0690230 /7949422
Photo 5.13 P1 Photo 5.14: P2
Photo 5.15: P3 Photo 5.16: P4

Revisão do Estudo de Impacto Ambiental – EIA - Piedade SHS – Março/2007, Pág.168
Qualitative and quantitative sampling
Qualitative sampling was conducted during the day (dragging a 2 mm mesh net and 3, 4 and 6 cm casting
nets between opposing knots), and quantitative sampling (using 10 meter gill nets with meshes varying
between three and 14 cm between opposing knots). The nets were set up at the end of the afternoon and
removed the following morning, remaining in the water for approximately 12 hours. The effort used with the
respective mesh size it was recorded for each sampling point (Table 5.8).
Table 5.8Catch per unit effort (M2), by mesh size, used at fish life monitoring points for the future
PIEDADE SHS, RIO PIEDADE, MG (JANUARY/2007).
Mesh Fishing effort (m2)
(cm) P1 P2 P3 P4 P5 Total
3 15 15 15 15 15 75
4 15 15 15 15 15 75
5 15 15 15 15 15 75
6 15 15 15 15 15 75
7 15 15 15 15 15 75
8 18 18 18 18 18 90
10 18 18 18 18 18 90
12 18 18 18 18 18 90
14 22 22 22 22 22 110
Total 151 151 151 151 151 755
The fish which were captured were separated by capture location, type of equipment used and were placed in
labeled plastic bags indicating their origin and date. Individual fish selected as examples and not destined for
dissection were immediately stabilized and maintained in 10% formol and this material will be incorporated
into the collection archive which will be created. The fish were then identified (identification confirmation
for some species was carried out
Photo 5.17: P5

Revisão do Estudo de Impacto Ambiental – EIA - Piedade SHS – Março/2007, Pág.169
in the laboratory), taking biometric data such as: Body weight (PC) and total length (CT). On some
occasions, before the stabilization process, the fish were photographed.
Evaluation of reproductive activity
The state of fish gonad maturity was diagnosed macroscopically based on volume, color, blood irrigation,
turgidity and visualization of ovocytes and sperm line cells. The gonads were classified on a maturity scale
according to BAZZOLI (2004).
1 = undeveloped, small, translucid ovaries, small volume, containing O1 and O2; thready or frilled and transparenttesticles containing only spermatagonia and semnipherous tubes closed.2 - initial maturity, larger ovaries, some ovicyte organs visible tot he naked eye containing 01, 02 and 03, larger andwhiter testicles with a small quantity of spermatozoids in the semnipherous tubes in relation to other spermatogeniccells.3 – advanced maturity/mature, ovaries at maximum volume with many ovocytes visible to the naked eye, containing 01,02, 03 and 04 and turgid testicles, milky white with semnipherous tubules full of spermatozoids.4A = partially spent/exhausted, flaccid ovaries, hemorrhagic, containing 01, 02, 03 and 04 and post=ovulationfollicles. Flaccid testicles, hemorrhagic, with appreciable quantities of spermatozoids and open semnipherous tubules.4A = totally spent/exhausted, very flaccid ovaries, hemorrhagic, containing many 01 and 02, various post=ovulationfollicles and O3 and O4 in atresia. Small testicles, hemorrhagic, containing only spermatagonia in the wall of thesemnipheral tubes with open tube.
When diagnosis of the reproductive status was doubtful, a fragment of the gonad was fixed in Bouin
solution.
Size and abundance of samples capturedThe variation in size of species for the sample period was evaluated by building tables with average,
maximum and minimum length and weight of the samples captured.
The relative abundance will be determined by calculating the catch per unit effort (CPUE) defined as the
sum of the number (CPUEn) or biomass (CPUEb in kg) of fishing 100 square meters of nets used for 12
hours. This procedure provides quantitative comparisons between species, seasons and period sampled,
obtained from the following formula:
CPUEn =CPUEb =Nm =Bm =Epm =M =
captura em número por unidade de esforço;
captura em biomassa (peso corporal) por unidade deesforço; número total dos peixes capturados na malham;
biomassa total capturada na malha m;esforço de pesca, que representa a área em m2 das redes demalha m; tamanho da malha (3, 4, 5, 6, 7, 8, 10 , 12 e 14 cm).

Revisão do Estudo de Impacto Ambiental – EIA - Piedade SHS – Março/2007, Pág.170
We therefore obtained the following CPUEs:CPUE, by number and biomass, by collection point;CPUE, by number and biomass, by mesh;
CPUE, by number and biomass, by species;
Analysis of fish life diversity
In order to calculate the diversity of species we used quantitative data obtained from the fish captured in the
gill nets (CPUE). We used the diversity index created by Shannon (Magurran, 1988), described by the
equation:
=
S = número total de espécies na amostra;i = espécie 1, 2, 3 .. .i na amostra;pi = proporção do número de indivíduos da espécie i na amostra, através da CPUE em número.
Similarity
The similarity between the sampling points was estimated using the Sorensen (Cn) index for quantitative
data, as stated in MAGURRAN (1988):
S==2j/ (a++b)
S = índice de similaridade;j = número de espécies comuns nos pontos de amostragem a e b;a e b = número de espécies exclusivas nos pontos de amostragem a e b.
Based on the methodology in VALENTIN (1995), similarity tables will be constructed based on the values
of these indices for the quality of sampling points. These were then used in the analysis of groupings in order
to create a densogram, based on the connection with the Unweighted Pair Group Method with Arithmetic
Mean (UPGMA).
Note: Data on the abundance, wealth, diversity, percentage occurrence, abundance level, frequency of
occurrence and reproductive activity will be presented in the final report.
5. 6.3 Environmental Diagnosis
Initially it is important to point out that the conditions of the Piedade River during the field campaign
conducted in the month of January 2007 were not favorable for catching fish using either quantitative
(gillnets) or qualitative (casting nets, dragnet) equipment. This is mainly because of the waterfalls along the
river which almost never have lakes and because of the high volume of water.
CPUE(n, b) malha =CPUE(n, b) malha =
CPUE(n, b) espécie =

Revisão do Estudo de Impacto Ambiental – EIA - Piedade SHS – Março/2007, Pág.171
60 samples were captured in the qualitative and quantitative samples during the first monitoring campaign in
the Piedade SHS influence area and its lower course, in January 2007, comprising eight species, five genuses
and five families (Table 5.9).
Table 5.9list of species captured in the first fish monitoring campaign in the area of influence from the
PIEDADE SHS and the lower course of the Piedade River in January 2007.
Espécies Nome vulgar
ORDEM CHARACIFORMES
Família Characidae
Astyanax bimaculatus Lambari-do-rabo-amarelo
Astyanax fasciatus Lambari-do-rabo-vermelho
Astyanax sp Lambari
Família Erythinidae
Hoplias lacerdae Trairão
Família Anostomidae
Leporinus friderici Piau-três-pintas
Leporinus macrocephalus Piau
Família Parodontidae
(espécie identificação) Canivete
ORDEM SILURIFORMES
Família Loricariidae
Hypostomus sp1 Cascudo
Size and abundance of samples captured
The variation in size of species for the sample period was evaluated by building tables with average,
maximum and minimum length and weight of the samples captured. The largest sample captured was a
trairão, H. lacerdae, 58 cm long (ICT) with 4350 g bodyweight (PC) and the smallest was a lambari, A.
bimaculatus with 7.5 cm (CT) and 8.0 g PC. The most abundant species in number was Astyanax sp. com
with 26 individuals and by biomass was H. lacerdae with 7150 g. The range of total length (CT) and
bodyweight (PC) by species and number of individuals captured is presented in table 5.10.

Revisão do Estudo de Impacto Ambiental – EIA - Piedade SHS – Março/2007, Pág.172
Table 5.10Number of individuals captured (N), biggest (Max.) and smallest (Min.) samples; average (Med.) for body weight (PC)and total length (CT) for each species captured during January 2007 sampling in the Piedade SHS area of influence and
lower course of the Piedade river.
Espécie N Max
PC (g)
Min Med Max
CT (cm)
Min Med
Astyanax bimaculatus 17 19.0 8.0 12.0 10.5 7.5 8.7
Astyanax fasciatus 2 11.0 10.0 10.5 10.5 9.0 9.8
Astyanax sp 26 16.0 11.0 13.7 12.0 8.5 9.8
Hoplias lacerdae 2 4350.0 2800.0 3575.0 58.0 50.0 54.0
Leporinus friderici 6 204.0 72.0 126.8 25.0 17.0 21.6
Leporinus macrocephalus 2 327.0 98.0 212.5 28.0 20.0 24.0
(espécie identificação) 1 24.0 24.0 24.0 14.0 14.0 14.0
Hypostomus sp1 4 17.0 12.0 14.0 12.0 9.0 10.5
5. 6.4. Final Considerations
Damming a watercourse results in various alterations to the aquatic environment with changes to flow (free-
flowing water) and standing (stationary water) characteristics most easily visible. This changes the available
habitats, physical and chemical conditions of the water, nutrient cycles, biomass/energy ratios and the
dynamic of water biotic communities (Sale, 1985). Based on the magnitude of these alterations we will then
see a reduction or elimination of species adapted to free-flowing water.
Alterations and elimination of habitats within the flooded area (reservoirs) is a major factor when building
dams.
On the Piedade River, downstream from the power station, the impact on fish will be related mainly to the
daily fluctuation in water levels related to the operating regime adopted by Piedade SHS. According to the
literature available, swift variations in flow levels are responsible for reducing aquatic communities in free-
flowing water environments downstream from dams. The factors responsible for these changes are not
clearly understood, but related to changes in the water habitat conditions. Among changes observed at those
related to dragging organisms, changes in the recruitment rates and nutritional condition for certain species.
So far, no information has justified deployment of a mechanism to transfer fish from the PHC Piedade dam
area. Such a mechanism is therefore likely to be unnecessary. However, the final analysis this issue will be
presented at the end of the first fish monitoring phase, as stated previously in this PCA.

Revisão do Estudo de Impacto Ambiental – EIA - Piedade SHS – Março/2007, Pág.173
6 ENVIRONMENTAL IMPACTSAs stated in this document, the change to the Piedade SHS layout does not invalidate the environmental
impacts identified in relation to the project. This chapter will therefore deal only with possible new impacts
arising from deployment and operation of Piedade SHS based on alterations to the engineering design.
In order to describe and evaluate possible environmental impacts from PCH Dias deployment in operation,
we based our analysis on CONAMA Resolution 01/86.
The potential effects of the impacts were qualified in line with the following criteria:
Development phase: Planning, Deployment, Reservoir Filling and Operation;
Effect: Positive or negative;
Type: Direct or indirect;
Scope: Local or regional;
Duration: Short, medium or long term;
Reversibility: Reversible or irreversible;
Importance: Important or unimportant; Magnitude: Low, medium or high;
Quantifying the final impact: Significant, moderate, not very significant or insignificant.
6.1 Physical Environment
6.1.1 Loss of Natural Heritage Locally from Filling the Reservoir and TVRFormation
In the new reservoir area, three waterfalls will be affected by the increased water level, two located on the
"unnamed" and Boa Vista streams, located on the right bank of the Piedade River and the Erson Waterfall
located on the Piedade River, thereby erasing their landscape effects (scenic value). Alongside the
waterfalls, 4 springs will also be flooded. This will have a direct, local, long-term, irreversible, important,
high magnitude, significant and negative effect.
Downstream from the forecast dam location, the Piedade River creates two waterfalls, one located on
property belonging to Mr. Francisco Carols Vieira and another known as Usina Velha or Guimarães
Waterfall, located on the property of Mr. Roosevelt Guimarães Jr.
By damning the river to retain the water in the reservoir, the volume of water in the existing waterfalls will
be restricted to a volume corresponding to the project low flow, compromising their landscaping effect
(scenic value). This will have a direct, local, long-term, irreversible, important, high magnitude, significant
and negative effect.

Revisão do Estudo de Impacto Ambiental – EIA - Piedade SHS – Março/2007, Pág.174
These impacts may be minimized by the "Natural Heritage Registration Program", "Project to Recover,
Rehabilitated Me Vegetate Springs and Watercourses" and "Groundwater Monitoring Program".
6. 1.2 WATER QUALITY
When a watercourse is dammed the water is held in place for a longer time compared with the free-flowing
system. Thomas et al. (1997) states that because of this, there are alterations to water temperature,
sedimentation levels and circulation of water masses, gas dynamics and nutrient circulation structure of
aquatic communities.
These modifications have the most effect on changes to the physical, chemical and biological characteristics
of the new water system (Júlio et al., 1997). As a direct consequence, the authors report possible appearance
of thermal stratification at during certain seasons and/or times of the day, forming the so-called thermocline,
specific vertical gradients in the water column, mainly in terms of dissolved oxygen concentration, resulting
in limits on aquatic organism distribution. We can observe the formation of three different longitudinal
zones (river, intermediate and lake), resulting from contributions from the water source creating the
reservoir. These ranges result in different behavior in relation to factors such as sedimentation rate,
concentration and cycling of nutrients, accretion and retention of organic and inorganic material, factors
limiting primary production and values of this production (Thomas et al., 1997).
Installation of the Piedade SHS will result in creation of a reservoirs the volume of 17,520,000 cubic meters;
water surface of 1,499,000 square meters, perimeter of 10400 and 33 m, approximate length of 4420 m,
maximum depth of 30 m and average depth of 14.5 m.
Plant reservoir operation will be based on the water level and the length of time that the water remains in the
reservoir will be subject to variation in incoming water flows. At a minimum monthly average flows
observed from fluviometric data (1.4 m3/s) this period will be around 145 days; for average long-term flows
(11.9 m3/s), 490 hours or 17 days; and for a maximum average monthly flow (42.7 m3/s), around 114 hours
or five days.
In order to better evaluate potential modifications arising from the Piedade SHS reservoirs, we looked at
certain important morphological aspects in the system which will be created. We therefore drew up
calculations evaluating susceptibility to stratification and eutrophization, as recommended by Von Sperling (1999)
and Håkanson (1981), taking into account a variety of morphometric variables. This was used to generate
important information on issues linked to limnological dynamics such as water column stratification, inter-
relation between the body of water and surrounding areas and the drainage basin, among others, based on the
reservoir format.
According to Von Sperling, correct interpretation of morphometric data from lakes and reservoirs

Revisão do Estudo de Impacto Ambiental – EIA - Piedade SHS – Março/2007, Pág.175
can be a useful tool for controlling bodies of water. However, the author points out that these studies can
only be used to determine trends and do not replaced suitable monitoring of water systems. The following
indices were therefore adopted: relative depth, densimetric Froude number, coastal region development
index and involvement factor.
In the methodology adopted for this type of valuation, the following parameters were used. maximum
reservoir depth (M), total surface area of the reservoir (m2), reservoir length (m), reservoir inflows (m3/s),
reservoir volume (m3), reservoir perimeter (m) and total drainage area of the reservoirs hydrographic basin
(m2).
The first index, relative depth, tells us about the stability in stratification of the water column. The value
obtained for the future Piedade SHS reservoir was 2.17%. This value shows that the future reservoir has a
slight tendency towards meromixis because of morphological limitations, meaning that the environment will
only be able to create vertical movement of water masses if there is sufficient incoming external energy, for
example high-intensity wind. We therefore estimated that the liquid mass of the reservoir will be subject to
periods of low vertical circulation which may result in a vertical stratification forming different metabolic
compartments such as epilimnial, metalimnial and hypolimnial. The absence of oxygen at the bottom of the
lake not only reduces biological diversity it also leads to reach soluble isolation of nutrients, especially
phosphorus, which makes it available for assimilation by aquatic plants, mainly to the underside formation
of eutrophization phenomena.
Calculation of the densimetric Froude number is carried out by evaluating the tendency to mix or stratify
water in a reservoir, taking into account key affluent flows in this system. The results obtained showed that
at the maximum depth (30 m) the trend revealed by the relative depth of periods of water column
stratification in the future reservoir will probably not be restricted only to times of lower flow, because the
maximum average flow registered was 0.115 for this index.
The perimeter development index provides the level of the regularity of the coastal region, i.e. the number of
ramifications. Reservoirs with an extensive coastal region consequently have a good capacity to assimilate
the impact of pollution and especially greater resistance to eutrophization. On the other hand, they have a
disadvantage in the indentations where water is retained for a longer period of time, thereby favoring an
accumulation of material in shallower areas which are exposed to sunlight radiation and subject to little
water movement. All of these conditions support decomposition of organic material and the growth of
microalgae.
However it would seem that offsetting these two phenomena, in most cases, are the predominant positive
conditions for nutrient assimilation. The value obtained from the perimeter development index, 2.39,
indicates the low number of reservoir bank ramifications. This means that the inter-relation between
immediate bank areas will be low, and possible interference at this level

Revisão do Estudo de Impacto Ambiental – EIA - Piedade SHS – Março/2007, Pág.176
may be incorporated into the liquid mass of the reservoir. This is an indication of reduced formation of
different horizontal zones because of the greater possibility of quickly mixing with the main body of the
reservoir. This trend would imply that when adding substantial amounts of nutrients and organic material,
the entire reservoir will quickly be subject to the effect of this addition, with a very small probability of
forming horizontal pure zones not subject to this impact.
The last index considered, the involvement factor, reached a value of 645, which shows a less accentuated
relationship between the drainage basin area and the reservoir area. This means that potential erosion of
nutrients into the body of water is lower than the dilation effect on these nutrients will be high.
We therefore believe, based on the morphometric indices analyzed, that the future reservoir will have
undefined horizontal space patterns with horizontal circulation, and a trend towards vertical stratification
periods in deeper regions of the lake. It will not be especially affected by the drainage basin because of the
large volume of water in the reservoir. The time the water remains in the reservoir will determine a mainly
longitudinal flow with a certain uniformity in the transversal section.
Eutrophization is the excessive growth of aquatic plants because of the wide availability of nutrients. This
phenomenon can lead to lower water quality because it reduces sunlight penetration and the concentration of
dissolved oxygen, which is used to decompose dead algae. In terms of the level of atrophy, lakes and
reservoirs can be classified according to the concentration of phosphorus and water (table 6.1).
Table 6.1Reservoir classification in terms of the level of atrophy based on phosphorus concentration in water.
Class of atrophy Total phosphorous concentration (mg P/L)Ultraoligotrophic < 0,005Oligotrophic < 0,01 – 0,02Mesotrophic 0,01 – 0,05Eutrophic 0,025 – 0,1Hipereutrophic > 0,1
Obs.: The overlapping values between two ranges indicates a difficulty inestablishing specific ranges
Slight increases in the level of nitrates and phosphates in waters and rivers often lead to aspiration
phenomena (eutrophization) or an increased number of organisms of specific species. Algae adopt this type
of behavior and do so in relation to other types of elements such as sulfur, potassium, magnesium and other
elements The fact that in natural water elevation only of nitrogen or phosphorus produces an increased
number of organisms means that this water normally contains sufficient quantities of other elements.
Despite the fact that much more nitrogen is required by organisms than phosphorus, in terms of pollution,
phosphorus is of much greater importance because even though there is an insufficient nitrogen supply, this
can be obtained from the atmosphere, while it is impossible to control levels in water.

Revisão do Estudo de Impacto Ambiental – EIA - Piedade SHS – Março/2007, Pág.177
Phosphorus, mainly produced by waste water, can be better controlled when preventing pollution.
Phosphorus is a highly reactive element and in well oxygenated water it forms in soluble compounds which
tend to precipitate, with a large number of metallic cations including calcium. Furthermore, it is widely
known that phosphate is absorbed in iron hydroxide (III) and aluminum hydroxide flakes, settling at the
bottom of the reservoir. This means that the quantity of phosphate available in waters depends on the
concentration of iron III and aluminum in the water, as well as its hardness.
According to the results of the water analysis carried out for this study, the Piedade River presents a
concentration of phosphorus is a .close to the dam which, in lakes and reservoirs, would be classified as
mesotrophic. However, as the flow system in lakes allows sedimentation of adsorbed phosphates with other
particles or as small precipitates, the effective dissolved phosphorus concentration in water will be lower
than that present in river water.
The ammonia nitrogen concentration in the Piedade River, in the ADA, was lower than the 3.7 mg/L N level
for pH levels below 7.5 (as specified in CONAMA Resolution No. 357, from March 2005). The nitrates and
nitride results in the diagnosis indicate their concentration the Piedade River is below that established
environmental legislation for class 2 water.
Complementing the evaluation on the risk of developing eutrophization processes in the future SHS
reservoir, phosphorus concentrations were estimated using empirical model known worldwide, constructed
by Vollenweider (1976), developed mainly for temperate lakes (Von Sperling,1995). Sala and Martino
(1991) analyzed experimental data from 40 lakes and reservoirs in Latina America and the Caribbean
obtaining, from linear regression, the corrected ratio of Ks (coefficient for phosphate loss from
sedimentation) for the environments.
The mathematical expression of the model is:
Where:
P: Is the phosphorous concentration in the reservoir, in gP/m3 or mg/L; L: Is the affluent phosphorous load in KgP/year; V: Is the reservoir volume in m3;
t: Is the time in years KS: Is the coefficient for phosphorous lost through sedimentation, in year-1.
Revisão do Estudo de Impacto Ambiental – EIA - Piedade SHS – Março/2007, Pág.178
The empirical expression for Ks obtained by Sala and Martino (1991) is KS =
Sperling stated that because it was based on regional data (including Brazilian data), the empirical modeldeveloped by Salas and Martino (1991) should be the model used for planning and managing lakes andreservoirs under our conditions. He also added that a critical eye and the experience of the researcher mustalways be present to avoid distortions, given the specific nature of each reservoir or lake.
Considering the amount of phosphates reaching the SHS as the amount from the river and reservoir drainage
area, we can state that the inflowing phosphorous level of the future reservoir is at a critical level, 0,11 mg
P-PO4/L or 0,035 mg P/L, calculated from monitoring in December 2003, the rainy season. Knowing the
average long term flow of the Piedade river, 11.9 m3/s, we can estimate the phosphorous flowing into the
river as 13,471 kg P/year.
Based on the fact that the reservoir volume is 17,520,000 m3, we can determine the dwell time as
approximately 0.047 years and a Ks coefficient of 9.3 year-1. We can therefore estimate phosphorous
concentration in the reservoir as 25.1 mg P/m3 or 0.025 mg P/L.
Application of the Vollenweider (1976) empirical model, adapted by Salas and Martino (1991), indicated
that the phosphorous concentration in the future Piedade SHS reservoir is characteristic of mesotrophic
lakes. Note that this model was mainly developed for temperate lakes and, even with the correction for the
Ks coefficient proposed by Salas and Martino, it must be used with caution.
Not accounting for exception factors (anthropogenic factors), the pH value of natural water oscillates
between 6.5 and 8.5. The pH influence on the eutrophization process is mainly based on the fact that at
higher pH values (> 0.8) phosphates adsorbed by iron (III) and aluminum hydroxides are released again,
enriching the water’s nutrients. pH above 8.0 can occur naturally in reservoir water during sunny periodsbecause of photosynthesis involving algae, removing CO2 and change the carbonate system (Boers, 1991).
Average pH values on site at the location of the future reservoir, close to the dam, vary between 7.21 and
7.95. The water retention period in the reservoir is characteristic of intermediate environments according to
CONAMA 357;05, at affluent flow rates above 5.1 m3/s. During lower flow periods (dry season) there may
be excessive proliferation of algae and excessively high pH. However, we can only evaluate the interaction
of this parameter with phosphorous enrichment in the reservoir after it has been created.
In light of this, we can see that there are factors which are favorable and other unfavorable for eutrophization
in the reservoir. Morphometric index analysis shows that the reservoir is not highly influenced by the
drainage basin, a fact corroborated by diagnostics conducted in the area. The trends presented show that
eutrophization is unlikely

Revisão do Estudo de Impacto Ambiental – EIA - Piedade SHS – Março/2007, Pág.179
in the reservoir, although it is related to the interaction of physical and chemical phenomena with external
influences. The synergy between different phenomena occurring in the reservoir after it has been formed will
be accompanied by the Limnologic and Water Quality Monitoring Program.
In terms of plankton communities, please note that there will be a trends towards substantial reduction in
organism densities because of reservoir stabilization, which may be followed by a slight rise in population.
This means that communities will develop based on plankton organisms and present a composition more
similar with lake environments.
Benthic communities will be subject to variation in depth mainly because of light penetration and sediment
composition. We therefore estimate that these communities will be more abundant in peripheral areas of the
future reservoir. We also believe that in these areas, the main substrate will be clay based, favoring the
appearance of organisms more suited to these substrates. Typical rock based substrates will be more
restricted because of the loss of these habitats and the substantial reduction of water flow speed over the
surface as these organisms are adapted to the speed of the current.
Organic material reaching the water course undergoes a natural neutralization process which mainly includes
dilution, sedimentation and biochemical stabilization, a process called self-purification (Branco, 1996).
When a pollutant is introduced into this body of water, a specific quantity of oxygen is required mainly to
oxidize the organic material, based on aerobic digestion processes carried out by microorganisms. This
process is called deoxygenation.
On the other hand, when the oxygen is consumed by the bacteria, this creates a deficit in relation to
saturation concentration. This deficit leads to a diffusive flow of oxygen from the air into the body of water.
This diffusion will occur faster the more turbulent the water is, because in still waters diffusion mainly
occurs through molecular diffusion (slower) and in turbulent water this mechanism is mainly turbulent
diffusion (faster). Additionally, the algae use photosynthesis to contribute towards oxygenation of natural
water. This process is called reoxygenation.
Oxygen concentration in the future reservoir was estimated using the mathematical model from Streeter-
Phelps (Von Sperling, 1995), which takes into consideration the following factors:
Only atmospheric reaeration
Oxygen consumption from biological decomposition of organic material; and Piston flow, i.e. looking at the body of water as a continuous reactor, mixing downstream water
with upstream water.

Revisão do Estudo de Impacto Ambiental – EIA - Piedade SHS – Março/2007, Pág.180
This model is restricted to the aerobic conditions of the body of water, no including or modeling the
anaerobic decomposition of organic material. The mathematical expression of the model is:
Where:
Ct: Is the concentration of dissolved oxygen in mg/L, in time “t”, in days; CS: Is the saturation concentration of dissolved oxygen in mg/L;
K1: Is the deoxygenation coefficient in d-1;
K2: Is the reoxygenation coefficient;
L0: Is the DBO5 concentration in mg/L, at initial time (t = 0); and,
D0: Is the oxygen deficit (Cs – C0) in t = 0.
The study considered some of the results obtained from the sampling point on the Piedade river (PIE-01) and
data in bibliographic references, cited in Table 6.2. We chose to use data collected in December which
represents the most critical situation.
Table 6.2Input data in the mathematical modelParâmetros PIE-01 – Dezembro/03
DBO5 (mg O2/L) 1.51Dissolved Oxygen (mg O2/L) 7.21Piedade river temperature (°C) 22.0Altitude above sea level (m) 639Reservoir length (km) 4.42Deoxygenation content (dia-1) 0.30Physical reaeration constant (dia-1) 0.37
Considering the long term average flow of the Piedade river, 11.9 m3/s, we obtain a water dwell time of
approximately 17 days.
Below is a calculation for the self-purification study on the Piedade SHS stretch of the river.

Revisão do Estudo de Impacto Ambiental – EIA - Piedade SHS – Março/2007, Pág.181
SELF-PURIFICATION STUDY
Reservoir section
DBOr = 1,51 DBO of the Piedade river (mg/L)
Tr = 22 Temperature of the Piedade river (°C)
ODr = 7,21 OD of the Piedade river (mg/L)
K1 = 0,3 Deoxygenation constant (1/dia)
K2 = 0,37 Physical reaeration constant (1/dia)
H = 639 Height above sea level (m)
v = 0,26 River surface flow speed (km/dia)
Dist = 4, 420 Lake distance to the dam (km)

Revisão do Estudo de Impacto Ambiental – EIA - Piedade SHS – Março/2007, Pág.182
According to the results of the mathematical method, oxygen concentration will always be above 7.03 mg/LO2 (Critical point) along the reservoir water course (Figure 6.1). It is important to note that all of thecalculations were based on data from the physical and chemical analysis of the Piedade river, and themathematical model used is widely acknowledged worldwide.
Figure 6.1 Dissolved oxygen deficit curve in the Piedade SHS reservoir at themost critical point (December 2003).
8,2
8,0
7,8
7,6
7,4
7,2
7,0
6,80 1 2 3 4 5 6 7 8 9 1 0 1 1 1 2 1 3 1 4 1 5 1 6 1 7 1 8
Tem po (d ia )
Curva do déficit de OD no reservatório
Tempo = 17 diaDist = 4,20 kmOD = 8,05 mg/L

Revisão do Estudo de Impacto Ambiental – EIA - Piedade SHS – Março/2007, Pág.183
Based on the surveys conducted, we believe that the water course will contain sufficient quantities of
dissolved oxygen for oxygenation of nutrients and organic material in this basin, which leads us to a low
probability that there will be processes compromising the environmental and sanitary quality of the future
system stop
The section of the Piedade river in the SHS area of influence was seen to be very stable throughout the
hydrological cycle in terms of physical and chemical quality of the water. There are obviously variations in
several of the parameters analyzed, but these are mainly due to variations in regional climate conditions
throughout the year, and could be considered natural fluctuations based on seasonal variations in
temperature and rainfall.
The biological communities are also subject to variations depending on the hydrological cycle. Based on the
phyto, zooplankton and zoobenthic analysis, we saw no biological loss in terms of species or diversity
during the analysis period. The community parameters measured in this water course suggests that the
environment is dynamically stable, although there have been previous events which have affected diversity,
suggested by the lower levels of ´phytoplankton. These events may include the construction of upstream
dams and modifications to land usage, such as the removal of the original vegetation for farming activities.
Evaluation of the morphological impacts shows that the reservoir is not highly influenced by the drainage
basin, a fact corroborated by diagnostics conducted in the area. Application of the Vollenweider (1976)
empirical model, adapted by Salas and Martino (1991), indicated that the phosphorous concentration in the
future Piedade SHS reservoir is characteristic of mesotrophic lakes. Therefore, the trends that have been
presented showed that it is unlikely that they will be eutrophization in the reservoir, although it is related to
the interaction of physical and chemical phenomena with external influences. The synergy between different
phenomena occurring in the reservoir after it has been formed will be accompanied by the Limnologic and
Water Quality Monitoring Program.
6.2 BIOTIC ENVIRONMENT
Changes to the Piedade SHS engineering project will not result in the appearance of further environmental
impacts on the biotic environment. Mainly based on the increased reservoir area, some previously identified
environmental impacts will be intensified, for example vegetation suppression, however in the newly
affected areas we found no different types of vegetation to those described in previous studies based on the
original project.
The proposed environmental programs to mitigate any impacts will be maintained, however they will be
adapted when implemented based on alterations to the development project. The SHS Piedade reservoir will
affect three waterfalls which may represent important environments for martin reproduction and nesting, as
well as two locations on the TVR. Therefore, based on the magnitude of these changes, the impact is
commented on below:
Revisão do Estudo de Impacto Ambiental – EIA - Piedade SHS – Março/2007, Pág.184
6.2.1 Loss of Habitats for Martin Species (STREPTOPROCNE ZONARIS and CYPSELOIDES
SENEX)
Reservoir of filling or flow reduction (TVR) in areas around the waterfalls may destroy habitats for two
species of martin, registered in the project area. Two species of martin (Streptoprocne zonaris and
Cypseloides senex), both have a highly specific connection with this habitat because of shelter and nesting,
with colonies around the sites.
During on-site visits to adapt to the EIA to the new engineering project, the waterfalls which will be flooded
by the reservoir were visited but this species was not present in the area. However, the time of year that the
inspections were made were not the most suitable for finding martins, because the reproductive phase of
most neotropical birds had ended. Furthermore, the flow is observed in the bodies of water was higher,
which is an important factor in dispersing species of martin.
The effects of this impact, if the presence of martins is confirmed around the waterfalls, may be considered
direct, regional, negative, long-term, irreversible, important, high magnitude and significant. The effects can
be mitigated by executing the "Martin (Cypseloides senex and Streptoprocne zonaris) Monitoring Program”already proposed in the PCA (LIMIAR, 2004), in order to confirm the presence of the species in this
locations and draw up measures for conservation and effective control. The aforementioned program will be
adapted to the new areas affected by the project however the methodological procedures and objectives will
remain the same
6.2.2 SOCIOECONOMIC ENVIRONMENT
This study, carried out between March 12 and 16 2007, focused on updating information regarding the
municipal region of Monte Alegre de Minas, updating information on properties located in the low flow
section (based on changes to the water channel route) and detailed surveys on new properties affected by the
reservoir and power station.
Notes of the observations made in a new field survey do not include changes to preventive and mitigating
measures indicated previously, because any interference from the new Piedade SHS project in terms of
properties affected can also be mitigated/monitored by the Land and Improvement Negotiation and
Socioeconomic Aspect Monitoring Programs, Support Plan. We should point out that these actions should
include the new properties and inhabitants affected by the project (21 properties are affected altogether,
following alterations to the Piedade SHS project).

Revisão do Estudo de Impacto Ambiental – EIA - Piedade SHS – Março/2007, Pág.185
7 BIBLIOGRAPHIC REFERENCESAGOSTINHO, A. A.; JÚLIO JR, H. F.; BORGHETII, J. R. 1992. Considerações sobre os impactos dos
represamentos sobre a ictiofauna e medidas para sua manutenção. Um estudo de caso: reservatório de
Itaipu. Revista Unimar, v.14 (supl.), p.89-107.
AGOSTINHO, A.A.; MENDES, V.P.; SUZUKI, H.T.; CANZI, C. 1993. Avaliação da atividade reprodutiva
da comunidade de peixes dos primeiros quilômetros a jusante do reservatório de Itaipu. Revista Unimar,
v.15 (supl.), p.175-189.ALLAN, j. D. 1995. Stream Ecology. Chapman & Hall, London, 388 p.Assembléia Legislativa do Estado de Minas Gerais. 1989. Constituição Estadual. Disponível em
<http://www.almg.gov.br/index.asp?grupo =legislacao&diretorio = coes&arquivo = constituicao estadu al>.
Acesso em 21/03/07.
BASTOS-FILHO, A. G. 1974. Zoneamento Econômico Florestal do Estado de Minas Gerais, M.A., IBDF.
BAZZOLI, N. 2004. Parâmetros reprodutivos de peixes de interesse comercial na região de Pirapora. In:
GODINHO, H. P.; GODINHO, A. L. (Eds.). Águas, peixes e pesca no São Francisco das Minas
Gerais. Belo Horizonte: Editora PUC Minas, CNPq/PADCT CIAMB III. P. 273-288.Biodiversitas. Biodiversidade em Minas Gerais: um Atlas para sua conservação. Costa, M. R. C. et al.
(orgs.) Belo Horizonte: Fundação Biodiversitas, 94 p. (1998)
BRITISKI, H. A.; SATO, Y. & ROSA, A. B. S. Manual de identificação de peixes da região de Três Marias -
com chaves de identificação para os peixes da bacia do São Francisco. Brasília: Câmara dos Deputados,
Coordenação de Publicações - CODEVASF, Divisão de Piscicultura e Pesca, 2a. ed., 115 p. (1988).
CEMA. Consultoria em Meio Ambiente S/C LTDA. 2001. Relatório de Impacto Ambiental. Piedade SHS.
233 p.
Construtora Wantec; Projeto Básico, Relatório Final PCH Cachoeira do Miné, VOL 1 – Texto.DODD, C. K. 1987. Status conservation and management. In: Snakes Ecology and evolutionary
Biology. R. A. Seigel, J. T. Collins and S.S. Novak (eds). Macgraw-Hill Publishing Company, NewYork: 478:513.
DUELLMAN, W. E., TRUEB, L. 1986. Biology of Amphibians. The Johns Hopkins University Press.670p.
FEIO, R.N.; BRAGA,U.M.L; WIEDERHECKER, H; SANTOS, P.S. 1998. Anfíbios do Parque Estadual do
Rio Doce(Minas Gerais). UFV/IEF, Viçosa-MG.
FERRAREZZI H. 1992. Uma sinopse dos gêneros e classificação das serpentes (Squamata): I. Scolecophidia
e Alenthinophidia não colubrideos. In: Herpetologia no Brazil, 1. Nascimento, L.B; Bernardes A. T; Cotta
G. A. (eds) 1992 Belo Horizonte-MG.
FIRKOWSKI, C. 1990. O habitat para a fauna. In: Congresso Florestal Brasileiro, 6, Campos do Jordão.
Trabalhos convidados. Campos do Jordão, SBS/SBEF. v.1, p.139-144.
FONSECA, G.A.B., G. HERMANN, Y.L.R. LEITE, R.A. MITTERMEIR, A.B.RYLANDS & J.L.
PATTON. 1996. Lista anotada dos mamíferos do Brasil. Conservation International & Fundação
Biodiversitas. Ocasional Paper Nº 4:1-38.
FOWLER, H. W. 1951. Os peixes de água doce do Brasil. Arq. Zool. São Paulo, v.6, p.1-625.GALDINO, C. A. B., ASSIS, V. B., KIEFER, M. C., VAN SLUYS, M. 2003. Reproduction and fat body
cycle of Eurolophosaurus nanuzae (Sauria: Tropiduridae) from a seasonal montane hábitat of southeasternBrazil. J. of Herpetol. 37(4): 687-694.
Revisão do Estudo de Impacto Ambiental – EIA - Piedade SHS – Março/2007, Pág.186
GARAVELLO, J. C. & GARAVELLO, J. P. 2004. Spatial distribution and interaction of four species ofthe catfish genus Hypostomus Lacépède with bottom of rio São Francisco, Canindé do São Francisco,
Sergipe Brazil (PISCES, LORICARIIDAE, HYPOSTOMINAE). Braz. J. Biol., 64(3B), 591-598.
GOSLINE, W. A. Contributions to the classification of the Loricariidae catfishes. Arq. Mus. Nac. Rio deJaneiro, 41:79-134, pls.101 (1947)
GUERRA, A. J. T. Erosão, Impactos Ambientais e Conservação dos Solos. In: GUERRA, J. T.; CUNHA, S.
B. da (org.). Geomorfologia: uma atualização de bases e conceitos. Rio de Janeiro: Bertrand Brasil, 1994.
p.187-189.
Henriques Jr. G., Costa, F. e Koole, E. 2001 Análise tecnológica do material lítico de um sítio de caçadores –coletores na província cárstica de Arcos – Pains – Doresópolis, Minas Gerais. Anais do XI Congresso da
Sociedade de Arqueologia Brasileira. Rio de Janeiro (no prelo)
Henriques Jr. G., Prous, A. e Costa, F. 1999. Análise Tecnológica e Espacial dos Vestígios Líticos das
Camadas IX/X da Escavação Externa da Lapa do Boquete. Anais do X Congresso da Sociedade de
Arqueologia Brasileira. Recife (no prelo)
IHERING, R. Von; AZEVEDO, P. de. As piabas dos açudes nordestinos (Characidae, Tetragonopterinae).
Arch. Inst. Biol., 7 (8): 75-110, 1936.
INSTITUTO BRASILEIRO do MEIO AMBIENTE 2003. Reserva Particular do Patrimônio Natural
(Legislação e Histórico). www.ibama.gov.br
INSTITUTO do PATRIMÔNIO HISTÓRICO e ARSTÍSTICO NACIONAL. 2002. Cadastro Nacional de
Sítios Arqueológicos. www.iphan.gov.br
KARLIN, C., Bodu, P. & Pelegrin, J. 1991 Processus, Techniques et Chaînes Opératoires: Comment les
préhistoriens s’approprient um concept élaboré par les ethnologues, In: Observer l’Action Technique: des
chaines opératoires, pour quoi faire?, Editions du CNRS, pp.101-117.
KINTIGH, K. 1988. The effectiveness of subsurface testing: a simulation aproach. American Antiquity,
53(4). Society for American Archaeology. p. 687-707.
LAMING-EMPERAIRE, A. 1967 Guia para o estudo das Industrias Líticas da América do Sul. Curitiba:
CEPA/ UFPR, Manuais de Arqueologia, n. 2.
LEROI-GOURHAN, A. (dir.) 1988. Dictionnaire de la Préhistoire. Paris, Presses Universitaires de France.
LEROI-GOURHAN, A. et al. 1966. La préhistoire. Presses Universitaires de France, Paris, France.
LIGHTFOOT, K. 1986 Regional surveys in the eastern United States: the strengths and weaknesses of
implementing subsurface testing programs. American Antiquity, 51(3). Society for American
Archaeology, p. 484-504.LIMIAR, 2003. Informações Complementares ao EIA/RIMA. Processo COPAM Nº 1403/2002/001/2002.
LIMIAR, 2004. Condicionantes da Licença Prévia. Piedade SHS. Anexo I do Parecer Técnico PCH nº
002/2004 Processo COPAM: 1403/2002/001/2002.
LIMIAR, 2004. Plano de Controle Ambiental. Piedade SHS. Fevereiro de 2004. 258 p.LYMAN, R. L.; O’Brien, M. J. & Dunnell, R. C. 1997 Americanist Culture History – Fundamentals of Time,
Space, and Form. Plenum, New York.
MACHADO, A. M. M., G. A.B. DA FONSECA, R. B. MACHADO, L. M. DE S. AGUIAR & L. V. LINS.
1998. Livro Vermelho das espécies ameaçadas de extinção da fauna de Minas Gerais. Belo Horizonte:
Fundação Biodiversitas. 608 p.
Madsen, B. 1984. Flint Axe Manufacture in the Neolithic: Experiments with Grinding and Polishing of

Revisão do Estudo de Impacto Ambiental – EIA - Piedade SHS – Março/2007, Pág.187
Thin-Butted Flint Axes. Journal of Danish Archaeology: (7), pp. 47-62.MAGURRAN, A.E. 1988 Ecological diversity and its Measurement. Princeton University Press, London.
179p.
MAROIS, R.; Scatamacchia, M. C.; Mahecha, A. M. G.; Jelks, E. & Almeida, J. E. 1997. Dicionário
multilíngue de termos relacionados com a indústria lítica. México, Instituto Panamericano de Geografia e
História.
MATTHEWS, W.J. 1998. Patterns in freshwater fish ecology. Chapman & Hall, New York, 756 p.
MITTERMEIER, R. A.; MYERS, N.; MITTERMEIER, C. G.(EDS.). 2000. Hotspots: earth’s biologicallyrichest and most endangered terrestrial ecoregions. México: CEMEX/Conservation International,
431 p.MYERS, N.; MITTERMEIER, R. A.; MITTERMEIER, C. G.; FONSECA, G. A. B. & KENT, J. 2000.
Biodiversity hotspots for conservation priorities. Nature, 403: 853-858 p.
NIMER, E. Climatologia das Regiões do Brasil, 1997 – IBGE. Recursos naturais e meio ambiente: uma visão
do Brasil/IBGE, Departamento de Recursos Naturais e Estudos Ambientais. 2ª ed. - Rio de Janeiro: IBGE,
1996
ODELL, G. H. 1996 Economizing behavior and the concept of “curation”. In: Odell, G. H. (ed.), Stonetools. Theoretical insights into human prehistory. New York: Plenum Press, pp. 51-80.
ODELL, G. H. et al.1996. Some Comments on a Continuing Debate. In: Odell, G. H. (ed.), Stone tools.
Theoretical insights into human prehistory. New York: Plenum Press, pp. 377-391.
OLIVE, M. & Pigeot, N. 1991 Les Tailleurs de Silex Magdaleniens d’Ëtiolles: Vers l’Identification d’une
Organization Sociale Complexe?, In: La Pierre Préhistorique, Laboratoire de Recherche des Musées de
France, , pp.173-185.
PENA G. S. 1980 Geologia da Região Sul-Sudoeste de Goiás e Partes do Leste do Mato-Grossense e do
Triângulo Mineiro Projeto Goiânia II, pp. 27-44.
PIANKA, E.R. 1967. On Lizards species diversity: North American Flatland deserts. Ecology. 48: 333-51.
POMBAL, J. P. Jr, 1997. Distribuição espacial e temporal de anuros (Amphibia) em uma poça
permanente na Serra de Paranapiacaba, sudeste do Brasil. Revista Brasileira de Biologia 57, 583-594.
Prefeitura Municipal de Monte Alegre de Minas (2004). Mapa de Cadastro do Patrimônio Histórico,
Arquitetônico, Cultural e Natural do Município.
PROUS, A. 1986-90 Os artefatos líticos, elementos descritivos classificatórios. Arquivos do Museu de
História Natural, XI, Belo Horizonte: UFMG, pp.1-90.
PROUS, A. 1990 A experimentação em arqueologia. Revista do CEPA Santa Cruz do Sul, v. 17, n. 20, pp.
17-31. ( Anais da V reunião científica da SAB ).
PROUS, A. e Fogaça, E. 1999. Archaeology of the Pleistocene-Holocene boundary in Brazil, Quarternary
International, 53/54: 21-41.
PROUS, A., Costa F. e Alonso, M. 2000 A Industria Lítica da lapa do Dragão. Arquivos do Museu de
História Natural. v. XVII. . Belo Horizonte: UFMG, pp.139-210.
PROUS, A.1992 Arqueologia Brasileira. Brasília: UNB.RA Engenharia e Consultoria Ltda, 2007. Caracterização do Aproveitamento. Piedade SHS. 25p.
RADAMBRASIL, 1983. Folha SE22. Goiânia; Geologia, geomorfologia, pedologia, vegetação e uso
potencial da terra. Rio de Janeiro: Ministério das Minas e Energia / Secretaria Geral, v.31, 768p.
RECURSOS NATURAIS E MEIO AMBIENTE: uma visão do Brasil/IBGE, Departamento de Recursos
Naturais e Estudos Ambientais. 2ª ed. - Rio de Janeiro: IBGE, 1996

Revisão do Estudo de Impacto Ambiental – EIA - Piedade SHS – Março/2007, Pág.188
REDMAN, C. L. & Watson, P. J. 1970 Systematic, intensive surface collection. American Antiquity.Vol. 35, No. 3. pp 279-291.
REDMAN, C. L. 1973 Multistage Fieldwork and Analytical Techniques. American Antiquity, v. 38, p. 61-79.
REDMAN, C. L. 1987 Surface collection, sampling, and research design: a retrospective. American
Antiquity, 52(2). Society for American Archaeology, pp. 249-265.
RIBEIRO, D. 1996 Os índios e a civilização: a integração das populações indígenas no Brasil moderno,
Companhia das Letras, São Paulo.
RICHTER, B. D., J. V. BAUMGARTNER, R. WIGINTON E D. P. BRAUN. 1996. A method for assessing
hydrologic alteration within ecosystems. Conservation Biology, 10 (4): 1163-1174.
ROCHA, C.F.D. 1994 Introdução à ecologia de lagartos brasileiros. In Nascimento L.B.; Bernardes, A.T.;
Cotta G.A. (eds.). Herpetologia no Brasil I. PUC-MG, Fund. Biodiversitas e FUNED, Belo Horizonte. Pp:
35-38.
SALE, M.J. 1985. Aquatic ecosystem response to flow modification: an overview of the issues, p. 25-31. In:
F.W. OLSON (Ed.). Proceedings of the symposium on small hydropower and fisheries. Bethesda,
American Fisheries Society, 497p.
SANTOS, G. M.; JEGU, M.; MERONA, B.(1984) Catalogo de Peixes Comerciais do Baixo Rio
Tocantins; projeto Tucuruí. Manaus, ELETRONORTE/CNPq/INPA, 83p.
SCHICK, K. D. & Toth, N. 1993. Making Silent Stones Speak – Human Evolution and the Dawn of
Technology. London. Weidenfeld & Nicholson.
SCHIFFER, M. B. 1987 The Formation Processes of the Archaeological Record. Tucson, Univ. of Arizona
Press.
SCHIFFER, M.; Sullivan, A & Klinger, T. 1979 The design of archaeological surveys. World Archaeology:
Field techniques and research design. Vol. 10. No. 1. p. 1-28.
SECRETARIA DE ESTADO DO PLANEJAMENTO E COORDENAÇÃO GERAL- SEPLAN/MG. 1987.
Anuário Estatístco de Minas Gerais, Belo Horizonte, 247 p., 1v.
SEMENOV, S. A. 1964. Prehistoric Technology. London; Adams & Dart.SICK, H. 1997. "Ornitologia Brasileira, Ed. Nova Fronteira, Rio de Janeiro, 912 p. il.
SILVA, A. M.; SCHULZ, H. E.; CAMARGO, P. B. Erosão e hidrossedimentologia em bacias hidrográficas.
São Carlos: Rima, 2003. 140 p.
SILVANO, D. L., 1999. Padrões de distribuição espacial e temporal e potencial indicador de qualidade
ambiental dos anuros (amphibia) na região da APA São José e entorno, MG, Brasil . Belo Horizonte -
MG. 01/07/1999. Dissertação, Mestrado. Mestrado. UFMG. 87p.
SPIX, J. B. von & Martius, F. von, 1976 Viagem pelo Brasil. São Paulo: Ed. Melhoramentos. TAUNAY, A.
E., 1975 História das Bandeiras Paulistas, Edições Melhoramentos, São Paulo. TIXIER, J. , Inizan, M. &
Roche, H. 1974. Glossary for description of Stone Tools. Newletter of Lithic
Technology, v.1, Washington State University.TORRENCE, R. 1986 Making and use of stone tools. Cambridge: CUPA.
TRIGGER, B. 1984 Archaeology at the Crossroads: What’s New? In: Siegel, B. J. , Beals, A. R. & Tyler, S.
A. (eds.) Annual Review of Anthropology, vol. 13. Annual Review Inc. Palo Alto, California, pp. 275-
300.
UNESCO - Organização das Nações Unidas para a Educação, a Ciência e a Cultura. Patrimônio Mundial no
Brasil, 1997. Publicações nacionais na área de ciências naturais. Disponível em

Revisão do Estudo de Impacto Ambiental – EIA - Piedade SHS – Março/2007, Pág.189
<http://www.unesco.org.br>. Acessado em 21/03/07.VELOSO, H.P., RANGEL-FILHO, A.L.R. & LIMA, J.C.A. 1991. Classificação da vegetação brasileira
adaptada a um sistema universal. Instituto Brasileiro de Geografia e Estatística, Rio de Janeiro. VOSS,
R.S. & L.H. EMMONS. 1996. Mammalian diversity in neotropical lowland rainforests: a
preliminary assessment. Bulletin of the American Museum of Natural History, New York, 230: 1-
115.
WILCOX, B.A & MURPHY, D.D. 1995. Conservation Strategy: The effects of Habitat fragmentation on
extinction. Am. Nat. 125: 879-887.
WOODRUFF, D. S. 2001. Declines of biomes and biotas and the future of evolution. PNAS. 98: 5471– 5476.