revised supporting information · 2011-10-24 · each element. rheological tests were conducted on...
TRANSCRIPT
Supporting Information for
Alkali-treated graphene oxide as a solid base catalyst: synthesis and electrochemical
capacitance of graphene/carbon composite aerogels
Fanchang Meng, Xuetong Zhang,* Bin Xu, Shufang Yue, Hui Guo and Yunjun Luo
School of Materials Science & Engineering, Beijing Institute of Technology, Beijing 100081, P. R. China
Research Institute of Chemical Defence, Beijing 100191, P. R. China
Aerospace Institute of Special Materials & Technology, China Aerospace Science & Industry Corp., Beijing 100074, P. R. China
Experimental
Materials: All reagents, including Resorcinol (99%) and formaldehyde (37% in water), absolute ethyl
alcohol, sodium hydroxide (NaOH), TFA (trifluoroacetic acid) and acetone, were purchased from Beijing
Chemical Reagents Company with their purity being of analytical grade and used as received. Graphene
oxide (GO) was synthesized in our lab according to the procedure reported in our previous study (J. Mater.
Chem., 2011, 21, 6494-6497).
Synthesis:
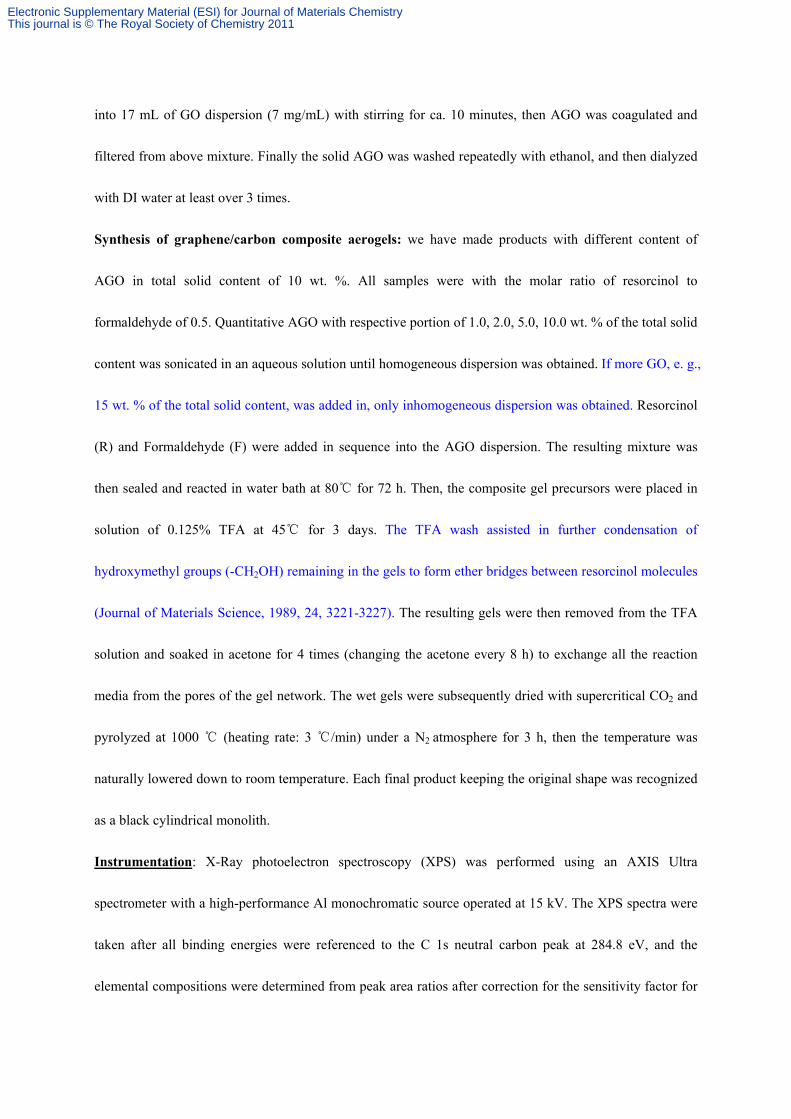
General procedure for synthesis of graphene/carbon composite aerogels is shown in Scheme 1. The
details are as follows:
Scheme 1: The synthetic route for graphene/carbon composite aerogles
Synthesis of alkali treated graphene oxide (AGO): 23.7 mL NaOH aqueous solution (0.1 M) was added
AGO nanosheet
Graphene nanosheet
Organic aerogel skeleton
Carbon aerogel skeleton
Electronic Supplementary Material (ESI) for Journal of Materials ChemistryThis journal is © The Royal Society of Chemistry 2011
into 17 mL of GO dispersion (7 mg/mL) with stirring for ca. 10 minutes, then AGO was coagulated and
filtered from above mixture. Finally the solid AGO was washed repeatedly with ethanol, and then dialyzed
with DI water at least over 3 times.
Synthesis of graphene/carbon composite aerogels: we have made products with different content of
AGO in total solid content of 10 wt. %. All samples were with the molar ratio of resorcinol to
formaldehyde of 0.5. Quantitative AGO with respective portion of 1.0, 2.0, 5.0, 10.0 wt. % of the total solid
content was sonicated in an aqueous solution until homogeneous dispersion was obtained. If more GO, e. g.,
15 wt. % of the total solid content, was added in, only inhomogeneous dispersion was obtained. Resorcinol
(R) and Formaldehyde (F) were added in sequence into the AGO dispersion. The resulting mixture was
then sealed and reacted in water bath at 80 for 72 h. Then, the composite gel precursors were placed in ℃
solution of 0.125% TFA at 45 for 3 days. ℃ The TFA wash assisted in further condensation of
hydroxymethyl groups (-CH2OH) remaining in the gels to form ether bridges between resorcinol molecules
(Journal of Materials Science, 1989, 24, 3221-3227). The resulting gels were then removed from the TFA
solution and soaked in acetone for 4 times (changing the acetone every 8 h) to exchange all the reaction
media from the pores of the gel network. The wet gels were subsequently dried with supercritical CO2 and
pyrolyzed at 1000 (℃ heating rate: 3 /min) under a N℃ 2 atmosphere for 3 h, then the temperature was
naturally lowered down to room temperature. Each final product keeping the original shape was recognized
as a black cylindrical monolith.
Instrumentation: X-Ray photoelectron spectroscopy (XPS) was performed using an AXIS Ultra
spectrometer with a high-performance Al monochromatic source operated at 15 kV. The XPS spectra were
taken after all binding energies were referenced to the C 1s neutral carbon peak at 284.8 eV, and the
elemental compositions were determined from peak area ratios after correction for the sensitivity factor for
Electronic Supplementary Material (ESI) for Journal of Materials ChemistryThis journal is © The Royal Society of Chemistry 2011
each element. Rheological tests were conducted on a Physica MCR 301 Rheometer with 25mm diameter
parallel-plate geometry. The gap distance between two plates was fixed to 2 mm and the frequency sweep
was in the range from 0.1 to 100 rad/s at a fixed oscillatory strain of 0.2%. To avoid the solvent evaporation
during the testing process, we used a plastic jacket to cover the hydrogel, and kept the test time as short as
possible (~15 min) at the room temperature. Atomic force microscope (AFM, Veeco NanoScope III, Veeco
Co., USA, operated in tapping mode) was used to characterize the surface topography of the samples. TEM
was conducted at a FEI Tecnai 20 transmission electron microscopy. The imaging was performed at 200
kV. Nitrogen sorption measurements were performed with ASAP 2010 (Micromeritics, USA) to obtain
pore properties such as the BET-specific surface area, pore size distribution, and total pore volume. Before
measurement, the sample was outgassed under vacuum at 250℃ for ca. 10 h until the pressure less than
0.665 Pa. UV-Vis spectroscopy was performed on UV-6100 double beam spectrophotometer (Shanghai
Mapada). Fourier transformed infrared (FT-IR, Bruker Tensor 27) spectra were recorded between 400 and
4000 cm-1. Raman spectra were recorded on a Renishaw system 1000 with a 50 mW He-Ne laser operating
at 514.5 nm with a CCD detector. XRD patterns of samples were measured with a X’Pert Pro MPD
(PANalytical, The Netherlands) diffractometer with monochromatic Cu Kα1 radiation (λ = 1.5406 Å) at 40
kV and 40 mA. The diffraction patterns were optimized with a step length of 0.01° (2θ) over an angular
range 4.5-90° (2θ) with a scanning speed of 0.01°/s. The compression tests were carried out by a
single-column system (FPZ100) with loading capacity from 100 to 1000 N at a constant loading speed of 1
mm/min. The electrochemical performances of the samples were measured in a two-electrode cell. The
electrodes were prepared by pressing a mixture of 87 wt% of sample, 10 wt% of acetylene black and 3 wt%
of PTFE binder into pellets (11 mm in diameter) and then drying at 120 °C for 12 h. The capacitor was
assembled into two-electrode system, among which two electrodes were separated by polypropylene
Electronic Supplementary Material (ESI) for Journal of Materials ChemistryThis journal is © The Royal Society of Chemistry 2011
membrane using 6 mol.L-1 KOH aqueous solutions as electrolyte. The cyclic voltammetry (CV) was
recorded by Solartron 1280B electrochemical workstation. The galvanostatic charge/discharge test was
carried out on an Arbin cell tester (CT2001A) between 0 and 1 V. The specific capacitance (C) of a single
electrode was determined with the formula 2 /C It Vm= Δ ,where I is the discharge current (A), t is the
discharge time (s), VΔ is the potential change in discharge (V) and m is the mass of the active material in a
single electrode (g). A Keithley 4200 Semiconductor Characterization System was used to measure
electrical conductivities (four-probe method) of the samples. Furthermore, the density of the resulting
products calculated in Table 1 was determined as the mass of the aerogel divided by its volume, and the
porosity of the resulting products was calculated as 100)2.2
1( ×−ρ
, where 2.2 (in the unit of g/cm3)
means the density of the graphite.
Electronic Supplementary Material (ESI) for Journal of Materials ChemistryThis journal is © The Royal Society of Chemistry 2011

Figures
Fig. SI1 (a) full scan spectra of GO and AGO. Elements for GO: O: 32.44%, C: 65.97%, S: 1.48%, Cl:
0.11%.. Elements for AGO: O: 26.32%, C: 67.71%, S: 0.47%, Cl: 0.19%, Na: 5.31%. (b) high-resolution
Na 1s XPS spectrum of AGO, (c) high-resolution O 1s XPS spectrum of GO and (d) high-resolution O 1s
XPS spectrum of AGO.
1000 800 600 400 200 0
Na
2pN
a 2s
S 2p
S 2 s
C 1
s
Na
KLL
O 1
s
O K
LL
Na
1s
Binding Energy (eV)
S 2p
S 2s
O 2
s
AGO GO
1065 1070 1075 1080
Binding Energy(ev)
COONa1071.6
538 536 534 532 530 528 526
Sum O-C O=C O=C-OH
Binding Energy(ev)
530.7
531.8
532.5
538 536 534 532 530 528 526
Binding Energy(ev)
Sum O-C O=C O=C-ONa
530.4
531.8
532.5
538 536 534 532 530 528 526
Sum O-C O=C O=C-OH
Binding Energy(ev)
530.7
531.8
532.5
538 536 534 532 530 528 526
Binding Energy(ev)
Sum O-C O=C O=C-ONa
530.4
531.8
532.5
a b
c d
Electronic Supplementary Material (ESI) for Journal of Materials ChemistryThis journal is © The Royal Society of Chemistry 2011
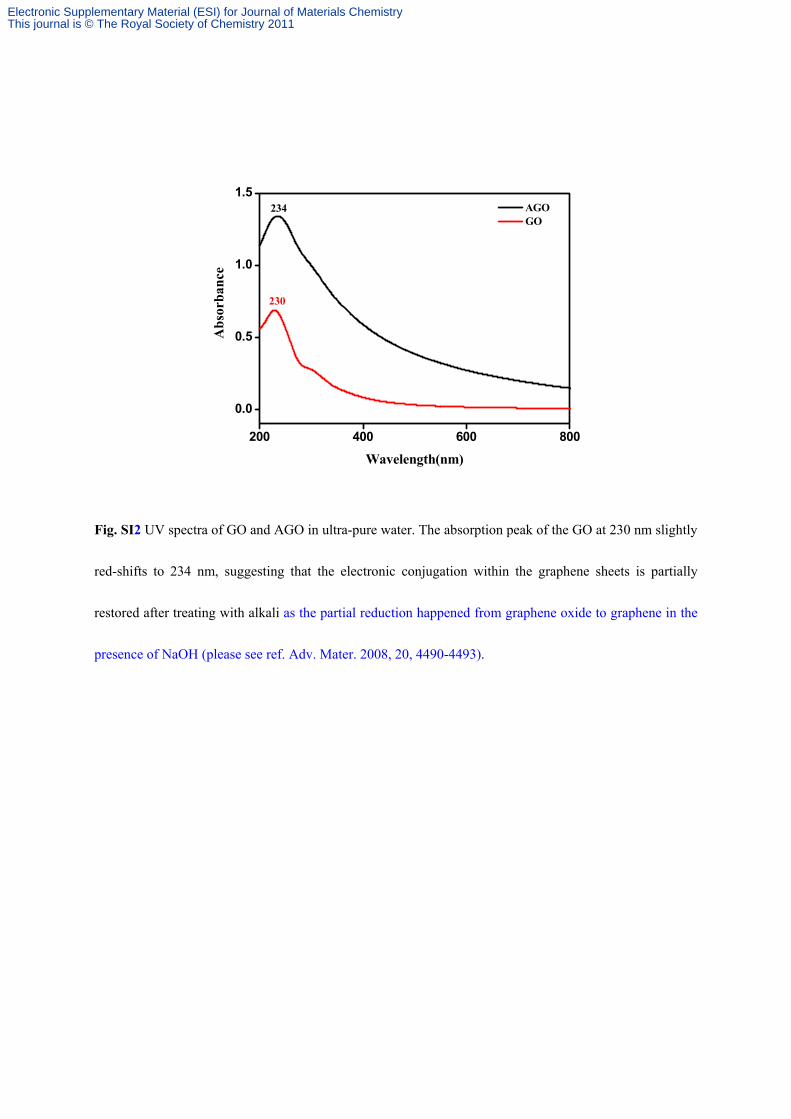
Fig. SI2 UV spectra of GO and AGO in ultra-pure water. The absorption peak of the GO at 230 nm slightly
red-shifts to 234 nm, suggesting that the electronic conjugation within the graphene sheets is partially
restored after treating with alkali as the partial reduction happened from graphene oxide to graphene in the
presence of NaOH (please see ref. Adv. Mater. 2008, 20, 4490-4493).
200 400 600 800
0.0
0.5
1.0
1.5234
Abs
orba
nce
Wavelength(nm)
AGO GO
230
Electronic Supplementary Material (ESI) for Journal of Materials ChemistryThis journal is © The Royal Society of Chemistry 2011

Fig. SI3 FT-IR spectra of GO and AGO. The peak at 3402 cm-1 shows a strong and broad absorption due to
the –OH stretching vibration (J. Phys. Chem, 2010, 114, 10368-10373), and an absorption band at 1728
cm-1 is typical of carbonyl stretching (Carbon, 2009, 47, 68-72). The peak at 1224 cm-1 due to C–OH
stretching and one at 1052 cm-1 arises from C–O stretching, respectively (J. Phys. Chem. B, 2010, 114,
5723-5728).
4000 3500 3000 2500 2000 1500 1000
1728
3402
1224
Tra
nsm
ittan
ce(%
)
Wavenumber(cm-1)
GO AGO
17281622
13901052
3404
16211384
12321054
Electronic Supplementary Material (ESI) for Journal of Materials ChemistryThis journal is © The Royal Society of Chemistry 2011
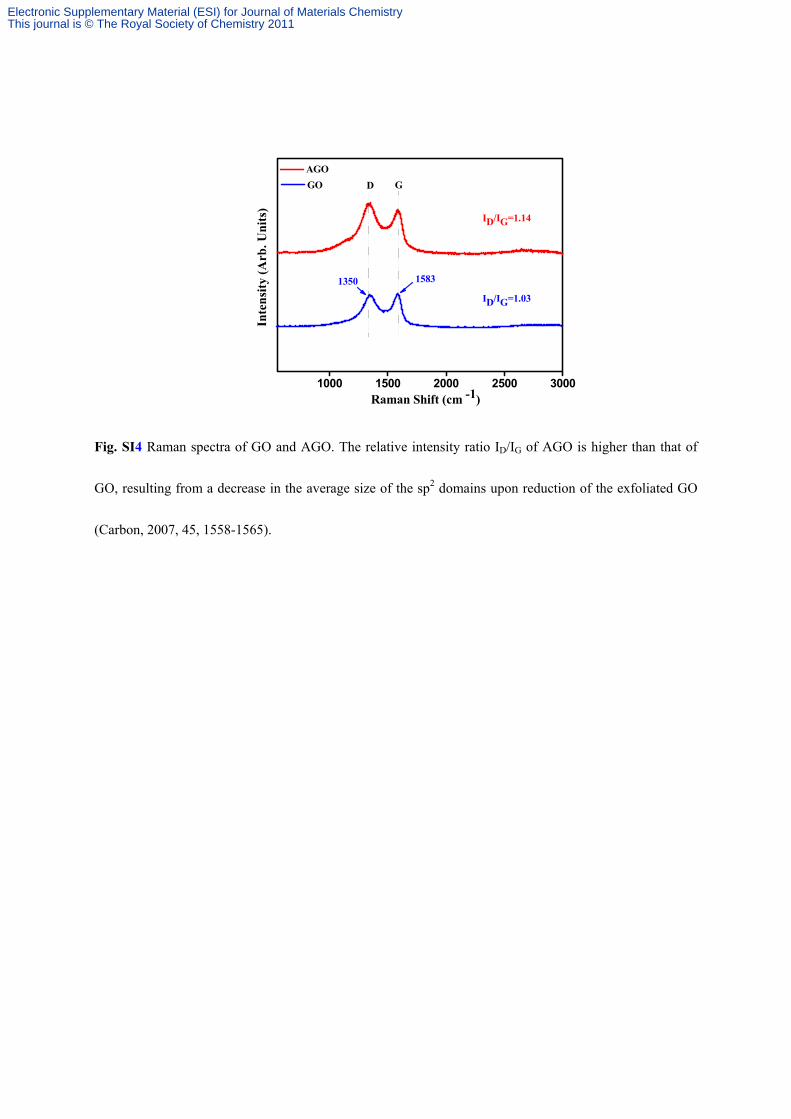
Fig. SI4 Raman spectra of GO and AGO. The relative intensity ratio ID/IG of AGO is higher than that of
GO, resulting from a decrease in the average size of the sp2 domains upon reduction of the exfoliated GO
(Carbon, 2007, 45, 1558-1565).
1000 1500 2000 2500 3000
ID/IG=1.03
G
Inte
nsity
(Arb
. Uni
ts)
Raman Shift (cm -1)
AGOD
ID/IG=1.14
1583
GO
1350
Electronic Supplementary Material (ESI) for Journal of Materials ChemistryThis journal is © The Royal Society of Chemistry 2011
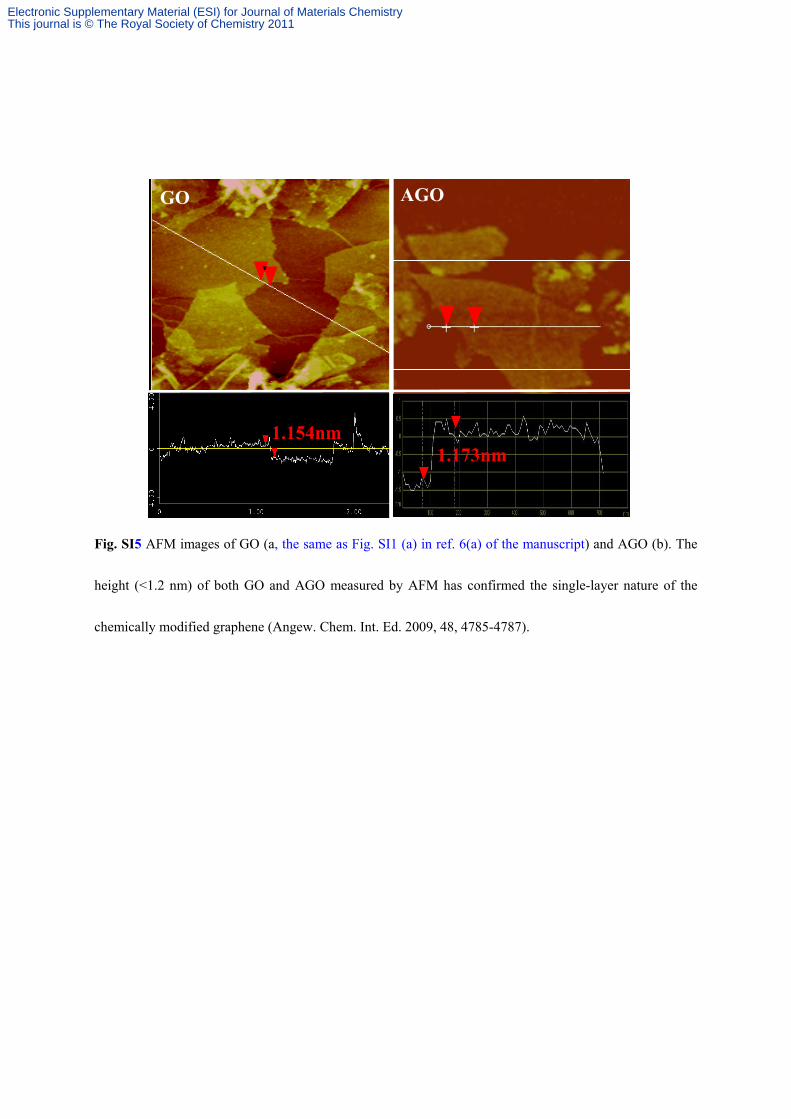
Fig. SI5 AFM images of GO (a, the same as Fig. SI1 (a) in ref. 6(a) of the manuscript) and AGO (b). The
height (<1.2 nm) of both GO and AGO measured by AFM has confirmed the single-layer nature of the
chemically modified graphene (Angew. Chem. Int. Ed. 2009, 48, 4785-4787).
1.154nm1.173nm
GO AGO
1.154nm1.173nm
GO AGO
1.154nm1.173nm
GO AGO
Electronic Supplementary Material (ESI) for Journal of Materials ChemistryThis journal is © The Royal Society of Chemistry 2011
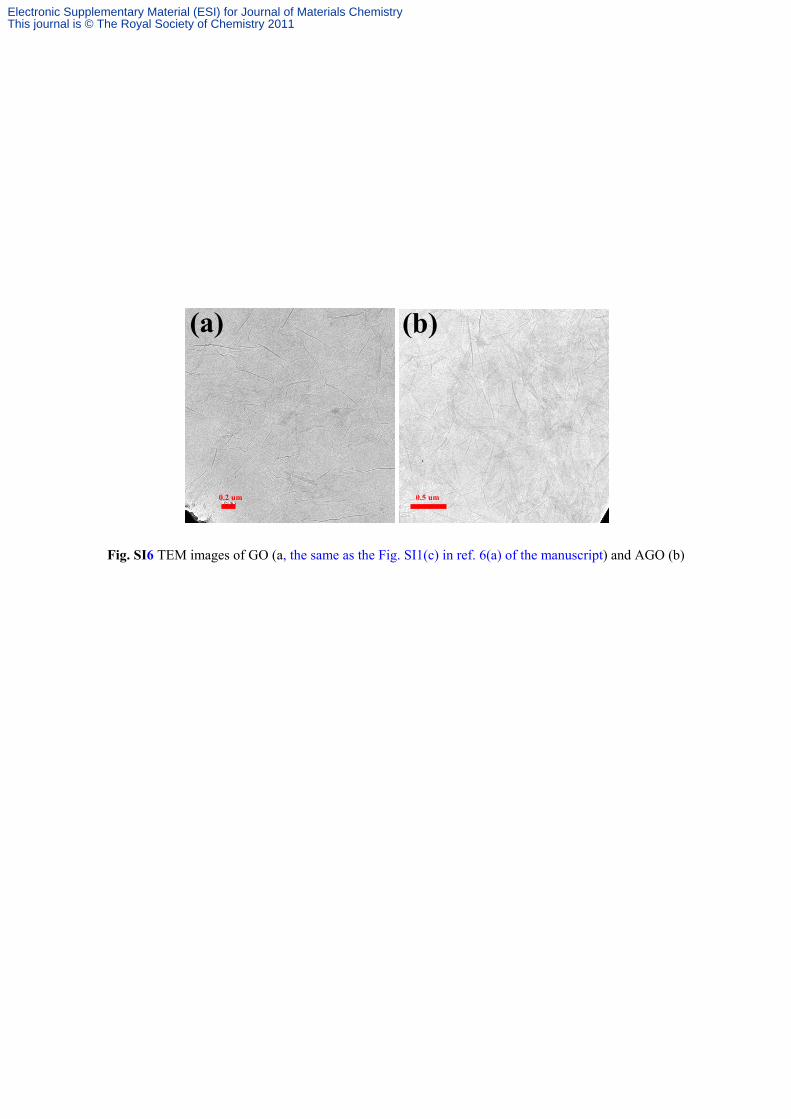
Fig. SI6 TEM images of GO (a, the same as the Fig. SI1(c) in ref. 6(a) of the manuscript) and AGO (b)
0.5 um 0.2 um
(a) (b)
Electronic Supplementary Material (ESI) for Journal of Materials ChemistryThis journal is © The Royal Society of Chemistry 2011

Fig. SI7 Proposed mechanism on polymerization of R with F in the presence of AGO as a solid base
catalyst, very similar to that of using NaCO3 as a catalyst (see Adv. Mater., 2003, 15, 101-114).
HO OHHO O 2 H C H
OOH
OHCH2OH
HOH2C
1. Addition Reaction
2. Condensation Reaction
OH
OH
CH2OH
HOH2C
HOH
OH
CH2
H2C
OH
OH
CH2OH
HOH2C
+
OH
OH
H2C
HOH2C
OH
CH2OH
CH2OH
HO
HO
CH2OH
CH2OCH2
H
OH
OH
H2C
CH2
HO
OH
CH2
OH2C
H2C
CH2
O
OH
HOH2C
HO
CH2OHOHOH
+
HO
HO
OH2C
HOHOCH2
COONa
COONa COOH
COOH
HO OHHO O 2 H C H
OOH
OHCH2OH
HOH2C
1. Addition Reaction
2. Condensation Reaction
OH
OH
CH2OH
HOH2C
HOH
OH
CH2
H2C
OH
OH
CH2OH
HOH2C
+
OH
OH
H2C
HOH2C
OH
CH2OH
CH2OH
HO
HO
CH2OH
CH2OCH2
H
OH
OH
H2C
CH2
HO
OH
CH2
OH2C
H2C
CH2
O
OH
HOH2C
HO
CH2OHOHOH
+
HO
HO
OH2C
HOHOCH2
COONa
COONa COOH
COOH
Electronic Supplementary Material (ESI) for Journal of Materials ChemistryThis journal is © The Royal Society of Chemistry 2011
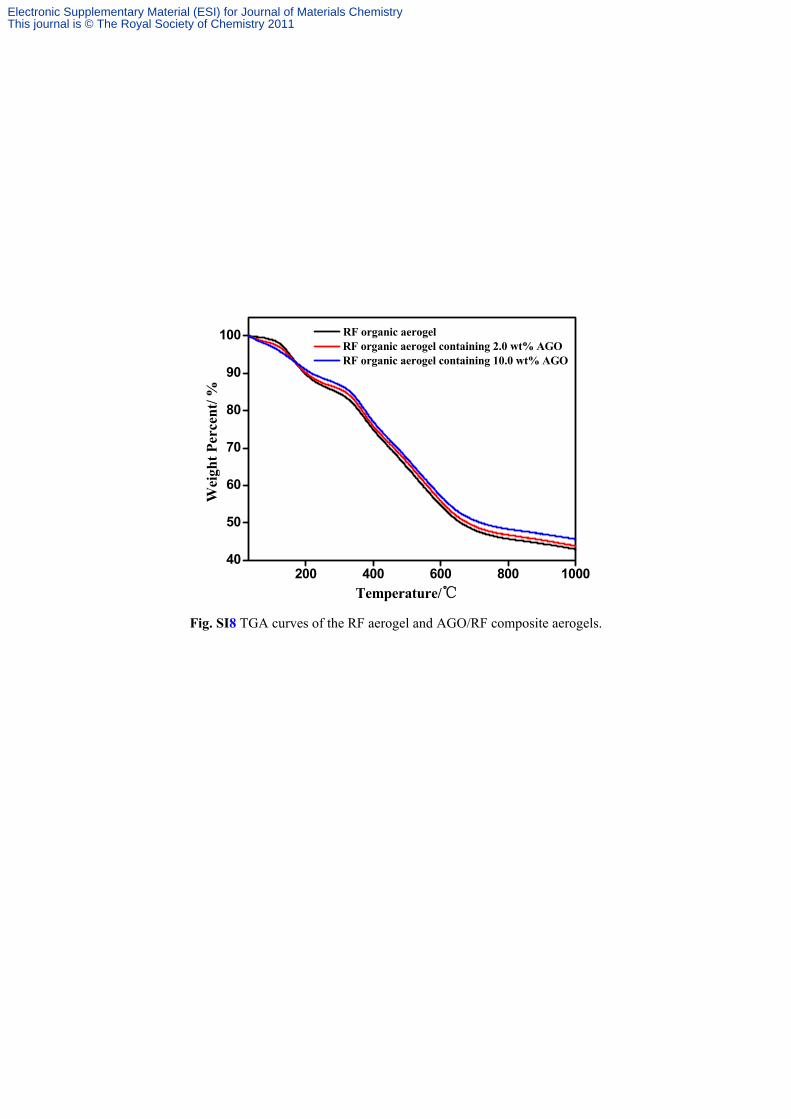
Fig. SI8 TGA curves of the RF aerogel and AGO/RF composite aerogels.
200 400 600 800 100040
50
60
70
80
90
100
Wei
ght P
erce
nt/ %
Temperature/℃
RF organic aerogel RF organic aerogel containing 2.0 wt% AGO RF organic aerogel containing 10.0 wt% AGO
Electronic Supplementary Material (ESI) for Journal of Materials ChemistryThis journal is © The Royal Society of Chemistry 2011
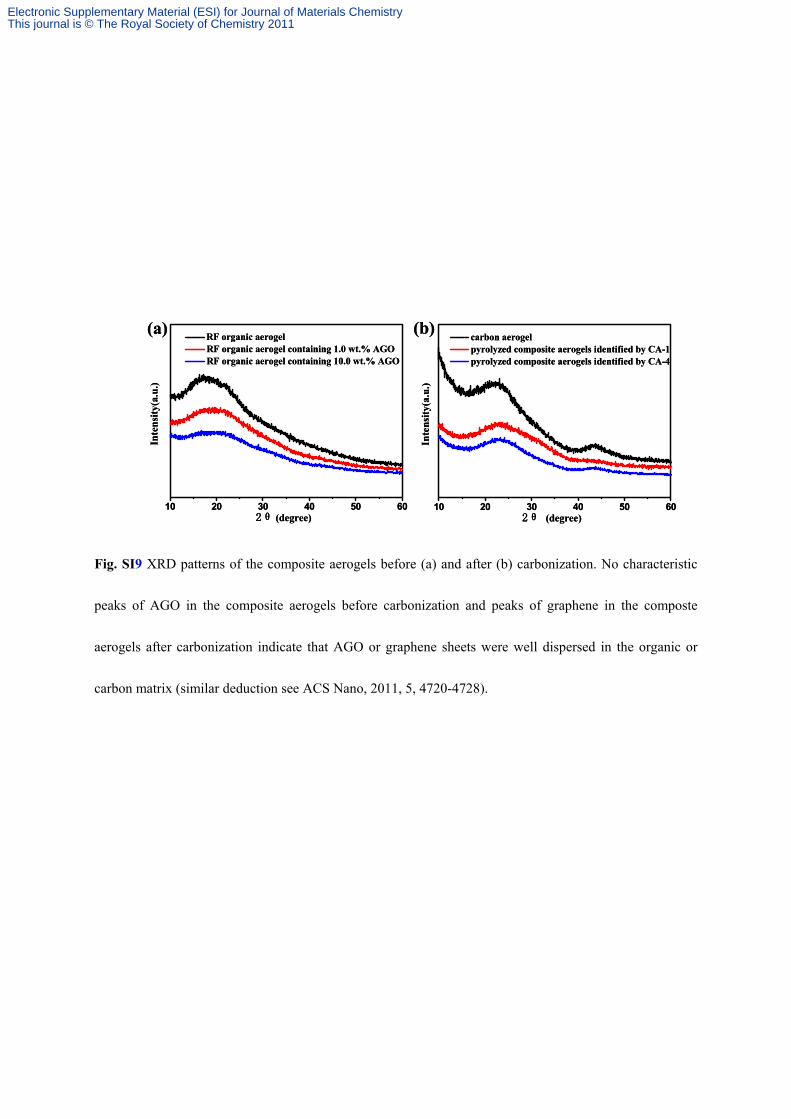
Fig. SI9 XRD patterns of the composite aerogels before (a) and after (b) carbonization. No characteristic
peaks of AGO in the composite aerogels before carbonization and peaks of graphene in the composte
aerogels after carbonization indicate that AGO or graphene sheets were well dispersed in the organic or
carbon matrix (similar deduction see ACS Nano, 2011, 5, 4720-4728).
10 20 30 40 50 60
Inte
nsity
(a.u
.)
2θ (degree)
RF organic aerogel RF organic aerogel containing 1.0 wt.% AGO RF organic aerogel containing 10.0 wt.% AGO
10 20 30 40 50 60
Inte
nsity
(a.u
.)
2θ (degree)
carbon aerogel pyrolyzed composite aerogels identified by CA-1 pyrolyzed composite aerogels identified by CA-4
(a) (b)
10 20 30 40 50 60
Inte
nsity
(a.u
.)
2θ (degree)
RF organic aerogel RF organic aerogel containing 1.0 wt.% AGO RF organic aerogel containing 10.0 wt.% AGO
10 20 30 40 50 60
Inte
nsity
(a.u
.)
2θ (degree)
carbon aerogel pyrolyzed composite aerogels identified by CA-1 pyrolyzed composite aerogels identified by CA-4
(a) (b)
Electronic Supplementary Material (ESI) for Journal of Materials ChemistryThis journal is © The Royal Society of Chemistry 2011

Fig. SI10 Raman spectra of the composite aerogels before carbonization (a) and after carbonization
(b).The ratio of ID/IG was increased after carbonization, indicating that the AGO have been converted
into graphene during carbonization (the intensity ratio of ID/IG for the pure graphene is 1.34 in our
case).
1000 1500 2000 2500
RF organic aerogel RF organic aerogel containing 1.0 wt.% AGO RF organic aerogel containing 10.0 wt.% AGO
ID/IG=0.98
1586
Inte
nsity
(Arb
. Uni
ts)
Raman Shift (cm -1)
1340
D G
ID/IG=0.96
750 1000 1250 1500 1750 2000
carbon aerogel pyrolyzed composite aerogels identified by CA-1 pyrolyzed composite aerogels identified by CA-4
D
Inte
nsity
(Arb
. Uni
ts)
Raman Shift (cm -1)
1325
1590G
ID/IG=1.28
ID/IG=1.16
ID/IG=1.14
(a) (b)
Electronic Supplementary Material (ESI) for Journal of Materials ChemistryThis journal is © The Royal Society of Chemistry 2011
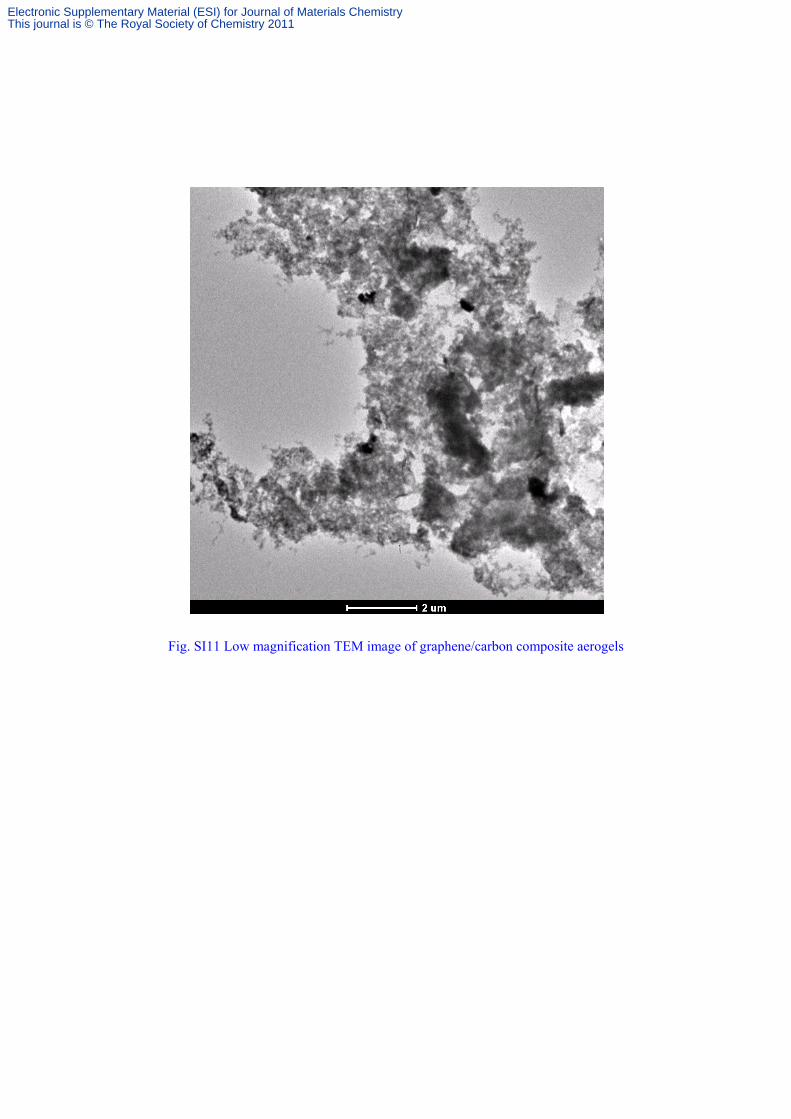
Fig. SI11 Low magnification TEM image of graphene/carbon composite aerogels
Electronic Supplementary Material (ESI) for Journal of Materials ChemistryThis journal is © The Royal Society of Chemistry 2011

Fig. SI12 Compressive stress-strain curves of the resulting graphene/carbon composite aerogels with
different amount of original AGO.
0.0 1.2 2.4 3.6 4.8 6.00.0
0.8
1.6
2.4
3.2C
ompr
essi
ve st
ress
(MPa
)
Comprssive strain (%)
1% AGO 2% AGO 5% AGO 10% AGO
E10=29.558MPaE5=17.632MPaE2=5.707MPaE1=3.633MPa
Electronic Supplementary Material (ESI) for Journal of Materials ChemistryThis journal is © The Royal Society of Chemistry 2011