revision of soil taxonomy in the classification of low
TRANSCRIPT

REVISION OF SOIL TAXONOMY IN THE CLASSIFICATION OF
LOW ACTIVITY CLAY SOILS
A DISSERTATION SUBMITTED TO THE GRADUATE DIVISION OF THE UNIVERSITY OF HAWAII IN PARTIAL FULFILLMENT
OF THE REQUIREMENTS FOR THE DEGREE OF
DOCTOR OF PHILOSOPHY
IN AGRONOMY AND SOIL SCIENCE
December 1983
by
MODESTO RAGANIT RECEL
Dissertation Committee:
Goro Uehara, Chairman Haruyoshi Ikawa Rollin C. Jones
Charles I. Murdoch James E. Silva

ii
We certify that we have read this dissertation and that in
our opinion it is satisfactory in scope and quality as a dissertation
for the degree of Ph.D. in Agronomy and Soil Science.
DISSERTATION COMMITTEE
Chairman
ill
ACKNOWLEDGEMENTS
The supports of the Benchmark Soils Project of the University of
Hawaii and of the Philippine government that made this graduate program
possible are gratefully acknowledged.
Special thanks are given to Director Godofredo N. Alcasid, Jr. of
the Bureau of Soils, Philippines for allowing me to pursue my doctorate degree.
Special recognition must also be given to Dr. Hari Eswaran of the
Soil Management Support Services, USDA, SCS for his valuable advices.
Sincere appreciation is expressed to Dr. Gordon Tsuji and his staff
who helped me in various ways.
And finally, my gratitude goes to my wife who typed this disserta
tion and gave me companionship and encouragement to finish my degree.

IV
ABSTRACT
The dominant soils of the intertropical region are Oxisols and low
activity clay (LAC) Ultisols and Alfisols, which are collectively termed
LAC soils. Due to Insufficient knowledge of these soils, their classi
fication was not as satisfactorily developed as the soils of the tempe
rate areas, and consequently, two International Committees (Internatio
nal Committee on Classification of Alfisols and Ultisols with Low Acti
vity Clays and International Committee on Classification of Oxisols)
were set up in 1975 and 1977, respectively, to develop proposals for
the refinement of Soil Taxonomy.
Through circular letters and classification workshops, these Inter
national Committees have proposed several changes in the classification.
The purpose of this dissertation was to evaluate these proposals, test
their appropriateness and validity and where necessary, to suggest
alternatives for consideration.
The review draft of a proposal for reclassification of Ultisols
and Alfisols with low activity clays which constitute the final report
of the ICOMLAC by the SCS and ICOMOX Circular Letter No. 10, dated June 1, 1983 and January 11, 1983, respectively, were the basis for the
final discussion and suggestions in this study.
The methodology consisted of fitting 163 test pedons from the in
tertropical region into the ICOM's proposals through specially developed
flow-diagrams. From these tests, suggestions were made for refinement.
The basis for proposing any modifications were:Ca) the modifications should result in marked improvements in the

interpretation which could be derived in the taxa names;
(b) the modification should result to a better expression of the
soil-landscape relationships;
(c) the modification should introduce significant advantage either
or both in the field or laboratory evaluations;
(d) the modification should result in mutually exclusive classes
and should not conflict with the other parts of the system; and
(e) the modification should not result in any soil in a landscape
from not being classified.
The criteria set in evaluating the impact of revision on agrotech
nology transfer were:
(a) revision should achieve groupings of soils having closely
similar crop production potential; and
Cb) revision should stratify agroenvironment into distinct agropro
duction niches.
The ICOM's proposals Improved the taxonomic placements of the LAC
soils, but there were pedons that could be placed in more than one taxa.
Amendments were suggested to overcome these limitations. Some of the
diagnostic class limits were refined. Certain criteria were also recommended for deletion and/or addition.
Finally, all the proposed changes were included in a key for the
classification of these soils.

TABLE OF CONTENTS
Vi
ACKNOWLEDGEMENTS............................................. iii
A B S T R A C T ..................................................... iv
TABLE OF CONTENTS .......................................... vi
LIST OF T A B L E S .............................................. xi
LIST OF FIGURES ............................................ xiv
I. INTRODUCTION......... 1
1.1. The Problem......................................... 2
1.1.1. Classification problems with the Oxisols . . . 2
1.1.2. Classification problems with the LAC Ultisols
and Alfisols................................. 3
1.2. Objectives......................................... 5
II. REVIEW OF LITERATURE.................................... 6
2.1. Concept of O x i s o l s ................................ 7
2.2. Concept of Oxic Horizon............................ 9
2.3. The ICOMOX Proposals.............................. 11
2.3.1. Definition of the oxic horizon............... 142.3.2. Key definition to the O x i s o l s .............. 16
2.4. Concept of the LAC Ultisols and A l f i s o l s .......... 17
2.5. Concept of the Argillic Horizon.................... 19
2.6. Concept of the Kandic Horizon...................... 20
2.7. The ICOMLAC Proposals.............................. 222.7.1. Summary of properties of the kandic horizon. . 22
Page

vii
III. MATERIALS AND METHODS................................... 24
3.1. Data Assemblage.................................. 24
3.2. Methodology...................................... 26
3.2.1. Analytical methods ........................ 26
3.2.1.1. Particle size analysis .............. 26
3.2.2. X-Ray diffraction analysis ................ 28
3.2.3. Testing the proposals ...................... 28
3.2.3.1. On the ICOMOX proposals............ 29
3.2.3.2. On the ICOMLAC proposals ............ 29
IV. RESULTS AND DISCUSSIONS - OXISOLS...................... 31
4.1. Testing the Criteria of the Oxic Horizon.......... 31
4.1.1. The charge properties ...................... 31
4.1.2. Contamination with andic materials ........ 37
4.1.3. Weatherable mineral content ................ 43
4.1.4. Texture and clay c o n t e n t .................. 48
4.1.5. Stability of the clay fraction............ 514.1.6. Volume of rock structure.................. 52
4.1.7. Amount of gravel or coarser materials . . . . 53
4.1.8. Application of suggested amendments to test
pedons...................................... 53
4.2. Testing Criteria of Oxisols ...................... 53
4.2.1. The light textured LAC soils .............. 55
4.2.2. The heavy textured LAC soils .............. 60
TABLE OF CONTENTS (Continued)
Page

viii
TABLE OF CONTENTS (Continued)
Page
4.2.3. Application of suggested amendments to the
test pedons................................. 65
4.3. Testing Criteria of Lower Categories of Oxisols . . 68
4.3.1. Testing the ICOMOX's key to Aquox .......... 68
4.3.1.1. Test of the Ochraquox.............. 72
4.3.2. Testing the ICOMOX's key to Torrox ........ 734.3.2.2. The Eutrotorrox .................... 73
4.3.3. Illustration for suggested retention of the
humox suborder............................. 76
4.3.4. Testing the ICOMOX's key to the Ustox . . . . 80
4.3.4.1. The Eutrustox ..................... 82
4.3.4.2. The Kurustox ....................... 82
4.3.4.3. The Haplustox ..................... 83
4.3.5. Testing the ICOMOX's key to the Orthox . . . 83
4.3.5.1. The Gibbsiorthox ................... 83
4.3.5.2. The Acrorthox ..................... 894.3.5.3. The Eutrorthox.................. 90
4.3.5.4. The Kurorthox ..................... 91
4.3.5.5. The Haplorthox ..................... 92
4.4. Suggested Amendments.............................. 92
V. RESULTS AND DISCUSSIONS - LAC ALFISOLS AND ULTISOLS . . . 103
5.1. Testing the Criteria of the Kandic Horizon ........ 103
5.1.1. The charge properties ...................... 103
5.1.2. The thickness of the surface horizon . . . . 109

ix
5.1.3. The rate and amount of clay increase......... 109
5.1.4. The thickness of the horizon................. 116
5.1.5. The stratification and organic matter
distribution ................................. 116
5.1.6. The clay skins.............................. 117
5.1.7. Depth of top of the kandic horizon......... 1185.2. Suggested Addendum to the Key Definition of the
Order Ultisols . . 121
5.3. Key Definition to the Great Group of LAC Ultisols . . 121
5.4. Testing the ICOMLAC's Key to the LAC Ultisols . . . . 122
5.4.1. The Kandiaquults and Kanhaplaquults ........ 127
5.4.2. The Kandihumults and Kanhaplohumults ........ ■ 127
5.4.3. The Kandiudults and Kanhapludults ......... 133
5.4.4. The Kandiustults and Kanhaplustults ....... 140
5.5. Suggested Addendum to the Key Definition of the
Order Alfisols...................................... 146
5.6. Key Definition to the Great Groups of LAC Alfisols . 1465.7. Testing the ICOMLAC's Key to the LAC Alfisols . . . . 147
5.7.1. The Kandiaqualfs ............................. 147
5.7.2. The Kandiustalfs and Kanhaplustalfs ......... 148
5.7.3. The Kandiudalfs and Kanhapludalfs ......... 148
5.8. Suggested Amendments of the Definition of the Kandic
Horizon with Respect to both LAC Alfisols and Ulti
sols ................................................ 155
TABLE OF CONTENTS (Continued)
Page

X
5.9. Suggested Key to the LAC Interphase................ 157
5.10. Impact of the Proposed Revision of Agrotechnology
Transfer........................................... 160
5.10.1. The ICOMOX's revision ...................... 160
5.10.2. The ICOMLAC's revision .................... 172
VI. RESULTS AND DISCUSSION - STANDARDIZATION OF DATA, TEST OF
EQUATION TO ESTIMATE CLAY CONTENT, AND RECLASSIFICATION OF
TEST PEDONS............................................. 177
6.1. Standardization of some Laboratory D a t a ............ 177
6.2. Test of Equation to Estimate Clay Content.......... 177
6.3. Final Classification of Test Pedons .............. 183
VII. CONCLUSIONS............................................. 189
APPENDICES
I .......................... •......................... 203
I I ..................................................... 208
I I I ..................................................... 214I V ..................................................... 223V . . . ............................................. 234V I ..................................................... 235
LITERATURE CITED ............................................. 239
TABLE OF CONTENTS (Continued)
Page

XI
LIST OF TABLES
1 Proposed changes of the parameters defining the oxichorizon by ICOMOX............................... 12
2 Chronology of changes in the proposed taxa in the orderOxisols by ICOMOX......................................... 13
3 Result of tests of ICOMOX proposed properties to definethe Oxic horizon of Oxisols............................... 32
4 Characteristics of the Maile series, (EPT-8) an Incepti-sols, used to test ICOMOX's proposed definition of theoxic horizon.............................................. 39
5 Characteristics of the Koolau series, (EPT-7) a PlinthicTropaquept, fine, halloysitic, acid, isothermic, used to test the ICOMOX's proposed definition of the oxic horizon ....................................................... 41
6 The of some pedons of Oxisols.................... 42
Table Page
447 The of selected pedons of Andisols ..............
8 The pH^^p of two pedons of the Waimea series, a TypicEutrandept, medial, isothermic in Hawaii .............. 45
9 Characteristics of the Waimea series, a Typic Eutrandept in H a w a i i ......................................... 46
10 Characteristics of the Kohala series in Hawaii used to test the proposed definition of the oxic horizon byICOMOX.................................................. 47
11 Recommended amendments to ICOMOX*s proposals and theiri m p a c t ................................................. 54
12 Characteristics of the Farmhill series in South Africa that were used to test Item C.l of the proposed ICOMOXkey definition of the order Oxisols.................... 58
13 Characteristics of a soil with ECEC less than 1.5 meqper 100 g clay and a positive ApH (Maile series, Hydric Dystrandepts). Source: SSIR No. 29, 1976, p 30.......... 61
14 Result of taxonomic tests on the recommended amendments.. 67

xii
LITST OF TABLES (Continued)
15a Distribution and placement of the great groups in thekey to the suborders of Oxisols in Soil Taxonomy . . . . 70
15b Proposed distribution and placement of the great groupsin the key to the suborders of Oxisols (ICOMOX CL No. 29 1982).................................................. 70
16 Some diagnostic attributes of selected pedons relatedto the "Gibbsi" characteristics ....................... 86
17 P-sorption capacity of selected Oxisols ............... 87
18 Characteristics of pedons that are accommodated by ItemCDA of the proposed key to Orthox great groups........ 88
19 Proposed ICOMOX revision of the key to suborders of theorder Oxisols and suggested amendments................ 93
20 Proposed ICOMOX revision of the key to the great groupsand the suggested amendments.......................... 96
21 Key attributes of selected pedons of LAC Mollisols.Source: SSIR No. 29, 1976, pages 104 and 1 0 8 .......... 107
22 Key attributes of the Uwala series, a LAC Inceptisol.Source: SSIR No. 29, 1976, page 9 2 .................... 108
23 Calculated data of LAC Ultisols used to test the definition of kandic horizon............................... 1 1 2
24 Result of the test of the ICOMLAC's proposed diagnosticproperties of the kandic horizon ...................... 119
25 Result of tests of the Kandi taxa of LAC Ultisols . . . 126
26 Key attributes of Pedon ULT-53 that were used to testthe LAC Aquults........................................ 130
27 Key attributes of selected Oxisols and Ultisols thatwere used to test the LAC Udults...................... 136
28 Key attributes of selected pedons used to test the LACUstults................................................ 143
29 Reclassification of the Benchmark network of soil families in accordance with the ICOMS proposals andwith the suggested amendments made in this study . . . . 163
Table Page
LIST OF TABLES (Continued)
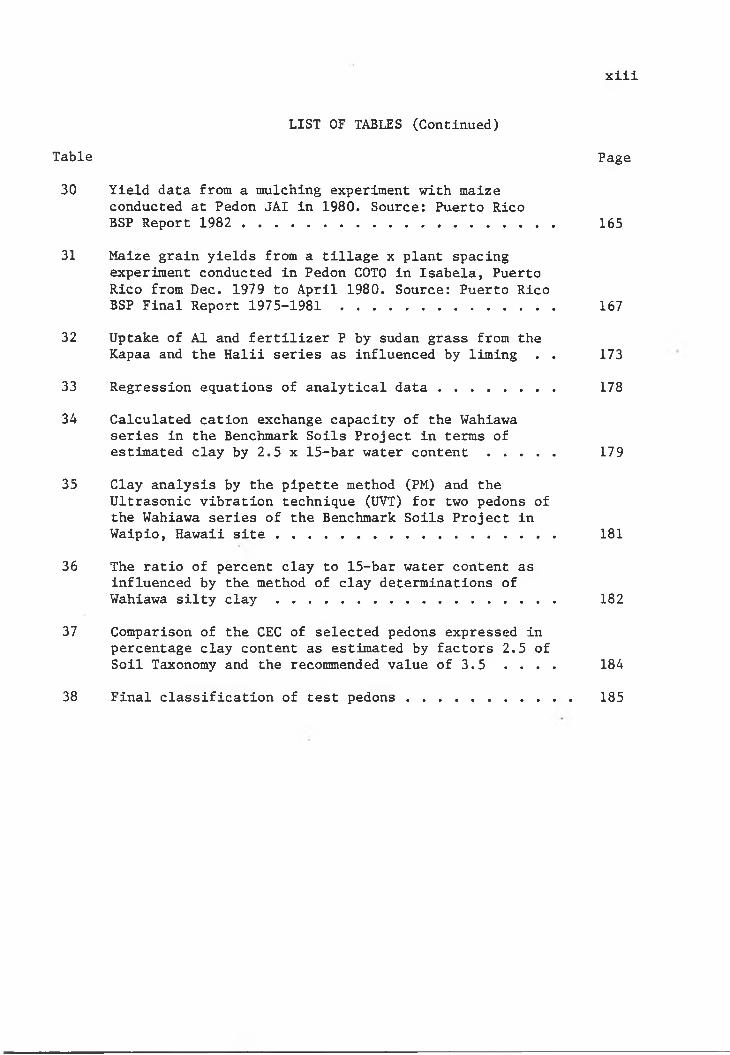
30 Yield data from a mulching experiment with maize conducted at Pedon JAI in 1980. Source; Puerto RicoBSP Report 1982 ....................................... 165
31 Maize grain yields from a tillage x plant spacing experiment conducted in Pedon COTO in Isabela, Puerto Rico from Dec. 1979 to April 1980. Source: Puerto RicoBSP Final Report 1975-1981 167
32 Uptake of A1 and fertilizer P by sudan grass from theKapaa and the Halii series as influenced by liming . . 173
33 Regression equations of analytical data ............... 178
34 Calculated cation exchange capacity of the Wahiawa series in the Benchmark Soils Project in terms ofestimated clay by 2.5 x 15-bar water c o n t e n t ........ 179
35 Clay analysis by the pipette method (PM) and the Ultrasonic vibration technique (UVT) for two pedons of the Wahiawa series of the Benchmark Soils Project inWaipio, Hawaii s i t e ................................... 181
36 The ratio of percent clay to 15-bar water content as influenced by the method of clay determinations ofWahiawa silty c l a y ................................... 182
37 Comparison of the CEC of selected pedons expressed in percentage clay content as estimated by factors 2.5 ofSoil Taxonomy and the recommended value of 3.5 . . . . 184
38 Final classification of test pedons..................... 185
xiii
Table Page

XIV
1 Distribution of test pedons............................. 25
2 Diagram of methodology .................................. 27
3 Fitting the test pedons into the flow-diagram key of theICOMOX's definition of the oxic horizon................ 35
4 The relationship between CEC and ECEC in Oxisols . . . . 38
5 The relationship of the ratio of cation exchange capacityto clay versus the percent clay of selected pedons of Oxisols................................................. 50
6 Fitting the test pedons into the flow-diagram key of theICOMOX*s definition of the order Oxisols .............. 56
7 Clay content of the Farmhill series as a function of depth showing the kandic horizon with a clear uppertextural boundary ....................................... 59
8 Immobilization of P by Pauwela and Kapaa soils during 4-day equilibration of soils with a P solution. Source;DeDatta (1964).................................... 64
9 Clay content of the Pak Chong series as a function ofdepth, showing the oxic material on top of the argillic horizon.......................... 66
10 Flow-diagram key to test the ICOMOX's proposed suborderof O x i s o l s .............. 69
11 Flow-diagram key to test the ICOMOX's proposed greatgroups of Aquox......................................... 71
12 Flow-diagram to test the ICOMOX's key to the great groupsof Torrox............................................... 74
13 Relationship between organic carbon content and thecation exchange capacity of some pedons of Oxisols . . . 78
14 Relationship of percent organic carbon content and soiltemperature in selected pedons of Oxisols .............. 79
15 Flow-diagram key to test the ICOMOX's great groups ofUstox................................................... 81
LIST OF FIGURES
Figure Page

XV
16 Flow-diagram key to test the ICOMOX's proposed greatgroups of Orthox....................................... 84
17 Flow-diagram key to test the definition of the kandichorizon • • • • 104
18 Clay content of the Daobli series in the Southwest Ivory Coast showing the depth of the required clay Increase ofa kandic horizon ....................................... 1 1 0
19 Clay distribution of a deeply developed (Kandi) and aless deeply developed (Kanhapl) kandic horizons of selected LAC Ultisols in Brazil. Source: Proc. 1st ISCW(1978) p 226 ........................................... 123
20 Flow-diagram to test the ICOMLAC's key to the subordersof Ulti s o l s........................................... 124
21 Flow-diagram to test ICOMLAC's key to Aquult greatgroups................................................. 128
22 Flow-diagram to test ICOMLAC's key to Humult greatgroups................................................. 132
23 Flow-diagram to test ICOMLAC's key to Udult greatgroups................................................. 134
24 Flow-diagram to test ICOMLAC's key to Ustult greatgroups . . . . . . . . . . . . . . . . a . . . . . . . . 141
25 Flow-diagram to test ICOMLAC's key to Ustalf greatgroups................................................. 149
26 Flow-diagram to test ICOMLAC's key to Udalf greatgroups................................................. 151
27 Diagram showing the Oxisols-LAC Alfisols and Ultisolsinterphase............................................. 158
28 Diagram showing the low activity clay soils interphase . 15929 Suggested flow-diagram key to the low activity clay
soils.................................................. 161
30 Immobilization of phosphate by Halii and Kapaa soilsduring four-day equilibration of soils with a phosphate solution. Source: Fox et al. (1963).................... 170
LIST OF FIGURES (Continued)Figure Page
XVI
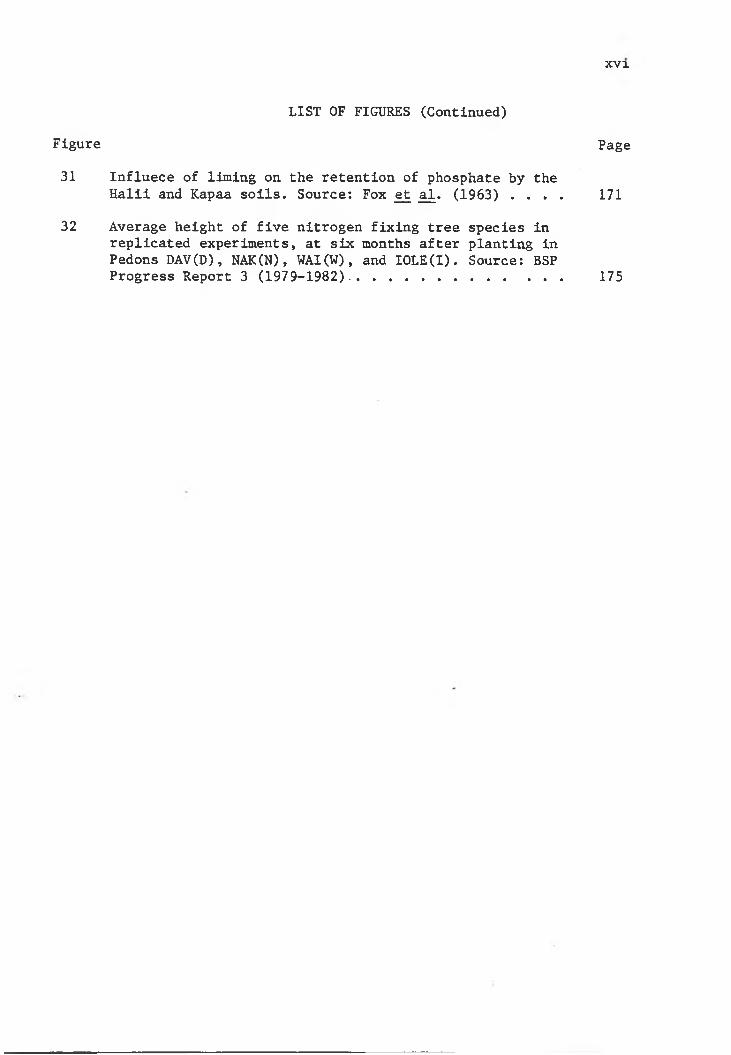
31 Influece of liming on the retention of phosphate by theHalii and Kapaa soils. Source; Fox et al. (1963) . . . . 171
32 Average height of five nitrogen fixing tree species in replicated experiments, at six months after planting in Pedons DAV(D), NAK(N), WAI(W), and lOLE(I). Source: BSP Progress Report 3 (1979-1982).......................... 175
LIST OF FIGURES (Continued)
Figure Page

Soil classification probably dates back as early as when man began
to sort out and classify objects around him. The early attempts were as
simple as grouping soils based on properties such as color or texture
or other characteristics that are easily observable and are of impor
tance to individuals using them. With time, the growing sophistication
in agriculture and the demanding complexity and diversity of soil uses promp.ted the need to modernize the system.
The purposes of soil classification, according to Cline (1949) are
to organize our knowledge about the soils so that we may be able to re
member their properties, understand their relationships, learn new re
lationships as well, and finally be able to establish groupings that
are useful to predict their behaviour, identify their best uses, estimate
their productivity and transfer technology.
Soil Taxonomy (Soil Survey Staff, 1975) is a classification system
that has potential for worldwide application. One of its advantages
over the other systems of classification is that it is quantitative and permits individuals familiar with the system to arrive at the same
classification of a given soil and extract the same kinds of information
from the taxa. The data base which the taxonomic names were derived
makes the system meaningful for land use at the level of individual
farm units (Cline, 1979).
Its appeal is evidenced by countries adopting it to classify their
soils. Cline (1980) found many countries using it as a primary system
I. INTRODUCTION

of classification, some others using it as a secondary system, while
many more are beginning to use it.
1.1 . The Problem
As other countries begin to fit their soils into the system, some
limitations were uncovered. This is not surprising because our know
ledge of soils is still incomplete (Beinroth, 1978) and at the time that
Soil Taxonomy was being developed, there were limited data on soils with
low activity clay (LAC); there was limited knowledge about the methods
of their study; and the pressing need to use the system to classify the
soils of the U.S.A. left little time and limited funds for the study of
tropical soils with low activity clays.
Hence, Soil Taxonomy needed refinement in the classification of
low activity clay soils (Soil Survey Staff, 1975).
Soil Taxonomy classifies the LAC soils at three categorical levels.
They are recognized at the order level in the Oxisols where LAC is one
of the requirements of the oxic horizon. The LAC Ultisols and Alfisols
including the LAC Inceptisols and Mollisols are assigned to the oxic
and orthoxic subgroups and finally their presence are recognized in the mineralogy classes of the family categoiry.
1.1.1. Classification Problems with the Oxisols
The limitation of Soil Taxonomy in the classification of the Oxi
sols is reflected on p 323 which reads, "The classification of Oxisols that follow seems to produce satisfactory groups of the few Oxisols in Hawaii and Puerto Rico. It needs to be tested more widely, for it is far from completion and is certain to have many shortcomings."
Many criticisms evidently point to the need for a thorough revision of the taxonomy of the Oxisols which Cline (1980) described as a

compromise of conflicting judgements that was of no satisfaction to
anyone. The boundary between the Oxisols and LAC Ultisols is very vague
CMoormann, 1979). According to Cline, the definition of Oxisols and
the soils it should encompass remain debatable, the class limits are
not precise (Isbell, 1979) and the number of taxa is limited (Regasami,
et al., 1978).
1.1.2. Classification Problems with the LAC Ultisols and Alfisols
The categorical level at which the LAC Ultisols and Alfisols are
distinguished is too low to permit meaningful taxonomic groupings
(Moormann, 1979). Consequently, the limited number of taxa inhibit
the freedom to make further separation, resulting in the grouping of
unlike soils in the same taxon.
Upgrading the classification of these soils to a higher category
appears to be a simple matter. But a proposed change which may appear
logical and meaningful for one part of the system, may be undesirable
on the other part. The diagnostic criteria to define the proposed
taxa have to be selected on the basis of their relevance to taxonomy,
to management, and their placement in the key. The subdivision of the new taxa in the lower ladder of the hierarchy requires enormous amount
of reliable field and laboratory data.The Alfisols and the Ultisols are identified by an argillic hori
zon or a horizon with accumulation of clay as described in Soil Taxo
nomy. The pedogenetic significance of this criteria has been chal
lenged (Isbell, 1979). An argillic horizon is defined by the presence
of illuvial layer lattice clays, that has a specified clay increase
compared to the eluvial horizon and by the presence of clay skins or

oriented clay or both. The amount of clay increase from the overlying
coarser textured horizon to the finer textured subsurface horizon and
the vertical distance within which this clay increase should be reached
are measured in order to define an argillic horizon. The near presence
or near absence of clay skins in the LAC Ultisols and Alfisols is very
subjective and clay skin is not unique to the LAC Ultisols in the wet
equatorial udic and perudic climates (ICOMLAC CL No. 3, 1976). This
problem will continue to be debated, and unless one has an access to
equipment for micromorphological analysis (Eswaran, 1979), it would be
difficult to confirm the presence of clay skins. There is also the
problem of ascertaining whether a clay "bulge" is a result of clay il-
luviation or some other processes (Moormann, 1979).
Clay skins or clay orientation are indicators of clay movement
from the upper to the lower horizons. Lack of clay skins, however, may
not necessarily mean that there was no movement of clay (Beinroth, ^
al., 1974) because the high biological activity in warm humid tropics
could lead to the destruction of clay skins faster than they are formed
(Gile and Grossman, 1968).
On the other hand, the clay "bulge" may be a result of selective erosion of the clay-sized particles from the surface layer or by depo
sition layering, or both. These may be mistaken for an argillic horizon.
The difficulties of ascertaining clay illuviation and the positive
identification of clay skins are complicated by an argillic horizon that has oxic properties. This problem is common in the tropical and sub
tropical countries (Cline, 1980).In many instances, separation of taxa are pragmatic and many of
4

the suggested limits to define the differentiating properties of
diagnostic criteria are emperical values. Therefore, the proposals
should be tested in the field and in as many environments of LAC soils
as possible.
It was for this purpose that this dissertation was initiated.
1.2. Objectives
The objectives of the study are:
1.2.1 To test the adequacy of the proposed definition of diagnos
tic criteria and the proposed key definitions of the Oxisols and
the LAC Alfisols and Ultisols as proposed by the International Soil
Classification Committees;
1.2.2 To determine the impact of the revision of Soil Taxonomy
on the principle of agrotechnology transfer; and
1.2.3 To recommend, if necessary, improvements to the proposed
classification schemes.

II. REVIEW OF LITERATURE
Soils in the warm humid tropics are more prone to intensive wea
thering, leaving a clay fraction that is dominantly of the 1 : 1 layered
clay minerals and the oxides-hydroxides of Fe and/or Al. These clays
are referred to as the low activity clays (LAC), which pertains to a
low cation exchange capacity (CEC) value of less than 16 meq per 100 g
clay (ICOMLAC CL No. 13, 1980).
Uehara, (1978) recognized two classes of LAC: (a) those having
high specific surface containing allophane and imogolite and other non
crystalline or poorly crystalline soil colloids, and (2) those with
crystalline, low specific surface minerals such as kaolin, Al-inter
layered secondary chlorites and oxides and hydrous oxides of Fe, Al, Ti
and Si. According to Uehara, the former class behave differently due to
their high specific surface that accounts for a high variable charge.
Here, their CEC by NH^OAc is high, but generally unrelated to the cation
retention capacity in the field. Uehara explained that these soils have
high water retention capacity, high water permeability, and low bulk density.
Low activity clays differ from high activity clays (HAC) in the origin of their surface charge (Uehara, 1975) and in their management
requirements. The surface charge density of the LAC arises from the
adsorption of potential determining ions (p.d.i.). In these soils, the
most important p.d.i.'s are the h"*" and the OH ( Uehara and Gillman, 1981). Uehara and Gillman explained that an acid medium causes an
excess of h " and an alkaline medium causes an excess of OH to be

adsorbed. Hence, soils with LAC are referred to as pH-dependent charge
soils, owing to the dependency of the surface charge on the pH of the
soil solution. The CEC of these soils may be increased by increasing
the electrolyte concentration, the counter ion valence and the pH, or
by lowering the zero point of charge (Uehara, 1975). According to
Uehara, the zero point of charge corresponds to soil pH at which net
surface charge is zero and this could be lowered by P fertilization or
raised by high Fe oxide in the clay fraction. Hence, highly weathered
soils can be rejuvenated through manipulation and management of the
sign and magnitude of the surface charge.
2.1. Concept of Oxisol
Oxisols in various regions of the world have been investigated in
considerable detail. Paramananthan and Lim (1979) investigated the
Oxisols in Malaysia; Rojanasoonthon and Panichapong (1979) in Thailand;
Isbell (1979) in Tropical Australia; Ikawa (1979) in Hawaii; Sys and
Tavemier (1979) in Africa; Bennema and Camargo (1979) and Lepsch and
Buol (1974) in Brazil; and Beinroth (1979) in Puerto Rico. Uehara
(1979) provided considerable information on the mineralo-chemical pro
perties of the Oxisols; Buol (1979) gave the geomorphology; and Eswaran(1979) discussed the micromorphology. Reports of these investigators
are contained in a series of proceedings of the International Soil
Classification Workshops of the ICOM'S. Performance of a network of
family of Oxisols was investigated by the Benchmark Soils Project (BSP)
of the Universities of Hawaii and Puerto Rico.
The general ideas of the above researchers commonly describe the
Oxisols as reddish, yellowish, or grayish soils on old surfaces or the

preweathered and transported sediments of ancient age on younger sur
faces (Smith, 1965) in the tropical and sub-tropical regions.
They occur on old stable geomorphic surfaces (Eswaran, 1980) where
deep weathering and almost complete pedological transformation have
occurred resulting in almost no variation in profile, color, and tex
ture. Thus, there is the absence of clear boundaries between horizons
(Latham, 1981).
Extreme weathering has reduced the Oxisols to a mixture of 1:1
alumino-silicate clays, free oxides, and quartz, leaving almost no
minerals that can weather to release plant nutrients (Uehara and Gill-
man, 1981). This process of weathering is related to the hot and
humid climate in the tropics that enhance the removal of the more so
luble elements of the rocks, i.e., Ca, Na, Mg, and K in solution (La
tham, 1981). Latham explained that the destruction of the primary
minerals results in the liberation of silica, iron, and aluminum and
the reorganization into a more stable form which is the kaolinite or
the 1:1 lattice alumino-silicates. With time, the silica continues
to leach, leaving only the Fe and some Al that eventually precipitate
as oxides or hydroxides.The Oxisols are on the upper part of the landscape so that there
is no chance for them to receive bases from laterally moving ground water (ICOMOX CL No. 6 , 1980). The continuous leaching of silica,
therefore, does not permit the synthesis of clay minerals (Eswaran,
1980). According to Eswaran, the mineralogy and the tendency of the
oxic soil materials to shift in pH corresponding to net zero surface
charge could lead to severe leaching of cations and fixation fo anions.
8

Given the proper management input, however, and with their excel
lent physical properties, they can be very productive. Some of the most
productive soils of the world are Oxisols, i.e., the Molokai, Lahaina,
Wahiawa, and the Lihue soil series of Hawaii (Uehara, personal commu
nication) .
2.2. Concept of Oxic Horizon
The oxic horizon is used to identify the soils belonging to the
order Oxisols. It is a mineral subsurface horizon that has been more
or less mineralogically completely weathered (Latham, 1981) and has
been reduced to kaolin and free oxides (Uehara and Gillman, 1981). The state of weathering is so advanced that the enormous length of time
has led to the formation of a horizon that is no less than 30 cm thick
(Smith, 1979) and that is practically devoid of weatherable minerals
CUehara and Gillman, 1981). Experiences in other countries, however,
show that the oxic material may have as much as 10 percent weatherable
minerals in the 50 to 150 micron fraction (ICOMOX CL No. 9, 1982) or
may contain as much but no more than 40 meq of K, Ca, Mg and Na per
100 g soil on a total elemental analysis after gravel removal (Herbil-
lon, 1980). Such low weatherable mineral contents of the oxic horizon emphasizes also the advanced state of weathering of the oxic horizon.It is further reflected by limiting the rock structure content to no
more than 5 percent (Soil Taxonomy, pp 36-37) because the rock fragments are also potential sources of clay.
The charge properties of the oxic horizon are very low. Here, the
effective cation exchange capacity (ECEC) is <10 meq per 100 g clay CSoil Taxonomy). The class limit ensures a low permanent charge by

excluding from the oxic horizon the 2 : 1 lattice clay minerals and alu-
mino-silicate clay minerals. The CEC by NH4OAC at pH 7 of <16 meq per
100 g clay is also imposed to exclude from the oxic horizon the short
range order alumino-silicate clay minerals such as allophane and imo-
golite (Eswaran, personal communication).
In this case, the allophane and imogolite possess pH-dependent
charge characteristics of crystalline LAC, but they behave differently
because of high specific surface (Uehara, 1978).
The oxic horizon has a sandy loam or finer texture in the fine
earth fraction and has >15 percent clay (Soil Taxonomy, p 39). This
excludes the sands and sand-size particles which have low specific
surface, thus low CEC, to become oxic materials. The intent is that
the low charge in the oxic material is due to the clay resulting from
intense weathering rather than the low charge of the sand particles
(Uehara, personal communication).
The oxic horizon is also characterized with gradual change in pro
file color and texture which is indicative of prolonged weathering and
that no other pedogenetic processes operated. Andie materials may be
present as contaminants, but not enough to react with NaF to a pH more
than 9.4 (ICOMOX CL No. 10, 1983).Clay skins are not more than 1 percent of the column of the hori
zon or they are not thick and continuous (Moormann, personal communica
tion). The upper textural boundary is usually diffuse (Buol, 1983) or
has gradual or diffuse boundaries between its sub-horizons (Soil Survey
Staff, 1975). Abrupt textural boundaries between sub-horizons are not permitted because they connote processes that did not operate in the
10

formation of the oxic horizon (Paramananthan and Eswaran, 1980). The
upper boundary is at the least depth where the mineralogy (ICOMOX CL
No. 7, 1981) and the charge characteristics (Soil Taxonomy, p 36) are
met but not above 15 cm or the base of the Ap horizon, or may be the
soil surface if the profile is truncated (ICOMOX CL No. 7, 1981).
2.3 . The ICOMOX Proposals
The International Committee on the Classification of Oxisols was
organized in January 1978 (Eswaran, 1979). The mandate was to develop
a clear concept of an Oxisol, redefine the oxic horizon, examine the
validity of the present taxa, and propose Improvement (Proc. 1st ISCW,
1978). Since its creation, various approximations, succeeding changes
and refinements of the definition of the oxic horizon, and the key de
finition of the order Oxisols have been made. The progressive develop
ment of the proposed definition of the oxic horizon is shown in Table 1.
One can see the proposed modifications, such as the adjustments of the
quantitative limits of some of the diagnostic properties, introduction
of additional criteria, and modification of statements of the provi
sions.
The thickness requirement, for instance, has been increased to 50 cm because work in Malaysia (Eswaran, 1979) indicated that feeder
roots only begin to decrease at about 60 to 70 cm. Increasing the
thickness to 50 cm, however, would exclude many Oxisols in the South
Pacific region (Proc. 2nd ISCW, Part II, 1979). Hence, the 30 cm limit
was restored (ICOMOX CL Nos. 8 , 9, and 10).
Table 2 shows the deletion, retention, and/or addition of taxa at
the suborder and great group levels. It can be seen that the first
11

12
Table 1. Proposed changes of the parameters defining the oxic horizon by ICOMOX.
Diagnostic Properties 1975* 1978 1980 ' 1981 1982
1. Thickness (cm) 30 50 50 50 302. ECEC in meq/lOOg clay 10 12 12 12 12
and/orCEC in meq/100 g clay 16 16 16 16 16
3. pH in NaF (1:50) - 9.4 9.4 9.4 9.4
4. Percent weatherable minerals t t 1
**1 1 0 . 0
5. Percent clay with sandy loam or finer texture 15 . 15 8 8
6. Textural boundaries between its subhorizons and adjacent horizons G or D G or D G or D G or D G or D
7. Percent rock structure by volume 5 5 5 5 5
8. Percent gravel by volume - - — - 85
* Sources: 1975, Soil Taxonomy ; 1978 No. 6 ; 1981, ICOMOX CL No. 7; 1982,
, Proc, ICOMOX
1st ISCW; CL No. 8 .
1980, ICOMOX CL
** Percent weatherable minerals in the 20-200 micron fraction. *** Percent weatherable minerals in the 50-250 micron fraction.
gradual, D = diffuse

13
Table 2. Chronology of changes in the proposed taxa in the order Oxisols by the ICOMOX.
Category SoilTaxonomy
1978 1980 1981 1982 1983
SUBORDER Aquox Aquox Aquox Aquox Aquox AquoxTorrox Humox Acr ox Acr ox Acrox TorroxHumox Torrox Humox Torrox Torrox UstoxUstox Ustox Torrox Ustox Humox OrthoxOrthox Orthox Ustox
OrthoxOrthox Ustox
Orthox
GREAT Sombr Sombr Sombr Sombr Gibbsi GibbsiGROUP Gibbsi Gibbsi Gibbsi Gibbsi Acr Acr
Plinth Acr Pale Pale Eutr EutrAcrEutrOchrUmbrHapl
LatUmbrEutrMelanRhodXanthHapl
KurRhodEutrPsammHapl
KurEutrRhodPsammHapl
Hapl KurHapl
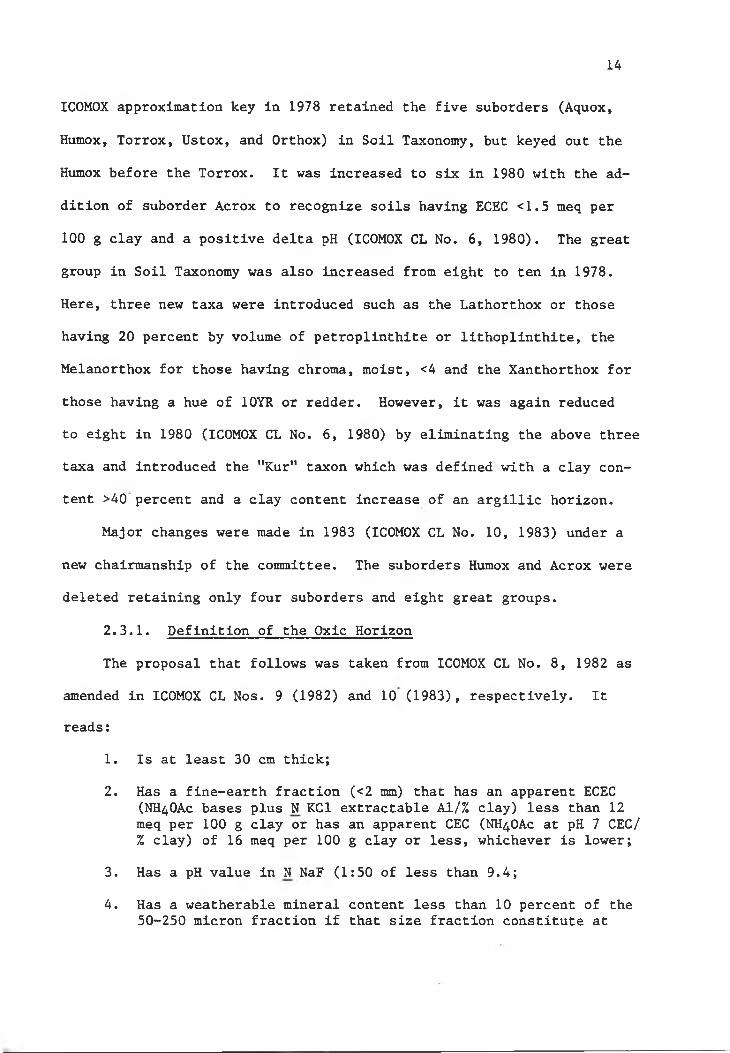
ICOMOX approximation key in 1978 retained the five suborders (Aquox,
Humox, Torrox, Ustox, and Orthox) in Soil Taxonomy, but keyed out the
Humox before the Torrox. It was increased to six in 1980 with the ad
dition of suborder Acrox to recognize soils having ECEC <1.5 meq per
100 g clay and a positive delta pH (ICOMOX CL No. 6 , 1980). The great
group in Soil Taxonomy was also increased from eight to ten in 1978.
Here, three new taxa were introduced such as the Lathorthox or those
having 20 percent by volume of petroplinthite or lithoplinthite, the
Melanorthox for those having chroma, moist, <4 and the Xanthorthox for
those having a hue of lOYR or redder. However, it was again reduced
to eight in 1980 (ICOMOX CL No. 6 , 1980) by eliminating the above three
taxa and introduced the "Kur" taxon which was defined with a clay con
tent >40 percent and a clay content increase of an argillic horizon.
Major changes were made in 1983 (ICOMOX CL No. 10, 1983) under a
new chairmanship of the committee. The suborders Humox and Acrox were
deleted retaining only four suborders and eight great groups.
2.3.1. Definition of the Oxic Horizon
The proposal that follows was taken from ICOMOX CL No. 8 , 1982 as
amended in ICOMOX CL Nos. 9 (1982) and 10 (1983), respectively. Itreads;
1. Is at least 30 cm thick;
2. Has a fine-earth fraction (<2 mm) that has an apparent ECEC(NH4OAC bases plus N KCl extractable Al/% clay) less than 12 meq per 100 g clay or has an apparent CEC (NH4OAC at pH 7 CEC/% clay) of 16 meq per 100 g clay or less, whichever is lower;
3. Has a pH value in N NaF (1:50 of less than 9.4;
4. Has a weatherable mineral content less than 10 percent of the50-250 micron fraction if that size fraction constitute at
14
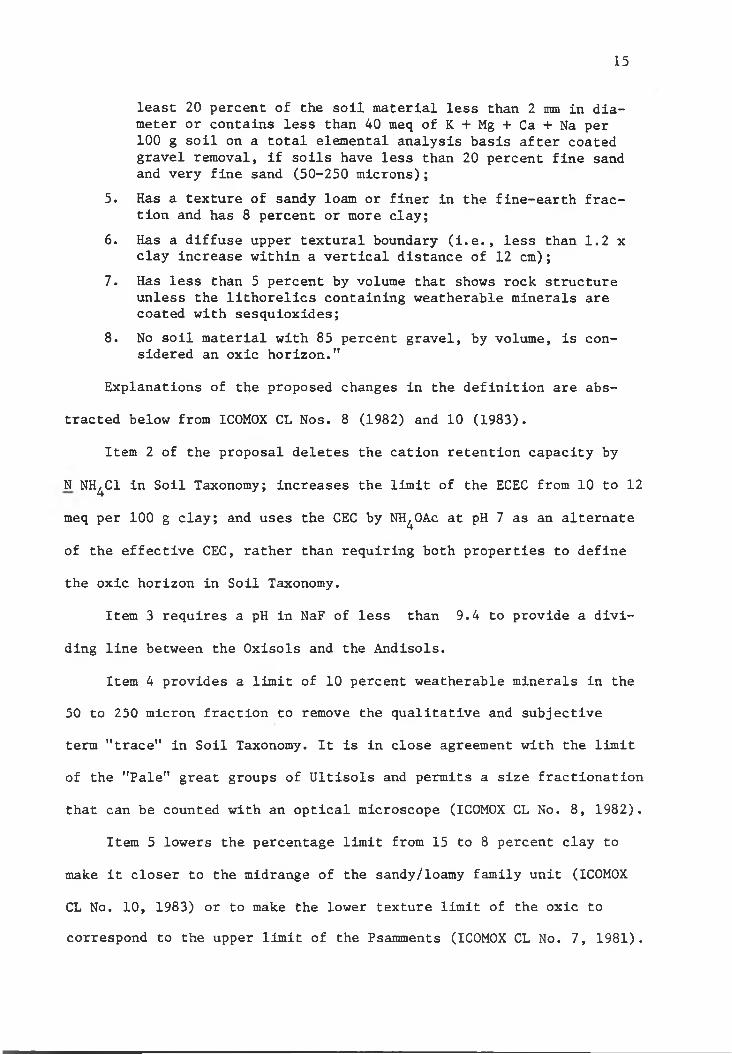
15
least 20 percent of the soil material less than 2 mm in diameter or contains less than 40 meq of K + Mg + Ca + Na per 100 g soil on a total elemental analysis basis after coated gravel removal, if soils have less than 20 percent fine sand and very fine sand (50-250 microns);
5. Has a texture of sandy loam or finer in the fine-earth fraction and has 8 percent or more clay;
6. Has a diffuse upper textural boundary (i.e., less than 1.2 xclay increase within a vertical distance of 12 cm);
7. Has less than 5 percent by voltime that shows rock structure unless the lithorelics containing weatherable minerals are coated with sesquioxldes;
8 . No soil material with 85 percent gravel, by volume, is considered an oxic horizon."
Explanations of the proposed changes in the definition are abs
tracted below from ICOMOX CL Nos. 8 (1982) and 10 (1983).
Item 2 of the proposal deletes the cation retention capacity by
N NH^Cl in Soil Taxonomy; increases the limit of the ECEC from 10 to 12
meq per 100 g clay; and uses the CEC by NH^OAc at pH 7 as an alternate
of the effective CEC, rather than requiring both properties to define
the oxic horizon in Soil Taxonomy.
Item 3 requires a pH in NaF of less than 9.4 to provide a divi
ding line between the Oxisols and the Andisols.
Item 4 provides a limit of 10 percent weatherable minerals in the 50 to 250 micron fraction to remove the qualitative and subjective
term "trace" in Soil Taxonomy. It is in close agreement with the limit
of the "Pale" great groups of Ultisols and permits a size fractionation
that can be counted with an optical microscope (ICOMOX CL No. 8 , 1982).
Item 5 lowers the percentage limit from 15 to 8 percent clay to
make it closer to the midrange of the sandy/loamy family unit (ICOMOX
CL No. 10, 1983) or to make the lower texture limit of the oxic to correspond to the upper limit of the Psamments (ICOMOX CL No. 7, 1981).
Item 6 specifies a diffuse upper textural boundary to provide a
mutually exclusive definition with the argillic, especially the kandic
horizon.
Item 7 requires the oxic horizon to have less than 5 percent by
volume that show rock structure as in Soil Taxonomy, but adds the con
dition, "unless the rocks containing weatherable minerals are coated
with sesquioxides." The 5 percent limit is set to ensure the advanced
stage of weathering of the oxic horizon by excluding the rock fragments
that are the source of weatherable minerals.
Item 8 is an additional requirement which does not permit the oxic
horizon to have more than 85 percent gravel, by volume.
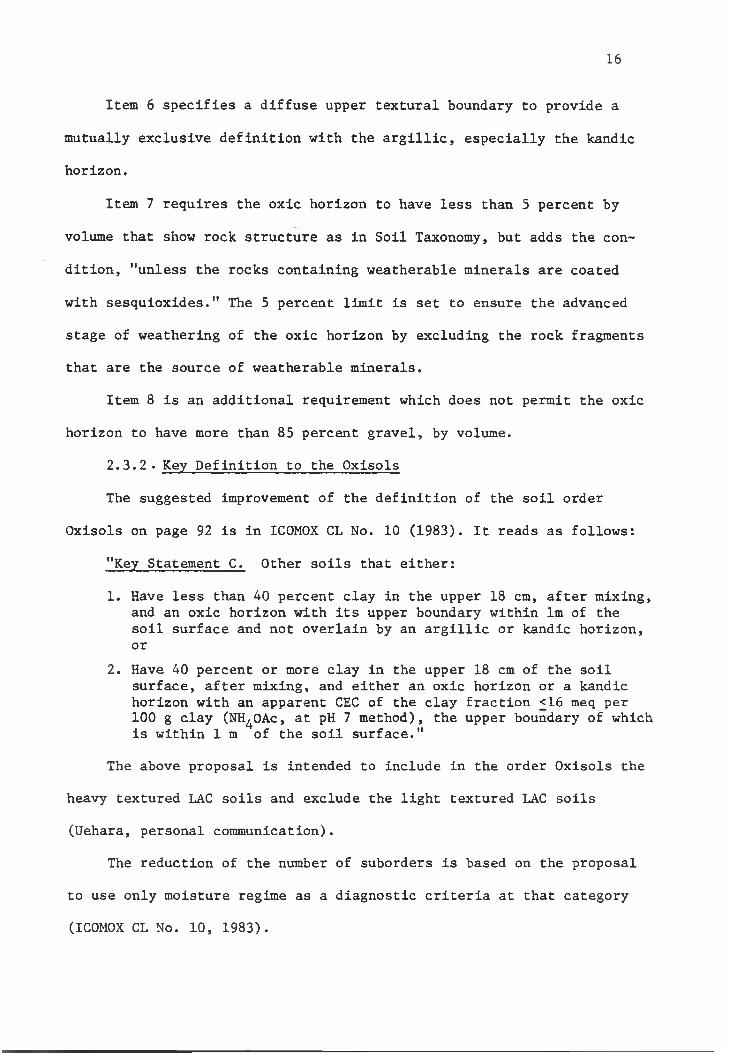
2.3.2 . Key Definition to the Oxisols
The suggested improvement of the definition of the soil order
Oxisols on page 92 is in ICOMOX CL No. 10 (1983). It reads as follows:
"Key Statement C. Other soils that either:
1. Have less than 40 percent clay in the upper 18 cm, after mixing, and an oxic horizon with its upper boundary within Im of the soil surface and not overlain by an argillic or kandic horizon, or
2. Have 40 percent or more clay in the upper 18 cm of the soil surface, after mixing, and either an oxic horizon or a kandic horizon with an apparent CEC of the clay fraction <16 meq per 100 g clay (NH^OAc, at pH 7 method), the upper boundary of which is within 1 m of the soil surface."
The above proposal is intended to include in the order Oxisols the
heavy textured LAC soils and exclude the light textured LAC soils
(Uehara, personal communication).
The reduction of the number of suborders is based on the proposal
to use only moisture regime as a diagnostic criteria at that category
(ICOMOX CL No. 10, 1983).
16

The "Pale" great group was deleted to give preference on the mor
phology rather than the pedogenetic concept of age (Buol, 1983). Buol
further explained the drastic reduction of taxa at the great group le
vel, saying: (a) the "sombr" feature probably occur only in Oxisols so
that it could be a unique feature that could be recognized at the sub
group level, (b) the "rhod" taxon has been used both as great group and
subgroup names and it seems less important to accessory characteristics
than "eutr", "acr", etc. and (c) the "psamm" taxon is proposed to be
recognized at the family level and at the subgroup intergrades to Psam-
ments.
In 1981, the acric soil material was introduced as a diagnostic
criterion of the key definition of the order Oxisols (ICOMOX CL No. 7,
1981).
The 1983 ICOMOX approximation is presented in the results and dis
cussion to provide immediate reference in the taxonomic tests.
2.4. Concept of the LAC Ultisols and Alfisols
These soils were extensively studied in detail in many parts of
the world. Moncharoen and Vljarnsorn (1979) investigated the LAC Alfi
sols and Ultisols in Thailand; Lim et al., (1979) in Malaysia; de Alwis(1979) in Sri Lanka; Sombroek and Muchena (1979) in Eastern Africa; Comerma (1979) in Venezuela; and Buol (1979) in the United States of .
America and Puerto Rico. The concept of the argillic horizon and
problems of its identification were discussed by Arnold (1979), Cline
(1980), and Eswaran (1981); Herbillon and Rodrigues (1979) published
the mineralogy of the low activity clay soils; and the micromorphology
was studied by Eswaran (1979). The performance of selected LAC Ultisols
17

was tested by the Benchmark Soils Project (BSP) of the Universities of
Hawaii and Puerto Rico.
The above workers reported that soils dominated by low activity
clays occur extensively in Southeast Asia, small portions of the Indian
Sub-continent, a major part of moist Tropical Africa, South America and
the Southeastern United States. They are also common in Australia and
East Asia.
Most of these LAC soils have B horizons with the clay content in
crease of an argillic horizon. They are presently placed in the order
Ultisols and Alfisols (ICOMLAC CL No. 13, 1980).
The predominance of low activity clays in the soil is important
because it is an indication of an advanced state of weathering (Moor
mann, personal communication).
The management properties of these soils are different from soils
having 2:1 type clays that have high activity (Uehara, personal commu
nication). For example, the problems with the availabilty of Al and
Ca are usually associated with low activity clays, but not with high
activity clays. The LAC soils have also limited response to fertili
zer and lime.The LAC Ultisols and Alfisols have low cation exchange capacity
and possess some characteristics of an oxic material. They are dif
ferentiated mainly by the base saturation by sum of cations at certain
specified depths.
The LAC Ultisols and Alfisols, are separated from the LAC Incep-
tisols by the presence of the clay content increase of an argillic horizon in the former, while the LAC Mollisols are those that have a
18

mollic eplpedon (ICOMLAC CL No. 13, 1980).
2.5. Concept of the Ar.ollllc Horizon
The argillic horizon differentiates the Alfisols and the Ultisols
from the other taxa of the system. Its use, however, is being criti
cized (Isbell, 1977) but, Arnold (1978) explained that the clay move
ment may not bear significance although it is the cause and effect that
tells a lot of information about the soil. In fact, Eswaran (1981) con
sidered the argillic horizon in terms of the sets of conditions that
lead to its formation viz, (1 ) the conditions in the surface horizon
should be conducive to dispersion, (b) the dispersed clay should be
translocated to the subhorizon, and (c) the translocated clay should be
able to deposit and form clay skins.
In soil management, the coarser textured overlying horizon provides
better tilth and favorable root proliferation while the finer textured
subsurface horizon increases the water holding capacity of the soila
(Eswaran, 1981). Smith, in an interview by Leamy (1981) , added that
the clay skins which are the evidence of clay illuviation have a marked
influence on the amount of nutrient elements that are cycled by plants.
According to Smith, the clay skins contain more N, P, and K than in the ped Interiors.
However, the advantage of higher nutrients cycled by plant on ped
coating of the argillic horizon, may be annulled when the clay skins
cover almost all the ped surfaces and root channels, restricting nu
trient uptake by plant roots (Soleon , 1964).
19
/= Leamy (1981). Conversation on Soil Taxonomy. New Zealand Soil News, Vol. 29, No.5, 1981.

Smith viewed it differently in that the Ca content of the coatings
on ped draws the roots deeper in the subsurface horizon for more avail
able water during periods of droughts. This is not the case, however,
if the finer textured subsurface horizon is not due to clay illuviation.
Experiences in the tropical and subtropical region also indicate
that the clay skins, as defined in Soil Taxonomy, pp 21-24, are not unique
to soils of LAC, particularly the Ultisols with udic or perudic moisture
regime (ICOMLAC CL No. 3, 1976). For example, the subsurface horizon
may have the chemical and mineralogical properties of the Oxisols and
the clay bulge of an argillic horizon with no clay skins. This makes
the distinction between the Oxisols and the LAC Alfisols and Ultisols
very vague.
2.6. Concept of Kandic Horizon
A kandic horizon is a subsurface horizon that has a much higher
percentage of clay than the overlying horizon(s), Moormann (1981). The
higher clay content may be associated with one or more processes acting
simultaneously or sequentially on the surface or subsurface horizon or
both causing textural differentiation.
The most important processes are (a) clay eluviation and Illuviation. Here, the higher clay content in the B horizon cannot be shown
by micromorphological analyses to have accumulated by illuviation. The
clay skins that are evidences of illuviation may be completely absent
because of (a) lack of orientation of clay-size particles as a result
of a high amount of Fe oxy-hydroxides in the clay fraction or the des
truction of clay skins by biological activity, (b) destruction of clay as a result of the weathering of layered-lattlce clay silicates.
20

(c) selective erosion, in which the finer soil particle may be moved
further from a point of origin due to rain drop splash, leaving a
coarser surface material (d) sedimentation of coarser textured surface
materials, in which it may overlie a fine textured strata, and (e) bio
logical activity, where earthworms, termites, and ants rework the soil
resulting to a coarser textured surface soil (ICOMOX CL No. 13, 1980).
The textural differentiation resulting from the above processes
can not be associated with the argillic horizon because it is diffi
cult to show that the higher clay content in the subsurface horizon came from the overlying horizon.
The kandic horizon has a CEC by NH4OAC at pH 7 <16 meq per 100
g clay or an ECEC of <12 meq per 100 g clay within 50 cm below the top
of the finer textured subsurface horizon (ICOMLAC CL No. 13, 1980).
The significance of the kandic horizon is related to its use as a
basis for differentiating soils with clay accumulation in the subsoil
where the argillic horizon alone is not adequate to differentiate some
Ultisols and Alfisols from Oxisols and Inceptisols (ICOMLAC Final Re
port, 1983). Here, it is used to separate the LAC Ultisols and Alfi
sols from the Oxisols and Inceptisols. ICOMLAC, however, suggests that the kandic horizon should not be used as a diagnostic horizon in soils
having >40 percent clay in the surface because in soils with clayey sur
face, the increase of clay content losses much of its significance.
The presence of a kandic horizon is an indication of a high degree of
weathering of a soil and the high degree of weathering relates to the
dominance of 1:1 layered-lattice clays and sesquioxides of Fe and Al
and the absence of 2 : 1 layer lattice clays.
21

The nomenclature proposed for the soils with the LAC at the great
group level was derived from the formative element "kandi", as proposed
by Eswaran (ICOMLAC CL No. 14, 1981). It connotes kandites which re
fer to the 1 : 1 lattice clays and more specifically the kaolinite with
varying amounts of the oxy-hydrates of Fe and Al (Moormann, personal
communication).
2.7. The ICOMLAC Proposals
The International Committee on Classification of Alfisols and Ul
tisols with low activity clays was organized in 1975 to recommend chan
ges in the classification of Alfisols and Ultisols with LAC and recom
mend diagnostic properties to define new taxa (ICOMLAC CL No. 13, 1980).
There have been several proposals in upgrading the LAC taxa in
the key. One is the introduction of a new order for the LAC soils.
The other is to define the Alfisols and the Ultisols with dominance of
high and low activity clays respectively or to exclude from the Alfi
sols all soils dominated by LAC and the Ultisols will be defined to
contain HAC and low base saturation as well as soils with LAC irres
pective of base saturation (Proc. 1st ISCW, 1978). These were ruled
out because they would require an overhaul of the major parts of Soil Taxonomy (Moormann, 1978).
The consensus in the Committee was to upgrade the "kandi" taxa
to the great group level. Here, the required changes both in the
overall taxa, are kept to the minimum (ICOMLAC CL No. 14, 1981).
2.7.1. Summary of Properties of the Kandic Horizon
The following was taken verbatim from the review draft of a proposal for reclassification of Ultisols and Alfisols with LAC by the
22

23
SCS based on the final report of the ICOMLAC, dated June 1, 1983.
The kandic horizon is a subsurface horizon which has a CEC <16 meq per 100 g clay (by NH4OAC) or have ECEC <12 (sum of bases plus KCl extractable Al) in the fine earth fraction at a depth of 50 cm below the top of the horizon or immediately above a lithic, paralithic, or petroferric contact that is shallower.
The kandic horizon has the following properties:
1. A coarser textured surface horizon. The minimum thickness ofthe surface horizon is 18 cm after mixing or 5 cm if the transition tothe kandic horizon is abrupt.
2. More total clay than the overlying horizon and the increased clay content is reached within a vertical distance at 12 cm or less as follows:
a. If the surface horizon has less than 20 percent totalclay, the kandic horizon must contain at least 4 percentmore clay; or
b. If the surface horizon has more than 20 percent total clay, the kandic horizon must have 1 . 2 times more clay than the overlying horizon or at least 8 percent more clay.
3. A thickness of at least 30 cm, or at least 15 cm if a lithic, paralithic, or petroferric contact occur within 50 cm of the mineral soil surface.
4. The layers or horizons overlying the kandic horizon do not show fine stratification and the content of organic carbon does not decrease irregularly with increasing depth.
5. Lacks clay skins that are thick and continuous in all parts, and the cross section has <5 percent oriented clay to a depth of 125 cm below the mineral soil surface or 75 cm below the top of the kandic horizon, whichever is deeper.

24
III. MATERIALS AND METHODS
The initial activity was a review of the low activity clay soils
and their corresponding diagnostic horizons in order to arrive at a
firm idea of what were to be tested. The concepts developed in Soil
Taxonomy and the concepts developed by the ICOM's were collated.
3.1. Data' Assemblage
The soils of the Benchmark Soils Project (BSP) of the Universities
of Hawaii and Puerto Rico were used because they have adequate soil
characterization data and some performance data as well. Obviously,
the number is small to test the entire ICOMOX and ICOMLAC proposals.
It was therefore, necessary to add more pedons. Existing data are
available and necessary parameters are adequate.
The 163 test pedons are presented in alphabetical arrangement by
soil order in Appendix 1. They represented many environments of soils
with low activity clays from the higher latitudes in the United States
to the lower latitudes in Hawaii, Puerto Rico, Brazil, Sumatra, Thailand, Malaysia, Philippines, the South Pacific Region, Cameroon, the Ivory Coast, Kenya, Indonesia, and Southwest Africa (Figure 1). A pro-
file/pedon code number is provided as reference for the different soils
particularly those soil series that are represented by more than one
pedon. The alphabetic portion of the code represents the last syllable
of the order name and the numerical part is the number in the listing.
Selected data needed for specific tests are also appended.

Figure 1. Distribution of test pedons.ro

Some data were analyzed with different procedures. These were
standardized to conform with procedures described in Soil Taxonomy.
It was done by establishing correlations between the data obtained by
other countries with those obtained by the National Soil Survey Labo
ratory (NSSL) of the Soil Conservation Service (SCS) in Lincoln, Neb
raska on the same pedons.
Correlation, however, was not possible on a few pedons because
they were not analyzed by the NSSL. Nevertheless, the laboratory data
of these pedons were used in the tests, but with caution.
3.2. Methodology
The methodology is illustrated in Figure 2.
3.2.1. Analytical Methods
3.2.1.1. Particle Size Analysis:
Some pedons classified as Oxisols from the BSP were re-analyzed
for particle size distribution because of suspiciously low clay con
tent. A modification of the method of Kilmer and Alexander (1949) was
made by using ultrasonic vibration with increased amount of Na-hexameta-
phosphate solution in order to enhance dispersion. This modification
consisted chiefly of adding 50 ml of sodium hexametaphosphate solution to a 10 g air dried soil sample. It was shaken overnight and subjected
to ultrasonic vibration, using the BIOSONIK IV Model by Bronwill, VW
Scientific. The ultrasonic treatment was first calibrated by testing
various time and energy inputs. The treatment that gave reproducible
dispersion values was selected and referred to as the modified treat
ment. It was coded HI-70-20, where the HI was for high energy input;
70 was for the scale of the vibration tuning; and 20 was the time in
26

27
Figure 2. Diagram of methodology.

minutes. Iron oxide removal was dispensed with, because the oxides
are important parts of the oxic materials.
3.2.2. X-Ray Diffraction Analysis
Mlneralogical analyses were conducted for some of the BSP profile
samples. The soil samples were prepared following the guidelines of
Jones (1977)^. Preferentially oriented silt and clay specimens were
prepared on glass slides for Mg-saturated, Mg-saturated and glycol-
solvated, K-saturated, and K-saturated and heated to 100°-, 300°-, and 550°C. The glass mounted samples were analyzed by means of the Philips
(XEG-3100) X-Ray Diffractometer equipped with long-fine-focus copper
tube (Ka, 1.5A18X) and a high voltage generator operating at 40Kv and
40mA. Diffractograms were produced by scanning the samples from 2 to
64° 20. A theta compensating divergence slit was used in place of a
stationary divergence slit and a curved graphite crystal monochrometer
was used in lew of a nickel filter.
Randomly oriented powdered sand-size aggregates of clay samples
obtained by the pipette method of Kilmer and Alexander (1949) were also
examined by X-ray diffraction analysis.
3.2.3. Testing of ProposalsAll the 163 test pedons (Appendix 1) were used in testing and in
developing the concepts. The taxonomic test was done by fitting the
individual pedons into the ICOM's proposals with the use of flow-
diagram keys. Here, the proposals were tested as illustrated by the
test pedons. From these tests, suggestions were made for refinement.
28
_b/ Jones (1977). Laboratory Guidelines on Soil Mlneralogical Analysis by X-ray Diffraction.

Each item in the proposed definitions of the diagnostic horizon
was tested, first on soils currently classified in the order in which
that horizon is used as a differentiae and second, on the other LAC
soils. At each stage, the pedons were checked to see the validity of
the proposals. Similar tests were done on the proposed key definitions.
The taxonomic tests proceeded in the following sequence;
3.2.3.1. On the ICOMOX Proposals;
a. Definition of the oxic horizon;
b. Key definition of the order Oxisols; and
c. Revision of keys to the lower categories.
3.2.3.2. On the ICOMLAC Proposals;
a. Definition of the kandic horizon;
b. Key definitions of the order Ultisols and
Alfisols to accommodate the LAC taxa; and
c. Key definition of the LAC great groups.
As part of the test, performance data, whenever available, were
used to strengthen the result of the taxonomic test.
There are few guidelines to evaluate the quality of a classifica
tion system. The principles adopted in this study are the basic principles employed in Soil Taxonomy that were based on the conceptual
work of John Stewart Mill (1891). In this respect, the specific sec
tion in Soil Taxonomy, pp 8-11 on (a) the attributes desired, (b) se
lection of differentiae; and (c) forming and defining taxa were close
ly adhered to.
The conditions set in this study, that should be satisfied in the
evaluation of any proposed change were:
29

a. The modifications should result to a marked improvement in
the interpretations which could be derived from taxa names;
b. The modifications should result in a better expression of soil-landscape relationships;
c. The modifications should introduce some significant advantages
either in the field identification of the soil or in the laboratory
evaluation;
d. The modification should at all times result in mutually ex
clusive classes and should not conflict with the other parts of the
system; and
e. The modification should not result in any soil in a landscape from not being classified.
The criteria set in evaluating the impact of revision on agrotech
nology transfer were:
a. Revision should achieve groupings of soils having closely
similar crop production potential; and
b. Revision should stratify agroenvironment into distinct agro
production niches.
Because the test pedons originated from different parts of the world (Figure 1), one of the problems encountered in this study was
the determination of the appropriateness of the proposed classifica
tion to the soils with respect to the above requirements. This was
partially overcomed by a detailed evaluation of published reports on
these soils and by personal communication with individuals familiar
with the test pedons.
30

31
IV. RESULTS AND DISCUSSION-OXISOLS
The ICOMOX's proposed definition of the oxic horizon and the pro
posed key to the lower categories were tested. Flow-diagrams were
used to test the criteria in a step-by-step fashion. The test pedons
are in Appendix I, and the selected pedons listed in the flow-diagrams were those that illustrated certain concepts.
4.1. Testing the Criteria of the Oxic Horizon
The proposed diagnostic criteria for the oxic horizon are listed
in Table 3, columns 3 and 4. The current definition of the oxic hori
zon in Soil Taxonomy is also presented in columns 1 and 2 and column 5
gives the result of the taxonomic test.
The flow-diagram key is in Figure 3 and the criteria were tested
against the data of 4 pedons of LAC Ultisols, 7 Oxisols and 4 LAC In
ceptisols. The LAC Ultisols and the LAC Inceptisols that did not qua
lify for an oxic horizon, indicated that the proposed definition did
not adversely affect the other parts of the system. However, failure of 7 pedons of Oxisols suggested certain limitations of the proposal.
4.1.1. The Charge Properties
Item 2 deleted the cation retention criterion by IN unbuffered
NH^Cl solution in Soil Taxonomy. Since the cation retention capacity
by NH^Cl approximates the ECEC in non-calcareous soils (Soil Taxonomy,
p 39) and since the ECEC is more commonly measured than the former,
the deletion of the latter seemed reasonable.
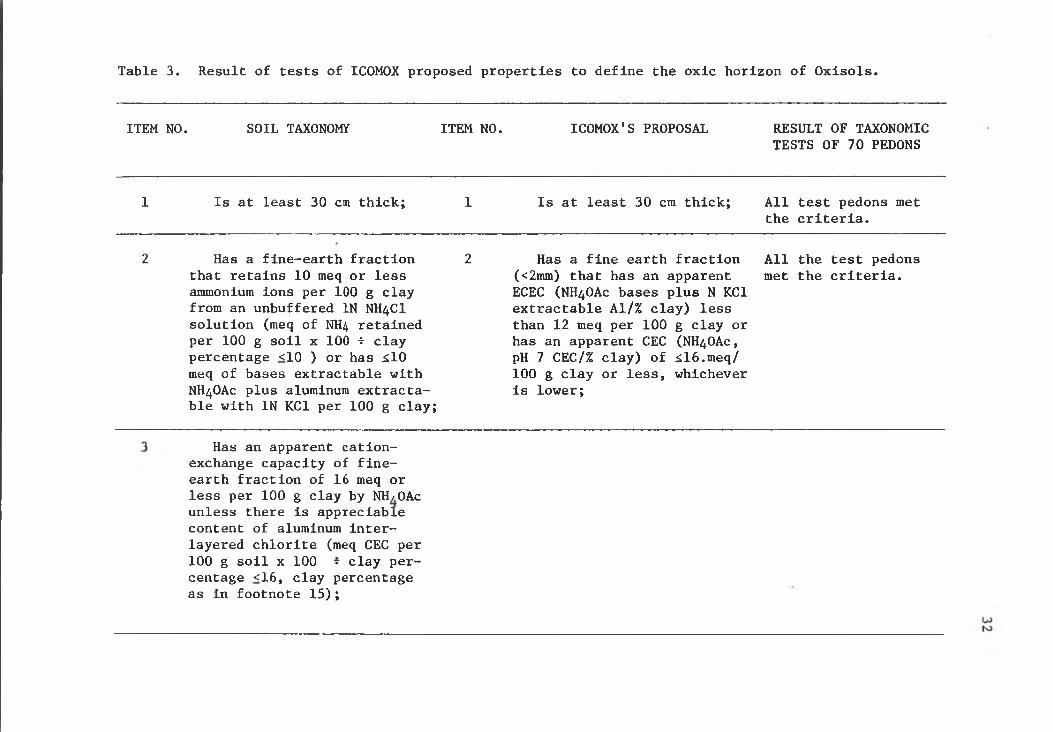
Table 3. Result of tests of ICOMOX proposed properties to define the oxic horizon of Oxisols.
ITEM NO. SOIL TAXONOMY ITEM NO. ICOMOX'S PROPOSAL RESULT OF TAXONOMIC TESTS OF 70 PEDONS
1 Is at least 30 cm thick; 1 Is at least 30 cm thick; All test pedons met the criteria.
2 Has a flne-earth fraction that retains 10 meq or less ammonium ions per lOO g clay from an unbuffered IN NH4CI solution (meq of NH4 retained
2 Has a fine earth fraction (<2mm) that has an apparent ECEC (NH4OAC bases plus N KCl extractable Al/% clay) less than 12 meq per 100 g clay or
All the test pedons met the criteria.
per 100 g soil x 100 i clay percentage <10 ) or has ^ 10 meq of bases extractable with NH4OAC plus aluminum extractable with IN KCl per 100 g clay;
has an apparent CEC (NH4OAC, pH 7 CEC/% clay) of il6 .meq/ 100 g clay or less, whichever is lower;
Has an apparent cation- exchange capacity of fine- earth fraction of 16 meq or less per 100 g clay by NH/OAc unless there is appreciable content of aluminum interlayered chlorite (meq CEC per 100 g soil X 100 T clay percentage <16, clay percentage as in footnote 15);

Table 3 (Continued)
ITEM NO. SOIL TAXONOMY ITEM NO. ICOMOX'S PROPOSAL RESULT OF TAXONOMIC TESTS OF 70 PEDONS
Has a pH value In II NaF (1:50) of less than 9.4;
4 Oxisols, 2 LAC Ultisols, and 3 Incepti- sols did not meet the criterion.
Does not have more than traces of primary aluminosi- licates such as feldspars, micas, glass, and ferro-mag- nesian minerals, as discussed earlier;
Has less than 10% of the 50-250 micron fraction if that size fraction constitute at least 20% of the soil material less than 2mm in diameter. For soils with less than 20% fine sand and very fine sand (50-250 microns) the oxic horizons contain less than 40 meq K + Mn +Ca + N/lOOg of soil on a total elemental analysis basis after gravel removal;
1 Oxisol and 1 Incep- tlsol did not meet the criteria.
5 Has texture of sandy loam or finer in the fine-earth fraction and has >15 percent clay;
5 Has a texture of sandy loam or finer in the fine earth fraction and contains 8 percent or more clay;
All test pdeons met the criteria.
6 Has mostly gradual or diffuse boundaries between its subhorizons; and
6 Has a diffuse upper textural boundary (i.e. <1 .2x clay Increase within a vertical distance of 12 cm);
2 Oxisols and 1 Ultlsol did not the criterion.
LACmeet OJU)

Table 3 (Continued)
ITEM NO. SOIL TAXONOMY ITEM NO. ICOMOX'S PROPOSAL RESULTS OF TAXONOMIC TESTS OF 70 PEDONS
7 Has <5 percent by volume that show rock structure.
7 Has <5 percent by volume that show rock structure unless the llthorelcits containing weatherable minerals are coated with sesquioxides;
All test pedons met the criteria.
8 Does not have more than 80 percent by volume of gravel.
All test pedons met the criteria.
u>
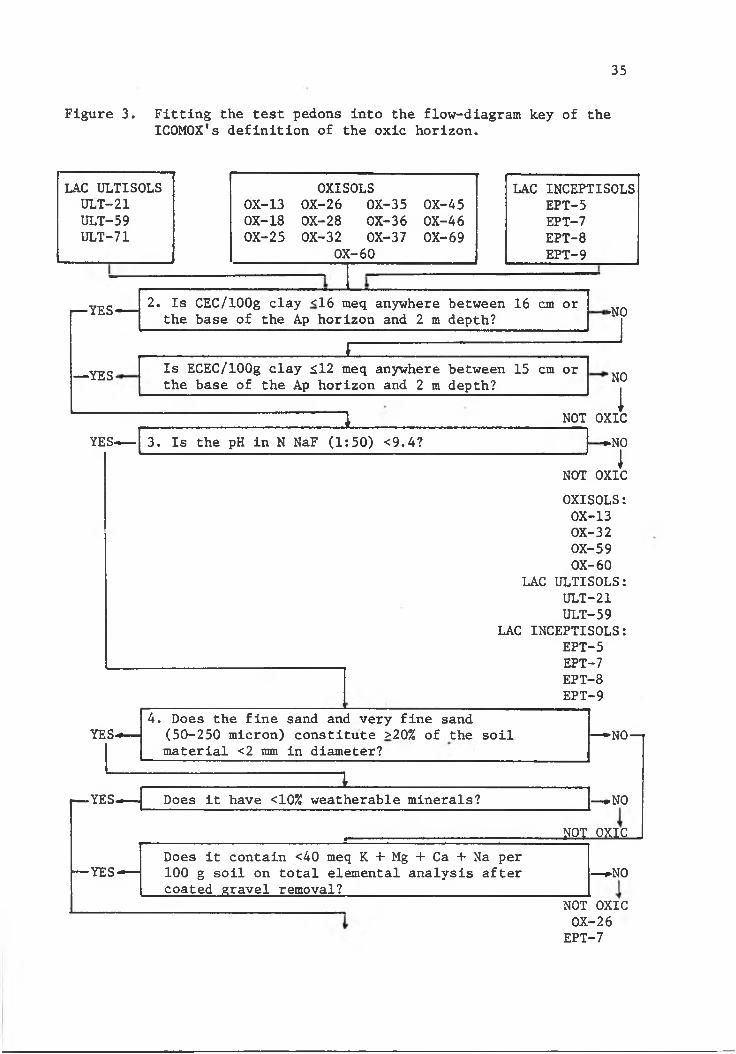
35
Figure 3. Fitting the test pedons into the flow-diagram key of the ICOMOX's definition of the oxic horizon.
LAC ULTISOLS ULT-21 ULT-59 ULT-71
OXISOLS LAC INCEPTISOLSOX-13 OX-26 OX-35 OX-45 EPT-5OX-18 OX-28 OX-36 OX-46 EPT-7OX-25 OX-32 OX-37 OX-69 EPT- 8
OX-60 EPT-9
— YES- 2. Is CEC/lOOg clay <16 meq anywhere between 16 cm or the base of the Ap horizon and 2 m depth? ►NO
— YES-£
Is ECEC/lOOg clay ^12 meq anywhere between 15 cm or the base of the Ap horizon and 2 m depth?
1
•NOiNOT OXIC
YES— 3. Is the pH in N NaF (1:50) <9.4? ♦NOiNOT OXIC
OXISOLS: OX-13 OX-32 OX-59 OX-60
LAC ULTISOLS: ULT-21 ULT-59
LAC INCEPTISOLS: EPT-5 EPT-7 EPT- 8 EPT-9
4. Does the fine sand and very fine sandYES— (50-250 micron) constitute >20% of the soil — NO—
material <2 mm in diameter?....— I
— YES-^ Does it have <10% weatherable minerals? — •NO
................. . NOTOJdO,.Does it contain <40 meq K + Mg + Ca + Na per
— YES — 100 g soil on total elemental analysis after — •NOcoated gravel removal?
NOT OXICOX-2 6 EPT-7

36
Figure 3. (Continued)
OX-18 OX-2 5 OX-28 OX-36 OX-37 OX-46

Item 2 uses CEC at pR 7 as an alternate to the ECEC rather than
an additional criterion as in Items 2 and 3 in Soil Taxonomy. This
was met by the 4 pedons of LAC Ultisols, 7 pedons of Oxisols and 4
pedons of Inceptisols.
The value of the ECEC that corresponded to 16 meq of CEC was also
tested using the data of 23 pedons of LAC soils consisting of 154 ho
rizons that have CEC <24 meq per 100 g clay in Hawaii, Puerto Rico,
Indonesia, Cameroon, Philippines, Thailand, and Brazil. This was done
by regressing the CEC by NH^OAc at pH 7 with the ECEC by sum of extrac- table bases plus KCl extractable Al.
The relationship was expressed in the equation
Y = 7.8956 + 1.2265X
where Y was the CEC and X was the ECEC in meq per 100 g clay. A plot
of the relationship is shown in Figure 4 with an of 0.69. It indi
cated that at the CEC limit of 16 meq per 100 g clay, the correspond
ing ECEC value was 7 meq. This was much lower than ICOMOX'S proposed
value of 12 meq per 100 g clay.
4.1.2. Contamination with Andie Materials
The flow-diagram key in Figure 3 show that 3 LAC Inceptisols, 4 Oxisols and 2 LAC Ultisols did not meet Item 3. Failure of the LAC
Inceptisols and LAC Ultisols to satisfy the provision of Item 3 meant
that the criterion did not adversely affect the other parts of the
system. This was illustrated by the Maile series (Table 4). It has
bulk densities <0.84 g per cc, abundant (3x) allophane and >100 per
cent 15-bar water content. These are properties of an exchange complex dominated by amorphous materials (ECDAM) to which a P%ap^9.4
may be inferred.
37

65
60 +
56 +
50: +
45 +
40 +nM 35 +o o
g 25 +
20 +
15 +
10 +
5 +-+ ■
PLOT OF Y*X PLOT OF PRED*X
A A **
A A *** *A
* * AAAAA
A AB
A A ****B*** *A*AAAB A AAA
A
AA
*AA
GEGEND: a + I OBS. B - 2 OBS , ETC.SYMBOL USED IS *
7.895 + 1.226X
Y “ CEC neq/lOOg clay X - ECEC neq/lOOg clay
- 0 .68
2 4 6 8 10 12 14 16 18 20 22 24 26 28 30 32ECEC (meq/lOOg clay)
NOTE : 20 OBS HIDDEN
Figure 4. The relationship between CEC and ECEC in Oxisols.
3A 36 38 AO A2-+~AA
00

39
Table 4. Characteristics of the Maile series, (EPT-8) an Inceptisol usedto test ICOMOX's proposed definition of the Oxic horizon
Depth Horizon
(cm)
ECEC CEC Bulk__________________ Allo-meq/lOOg clay Density phane
(g/cc) (%)
15-Bar ApH______Water pIS-ci - pHg^o (%)
0-5 All 13.5 56.2 0.52 3X -0 . 1
10-35 A13 1 . 0 56.1 132 -0.343-50 B22 0 . 8 38.2 0.32 -0 . 1
60-73 lie 0 . 2 36.7 0.30 0 . 0
90-120 IIIB25b 0.4 50.5 0.30 3X 193 +0 . 1
120-150 IIIB26b 0.4 31.1 0.45 3X 126 +0.3
Source: SSIR No. 29, 1976, p 30.

The Koolau series lends support to the above illustration (Table 5).
It has a very low sum of bases to which a low ECEC could be inferred but
has CEC ranging from 169.7 to 217.5 meq per 100 g clay in the same
horizons. The bulk densities, field moist, of 0.86 and 0.76 g per cc in
the B21g and C horizons, respectively, are indicative of ECDAM. Such
properties were apparently influenced by the parent material derived
from melilite basalt of the Koloa flow which has low amount of silica
and volcanic ash (SSIR No. 29, - 25). According to Uehara (1978) soils
developed from volcanic ash deposit possess pH dependent charge charac
teristics of crystalline low activity clays but behave differently
because of their high specific surface. He explained that their CEC
by NH4OAC is high and generally unrelated to cation retention in the
field which is low.
Item 3, however, is a constraint in some Oxisols. This was illus
trated by the data of Pedon OX-59 of the Wahiawa series in Hawaii
CTable 6). It has >9*4 in the B horizons. This was supported by
the data of Pedons OX-60, OX-33 of the Molokai series in Hawaii and OX-
13 of the Farmhill series in South Africa (Table 6).However, it has been shown by Perrott _eit (1976) that there are
also strong reactions of NaF with amorphous iron and disordered aluminum oxides that release OH . They illustrated the reaction as
(Fe,Al)OH + F ------- »■ (Fe,Al)F + 0H~
which leads to a >9.4. Parfitt (1978) also reported the chemis
try of amorphous materials that are dominated by the reactions of NaF
with large amounts of free (Fe)-OH and (Al)-OH groups on charge surfaces.
40

41
Table 5. Characteristics of the Koolau series, (EPT-7) a PlinthicTropaquept, fine, halloysitic, acid, isothermic, used to testthe ICOMOX's proposed definition of the oxic horizon.
Depth Horizon Sum CEC BulkOF (sum) densitybases
(cm) (meq/lOOg clay ) (g/cc)
15-Bar __Mater
(%)
ApH
0-15 All 2.7 63.5 0.37 56.6 -0 . 2
15-28 A12g 0.7 33.5 34.7 -0.328-40 A2g 1.9 40.1 38.9 -0.740-100 A21g 2 . 2 42.6 0 .8 6 36.7 -0.7100-130 B22g 1 . 8 54.8 46.6 -0.5130-180 C 2.3 55.2 0.78 42.4 -1 . 0
Source: SSIR No. 29 (1976).

42
Table 6. The pH in NaF of some pedons of Oxisols.
Depth-cm-
Horizon P^aFPedon OX-59, Wahiawa series, Eutrustox, Waipio, Oahu, Hawaii (BSP original pit)0-10
10-2727-4040-6565-9090-120
120-150
AplAp2BBwBwlBw2Bw2
8.78 .89.39.39.49.59.5
Pedon OX-60, Wahiawa series, Eutrustox, Waipio, Oahu, Hawaii (BSP new pit)
0-2323-3838-5353-9191-125
125-147147-178
AplAp2BBwBwlBw2Bw2
9.3 9.0 8.9 9.2 9.59.49.4
Pedon OX-33, Molokai series, Torrox, Molokai, Hawaii (BSP experimental survey pit)
0-2323-4747-6464-8787-104
9.59.6 9.5 9.4 9.2
Pedon OX-13, Farmhill series, Acrohumox, South Africa.0-1616-2828-6262-113
113-149149-165
AlA2B1BtlBt2Bt3
10.610.99.79.49.49.4
Pedon OX-46, Haplohumox, Aneityum Island, New Hebrides. **
0-1 010-120
AlB2
8.49.1
* Analyzed by the NSSL, Soil Conservation Service, USDA. ** Source: Leamy et al. (1979).

The available data indicated that the limit of 9.4 was too
low for some Oxisols. The values of some Andisols were examined
in order to establish a mutual boundary between the oxic and the "andic"
horizons. Table 7 shows that these soils have pH j^p >10.0. Evidently,
a value of 10.0 appeared to be the appropriate breaking point. Andepts
in drier environement like the Waimea series may have pH ^ p less than
10.0 (Table 8). But this soil has CEC greater than 16 meq per 100 g
clay and the sum of bases are very high to which a high ECEC may be in
ferred. This was illustrated by a pedon of Waimea series that was
sampled from a- profile pit close to the pedons in Table 8 . It has CEC
greater than 16 meq per 100 g clay and the siim of bases are very high
to which a high ECEC may be inferred (Table 9). Hence, the Waimea
series can not have an oxic horizon. On the basis of the available
data, therefore. Item 3 may be refined in the following manner; "Have
a pH value in N NaF (1:50) of less than 10.0."
4.1.3. Weatherable Mineral Content
The Kohala series illustrated the significance of the provision of
Item 4 that prevented the LAC Inceptisols to qualify for an oxic horizon
by virtue of its high weatherable mineral content (Table 10).The Kapaa, Makapili, and the Puhi series in Hawaii, the Segamat,
Kuantan and the Kuala Pilah series in Malaysia showed that the provi
sion of Item 4 was in accord with the test pedons of Oxisols (Table 1,
Appendix II).
The Lihue series, a Tropeptic Eutrustox, however, had more than
40 meq per 100 g soil, total elemental analysis (Table 1, Appendix II)
and the total elemental analysis was mostly contributed by MgO and K2O.
43

44
Table 7. The of selected pedons of Andisols.
Depth-cm-
Horizon P^aF
Hilo series. Typic Hydrandepts, thixotropic, isohyperthermic, Hawaii.^0-17 Ap - 9.7
17-39 B21 8.739-65 B22 10.565-70 lie 1 0 . 870-85 IIIAbl 10.785-110 IIIAb2 10.7110-125 IIIAb21b 1 0 . 2
Akaka series , Typic Hydrandepts,, thixotropic, isomesic, Hawaii.0-25 Ap 10.4
25-60 B21 10.460-85 B22 1 0 . 185-95 IIApB 10.595-105 IIB21b 1 0 . 1
105-120 IIB22b 1 0 . 0
Kukaiau series, Hydric Dystrandepts, thixotropic, isothermic, Hawaii.'0- 22 Ap 10.422-43 B21 1 0 . 843-66 B22 1 0 . 666-80 B23 1 0 . 680-97 B24 10.597-118 B25 10.3
Waimea series, Typic Eutrandepts, medial0-18 Ap 9.9
18-36 B21 10.336-61 B22 1 0 . 061-99 B23 1 0 . 299-132 B24 10.4
132-152 C 1 0 . 8
"PUC" soil. Hydric Dystrandepts, thixotro0-20 Ap 11.4
20-45 BA 1 1 . 145-80 BWl 10.980-115 BW2 10.9115-160 BW3 1 0 . 8160-190 BW4 10.7"ITKA" soil , Hydric Dystrandepts, thixotr*
0-23 Ap 10.923-42 BW 1 1 . 042-66 ABl 1 1 . 166-92 AB2 1 1 . 292-125+ AB3 1 1 . 2
isothermic, Hawaii.'
isothermic, Indonesia.
Sources: a= Recel (1981); b= Hawaii BSP as analyzed by the SCS.

45
Table 8 . The of two pedons of the Waimea series, a TypicEutrandepts, medial, isothermic, in Hawaii.
Depth
-cm-
Horizon P^aF 15-Bar Water Content
- - - pet - -
Waimea very fine sandy loam, Typic Eutrandepts, medial, isothermic.0-18 All 9.0 32.2
18-40 A12 9.5 36.440-71 B21 9.5 40.571-99 B22 9.4 38.799-127 Cl 9.4 36.9
Waimea silt loam, Typic Eutrandepts , medial, isothermic.0-18 Ap 9.3 31.718-25 B1 9.6 52.425-51 B21 9.7 48.951-81 B22 9.8 40.2
Source: Recel (1981).

46
Table 9. Characteristics of the Waimea series, a Typic Eutrandept, in Hawaii. Source; SSIR No. 29, 1976, p 46.
Depth
-cm-
Horizon *CEC Sum of
Bases- meq/lOOg -
BulkDensity
g/cc
15-BarWaterContent
Allophane
0-5 All 80.8 46.9 29.9
5-13 A12 71.8 46.1 0.71 29.1 4X13-20 A13 74.1 50.0 32.8
20-58 B21 80.8 57.5 48.3 4X
58-88 B22 90.8 5$ . 2 0 . 6 6 59.2
88-118 B23 79.2 51.4 60.8 4X
* CEC by sum of cations. 4X= dominant

47
Table 10. Characteristics of the Kohala series in Hawaii, used to testthe proposed definition of the oxic horizon by ICOMOX.
Depth Horizon Ca_____Mg______Na_______^ Total Mica-cm- _ _ _ -meq/lOOg clay- - - - - - - - - -%-
0-18 Apl 1.43 53.32 3.55 20.85 81.15 1518-35 Ap2 2.43 51.83 6.13 20.85 80.24 1535-68 B22 t 49.34 3.23 21.06 73.42 1568-98 B23 - 44.86 3.23 21.28 69.15 1598-113 Cl 1.07 47.35 2.90 9.15 60.47 5113-133 C2 t 44.86 3.23 3.83 51.92 2
Source: SSIR No. 29 (1976).

In this regard Swindale and Uehara (1966) found a direct relationship
between the amount of mica and the amount of exchangeable K in the soil.
But Juang and Dehara (1967) found that the Hawaiian Latossolic soils
are derived from parent material free of mica and they concluded that
mica is of tropospheric origin. It is, therefore, possible to suppose
that the K2O and some MgO originated from mica. This mica was reported
to be a K-bearing 2:1 layer silicate which is common in small amounts
in many soils in Hawaii and is made up of muscovite and vermiculite
layers (SSIR No. 29, 1976, p 207).
The mica, however, is in the clay fraction, and therefore, the
Lihue series is permitted to have an oxic horizon.
4.1.4. Texture and Clay Content
The intent of Item 5 is to exclude the sands and sandy particles
from the oxic horizon, because they too have low CEC. The clay con
tent limit of >8 percent replaces the 15 percent in Soil Taxonomy that
was originally used to keep the Quartzipsamments that have clay con
sisting of kaolinite and free oxides from having an oxic horizon. Here,
8 percent is the highest limit of clay content of the Quartzipsamments
and it is thus proposed to be the lower limit of clay content of the Oxisols by ICOMOX.
The texture and clay content criteria is explained by Smith (as
interviewed by Leamy, 1981) that the 15 percent clay limit in Soil
Taxonomy was originally intended to make a break between the sandy
loams (>15 percent clay) and the sands (<10 percent clay) or loamy
48
Leamy (1981). Conversation in Taxonomy. New Zealand Soils News. Volume 29, No. 3 pages 80-81.

sands (<15 percent clay) on the assumption that the highly weathered
soils have virtually no silt. Smith explained that the management
implication of separating the Oxisols from the Psamments is based on
the presumption that Psamments are subjected to blowing and drifting
and are very difficult to traverse with wheeled vehicles when dry,
while the Oxisols are not. Here, the 15-percent limit in Soil Taxonomy
was presumed to be the point where trafficability and blowing problems
develop. It was, however, found later that this value needed refine
ment for the reason that the presence of the appreciable amount of silt
plus clay did not produce the peculiar property.
Pedon OX-43 of the Sadao series in Thailand was used for the test.
It has no weatherable minerals, has less than 15 percent clay, and has
enough silt to have a sandy loam texture, (Table 2, Appendix II). It
could be placed neither in the Quartzipsamments because of the sandy
loam texture, nor in the Oxisols because it has <15 percent clay, if
Soil Taxonomy is applied. Smith reported soils of this characteristics
in Venezuela, supporting the idea that the 15 percent clay content
limit must be refined, hence, the 8 percent proposal of the ICOMOX.
If the clay content is too low, however, it is thought to exaggerate or increase abruptly the CEC/% clay ratio. But Figure 5 seemsto show that the CEC/% clay ratio gradually increase with decreasing
percentage clay content indicating that it is feasible to lower the
clay content limit such as the Sadao series to permit an oxic horizon.
The available data show that the lowest clay content for a sandy loam
texture is 11.6 percent. Perhaps a value of 10 percent may be a better compromise between the 8 percent clay proposed ICOMOX and the 15
49
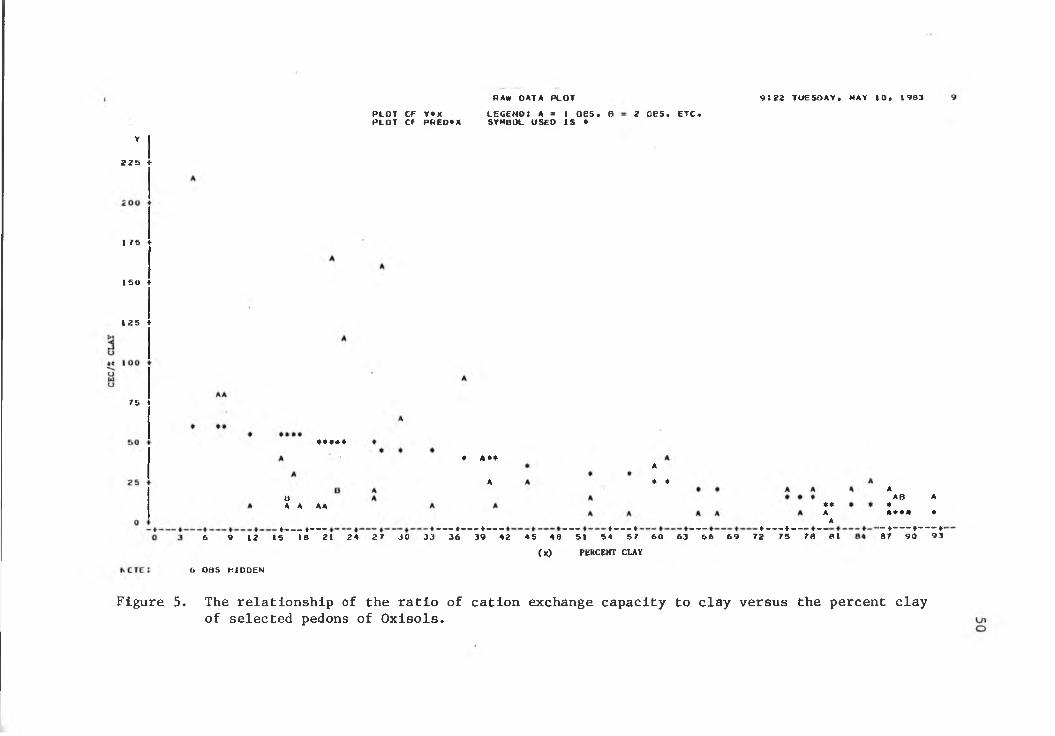
RAW D A T A P L O T 9 : 2 2 T U E S D A Y * MAY 10* 1963
Y
2 2 5 *
I 75 t
tSO *■
125 *
75
P L O T CF Y *X P L O T CT P R E O * X
l e g e n d : a s 1 oes* bSYMBOL U S E D I S ♦
2 oes* E T C *
« A A*
A
A
A ABA A AA A*
AA
*----------- « -------------------------------------------------------------------- ------- - ♦ ---------- ♦ ----------------------------------------- ------ ---- 4 - — f ---------------------------------------4 --------- 4 - - - -------6 9 12 I S 18 21 2 4 2 7 J O 33 3 6 3 9 42 4 5 4 6 51 5 4 5 7 6 0 63 6 6 6 9 72 75 7 6 61
AAB A
«A * « 4 4
- 4 - -----4 - — 4‘87 9 0 9 3
( x ) PERCENT CLAY
6 OBS FIDOEN
Figure 5. The relationship of the ratio of cation exchange capacity to clay versus the percent clay of selected pedons of Oxisols.

percent in Soil Taxonomy. More data, however, are needed to test the
suggestion particularly soils in Zaire and other parts of South Africa
where Oxisols and Quartzipsamments grade into each other.
4.1.5. Stability of the Clay Fraction
Item 6 requires the oxic horizon to have a diffused upper textural
boundary (i.e., 1 . 2 times clay increase within a vertical distance of
1 2 cm.).
Figure 3 shows that Item 6 was not satisfied by the Senai series
and pedon SOR. Such failure to meet Item 6 was appropriate for the LAC
Ultisols as their placement was not affected, but may not be for the
Oxisols.
The Phuket series in Thailand illustrated the appropriateness of
the placement of an Oxisol to the Ultisols by virtue of Item 6. Here
the clay content increase at a vertical distance of 12 cm to the upper
part of the oxic horizon is greater than 1 . 2 x clay content of the over-
lying horizon (Table 3, Appendix II). The new placement of the Phuket
series was in accord with the presence of some weatherable minerals viz
few mica flakes at the B23t and few feldspars at the B24t horizons that
were confirmed in the mineralogy of the sand fraction as having relative amounts of 17 percent potassium feldspars in its fine sand fraction (0.1 - 0.25 mm) and 19 percent in the coarse sand fraction (1.0 - 0.5mm)
(Proc. 2nd ISCW, Part II, 1978, pp 359-364).
Pedon OX-45 of the Senai series (Appendix I) did not qualify for
an oxic horizon due to its abrupt upper textural boundary. It has,
therefore, a kandic horizon. Being a light soil and having a kandic horizon, it could be placed in the order Ultisols. It has an ECEC of
51

less than 1.5 meq per 100 g clay and also has positive delta pH in some horizons, that makes it one of the poorest soils in the world. It has an abrupt upper textural boundary which suggested that Item 6 needed to be refined to retain an oxic horizon for this pedon.
Two possible suggestions may be made to accommodate these soils in the order Oxisols. Either Item 6 may be modified with the addendum, "...unless there is an acric soil material within 1.25 m of the soil surface" or impose this provision in the ICOMOX'S key definition of the order Oxisols. This will be discussed further in the tests on the key definition of the order Oxisols.
4.1.6. Volume of Rock StructureItem 7 defines the oxic horizon as one that has less than 5 per
cent by volume that shows rock structure unless the lithorelics containing materials are coated with sesquioxides.
The significance of this provision was illustrated by the Kapaa series (Table 4, Appendix II). It had a CEC by NH^OAc less than 16 meq per 100 g clay from B21 to B25 horizons (115 cm thick). It had more than 5 percent weathered gravel. But because they were impregnated with gibbsite, they were permitted to have an oxic horizon as per Item 7. Other Orthox in Hawaii that lent support were the Makapili series (Table 4, Appendix II) and Pedons OX-37 of the Puhi taxadjunct, OX-25 of the Lawai, and OX-36 of the Pooku series. The latter 3 pedons have also >15 percent by volume of saprolite coated with goethite or gibbsite within varying depths and thicknesses.
The retention of these soils in the Oxisols was strengthened by
the net positive delta pH in some parts of the oxic horizon. These are
52

features of an extremely weathered soil that defines an acric soil material, whose adverse characteristics take precedence over the argillic or kandic horizon,
4.1.7. Amount of Gravel in Coarser MaterialsItem 8 is an additional item proposed by ICOMOX to distinguish an
oxic horizon (ICOMOX CL No. 8 , 1982). The proposal reads, "Does not have more than 85 percent by volume of gravel or coarser materials."
The available pedon of Oxisols that contain considerable coarse materials such as stones, rock fragments and boulders were found in the South Pacific. The amounts of these materials were not quantified (Table 5, Appendix II, column 6), hence, they could not be used for testing. However, the absence of roots in the soils having these materials seem to suggest the significance of this criteria.
4.1.8. Application of Suggested Amendments to test PedonsThe summary of recommendations based on the preceding tests is in
Table 11.The suggested amendment of Item 3 recognized the presence of an
oxic horizon for the pedons that were slightly contaminated with volcanic ash or have amorphous Fe and Al oxides that were not sufficient to alter their properties. It also prevented the LAC Inceptisols from having oxic horizons.
The suggested amendment of Item 5 refined the class limit from 8
to 10 percent in accordance with available data.4.2. Testing Criteria of Oxisols
The ICOMOX'S proposed key definition of Oxisols that was tested reads:
53

Table 11. Recommended amendments to ICOMOX's proposals and their impact.
ITEM NO. RECOMMENDED AMENDMENTS IMPACT OF SUGGESTIONS AMENDED DEFINITION OF THE OXIC HORIZON
1 None None None
2 None None None
3 Change pH in NaF limit from 9.4 to 10.0
1. Retained the Oxisols that are slightly contaminated with volcanic ash or have amorphous Fe and Al but not sufficient to alter gross properties;2. The LAC Inceptisols were excluded.
Has a pH value in N NaF (1:50) of less than 1 0.0.
4 None None None
5 Change clay percentage from 8 to 1 0.
Refinement of class limit. Has a texture of sandy loam or finer in the fine earth fraction and contains 10 percent more clay;
6 Include addendum, "Unless It has acrlc soil materials in any part to a depth of 1.5 m"*.
Accommodated the Oxisols that met the clay content increase of a kandic horizon and have acric soil materials.
Has a diffuse upper textural boundary, "unless it has acric soil materials within 1.5 m from the surface.
7 None None None
8 None None None* Addendum may be made in Item 6 or in Item C.l of the key definition of the order Oxisols.
U14>

55
"C.l. Other soils that either have less than 40 percent clay in the upper 18 cm, after mixing, and an oxic horizon with its upper boundary within 1 m of the soil surface and not overlain by an argillic or kandic horizon; or
C.2. Have 40 percent or more clay in the upper 18 cm of thesoil, after mixing, and either an oxic or a kandic horizon with an apparent CEC of the clay fraction <16 meq per 100 g clay (NH^OAc, pH 7 method), the upper boundary of which is within 1 m of the soil surface."
4.2.1. The Light Textured LAC SoilsThe rationale for the 40 percent clay content limit are that the
idenfItication of clay films in high clay soils is less certain than in low clay soils and the increase in clay content is much more important in ligth soils. The argillic horizon, therefore, takes precedence over the oxic characteristics (Uehara, personal communication).
The management implication is that the coarser textured overlying horizon in light soils have excellent features for cultivation and root proliferation, while the finer textured subsurface horizon(s) increases the capacity of the soil to retain more moisture and plant nutrients (Eswaran, personal communication).
Item C.l was tested against the data of some Oxisols, LAC Incep- tisols and LAC Ultisols having clay content <40 percent in the upper 18 cm, after mixing. In accordance with the flow-dlagram In Figure 6.The test pedons of two Oxisols and the 21 LAC Ultisols were excluded from the Oxisols. The exclusion of the LAC Ultisols having low clay content is appropriate as it conformed with the rationale for Item C.l. This was illustrated particularly by the LAC Ultisols in Mainland, U.S.A. such as Pedons ULT-24, -32, -33, -36, -38, and -53. But the exclusion of the test pedons of Oxisols seem to indicated certain limitations of this item.

56
Figure 6. Fitting the test pedons into the flow-diagram key of the ICOMOX's definition of the order Oxisols.
11 LAC Ultiols "SOR""BUK""BPMD""NAK"

57
The problem was illustrated by the Farmhill series in South Africa.
It has less than 40 percent clay in the upper 18 cm, after mixing (Table 12). A plot of the clay content and CEC as a function of depth showed a kandic horizon with its upper boundary at about 62 cm from the soil surface (Figure 7). The CEC is <16 meq per 100 g clay at that depth and the ECEC is <12 meq in all horizons. However, it did not qualify for an oxic horizon due to the provision of Item 6 of the ICOMOX's definition that requires a diffuse upper textural boundary.The absence of an oxic, the presence of a kandic horizon and a base saturation <35 percent could place this pedon in the LAC Ultisols, by virtue of Item C.l.
But the adverse physico-chemical properties of the acric soil materials appear to be more important than a textural clay content increase of the kandic horizon. Here, the soils with acric materials are some of the poorest soils in the world on account of their inability to hold on to cations (Uehara, personal communication), imbalance between nutrient cations, deficiencies and/or toxicities, of some trace elements, low water holding capacity, and ability to fix high amount of phosphate (ICOMOX CL No, 7, 1981).
Hence, Item C.l may be modified so that it could retain light textured (<40 percent clay) LAC soils that have acric soil materials in the Oxisols.
The suggested amendment reads, "Other soils that have acric soil materials within 1.25 m of the soil surface or have <40 percent clay in the upper 18 cm, after mixing and an oxic horizon within its upper

Table 12. Characteristics of the Farmhill series in South Africa that were used to test Item C.l ofthe proposed ICOMOX;'s key definition of the Oxisols.
Depth Horizon Organic Clay Sum of CEC ECEC Base pH 15-Bar
-cm-Carbon
---- %
(<.002mm)
Bases (meq/100 g soil)
(meq/lOOg clay) Sat. (sum) - % -
H2O KCl ApH Water
- % -
0-16 Al 11.70 16.8 2.5 38.3 7.6 5 5.2 4.4 -0.8 38.416-28 A2 7.34 1 0 . 0 0 . 6 35.0 1.5 1 5.4 4.8 -0 . 6 32.028-62 B1 1.98 11.5 0.5 16.9 0.9 3 5.7 5.3 -0.4 20.362-113 Btl 0.20 20.0 0.5 7.8 1 . 6 7 5.9 6.3 +0.4 15.5
113-144 Bt2 0.13 22.4 0.5 7.9 1 . 2 7 5.9 5.7 -0 . 2 17.2144-165 Bt3 0 . 10 20.4 0.7 8 . 0 1.7 8 5.8 5.7 -0 . 1 16.9
Source: Soil Management Support Services, SCS, USDA (1983).
00

59
% Clay
Figure 7. Clay content of the Farmhill series as a function of depth, showing the kandic horizon with a clear upper textural boundary.

boundary within 1.5 m of the soil surface and which do not meet the
clay increase requirements of an argillic or kandic horizon, "or ...
The LAC Inceptlsols having a delta pH of -0.2 or more positive
like the Maile series (Table 13) will not be affected because the An
disols will key out before the Oxisols (Eswaran, personal communication).
Item C.l was further tested with 21 selected pedons of the LAC
Ultisols and Alfisols that have <40 percent clay in the upper 18 cm,
after mixing, and a kandic horizon to assess its effect on the other
parts of the system (Table 1, Appendix III). The result did not dis
turb their current placement which means that the criterion is appro
priate.
The depth of the control section is suggested to be changed from
1.25 m to 1.5 m because the latter is the common depth for soil survey
observations. It also parallels the proposed depth of the kandic hori
zon and it will be easier to remember only one value for the depth of
the diagnostic horizons.
4.2.2. The Heavy Textured LAC Soils
Item C.2 permitted the entry of the 15 pedons of fine textured
(>40 percent clay) LAC Ultisols that have kandic horizon into the Oxisols (Figure 6).
The rationale was that the high degree of weathering as evidenced
by the low activity of the clay was more important to soil behaviour
than the evidence of clay movement. Furthermore, a soil with a high
clay content, yet very low CEC (<16 meq per 100 g clay) ensure the do
minance of oxic materials in the soil. Here, the extremely low nutrient
retention capacity, and the low nutrient supplying capacity of the oxic
60

61
Table 13. Characteristics of a soil with ECEC less than 1.5 meq per 100 g clay and a positive ApH (Maile series, Hydric Dys- trandept). Source: SSIR No. 29, 1976, p 30.
Depth Horizon Organic Sum of KCl ECECCarbon Bases Extr.
-cm- — %— _ _ _ meq/lOOg clay-CEC pH
H2O KCl ApH
0-5 All 18.00 12.3 1 . 2 13.5 56.2 5.5 4.5 -1 . 0
5-10 A12 5.12 1.3 1 . 1 25.5 5.4 4.5 -0.910-35 A13 11.74 0.3 0.7 0 . 8 56.1 5.2 4.9 -0.333-43 B21 10.55 0.4 0 . 2 43.2 5.3 5.1 -0 . 2
43-50 B22 9.75 0 . 6 0 . 2 0.4 38.2 5.4 5.3 -0 . 1
50-60 B23 9.04 0 . 2 0 . 2 43.6 5.5 5.3 -0 . 1
60-73 lie 8.32 0 . 2 0.4 36.7 5.3 5.3 0
73-90 IIIB24b 8.89 0.4 42.5 5.1 5.3 +0 . 2
90-12&f IIIB26b 9.15 0.3 0 . 2 0.4 50.5 5.2 5.5 +0.3

soil materials override the benefits of the clay increase with depth
of the argillic horizon or the kandic horizon.
Other advantages in the placement of some test pedons from the
Ultisols to the Oxisols are related to the clay mineralogy that is pre
dominantly of the variable charge type. According to Uehara (personal
communication, 1983), the Al and Fe oxides in these soils are stable
minerals at very low pH so that they pose no toxicity problems. How
ever, they become toxic when the pH is too low because the oxides are
dissolved and Al is released into the soil solution in toxic amounts.
The difference in correcting this problem with other soils is an import
ant consideration that should be reflected in the soil name. For example,
a relatively small amount of lime is enough to bring the pH to about
3.5 as compared to the permanent charge soils, that requires a conside
rable amount of lime to raise the pH.
Item C.2 applied very well with the available test pedons of Oxi
sols. Its effect with the other parts of the system was tested with
11 representative pedons of LAC Ultisols (Table 2, Appendix IV). It
was illustrated by the Pauwela and Paaloa series and the Haiku taxad-
junct in Hawaii. These pedons have more than 40 percent clay in the upper 18 cm of the surface, after mixing, and a kandic horizon. There
fore, they could be placed in the order Oxisols. The appropriateness of
their new placement may be viewed in terms of properties. Cline et al. (1955), described these soils as strongly acid to very strongly acid.
They are leached of bases and silica resulting in the increased con
centration of Fe, Ti, and Al. The sesquioxides cement the clay fraction
into sand or silt-sized aggregates resulting in reduced water holding
62

capacity and subsequent droughtiness after a few rainless periods.
These properties greatly influence the management of these soils. Such
properties indeed seemed to be more associated with the oxic materials
than they are with the clay content Increase in the argillic or kandic
horizon.
Hence, they may be more appropriately classified as Oxisols. This
was further illustrated by the Pauwela (Ultisol) and the Kapaa (Oxisols)
series (Figure 8). According to de Datta et al. (1963), the rate of P
immobilization by the two soils were similar. Hence, in terms of ma
nagement, it seemed reasonable to suppose that the LAC Ultisols, having
clay content >40 percent as illustrated by the Pauwela series are beha
ving more as Oxisols than as Ultisols.
The Pak Chong, Ban Chong, and the Kabin Buri series in Thailand
illustrated the difficulty in ascertaining the presence or absence of
the clay skins which are very vital in the identification of an argil
lic or kandic horizon.
The field morphological description of the Pak Chong series showed
broken moderate cutans on ped faces (Proc. 2nd ISCW, Part II, 1979).
The discontinuous clay skins and the CEC <16 meq per 100 g clay supported the presence of a kandic horizon. The kandic horizon and clay
content >40 percent placed this soil in the Oxisols by virtue of Item C.2. Its micromorphological analysis, however, showed well oriented
ferri-argillans that occupied about 15 percent of the area at 30 cm
depth. This suggested instead the presence of an argillic horizon
which was thought to have developed in the oxic material as a result of
a large scale deforestation that changed the climate and the process of
63
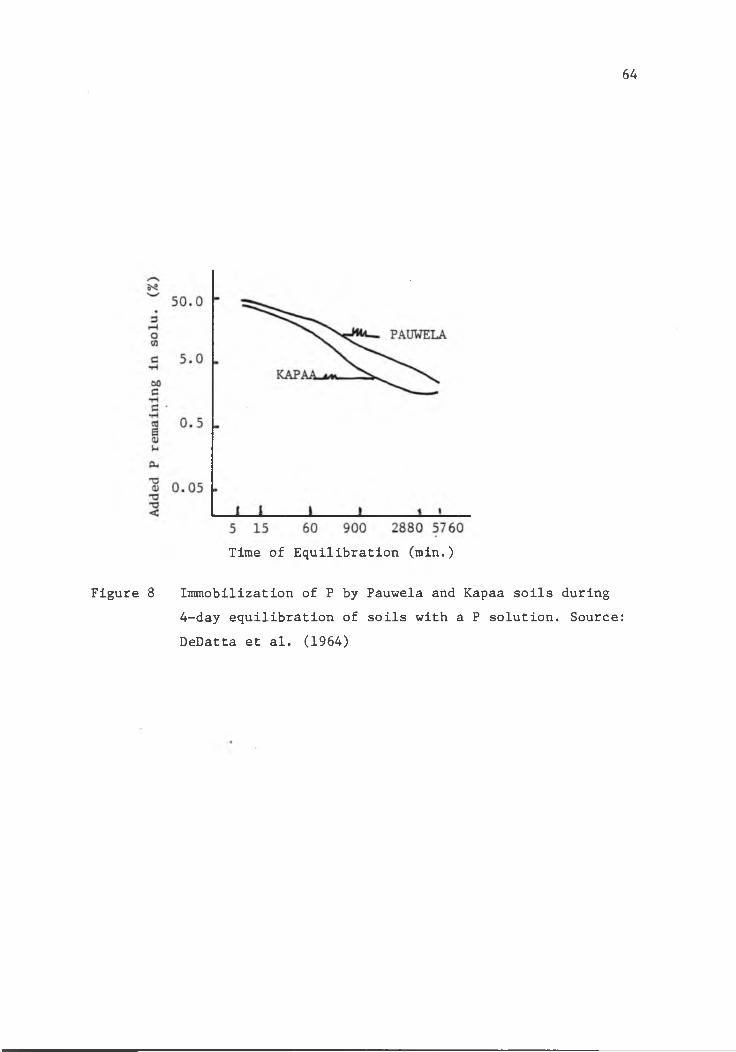
64
Time of Equilibration (min.)
Figure 8 Immobilization of P by Pauwela and Kapaa soils during4-day equilibration of soils with a P solution. Source: DeDatta et al. (1964)

soil fonnation (Proc. 2nd ISCW, Part II, 1979, p 265).
A plot of the clay content with depth of Pak Chong series showed
that the upper boundary of the oxic horizon was above the argillic ho
rizon (Figure 9). Here, preference was given the horizon nearest the
surface on the assumption that the more recent process that dominate
the soils' genesis produce the diagnostic horizons closer to the sur
face than the older process which produced the horizons at greater
depths (Smith, 1980). This confirmed the placement of the Pak Chong
series in the Oxisols.
The Ban Chong series was another pedon lending support to the
change in classification of heavy textured LAC Ultisols to the order
Oxisols (Table 1, Appendix III).
The new placement was viewed in terms of its management proper
ties. It is droughty and the natural fertility is medium but will
decline when cultivated without corrective measures (Scholten and
Boonyawat, 1972). Here the problem of droughtiness perhaps is more
associated with oxic characteristics of the Oxisols than with the clay
increase in the kandic horizon of the LAC Ultisols.
4.2.3. Application of Suggested Amendments to the Test PedonsThe preceding test indicated the need to refine Item C.l in order
to accommodate the LAC soils with acric soil materials. The impact of
the suggested amendments is shown in Table 14.
Item C.2 accommodated the heavy textured LAC Ultisols in the
order Oxisols. Here, more importance is given to the effects of high
degree of weathering than the evidence of clay movement.
65

66
80%Clay
90
Figure 9. Clay content of the Pak Chong series as a function of depth, showing the oxic material on top of the argillic horizon.

67
Table 14. Result of taxonomic tests on the suggested amendments.
ITEM NO. AMENDED DEFINITION RESULT OF TESTS*
C.l Other soils that1. Have acric soil materials
within 1.25 m of the mineral soil surface; and/ or
1 pedon having acric soil material that did did not meet Item 6 of definition of oxic horizon was retained in the Oxisols.
2. Have less than 40 percent clay in the upper 18 cm, after mixing, and an oxic horizon with its upper boundary within 1.25 m of the soil surface and which do not meet the clay content Increase of an argillic or kandic horizon; or
21 LAC Ultisols were kept out of Oxisols.
C.2 Have 40 percent or more clay in the upper 18 cm of the soil surface, after mixing, and an oxic horizon.
11 LAC Ultisols and the 4 BSP pedons were placed in the Oxisols.
* 63 pedons of Oxisols and 36 pedons of LAC Ultisols were used.

The acric soil material is also suggested to be defined as a
mineral soil material that has an ECEC as determined by the sum of
bases (extracted with NH^OAc and KCl extractable aluminum) of <1.5
meq per 100 g clay and a delta pH (pHj ^ “ ^^2^^ -0.2 or more positive within 1.5 m' from the soil surface.
4.3. Testing Criteria of Lower Categories of Oxisols
The ICOMOX's key to the suborder was tested with the flow-diagram
key in Figure 10 which was based on the most recent approximation as
described in ICOMOX CL No. 10 (1983).
Here, substantial changes were made as shown in Table 15a and 15b.
4.3.1. Testing the ICOMOX's key to the Aquox
Item CA of the proposed key to the suborders of Oxisols defines the Aquox as "The Oxisols that are either saturated with water within30 cm of the mineral surface for at least 30 days per year in more yearsor are artificially drained and have one or both of the following characteristics associated with wetness:
a. A histic epipedon, and/orb. If free of mottles, immediately below any epipedon that has
a moist color value of less than 3.5 there is a dominant chroma of 2 or less; or if there are distinct or prominentmottles within 50 cm of the soil surface, the dominant chromais 3 or less or the hue is 2.5Y or yellower."
The ICOMOX's proposal deleted the plinthite that forms a continuous phase within 30 cm of the mineral surface. It also quantified
the required duration of water saturation and introduced the color
criterion of 2.5Y or yellower.
The ICOMOX key to the Aquox was tested against the data of 8
available pedons in Sumatra using the flow-diagram key to the great
groups in Figure 11. Pedon OX-40, an Umbraquox was excluded while
Pedon ULT-36, a Paleaquult was accommodated in the order Oxisols.
68
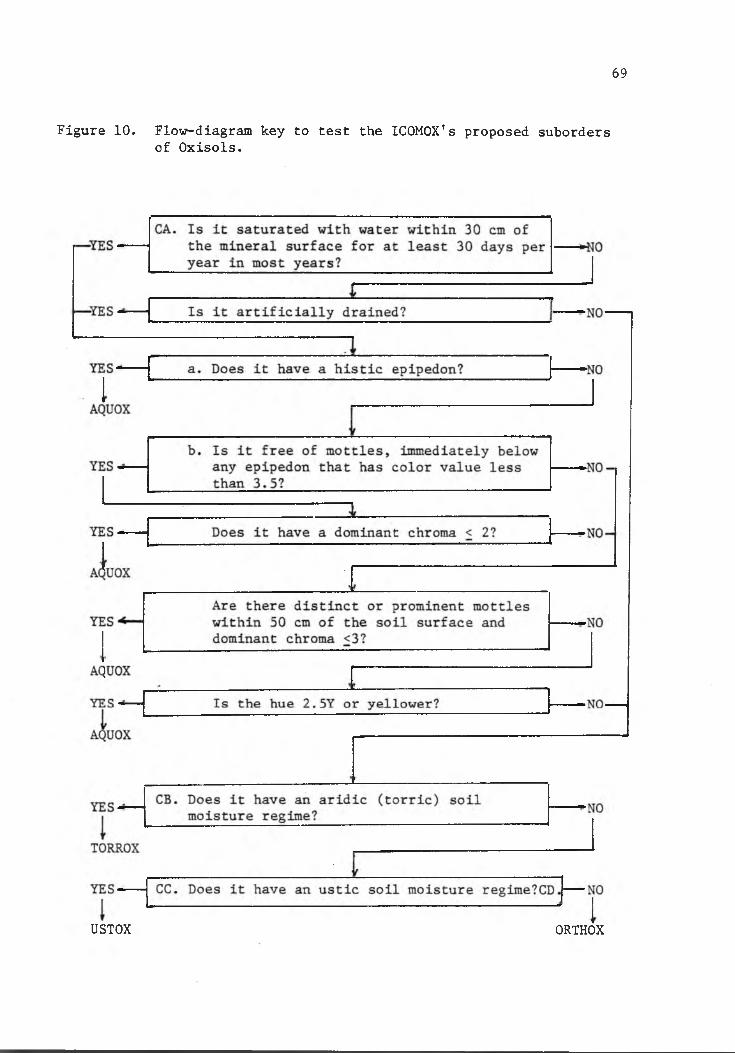
69
Figure 10. Flow-diagram key to test the ICOMOX's proposed subordersof Oxisols.
USTOX ORTHOX
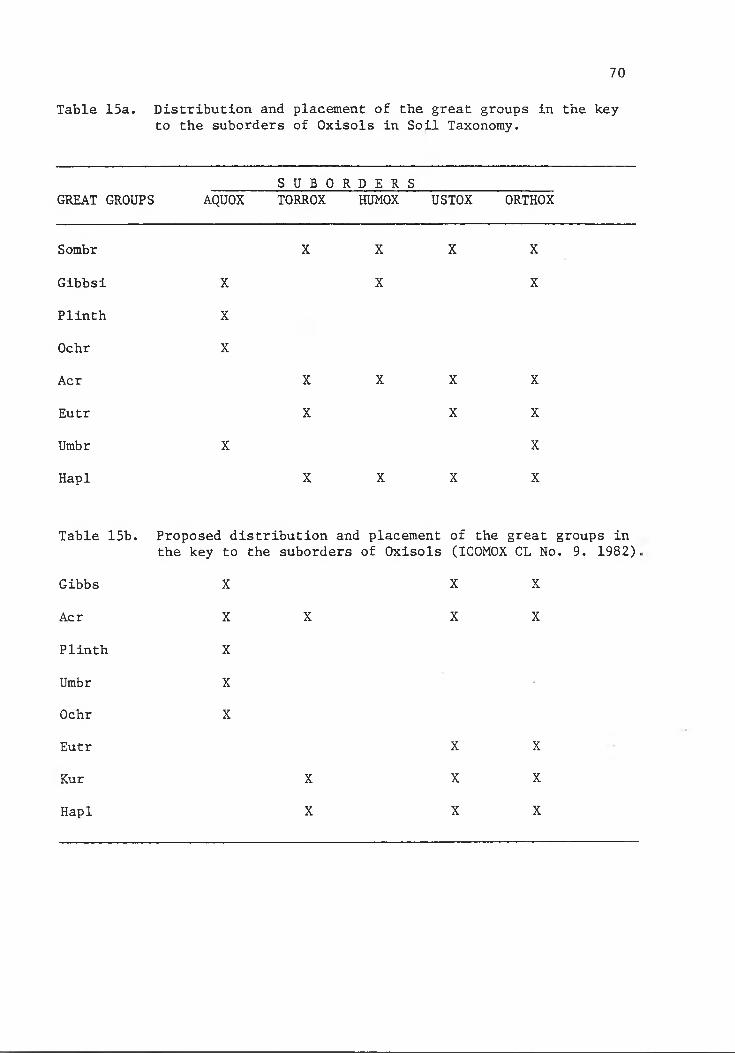
Table 15a. Distribution and placement of the great groups in the key to the suborders of Oxisols in Soil Taxonomy.
70
S U B O R D E R SGREAT GROUPS AQUOX TORROX HUMOX USTOX ORTHOX
Sombr X X X X
Gibbsi X X X
Plinth X
Ochr X
Acr X X X X
Eutr X X X
Umbr X X
Hapl X X X X
Table 15b. Proposed distribution and placement of the great groups in the key to the suborders of Oxisols (ICOMOX CL No. 9. 1982),
Gibbs X X X
Acr X X X X
Plinth X
Umbr XOchr X
Eutr X X
Kur X X X
Hapl X X X
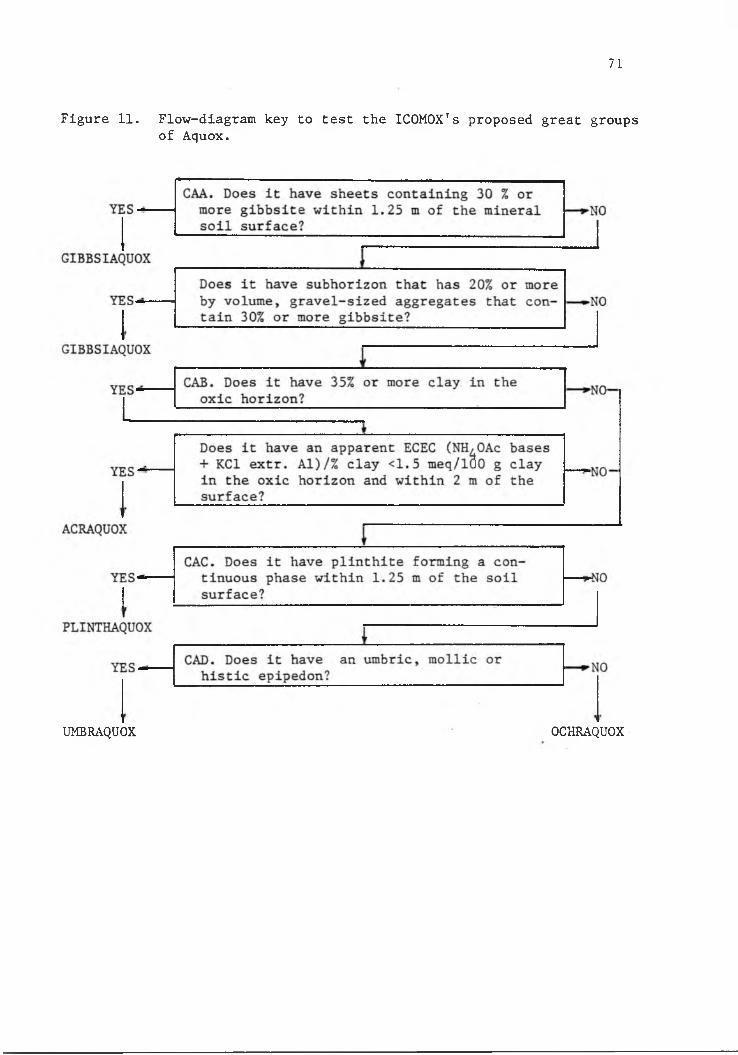
71
Figure 11. Flow-diagram key to test the ICOMOX's proposed great groups of Aquox.
UMBRAQUOX OCHRAQUOX

Pedon OX-42 shifted from the Orthox to the Aquox. The details and
rationale follow as they were keyed into the lower categories.
4.3.1.1. Test of the Umbraquox - The properties of Pedon
OX-14 in Sumatra agree well with the ICOMOX's key to the Aquox. How
ever, Pedon OX-40, an Umbraquox was excluded from the order Oxisols
because the upper boundary was not diffuse as required in Item 6 of
the ICOMOX's definition of the oxic horizon. It was placed instead in
the "kandi" great group of Ultisols. The change in classification may
be viewed in terms of the low clay content of <40 percent in the sur
face 18 cm, which is favorable for tillage operation and ease of root
proliferation while the higher clay content in the subsurface horizon
increases its water and nutrient retention capacity. These management
properties are more important then the oxic characteristics.
4.3.1.2. The Ochraquox - Item CAE (see Figure 11) of the key
to the great groups of Aquox was tested with Pedon OX-22 of the Kuamang
series in Singkut, Sumatra (Table 1, Appendix IV). It illustrated the
common and distinct mottles and the dominant chroma of 3 or less that
define the suborder Aquox. This was confirmed by the properties of
the Alai and Kersik series in Sumatra. Pedon OX-22 of the Kuamang series, supported by the data of Pedon OX-3 of the Babeko series in
Singkut, Sumatra in the same table illustrated the chroma greater than
2 in some horizons below the epipedon that diagnose the aerie subgroup.
Pedon OX-42 of the Rukani series in Alai Hilir, Sumatra showed
the change in classification from the Orthox to the Aquox. Its posi
tion in a valley bottom and its imperfectly drained condition, plus
72

the distinct mottles within 50 cm of the soil surface and a hue of
2.5Y in the oxic horizon strongly favored its placement in the Aquox.
The chroma greater than 2 in the major part of the horizon also il
lustrated properties that define an Aerie subgroup.
Item C.2 of the key definition of the order Oxisols, placed pedon
ULT-34 of the Grady series in Georgia, U.S.A. from the Ultisols to the
Oxisols. Item CA.b (see Figure 10) of the key to the suborders placed
it from the Aquults to the Aquox and Item CAE placed it in the great
groups of Ochraquox owing to its ochric epipedon. There were not
enough data, however, to support this new placement. It is possible
that it is in the border line between the Ultisols and the Oxisols.
4.3.2. Testing the ICMOX's key to the Torrox
Item CB (see Figure 10) of the key to the suborders introduced
three great groups of Torrox (Figure 12). Pedons OX-31 and OX-32 of
the Molokai series (Table 2, Appendix IV) and Pedon OX-33 (Yaibuathes,
1965) were reported to have torric soil moisture regime and isohyper-
thermic temperature regimes. They illustrated the provisions of Item
CB for the suborder Torrox.4.3.2.1. The Eutrotorrox - Item CBB (see Figure 12) o£ the
key to the great groups of Torrox was illustrated by Pedons OX-31 and
OX-32 with base saturation ranging from 41 to 49 percent. The delta pH
was more negative than -0.2 and the ECEC was greater than 1.5 meq per
100 g clay in all horizons.Pedon OX-33, however, had base saturation less than 35 percent in
the Ap2 horizon which fell short of the requirement. On this basis,
the definition of Eutrotorrox may be modified as, "Other Torrox that
73

74
Figure 12. Flow-diagram to test the ICOMOX's key to the great groups of Torrox.
EUTROTORROX HAPLOTORROX

have >35 percent base saturation at pH 7 in the major part of the oxic
orizon."
In Hawaii, the Torrox show no distinct differentiating properties
to permit separation at the great group or subgroup level. Hence, they
are Typic Torrox (Soil Survey Staff, 1972). With the ICOMOX proposal,
their placement in the Eutrotorrox seem to be an improvement because
enrichment of bases is appropriately reflected in the "Eutr" taxon.
This was illustrated with the Molokai series, which is considered one
of the best soils in the Hawaiian Islands for sugarcane under irriga
tion, mainly because it is well supplied with bases and it receive much
solar radiation (Cline, ^ 1., 1955).
Such placement, however, is not without question because in Soil
Taxonomy, p 91, it says that the full definition of a great group as
a subdivision of the suborder is usually followed by description of
a soil that represents the central concept of the great group. The
soil that represents the central concept is used as reference to de
termine the variants which reflects a soil forming process other than
those responsible for the soils belonging to the central concept. These
variants are keyed out first, leaving the soil representing the central concept last in the key which is the "Hapl" great group.
In this respect, the Torrox is described as the Oxisols having a
relatively high base saturation (Soil Taxonomy, p 33). Concsequently,
the Haplotorrox must have a high base saturation and, therefore, those
with lower base saturation are the Dystorrox. In other words, the
"Hapl" great groups of Torrox become the counterpart of the "Eutr" great groups in the other suborders.
75

In order to parallel the class limit of the "Eutr" great groups
in the other parts of the system, the Haplotorrox may be defined as,
"Other Torrox that have more tha 35 percent base saturation at pH 7 in
the major parts to a depth of 1.5 m." Or in the key, the Dystorrox
will be defined as, "Torrox that have less than 35 percent base satu
ration at pH 7 in the major parts to a depth of 1.5 m ." And, therefore,
the Haplotorrox will also be defined as, "Other Torrox". "Acric" great
group of Torrox is proposed, but this has yet to be found before it isincluded in the key.
4.3.3. Illustration for Suggested Retention of the Humox Suborder
One of the major changes in the ICOMOX proposal is the deletion of
the suborder Humox. Apparently, this is a debatable proposition. On
one side, its deletion may be favorable assuming that clearing the
forest and putting it into cultivation would easily lead to the rapid
decline in organic carbon content and eventually result to a possible
change in classification within a short time. This is in accord with
Soil Taxonomy as provided on page 8 , which reads, "the differentiae
should keep an uncultivated soil and its cultivated or otherwise non
modified equivalents in the same taxon in so far as possible."Furthermore, the definition of the "Hum" taxon in Soil Taxonomy
is being questioned. For instance, the organic carbon-temperature cri
teria are constraints in Brazil (Bennema and Camargo, 1979) and in
Australia (Isbell, 1979) because some soils high in organic carbon con
tent are also found outside regions having thermic or cooler soil temp
erature regimes.
76
77
On the other side, the retention of suborder Humox may be reason
able because the Humox could be geographically delineated, which is
one of the purposes of the taxa at the suborder level. This was demons
trated by Ikawa (1979) with the Humox in Hawaii, Leamy ^ al., (1979)
in the South Pacific, and Eswaran (personal communication) in the high
plateaus of Zaire. According to Eswaran, the properties of the Humox
also reflect a process which is another function of the suborder category.
A test of the Humox with Pedons OX-27, OX-37, OX-18, OX-28, OX-25,
OX-31, OX-41, OX-24, OX-17, and OX-45 representing different soil mois
ture regimes showed that the CEC increased with increasing amount of
organic carbon content. This seemed to suggest that the organic car
bon content may be masking the low CEC of the clay fraction (Figure 13).
Apparently, this makes the organic matter-rich Oxisols better than the
organic matter-poor Oxisols.
The Humox are also presumed to occur in cooler places, where humus
has more chances to accumulate. Pedons OX-27 and OX-15 in Hawaii,
OX-62 in Brazil, OX-46 in the South Pacific; selected Orthox such as
pedons OX-37, OX-18, OX-36, OX-25, OX-28 in Hawaii; and selected UstOK such as OX-26 in Hawaii illustrated the increasing organic carbon content as the soil temperature regime decrease (Figure 14). Apparently
they indicated that Humox are more confined in the cooler climates where
moisture regime is udic.
The properties of the Halii series (Gibbsihumox) and the Mahana
series (Acrohumox) in Hawaii, Pedon OX-7, an Acrohumox in Parana,
Brazil, and Pedon OX-18 of the Farmhill series (Acrohumox, tentative)

3 0 . 0 t
2 7 . b
2 b . 0 4
2 0 . 0 4
o« YbOO 1 5 . 0 4or»tus. Iii.5 to*gs
1 0 . 0 4
7 . b 4
2 . 5 4
0 . 0 4-4--
0 . 0
P L O T OF Y 4 X P L O T OF P R E D 4 X
RAW D A T A p l o t
L E G E N D S A s 1 U t i S . 0 = 2 O t i S* E T C . S Y M B O L O S L O I S 4
1 2 : i a M O N D A Y , MA Y 2 . 1 9 6 3 5
A A AA4 4
4 A
A 4 4 4A
A 4 4
A 4 4A 4 4 4
AA A
A A BA
A A
A 4 4 4 4A 4 4
4 AA
A A
A
Y = 5.599 + 2.6969X
R = 0.74
A 44
4 4A A
0 . 5 1 . 0 I . 5 2 . 0
n o t e : I I O B S H I D D E N
5 3 . 0
X
X O r g a n i c C a r b o n
3 . 5 4 . 0 4 . 5 S . O b . S 6 . 0
Figure 13. Relationship between organic carbon content and the cation exchange capacity of some pedons of Oxisols.
00

12 4 ♦
Id 1 9 t
Iti *
‘M
P L O T OF V 4 X P L O T OF P R E 0 4 X
RAW D A T A P L O T
L E O E N O : A 3 I OOS* 13 « 2 OBS* E T C . SYMBOL U S E D I S «
l i : 5 3 M O N D A Y . MAV 2 , 1 9 8 3 5
Y = 24.0345 - 3.2798X = 0.98
0 . 3
n o t e : 4 O U S H I O D L N
0 . 7 0.8 X
Z O r g a n i c C a r b o n
0 . 9 1 . 0 I . I 1 . 3 1 . 4
Figure 14. Relationship of percent organic carbon content and soil temperature in selected pedons ^of Oxisols.

in South Africa illustrated the mollic or umbric criteria.
These evidences supported the inclusion of the "Hum" taxon at the
suborder level. It may be defined as "Other Oxisols that have a mollic
or umbric epipedon." There were, however, pedons having umbric epipe
don such as the Pedons SOR and NAK of the BSP whose performance were
not better than the Orthox. To exclude them from the Humox, the "Hum"
taxon should be further defined to have an organic carbon content <16
kg/m2 to a depth of 1 m.
The ochric epipedon having 1.0 percent organic carbon content to
a depth of 75 cm was illustrated by Pedon OX-46 of a Haplohumox in the
New Hebrides and Pedon OX-16 of the Pooku series (Acrohumox) in Hawaii.
This could be another possible criterion for Humox. Here the ochric
epipedon and >16 kg/m^ of organic carbon content to a depth of 1 m will
accommodate the cleared and cultivated Humox.
Pedon OX-34, however, of the Nipe series in Puerto Rico, met these
criteria but the significance of the organic carbon content >1 percent
to a depth of 75 cm was not demonstrated in the performance of this
soil compared to the other soils currently classified as Acrorthox in
Puerto Rico (Eswaran, personal communication). Further testing of this criterion is, therefore, needed.
4.3.4. Testing the ICOMOX'S Key to the Ustox
Item CC (see Figure 14) of the key to the suborders of Oxisolskeys out the Ustox with an ustic soil moisture regime.
Ten representative pedons of Oxisols in Hawaii, Fiji, and in
Thailand and several others from other orders were used to test the
ICOMOX'S key definition of the Ustox as outlined in Figure 15.
80

81
Figure 15. Flow-diagram key to test the proposed ICOMOX's great groups of Ustox.
KURUSTOX HAPLUSTOX

4.3.4.1. The Eutrustox - Item CCC (see Figure 15) of the
ICOMOX'S key to the great group of Ustox was illustrated by Pedons OX-
59 of the Wahiawa series and OX-16 of the JAIBA soil with base satura
tion by NH4OAC >35 percent in all parts to a depth of 1.25 m. Pedon OX-
10 of the COTO series illustrated certain limitations of the provision
of Item CCC. The percentage base saturation by NH4OAC was not more than
35 percent in all parts to a depth of 1.25 m. This was confirmed by a
duplicate pedon of COTO series in SSIR No. 12 (1967) which also showed
less than 35 percent base saturation in the B21 and B22 horizons. The
similar response of COTO to a given management as those of pedons OX-59
and OX-16 (BSP Tech. Report, 1980) suggested its placement in the same
taxa with the latter 2 pedons. On that basis, the "Eutr" great groups
may be defined with a limit of >35 percent base saturation by NH4OAC
in the major part of the oxic horizon. This corroborated the sugges
tion made earlier for the "Eutr" great groups of Torrox.
4.3.4.2. The Kurustox - Item CCD of the ICOMOX'S key to the
great group of Ustox was illustrated by the Ban Chong series in Amphoe
Kabin Buri, Thailand with >40 percent clay in the upper 18 cm, after
mixing and a clay content increase of an argillic horizon. Its placement from Ultisols to Oxisols may be viewed in terms of its infertile,
droughty and unsuitability to paddy rice. Its droughtiness and unsuitability to paddy rice demonstrated its inability to store water. Here,
increased water retention is supposed to be one of the benefits asso
ciated with the argillic horizon. Hence, the oxic characteristics
take precedence over the clay content increase of the horizon. Such
clay increase, however, is recognized at the "Kur" great groups.
82

4.3.4.3. The Haplustox - Item CCE (see Figure 15) of the
ICOMOX'S key to the great groups of Ustox was tested with Pedon ULT-62
of the Pak Chong series in Thailand. It illustrated the change in
placement from Ultisols to Oxisols by virtue of a clay content that is
more than 40 percent in the upper 18 cm, after mixing (Item C.2) and an
oxic horizon, the upper boundary of which is within 1 m of the soil
surface. Such change in classification may be supported by its drough
tiness during periods of insufficient rainfall and unsuitability for
paddy cultivation because it is too permeable to impound water (Schol-
ten and Bonnyawat, 1972). These important features appeared less rela
ted to the clay accumulation of the argillic horizon than the oxic cha
racteristics. It follows, therefore, that this property is better re
flected in the new name Haplustox than the current classification as
Paleudults.
4.3.5. Testing the ICOMOX'S Key to the Orthox
Item CD (see Figure 10) of the ICOMOX'S key to suborders Oxisols
keys out the Orthox. It was tested against the data of thirty two
pedons in Malaysia, Thailand, Puerto Rico, Indonesia and in the Ivory
Coast.4.3.5.1. The Gibbsiorthox - Item CDA (see Figure 16) of the
great groups of Orthox was tested against the Kapaa, Pooku, Halii se
ries in Hawaii and pedon OX-52 in Western Samoa.
In the South Pacific Region, Latham mentioned that Soil Taxonomy
do not accommodate soils having gibbsite as high as 40 percent in the
"Gibbsi" great groups. This was corroborated by Leslie and Blakemore (1979) in Banuato Santo, in the Solomon Islands; Quantin in the New
83

84
Figure 16. Flow-diagram key to test the ICOMOX's proposed great groups of Orthox.
KURORTHOX HAPLORTHOX

Hebrides; and Tercinier in Tahiti as cited by Latham (1981).
The important attribute of the "Gibbsi" taxon seem to be the
sheets or gravel-size aggregates of gibbsite that appear to inhibit
root proliferation as indicated by root mats above the gibbsite sheets
in the Kapaa and the Pooku series (Table 16).
Table 17 shows the P requirement of some Oxisols in relation to
their mineralogies. The Kapaa series (a "Gibbsi" great group) which
is predominantly gibbsite and goethite sorbed more P than the non-
"gibbsi" soils like the Wahiawa and Molokai series. This indicated
a different management property for the "Gibbsi" taxa.
In another case, Younge and Plucknett (1966) demonstrated a heavy
application of P to increase crop yields of the bauxitic Kapaa soils
in Kauai. Foote e^ (1968) also found that residual fertilizer phos
phate efficiencies were greater for strip soil than for the surface
soil in the Kapaa series. These evidently showed that bauxitic mate
rials may be management limitations in the "Gibbsi" taxon.
Table 18 shows, however, that there is no root matting in the pe
dons that have more than 30 percent gibbsite in the whole soil sugges
ting that the high gibbsite content may not be a management limitation unless they are in sheets or in gravel-size aggregates. This seems to
support Item CDA (see Figure 16) in excluding these soils in the "Gibb
si" great group. Nevertheless, Soil Taxonomy considers soils having
more than 40 percent gibbsite in the whole soil as gibbsitic in the
mineralogy class. It might be mentioned that ICOMOX proposes to delete
the gibbsitic mineralogy class on the presumption that it is covered
by the "Gibbsi" great groups (ICOMOX CL No. 10, 1983). Table 16,
85

Table 16. Some diagnostic attributes of selected pedons related to Gibbsi characteristics.
Depth
-cm-
Org.Carbon
BaseSat.
CEC ECECHorizon Mlneraloglcal Anal.KK GI GE MT
— pet of whole soil— pet------meq/lOOg clay-
Soll pH Root Descrip- Color Distrl- tion
bution
Kapaa series, Typic Glbbslorthox,clayey,oxidic,isohyperthermlc. Kauai,Hawaii (SSIR No.29,pp 164-165).0-3030-4040-6363-9090-123
123-150
ApB21B22B23B24B25
100000
20
253030351010
403535303030
51010101520
3.921.461.090.640.460.48
111431 2632 24
21.24.23.42.44.67.6
3.10 . 61.00 . 61.61.7
10YR4/35YR4/65YR4/85YR4/65YR4/85YR4/4
-0.5+0.2+0.2- 0.1+0.1- 0 . 6
Mfvfvfvfn
5% swgi GI 20% swgi GI 40% swm sbw 60% swm sbw
Pooku series, Typic Gibbsiorthox,clayey,oxidic,isohyperthermic. Kauai,Hawaii (SSIR No.29, ppl68-169).0-3838-4848-7575-100
100-155155-225
AplAp2B21B22ClC2
52
403525354545
405040404030
152
15101015
3.882.431.581.100 .660.16
92
12t
2620
18.911.45.8 3.52.9 1.1
2.10.40 . 8
0.90.4
10YR4/410YR4/45YR3/45YR3/45YR3/35YR2/3
- 1.0-0.3+0.1+0.5+0 . 6+0.4
mc
cf
Halil series, Typic Gibbsihumox,cleyey,ferritlc,isothermic. Kauai, Hawai (Ikawa, 1979). 0-33 Ap 2.87 24 36.1 8 . 8 10YR3/3 -0.4 n33-58 B21 1.91 12 24.3 3.1 10YR3/4 -0.2 n58-76 B22 1.31 6 14.6 0.9 7.5YR4/4 +0.1 n76-112 Cl 0.99 6 13.5 0.9 5YR3/4 +0.2 n
ncpsM on dis tp of HE GI ts of HE GI
10-20% sap 50% sap 80-90% sap
OX-52,Typic Glbbslorthox,clayey,oxidic,Isohyperthermlc.Afiamalu, W.Samoa (Proc 2nd ISCW, 1979, p 188) 0-3 A 20.6 16 59.7 15.0 5YR3/3 _ _ -3-30 B 6.0 4 - - 7.5YR4/4 - - -51-61 C 36.0 1.9 10 7.7 0.7 2.5YR4/6 - -
Mineralogy: KK=kaolinlte, Gl-gibbsite, GE-goethite, MT=magnetite, HE=hemathite. Root Distribution: M=root matting, m=many, c=common, a=abundant, ve=very few, f=few, n=none. Description: swgi=strongly weathered gravel impregnated with, swm=strongly weathered material, sbw=streaks of black and white, ncps=nearly continuous pressure surface, dis=discontinous iron seam, tp=thin plates,ts=thin sheets, c=cominon, sap=saprolite.
00o

87
Table 17. P sorption capacity of selected Oxisols.
Soil Series PresentClassification
ImportantSecondaryMinerals
ParentMaterial
P-sorbed at 0.2ppm P in supernatant (ppm)
Molokai Torrox 1:1 clays Basalt 30Wahiawa Eutrustox 1:1 clays Basalt 390Kapaa Gibbsiorthox Gibbsite
GoethiteBasalt 660
Source: Fox et al. (1968).

Table 18. Characteristics of pedons that are not accommodated by Item CDA of the proposed key to Orthox great groups.
88
Depth Horizon Clay CEC ECEC Root CommentsContent Distri-
(<.002mm) but ion-cm- C%) -meq/lOOg clay-
OX-49, Leptic Acrorthox, clayey, gibbsitic, isohyperthermic. Kolombanga- ra, Solomon Islands (Proc 2nd ISCW Part I, 1979, pp 181-182).
50-70% GI0-15 Al 35.8 18.7 1.7 s15-61 Alg - - ■ - vf61-71 AC 45.3 3.8 0.1 n71-+ AC 15.0 3.3 0.2
OX-50, Haplic Acrorthox, clayey, gibbsitic, isohyperthermic, Kolombanga- ra, Solomon Islands (Proc 2nd ISWC Part 1, 1979, pp 183-184).
0-10 All 52.8 44.5 8.7 m 40% GI and10-28 A12 - - f 35% KK28-81 B . 54.5 7.2 0.1 vf81-127r
- - n
OX-55, Tropeptic Eutrorthox, clayey. oxidic, isohyperthermic. BuaProv., Vanua Levu,, Fiji (Proc 2nd ISCW Part I, 1979, pp 193).
0-8 A 53.3 40.9 23.6 c 25-40% GI8-23 B 63.8 14.9 5.8 f 15-30% KK
30-45 C 75.0 7.2 2.8 f
a - CDA; Orthox that have within 1.25 m of the mineral surface sheets that contain 30 percent or more gibbsite or a subhorizon that has 20% or more by volume gravel-size aggregates that contain 30 percent or more gibbsite.
Root Distribution: m=many, c=common, s=some, f=few, n=none.Commonts: GI=gibbsite, KK=kaolinite.
however, shows that some "Gibbsl" great groups have oxidic rather than
gibbsitic mineralogy. These soils have 25 to 35 percent gibbsite and
30 to 35 percent goethite. This meant, therefore, that not all "Gibbsi"
great groups have gibbsitic mineralogy.
4.3.5.2. The Acrorthox - Item CDB (see Figure 16) of the key
to the great groups defines the Acrorthox as the other Orthox that have
apparent ECEC of less than 1.5 meq per 100 g clay in the oxic horizon
within 2 m of the soil surface. This was illustrated by Pedon OX-47 in
the Solomon Islands which is presently classified as Acrorthox (Table
2, Appendix IV). The properties conformed well with the definition.There were also some pedons presently classified as Haplorthox
that were placed in the great group of Acrorthox. This was illustra
ted by the Segamat series in Malaysia. The ECEC of less than 1.5 meq
per 100 g clay within 2 m of the soil surface placed it in the Acror
thox. The hue of 2.5YR in all horizons also illustrated the need for
a Rhodic subgroup in the great group Acrorthox.
Another important change in the proposed key to the suborder Or
thox is the deletion of the great group Umbriorthox, resulting to their
placement in the Acrorthox and to the Hap-lorthox. This was illustrated by the Makapili series (Table 4, Appendix IV). The other two pedons
of Umbriorthox like the Lawai and Puhi series were placed in the great
group Haplorthox on the basis of a udic soil moisture regime and an
apparent ECEC greater than 1.5 meq per 100 g clay (Table 4, Appendix
IV).The justification of the separation of the Makapili series from
the Lawai and Puhi series was viewed in terms of their generic factors
89
and their management properties CTable 5, Appendix IV). The parent
material of both Makapili and the Puhi series is basalt while the Lawai
series is collovium weathered from basic igneous rocks. The former
two soils were also closer with respect to elevation, MAR and MAT. The
Lawai series, on the other hand, receives more rainfall and is 0.2°C
cooler than the two pedons. Management wise, the Makapili and Puhi
series have similar productivity rating as evaluated by the Modified
Storie Rating Index (Land Study Bureau, LXB, Bui. 9, 1967). The Maka
pili and Puhi series have more properties in common than with the Lawai
series, suggesting that Item CDB that defines the Acrorthox seem to be
inadequate to separate the soils under consideration. Evidently, the
Makapili and Puhi series both have zero or positive delta pH while the
Lawai series did not, suggesting that the delta pH may be a useful cri
terion.
4.3.5.3. The Eutrorthox - Item CDC (see Figure 16) of the
key to the great groups defines the Eutrorthox as the Orthox that have
more than 35 percent base saturation by NH^OAc in all parts to a depth
of 1.25 m. This was illustrated by Pedon OX- 6 of the Latossolo Roxo
Eutrofico in Brazil, Pedon OX-4 of the Bayoman series, and Pedon OX-29
of the Matanzas series in Puerto Rico (Table 6, Appendix IV). The sub
group class of the latter 2 pedons, however, changed from Tropeptic to
Rhodic taxa.
The change from Tropeptic to Rhodic may not matter so much. It
depends on how the two taxa are defined. The initial intent of the
Rhodic taxon was to group soils that do not have serious problems of soil structure under cultivation. They are rhodic because they are
90
dark red (Smith, 1979). The structure is also carried in the name Tro-
peptic (Soil Taxonomy). The advantage of Rhodic is that it is quanti
tative. Tropeptic is qualitative. Rhod taxon is often associated with
abundant iron, but it has been shown that the red color is not always
correlated with high iron content (Isbell, 1959, and Paramananthan and
Lim, 1979).
4.3.5.4. The Kurorthox - Item CDD (see Figure 16) of the key
to the great groups of Orthox defines the Eutrorthox as the Orthox that
have more than 40 percent clay in the surface 18 cm, after mixing, and
a clay content increase with depth of more than 1.5 m within a thick
ness of 30 cm (i.e., kandic horizon).
It is intended to group together the youthful Oxisols (ICOMLAC CL
No. 6, 1980) and permits the clay Increase of an argillic or kandic
horizon In the order Oxisols. This was illustrated by the pedons in
Hitam Ulu, Sumatra and in the Southwest Ivory Coast (Tables 7 and 8 ,
Appendix IV). They were placed from the Haplorthox to the Kurorthox
to recognize the clay accumulation at the subsurface horizon that seemed
to influence their behaviour and uses.
Pedon ULT-9 of the Terra Roxa Estruturada Distrofico In Brazil Illustrated the change in classification from Ultisols to Oxisols.
The clay content that was more than 40 percent in the upper 18 cm, after
mixing, and the clay content increase with depth of more than 1 . 2 x
within a thickness of 30 cm qualified this pedon for a kandic horizon.
This was permitted in the order Oxisols by virtue of Item C.2 of the
key to the order category. Its placement in the Oxisols was supported by its properties that were influenced by the high specific surface of
91

the Fe-oxides (Proc. 1st ISCW, 1978) which was appropriately reflected
in the name "OX."
This was further illustrated by Pedon ULT-23 of the CAM soil of
the Benchmark Soils Project in Cameroon. Currently, it is a Typic Pa-
leudult, but it became a Typic Kurorthox by virtue of Item CDD. The
new placement may be viewed in terms of its very low weatherable mine
ral content and the delta pH that is more positive than -0.2 in some
horizons. These are features of soils that have undergone extreme
weathering and that the clay content increase is less important than
the oxic characteristics.
The provisions of Item CDD that defines the "Kur" great groups
are close to those of the kandic horizon, viz, the CEC <16 meq and
ECEC ^12 meq per 100 g clay, and clay increase of 1.2 x the overlying
coarser textured horizon. They only differ in clay content where the
"Kandi" great groups do not have >40 percent clay in the upper 18 cm,
after mixing. Therefore, it seems appropriate that the "Kur" should
be the "Kandic" great groups of Oxisols, in order to parallel the LAC
taxa of Ultisols and Alfisols.
4.3.5.5. The Haplorthox - Item CDE of the ICOMOX key to the Orthox great groups that defines the Haplorthox was illustrated by
Pedon ULT-69 in the Philippines with a clay content >40 percent and
an oxic horizon.
4.4. Suggested Amendments
Table 19 summarizes the key to the suborders of Oxisols as de
fined in Soil Taxonomy, the proposed revision by ICOMOX and the suggested amendments made in this study. Table 20 also shows the key to
92
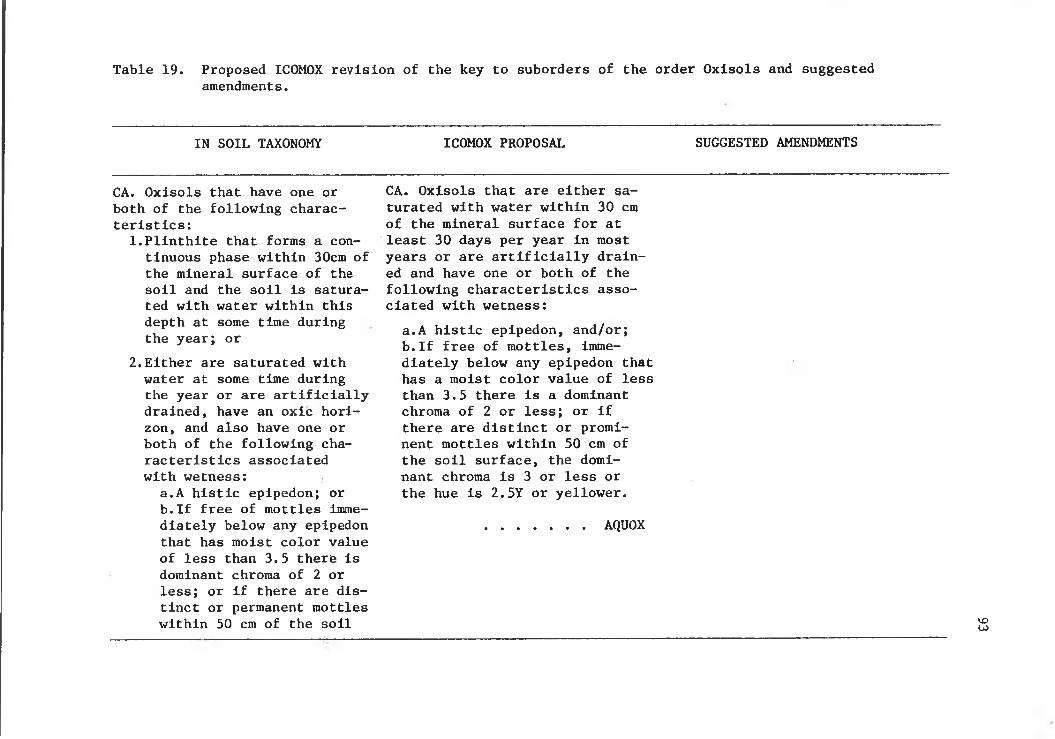
Table 19. Proposed ICOMOX revision of the key to suborders of the order Oxisols and suggestedamendments.
IN SOIL TAXONOMY ICOMOX PROPOSAL SUGGESTED AMENDMENTS
CA. Oxisols that have one or both of the following characteristics:
1 .Plinthite that forms a continuous phase within 30cm of the mineral surface of the soil and the soil is saturated with water within this depth at some time during the year; or
2.Either are saturated with water at some time during the year or are artificially drained, have an oxic horizon, and also have one or both of the following characteristics associated with wetness;
a.A histic epipedon; orb.If free of mottles immediately below any epipedon that has moist color value of less than 3.5 there is dominant chroma of 2 or less; or if there are distinct or permanent mottles within 50 cm of the soil
CA. Oxisols that are either saturated with water within 30 cm of the mineral surface for at least 30 days per year in most years or are artificially drained and have one or both of the following characteristics associated with wetness:
a.A histic epipedon, and/or;b.If free of mottles, immediately below any epipedon that has a moist color value of less than 3.5 there is a dominant chroma of 2 or less; or if there are distinct or prominent mottles within 50 cm of the soil surface, the dominant chroma is 3 or less or the hue is 2.5Y or yellower.
AQUOX
VOCO

Table 19 (Continued)
IN SOIL TAXONOMY ICOMOX PROPOSAL SUGGESTED AMENDMENTS
surface, the dominant chroma is 3 or less.
AQUOX
CB. Other Oxisols that have a torric moisture regime.
.......... TORROX
CC. Other Oxisols that:1. Have 16 kg or more organic carbon per square meter to a depth of 1 m, exclusive of organic surface litter;2'. Have weighted average base saturation in the oxic horizon (by NH4OAC) of >35 percent; and3. Have isothermic, thermic, or cooler temperature regime.
CB. Other Oxisols that have an arldlc (Torric) soil moisture regime.
............ TORROX
CC. Other Oxisols that:Have a mollic or umbric epipe- don and an organic carbon content of 16 kg or more per sq m to a depth of 1 m.
HUMOX
.HUMOX
CD. Other Oxisols that have an ustlc soil moisture regime and an Isothermic, thermic.
CC. Other Oxisols that have ustic soil moisture regime.
.............. USTOXV£)

Table 19 (Cont inued)
IN SOIL TAXONOMY ICOMOX PROPOSAL SUGGESTED AMENDMENTS
or warmer temperature regime.
......... USTOX
CE. Other Oxisols......... .ORTHOX
CD. Other Oxisols.
VOL n

Table 20. Proposed ICOMOX revisions of the key to the great groups and the suggested amendments.
IN SOIL TAXONOMY ICOMOX PROPOSAL SUGGESTED AMENDMENTS
KEY TO AQUOX GREAT GROUPS
CAA. Aquox that either have cemented sheets containing 30 percent or more gibbslte or have 20 percent or more by volume gravel-slze aggregates containing 30 percent or more glbbsite within 1 m of the mineral soil surface but that do not have plinthlte that forms a continuous phase within 30 cm of the soil surface.
....... GibbsiaquoxCAB. Other Aquox that have plinthlte that forms a continuous phase within 1.25 m of the soil surface.
Plinthaquox
CAA. Aquox that have within 1.25 m of the mineral soil surface sheets containing 30 percent or more glbbsite or a subhorizon that has 20 percent or more by volume, gravel-slze aggregates that contain 30 percent or more glbbsite.
.Gibbsiaquox
CAB. Other Aquox that have 35% or more clay in the oxic horizon and an apparent effective cation exchange capacity (NH4- OAc bases + KCl extr. Al)/% of less than 1.5 meq/lOOg clay in the oxic horizon and within 2 m of the surface.
CAA. Aquox that have acric soil materials within 1.5 m of the soil surface.
Acraquox
CAB............... Gibbsiaquox
Acraquox
CAC. Other Aquox that have an ochric epipedon.
Ochraquox
CAC. Other Aquox that have plinthlte forming a continuous phase within 1.25 m of the soil surface.
Plinthaquox
CAC............... Plinthaquox
ON

Table 20. (Continued)
IN SOIL TAXONOMY ICOMOX PROPOSAL SUGGESTED AMENDMENTS
CAD. Other Aquox.
Umbraquox
CAD. Other Aquox that have umb- ric, molllc or histic eplpedon.
CAE. Other Aquox.Umbraquox
Ochraquox
CAD.
CAE.
Umbraquox
Ochraquox
KEY TO TORROX GREAT GROUPS
CBA. Torrox are the Oxisols that have a torric moisture regime.
"The soils we know in this suborder are so similar that no subdivisions seem justified at the great group or subgroup levels. All are considered to be typic soils of the suborder."
CBA. Torrox that have an apparent effective cation exchange capacity of less than 1.5 meq/ 100 g clay in the oxic horizon within 2 m of the soil surface.
Akritorrox
CBB. Other Torrox that have more than 35% base saturated (pH 7) in all parts to a depth of 1.25 m.
CBA. Torrox that have base saturation (by NH4OAC at pH 7) <35 percent in the major part of the oxic horizon within a depth of 1.5 m.
■Dystorrox
CBB. Other TorroxHaplortorrox
Eutrotorrox
CBC. Other Torrox.
Haplotorrox VO
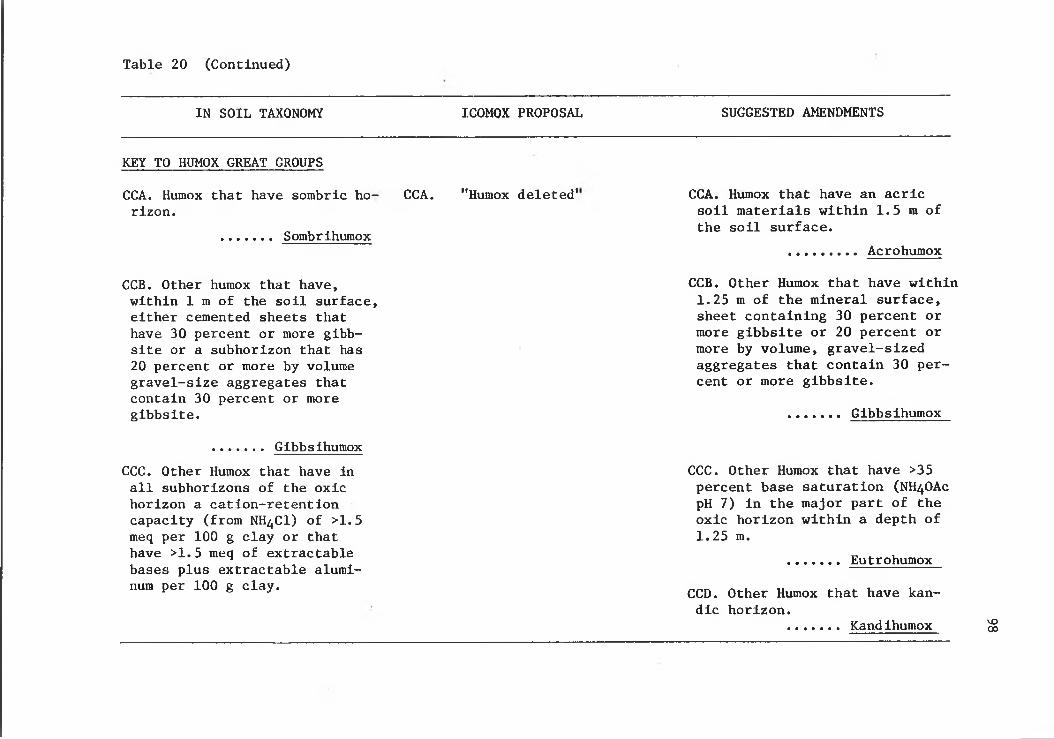
Table 20 (Continued)
IN SOIL TAXONOMY ICOMOX PROPOSAL SUGGESTED AMENDMENTS
KEY TO HUMOX GREAT GROUPS
CCA. Humox that have sorabric horizon.
Sombrihuraox
CCA. "Humox deleted' CCA. Humox that have an acric soil materials within 1.5 m of the soil surface.
Acrohumox
CCB. Other humox that have, within 1 m of the soil surface, either cemented sheets that have 30 percent or more gibbsite or a subhorizon that has 20 percent or more by volume gravel-size aggregates that contain 30 percent or more gibbsite.
CCB. Other Humox that have within1.25 m of the mineral surface, sheet containing 30 percent or more gibbsite or 20 percent or more by volume, gravel-sized aggregates that contain 30 percent or more gibbsite.
Gibbsihumox
GibbsihumoxCCC. Other Humox that have in all subhorizons of the oxic horizon a catlon-retention capacity (from NH4CI) of >1.5 meq per 100 g clay or that have >1.5 meq of extractable bases plus extractable aluminum per 100 g clay.
CCC. Other Humox that have >35 percent base saturation (NH4OAC pH 7) in the major part of the oxic horizon within a depth of1.25 m.
Eutrohumox
CCD. Other Humox that have kandic horizon.
....... Kand ihumox VO00

Table 20 (Continued)
IN SOIL TAXONOMY ICOMOX PROPOSAL SUGGESTED AMENDMENTS
CCD. Other Humox.Acrohumox
CCE. Other Humox.Haplohumox
KEY TO USTOX GREAT GROUPS
CDA. Ustox that have a sombric horizon.
... Sombriustox
CDB. Other Ustox that have a catlon-retention capacity (from NH^OCl) of 1.5 meq or less per 100 g clay in some subhorizon of the oxic horizon (or have 1.5 meq or less of extractable bases plus extractable aluminum per 100 g clay).
Acrustox
CDC. Other Ustox that have basesaturation of 50 percent ormore (by NH4OAC) in the majorpart of the oxic horizon ifthe particle size class isclayey or 35 percent or moreif the particle-size classis loamy. „ ^ Eutrustox
CCA. Ustox that have within 1.25 m of the mineral surface sheets that contain 30 percent or more gibbsite or a subhorizon that has 20 percent or more by vol. gravel-size aggregates that contain 30 percent or more gibbsite.
CDA. Ustox that have acric soil materials within 1.5 m of the soil surface.
Glbbsiustox
Akrustox
Eutrustox
Acrustox
CCB. Other Ustox that have an apparent effective cation exchange capacity of less than 1.5 meq/100 g clay in the oxic horizon within 2 m of the soil surface.
CCC. Other Ustox that are more than 35% base saturated (NH4OAC) in all parts to a depth of 1.25 m.
CDB............... Glbbsiustox
CDC. Other Ustox that have >35 percent base saturation (NH4OAC, pH 7) in the major part of the oxic horizon.
.... Eutrustox
CDD. Other Ustox that have a clay Increase of a kandic horizon.
... Kandlustox SO

Table 20 (Continued)
IN SOIL TAXONOMY ICOMOX PROPOSAL SUGGESTED AMENDMENTS
CDD.Other Ustox.Haplustox
CCD. Other Ustox that have more than 40% clay In the surface 18 cm after mixing, and a clay con - tent Increase with depth of more than 1 .2x within a thickness of 30 cm (i.e., kandic horizon).
CDE. Other Ustox.Haplustox
KurustoxCCE. Other Ustox.
Haplustox
KEY TO ORTHOX GREAT GROUPS
CEA. Orthox that have sombric horizon.
Sombriorthox
CEB. Other Orthox that have with in 1.25 m of the soil surface sheets that contain 30 percent or more gibbsite or a subhorizon that has 20 percent or more by vol. gravel-size aggregates that contain 30 percent or more gibbsite.
Gibbsiorthox
CDA. Orthox that have within 1.25 m of the mineral surface sheets that contain 30 percent or more gibbsite or a subhorizon that has 20 percent or more by vol. gravel-size aggregates that contain 30 percent or more gibbsite.
GibbsiorthoxCDB. Other Orthox that have an apparent effective cation exchange capacity of less than 1.5 meq/1 00 g clay in the oxic horizon within 2 m of the soil sur-
.................. Akrorthox
CEA. Orthox that have acric soil materials within 1.5 m of the soil surface.
Acrorthox
CEB. . . . .Gibbsiorthox
oo

Table 20 (Continued)
IN SOIL TAXONOMY ICOMOX PROPOSAL SUGGESTED AMENDMENTS
CEC. Other Orthox that1. Have in some subhorizon of the oxic horizon a cation- retention capacity of 1.5 meq or less (from NH4CI) per 100 g clay (or 1.5 meq or less extractable bases plus extractable aluminum per 100 g clay); and2. Do not have discernible structure in the oxic horizon or have only weak blocky or prismatic peds.
Acrorthox
CED. Other Orthox that do not have an anthropic epipedon and have base saturation of 35 percent or more (by NH^OAc) in the epipedon and in all subhorizons of the oxic horizon to a depth of at least 1.25 m.
CDC. Other Orthox that are more than 35% base saturated (NH^OAc) in all parts to a depth of 1.25 ro.
Eutrorthox
CDD. Other Orthox that have more than 40% clay in the surface 18 cm, after mixing, and a clay content increase with depth of more than 1 . 2 x within a thickness of 30 cm (i.e., kandic horizon).
Kurorthox
CDE. Other Orthox.
Haplorthox
CEC. Other Orthox that have ^35 percent base saturation (NH4- OAc, pH 7) in all subhorizons of the oxic horizon within a depth of 1.5 m.
Eutrorthox
CED. Other Orthox that have the clay increase of a kandic horizon.
....Kandlorthox
CEE. Other Orthox.
Haplorthox
Eutrorthox

the great groups of Oxisols in Soil Taxonomy, the corresponding pro-
posed revision by ICOMOX and the suggested amendments.
102

103
V. RESULTS AND DISCUSSION - LAC ALFISOLS AND ULTISOLS
The proposal that was tested is found in the review draft pre
pared by the SCS, dated June 1, 1983, based on the final report of
ICOMLAC. The proposed definition of the kandic horizon was first
tested, followed by the proposed key to the "Kandi" great groups. The
test for the criteria of the kandic horizon was done as illustrated
in Figure 17.
5.1. Testing the Criteria of the Kandic Horizon
5.1.1. The Charge Properties
The opening statement of the ICOMLAC's definition reads, "The Kandic horizon is a subsurface horizon which has a CEC <16 meq per 100 g clay (by NH^OAc) or have ECEC ^12 (svim of bases plus KCl extractable Al) in the fine earth fraction at a depth of 50 cm below the top of the horizon or immediately above a lithic, paralithic, or petroferric contact that is shallower."
Out of the 65 test pedons of LAC Ultisols, 13 have CEC >16 meq
per 100 g clay but have ECEC <12 meq per 100 g clay; 17 pedons have
ECEC >12 but have CEC <16 meq per 100 g clay; and 35 pedons have both
CEC <16 meq and ECEC <12 meq per 100 g clay. The 4 pedons of LAC Alfisols have CEC il6 meq per 100 g clay, but they all have ECEC <12 meq
per 100 g clay. The 2 LAC Mollisols have ECEC >12 meq but they both
have CEC ^16 meq per 100 g clay (Table 21). The LAC Inceptisols were
illustrated by the Uwala series, which had CEC <16 meq and ECEC <12
meq per 100 g clay (Table 22).
The result showed that all the test pedons met the charge charac
teristics of a Kandic horizon.
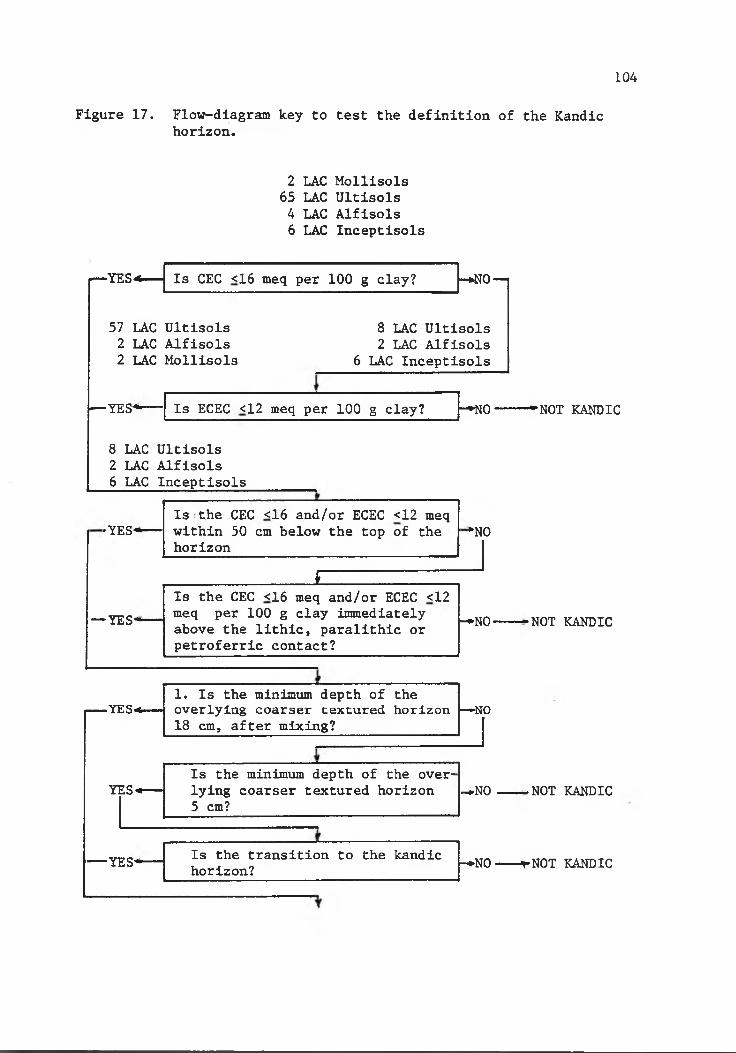
104
Figure 17. Flow-diagram key to test the definition of the Kandic horizon.
2 LAC Mollisols 65 LAC Ultisols 4 LAC Alfisols 6 LAC Inceptisols
r-YES*. Is CEC <16 meq per 100 g clay? - h.no —
57 LAC Ultisols 2 LAC Alfisols 2 LAC Mollisols
8 LAC Ultisols 2 LAC Alfisols
6 LAC Inceptisols
— YES Is ECEC <12 meq per 100 g clay? ■H^O' 'NOT KANDIC
8 LAC Ultisols 2 LAC Alfisols 6 LAC Inceptisols
•YES'
— YES-
Is the CEC <16 and/or ECEC <12 meq within 50 cm below the top of the horizon
’‘NO
£Is the CEC <16 meq and/or ECEC <12 meq per 100 g clay immediately above the lithic, paralithic or petroferric contact?
— NO- ■NOT KANDIC
1. Is the minimum depth of the ■YESH' — I overlying coarser textured horizon |— NO
18 cm, after mixing?
Is the minimum depth of the over-YESh lying coarser textured horizon
5 cm?
— YES*
— NO .NOT KANDIC
Is the transition to the kandic horizon? -♦NO t NOT kandic

105
Figure 17 (Continued)
Pangnga Chalong Mab Bon Ban Bong

106
Figure 17 (Continued)

Table 21 . Key attributes of selected pedons of LAC Mollisols. Source; SSIR No. 29, pages 104 and 108
Depth Horizon Organic CEC ECEC 15-Bar Base S o i -C o l o rCarbon (meq/lOOg clay) Water Saturation Moist Dry
-cm- (%) (%) (%)
Makawall series, Oxic Haplustoll, fine kaollnitic, isohyperthermic.0-18 Apl 2.44 18.9 27.0 24.4 100+ 10YR3/2 10R3/6
18-30 Ap2 1.35 12.3 16.6 24.1 100+ 10R3/3 10R3/430-60 B21 0.59 15.8 13.7 22.7 87 10R3/4 10R4/660-90 B22 0.37 15.9 15.6 23.9 98 10R3/4 10R3/690-150 B23 0.53 19.0 16.5 24.8 86 10B3/3 10R3/6
Pala series, Oxic Haplustoll, fine kaolinltlc, Isohyperthermic.0-28 Apl 1.85 32.6 40.5 27.3 100+ 5YR3/2 5YR3/3
28-48 Ap2 1.62 27.9 31.5 28.3 100+ 5YR3/2 5YR3/348-75 B1 0.70 19.8 19.3 26.6 100+ 5YR3/3 5YR3/475-103 B21 0 . 2 1 15.8 1 2 . 2 25.3 97 5YR3/2 5YR3/3103-133 B22 0 . 1 2 14.3 14.5 24.9 lOOf 5YR3/3 5YR3/4133-150 B23 0.28 14.2 14.2 25.4 99 5YR3/3 5YR3/4
o

108
Table 22. Key attributes of the Source; SSIR No. 29,
Uwala series, a LAC Inceptisols. 1979, page 92.
Depth Horizon Organic CEC ECEC 15-Bar BaseCarbon (meq/lOOg clay) Water Saturation
(cm) C % ) (%) (%)
0-18 Apl 1.70 20.9 9.5 22.7 3918-38 Ap2 0.90 17.0 9.8 25.2 5738-75 B2 0.61 16.4 10.9 29.2 6575-110 B3 0.45 15.5 1 1 . 0 32.1 67110-150 C 0.70 16.2 1 0 . 8 29.0 61

5.1.2. The thickness of the surface horizon
Item 1 of the summary of properties of the kandic horizon reads, "The kandic horizon has a coarser textured surface horizon. The minimum thickness of the surface horizon is 18 cm, after mixing or 5 cm if the transition to the kandic horizon is abrupt."
This provision is intended to exclude soils with very thin coarser
textured surface horizons because they can easily be altered by culti
vation practices which result in a sudden change in classification
(Moormann, personal communication).
Pedon ULT-29 of the Daobli series in Southwest Ivory Coast illus
trated the significance of this provision. The A horizon is 5 cm thick
and has 41.0 percent clay that decreases to 21 percent in the Bll hori
zon within 19 cm from the surface (Figure 18). Without mixing the sur
face 18 cm, the overlying coarser textured horizon (OCTH) would be 41.0
percent and the required clay content increase for recognition of an
argillic horizon is 49.0 percent (Point B). This point is reached with
in a vertical distance of more than 65 cm which is too deep. But if
the upper 18 cm is mixed, as in plowing, the clay content of the OCTH
is 26.8 percent and the required Increase in clay content for the kan
dic horizon is 32.1 percent (Point A). This point is reached withina vertical distance less than 12 cm and so the subsurface layer can
qualify as a kandic horizon. It means, that without mixing the surface
18 cm, the soil becomes an Oxisol, but when mixed, it could be placed
in the "Kandi" great groups of Ultisols.
5.1.3. The rate and amount of clay increase
Item 2 reads, "The Kandic horizon has more total clay than the overlying horizon and the Increased clay content is reached within a vertical distance of 12 cm or less.
2.1. If the horizon, overlying the kandic horizon has less than 20 percent total clay in the fine-earth fraction, the kandic horizon must contain at least 4 percent more clay.
109

110
% Clay
§
Cl.(UQ
Figure 18. Clay content of the Daobli series in the Southwest Ivory coast showing the depth of the required clay increase of a kandic horizon.

2.b. If the horizon, overlying the kandic horizon has more than 20 percent total clay in the fine-earth fraction, the ratio of clay in the kandic horizon to that in the overlying horizon must be 1 . 2 or more, or the kandic horizon must contain at least 8 percent more clay."
Pedon EPT-10 (SV 2/4), a Tropaquept in Lampung, Sumatra illus
trated the significance of the above provision by excluding the LAC In-
ceptisols from the LAC Ultisols and Alfisols. It had 27 percent clay
in the OCTH and it met the required clay content increase but the ver
tical distance was more than 12 cm. Hence, it did not meet the require
ment of a kandic horizon. The other 5 LAC Inceptisols also did not meet
the required clay content increase (Table 1, Appendix V). The LAC Mol-
lisosl, on the other hand, were separated from the LAC Alfisols by key
ing out first the former with a mollic epipedon (Table 21).
Pedon ULT-64 of the Pak Chong series in Thailand illustrated the
change in classification from Ultisols to Oxisols on account of the
provision of Item 2 where the vertical distance is >12 cm (79 cm). The
clay content that was >40 percent in the surface 18 cm, after mixing,
and the oxic characteristics placed Pedon ULT-64 in the Oxisols.
The Kabin Buri (Haplustults) in Thailand and the Drasa series
(Haplustults) in Fiji (Table 23) illustrated a different case. Like the Pak Chong series, they met the required clay content increase and a vertical distance to the overlying horizon that was more than 12 cm
but not greater than 30 cm, thus an argillic horizon was present. While
the clay content was >40 percent in the upper 18 cm, after mixing, they could not be placed in the Oxisols because Item C.2 of the ICOMOX’S key
definition to the order Oxisols does not accommodate argillic horizons
that have CEC <16 meq or ECEC ^12 meq per 100 g clay. It could not be
placed in the LAC Ultisols because the clay content was >40 percent
Ill

Table 23. Calculated data of LAC Ultisols used to test the definition of the Kandic horizon.
Soil Series or pedon
PresentClassification
Thickness of kandic horizon
(cm)
ClayContent
Requiredclay
increase
(%)
Amount of clay Increase
(%)
Vert.dist.bet.OCTH &FTSH(cm)
Depth of upper bdry. of the kandic hor.
(cm)
OCTH
(%)
FTSH
(%)
U.S.A.1. Faceville Paleudults 139 6 . 0 19.1 1 0 . 0 13.1 2.5 2 12. Grady Paleaquults 98 40.9 52.7 49.0 1 1 . 8 2.5 203. Cecil Hapludults 99 13.9 33.2 17.9 19.3 6 234. Dunmore Paleudults 105 18.1 58.2 2 2 . 1 40.1 2.5 2 15. Marlboro Paleudults 108 3.6 2 1 . 2 7.6 17.6 2.5 19
PUERTO RICO
6. Jagueyes Tropudults 142 2 0 . 1 32.0 24.1 11.9 6 . 397. Llmones Tropohumults 18 48.5 59.0 24.1 10.5 5 23
THAILAND8. Pak Chong Paleustults 122 83.9 93.7 91.9 9.8 79 599. Banchong Paleustults 123 56.6 67.4 64.6 1 0 . 8 2.5 2010. Kabin Burl Haplustults 1 1 0 48.3 63.2 56.3 14.9 13 3111. Mab Bon Paleustults 177 18.4 29.9 22.4 11.5 5 2312. Chalong Plinthustults 160 15.5 21.4 19.4 5.5 2.5 2013. Warin Paleustults 178 6.9 13.9 10.9 7.0 6 3214. Yasothon Rhodustults 132 5.4 15.8 9.4 10.4 1 2 6815. Phangnga Paleudults 160 23.0 37.1 27.4 14.1 2.5 2016. Kho Hong Paleudults 130 1 2 . 2 17.5 16.2 5.3 6 29OCTH= overlying coarser textured horizon, FTSH= textured subsurface horizon.

Table 23 (Continued)
Soil Series or pedon
PresentClassification
Thickness of kandic horizon
(cm)
Clay.Content
Requiredclay
Increase
(%)
Amount of clay increase
(%)
Vert.dist.bet.OCTH &FTSH(cm)
Depth of upper bdry. of the kandic hor.
(cm)
OCTH
(%)
FTSH
(%)17. Khlong Chak Paleudults 190 28.7 53.0 34.4 24.3 2.5 2018. Songkhla Paleaquults 143 12.4 31.0 14.4 18.6 6 4319. Khorat Haplustults 117 5.5 17.6 9.3 1 2 . 1 6 61BRAZIL20. BR3 Haplustults 122 14.2 24.0 18.2 9.8 12 4621. BR4 Palehumults 257 23.8 42.0 28.6 18.2 12 3322. BR8 Palehumults 31 48.7 59.0 56.7 10.3 2.5 2523. BR20 Fragiudults 81 9.7 18.1 13.7 8.4 1 2 7624. BR23 Paleudults 230 30.9 46.5 37.1 15.6 6 4625. BR27 Paleudults 214 19.8 44.0 23.8 24.2 2.5 4626. BR30 Paleudults 179 8 . 8 32.6 1 2 . 8 23.8 6 41MALAYSIA27. Lanchang Paleudults 218 37.8 58.2 45.4 20.4 2.5 1928. Kening Paleudults 231 28.5 36.9 34.2 8.4 2.5 1929. Bungor Paleudults 205 18.1 30.7 2 2 . 1 1 2 . 6 2.5 13HAWAII30. Haiku taxadjunct Tropohumults 141 62.5 96.0 70.5 33.5 2.5 3431. Pauwela Tropohumults 47 60.3' 88.3 68.3 28.0 12 36SUMATRA32. Sijau Paleudults 130 53.1 62.0 61.1 8 . 8 6 2433. Sijau Tropudults 128 73.3 87.5 81.3 14.6 6 2234. Dalek Tropudults 91 22.3 27.0 30.3 4.7 2.5 1935. MU-7 Tropaquults 61 25.0 33.0 30.0 8 . 0 6 26

Table 23 (Continued)
Soil Series or pedon
PresentClassification
Thickness of kandic horizon
(cm)
ClayContent
Requiredclay
increase
(%)
Amount of clay Increase
(%)
Vert.dist.bet.OCTH &FTSH(cm)
Depth of upper bdry. of the kandic hor.
(cm)
OCTH
(%)
FTSH
(%)
36. MU-11 Tropudults 100 38.6 49.0 46.3 1 0 . 0 2.5 1737. MU-13 Tropudults 90 30.4 39.0 36.5 8 . 6 2.5 14BNAGLADESH38. Tejgaon Paleudults 39 35.1 49.0 42.1 13.9 15 48IVORY COAST39. Bedoule Paleudults 136 26.0 36.5 31.2 10.5 8 2340. Daobli Paleudults 196 21.3 50.1 32.8 28.8 6 4441. Gloaumo Paleudults 140 9.2 15.7 13.2 6.5 8 2742. Guire Paleudults 200 6.5 34.8 10.5 28.3 1 2 4043. Kolea Paleudults 207 2 1 . 8 58.4 26.1 36.6 1 2 4344. Malan Pllnthudults 42 44.5 56.3 53.4 1 1 . 8 6 3645. Nelra Paleudults 182 41.8 51.0 49.8 9.2 6 3346. Niagui Paleudults 98 9.4 13.9 12.4 4.5 2.5 3747. Nonoua Paleudults 234 34.3 63.7 41.3 29.3 2.5 1348. Saoa Paleudults 197 14.4 29.5 17.2 15.1 6 4349. Tabou Pllnthudults 124 23.9 32.0 28.7 8 . 1 6 34FIJI50. Koronlvla Tropodults 59.5 37.0 69.0 44.5 32.0 2.5 4051. Mokarabo Haplustults 156.0 27.0 36.0 32.4 9.0 1 1 2452. Drasa Haplustults 75 44.2 54.0 53.1 9.9 17 50Sources; U.S.A. = SSIR Nos. 15 (1967) and 16 (1967); Puerto Rico* SSIR No. 12 (1967); Thailand* Proc.2nd ISCW, Part II (1979); Brazil* Proc. 1st ISCW (1978); Malaysia* Proc. 2nd ISCW, Part II (1979); Hawaii* SSIR No. 29 (1976); Sumatra* Williams and Harding (1979) and SRL (1975); Ivory Coast* Soil Survey of the Southwest Region, Ivory Coast (1978); Fiji* Morrison and Leslie (1981).

(Item C.l). They could not be placed in the LAC Inceptisols because
they have argillic horizon or in the LAC Mollisols because they have
no mollic epipedon.
A question then arises, relative to the intent of Item C.2 of
the ICOMOX'S key definition of the order Oxisols, wherein the advanced
stage of weathering in fine textured soils (>40 percent clay) as evi-
dneced by the low activity of the clay is more important than the evi
dence of clay movement in the kandic or argillic horizon. Here, the
oxic horizon takes precedence over the argillic and therefore, it
should be placed in the Oxisols. Several alternatives, however, are
suggested. One is to modify the provision of Item 2, such that the
rate of clay increase may be the same as that of the argillic horizon,
which is <30 cm. In this respect, the kandic horizon may be recognized
with >40 percent clay in the upper 18 cm. By this modification, the
Kabin Buri series qualify for a kandic horizon. Having a kandic horizon and with clay contents >40 percent, it can be accommodated in the
order Oxisols. Here, the intent is to bring the argillic horizons
with LAC into the kandic horizon. Another alternative is to define
Item C.2 of the Oxisols criteria, as "Have 40 percent or more clay in the upper 18 cm of the soil, after mixing, and an oxic horizon that
met the clay content increase of a kandic or argillic horizon."
In Table 23, column 7, the amount of clay content increase in the
pedons having less than 20 percent clay in the overlying coarser tex
tured horizon(s) ranged from 4.5 to 30.1 percent, while those having
more than 20 percent ranged from 8.0 to 36.6 percent. The data seemed to indicate that the absolute value of clay increase of 4 percent in
115

the kandic horizon for soils having less than 20 percent clay in the
overlying coarser textured horizons or 8 percent more clay in the kan
dic for soils more than 20 percent clay were appropriate. The ratio
nale for these limits is that the increase in absolute amount of clay '
of less than 4 percent is not consistently observable in the field for
the coarser textured soils. In the same manner, the absolute increase
of 8 percent more clay is about the minimum that could be consistently
observed in the field for the finer textured soils (Smith, as Inter-2/viewed by Leamy, 1978).—
5.1.4. The thickness of the horizon
Item 3 requires that, "The kandic horizon should have a thickness of at least 30 cm, or at least 15 cm if a lithic, parallthic, or petro- ferric contact occur within 50 cm of the mineral soil surface."
The Llmones series in Puerto Rico was the only soil that did not
meet the thickness criterion. It had 45.5 percent clay content in the
surface 18 cm, after mixing, and satisfied the required clay increase
of 1,2 X (58.5 percent) which was reached within a vertical distance
of 5 cm, but it was too thin (<18 cm) to be a kandic horizon. It was
placed in the order Oxisols by virtue of Item C.2 of the key definition
of the order Oxisols. The new placement may be justified by the thin layer of clay accumulation which may not be sufficient to exert signi
ficant influence associated with the kandic or argillic horizon, and
therefore, the effect of the oxic material takes precedence.
5.5.5. The stratification and organic matter distribution
Item 4 reads, "The layers or horizons, overlying the kandic horizon do not show fine stratification, and the organic carbon content do not decrease irregularly with increasing depth."
116
l! Leamy, M. (1978). Conversations in Taxonomy, New Zealand Soil News. Vol. 26, No. 6, 1978.
Several pedons of Ultisols having low activity clays did not satis
fy the requirement such as Pedons ULT-25 of the Chalong, ULT-51 of the
Mab Bon and ULT- 6 6 of the Phangnga series in Thailand (Table 1, Appen
dix VII). They illustrated a carbon content that decreases irregularly
with increasing depth. By the ICOMLAC definition, these soils did not
qualify for a kandic horizon nor did they qualify for an oxic horizon
because of the abrupt upper textural boundary. Neither could they qua
lify for the LAC Inceptlsols because of the presence of an argillic ho
rizon. Perhaps they may be placed in the kandic subgroups of Ultisols,
These will be the Ultisols that have low activity clay that do not meet
the definition of a kandic horizon. It is reported that Ultisols in
Thailand occur in all landforms and on a wide range of parent mate
rials. It is possible that these pedons occur between the landforms
in organic matter and in fans of old alluvium or collovium that may
result to the organic carbon content that decrease irregularly with
depth (Proc. 2nd ISCW, Part II, 1979). This kind of soil-landscape
relationship seem to favor their placement at the subgroup level.
5.1.6. The clay skinsItem 5 requires that, "A kandic horizon lacks clay skins that are
thick and continuous in all parts, and the cross section should have <5 percent oriented clay to a depth of 125 cm below the mineral soil surface or 75 cm below the top of the kandic horizon whichever is deeper."
Three test pedons in the Southwest Ivory Coast did not meet the criterion. Pedon ULT-47 of the Kolea series, illustrated this with
thick and continuous clay skins but has an argillic horizon that has
CEC by NH4OAC <16 meq per 100 g clay. Since the clay content is <40
percent in the surface 18 cm, after mixing, the clay content increase
117

in the argillic horizon takes precedence over the advanced weathering
condition, as evidenced by the low activity of the clay and,, therefore,
it may be placed in the "Kandi" great groups. This suggest the dele
tion of Item 5 since the clay skin criterion is too subjective.
5.1.7. Depth of Top of the Kandic Horizon
In place of the clay skin criterion, it is suggested that the
depth requirement of the top of the kandic horizon as described by
ICOMLAC in the review draft (SCS, 1983) be Included in the summary of
properties.
"The top of the kandic horizon is normally within one of the fol
lowing depths:
a. If the clay content of the surface horizon is 20 percent or more, the upper boundary is at a depth of less than 100 cm from the mineral soil surface.
b. If the clay content of the surface horizon is less than 20 percent and the particle size class (of part or all of the upper 100 cm) is finer than sandy or sandy skeletal, the upper boundary is at a depth of less than 125 cm from the mineral soil surface.
c. If the particle size class of the upper 100 cm is sandy or sandy skeletal, the upper boundary is at a depth between 100 cm and 200 cm from the mineral soil surface in most of the pedon."
All test pedons inet the above requirements.The result of the test for the proposed criteria for the kandic
horizon is summarized in Table 24. The 2 LAC Mollisols, 6 LAC Inceptisols and 11 LAC Ultisols that did not meet some of the requirements
illustrated the appropriateness of the proposal. However, the LAC
Ultisols that did not qualify for a kandic horizon indicated the need
for certain modifications as shown in Table 24.
118

Table 24. Result of test of the ICOMLAC*s proposed diagnostic properties of the Kandic horizon.
ITEM NO. PROPOSED SUMMARY OF PROPERTIES RESULT OF TEST REMARKS
OpeningStatement
The kandic horizon is a subsurface horizon which has a CEC il6 meq per 100 g clay (by NH^OAc) or have ECEC ^ 12 (sum of bases plus KCl extractable Al) in the fine earth fraction at a depth of 50 cm below the top of the horizon or immediately above a li- thick, paralithic, or petroferric contact that is shallower.
The kandic horizon has the following properties;
All test pedons met the limits for the charge properties.
1 A coarser textured surface horizon. The minimum thickness of the surface horizon is 18 cm after mixing or 5 cm if the transition to the kandic horizon is abrupt.
All test pedons met the criterion.
2 More total clay than the overlying horizon and the increased clay content is reached within a vertical distance at 12 cm or less as follows;
1 LAC Ultisols and 1 LAC Inceptisols did not meet the criterion.
The LAC Ultisols was placed in the Oxisols by Item C.2 of the key definition of the Oxisols; Exclusion of the LAC Inceptisols was faborable.
2a If the surface horizon has less than 20 percent total clay, the kandic hd- rizon must contain at least 4 percent more clay; or
All test pedons met the criterion.
VO

Table 24. (Continued)
ITEM NO. PROPOSED SUMMARY OF PROPERTIES RESULT OF TEST REMARKS
2b If the surface horizon has more than 20percent total clay, the kandic horizon must have 1 . 2 times more clay than the overlying horizon or at least 8 percent more clay.
5 LAC Inceptisols and The criterion is use-2 LAC Mollisols did ful to exclude the LACnot meet the criterion. Mollisols and LAC In
ceptisols.
A thickness of at least 30 cm, or at least 15 cm if a lithic, paralithic or petroferric contact occur within 50 cm of the mineral soil surface.
The layers or horizons overlying the kandic horizon do not show fine stratification and the contents of organic carbon does not decrease irregularly with increasing depth.
One (1) test pedon did not meet the criterion.
Four (4) test pedons did not meet the criterion.
The excluded pedon was placed in the Oxisols by virtue of Item C.2 of the key definition of the order Oxisols.These pedons may be placed in the Kandic subgroups.
Lacks clay skins that are thick and continuous in all parts, and the mineral soil surface or 75 cm below the top of the kandic horizon, whichever is deeper.
Three (3) test pedons did not meet the criterion.
The criterion is subjective and a constraint to LAC Ultisols.

5.2. Suggested Addendum to the Key Definition of the order Ultisols
The key definition of the order Ultisols in Soil Taxonomy, p 92
needed a provision to accommodate the LAC Ultisols that were proposed
to be identified with the newly introduced kandic horizon.
This was done in Item F.l of the key to soil orders, by inser
ting the phrase, "or a kandic horizon," after the words, "Have an ar
gillic....," to read, "Have an argillic or a kandic horizon but not a
fragipan and have base saturation (by sum of cations) of <35 percent
within the following depths."
5.3. Key Definition to the Great Groups of LAC Ultisols
The proposed keys to suborders, great groups and subgroup that
were tested were obtained from the review draft of a proposal for re
classification of Ultisols and Alfisols with low activity clays by the
SCS, based on the final report of the ICOMLAC, dated June 1, 1983.
In the key to the suborders of Ultisols, ICOMLAC deleted the
Xerults in Soil Taxonomy.
The great groups Tropaquults and Umbraquults of the suborder
Aquults in Soil Taxonomy were deleted. Similarly, the Palehumults and Tropohumults of the suborder Humults as well as the Tropudults in the
suborder Udults were also deleted.
The ICOMLAC key to the great groups recognizes two LAC Ultisols.
One has a deeply developed kandic horizon (Kandi) and the other has a
less deeply developed kandic horizon (Kandhapl). The two LAC great
groups parallel the present "Pale" and "Hapl" great groups in the various suborders of the Ultisols.
121

The advantage of segregating the LAC great groups into the more
developed and the less developed taxa may be related to the deeper ac
cumulation of the clay in the "Kandi" great groups which may be more
suitable for farm ponds than the less developed "Kanhapl" great group
(Figure 19).
On the other hand, the "Kanhapl" great group may perform better
for septic tank than the "Kandi" great group because there is less clay
accumulation with depth that would permit better filtering effect. In
terms of crop performance, the less deeply developed textural differen
tiation of the Kanhapl may have less ability to retain soil moisture
and plant nutrients, but this has yet to be supported with data.
Since Soil Taxonomy is not only for agriculture, but for other
purposes like engineering, the recognition of the "Kandi" and the
"Kanhapl" taxa may be,useful.
5.4. Testing the ICOMLAC Key to the LAC Ultisols
The placement of the LAC great groups in the key varied with sub-' orders but in general, the "Kandi" and "Kanhapl" taxa are keyed out
after the "Plinth", "Frag", "Alb", and "Sombr" great groups. They
were also keyed out before the "Pale", "Rhod", "Hapl", and "Ochr" great groups.
The ICOMLAC's key to the suborders of LAC Ultisols was tested as
illustrated in Figure 2D. The result of the test in Table 25 shows
that some of the "Pale" great groups were placed in the "Kandi" taxon
while the other LAC Ultisols were placed in the "Kanhapl taxon" parti
cularly the Trop taxa.
122
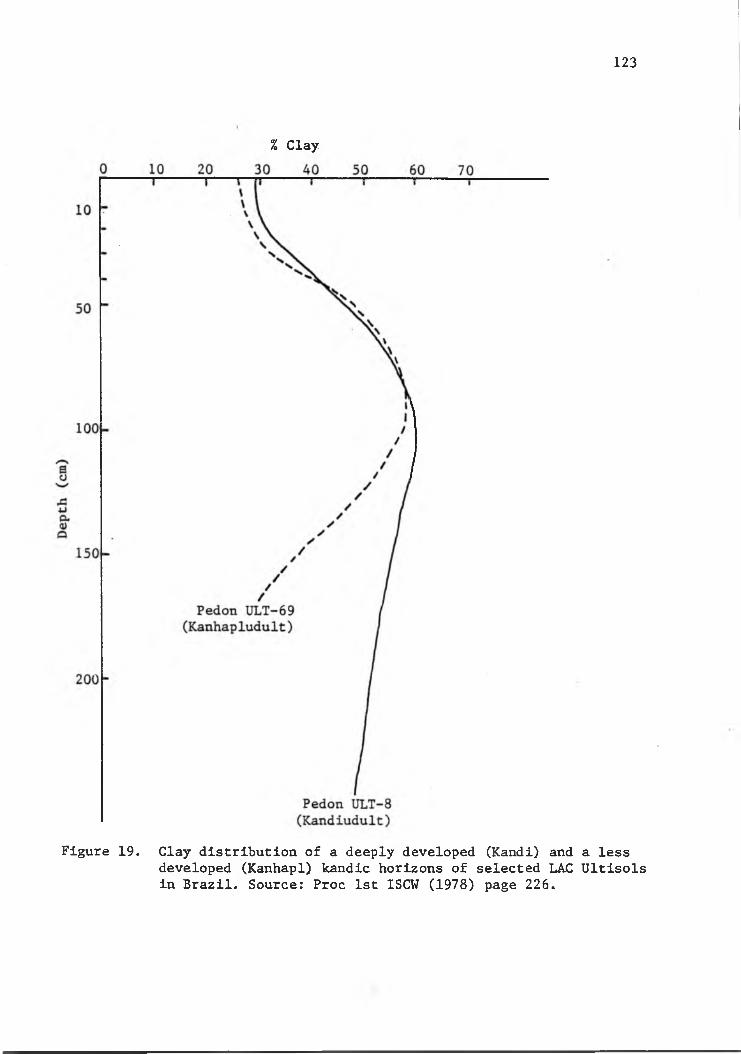
123
% Clay
Figure 19. Clay distribution of a deeply developed (Kandi) and a lessdeveloped (Kanhapl) kandic horizons of selected LAC Ultisols in Brazil. Source; Proc 1st ISCW (1978) page 226.

124
Figure 20. Flow-diagram to test the ICOMLAC's key to the subordersof Ultisols.
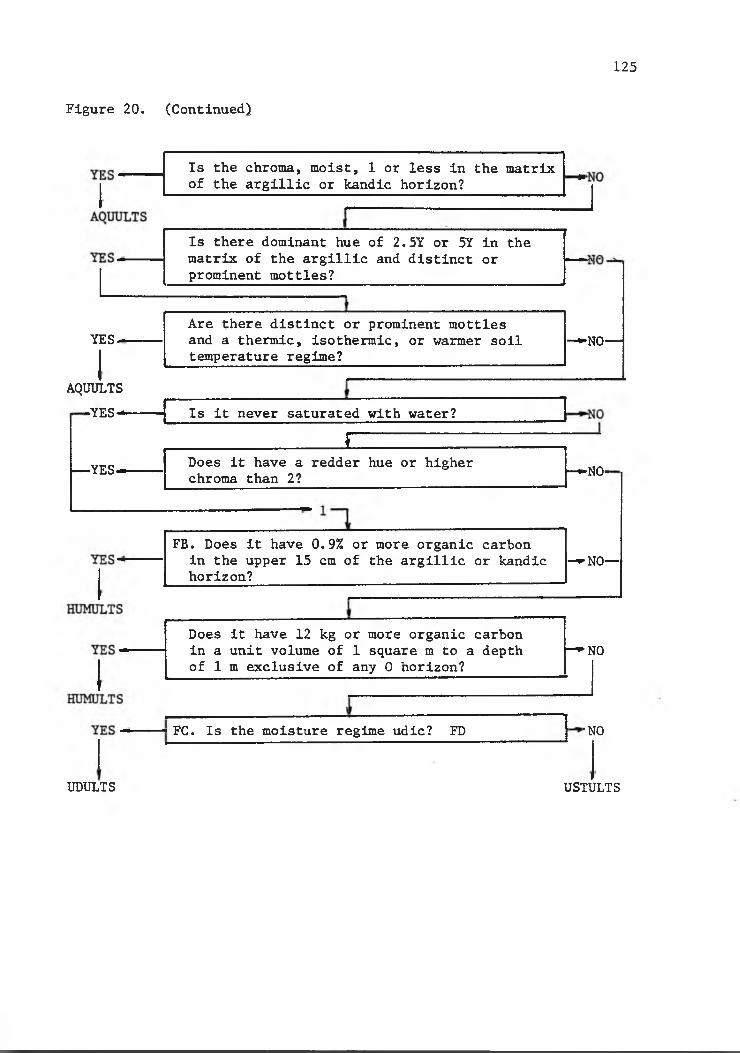
125
Figure 20. (Continued)
YES-
AQUULTS -YES-
— YES-
Is the chroma, moist, 1 or less in the matrix of the argillic or kandic horizon? ^
Is there dominant hue of 2.5Y or 5Y in the matrix of the argillic and distinct or prominent mottles?
Are there distinct or prominent mottles and a thermic, isothermic, or warmer soil temperature regime? ___
-»N0—
Is it never saturated with water?r
Does it have a redder hue or higher chroma than 2? h-— NO-
FB. Does it have 0.9% or more organic carbonin the upper 15 cm of the argillic or kandic -— NO— horizon?
Does it have 12 kg or more organic carbon in a unit volume of 1 square m to a depth h^NO of 1 m exclusive of any 0 horizon?
FC. Is the moisture regime udic? FD •NO
UDULTS USTULTS

126
Table 25. Result of tests of the kandi taxa of LAC Ultisols.
Pedon/Series
Suborder CLASSIFICATIONIn Soil Taxonomy In ICOMLAC proposal
Songkhla Aquults Paleaquults KandiaquultsMU-7 Aquults Paleaquults KandiaquultsKoronivia Humult s Tropohumults KanhapluhumultsULT-15 Udults Paleudults KandiudultsULT-19 Udults Paleudults KandiudultsSaoa Udults Paleudults KandiudultsToko Udults Paleudults KandiudultsGuire Udults Paleudults KandiudultsKolea Udults Paleudults KandiudultsGlouamo Udults Paleudults KandiudultsULT-14 Udults . . Tropudults . KanhapludultsMU-11 Udults Tropudults KanhapludultsMU-13 Udults Torpudults KanhapludultsMab Bon Ustults Paleustults KandiustultsULT- 8 Ustults Paleustults KandiustultsULT-4 Ustults Paleustults KandiustultsMocambo Ustults Haplustults Kanhaplustults

5.4.1. Testing the Kandiaquults and Kanhaplaquults
The ICOMLAC key to the great groups of suborder Aquults was tested
in accordance with the flow-diagram in Figure 21.
Pedon ULT-70 of the Songkhla series in Thailand illustrated Item
DAD CFigure 20) with a CEC <16 meq per 100 g clay which indicated the
predominance of low activity clays; a clay content of <40 percent
(12.4%) in the surface 18 cm, after mixing, and a clay content increase
of more than 4 percent that was reached at a vertical distance of <12
cm (6 cm) which defines LAC Ultisols.
It also illustrated the chroma, moist, of 2 or less; a color
value, moist, of <3.5 in the Al and; a dominant chroma, moist <2 in
coatings on the surfaces of peds and mottles within peds that distin
guish the Aquults. This was confirmed by the aquic features as shown
in the micromorphologlcal description at 100 cm depth in which iron
diffuses in the kaolinan or the matrix of the soil material resulting
in reddish features (Proc 2nd ISCW, Part II, 1979). It also illus
trated a chroma of 12 in some horizons (B21t) that defines an aerie
subgroup.
Pedon ULT-55 in Lampung, Sumatra illustrated the concept of the "Kanhapl" great group wherein the CEC is <16 meq and ECEC is <12 meq per 100 g clay and the percentage clay distribution decreases by as
much as 20 percent within a depth of 1.5 m from the surface (Table 26).
It also illustrated the color value, moist <3.5 in the Ap horizon that defines an umbric subgroup.
5.4.2. The Kandihumults and Kanhapluhumults
The ICOMLAC's key to the great groups of suborder Humults was
127

128
Figure 21. Flow-diagram to test ICOMLAC's key to Aquult great groups.

129
Figure 21 (Continued)
YES-
KANDIAQUULTS
Is the texture finer than loamy fine sand in some part of the argillic or kandic horizon? FAE
-s»NO—
KANHAPLAQUULTS
PALEAQUULTS OCHRAQUULTS

Table 26. Key attributes of Pedon ULT-53 that were used to test the LAC Aquults.
Depth
-cm-
Horizon Organic Carbon (%)
CEC(meq/lOOg
ECECclay)
BaseSat.(%)
Clay (<.002mm)
(%)
Texture Soil Color (moist)
ClaySkins
Mottles
0-26 Ap 3.95 69.2 7.2 4 25 scl 10YR3/1 - -
26-50 B21t 0.50 16.9 0 . 6 4 33 scl 10YR4/1-4/2 - -
50-65 B22t 0.40 8 . 8 0 . 6 7 52 c 10YR5/6 - 5YR5/865-90 C 0.25 7.8 0.4 4 57 c 10YR5/2-5/6 2.5YR4/6
o

tested in accordance with the flow-diagram in Figure 22.
In Soil Taxonomy, the Plinthohumults are keyed after the Palehu-
mults. ICOMLAC deleted the latter and introduced the "KANDI" taxa.
Pedon ULT-48 of the Koronivia series in Fiji illustrated the con
cept of the great group of Kanhaplohumults in which the clay content
was less than 40 percent in the upper 18 cm, after mixing, and a kandic
horizon was present. This supported its placement in the order Ulti
sols. It further demonstrated the 0.9 percent organic carbon content
in the upper 18 cm of the kandic horizon that defines the suborder
Humox, and finally illustrated the need to amend item FB in the key
to suborders in Soil Taxonomy, pp 350-351.
Here, it is suggested that the key definition of Humults be modi
fied by inserting the phrase, "or Kandic", after the word argillic, in
order to permit the LAC Humults to be keyed in the suborder category.
The amendment reads as follows:
FB. Have 0.9 percent or more organic carbon in the upper 15 cm
of the argillic or kandic horizon;
The Koronivia series also illustrated the percentage clay decrease from its maximum by more than 20 percent of that maximum with
in a depth of 1.25 m below the soil surface, which defines the "Kan-
hapl" great group of Humults.
The data of Pedon ULT-1 of the Alaeloa series, in Hawaii lent
support to the above pedon. It illustrated a clay content of less
than 40 percent and an ECEC <12 meq per 100 g clay which indicated a
kandic horizon. It was placed in the LAC Ultisols in consideration
with the base saturation by sum of cations <35 percent. It also
131

132
Figure 22. Flow-diagram to test ICOMLAC's key to Humult great groups.

illustrated the concept of the suborder Humults with the organic car
bon content >0.9 percent in the upper 18 cm of the argillic horizon.
The clay distribution that decreases to more than 20 percent from the
maximum within a depth of 1.5 m from the soil surface illustrated the
less deeply developed kandic or argillic horizon. But the Alaeloa
soil has thick and continuous clay skins. The ICOMLAC proposal recog
nizes the argillic horizon as the diagnostic horizon rather than the
kandic horizon. Here ICOMOX proposed that in addition to the kandic
horizon, an argillic horizon may also be used to define the LAC Ulti
sols if it has CEC il6 meq and/or ECEC il2 meq per 100 g clay.
In this study, it was suggested earlier that the clay skin cri
terion of the kandic horizon be deleted so that the argillic horizon
having low activity clays be placed in the kandic horizon.
5.4.3. Testing the Kandiudults and Kanhapludults
The ICOMLAC's key to the great groups of suborder Udults was tes
ted in accordance with the flow-diagram in Figure 23, using the test
pedons in Table 27.
The 3 pedons of Oxisols met the requirement of the Kandiudults.
This was illustrated by the Donie series which has clay content less than 40 percent and has a kandic horizon. The plinthic characteris
tics of this soil makes the clay content increase in the B horizon
very important because it helps retain moisture in the horizons where
it has 15 percent by weight of very fine ironestone gravel that in
creases to 65 percent with Increasing depth. Apparently the rela
tively higher clay content in the kandic horizon makes it capable to
sustain production of upland rice, maize, cassava, forage and pasture
133

134
Figure 23. Flow-diagram to test ICOMLAC's key to Udult great groups.

135
Figure 23, (Continued)
YES<-
KANDIUDULTS
Is there no lamellae in at least the upper 1 m of the argillic or kandic horizon? FCD
KANHAPLUDULTS
RHODUDULTS HAPLUDULTS

Table 27. Key attributes of selected Oxisols and Ultisols that were used to test the LAC Udults.
Depth
-cm-
Horizon OrganicCarbon
(%)
CEC ECEC BaseOof-(meq/1 0 0 g clay)Clay
(<.002mm) (%)
Texture Soil Coloi• Clay Skins
Mottles
Pedon OX- •k•12 of the Donie series, Plinthic Haplorthox, in Ivory Coast. Source; SSSR (1967).0-6 Al 1.9 68.5 21 8.9 si 10YR3/4 fw,tn -6 - 1 2 A3 1 . 2 39.5 10 11.4 cl 7.5YR4/6 fw,tn -
1 2 - 1 0 2 IIB23 0.3 3.9 3 45.7 gr.c 7.5YR5/6 mn,tn -190-248 lie 0 . 1 17.9 2 26.8 gr,c 7.5YR5/6 cn,tn —
Pedon OX-■1 of the Aburan series, Aquic Haplorthox, Sumatra. Source: SRI (1975).0-5 Ah 4.8 70.0 25.7 3 21 sc 7.5YR4/45-10 ABh 1.4 28.4 16.3 4 19 si 10YR6/3
10-33 Bwsl 0.5 12.4 9.2 3 25 sc 10YR6/433-102 Bws2 0.3 11.5 8.1 0 27 scl 10YR7/4 7.5YR5/6
102-130 Bg 0 . 2 11.4 8 . 6 0 22 scl 10YR7/4 10YR7/210R5/8
130-150 Bn 0 . 1 11.8 9.7 0 34 cl 10YR7/1 10YR7/6
Pedon OX-•5 of the Boka series, Plinthic Haplorthox, Ivory Coast . Source: SSSR (1967) •0-3 Al 8.4 8 8 . 6 83 39.2 gr,cl 5YR3/23-9 A3 3.5 50.6 60 32.2 gr.cl 5YR4/4
42-119 IIB22 0.3 12.8 29 51.4 c 2.5YR5/6 cm,mo,tk
*SSSR= Soil Survey of the Southwest Region, Republic of the Ivory Coast.Texture: sl=sllt loam, cl=clay loam, sc= silty clay, c= clay, gr« gravelly. Clay skins: fw=few, tn= thin, mn=many, cn= continuous, cm= common, mo= moderate, tk=thlck.
U)o

Table 27 (Continued)
Depth
-cm-
Horlzon OrganicCarbon(%)
CEC ECEC (meq/lOOg clay)
BaseSat.(%)
Clay(<. 002mm)
(%)
Texture Soil Color Clay Skins
Mottles
Pedon ULT--19 , "BR--30", Typic Paleudult, Pernambuco,, Brazil. Source: Proc . 1st ISCW (1978).0-15 Ap 0.69 59.7 2 2 . 8 39 5.7 s 10YR4/215-38 A2 0.47 29.4 6.4 2 1 10.9 Is 10YR5/338-62 B21t 0.40 14.7 3.7 16 32.6 scl 10YR6/3 5YR5/662-82 B23 0.35 13.7 4.6 13 35.1 scl 10YR6/4
1290-220 B3 0 . 2 0 1 1 . 2 2 . 6 6 31.2 sc 5YR6/6 2.5YR3/6
Pedon ULT--6 of the Saoa series', Plinthic Paleudult, Southwest Ivory Coast . Source SSSR (1967)0-5 All 1 . 6 72.7 31. 6 . 6 si 10YR3/25-14 A12 1 . 0 32.8 8 11.9 si 10YR4/3
14-40 B1 0.7 24.6 4 16.7 gr,scl 10YR4/440-61 B21 0.5 14.2 1 29.5 gr.sl 10YR5/8 cm,tn61-102 IIB22 0 . 2 1 2 . 8 7 37.4 sc 10YR5/8 cm,tn 5YR4/6
102-138 IIB23cn 0 . 2 13.8 5 39.8 c 10YR5/8 wk,tn 7.5YR5/6,5YR4/4
138-195 IIB24cn 0 . 2 6 39.6 sc 10YR5/8 wk,tn 10YR6/6,5YR4/6
Pedon ULT--74 of the Toko series. Typic Paleudult, Southwest Ivory Coast. Source: SSSR (1967) •0-4 All 6.3 85.1 54 24.8 gr,scl 5YR3/24-12 A12 2.4 41.9 44 21.7 gr,scl 5YR3/412-26 Bll 0 . 6 19.0 22 2 2 . 1 gr.cl 5YR4/626-38 B12 0.5 14.7 19 29.2 gr,cl 5YR4/6 fw,tn38-61 B21 0 . 6 12.5 19 52.6 gr,cl 2.5YR4/6 mn,tn61-88 B22cn 0.4 11.5 19 62.7 gr,cl 2.5YR3/6 cn88-156+ B23cn 0.3 12.7 17 61.3 gr,cl 2.5YR3/6 cn 00

Table 27 (Continued)
Depth
-cm-
Horizon OrganicCarbon(%)
CEC ECEC(meq/lOOg clay)
BaseSat.(%)
Clay (< . 002inin)
(%)
Texture Soil Color ClaySkins
Mottles
Pedon ULT-35 of the Glouamo series, Aquic Paleudult, Southwest Ivory Coast. Source; SSSR (1967).0-66-2121-4444-6666-7575-120
120-184
AlBllB12IIB21IIB22IIB23IIIB23
1.80.40.30.40.30.20.2
77.243.8 27.418.910.9 14.0 19.7
47252024343136
10.18.915.725.8 26.6 27.1 31.0
sisisclgr,sclgr,clclcl
10YR3/310YR4/410YR5/47.5YR5/67.5YR5/67.5YR5/610YR5/6
fw,tnfw,tnvtncm,mo,tkfw,tn 7.5YR8/2,
7.5YR7/4Pedon ULT-28 of Dalek series, Typic Paleudults, Sumatra. Source: Williams and Harding 1979)
0-33-1313-4444-6090-110
ApABBtlBt2Bt4
5.062.240.330.240.10
112.18.3 4.1 4.04.4
10014000
1921273038
11clclcl
10YR3/110YR6/310YR6/310YR6/37.5YR6/4
Pedon ULT-69 of the Sijaw series, Typic Paleudults, Sumatra. Source: Williams and Harding (1979)0-22-17
17-4242-116116-150
AhEhBtlBt2Bt3
6.870.980.550.430.30
43.110.67.6 6.16.6
40002
4254627071
ccccc
7.5YR4/210YR5/410YR6/610YR6/67.5YR6/6
cx>

Table 27 (Continued)
Depth
-cm-
Horizon Organic CEC ECEC Base ClayCarbon (meq/lOOg clay) Sat (<.002nmi)(%) (%) (%)
Texture Soil Color ClaySkins
Mottles
Pedon ULT--6, "MU-11", Orthoxic Tropudults, Sumatra. *Source: SRI (1975).0-17 Ap 2 . 2 2 27.1 28 38 sc 10YR3/1
17-28 B21t 0 . 8 6 14.3 17 49 c 7.5YR5.628-46 B22t 0.54 13.3 14 42 c 7.5YR5/646-73 B23t 0.46 12.7 8 49 c 7.5YR5/6-5/873-90 B2cn 0.43 13.2 8 47 c 7.5YR5/6-5/890-120 C 0.29 13.8 8 47 gr,c 7.5YR5/8
Pedon ULT--57, "MU-13", Orthoxic Tropudults, Sumatra. Source: SRI (1975).0-14 Ap 1.41 24.6 22 28 sc 10YR4/114-33 Bit 0.63 14.4 27 39 sc 10YR5/433-63 B21t 0.35 11.4 13 42 c 7.5YR5/663-89 B22t 0 . 2 1 10.5 9 55 c 7.5YR5/6-5/889-110 BC — — — — c 7.5YR6/8
* SRI= Soil Research Institute, Indonesia.
VO
as reported in the Soil Survey of the Southwest Region of the Ivory
Coast (1967).
Pedon ULT-19 in Pernambuco, Brazil illustrated the placement of
the Paleudults in the new great group of Kandiudults. This pedon il
lustrated the clay content of less than 40 percent in the surface 18
cm, after mixing, the presence of a kandic horizon, and the percentage
base saturation by sum of cations <35 percent, in addition to a udic
soil moisture regime and a clay distribution which did not decrease
from its maximum by as much as 20 percent of that maximum within a
depth of 1.5 m from the surface. This was supported by the data of
the other pedons in Table 27.
Pedons ULT-56 and ULT-57 illustrated the "Kanhapl" great group
of the LAC Udults showing the less deeply developed kandic horizons
with a clay distribution that decreased from the maximvim by more than
20 percent within 1.5 m from the surface (Table 27).5.4.4. Testing the Kandiustults and Kanhaplustults
The ICOMLAC's key to the great groups of Ustults was tested in
accordance with the flow-diagram in Figure 24, using the test pedons
in Table 28. The Pak Chong series, illustrated the placement from the Ultisols having CEC il6 meq and/or ECEC il2 meq per 100 g clay
that have clay contents >40 percent in the upper 18 cm of the soil
surface to the Oxisols.
The clay content of the Pak Chong series of more than 8 percent in the finer textured subsurface horizon was that of a kandic horizon,
but a kandic horizon cannot be used as a diagnostic horizon if theclay content of the eluvial horizon is >40 percent (SCS, Final draft
140

141
Figure 24. Flow-diagram to test ICOMLAC's key to Ustult great groups.

142
Figure 24 (Continued)
RHODUSTULTS HAPLUSTULTS

Table 28. Key attributes of selected pedons used to test the LAC Ustults.
Depth
-cm-
Horizon Organic Carbon (%)
CEC ECEC
(meq/lOOg clay)
BaseSat. (< (%)
Clay .002mm) (%)
Texture Soil Color ClaySkins
Mottles
Pedon ULT--64 of the Pak Chong series , Oxic Paleustults , Thailand. Proc. 2nd ISCW Part II (1978).0 - 1 2 Ap 1.64 19.3 13.1 57 83.3 c 2.5YR3/4
12-30 B21t 0.97 14.8 8.3 40 85.1 c 10R3/4 mo,tk30-53 B21t 0.56 13.1 7.1 17 89.6 c 10R3/4 mo,tk53-90 B22t 0.28 13.2 6.5 7 93.7 c 10R3/4 pc,mo,tk90-137 B22t 0.23 1 1 . 8 6.3 7 92.3 c 10R3/4 pc,mo,tk
137-160 B23t 0.34 1 1 . 6 6.3. 13 92.1 c 10R3/6 pc,tn
Pedon ULT--8 , "BR-4", Typic Paleustults, Rio de Janeiro , Brazil. Source: Proc. 1st ISCW (1978) •0 - 1 1 Ap 1.09 48.3 12.4 24.67* 17.30 gr,sl 10YR3/211-27 B3 0 .6 6 26.1 7.2 23.96 28.32 gr,scl 10YR4/3 cm,wk27-46 Bit 0.60 • 17.3 5.2 27.50 41.89 gr,c 7.5YR4.5/4 cm,wk46-77 B21t 0.48 17.4 5.4 23.96 49.53 gr,c 7.5YR4/4 cm, mo77-110 B22t 0.44 15.5 5.2 23.96 50.37 gr,c 7.5YR4/4 cm, mo
110-160f B23t 0.39 15.7 4.9 21.84 48.67 gr,c 7.5YR5/5 cm, mo 10R4/8Pedon "BR-16", Plinthic Paleustults.Sergipe , Brazil. Source; Proc. 1st ISCW (1978).
0-26 Al 1.37 35.1 9.7 21.13* 31.71 gr,sc 10YR4/2 7.5YR5/626-40 IIA3 0.84 25.5 7.3 14.06 37.65 c 10YR4/3 7.5YR5/640-88 IIB2t 0.37 16.8 5.4 7.69 43.59 c 10YR7/6 7.5YR6/888-168 IIIBtpl 0.17 18.1 7.8 5.57 37.65 c 10YR6/6 7.5YR6/8
Pedon ULT--58 of the Mocambo series. Oxic Haplustults, Viti Levu,, Fiji. Source: Proc. SPRFST (1981).0-24 Ap 0.9 19.26 1 0 . 0 38* 27 si 5YR3/324-69 Btl 0.3 13.61 10.3 75 36 cl 5YR5/8 fw69-109 Bt2 0 .2 2 2 .2 2 27.3 23 45 gr,c 5YR5/8
* Base saturation by NH^OAc. ** South Pacific Regional Forum on Soil Taxonomy.4

of proposal for reclassification of LAC Alfisols and Ultisols, 1983).
However, aside from the kandic horizon Item FDB (Figure 24) also em
ploys an argillic horizon to define the "Kandi" great groups if it has
a CEC <16 meq or ECEC <12 meq per 100 g clay. The presence of an ar
gillic horizon was supported by the micromorphological analysis showing
that clay translocation took place subsequent to deposition of the
oxic material, suggesting that an argillic horizon had developed in
oxic material (Proc. 2nd ISCW, Part II, 1979).
The case of this pedon has been discussed earlier in illustrating
the definition of the kandic horizon. There, the rationale was that
for heavy soils, the textural differentiation losses much of its signi
ficance, hence, the oxic characteristics takes precedence over the
clay content increase of the kandic or argillic horizons. However,
Item C.2 of the ICOMOX key definition to the order Oxisols excludes
the LAC Ultisols with argillic horizon. Therefore, if the above ra
tionale were to be adhered to, the definition of the kandic horizon
should be amended and include an argillic horizon having CEC <16 and/
or ECEC <12 meq per 100 g clay in the kandic horizon in order to de
lete argillic horizon with LAC in the definition of the kandi great groups of Ultisols. This can be done by modifying Item 2 of the definition of the kandic horizon by (a) changing the vertical distance
of 12 cm or less to 30 cm to reach the required clay content increase
as in the argillic horizon. This will place the LAC Ultisols having
argillic horizon in the "Kandi" taxa, and Item 5 of the definition
of the kandic horizon may be deleted to place the argillic horizon having CEC <16 meq and/or ECEC <12 meq per 100 g clay that have thick
144

and continuous clay skins in the kandic horizon. The above sugges
tions mean that the kandic horizon becomes an exclusive differentiae
for the LAC Ultisols as it was so intended.
Such modifications will also simplify the key definitions of the
charge properties of the "Kandi" great groups as illustrated below:
In the flow-diagram (Figure 24), Item FDB defines the charge
properties of the Kandiustults as,
"Have CEC <16 meq per 100 g clay (by NH4OAC) or have ECEC <12
(sum of bases plus KCl extractable Al) at a depth of 50 cm below the
top of the argillic."
If the above amendments are applied, the first provision of Item
FDB will be; "Have a kandic horizon." This will also hold true with
the LAC great groups of the other suborders of Ultisols.
Pedon ULT- 8 in Brazil Illustrated the usefulness of the kandic
horizon in placing the Paleustults to the great group Kandiustults.
It has a clay content of <40 percent in the surface 18 cm, after
mixing and a kandic horizon that placed it in the Ultisols order
(Table 28). The ustic soil moisture regime placed it in the suborder
Ustults. It illustrated the clay content distribution that did not decrease from its maximxim by as much as 20 percent of the maximum within a depth of 1.5 m from the soil surface that defines the Kandi-
ustult great group.
The less deeply developed LAC Ustults were illustrated by the
properties of Pedon ULT-58 of the Mocambo series in Levu, Fiji (Table
28). The clay content <40 percent in the surface 18 cm, after mixing,
and a kandic horizon placed this pedon in the order Ultisols and the
145

ustic moisture regime placed it in the suborder Ustults. The kandic
horizon and a clay content distribution such that the percentage clay
decreased from its maximum by as much as 20 percent of that maximinn
within a depth of 1.5 m from the soil surface illustrated the proper
ties that define the Kanhaplustult great groups.
5.5. Suggested Addendum to the Key Definition of the Order Alfisols
The key definition of the order Alfisols in Soil Taxonomy, p 93
needed a provision to key the "kandi" taxa. This was achieved by in
serting, "a kandic" after "Have an argillic," and before "or natric
horizon..." in Item H.l to read,
"H Other soils that
1. Have an argillic, a kandic or natric horizon but not
fragipan; or
2. Have a fragipan that
a. Is in or underlies an argillic, or
b. Meets all requirements of an argillic horizon, or
c. Has clay skins 1 mm thick in some parts
The suggested amendment was illustrated by Pedon ALF-1 in Rio
de Janeiro, Brazil with a kandic horizon that has a clay content <40 percent in the surface 18 cm, after mixing, and a base saturation that
has <35 percent.
5.6. Key Definition to the Great Groups of LAC Alfisols
The key definition for the LAC Alfisols that was tested was ob
tained from the same sources as that of the LAC Ultisols.
The "Kandi" and "Kanhapl" great groups were introduced to recog
nize the more deeply developed and the less developed kandic horizons
146

respectively.
Compared to the LAC Ultisols, the LAC Alfisols are proposed to be
defined with higher class limits of <24 meq and <16 meq ECEC per 100
g clay.
5.7. Testing the ICOMLAC'S Key to the LAC Alfisols
The placement of the LAC great groups in the key varied with the
suborders but in general, the "Kandi" and "Kanhapl" are keyed after
the "Plinth", "Natr", "Dur", "Fragi", "Glass", and "Alb" taxa. They
are also keyed before the great groups of "Umbr", "Pale", "Rhod", and
"Hapl".
5.7.1. The Kandiaqualfs
The key to the great groups of suborder Aqualfs in Soil Taxonomy,
p 109 was modified by ICOMLAC as follows:
H A A .................... Plinthaqualfs
H A B ........................................... Natraqualfs
H A C ........................................... Duraqualfs
HAD . Other Aqualfs that have CEC <24 meq per 100 g clay (by
NH4OAC) or have ECEC <16 (sum of bases plus KCl extractable Al) at a
depth of 50 cm below the top of the argillic or kandich o r i z o n ...................................... • • Kandiaqualfs
HAE ........................................... FragiaqualfsHAF ......................................... Glossaqualfs
H A G ........................................... Albaqualfs
H A H ........................................... Umbraqualf s
H A I ........................................... Ochraqualfs
Here, no pedons were available to test the above.
147

5.7.2. The Kandiustalfs and Kanhaplustalfs
The ICOMLAC key to the LAC great groups of Ustalfs was tested in
accordance with the flow-diagram in Figure 25.
Pedon ALF-2 in Alianca, Pernambuco, Brazil, illustrated the pro
visions of Item HCD of the Kandiustalfs with a kandic horizon that is
reached within a vertical distance of <25 cm from the overlying coar
ser textured horizon. The maximum clay content of 45.3 percent in the
B21t that decreased to 33.4 percent at B3t showed that the clay con
tent did not decrease to more than 20 percent.
Pedon ALF-2, on the other hand, illustrated Item HCE with a clay content decrease of >20 percent from the maximum.
The significance of the change in classification from Paleustalfs
to the Kandiustalfs may be viewed in terms of the accessory properties
of the extremely weathered Alfisols inferred in the kandi taxa as evi
denced by the low activity of the clay which may be more important
than the evidence of clay movement in the Paleustalfs.
5.7.3. The Kandludalfs and Kanhapludalfs
The ICOMLAC key to the LAC great groups of Udalfs was tested in accordance with the flow-diagram in Figure 26.
Pedon ALF-2 in Parana, Brazil illustrated the concept of the Kandludalfs. It has CEC >24 meq per 100 g clay, but because it has
ECEC <16 meq, it satistifed the charge requirement of a kandic hori
zon as per Item HEG, see Figure 26. Here, the Kandic horizon was not
used as a diagnostic horizon because it has more than 40 percent clay in the surface horizon after mixing the upper 18 cm of the soil sur
face (SCS, Review draft of proposal for reclassification of LAC
148
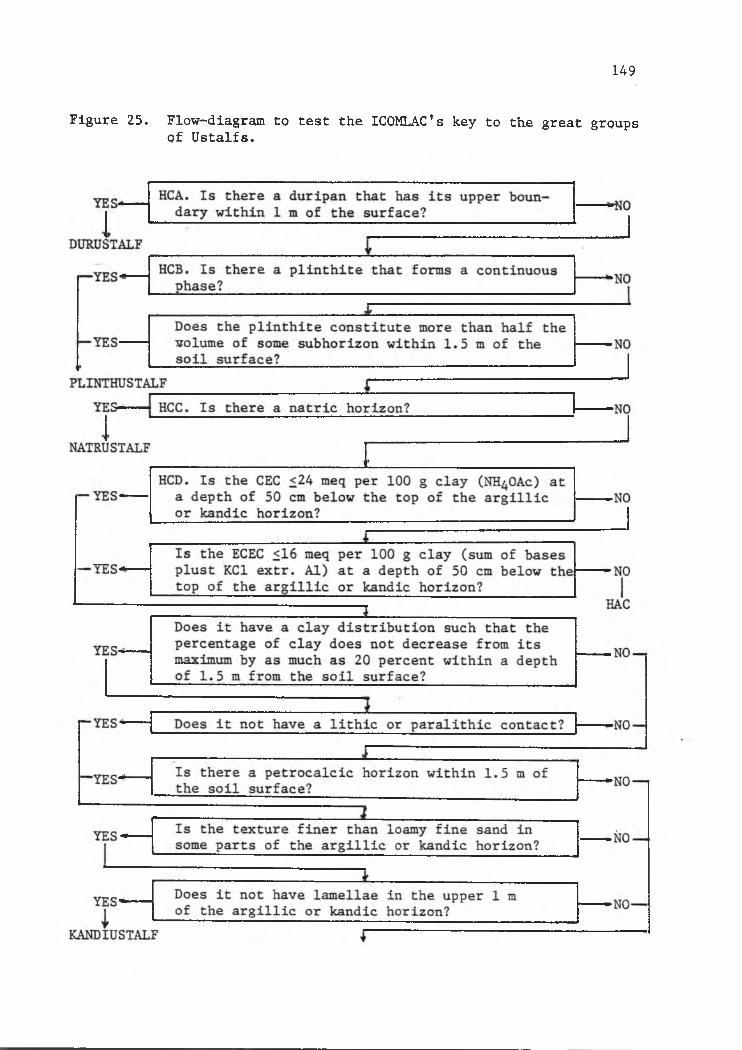
149
Figure 25. Flow-diagram to test the ICOMLAC's key to the great groupsof Ustalfs.
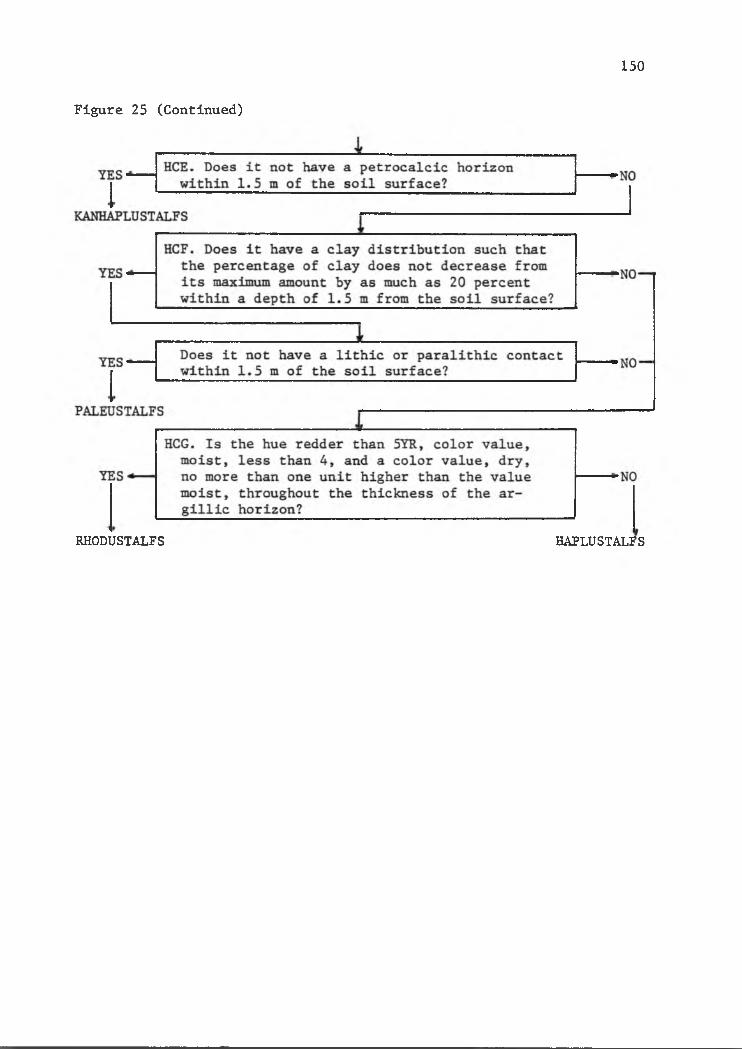
150
Figure 25 (Continued)
RHODUSTALFS HAPLUSTALFS

151
Figure 26. Flow-diagram to test the ICOMLAC's key to the great groupsof Udalfs.
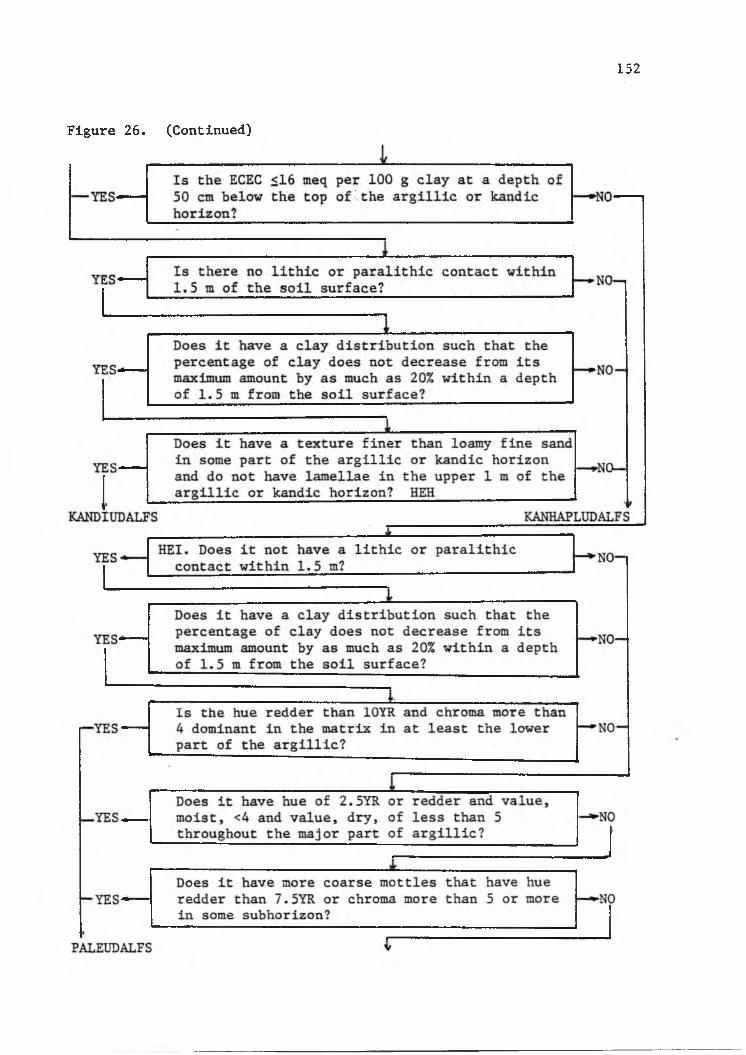
152
Figure 26. (Continued)

153
Figure 26. CContinued)
HEJ. Does it have an argillic horizon that hasYE&< throughout its thickness a hue redder than
5YR?NO-
IYES* Is the color value, moist, less than 4? ►NO
YES-1
Is the color value, dry, no more than 1 unit higher than the value, moist? •NO-
RHODUDALFS HAPLUDALFS

Alfisols and Ultisols, 1983). Item HEG, however, uses the argillic
horizon, as an alternate criterion for the "Kandi" great groups if Che
ECEC is <16 meq per 100 g clay at a depth of 50 cm below the top of
the argillic. The presence of an argillic horizon was confirmed by the
micromorphological description showing that clay illuviation was an in
tense process in this profile (Proc. 1st ISCW, 1978). The grainy ap
pearance of cutans and the absence of more yellowish argillans were in
dicators of terminated translocation and that the cutans were begin
ning to be altered. The maximum clay content of 74.3 percent in the
B21t horizon that decreased to as much as 17.6 percent in the B3t ho
rizon illustrated the concept of the Kandludalfs. The micromorpholo
gical description also revealed that the CEC >24 meq per 100 g clay was
due to the pseudomorphs which consisted of altered biotite. The mi
neralogy of the sand fraction has 8 percent biotite, 3 percent potas
sium feldspars, 7 percent chlorites and 82 percent resistant minerals
(Proc. 1st ISCW, 1978, p 117). In that seminar workshop, this pedon
was believed to be transitional to a Mollisol. It was not placed in
that order because the mollic epipedon was too thin.
The question that arises is, "If the LAC Alfisols are permitted to have CEC <24 meq or ECEC <16 meq per 100 g clay, can they be placed
in the Oxisols if the clay content is >40 percent?" Here, the amount
of weatherable minerals is >10 percent. The next question then is,
"Is the CEC meq or ECEC <16 meq per 100 g clay an appropriate li
mit to describe a LAC soil?" This is one of the most debated issues
regarding the ICOMLAC proposal and both 16 and 24 meq per 100 g clay received strong support as the upper limit of the CEC for the "Kandic"
15A

and "Kanhapl" taxa (SCS, Review draft of Proposal for Reclassification
of LAC Alfisols and Ultisols (1983).
The available data showed that the pedons of LAC Alfisol having
CEC <16 or ECEC <12 have weatherable mineral content <10 percent. But
those having CEC <24 or ECEC ^16 meq exceeded the 10 percent class li
mit of the oxic characteristics. Therefore, the CEC <24'meq.'or ECEC <
16 meq per 100 g clay may not be consistent with Item C.2 of the
ICOMOX’s key definition of the order Oxisols, where the LAC Alfisols
having clay content >40 percent may be placed in the Oxisols. Uehara
(.1975) described these soils as medium activity clay (MAC) soils-. This
seems to suggest that the charge characteristics of the LAC Alfisols
should also be <16 meq CEC and/or ECEC’.<12 meq per 100 g clay.
5.8. Suggested Amendment of the Definition of the Kandic Horizon with
Respect to Both LAC Alfisols and UltisolsThe preceding tests of the keys to LAC Ultisols and Alfisols showed
that the ICOMLAC's summary of properties of the kandic horizon did
not cater to the LAC Alfisols. The reason was that the charge proper
ties of the kandic horizon were defined with a CEC <16 meq per 100 g
clay (by NH^OAc) or with an ECEC <12 meq (sum of bases plus KCl extractable Al) .
This led to the limited application of the kandic horizon in the
definition of the "Kandi" and "Kanhapl" great groups of Ultisols and
Alfisols, as illustrated below by the Udults and Udalfs.
FAD. Other Udults that meet all of the following requirements:
Have <16 meq per 100 g clay (by NH^OAc) CEC or ECEC <12 meq
(sum of bases plus KCl extractable Al) at a depth of 50 cm below
155

In the Udalfs, the great group counterpart, Kandiudalfs is de
fined as, "Have CEC <24 meq per 100 g clay (by NH^OAc) or have ECEC
<16 meq (sum of bases plus KCl extractable Al) at a depth of 50 cm
below the top of the argillic or kandic horizon."
The above illustration showed that the kandic horizon had not
been adequate to define the charge properties of the Kandiudalfs be
cause the class limits were greater than those of the kandic horizon.
On the other hand, the charge characteristics of the kandic horizon
were also repeated in the key definition of the Kandiudults. In this
regard, it may be suggested that the charge properties of the LAC Al
fisols should be changed to an ECEC <12 meq or CEC <16 meq per 100 g
clay to conform with the definition of the kandic horizon.
In this respect, the charge properties of the "Kandi" and "Kan
hapl" great groups of Alfisols will be simply defined as, "Have a kan
dic horizon;"
It will be noted that the argillic horizon in Item FAD.l had
been deleted. This was taken cared of by the earlier suggestion to
delete Item 5 of the definition of the Kandic horizon so that the argillic horizon having CEC <16 meq or ECEC <12 meq per 100 g clay
will be included in the Kandic horizon. The main purpose is to group
together soils with low activity clays in the "Kandi" and "Kanhapl"
great groups, using the kandic horizon as the differentiae to conform
with the intent of the Kandi taxa. Besides the simplification of the
key definition of the LAC great groups, the clay skin criterion which
is very subjective will also be avoided.
156
the top of the argillic or kandic horizon ......... Kandiudults

The soil is a continuoum. Hence, the different LAC soils tend to
grade into each other. Here, a given soil may possess an argillic
horizon that has oxic characteristics. Others may be dominated by low
activity clays but do not have argillic or oxic horizons. The argil
lic horizon is not sufficient to provide an adequate diagnostic crite
rion for all Ultisols and Alfisols from the Oxisols and Inceptisols
(Review draft for reclassification of LAC Ultisols and Alfisols, SCS,
1983). Consequently, a pedon may be placed in more than one taxa or
different pedons may be placed in one taxon. This is where the sug
gested modifications made in this study were integrated in order to
establish mutual boundaries among the LAC soils.
The mutual boundary between the Oxisols and the LAC Alfisols and
Ultisols is illustrated in Figure 27. Interphase A may have an oxic
horizon or a kandic or argillic horizon that has CEC <16 meq or ECEC
<12 meq per 100 g clay. It is an Oxisol belonging to the "Kandi"
great groups if the clay content is >40 percent in the surface 18 cm,
after mixing. Interphase B may have an oxic and/or a kandic or argillic horizon. It is a LAC Ultisol or Alfisol, if the clay content is
<40 percent. Interphase C may have an oxic and/or an argillic or kandic horizon and clay content <40 percent. It is an Oxisol if there
are some acric soil materials.
Figure 28 includes the LAC Inceptisols in the interphase. In
terphase D has CEC <meq or ECEC <12 meq per 100 g clay. It is an
Oxisol if the weatherable mineral is <10 percent and the pH in NaF is
<10. Interphase E has also CEC <16 meq or ECEC <12 meq per 100 g clay.
157
5.9. Suggested Key to the LAC Interphase

158
<40 % clay
Figure 27. Diagram showing the Oxisols-LAC Alfisols and Ultisols interphase.

159
OXI SOLS
LAC MOLLISOLS
Figure 28. Diagram showing the low activity clay soils interphase.

A LAC Mollisol can also grade into the LAC Alfisols. Here, the
LAC Alfisols have base saturation (by N^OAc) that is <50 percent in
some subhorizons of the kandic horizon. If it grades with the Oxisols,
it is a LAC Mollisol if it does not have an oxic horizon. The LAC
Alfisols and Ultisols that grade into the LAC Inceptisols are recog
nized by the presence of a kandic horizon.
The above interphase may be summarized into a flow-diagram key
for LAC soils as shown in Figure 29.-
5.10. Impact of the Proposed Revision on Agrotechnology Transfer
Uehara (1981) defined agrotechnology transfer as, "the taking
of agricultural innovations, knowledge and experience from their site
of origin to a new location where they are likely to succeed." The
vehicle for transfer is a classification system where soils with si
milar physical and chemical properties that influence their behaviour
to use and management are placed in the same taxa. Information about
these properties are provided in the taxa name at the family category
of Soil Taxonomy. This type of technology transfer is termed transfer by analogy (Nix, 1980).
5.10.1. The ICOMOX'S RevisionTable 29 shows that the test pedons of Oxisols in the Benchmark
Soils Project were placed in different taxa by the ICOMOX'S key. Pe
don WAI was placed in a different order category and Pedon COTO in a
different great group category. The latter was placed from the Eu
trustox to the Haplustox great groups because it fell short of the
160
It is a LAC Ultisol or Alfisol if there is an argillic or kandic hori
zon.

161
FIGURE 29. Suggested flow-diagram key to the low activity clay soils.
HISTOSOLS*
ANDISOLS
SPODOSOLS*
OXISOLS-
-YES- Is it a Hlstosol? — NO
■YES-r
Is it an Andisol? -►NO
■YES- Is it a Spodosol?
-YES-r
-►NOJIs there acric soil materials [—►NO in some of the horizons?
— YES-— I Is the ECEC <12 meq/lOOg clay? ►NO
-YES- Is the CEC <16 meq/lOOg clay? — NO •HAC
YES-Is the clay content >40% in the surface 18 cm, after mixing?
-►NO'
OXISOLS-
LAC -----MOLLISOLS
-YES- Does it meet the clay content increase of a kandic horizon?
■YES-^ Is there a mollic epipedon?
YES- Is there an oxic horizon?
YES*
-YES-
Is the clay content of the surface horizon >20% ?
Is the upper boundary at a depth of less than 100 cm from the mineral surface?
-►NO
-» ^ 0 — »LACINCEPTISOLS
— NO
Y K Is there a kandic horizon [— NO—|
-►NO-
— NO .-B

162
Figure 29. (Continued)
LAC-*----ULTISOLS
■YES' Is the base saturation by sum of cations less than 35% -NO- »LAC
ALFISOLS
YES-
YES-
LAC-*----ULTISOLS
YES-
Is the particle size class (of part or all of the upper 10 0 cm) finer than sandy or sandy skeletal? ______
— NO
Is the upper boundary at a depth of 1.25 m from the mineral soil surface? __________
— NO-
Is the percent base saturation by sum of cations <35%________ -NO ►LAC
ALFISOLS
LAC ----MOLLISOLS
YES- Is there a mollic epipedon? — NO— »-LACINCEPTISOLS
LAC-*-----MOLLISOLS
YES- Is there a mollic epipedon? -NO— »LACINCEPTISOLS

Table 29. Reclassification of the Benchmark network of soil families in accordance with the ICOMS proposals and with the suggested amendments in this study.
PEDONS IN SOIL TAXONOMY IN THE ICOMS PROPOSAL IN THIS STUDY
WAI
COTO’"*JAI
DAV**
SOR**
NAK**
**BUK
BPMD
CAM
Tropeptic Eutrustox, clayey, kaolinitic, isohyperthermlc.
Tropeptic Eutrustox, clayey, kaolinitic, isohyperthemic.
Tropeptic Eutrustox, clayey, kaolinitic, isohyperthermlc.
Ultic Tropudalf, very fine, halloysitlc, isohyperthermlc.
Tropeptic Haplorthox, clayey, halloysitlc, isohyperthermlc.
Orthoxlc Palehumult, clayey, kaolinitic, isohyperthermlc.
Orthoxlc Tropohumult, clayey, kaolinitic, isohyperthermlc.
Typic Paleudult, clayey, kaolinitic, isohyperthermlc.
Typic Paleudult, clayey, kaolinitic, isohyperthermlc.
LAC Inceptisols.
Typic Haplustox, very fine, kaolinitic, isohyperthermlc.
Rhodic-Kurlc Eutrustox, very fine, kaolinitic. Isohyper- thermic.
Mollic Kandludalf, clayey, halloysitlc,isohyperthermlc.
Typic Haplorthox, very fine, halloysitlc, Isohyperthermic.
Typic Kurorthox, very fine, kaolinitic, isohyperthermic.
Typic Kurorthox, very fine, kaolinitic, Isohyperthermlc.
Typic Kurorthox, very fine, kaolinitic, isohyperthermic.
Typic Kurorthox, very fine, kaolinitic, isohyperthermic.
Tropeptic Eutrustox, very fine, kaolinitic, isohyperthermlc.
Tropeptic Eutrustox,very fine, kaolinitic, isohyperthermic.
Tropeptic Eutrustox,very fine, kaolinitic, Isohyperthermic.
Mollic Kandludalf, very fine, halloysitlc, Isohyperthermlc.
Tropeptic Haplorthox,very fine, halloysitlc, isohyperthermlc.
Typic Kandlorthox, very fine, kaolinitic, isohyperthermic.
Typic Kandlorthox, very fine, kaolinitic, isohyperthermic.
Typic Kandlorthox, very fine, kaolinitic, isohyperthermic.
Typic Kandlorthox, very fine, kaolinitic, isohyperthermic.
* Analysis by the Benchmark Soils Project Laboratory in Hawaii.** Analysis by the National Soil Survey Laboratory, SCS, in Lincoln, Nebraska.
O'UJ

164
base saturation requirement, while the former was excluded from the
Oxisols because the pH in NaF >9.4. This illustrated the case of soils
that perform similarly being placed in different taxa.
Evidences of similarties of these soils were demonstrated in the
Benchmark Soils Project (BSP Final Report, Puerto Rico, 1975-1981).
Pedons WAI, JAI, and GOTO have ustic moisture regimes that permitted at
least two maize crops per year when irrigated during the dry season.
This property was reflected in the prefix "Ust" of the taxon Ustox. It
was supported with the performance of Pedon JAI in Table 30 where mul
ching was necessary to conserve moisture, suggesting that irrigation
was indeed needed in some part of the year as inferred in taxon "Ust".
The BSP in Puerto Rico reported very similar maximum yields of
maize in the GOTO and JAIBA sites with comparable inputs. There was
also no response to K fertilizer at both sites, and that one specific
maize variety performed best in the two sites (BSP Final Report,
Puerto Rico, 1975-1981). These seemed to Illustrate the homogeneity in
properties important to plant growth. It was further reported that
the highest maize grain yield of all transfer trials in the GOTO soil was'11,515 kg/ha. For that experiment, the overall mean was also high
(10,223 kg/ha). In Hawaii, Pedon WAI gave maize yields as high as 11,530 kg/ha (BSP Report, 1980). The highest mean yield of maize in
Pedon JAI was also 9,192 kg/ha. These are considered excellent yields
for maize in the tropics (BSP Final Report, Puerto Rico, 1975-1981).
The high production potential may be indicative of nutrient en-
taxon "Eutr". Therefore, a change in the placement of Pedons GOTO and
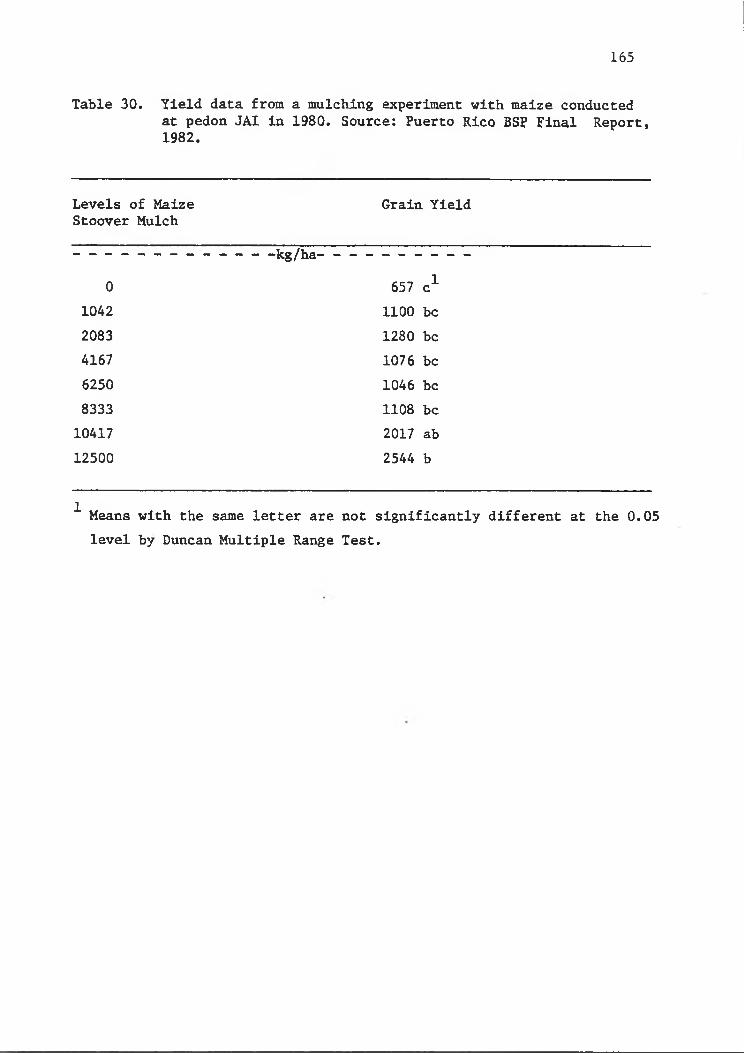
165
at pedon JAI in 1980. Source: Puerto Rico BSP Pinal Report, 1982.
Table 30. Yield data from a mulching experiment with maize conducted
Levels of Maize Grain YieldStcover Mulch
-kg/ha-
0 657 c"1042 11 0 0 be2083 1280 be4167 1076 be6250 1046 be8333 1108 be10417 2017 ab12500 2544 b
^ Means with the same letter are not significantly different at the 0.05level by Duncan Multiple Range Test.

WAI from Eutrustox to other taxa do not seem to match with the above
performances.
In this study, it was suggested earlier to redefine the "Eutr"
great group with a percentage base saturation >35 percent in the major
part of the oxic horizon and to refine the pH in NaF of the oxic hori
zon from 9.4 to 10.0. These changes seemed to have improved the clas
sification of the 3 pedons by placing them in the same taxa at the
great group level (see Table 29).
At the subgroup level, the insignificant difference in maize yield
between no tillage compared to the conventional tilling method in Pe
don GOTO (Table 31) evidently showed good physical condition of the
soil which is appropriately reflected in the Tropeptic taxon. The
change to Rhodic-Kuric in the ICOMOX's proposal may be viewed in terms of the information provided in the taxonomic name. The proposed de
finitions .read, "Rhodic has 5YR or redder color hues in all parts of
the oxic horizon above 1.25 m below the soil surface” and "Kuric has
>40 percent clay in the surface 18 cm, after mixing."
Initially, the Rhod taxon was used to identify soils that do not
have problems on soil structure under cultivation in the U.S.A. These soils have red color, hence, rhodic (Smith, as interviewed by Leamy,
1981)— to imply the red color. In Malaysia, the rule of thumb is,
"the redder the soil, the weaker the structure and the more friable
it is. However, they often have very stable fine granular or crumb
structure " (Paramananthan and Llm, 1979). In this respect, the
166
V Leamy, M. 1981. Conversation in Taxonomy. New Sealand Soil News Vol. 27, No. 2 pp 196-203.
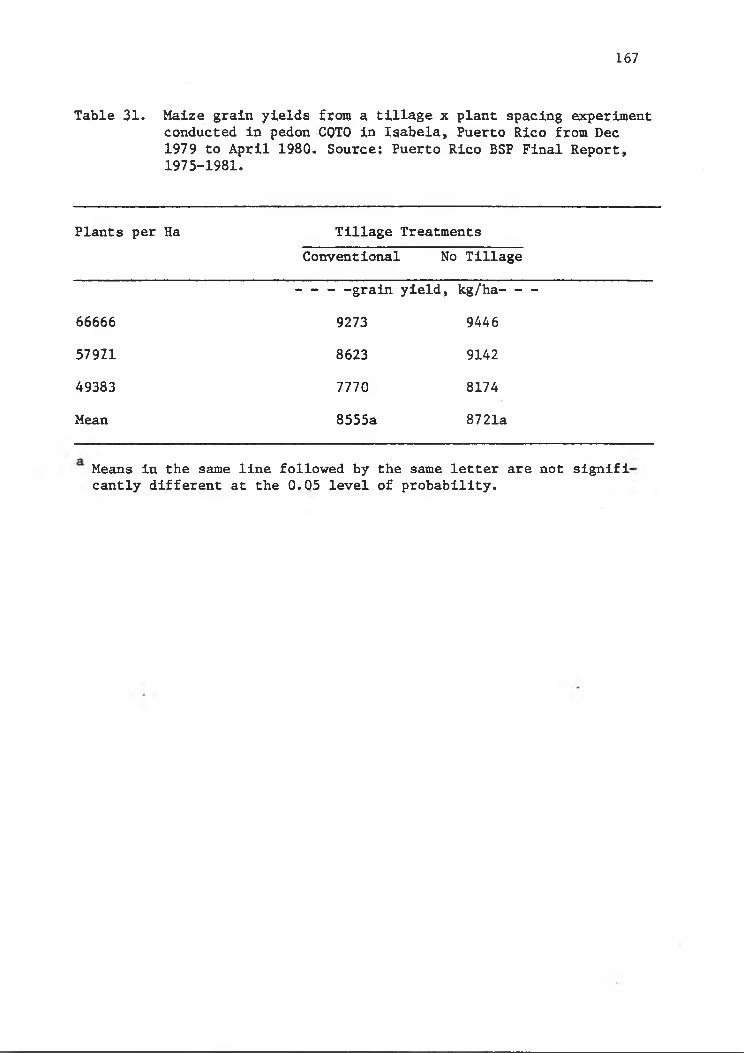
167
Table 31. Maize grain yields from a tillage x plant spacing experiment conducted in pedon CQTO in Isabela, Puerto Rico from Dec 1979 to April 1980. Source; Puerto Rico BSP Final Report, 1975-1981.
Plants per Ha Tillage TreatmentsConventional No Tillage
-- - -grain yield. kg/ha----
66666 9273 9446
57921 8623 9142
49383 7770 8174
Mean 8555a 8721a
Means in the same line followed by the same letter are not significantly different at the 0.05 level of probability.
Tropeptic and the Rhodic taxa may imply favorable soil structure.
However, it is oftenly mentioned that the hue of the soil becomes red
der with increased amount of free iron, and that the red color implies
high hematite content. But there are some yellow soils that contain
high amounts of free Fe (Paramananthan and Lim, 1979). Isbell and
Smith (1976) found that a red or yellow soil color may not give a re
liable indication of iron content. This means that the "Rhod" taxon
may not be exclusive for soils high in free iron content.
The Kuric subgroup is defined with a high clay content. This pro
perty may be indicated by adding the fine and very fine particle size
class in Oxisols and Ultisols. In this case, the change from Tropeptic
to Rhodic-Kuric may not provide a significant improvement in the clas
sification, except perhaps that the latter are more quantitative and
hence, less subjective than the determination of soil structure for the
Tropeptic taxon. The structure criterion, however, is a very useful
tool for soil surveyors in the field.
Tropeptic, in Soil Taxonomy, implies both structure and depth.
Here, it is suggested that it should be defined only with the struc
ture and that the depth criterion will be that of the Leptic subgroup as provided in Item b, page 331 in Soil Taxonomy.
The breakdown of clayey textural class into fine (40-60 percent
clay) and very fine (>60 percent clay) by ICOMOX appears to be favor
able, because the soil behaviour depends strongly on texture. For
example, reliable estimates of water holding capacity, permeability,
CEC, trafficability and rheology can be made from knowledge about par
ticle size distribution (Uehara, 19750. Here, the class limits are
168

more specific and, therefore, soil interpretation will be more precise.
The Halii and the Kapaa series in Hawaii illustrated the problem
of two different soils placed in the same taxon. The ICOMOX's key
placed the two soils in the great group of Gibbsiorthox.
However, Ikawa (1979) showed that the Halii and Kapaa series were
quite different in some important respects. The Halii series has an
isothermic temperature regime while Kapaa series has isohyperthermic.
The latter has also a lower meanannual rainfall (MAR) and a higher
mean annual temperature (MAT). These characteristics led to different
economic uses and management properties for the two soils. For
example, the Kapaa series is mainly used for water supply, wildlife
habitat, pasture and may also be cropped to sugarcane. But in addi
tion to the above, the Halii series is also utilized for pineapple,
orchard, and truck crops.
In terms of fertilizer management. Fox (1962) showed that the
Kapaa soil fixed more P than the Halii soil (Figure 30). Understand
ably, the P requirement of the Kapaa (Orthox) should be higher than
the Halii (Humox). Fox attributed extreme availability of early-
applied P in the Halii series to the abundance of the small nodules which constituted a large fraction of the soil. According.to Fox, these nodules reacted with relative slowness at first because of the
small surface area which they presented. As a result, late-applied P
was taken up in relative abundance in the Halii series when compared
with the Kapaa series.
It can also be seen in Figure 31 that as lime was added to increase the pH, the amount of added P remaining in solution did not
169

170
Time (minutes)Figure 30. Immobilization of phosphate by Halil and Kapaa soils during
four-day equilibration of soils with a phosphate solution. Source: Fox et al. (1963).

171
Soil pH
Figure 31. Influence of liming on the retention of phosphate by the Halii and the Kapaa soils. Source: Fox (1963).

vary very much in the Kapaa series, while in the Halii series, liming
to pH 6 drastically reduced the P in solution. In terms of crop per
formance, the P uptake of sudan grass was higher in both the limed and
unlimed Halii soil, compared to the limed and unlimed Kapaa soil (Table
32). These performances were evidences showing different management
properties of the two soils which in turn indicated that they should not
be placed in the same taxon. In the suggested modification of the
ICOMOX proposal, the Halii was placed in the Gibbsihumox, while the
Kapaa soil was placed in the Gibbsiorthox.
5.10.2. The ICOMLAC Revision
The impact of the ICOMLAC proposal on agrotechnology transfer was
tested against the characteristics and performance data of selected
pedons of LAC Ultisols in the BSP network of soil family of the
Ultisols.
The placement of Pedon DAV to the Alfisols illustrated the impact
of the propsal in the stratification of agroenvironment into distinct
agroproduction niches.
The characterization data obtained by the SCS on Pedon DAV supported its placement in the Ultic Tropudalf, clayey, halloysitic. Iso- hyperthermic according to Soil Taxonomy. The ICOMLAC propsal placed
this pedon in the Mollic Kandiudalf, very fine, halloysitic, isohyper-
thermic. This was in agreement with the classification made in this
study and it is short of 1 percent base saturation in the B14 horizon
to be in the order Mollisols. In fact, pedon DAV had appreciable
amount of weatherable minerals such as 37 percent plagioclase feldspars,
8 percent hornblende, 4 percent muscovite in the very fine sand farction.
172

173
Table 32. Uptake of Al and fertilizer P by sudan grass from the Kapaa and the Halli series as influenced by liming.
Soil LimeTreatment
P Yield
(mg)
Utilization of added P
(%)
Al uptake
(mg/pot)
Plant Al
(ppm)
Kapaa Unlimed 0.23 0.12 0.10 313Limed 0.32 0.15 0.09 232Control 0.18 - 0.07
•
358
Halii Unlimed 0.44 0.44 0.09 208Limed 0.53 0.64 0.06 111Control^ 0.26 — 0.13 400
Source; Fox (1962).
No lime or P applied.

Compared with the Oxisols and Ultisols of the Benchmark network
of soil families, its placement in the Alfisols may be supported by
the similar growth and development during the earlier stage of growth
when the roots were still shallow and the marked increase in growth of
nitrogen fixing trees in pedon DAV (Figure 32) at the later stage. The
growth of the trees in Pedon NAK (paleudult) and Pedon WAI (Eutrustox)
were poorer. Here, it seemed reasonable to supposed that the better
performance of the trees in Pedon DAV may be related to the higher per
centage base saturation throughout the profile from which the deep
rooting nitrogen fixing trees were drawing sustained supply of nutrients
without amendments.
The halloysitic mineralogy conformed with the relatively higher
CEC and ECEC values of Pedon DAV than Pedons NAK, BUK, and SOR. The
higher CEC and ECEC values seemed to be related to the consistently
higher maize yield in Pedon DAV compared with the yields obtained in
Pedons NAK, BUK, and SOR CCady, personal communication).
Item HEG of the ICOMLAC key to the great groups of Udalfs placed
Pedon DAV in the Kandiudalfs.
The data obtained by the SCS for Pedons SOR supported its place- in the Tropeptic Haplorthox, clayey, halloysitic, isohyperthermic
according to Soil Taxonomy.
The ICOMOX's proposal placed it in the Typic Haplorthox, very
fine, kaolinitic, isohyperthermic. Here, the Tropeptic subgroup was
proposed to be deleted by the ICOMOX.
174
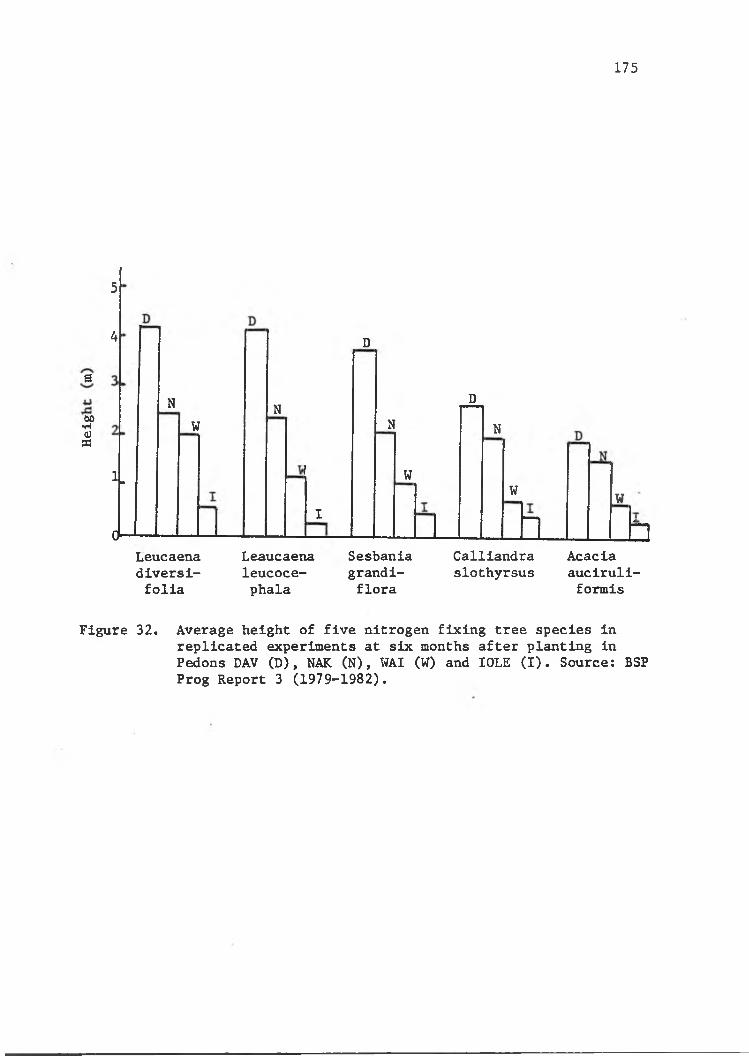
175
5
4 D
a
00•H0)SB
1 .
0-
NW
N DN N
Leucaenadiversi-folia
W
I
Leaucaena Sesbanla leucoce- grandi-phala flora
W w
n inCalllandraslothyrsus
Acaciaauciruli-formis
Figure 32. Average height of five nitrogen fixing tree species in replicated experiments at six months after planting in Pedons DAV (D), NAK (N), WAI (W) and IDLE (I). Source; BSP Prog Report 3 (1979-1982).

The suggested amendment to the ICOMOX's proposal placed it differ
ently in the Tropeptic Haplorthox which is similar to its current clas
sification in order to recognize and reflect in the taxa the discerni
ble fine or medium granular structure.
The proposed changes by the ICOMS made considerable improvement in
the classification of the LAC soils relative to agrotechnology transfer.
However, the preceding exercise seem to indicate room for improvement.
Suggestions were, therefore, made and the modifications seem to provide
class units that have relative homogeneity in soil properties related
to plant growth that led to the grouping together of soils having simi
lar crop production potential.
176

177
VI. RESULTS AM) DISCUSSION - STANDARDIZATION OF DATA, TEST OF EQUATION
TO ESTIMATE CLAY CONTENT, AND RECLASSIFICATION OF TEST PEDONS
6.1. Standardization of some Laboratory Data
The data of a few test pedons were determined with procedures dif
ferent from those prescribed in Soil Taxonomy. They were standardized
to conform with methods required in Soil Taxonomy. It was done by es
tablishing correlations between the data obtained by other countries
with those obtained by the National Soil Survey Laboratory (NSSL) of
the Soil Conservation Service in Lincoln, Nebraska on the same pedons.
The equations that were developed are shown in Table 33.
6.2. Test of Equations to Estimate Clay Content
The clay percentage in Item 2 of the summary of properties of
the oxic horizon in Soil Taxonomy, p 39 is footnoted as follows:"15The percentage of clay as measured by the pipette method or
2.5 X 15-bar water whichever value is higher but not more than 100."
The implication of the above is that low activity clays are dif
ficult to disperse and, therefore, clay content may be estimated by its relation to the 15-bar water content. Here, the basis is that
the moisture content is dependent on the clay and organic matter con
tents. Since Oxisols are generally low in organic matter, the use of
the equation 2.5 x 15-bar water to estimate the clay content is per
mitted in Soil Taxonomy. Evidently, however, the factor 2.5 seem to
underestimate the clay content of some Oxisols in Hawaii. This was
illustrated by the data of the Wahiawa series (Table 34). Here, the

A. Data of pedons in Brazil by the NSSL, SCS (Y) and by the SNLCS Soil Laboratory (X). Source: Ikawa (1979).
Table 33. Regression Equations of analytical data.
178
VARIABLES REGRESSION EQUATIONS
Sand Y 38 0.9907X + 2.6718 0.996 28Silt Y as 1.2972X - 1.3355 0.948 28Clay Y » 0.8480X + 1.1844 0.977 28Organic Carbon Y s 1.1552X - 0.0581 0.993 28N Y 0.9298X - 0.0208 0.983 15PHcaCl2 ^®KC1
Y SB 1.0003X + 0.0843 0.859 28
Y = 0.9975X - 0.2334 0.927 28Na —
K Y 1.3733X - 0.0357 0.939 27Ca & Mg Y = 0.9949X - 0.0683 0.998 28Al Y 1.0998X + 0.0073 0.990 28Base Saturation Y 38 0.7074X - 2.9177 0.975 28Sum of Bases Y = 1.3923X + 0.8333 0.990 28
B. Data of pedons in Thailand by the NSSL, SCS (Y) and by theThailand Soils Laboratory (X). Source: Calculated from the Proc 2nd ISCW Part II, 1979.
Clay Y ss 1.1371X - 0.1093 0.989 51CEC Y as 1.0586X + 1.2323 0.977 51Al Y a 1.0365X + 0.2085 0.979 43Organic Carbon Y a 0.7818X + 0.0236 0.912 51Ca Y a 1.0578X - 0.0704 0.991 51Mg Y = 0.9715X + 0.2698 0.949 51Na Y = 0.9975X - 0.0098 0.865 51K Y 1.0740X - 0.0430 0.918 39Base Saturation Y = 0.8505X - 4.2675 0.965 51Sum of Bases Y a 1.0556X - 0.1343 0.991 4515-Bar Water Y =* 0.8421X + 1.3865 0.962 51pH Y a 0.7959X + 1.3865 0.997 51

179
Table 34, Calculated cation exchange capacity of the Wahiawa series in the Benchmark Soils Project in terms of estimated clay by 2.5 X 15-bar water content.
Depth
(cm)
Horizon 15-BarWater(%)
CEC (meq per 100 g)Soil Clay Clay
(2.5 X 15-bar) (Measured)
0 - 1 0 Apl 24.8 20.81 35.3 34.810-27 Ap2 24.3 18.43 29.7 19.327-40 AB 24.9 17.58 27.8 31.540-65 B21 24.4 13.74 2 2 .2 26.265-90 B22 24.4 13.01 2 0 .0 17.990-120 B23 25.1 14.11 21.5 18.8
120-150 B24 26.3 14.42 22.3 2 0 .6
* Original profile samples.

180
clay content as estimated by the relationship of 2.5 x 15-bar water
gave CEC values >16 meq per 100 g clay. Similarly, the low recovery
of clay by the pipette method also resulted to a CEC >16 meq per 100
g clay (Table 35). The current placement of the Wahiawa series, there
fore, in the Oxisols (BSP Tech. Report 1, 1979) is incorrect if Soil
Taxonomy is strictly applied.
Soil Taxonomy prescribes the pipette method of Kilmer and Alexan
der (1949) for the determination of particle size distribution. The
method has lower values of measured clay content than the actual clay
content of some Hawaiian Oxisols (Tsuji, ^ 1974) and most oxidesoils of the tropics (Ikawa, 1978) suggesting that this method may not
be suitable for some Oxisols. The degree of clay dispersion by the
pipette method was, therefore, compared with the ultrasonic vibration
technique. The result in Table 35 showed a considerable increase of
clay recovery with the ultrasonic vibration technique.
The sand- and silt-sized particles were examined by means of X-ray
diffraction and it turned out that the minerals detected in the clay
fraction were also those in the sand- and silt-sized particles . This
seemed to confirm that the sand- and silt-sized particles were aggregates of clay that were not dispersed by the pipette method.
The experimental value of the factor used to multifly the per
centage of 15-bar water content was calculated from the new data as
the ratio of the measured clay to 15-bar water content. The result agreed with the factor 2.5 by using the pipette method, while the ul
trasonic vibration technique gave an average factor of 3.5 (Table 36).
The value of 3.5 was supported by the data of some Brazilian soils

181
Table 35. Clay analysis by the Pipette Method (PM) and the Ultrasonic Vibration Technique (UVT) for two pedons of the Wahiawa series of the Benchmark Soils Project in Waipio, Hawaii.
Depth Horizon Percentage ClayPM UVT
Pedon WAI (BSP original profile pit)0 - 1 0 Apl 59.8 84.9
10-27 Ap2 62.9 82.627-40 AB 55.8 8 6 .840-65 B21 52.4 88.565-90 B22 73.6 92.090-120 B23 74.9 88.7
120-150 B24 69.9 87.4
Pedon WAI (BSP new profile pit)0-23 Apl 61.9 88.4
23-38 Ap2 69.5 85.538-53 B 70.1 92.353-91 Bw 65.8 91.391-125 Bwl 64.5 75.3
125-147 Bw2 38.3 45.2147-178 Bw3 36.5 59.3

182
Table 36. The ratio of percent clay to 15-bar water content asinfluenced by the method of clay determination of Wahiawa silty clay.
Depth Ratio of percent clay to 15-bar WaterPipetteMethod
UltrasonicVibration
Original BSP profile0 - 1 0 2.4 3.410-27 2 .6 3.427-40 2 .2 3.540-65 2 . 1 3.665-90 3.0 3.890-120 2.9 3.5
120-150 2.7 3.3
Second BSP profile0-23 2 . 6 3.623-38 2 .8 3.438-53 2.7 3.553-91 2.5 3.691-125 2.5 3.1
125-147 1.5 1 . 1
147-178 1.4 2 .8

obtained by the pipette method of Kilmer and Alexander (1949), Pedons
OX-10 of the GOTO and OX-16 of the JAI soils in Puerto Rico and in
Brazil, respectively, OX-9 of the Chock Chai (Table 1, Appendix VI),
and the Pack Chong and the Yasothon series in Thailand (Table 2,
Appendix VI).
The impact of the new factor was tested with the data of the
Molokai (SSIR No. 29, p 180) and the Wahiawa series (SSIR No. 29, p
188) both of which are classified as Oxisols but failed to meet the CEC
requirement of the oxic horizon when the clay content was computed by
2.5 X 15-bar water content. With the factor Of 3.5, the CEC's were
lowered to 16 meq per 100 g clay or less (Table 37). It also reduced
the CEC values of some oxic subgroups of Inceptisols (Table 3, Appendix
VI) but they did not qualify for an oxic horizon because the upper tex
tural boundary was not diffuse and the weatherable mineral content was
high.
These are evidences that the factor 3.5 is a suitable value to
keep some Oxisols that are difficult to disperse in their proper placement.
On that basis, the footnote fo-r clay content in Soil Taxonomy, p38 was suggested to be modified in the folliwing manner;
"15The percentage clay as measured by the pipette method of 3.5 times 15-bar water whichever value is higher but not more than 100."
6.3. Final Classification of Test Pedons
Applying the amendments made in this study, the test pedons were
reclassified as shown in Table 28.
183

184
Table 37. Comparison of the CEC of selected pedons expressed in percentage clay content as estimated by factors 2.5 of SoilTaxonomy and the recommended value of 3.5.
Depth CEC® CEC^ CEC° Source
Wahiawa silty clay. Hawaii., SSIR No. 290-15 25.7 42.1 30.1 p 188 (1976)15-30 24.2 38.5 27.530-40 16.5 26.3 18.840-83 13.1 2 1 . 6 15.483-113 13.5 21.9 15.7113-150 1 2 . 8 20.7 14.8
Molokai silty clay. Hawaii. SSIR No. 290-15 23.5 42.5 30.1 p 180 C1976)15-38 20.9 37.1 26.538-65 1 1 . 6 20.9 14.965-100 14.4 24.9 17.81
100-150 1 0 . 2 19.2 13.7
Meq per 100 g soil.Meq per 100 g clay where percent clay = 2.5 x 15-bar water.Meq per 100 g clay where percent clay = 3.5 x 15-bar water.

Table 38. Final classification of test pedons.
183
PEDONS SERIES CURRENTCLASSIFICATION
CLASSIFICATION IN THE STUDY
OX-1 Aburan Haplorthox KandiorthoxOX-2 Alai Ochraquox OchraquoxOX-3 Babeko Ochraquox OchraquoxOX-4 Bayoman Eutrorthox EutrorthoxOX-5 Boka Haplorthox HaplorthoxOX- 6 "BR-7” Eutrorthox EutrorthoxOX-7 "BR-14" Acrohumox AcrohumoxOX- 8 Catalina Haplorthox HaplorthoxOX-9 Chock Chai Haplustox HaplustoxOX-10 Coto Eutrustox EutrustoxOX-11 Delicias Haplorthox HaplorthoxOX-12 Donie Haplorthox HaplorthoxOX-13 Farmhill GibbsIhumox AcrohumoxOX-14 Gedang Umbraquox UmbraquoxOX-15 Halii GibbsIhumox GibbsihumoxOX-16 Jaiba Eutrustox EutrustoxOX-17 Jerangau Acrorthox AcrorthoxOX-18 Kapaa ■ Gibbsiorthox GibbsiorthoxOX-19 Kersic Ochraquox OchraquoxOX-20 Kuala Pilah Acrorthox AcrorthoxOX-21 Kuamang Haplorthox KandiorthoxOX-22 Kuamang Ochraquox OchraquoxOX-23 Kuamang Haplorthox HaplorthoxOX-24 Kuantan Acrorthox AcrorthoxOX-25 Lawal Umbriorthox UmbriorthoxOX-2 6 Lihue Eutrustox EutrustoxOX-27 Mahana Acrohumox AcrohumoxOX-28 Makaplll Umbriorthox AcrorthoxOX-2 9 Matanzas Eutrorthox EutrorthoxOX-30 Merangin Haplorthox KandiorthoxOX-31 Molokai Torrox HaplorthoxOX-32 Molokai Torrox HaplorthoxOX-33 Molokai Torrox HaplorthoxOX-34 Nlpe Acrorthox AcrorthoxOX-35 Phuket Haplorthox KandiorthoxOX-36 Pooku Acrohumox AcrohimoxOX-37 Puhi Umbriorthox HaplorthoxOX-38 "P-l" Not classified -
OX-39 "p_2" Not classified -
OX-40 Rebah Umbrquox UmbraquoxOX-41 Regosari Haplorthox KandiorthoxOX-42 Rukani Haplorthox OchraquoxOX-43 Sadao Haplorthox HaplorthoxOX-44 Segamat Haplorthox Kandiorthox

186
Table 38. (Continued)
PEDONS SERIES CURRENTCLASSIFICATION
CLASSIFICATION IN THE STUDY
OX-45 Senai Acrorthox AcrorthoxOX-46 "SPl" Haplohumox HaplohumoxOX-47 "SP3" Haplorthox HaplorthoxOX-48 "SP5" Acrorthox AcrorthoxOX-49 "SP6" Acrorthox AcrorthoxOX-50 "SP7" Acrorthox AcrorthoxOX-51 "SP8" Acrorthox AcrorthoxOX-52 "SPIO" Gibbsiorthox GibbsiorthoxOX-53 "SPll" Gibbsiorthox GibbsiorthoxOX-54 "SP12" Acrorthox AcrorthoxOX-55 "SP14" Haplorthox HaplorthoxOX-56 "SP15" Eutrorthox EutrorthoxOX-57 "SP17" Eutrustox EutrustoxOX-58 Tabri Haplorthox KandlorthoxOX-59 Wahiawa Eutrustox EutrustoxOX-60 Wahiawa Eutrustox EutrustoxOX-61 Wahiawa Eutrustox EutrustoxOX-62 Profile 1 Haplorthox HaplorthoxOX-63 Profile 2 Umbriorthox UmbriorthoxULT-1 Alaeloa Tropohumult TropohumultULT-2 Aibonito Tropohumult TropohumultULT-3 Ban Bong Paleustult PaleustultULT-4 Ban Chong Paleustult KandiustoxULT-5 Bedoule Paleudult KandludultULT- 6 Besara Paleudult KandiudultULT- BPMD Paleudult KandlorthoxULT-7 "BR-3" Haplustult KanhaplustultULT- 8 "BR-4" Paleustult KandiustultULT-9 "BR-8" Palehumult KandlorthoxULT-10 "BR-10" Hapluhumult KandirothoxULT-11 "BR-12" Paleudult KandlorthoxULT-12 "BR-19" Haplustalf KandiustalfULT-13 "BR-20" Fragiudult FragiudultULT-14 "BR-22" Tropudult KanhpaludultULT-15 "BR-23" Paleudult KandiudultULT-16 "BR-24" Paleudult or
HaplorthoxKandiudult
ULT-17 "BR-25" Paleudult KandlorthoxULT-18 "BR-27" Paleustult kandiustultULT-19 "BR-30" Paleudult KandiudultULT-20 "BR-31" Paleudult KandiudultULT-21 BUK Tropohumult KandlorthoxULT-22 Bungor Paleudult KandiudultULT-23 CAM Paleudult Kandlorthox

187
Table 38. (Continued)
PEDONS SERIES CURRENTCLASSIFICATION
CLASSIFICATION IN THE STUDY
ULT-24 Cecil Hapludult KanhapludultULT-25 Chalong Plinthustult PlinthustultULT-26 Cialitos Tropohumult KandiorthoxULT-27 Daguey Tropohumult TropohumultULT-28 Dalek Paleudult KandiudultULT-29 Daobli Paleudult KandiudultULT-30 DAV Tropudalf TropudalfULT-31 Drasa Paleustult KandiustoxULT-32 Dunmore Paleudult KandiudultULT-33 Faceville Paleudult KandiudultULT-34 Gamboro Paleustult KandiustultULT-35 Glouamo Paleudult KandiudultULT-36 Grady Paleaquult OchraquoxULT-37 Guire Paleudult KandiudultULT-38 Hayesville Hapludult HapludultULT-39 Uumatas Tropohumult TropohumultULT-40 Haiku Taxadjunct Tropohumult KandiorthoxULT-41 Jagueyes Tropudult KandiorthoxULT-42 Kabin Buri Haplustult KandiustoxULT-43 Kalae Tropohumult KandiustoxULT-44 Kenlng Paleudult HaplorthoxULT-45 Khlong Chak Haplustult KandiudultULT-46 Kho Hong Paleudult KandiudultULT-47 Kolea Paleudult KandiudultULT-48 Koronivia Tropohumult KanhaplohumultULT-49 Lanchang Paleudult AcrorthoxULT-50 Llmones Paleudult KandiorthoxULT-51 Mab Bon Paleudult KandiudultULT-52 Malan Plinthuduit PlinthorthoxULT-53 Marlboro Paleudult KandiudultULT-54 Muse Hapludult HapludultULT-55 "MU-7" Tropaquult KanhaplaquultULT-56 "MU-11" Tropudult KanhapludultULT-57 "MU-13" Tropudult KanhapludultULT-58 Mokambo Haplustult Kanhaplus tultULT-59 NAK Palehumult KandiorthoxULT-60 Neira Paleudult PaleudultULT-61 Niagui Paleudult PaleudultULT-62 Nonoua Paleudult KandiudultULT-63 Paaloa Tropohumult KandihumoxULT-64 Pak Chong Paleustult HaplustoxULT-65 Pauwela Tropohumult KandiorthoxULT- 6 6 Phangnga Paleudult Kandiudult

188
Table 38. (Continued)
PEDONS SERIES CURRENTCLASSIFICATION
CLASSIFICATION IN THE STUDY
ULT-67 Sabana Plinthaquult PlinthaquoxULT- 6 8 Saoa Paleudult KandiudultULT-69 Sijau Paleudult KandiorthoxULT-70 Songkhla Paleaquult KandiaquultDLT-71 SOR Haplorthox HaplorthoxULT-72 Tabau Plinthudult PlinthudultULT-73 Telico Rhodudult RhodudultULT-74 Toko Paleudult PaleudultULT-75 War in Paleudult PaleudultULT-76 Waynsboro Paleudult PaleudultULT-77 Yasothon Rhodustult HaplustoxULT-78 Profile 3 Palehumult KandiorthoxULT-79 Profile 4 Paleudult Kandlorthox
OLL-1 Keahua HaplustollsOLL-2 Makaweli HaplustollsOLL-3 Paia Haplustolls
ALF-1 "BR-2" Paleustalf KandiustalfALF-2 "BR-6" Paleudalf PaleudalfALF-3 "BR-28" Paleustalf KandiustalfALF-4 Puo Opae Rhodustalf Kandiustox
tiPT-l Akaka HydrandeptEPT-2 Hilo HydrandeptEPT-3 Hoolehua UstropeptEPT-4 ITKA DystrandeptEPT-5 Kohala HumltropeptEPT- 6 Kohala HumitropeptEPT-7 Koolao TropaqueptEPT- 8 Kukalau DystrandeptEPT-9 PUC Dystrandept ,
EPT-10 "S.V.2.4" TropaqueptEPT-11 "S.V.9.2" DystrandeptEPT-12 Uwala UstropeptEPT-13 Waimea Eutrandept

189
The ICOMOX and ICOMLAC proposals were tested against the data of
163 pedons representing various environments of LAC soils in many parts of the world.
With respect to the first objective of this study of testing the
ICOM's proposals, it made considerable improvements in the classifica
tion of LAC soils in Soil Taxonomy. However, some pedons still could
not be placed in the classification scheme because of deficiencies of
definition of taxa or others could not be placed because no taxon is
provided to accommodate them. On the other hand, similar pedons could
be placed in different taxa or pedons with diverse characteristics
could be placed in the same taxon.
With respect to the second objective of determining the impact of
the ICOM's proposals on agrotechnology transfer, in general, there was
Improvement in the groupings of soils that have relative homogeneity
in properties important to plant growth. However, some test pedons having similar crop production potential were placed in different taxa while others were placed in the same taxon but have different
management requiremens.
With respect to the third objective of recommending, if necessary,
improvements in the proposed classification schemes, amendments or
certain alternatives were suggested to overcome the above limitations.
Some diagnostic limits were refined, certain criteria were deleted and/or added and certain definitions were modified.
VII. CONCLUSIONS

Therefore, the ICOM's proposals were modified according to the*amendments suggested in this study as presented below.
I. Suggested Amendments to the ICOMOX'S Summary of Properties of
the Oxic Horizon.
In summary, the oxic horizon is a subsurface horizon that
1. Is at least 30 cm thick;2. Has a fine-earh fraction (<2 mm) that has an apparent ECEC
(NH4OAC bases plus IN KCl extractable Al percent clay) <12 meq per
100 g clay or apparent CEC of 16 meq or less per 100 g clay by NH4OAC
at pH 7.
3. Has a pH value in N NaF Cl:SO) in 2 minutes of <10.0.
4. Has less than 10 percent weatherable minerals of the 50-250
micron fraction if that size fraction constitute at least 20 percent
of the soil material less than 2 mm in diameter or have less than 40
meq of K + Mg + Ca + Na/100 g of soil on a total elemental analysis
basis after coated gravel removal if the soil has less than 20 per
cent fine sand and very fine sand (50-250 micron);
5. Has a diffuse upper textural boundary (i.e. <1.2 x clay increase within a vertical distance of 12 cm), unless theve is aariG
soil matevial in some parts of any horizon to a depth of 1.25 m.
6. Has a texture of sandy loam or finer in the fine-earth frac
tion and has more than 1^ percent clay;
7. Has less than 5 percent by volume that show rock structure
unless the lithorelics containing weatherable minerals are coated
190
Modifications or suggestions as a result of this study are given in italics.
**/ Suggested criterion for further study.

191
with a continuous sesquioxide skin.
8. Does not have more than 85 percent gravel by volume.
II. Suggested Definition of the Acric Soil Materials
Aoria soil matevials are mineral soil materials o f at least 25 am
thiakt that have an effective cation exchange capacity (ECEC) as the
sum o f bases by NH 4 OA0 at p S 7 plus IN KCl extractable Al^ of <1.5 meq
per 100 g clay and a delta p H (pHxci - P^H20^ more positive.
III. Suggested Amendments to Key the LAC Soils in the order Category
Key to Soil Order
A................................................. Histosols*B................................................. Andisols
C................................................. SpodosolsD. Other soils that
1. Have acric soil materials within 1.25 m of the soil surface,
or
2. Have less than 40 percent clay in the upper 18 cm, after
mixing, and an oxic horizon with its upper boundary within
1.25 m of the soil surface and which do nvt meet the clay
increase requirement of a kandic horizon; or
3. Have 40 percent or more clay in the upper 18 am of the soil
surface, after mixing, and an oxic horizon with its upper
boundary within 1.24 m o f the soil surface . . Oxisols
E ...................................................... Vertisols
* Proposed placement of Andisols in the key (personal communication, Eswaran).
** Suggested amendment to ICOMOX'S proposal.

192
F................................................. Aridosols
G* Othev soils that have a mesia^ isomesic, or warmer temperature
regime... hut have one o f the following aombination o f oharao-
teristios;
1. Have an argillia or handia horizon but not a .
f r a g i p a n ............................... Ultisols
H................................................. Mollisols
I Other soils that have an argillic or hxndia horizon hut not a
fragipan^ or ............................... Alfisols
J................................................. Inceptisols
K................................................. EntisolsIV. Suggested Amendments to the Oxisol Keys
Key to Suborders
CA. Oxisols that are either saturated with water within 30 cm
of the surface for at least 30 days per year in most years
or are artifically drained and have one or both of the fol
lowing characteristics associated with wetness;
a. A histic epipedon, and/or;
b. If free of mottles, immediately below any epipedon that has a moist color value of less than 3.5 there is a dominant
chroma of 2 or less; or if there are distinct or prominent
mottles within 50 cm of the soil surface, the dominant chro
ma is 3 or less or the hue is 2.5Y or yellower. Aquox
CB. Other Oxisols that have an Aridlc (Torric) soil moisture
regime ................................. Torrox
* Suggested addendum in Soil Taxonomy.
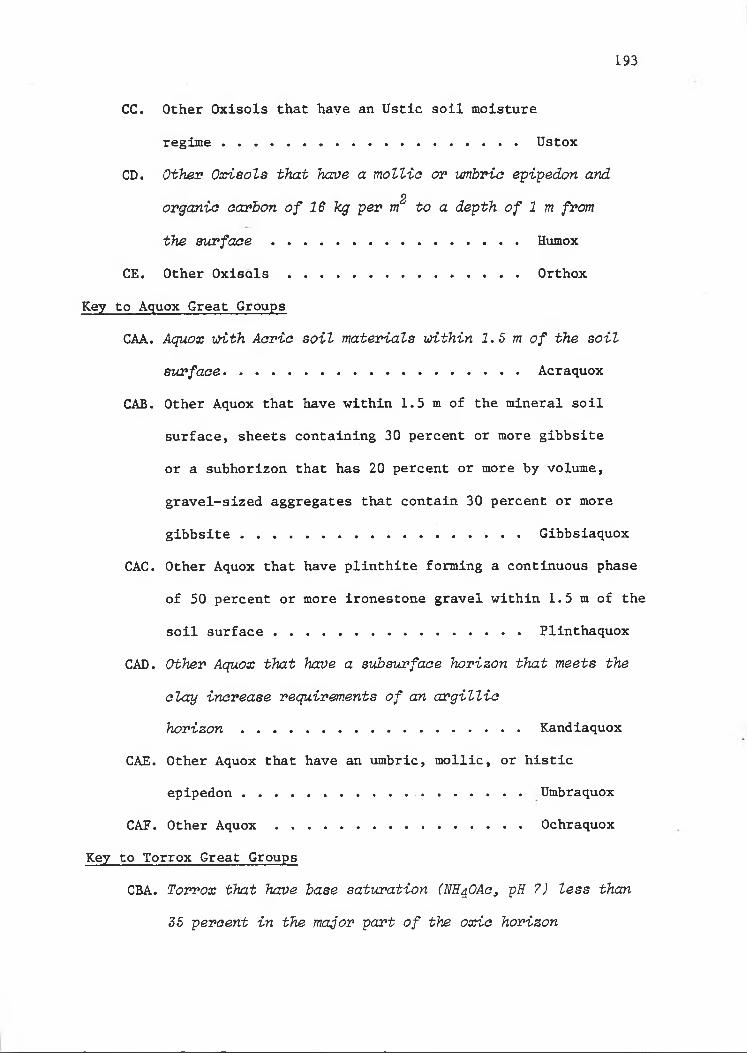
CC. Other Oxisols that have an Ustic soil moisture
regime.....................................Ustox
CD. Other OsrCsols that have a mollia or lanbrio epipedon and 2
organic carbon o f 16 kg per m to a depth of 1 m from
the s u r f a c e ................................. Humox
CE. Other Oxisols ........................... Orthox
Key to Aquox Great Groups
CAA. Aquox with Acric soil materials within 1.5 m of the soil
surface...................... ..............Acraquox
CAB. Other Aquox that have within 1.5 m of the mineral soil
surface, sheets containing 30 percent or more gibbsite
or a subhorizon that has 20 percent or more by volume,
gravel-sized aggregates that contain 30 percent or more
gibbsite ................................... GibbsiaquoxCAC. Other Aquox that have plinthite forming a continuous phase
of 50 percent or more ironestone gravel within 1.5 m of the
soil surface ............................... Plinthaquox
CAD. Other Aquox that have a subsurface horizon that meets the
clay increase requirements of an argillic
horizon ......... ........................ Kandiaquox
CAE. Other Aquox that have an umbric, mollic, or histic epipedon .................... ............ Umbraquox
CAP. Other Aquox .............................. Ochraquox
Key to Torrox Great Groups
CBA. Torrox that have base saturation ( M 4 OAO 3 pH 7) less than
35 percent in the major part of the oxic horizon
193

within a de-pth of 1.5 m .................. Dystorrox
CBB. Other Torrox ............................. Haplotorrox
Key to Ustox Great Groups
CCA. Ustox that haoe Aario soil materials within 1.5 m of the
soil s u r f a c e ............................ Acrustox
CCB. Other Ustox that have within 1.5 m of the mineral surface
sheets that contain 30 percent or more gibbsite or a sub
horizon that has 20 percent or more by volume gravel-size
aggregates that contain 30 percent or more gibbsite ........................................................ Gibbsiustox
CCC. other Ustox that have ^35 percent base saturation (NE^OACj
pH 7) in the mafor part of the oxic horizon to a depth of
1.5 m ....................................Eutrustox
CCD. Other Ustox that hare a subsurface horizon that meets the
clay increase requirement of an argillic
horizon . . . ............................ Kandiustox
CCE. Other Ustox ............................... Haplustox
Key to Humox Great Groups
CDA. Humox that have Acric soil materials within 1.5 m of the
soil s u r f a c e ..................... Acrohumox
CDB. Other Humox that have within 1.5 m o f the mineral surface^
sheets^ containing 30 percent or more gibbsite or 20 per
cent or more by volume^ gravel-sized aggregates that con
tain 30 percent or more gibbsite ......... Gibbsihumox
CDC. Other Humox that have t35 percent base saturation (NH4 OAC 3
p H 7) in the major part of the oxic horizon within a
194

depth o f 1.5 m ........................... E u t r o h m o x
CDD. Other Humox that have a subsurface horizon that meets the
clay increase requirement of an argillic
h o r i z o n .............. . Kandihumox
CDE. Other H u m o x ............................. Haplohumox
Key to Orthox Great Groups
CEA. Orthox that have Acric soil materials within 1.5 m of the
soil s u r f a c e ............................. Acrorthox
CEB. Other Orthox that have within 1.5 m of the mineral surface
sheets that contain 30 percent or more gibbsite or a sub
horizon that has 20 percent or more by volume gravel-size
aggregates that contain 30 percent or more
gibbsite ................................. Gibbsiorthox
CEC. Other Orthox that have 2 . 3 5 percent base saturation (NH4 OA0 ,
p H 7) in the major part of the oxic horizon within a depth
of 1.5 m ................................. Eutrorthox
CED. Other Orthox that have a handic horizon. . Kandiorthox
CEE.. Other Orthox ............................ Haplorthox
V. Suggested Amendments to the ICOMLAC*S summary of Properties of the Kandic Horizon
In summary, the kandic horizon is a subsurface horizon which has
a CEC of ^16 meq per 100 g clay (by NH4OAC) or have ECEC <12 (sum of
bases plus KCl extractable Al) in the fine earth fraction at a depth
of 50 cm below the top of the horizon or immediately above a lithic,
paralithic, or petroferric contact that is shallower.
195

1. A coarser textured surface horizon. The minimum thickness
of the surface horizon is 18 cm after mixing, or 5 cm if the transi
tion to the kandic horizon is abrupt.
2. More total clay than the overlying horizon and the increased
clay content is reached within a vertical distance of 1 2 cm or less
as follows;
a. If the surface horizon overlying has less than 20 percent
total clay, the kandic horizon must contain at least 4 per
cent or more clay; or
b. If the surface horizon has >20 percent total clay, the
kandic horizon must have 1 . 2 times more clay than the over-
lying horizon or at least 8 percent more clay.
3. A thickness of at least 30 cm or at least 15 cm if a lithic,
paralithic, or petroferric contact occur within 50 cm of the mineral
soil surface.
4. The layers or horizons overlying the kandic horizon do not
show any stratification and their content of organic carbon does not
decrease irregularly with increasing depth.
5. The top of the handia horizon is normally within one of the
following depths:
a. If the alay content of the surface horizon is 20 percent
or more 3 the upper boundary is within 1 0 0 cm from the mine
ral soil surface.
b. I f the clay content of the surface horizon is less than
2 0 percent and the particle size class (of part or all of
the upper 1 0 0 cm) is finer than sandy or sandy skeletalj the
196

upper boundary is within less than 125 am from the mineral
soil surfaoe.
a. I f the particle size class o f the upper 100 am is sandy
or sandy skeletal^ the upper boundary is ad a depth between
1 0 0 cm and 2 0 0 . cm from the mineral soil surface.
The above definition of the kandic hoirizon is suggested to be
diagnostic to both the LAC Ultisols and Alfisols^ hence the succeeding
amendments.
VI. Suggested Amendments to ICOMLAC*S Keys to the LAC Ultisols
Key to Aquult Great Groups
FAA ............................................. Plinthaquults
FAB ............................................. Fragiaquults
F A C ................ ............................ Albaquults
FAD Other Aquults that
1. Hare a kandic horizon; and
2. Do not have a lithic or paralithic contact within 1.5m
of the soil surface; and
3. Have a clay distribution such that the percentage of clay
does not decrease by as much as 20 percent within a depth of1.5 m from the soil surface.. . ............Kandiaquults
FAE Other Aquults that hare a kandic horizon. . . KanhaplaquultsF A F ............................................... Paleaquults
F A G ............................................... Ochraquults
Key to Humult Great Groups
FBA ............................................. Sombriaquults
FBB ............................................. Plinthohumults
197

1. Have kandia hovizon; and
2. Do not have a lithic or paralithic contact within 1.5 m
of the soil surface;
3. Have a clay distribution such that the percentage clay
does not decrease from its maximum amount by as much as 20
percent within a depth, of 1.5m from the soil surface, or
the soil has a petroferric contact within that depths
............................................. Kandihumults
FBD Other Humults that have handia horizon . . . Kanhaplohumults
FBE ............................................. Haplohumults
Key to Udult Great Groups
FCA .......................................Plinthudults
F C B ............................................... Fragiudults
FCC Other Udults that
1. Have a kandia horizon; and
2. Do not have a lithic or paralithic contact within 1.5 m
of the soil surface; and3. Have clay distribution such that the percentage of clay does not decrease from its maximum amount by as much as 20
percent within a depth of 1.5 m from the soil surface, or
have a petroferric contact within that depth.. Kandiudults
FCD Other Udults that have kandia horizon........ Kanhapludults
F C E ..............................................Paleudults
F C F ............................................... Rhodoudults
F C G ..............................................Hapludults
198
FBC Other Aquults that

FDB Other Ustults that
1. Have a kandia horizoni and
2. Do not have a lithic or paralithic contact within 1.5 m
of the soil surface;
3. Have a clay distribution such that the percentage clay does not decrease from its maximum amount by as much as 20
percent within a depth of 1.5 m from the soil surface or the
soil has petroferric contact within that depth; and
4. Have texture finer than loamy fine sand in some part of
the kandic horizon.....................Kandiustults
FDC Other Ustults that have a kandia horizon . . Kanhaplustults
F D D ....................................... Paleustults
F D E ....................................... Rhodustults
F D F ....................................... Haplustults
VII'.: Suggested Amendments to the ICOMLAC'S Key to the LAC Alfisols
Key to Aqualf Great Groups
HAA ............................................. PlinthaqualfsH A B ....................................... Na tr aqualf s
H A C .................... ........................ Duraqualfs
HAD Other Aqualfs that have a kandic horizon . . KandiaqualfsHAE ............................................. Fragiaqualfs
HAF ............................................. Glossaqualfs
H A G ....................................... Albaqualfs
H A H ......................................... Umbr aqualf s
199
Key to Ustult Great Groups
F D A .................................... .... Plinthustults

H A I ........................................... Ochraqualfs
Key to Udalf Great Groups
HEA . . . . . .................................. Agrudalfs
H E B ........................................... Natrudalfs
HEC . ..................................... Ferrudalfs
H E D ........................................... Glossudalfs
HEE ........................................... Fraglossudalfs
H E F ........................................... Fragludalfs
HEG Other Udalfs that have all the following requirements;
1. Eaoe a kandic horizon;
2. Do not have a lithic or paralithic contact within 1.5 m
of the soil surface;
3. Have a clay distribution such that the percentage of clay
does not decrease from its maximum amount by as much as 20
percent within a depth of 1.5 m from the soil surface.
Kandiudalfs
HEH Other Udatfs that have kandic horizon . . . Kanhapludalfs
H E I ........................................... Paleudalf sHE J ............................................. Rhodudalfs
H E K .......................................... Hapludalfs
Key to Ustalf Great Groups
H C A ..................................... DurustalfsHCB . . . ..■.................................. Plinthustalfs
H C C ........................................... Natrustalfs
HCD Other Ustalfs that meet all of the following requirements:
1 . Have a kandic horizon; and
200
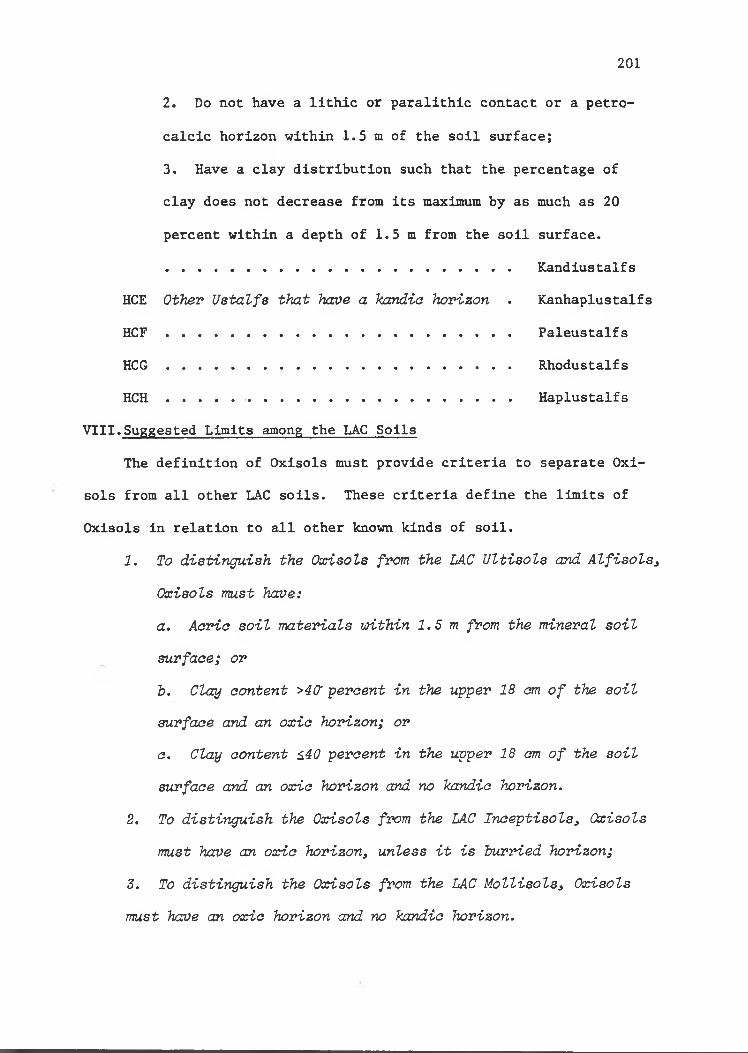
2. Do not have a lithic or paralithic contact or a petro-
calcic horizon within 1.5 m of the soil surface;
3. Have a clay distribution such that the percentage of
clay does not decrease from its maximum by as much as 20
percent within a depth of 1.5 m from the soil surface.
........................................... Kandlustalfs
HCE Other Ustalfs that have a kandia horizon . Kanhaplustalfs
H C F .................................. Paleustalfs
H C G ............................... Rhodustalfs
H C H ........ .................................. Haplustalfs
VIII.Suggested Limits among the LAC Soils
The definition of Oxisols must provide criteria to separate Oxi
sols from all other LAC soils. These criteria define the limits of
Oxisols in relation to all other known kinds of soil.
1. To distinguish the Oxisols from the LAC Ultisols and Alfisols,
Oxisols must have:
a. Acrio soil materials within 1.5 m from the mineral soil
surface; or
b. Clay content >40' percent in the upper 18 am o f the soil
surface and an oxic horizon; or
c. Clay content ^40 percent in the upper 18 am of the soil
surface and an oxic horizon and no kandic horizon.
2. To distinguish the Oxisols from the LAC Inceptisols, Oxisols
must have an oxic horizon, unless it is hurried horizon;
3. To distinguish the Oxisols from the LAC Mollisols, Oxisols
must have an oxic horizon and no kandic horizon.
201

The definition of LAC Alfisols and Ultisols must provide criteria
to separate LAC Alfisols and Ultisols from all other LAC soils. These
criteria define the limits of LAC Alfisols and Ultisols in relation to
other known kinds of soil.
1, To distinguish LAC Alfisols from LAC Mollisols^ LAC Alfisols
have a base saturation Cby NH^OAa) that is less than 50 per
cent in some subhorizon of the kandic horizon.
2. To distinguish LAC Alfisols and Ultisols from LAC Inceptisols^
LAC Alfisols and Ultisols have kandic horizon.
IX. Suggested modification of the footnote in Soil Taxonomy, page 39
For soils that are very difficult to disperse, the footnote should
read, "The percentage o f clay as measured by the pipette method or
3.5 times 15-bar water^ whichever value is higher but not more than
100 . "
202

203
APPENDIX I
Table 1. List of pedons and/or profiles used to test the ICOMSproposals.
PEDON/ SERIES PROFILE
LOCATION PRESENT CLASSIFICATION SOURCE
OX-1OX-2OX-3OX-4OX-5OX- 6OX-7OX- 8OX-9OX-IOOX-11OX-12OX-13OX-14OX-15OX-16OX-17OX-18OX-19OX-20OX-21OX-22OX-23OX-24OX-25OX-2 6OX-27OX-28
AburanAlaiBabekoBayomanBoka"BR-7""BR-14"CatalinaChock ChaiCOTODeliciasDonieFarmhillGedangHaliiJAIBAJerangauKapaaKersicKuala PilahKuamangKuamangKuamangKuantanLawaiiLihueMahanaMakapill
SumatraJambi, Sumatra Jambi, Sumatra Puerto Rico Ivory Coast Parana, Brazil Pernam., Brazil Puerto Rico Thailand Puerto Rico Pxierto Rico Ivory Coast South Africa Jambi, Sumatra HawaiiJaiba, BrazilMalaysiaHawaiiSumatraMalaysiaSumatraSumatraSumatraMalaysiaHawaiiHawaiiHawaiiHawaii
Aquic Haplorthox (K)Typic Ochraquox (K)Typic Ochraquox (K)Tropeptic Eutrorthox (H)Plinthic Haplorthox (L)Typic Eutrorthox (E)Typic Acrohtimox (E)Tropeptic Haplorthox (H)Typic Haplustox (G)Tropeptic Eutrustox (C)Typic Haplorthox (H)Plinthic Haplorthox (L)Typic Gibbsihumox (X)Typic Umbraquox (K)Typic Gibbsihtimox (F)Tropeptic Eutrustox (C)Haplic Acrorthox (F)Typic Gibbsiorthox (A)Typic Ochraquox (K)Haplic Acrorthox (F)Aquic Haplorthox (K)Typic Ochraquox (K)Typic Haplorthox (K)Haplic Acrorthox (F)Tropeptic Umbriorthox (A)Tropeptic Eutirt’Stox (A)Typic Acrohumox (A)Tropeptic Umbriorthox (A)
Sources; (A) SSIR No. 29 (1976), Hawaii; (B) Recel (1981); (C) Benchmark Soils Project (1979); (D) Soil Research Institute, Indonesia;(E) Proc. 1st ISCW (1978); (F) Proc. 2nd ISCW, Part I (1979); (G) Proc. 2nd ISCW, Part II (1979); (H) SSIR No. 12 (1967), Puerto Rico; (I) ICOMOX CL No. 9 (1982); (J) Leamy (1979); (K) Williams andHarding (1979); (L) Soil Survey Rep. of Southwest Ivory Coast (1975); (M) SSIR No. 15 (1967), Tennessee; (N) Proc. South Pacific Forxim on Soil Taxonomy (1981); (0) SSIR No. 16 (1967), Georgioa; (P) Yaibuathes (1969); (Q) Ikawa (1979); (R) Lepsch and Buol (1973); (S) de Alwis (1967);(T) SSIR No. 14, (1967), Kentucky; (U) SSIR No. 15 (1967), Tennessee; (V) Chotimon (1969); (W) Periaswamy (1969); (X) Eswaran (1983); and (Y) Mausbach (1983).

Table 1. (Continued)
204
PEDON/ SERIESPROFILE
LOCATION PRESENT CLASSIFICATION SOURCE
OX-29 OX-30 OX-31 OX-32 OX-33 OX-34 OX-35 OX-36 OX-37 OX-38 OX-39 OX-40 OX-41 OX-42 OX-43 OX-44 OX-45 OX-46 OX-47 OX-48 OX-49 OX-50 OX-51 OX-52 OX-53 OX-54 OX-55 OX-56 OX-57 OX-58 OX-59 OX-60 OX-61 OX-62 OX-63
MatanzasMeranginMolokaiMolokaiMolokaiNipePhuketPookuPuhi"P-l"”p_2"RebahRegosariRukaniSadaoSegamatSenai"SPl""SP3""SP5""SP6""SP7""SP8""SPIO""SPll""SP12""SP14""SP15""SP17"TabriWahiawaWahiawaWahiawaProfileProfile
Puerto RicoSumatraHawaiiHawaiiHawaiiPuerto RicoThailandHawaiiHawaiiIndonesiaIndonesiaSumatraSumatraStunatraThailandMalaysiaMalaysiaNew HebridesNew HebridesSolomon IslandsSolomon IslandsSolomon IslandsSolomon IslandsWestern SamoaSolomon IslandsWestern SamoaWestern SamoaVanua Levu, FijiLakeva, FijiSumatraWaiplo, Hawaii Waiplo, Hawaii HawaiiSao Paulo,Brazil Sao Paulo,Brazil
Tropeptic Eutrorthox (H)Aquic Haplorthox (F)Typic Torrox (A)Typic Torrox (A)Typic Torrox (P)Typic Acrorthox (H)Tropeptic Haplorthox (G)T3rpic Acrohumox (P)Tropeptic Umbriorthox (A)Not classified (I)Not classified (I)Typic Umbraquox (K)Aquic Haplowthox (K)Aquic Haplorthox (K)Haplorthox (P)Tropeptic Haplorthox (F)Aquic Acrorthox (F)Typic Haplohiunox (J)Tropeptic Haplorthox (J)Typic Acrorthox (J)Typic Acrorthox (J)Leptic Acrorthox (J)Haplic Acrorthox (J)Typic Gibbsiorthox (J)Typic Gibbsiorthox (J)Typic Acrorthox (J)Tropeptic Haplorthox (J)Tropeptic Eutrorthox (J)Tropeptic Eutrustox (J)Aquic Haplorthox (F)Tropeptic Eutrustox (C)Tropeptic Eutrustox (C)Tropeptic Eutrustox (A)Typic Haplorthox (R)Typic Umbriorthox (R)
ULT-1 Alaeloa Hawaii Orthoxic Tropohumult (W)ULT-2 Aibonito Puerto Rico Orthoxic Topohumult (H)ULT-3 Ban Bong Thailand Arenlc Paleustult (G)ULT-4 Ban Chong Thailand Oxic Paleustult (G)ULT-5 Bedoule Ivory Coast Plinthic Paleudult (L)ULT- 6 Besara Malaysia Typic Paleudult (F)ULT-7 "BR-3" Brazil Oxic Haplustult (E)ULT- 8 "BR-4" Brazil Typic Paleustult (E)

Table 1. (Continued)
205
PEDON/ SERIESPROFILE
LOCATION PRESENT CLASSIFICATION SOURCE
ULT-9ULT-10ULT-11ULT-12ULT-13ULT-14ULT-15ULT-16ULT-17ULT-18ULT-19ULT-20ULT-21ULT-22ULT-23ULT-24ULT-25ULT-26ULT-27ULT-28ULT-29ULT-30ULT-31ULT-32ULT-33ULT-34ULT-35ULT-36ULT-37ULT-38ULT-39ULT-40
ULT-41 ULT-42 ULT-43 ULT-44 ULT-45 ULT-46 ULT-47 ULT-48 ULT-49 ULT-50 ULT-51
"BR-8""BR-10""BR-12""BR-19""BR-20""BR-22""BR-23""BR-24""BR-25""BR-27""BR-30""BR-31"BUKBungorCAMCecilChalongCialitosDagueyDalekDaobliDAVDrasaDunmoreFacevilleGamboraGlouamoGradyGuireHayesville Humatas Haiku taxadjunct
Jagueyes Kabin Buri Kalae KeningKhlong ChackKho HongKoleaKoroniviaLanchangLimonesMab Bon
Parana Brazil Pernam., Brazil Pemam., Brazil Alagoas, Brazil Alagoas, Brazil Alagoas, Brazil Alagoas, Brazil Pemam., Brazil Pemam., Brazil Pernam., Brazil Pernam., Brazil Pemam., Brazil Indonesia Malaysia CameroonN. Carolina, USA Thailand Puerto Rico Puerto Rico Singkut, Sumatra Ivory Coast Philippines Levu, Fiji Tennessee, USA Georgia, USA Ceylon Ivory Coast Georgia, USA Ivory Coast S. Carolina, USA Puerto Rico Hawaii
Puerto RicoThailandHawaiiMalaysiaThailandThailandIvory CoastFijiMalaysiaPuerto RicoThailand
Orthoxlc Palehumult (E)Typic Haplohumult (E)Typic Paleudult (E)Oxic Haplustalf (E)Arenic Fragiudult (E)Orthoxic Tropudult (E)Typic Paleudult (E)Epiaquic Paleustult (E)Rhodic Paleudult (E)Epiaquic Paleustult (E)Typic Paleudult (E)Typic Paleudult (E)Orthoxic Topohumult (Y)Typic Paleudult (F)Typic Paleudult (C)Typic Hapludult (0)Oxic Plinthustult (G)Orthoxic Tropohumult (H)Orthoxic Tropohumult (H)Typic Paleudult (K)Typic Paleudult (L)Ultic Tropudalf (Y)Oxic Paleustult (N)Typic Paleudult (M)Typic Paleudult (0)Paleustult (S)Aquic Paleudult (L)T^ic Paleaquult (0)Typic Paleudult (L)Tj^ic Hapludult (0)Typic Tropohumult (H)Humoxic Tropohumult (A)
Oxic Tropodult (H)Oxic Haplustult (G)Ustoxic Tropohumult (A)Typic Paleudult (F)Oxic Haplustult (G)Typic Paleudult (G)Typic Paleudult (L)Humoxic Tropohumult (N)Typic Paleudult (F)Typic Paleudult (H)Oxic Paleudult (G)

Table 1. (Continued)
206
PEDON/ SERIESPROFILE
LOCATION PRESENT CLASSIFICATION SOURCE
ULT-52 ULT-53 ULT-54 ULT-55 ULT-56 ULT-57 ULT-58 ULT-59 ULT-60 ULT-61 ULT-62 ULT-63 ULT-64 ULT-65 ULT- 6 6 ULT-67 ULT- 68 ULT-69 ULT-70 ULT-71 ULT-72 ULT-73 ULT-74 ULT-75 ULT-76 ULT-77 ULT-78 ULT-79
OLL-1OLL-2OLL-3ALF-1ALF-2ALF-3ALF-4
EPT-1EPT-2EPT-3EPT-4EPT-5EPT- 6
MalanMarlboroMuse"MU-7""MU-11""MU-13"MokamboNAKNeiraNiaguiNonouaPaaloaPak ChongPauwelaPhangngaSabanaSaoaSijauSongkhlaSORTabauTelicoTokoWarinWaynsboroYasothonProfile 3Profile 4
KeahuaMakaweliPaia"BR-2" "BR-6" "BR-28" Puu Opae
AkakaHiloHoolehuaITKAKohalaKohala
Ivory CoastGeorgia, USAKentucky, USASumatraSumatraSumatraFijiIndonesia Ivory Coast Ivory Coast Ivory Coast Hawaii Thailand Hawaii Thailand Puerto Rico Ivory Coast Sumatra Thailand Philippines Ivory Coast Tennessee, USA Ivory Coast Thailand Teneessee, USA ThailandSao Paulo, Brazil Sao Paulo, Brazil
HawaiiHawaiiHawaii
BrazilParana, Brazil Pemam., Brazil Kauai, Hawaii
HawaiiHawaiiHawaiiIndonesiaHawaiiHawaii
Typic Plinthudult (L)Typic Paleudult (0)Typic Hapludult (T)Umbric Tropaquult (D)Orthoxic Tropudult (D)Plinthic Tropudult (D)Oxic Tropudult (N)Orthoxic Palehumult (Y)Typic Paleudult (L)Typic Paleudult (L)Typic Paledult (L)Humoxic Tropohumult (A)Oxic Paleustult (G)Humoxic Tropohumult (A)Typic Paleudult (G)Oxic Plinthaquult (H)Plinthic Paleudult (L)Typic Paleudult (K)Aerie Paleaquult (G)Typic Haplorthox (C)Typic Rhodudult (Y)Typic Rhodudult (U)Typic Paleudult (L)Typic Paleudult (G)Typic Paleudult (U)Typic Rhodustult (G)Orthoxic Palehumult (R)Typic Paleudult (R)
Torroxic Haplustoll (A)Torroxic Haplustoll (A)Oxic Haplustoll (A)Oxic Paleustalf (E)Rhodic Paleudalf (E)Oxic Paleustalf (E)Oxic Rhodustalf (V)
Typic Hydrandept (B)Typic Hydrandept (B)Oxic Ustropept (A)Hydric Dystrandept (Y)Ustic Humitropept (A)Ustic Humitropept (D)
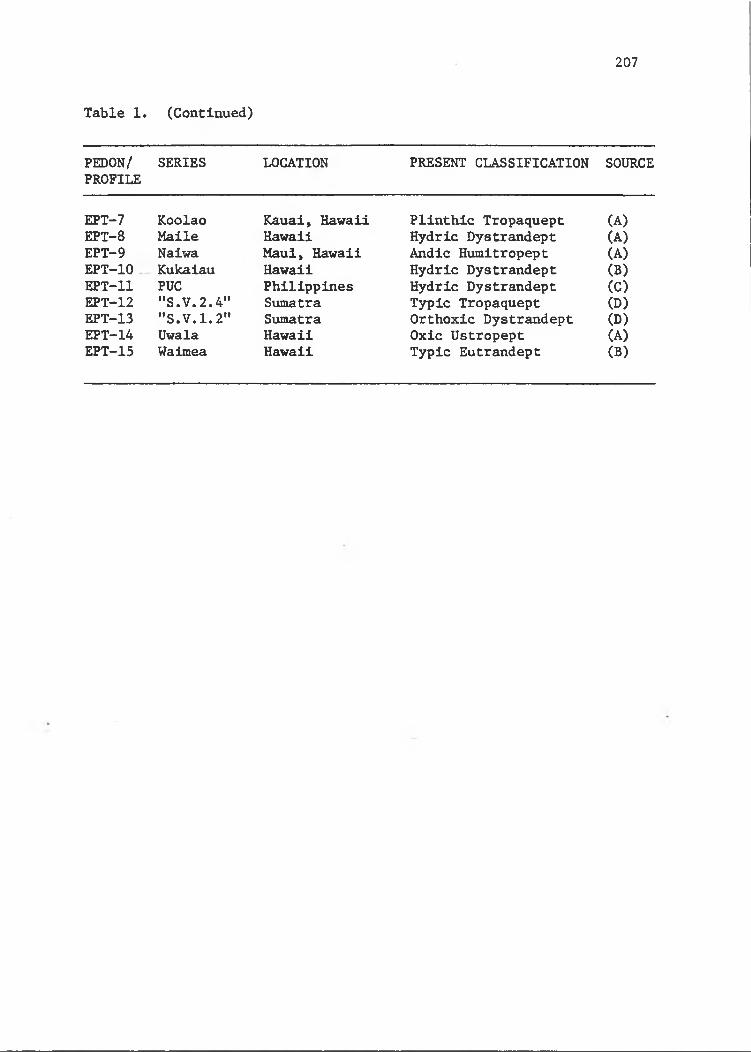
Table 1. (Continued)
207
PEDON/ SERIES PROFILE
LOCATION PRESENT CLASSIFICATION SOURCE
EPT-7 Koolao Kauai, Hawaii Plinthic Tropaquept (A)EPT- 8 Maile Hawaii Hydric Dystrandept (A)EPT-9 Naiwa Maul, Hawaii Andic Humltropept (A)EPT-10 Kukalau Hawaii Hydric Dystrandept (B)EPT-11 PUC Philippines Hydric Dystrandept (C)EPT-12 "S.V.2.4" Sumatra Typic Tropaquept (D)EPT-13 "S.V.1.2" Sumatra Orthoxic Dystrandept (D)EPT-14 Uwala Hawaii Oxic Ustropept (A)EPT-15 Waimea Hawaii Typic Eutrandept (B)

208
APPEDNIX II
Table 1. Some diagnostic features of selected pedons used to testItem 4 of the proposed definition of the oxic horizon.
Depth Horizon Clay Calculated Total Ele-^ Total CEC________ ECECments (meg/lQOg soil) Elem. (meq/lOOg clay)
(cm) (%) Ca Mg Na K
Lihue series, Tropeptic Eutrustox , Hawaii (SSIR No. 29, 1976, p 184)0-15 Apl
15-30 Ap230-53 B2153-68 B2268-120 B23
120-150 B24Kapaa series, Tjrplc Gibbsiorthox, Hawaii (SSIR No. 29,1976, p 164).
0-30 Ap 75.0 t 15.95 0.97 5.96 21.2 3.130-40 B21 89.0 - 12.45 0.97 2.34 15.77 4.2 1.240-63 B22 76.3 - 3.99 0.97 1.49 6.45 3.4 1.863-90 B23 80.3 - 6.48 0.97 1.49 8.94 2.4 1.490-123 B24 79.3 - 5.48 0.97 1.49 7.94 4.7 1.6
123-150 B25 87.0 t 18.94 0.97 1.49 21.40 7.0 1.8
Makapili series, Tropeptic Umbrlorthox, Hawaii (SSIR No. 29, 1976,pl76).
84.5 2 . 8 6 49.34 6.13 33.96 - 2 2 . 6 14.484.0 t 54.32 5.48 33.96 — 2 0 . 6 10.780.8 t 28.90 7.09 33.08 69.07 9.8 6 . 682.5 t 31.89 6.45 32.79 71.13 8 . 8 5.385.5 t 23.42 6.13 23.72 53.28 8 . 6 5.387.5 t 3.49 5.16 15.83 24.46 9.5 6 . 6
0-30 Ap 79.5 1.07 34.39 3.23 23.80 - 27.1 5.830-35 B1 r- - I - T - - 18.8 2 . 235-55 B21 87.0 t 19.94 2.90 17.85 - 16.3 2 . 155-70 B22 84.3 t 14.95 2.58 12.96 30.45 14.6 1.770-110 B23 61.5 t 15.95 1.61 5.31 22.87 9.4 0 . 8
110-150 B24 75.3 t - - - 4.9 0.4Puhi series, Tropeptic UmbriorthoXj, Hawaii (SSIR No. 29, 1976, P 178)
0-23 Ap 85.5 t 101.67 3.55 15.96 — 2 2 . 6 14.423-53 B21 - t 77.75 2.58 10.85 - 2 0 . 6 10.753-75 B22 - t 69.78 3.55 7.02 80.35 9.8 6 . 675-98 B23 97.0 t 24.42 3.55 3.19 31.16 8 . 8 5.398-120 B24 86.3 t 29.41 4.19 2.34 35.94 8 . 6 5.3"Segamat series, 1979, p 296).
Tropeptic Haplorthox, Malaysia (Proc 2nd ISCW,PartII0-4 Al 51.2 10.71 4.98 3.23 2.13 21.3 24.24-33 Blox 65.8 7.14 t t 2.13 9.27 8 . 6 5.8
33-66 B21ox 70.2 7.14 t t 2.13 9.27 8 . 6 5.866-115 B22ox 73.7 3.57 t t 2.13 5.70 5.6 1.3
115-147 B23ox 66.4 3.57 t t 2.13 5.70 6 . 0 2 . 2
* Calculations made from the oxide forms.

209
Table 1 (Continued)
Depth Horizon Clay Calculated Total Elem- Total CEC_______ECECments (meq/lOOg soil) Elem.
(cm) (%) Ca Mg Na K (meq/lOOg clay)
Kuantan series, Haplic Acrorthox, Malaysia (Proc 2nd ISCW, Part I. 197!p 308).
0-18 Al-3 59.8 3.57 4.98 t 2.13 15.4 4.718-46 B21ox 65.2 t 4.98 t t 4.98 8 . 0 1.746-121 B22ox 65.3 t 4.98 t t 4.98 6 . 2 1.5
1 2 1 - 2 0 0 B23ox 69.1 3.57 4.98 t t 8.55 4.6 1 . 1
Kuala Pilah, Haplic Acrorthox, Malaysia (Proc 2nd ISCW, Part I, 1979,p 328).0 - 1 0 Al-3 26.8 3.57 4.98 t 2.13 22.4 6.9
10-57 B210X 28.2 3.57 4.98 3.32 2.13 13.91 6.7 4.457-171 B22ox 41.5 t 4.98 t t 4.98 3.7 2 . 6
171-213 B230X 43.1 t 4.98 t t 4.98 3.4 1 . 8213-283 B24 34.4 3.57 4.98 3.23 2.13 13.91 7.7 2.5

210
Table 2. Some diagnostic features of the Sadag series, an Ustox in Amphoe Muang, Changwat, Pattalung, Thailand, used to test Item 5 of the proposed definition of the oxic horizon by the ICOMOX. Source; Yaibuathes C1969).
APFENDIX II
Depth Horizon Particle Size Analysis Texture CEC ECEC
(cm)Sand Silt
- pet-Clay (meq/ 100 g clay)
0-7 Al 82.5 1 . 8 15.7 Is 14.3 2 . 6
7-19 A3 79.0 6 . 2 15.7 Is-sl 13.6 1 . 6
19-33 B1 78.3 6 . 1 15.7 si 11.9 1.533-80 Blox 77.4 9.0 1 1 . 6 si 1 1 . 1 1.980-100 B2ox 74.5 6 . 2 19.3 si 7.6 1.7

211
APPENDIX II
Table 3. Some diagnostic features of selected pedons used to testItem 6 of the proposed definition of the oxic horizon byICOMOX.
Depth Horizon Hori- Clay CEC ECEC (X) (Y) (Z)zon ____________
(cm) bdry. meq/lOOg clay
Phuket series, Tropeptic Haplustox, Thailand (Proc 2nd ISCW Part II, 1979, p 363).
0-16 Al CS 21.0 27.6 9.0 21.0 25.2 43.816-35 B21 GS35-68 B22t GS68-90 B23t GS90-117 B23t GS
117-144 B24t GS144-180 B3t
Senai series, Haplic Acrorthox, Malaysia (Proc 2nd ISCW Part I, 1979,
34.5 41.5 55.0
2 1 . 0 27.6 9.043.8 11.4 4.342.0 11.4 3.643.5 1 0 . 6 4.143.1 10.9 5.344.2 10.9 4.145.2 11.7 4.9
p 320). 0 - 1 0 Apl C 25.9 22.3 9.4
10-25 Ap2 S 40.2 12.4 1.925-52 Blox D 56.4 6 . 0 1 . 0
52-110 B21ox D 64.2 5.0 0.7110-140 B220X D 6 6 . 6 3 .2 0 . 6
140f B3 51.9 3.9 0.7
(X) * Percent clay content of overlying coarser textured horizon.(Y) = 1.2x clay content of overlying coarser textured horizon.(Z) = Percent clay content within a vertical distance of 12 cm from the
overlying coarser textured horizon to the oxic horizon.Horizon Boundary: C= clear, S= smooth, G= gradual and D= diffuse.

212
Table 4.
APPENDIX II
Key attributes of selected pedons that 7 of the proposed ICOMOX definition of
are affected by Item the oxic horizon.
Depth Horizon CEC Saprolite(cm) Cmeq/lOOg clay) (%)
Kapaa series, Typic Gibbsiorthox, Hawaii. Source : SSIR No. 29 (1976).0-30 Ap 2 1 . 2 -
30-40 B21 4.2 540-63 B22 3.4 20
63-90 B23 2.4 4090-123 B24 4.7 *60123-150 B25 7.0 -
Makapili(1976).
series, Tropeptic Umbriorthox, Hawaii. Source: SSIR No. 29
0-25 , Ap 24.1 -
25-33 B1 13.8 -
33-53 B21 1 2 . 2 -53-83 B22 U. 5 -
83-125 B23 5.0 5125-163 B24 5.1 50
■k Strongly weathered with loam texture and sandy appearance.

aDepth Horizon CEC Clay Content Distinctness Rock Structureof Horizon
(cm) (meq/lOOg clay) (%) Boundary
Pedon OX-47, Tropeptic Haplorthox, New Hebrides. Source; Leamy et al.(1979).0-15 27.5 .82.8 I Structure of strongly weathered15-60 14.6 83.5 I rock at 60 to 90 cm.60-90 34.2 84.0
Pedon OX-50, Leptlc Acrorthox, Solomon Islands . Source: Leamy ^ (1979)0-15 Ao 18.7 35.8 S Large fragments of strongly
15-76 AC 3.8 45.3 I weathered rocks at 76 cm depth76+ AC 3.3 15.0 and below.
Pedon OX-52, Typic Gibbsiorthox, Western Samoa. Source; Leamy (1979)0-8 A 33.8 46.5 D Very strong clay, rock fragments8-31 B 11.2 43.0 D and well weathered at 72 cm.
31-72 BC 5.4 42.3 DPedon OX-54, Typic Acrorthox, Western Samoa. Source: Leamy et al. (1979)
0-15 A 30.8 48.0 M Few weathered boulders, becoming15-30 B 11.5 48.0 M very numerous below 120 cm.30-76 C 1.8 48.8
Pedon OX-55, Tropeptic Haplorthox, Western Samoa. Source: Leamy et al. (1979).0-15 A 49.0 73.0 M Mainly boulders below 97 cm.
15-46 B 14.9 59.8 D46+ C
a= Percent clay was estimated by 2.5 x 15-bar water.S= sharp (almost a line); D= distinct (less than 2.5 cm); 1= indistinct (2.5 to 6 cm); D= diffuse (>6 cm). Ref. Newzealand Soil Survey Manual.
APPENDIX II
Table 5. Selected pedons of Oxisols illustrating thin oxic horizons.
N)I— *

214
Table 1. Diagnostic features of selected pedons used to test theimpact of Item C.l of the ICOMOX's proposed key definition of the Oxisols on the LAC Ultisols.
APPENDIX III
Depth -cm—
Horizon CEC ECEC (meq/lOOg clay)
Clay-%-
ClaySkins
(X) (Y) CZ)
Kho Hong Series, Typic Paleudults, Amphoe Muang, Rayong,ThailandCProc. 2nd ISCW, Part II, 1979, pp 385-393).0-28 Ap 19.7 12.3 1 2 . 2 — 1 2 . 2 16.2 17.528-41 B1 15.4 8 . 6 17.5 —
41-76 B21t 14.0 8.7 20.7 Pt76-100 B22t 14.9 8.9 2 0 . 2 Pt100-135 B22t 18.5 8.5 19.9
Chalong series, Oxic Haplustults, Amphoe !Muang, Rayong, Thailand (Proc.2nd ISCW, Part II, 1979, pp 395-401).
0 - 1 0 Al 44.3 22.4 11.5 - 15.5 19.4 20.610-40 B1 13.3 6 . 8 2 0 . 6 pt40-63 B21t 10.0 5.4 34.8 bt63-96 B22tcn 7.9 4.5 45.6 bmT96-130 B23tcn 9.9 3.7 49.2 bmT130-150 B24t 13.7 3.8 45.9 bmT150-180 B24t 8.2 3.9 56.2 bmT
Mab Bon series, Oxic Paleustult, Amphoe Ban Kai, Thailand (Proc. 2ndISCW, Part II, 1979, pp 409-414).
0-20 Al 26.7 11.4 18.4 - 18.4 22.4 29.920-42 B21t 15.9 8 . 8 29.9 pt42-60 B22t 10.3 6.5 48.4 bmT60-90 B22t 9.6 6.3 55.0 bmT90-120 B23t 9.3 4.6 55.0 bmT120-152 B23t 10.1 5.0 54.2 bmT152-175 B3 8 . 6 4.1 60.0 bmT175-200 B3 10.3 4.7 55.0 bmT
(X)-clay content of overlying coarser textured horizon, (y)-required clay Increase at the finer textured subsurface horizon, (Z)-clay content of the finer textured subsurface horizon.
T=thick; t=thin; p«patchy; b=broken; m=moderate; w=weak; d=discon- tinuous; C-continuous; c=common; n=nearly.

Table 1 (Continued)
215
Depth —cm——
Horizon CEC_________ ECEC Clay Clay(meq/lOOg clay) -%— skins
(X) (Y) (Z)
Phangnga series, Typic Paleudults, Amphoe Makham, Chanthaburl, Thailand (Proc. 2nd ISCW, Part II, 1979. pp 353-358).
0-1616-3333-6262-8585-112112-135135-155155-180
AlBitB21tB22tB22tB23tB3tB3t
23.810.19.6 7.19.78.4 8.37.5
7.84.63.64.13.9 3.84.24.3
21.337.1 47.749.5 50.951.652.458.1
23.0 27.6 37.1
pmTbmTbmT
Khlong Chak series, Typic Paleudults, Amphoe Muang, Chanthaburi, Thailand (Proc. 2nd ISCW, Part II, 1979, pp 383-384).
0-1515-4545-7575-110110-140
AlB21tB22tB22tB23t
27.58.47.4 8.6 7.3
13.54.13.33.83.9
23.753.7 51.0 48.351.8
28.7 34.4 53.7
Songkhla series, aerie Paleaquults, Amphoe Laem Sing, Chanthaburi, Thailand (Proc. 2nd ISCW, Part II, 1979, pp367-372).
0-1515-3434-6060-8585-125125-150150-180
AllA12B21tB22tB23tgB24tgB24tg
35.927.9 11.711.3 9.2 9.710.4
12.99.26.7 6.54.84.86.2
11 . 213.432.033.944.043.942.5
12.4 14.9 32.0
btbtbmTbmT
Alaguas, Brazil (Proc. 1st ISCW, 1978, pp 237-245).0- 22 Ap 26.9 8 . 1 28.3 30.9 37.1 46.522-37 A3 18.2 4.6 34.7 —
37-68 Bit 14.6 3.0 46.5 fw6 8 - 10 2 B21t 8.3 2.4 57.8 cw102-154 B22t 8 . 6 2.9 51.0 cw154-214 B23t 1 1 . 1 3.3 42.3 fw

216
Table 1 (Continued)
Depth Horizon CEC ECEC Clay Clay (X) (Y) (Z)-cm— (meq/lOOg clay) -%— skins
Podzolico Vermelho-Amarelo Allco, Typic Paleusult, Goeana, Pernambuco,Brazil ((Proc. 1st ISCW, 1978, pp 388-396).
0-15 Ap 59.7 2 2 . 8 5.7 8 . 8 10.6 32.615-38 A2 29.4 6.4 10.9 -
38-62 B21t 14.7 3.7 32.6 —
62-82 B23 13.7 4.6 35.1 -
190-220 B3 11.2 2 . 6 31.2 -
Dalek series, Typic Paleudult, Singkut, Sumatra (Williams and Harding,1979).
0-3 Ap 112.1 - 19.0 22.3 26.8 27.03-13 Eh 8.3 - 2 1 . 0 -
13-44 Btgl 4.1 - 27.0 -
44-60 Bt2 4.0 - 30.0 Pt60-90 Bt3 nd - nd Pt90-110 Btg4 4.4 - 38.0 -
Bedoule series, Plinthic Paleudult;, Southwest Ivory Coast0-3 All 56.3 - 11.9 21.0 31.2 36.53-8 A12 46.7 - 13.5 -
8-18 B1 15.6 - 36.5 -18-30 B21 13.4 - 44.7 ft30-50 B22 14.6 - 46.7 ft50-80 IIB23cn 11.1 - 50.4 ft80-112 IIB24cn 10.7 - 51.5 ft112-159+ IIB31cn 10.1 - ' 49.3 ft
Daobll ;series, Typic Paleudult, Southwest Ivoery Coast0-3 All 73.9 — 9.6 27.3 32.8 35.03-7 A12 49.5 - 10.3 -
91-125 B24 11.9 49.5 MCmt

217
Table 1 CContinued)
Depth—cm*—
Horizon CEC ECEC ClayCmel/lOOg clay) -%-
Clayskins
(X) (Y) (Z)
Toko series, Typic Paleudult, Southwest Ivory Coast22.40-4
4-1212-2626-3838-6161-8888-156
156-196196-240
AllA12BllB12B21B22cnB23cnB31B22
85.141.919.014.712.511.512.7 9.4
10.8
24.8 21.7 22.129.252.662.761.357.9 42.0
26.9 29.2
ftMtCCct
Malan series, Typic Plinthudult, Southwest Ivory Coast34.60 -2
2-876-132180-240
AllA12IIB24cnIlCcn
120.941.912.116.2
4.38 . 656.335.7
41.5 56.3MtMt
Tabau series, Typic Plinthudult, Southwest Ivory Coast5-12 A12 31,3 - 22.4 - 25.651-78 B22 14.7 - 32.0 ct78-240 IIC2cn 16.3 - 48.5 -
30.7 32.0
Nonoua series, Plinthic Paleudult, Southwest Ivory Coast0-22-613-202
202-240
AlB1IIB24cnIIB25cn
96.8 26.6 13,517.9
30.9 -36.2 -63.7 Ct-Mmt 53.4 ct
53.9 61.9 63.7
Dunmore series, Typic Paleudult clayey, kaolinitic, mesic, Blount County, Tennessee (SSIR No. 15, 1967, pp 96-97).
0-1818-3333-5656-7171-127
ApB1B21B22C
32.412.29.511.711.8
18.158.274.275.774.7
18.1 21.7 58.2

218
Table 1 (Continued)
Depth Horizon CEC ECEC Clay Clay (X) (Y) (Z)-cm— (meq/lOOg clay) -%— skins
Bungor series, Typic Paleudult, Malaysia (Proc. 2nd ISCW, Part I, 1979, pp 304-307).
0-20 Ap 16.9 10.9 18.1 - 18.1 21.7 30.720-35 B1 10.2 7.7 30.7 -35-52 B21t 10.0 6 . 8 35.3 tc52-70 B22t 8.4 6.3 36.1 c70-90 B23t 8.2 5.6 41.2 p90-135 B31 7.6 5.2 44.3 fp
135-190 B32 7.1 5.0 47.1 -190-226 Cl 7.2 6.0 39.0 -Lanchang series, Typic Paleudult, Malaysia (Proc. 2nd ISCW, Part I, 1979, pp 291-295).
37.8 45.4 50.90-15 Ap 24.5 1 2 . 1 35.2 -
15-33 Bit 1 1 . 2 5.9 50.9 pd33-58 B21t 9.5 4.4 58.2 Cd58-89 B22t 7.7 3.4 61.3 pd89-120 B23t 6 . 8 3.1 63.9 dC120-167 B24t 6.5 1.3 63.6 dC167-210 B25t 6 . 6 1.3 66.7 dC210-237 B3t 6.4 1.3 65.3 dC237-250 C 7.2 1.4 47.1 -
Kening series, Typic Paleudult, Malaysia pp 300-301).
(Proc
0-8 A13 23.5 11.3 18.0 —
8-27 B21t 10.4 5.5 36.9 P27-57 B22t 7.7 3.9 44.8 P57-91 B23t 6.3 3.4 50.391-125 IIBtc 6.9 4.8 47.3 pd125-170 IIIBtc 6.7 3.9 43.1 pd170-209 IVBtc 7^4 3.9 39.3 pd209-250 VBtc 6 . 6 3.8 39.2 pd
28.5 34.2 44.8

219
Table 1 CContinued)
Depth
(cm)
Horizon CEC ECEC Clay Clay Content :Skins
Cmeq/lOQg clay) ©)cx) m CZ)
Saoua series, Plinthic Paleudult, Southwest Ivory Coast.
0-5 All 72.7 6 . 6 - 1 2 . 25-14 A12 32.8 11.9 -
14-40 B1 24.6 16.740-61 B21 14.2 29.5 ct61-102 IIB22 1 2 . 8 37.4 ct102-138 IIB23cn 13.8 39.8 wt138-195 IIB24cn - 39.6 wt195-240 IIB3cn 13.9 39.7 wtGlouamo series, Aquic Paleudult, Southwest Ivory Coast.
0- 6 Al 77.2 1 0 . 1 - 9.26 - 2 1 Bll 43.8 8.9 -
21-44 B12 27.4 15.7 ft44-66 IIB21 18.9 25.8 ft66-78 IIB22 10.9 26.6 cmt78-120 IIB23 14.0 27.1 cmt120-184 IIIB23 19.7 31.0 ft
Farmhill series, Typic Acrohumox (temtative)t South Africa0-16 Al 219.0 29.2 16.8 * 1 2 . 616-28 A2 280.0 1 2 . 0 1 0 . 0 -28-62 B1 74.8 4.3 11.5 -62-113 BTl 1 2 . 0 2.5 22.0 m
113-149 BT2 15.2 2 . 2 22.4 c149-165 BT3 16.6 3,4 20.4 m
* Has a positive delta pH in some horizons,•
14.6 29.5
13.2 15.7
15.0 22.0

220
Table 2. Key attributes of some Ultisols that qualify them into the order Oxisols by virtue of Item C.2 of the ICOMOX’s proposed definition of Oxisol.
APPENDIX III
Depth
—cm—
Horizon CEC ECEC Clay Clay Content Skins
(X) (Y) (Z)
(meq/lOOg clay) — %-
Pauwela series, Humoxic Tropohumult, Maui, Hawaii (SSIR No.29, 1.1976, pp 132-133).
0-1818-3030-4343-6.060-7575-103
103-138
AplAp2B21tB22tB23tB3tCl
27.5 22.2 16.214.513.310.3 11.0
3.83.02.0 0.7 0.9 2.3 3.2
57.8 60.083.888.589.578.053.0
58.7 70.4 83.4
nCnC
Haiku Taxadjunct, Hvimoxic Tropohumult, Maui, Hawaii (SSIR No. 29, 1976, pp 134-135).
0-18 Apl 24.9 2.4 63.8 - 62.5 75.0 96.018-33 Ap2 23.4 2.3 61.0 -
33-45 B21 16.1 1 . 8 96.0 -
45-70 B22 12.5 2 . 1 97.5 nC70-98 B23 15.3 4.5 83.0 c98-155 B3 14.3 3.3 83.8 Pt
155-175 Cl 19.9 3.9 62.3 T
Paaloa series, Humoxic Tropohumult, Honolulu, Hawaii (SSIR No. 29, 1976pp 144-145).
0-43 Ap ' 21.5 5.1 6 6 . 0 65.3 53.3 76.343-63 B21t 1 1 . 0 3.3 63.8 TnC63-90 B22t 8 . 1 2.4 76.3 tP90-113 B23t 9.2 2.9 78.3 tP
113-150 B24t 17.5 3.5 83.5 tPSijau series, Typic Paleudult, Alai Hilir, Sumatra (Williams & Harding,1979, p
0-2
32).Ah 43.1 15.0 42 53.1 61.1 62.0
2-17 Eh 1 0 . 6 7.0 54 none17-42 Btl 7.6 5.3 62 It
42-116 Bt2 6 . 1 4.1 70 tr
116-150 Bt3 6 . 6 4.2 71 It

221
Table 2. (Continued)
Depth Horizon CEC ECEC Clay Clay (X) C?) CZ)-------------- Content Skins
-cm- (meq/lOOg clay) -%-
Drasa series, Oxic Paleustult, Viti Levu, Fiji (Proc South Pacific Regional Forum on Soil Taxonomy, 1981, p 381).
0 - 1 0 Au 34.1 14.5 42 — 44.2 53.1 54.025-35 Bit 23.4 6.4 47 —
50-60 B2t 7.2 5.6 54 f80-90 B3t 14.2 1 0 . 0 45 f120-125 Bs 19.5 9.3 42 -Pak Chong (Proc 2nd
series, Oxic Paleustult, Amphoe Pak Chong, ISCW Part II, 1979, p 259).
Ratchasima, Thailand
0 - 1 2 Ap 19.3 13.1 83.3 — 83.9 91.3 93.712-30 B21t 14.8 8.3 85.1 bmT30-53 B21t 13.1 7.1 89.6 bmT53-90 B22t 13.2 6.5 93.7 pmT90-137 B22t 1 1 . 8 6.3 92.3 pmT
137-160 B3 1 1 . 6 6.3 92.1 -Ban Chong series. Oxic Paleustult, Amphoe Kabin Buri , Prachin Buri,Thailand i(Proc 2nd ISCW Part II, 1979, p 331)
0-13 B1 2 1 . 2 6.5 53.6 — 56.6 64.6 67.413-33 B21t 13.4 4 . 6 64.5 Pt33-53 B22t 9.7 3.4 67.453-80 B22t 13.0 3.6 66.4 -
80-106 B22t 13.1 3.9 64.1 —
106-127 B23t 13.2 3.9 64.8 -
127-143 B23t 12.3 3.8 6 8 . 0 -
143-173 B3t 13.6 5.3 59.8 -Kabin Buri series, ISCW Part II, 1979
Oxic Haplustult , P 341).
, Amphoe Kabin Buri, Thailand (Proc
0-7 Al 31.6 1 0 . 8 38.3 - 48.3 56.3 63.27-26 B1 15.9 3.9 54.6 -
26-62 B21t 1 1 . 8 3.1 63.2 mT62-95 B22t 1 0 . 8 2 . 8 71.5 mT95-130 B22t 9.8 3.7 65.4 mT
130-180 B3 17.0 5.3 36.6 -
Terra Roxa Estruturada Distrofico, Orthoxic Palehumult, Ortiguiera,Parana, Brazil (Proc 1st ISCW, 1978, p 128) •
0 - 1 0 Ap 45.5 2 0 . 2 45.3 - 48.7 56.7 59.710-25 Bit 28.4 9.6 52.9 cm25-73 B21t 19.1 4.9 59.7 cm73-167+ B22t 15.5 3.3 56.3 cm

222
Table 2. (Continued)
Depth
-cm-
Horizon CEC ECEC Clay Content
ClaySkins
(X) (Y) CZ)
(meq/lOOg clay) -%-
Limones series, Orthoxic Tropohumult, Puerto Rico (SSIR No. 12, 1967,. pp 124-125).
0-1313-2323-4141-6666-102
102-137137-183
ApB1B21tB22tB3ClC2
21.716.7 11.9 11.6 14.318.517.6
10.97.55.85.9 9.3
15.113.0
46.653.359.054.346.3 37.833.0
48.5 56.5 59.0ftptCtCtp
Grady series, Typic Paleaquult, Houston Georgia, USA (SSIR No. 16, 1967, pp 40-41).
40.9 48.9 52.70-15 Ap 53.6 17.1 38.5 —
15-28 Big 16.2 10.4 52.7 -
28-46 B21g 14.8 8.7 50.4 -
46-74 B22g 9.2 5.6 62.3 -
74-99 B23g 18.2 10.5 45.7 -
99-114 B3g 13.4 8.5 50.4 -
114-127 Cg 15.1 9.5 31.7 -

223
Depth Horizon^ Organic Base C o l o r CEC Mois- ClayCarbon Sat. meq/ ture
Horizon Mottles lOOg-cm- p e t clay
Pedon OX-14, Typic Umbraquox, Kuamang Kuning, Jamib, Sumatra.0-10 Hg 30.00 9 5YR3/2 161.9 W 27
10-25 -ABhr 2.40 4 7.5YR5/2 38.0 W 1525-80 Brl 0.41 0 10YR7/1 10YR5/3 11.8 W 1780-100 Br2 0.31 0 2.5YR6/2 10YR5/3 11.0 W 20100-125 Br3 0.25 3 10YR7/1 10YR6/2 11.2 W 33Pedon QX-2, Typic Ochraquox, Kubang Ujo, Jambi, Sumatra.
0-3 Ah 14.29 3 10YR3/2 91.1 W 373-8 ABh 9.09 2 10YR4/2 38.4 W 618-15 Brl 7.58 2 10YR6/2 34.1 W 5915-75 Br2 1.03 1 10YR7/1 7.5YR6/8 15.6 W 5275-130 Br2 0.43 4 10YR7/1 7.5YR6/8 20.1 W 78130-150 Br3 0.25 6 5GY7/1 2.5YR4/6 26.7 -Pedon OX-40, Typic Umbraquox, Singkot Rentis, Jambi, Sumatra.
0-29 He 18.00 20 10YR2/2 S29-44 Ah 4.32 31 10YR4/3 53.8 W 644-66 BAh 2.92 19 10YR5/3 18.0 W 1866-83 Brl 2.05 33 10YR6/2 5.1 W 4783-100 Br2 0.98 19 2.5YR6/2 14.6 W 35
Pedon OX-20, Typic Ochraquox, Singkot, Jambi, Sumatra.0-4 Ap 4.22 33 10YR3/1 6 6 . 8 W 224-25 BAw 1.53 11 10YR5/2 23.8 M 2625-43 Bgl 0.29 6 10YR6/3 . 8.0 M 3543-71 Bg2 0.23 6 10YR6/3 7.5YR6/4 9.0 M 4071-120 Brl 0.14 0 10YR7/1 10R4/8 9.0 M 41120-150 Br2 10YR7/1 10R4/8 WPedon OX-19, Typic Ochraquox, Hitam Ulu, Jambi, Sumatra.
0-8 Ah 12.25 9 7.5R3/2 54.0 M 678-32 BAh 1.67 2 10YR5/6 11.4 M 7232-75 Brl 0.68 0 2.5Y6/2 2.5YR4/8 8 . 6 W 7275-112 Brl 0.35 0 10YR6/1 7.5YR5/8 11.3 W 67
112-150 Brcs 0.11 0 5BG6/1 5YR4/2 13.3 W 46Source: Williams and Harding (1979).® Horizons described according to FAO-UNESCO, Soil Map of the World.Tol. 'I,' Legend (1974) pp 21-23. Moisture: W-wet, S=saturated,M=moist.
APPENDIX IV
Table 1. Key attributes of selected pedons used to test the proposedkey to suborder Aquox.

224
Table 1. (Continued)
Depth Horizon^ Organic Base C 0 l o r CEC Mois ClayCarbon Sat. meq/ ture
Horizon Mottles lOOg-CIB- -----pet------ clay
Pedon OX--3, Typic Ochraquox, Singkot, Jambi, Sumatra.0-4 Ah 3.53 9 7.5YR3/2 78.5 M 134-18 ABh 2.04 11 10YR5/4 7.5YR5/8 23.8 M 1518-40 Brl 1 . 6 8 1 1 2.5YR6/4 5YR5/8 2 1 . 2 M 1740-118 Br2 1.23 13 10YR6/2 7.5YR6/8 1 1 . 6 M 34118-150 Br3 1.19 39 10YR8/1 7.5YR6/8 3.3 W 70

225
APPENDIX IV
Table 2. Key attributes of selected pedons to test the key definitionof suborder Torrox.
Depth
(cm)
Horizon CEC ECEC (meq/lOOg clay)
ApH BaseSat.(%)
Matrixcolor
ClayContent
(%)Molokai SSIR No.
series, Typic Torrox, 29, 1976, p 180.
Honolulu County, Oahu, Hawaii. Source:
0-15 Apl 42.2^ 18.4 -0.7 41^ 2.5YR2/4 52.8 ^15-38 Ap2 37.2 15.6 -0.7 42 2.5YR3/4 56.338-65 B21 20.9 * 10.7 -0 . 6 51 2.5YR2/4 55.365-100 B22 24.9 12.3 -0.5 49 5YR3/3 57.8
100-150 C 19.2 9.1 -0 . 8 47 5YR3/4 53.0
Molokai(1969).
series. Typic Torrox, Kunia, Oahu, Hawaii. Source: Yaibuathes
0-30 Apl 27.7^ 13.4 -0 . 6 48 2.5YR3/4 52.2 ^30-82 Ap2 19.1 6.5 -0.4 34 10R3/6 49.882-110 B21 15.2 6 . 0 -0 . 2 38 10R3/6 51.0
110-130 B22 13.4 6.3 -0.4 46 10R3/6 54.3
By sum of cations.By sum of cations.Clay content by 2.5 x 15-bar water.

226
APPENDIX IVTable 3. Key attributes of pedons in the "Acr" great groups of sub
order Orthox.
Depth Horizon ECEC ... pH,, Organic Color of
(cm)(meq/lOOgclay)
H2O KCl ApH Carbon
(kg/m^)epipedon
Mahana series, Typic Acrohumox, Kauai, Hawaii (SSIR No. 29, 1976, pl58)0-13 Al 5.8 5.6 4.6 -1.0 32.6 2.5YR3/3
13-30 B21 1.3 4.8 4.6 -0 . 230-58 B22 1.2 5.0 4.8 -0 . 258-88 B23 0.5 5.1 4.8 -0 . 288-138 lie 3.2 4.4 4.4 0
Jerangau series, Haplic Acrorthox, Malaysia (ISCW, Part I, 1978, p 317).0-25 Ap 3.6 4.5 3.9 -0.6 15.0 7.5YR4/4
25-57 B 1.2 4.5 4.1 -0.457-89 B21 0.5 4.7 4.3 -0.489-130 B22 0.5 4.5 4.3 -0 . 213(>f B23 0.47 4.6 4.6 0
SP4, Typic Acrorthox, Sta. Isabel, Solomon Islands (Leamy et al. 1979).0-8 3.0 4.5 3.9 -0.6 11.9 2.5YR3/2
15-84 0 . 1 5.6 6 . 0 +0.484-137 <0 . 1 5.7 6 . 2 +0.5137-213 0 . 1 5.6 6 . 1 +0.5OX-48, Typic Acrorthox, San Cristobal, Solomon Islands (Leamy et al.1979).
0-15 0 . 1 5.0 4.6 -0.4 24.0 7.5YR5/615-66 0.3 5.4 5.6 -0 . 166-74 0 . 1 5.1 5.6 +0.574-99 0 . 1 5.4 6 . 0 +0 . 6
OX-49, Leptic Acrorthox, Sta. Isabel, Solomon Islands (Leamy et al.1979)
0-15 2.9 4.7 4.2 -0.5 21.4 10R3/323-46 0 . 1 5.8 5.8 0 . 046-91 0 . 1 5.7 6 . 0 + 1 . 0
OX-50, Haplic Acrorthox, Kolombangara, Solomon Islands (Leamy et al.1978)
0-15 Al 1.7 4.4 4.0 -0.4 8.0 7.5YR5/615-76 Alg 0.1 5.2 5.5 +0.376+ AC 0.2 5.7 6 . 0 +0.3

227
Table 3. (Continued)
Depth
(cm)
Horizon ECEC(meq/lOOgclay)
H2OpHKCl ApH
Organic Color of Carbon epipedon(kg/m3)
OX-51, Haplic Acrorthox, Kolombangara, Solomon Island (Leamy et al.1979).
0 - 1 0 All 8.7 4.3 3.7 -0 . 6 18.0 2.5YR4/410-28 A1228-81 B 0 . 1 4.9 4.8 -0 . 181-127
Kuantan series, Haplic Acrorthox, Malaysia (Proc; ISCW, Part I, 1979,pp 308-310).
0-18 A13 4.7 4.3 3.9 -0.4 7.518-46 B210X 1.7 4.6 4.1 -0.546-121 B22ox 1.5 4.8 4.8 0 . 0
1 2 1 - 2 0 0 B230X 1 . 2 4.8 4.3 -0.5Senai series, Haplic Acrorthox, Malaysia (Proc. ISCW, Part I,.1979,pp 320-322).
0 - 1 0 Apl 9.4 4.1 3.9 -0 . 2 13.1 7.5YR3/310-25 Ap2 1.9 4.4 4.0 -0.425-52 Blox 1 . 0 4.6 4.1 -0.552-110 B210X 0.7 4.6 4.3 -0.3
110-140 B22ox 0.9 4.7 4.4 -0.3140+ B3 0.7 4.9 4.7 -0 . 2
Nipe series, Typic Acrorthox, Puerto Rico (SSIR No. 12, 1967)0 - 1 1 Al 7.9 5.1 4.3 -0 . 8 38.0 2.5YR2/4
11-18 B1 1.7 5.0 4.4 -0 . 618-25 B21 5.0 4.7 -0.325-38 B22 5.2 5.7 +0.538-48 B23 0 . 2 5.5 6 . 1 +0 . 648-62 B24 t 5.7 6.4 +0.762-70+ Cl t 5.8 6.7 +0.9
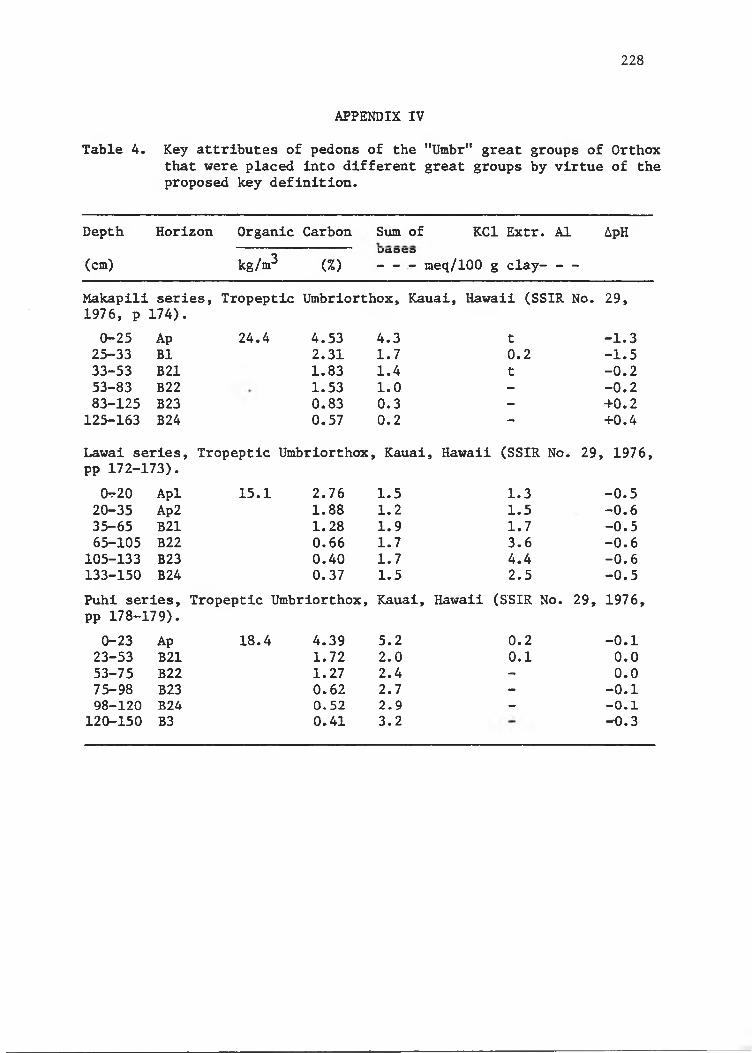
228
Table 4. Key attributes of pedons of the "Umbr" great groups of Orthox that were placed into different great groups by virtue of the proposed key definition.
APPENDIX IV
Depth Horizon Organic Carbon Slim of KCl Extr. Al ApH
(cm) kg/m^ (%)uciaeo- - - meq/1 0 0 g clay- - -
Makapili series, Tropeptic Umbriorthox, Kauai, Hawaii (SSIR No. 29,1976, p 0-25
174).Ap 24.4 4.53 4.3 t -1.3
25-33 B1 2.31 1.7 0 . 2 -1.533-53 B21 1.83 1.4 t -0 . 253-83 B22 1.53 1 . 0 - -0 . 283-125 B23 0.83 0.3 - +0 . 2125-163 B24 0.57 0 . 2 - +0.4
Lawai series, Tropeptic Umbriorthox , Kauai,, Hawaii (SSIR No. 29 , 1976,pp 172-173).
Ot-20 Apl 15.1 2.76 1.5 1.3 -0.520-35 Ap2 1 . 8 8 1 . 2 1.5 -0 . 635-65 B21 1.28 1.9 1.7 -0.565-105 B22 0 . 6 6 1.7 3.6 -0 . 6
105-133 B23 0.40 1.7 4.4 -0 . 6133-150 B24 0.37 1.5 2.5 -0.5Puhi series, Tropeptic Umbriorthox, Kauai, Hawaii (SSIR No. 29, 1976,pp 178-179).
0-23 Ap 18.4 4.39 5.2 0 . 2 -0 . 123-53 B21 1.72 2 . 0 0 . 1 0 . 053-75 B22 1.27 2.4 - 0 . 075-98 B23 0.62 2.7 - -0 . 198-120 B24 0.52 2.9 - -0 . 1
120-150 B3 0.41 3.2 -0.3

229
Table 5. Some genetic factors of the Makapili, Lawall and Puhi series in Hawaii.
APPENDIX IV
Genetic Factors Makapiliseries
Puhiseries
Lawaiseries
Parent Material Basalt Basalt Colluvium
Elevation (m) 72 90 225
Mean Annual Rainfall .(cm)
188 175 250
Mean Annual ^ Temperature ( C)
2 2 . 2 2 2 . 2 2 0 . 0
Uses sugarcane grazing woodland forest reserve
sugarcane grazing woodland wild life
habitat pineapple truck crops ocrhcard
sugarcane pinapple
Sources: SSIR No. 29, 1976; LSB Cir. No. 9 (1967) and; Soil SurveyStaff (1972).

APPENDIX IVTable 6 . Key attributes of selected pedons of the great groups of Eutrorthox.
Depth
(cm)
Horizon Matrixcolor
Clay
(%)
Organic Carbon CEC ECEC
kg/m (%) (meq/1 00 g clay)
BaseSat.(%)
ApH Horizon Clay Bdry. Skins
Bayoman series, Tropeptic Eutrorthox, Puerto Rico (SSIR No. 12, 1967, p 157)0-2020-4646-6969-9999-130
ApB21B22B23B3
5YR3/42.5YR3/62.5YR3/62.5YR4/62.5YR4/6
73.381.285.589.590.6
10.3 2.73 20.7 ; 14;9 72 -0.7 CS -0.94 11.7 8.4 68 -0.7 GS tp0.55 10.1 8.3 83 -0.5 GS tp0.35 10.9 9.1 83 -0.4 GS tp0.25 15.6 13.8 89 0 . 0 AS -
, oxidlc, isohyperthermic. Puerto Rico (SSIR No. 121967, p 159).
0-35 Al 2.5YR3/4 51.5 15.1 2.84 28.9 - - - - -
35-68 B21 lOY-2.5YR3/4 83.0 1.03 1 0 . 1 - - - - -
68-97 B22 2.5YR5/6 87.0 0.55 8 . 2 9.4 115 - - -Latossolo Roxo Eutrofico, Typic Eutrorthox, Londrlna, Parana, Brazil (Proc. 1st ISCW, 1978,pp 123
0-18 Ap 1YR3/3 59.7 14.2 2.54 35.4 19.2 53 -1 . 1 CS -18-30 A3 1YR3/3 61.4 1.79 30.4 15.9 52 -1 . 1 CS -
30-80 B1 1YR3/4 69.0 0.82 19.2 8 . 8 46 -1 . 0 DS -80-150 B21 1YR3/4 65.6 0.57 16.2 6.4 40 -0.5 DS -
150-235 B22 1YR3/5 65.6 0.31 13.4 4.8 37 +0.4 DS -235-275+ B23 1YR3/6 63.9 0 . 2 2 13.5 5.4 42 +0 . 2 - -
K>o

231
APPENDIX IV
Table 7. Key attributes of selected pedons to the Aquic subgroupsof Haplorthox.
Depth
(cm)
Horizon Color of Mottles
Clay CEC Content meq/100
g clay(%)
Moisture ClayRatio
Merangln series, Aquic Haplorthox, Hitam Ulu, Sumatra.. Source: Williamsand Harding (1979), p 194.
0 - 1 1 Ah — 43 28.1 M11-40 BAh — 51 15.3 M40-60 Bws 2.5YR5/8 64 10.5 M 1.460-91 Bwsgl 10YR6/1 71 . 10.3 M91-133 Bwsg2 10YR6/1 73 1 1 . 6 M133-150 Br 10YR7/1 75 1 1 . 6 MTabri series, Aquic Haplorthox, Hitam Ulu, Sumatra. Source; Williamsand Harding (1979), p 184.
0 - 1 0 Ah — 71 16.5 M10-40 Bws - 77 9.6 M40-60 Bgl 10YR6/1 79 9.0 M 1 . 060-115 Bg2 N7 78 8.5 M
115-150 Bg3 N7 76 9.3 MRegosari series, Aquic Haplorthox, Hitam Ulu, Sumatra . Source; Williamsand Harding (1979), p 180.
0-17 Ah — 41 20.5 M17-47 Bwsl - 47 11.3 M47-90 Bws2 - 50 9.6 M 1 . 290-111 Bgds 10YR6/1 52 9.8 W
111-150 Brcs 10YR6/1 48 10.4 WKuamang series, Aquic Haplorthox, Kuamang Kuning, Sumatra. Source:Williams and Harding (1979), p 122 • .
0 - 1 2 Ah — 26 52.7 M12-50 Bws - 31 11.3 M 1 . 150-73 Bg 10YR7/2 29 9.3 W73-90 Brl - 13 11.5 W90-120 Br2 — 22 9.5 W
Moisture: M= moist and W= wet.* Ratio of clay content of the finer textured subhorizon to the caorser
textured overlying horizon.

232
Table 7. (Continued)
Depth
(cm)
Horizon Color of Mottles
ClayContent
(Z)
CEC meq/1 00 g clay
Moisture ClayRatio
Aburan series, Aquic Haplorthox, Kuamang Kunlng, Sumatra. Source:Williams and Harding (1979), p 118.
0-5 Ah — 2 1 70.0 M5-10 ABh - 19 28.4 M
10-33 Bwsl - 25 12.4 M33-102 Bws2 - 27 11.5 M 1 . 2102-130 Bg 10YR7/2 22 11.4 M130-150 Br - 34 1 1 . 8 WRukani series, Aquic Haplorthox, Hitam Dlu, Sumatra. Source: Williamsand Harding (1979), ]p 2 02.
0-3 Ah — 51 39.0 M3-19 ABh - 52 19.8 M19-58 Bws 7.5YR6/8 62 1 2 . 6 M58-110 Brl 2.5YR4/6 68 11.9 M 1.3
110-150 Br2 2.5YR4.8 75 13.6 M

233
Table 8. Key attributes of sleeted pedons used to test the Plinthic definition at the subgroup level.Source: Soil Survey of the Southwest Region Clechnical Appendix), Ivory Coast (1967).
APPENDIX IV
Depth
(cm)
Horizon ClayContent
(%)
CEC meq/ 100 g clay
Description
Boka series, Plinthic Haplorthox, Southwest Ivory Coast.0-3 Al 38.2 8 8 . 6 34% by weight ironstone gravel.3-9 A3 32.2 50.6 70% by weight ironstone & quartz
gravel & iron cemented rocks.42-119 IIB22 51.4 1 2 . 8 38-24% by weight ironstone gravel
and schist.119-240 lie 2 1 . 8 1 0 . 1 Much hard and soft plinthite.Donie series, Plinthic Haplorthox, Southwest, Ivory Coast.
0- 6 Al 8.9 58.5 —
6 - 1 2 A3 11.4 39.5 -
65-102 IIB23 45.7 3.9 15-65% by weight fine ironstone gravel & quartz fragments.
102-248 lie 26.8 17.9 Soft & hard plinthite that form continuous phase.
Bedoule series, Plinthic Paleudult, Southwest, Ivory Coast.0-3 All 11.9 56.3 15% by weight ironstone gravel.3-8 A12 13.5 46.7 52% by weight fine ironstone
gravel.8-18 B1 36.5 15.6 55% by weight fine & medixim ferro'
genous gravel.18-30 B21 44.7 13.4 26% by weight fine ferrogenuous
gravel.30-50 B22 46.7 14.6 24% by weight fine ironstone
gravel.50-80 IIB23cn 50.4 1 1 . 1 20% by weight hard plinthite and
quartz fragments.80-112 IIB24cn. 51.5 10.7 1 2% by weight fragments of hard
plinthite.112-159+ IIB37cn 49.3 1 0 . 1 9% by weight quartz fragments
and gnelssic pseudomorphs.
Nonoua series, Plinthic Paleudult, Southwest Ivory Coast.0- 2 Al 30.9 96.8 5% by weight ironstone gravel.2 - 6 B1 36.2 26.6 Less than 5% by weight iron
stone gravel.113-202 IIB24cn 63.7 13.5 14-70% by weight ironstone
gravel.202-240 IIB25cn 53.4 17.9 —

234
APPENDIX V
Table 1. Properties of selected Inceptisols that were used to testItem 2 of the proposed definition of the oxic horizon byICOMOX.
Depth Horizon ECEC CECmeq/lOOg clay
(cm)
Texture ClayContent(%)
OrganicCarbon(%)
Koolau series, Plinthic Tropaquept , Kauai, Hawaii (SSIR No. 29, 1976P 74).
0-15 All 3.8 89.8 sicl 70.7 8.6515-28 A12g 1 . 2 56.9 sic 58.9 1.7328-40 A2g 5.5 34.6 sic 34.6 0.7840-100 B21g 8 . 8 169.7 sicl 25.1 0.94100-130 B22t 7.1 217.5 sicl 25.2 2.29130-180 C 13.5 325.3 sicl 17.0 1.08Naiwa series. Andie Humitropept, Maui, Hawaii (SSIR No. 29, 1976 P 78)
0-10 Ap 17.8 27.1 sicl 40.0 5.0510-28 A12 1 0 . 8 26.3 sicl 43.6 4.1028-35 B1 3.1 42.7 sil 48.2 3.9935-65 B2 5.3 80.4 sil 28.5 9.6665-100 B3 6 . 2 89.6 1 22.5 10.34
100-130 IICl 5.4 88.7 1 25.9 10.34Kohala series,, Ustic Humitropept, Hawaii, Hawaii.(SSIR No. 29, 1976,P 82).
0-18 Apl 16.6 45.8 sic 70.5 2 . 6 818-35 Ap2 16.4 49.9 sic 69.0 2.4035-68 B21 11.5 33.1 sic 72.0 0.9768-98 B22 7.5 26.5 sic 72.0 0 . 6 698-113 Cl 14.0 35.5 - 77.3 0.80
113-133 C2 14.5 43.4 - 71.5 0.30Uwala series. Oxic Ustropept, Maui , Hawaii (SSIR No. '29, 1976, p 90).
0-20 Apl 13.3 24.2 sicl 57.8 2.1320-40 Ap2 12.7 2 1 . 1 sicl 66.3 1.4240-70 B2 12.3 18.0 sicl 70.0 0.4670-105 Cl 1 1 . 8 18.8 sicl 77.0 0.54105-155 IIC2 10.3 2 1 . 0 sicl 78.5 0.24Pedon SV.2.4, Typic Tropagquept, Lampung, Sumatra (SRI, 1975).
0-14 Al 9.0 44.8 scl 27.0 1.4014-45/50 B21 4.3 26.1 scl 33.0 0.4745/50-72 BC 2.5 2 1 . 6 scl 37.0 0 . 2 1

235
APPENDIX VI
Table 1. Some physical characteristics of selected Oxisols.
Depth Clay 15-Bar % ClayContent Water Content 15-Bar Water
(cm) (%) a)Pedon OX-62, Typic Umbriorthox, Sao Paulo, Brazil. Source; Lepsch andBuol (1973).
0 - 1 2 74 23.3 3.212-33 75 24.3 3.133-64 77 26.4 2.964-90 79 27.2 2.990-140 79 26.8 2.9
Pedon OX-63, Typic Haplorthox, Sao Paulo, Brazil. Source; Lepsch andBuol (1973).
0-15 70 26.4 2.715-36 77 25.1 3.136-65 79 25.3 3.165-140 77 25.7 3.0140-180 76 26.2 2.9Phuket series, Tropeptic Haplustox, Thailand. Source; Proc 2nd ISCW,Part II, 1979.35-68 42.0 13.0 3.268-90 43.5 16.4 2.790-117 43.1 15.5 2.8
117-144 44.2 17.0 2.6Coto Taxadjunct, Tropeptic Eutrustox, Isabela, Puerto Rico. Source; BSPTech. Report No. 5 (1979).
0-13 70.7 22.5 3.113-25 71.1 22.8 3.125-45 75.9 23.7 3.245-65 79.6 26.4 3.065-90 81.9 26.8 3.1
Jalba series, Tropeptic Eutrustox, Minas Gerais, Jaiba, Brazil. Source: BSP Tech. Report No. 5 (1979).
0-1010-2020-5050-120120-200
56.463.1 58.352.253.2
22.2
20.4
2.5
2.9

236
Table 1. (Continued)
Depth Clay 15-Bar % ClayContent Water Content 15-Bar Water
Ccm) (%) (%)
Choc Chal II, 1979,
series, Typic Haplustox, Thailand, p 317.
Source; Proc 2nd ISCW, Part
0-14 56.8 15.0 3.814-36 69.7 17.2 4.136-60 66.9 17.1 3.960-86 68.9 17.6 3.98 6 - 1 2 0 68.7 17.2 4.0120-156 69.8 17.3 4.0156-185 67.5 17.0 4.0185-200 67.9 17.3 3.9

237
Table 2.APPENDIX VI
Clay content and soil water retention characteristics and ratio of percent clay to 15-bar water content of selected Ultisols.
Depth Clay 15-Bar % ClayContent Water Content 15-Bar Water
(cm) (%) (%)Pak Chong series, Thailand., Source: Proc 2nd ISCW Part II, 1979, p 163.
0 - 1 2 83.3 21.9 3.812-30 85.1 23.1 3.730-53 89.6 24.1 3.753-90 93.7 25.3 3.790-137 92.3 25.3 3.7
137-160 92.1 24.3 3.8160-200 92.5 24.4 3.8Yasothon series, Thailand. Source: Proc 2nd ISCW Part II, 1979, p 301.
0-14 4.5 1.9 2.414-34 6 . 1 2.3 2 . 634-62 7.7 - -
62-85 15.8 5.0 3.285-115 18.6 5.5 3.4115-150 14.9 4.8 3.1150-175 14.1 4.4 3.2175-200 14.5 4.7 3.1Orthoxic Palehumult, Bao Paulo, Brazil. Sourcer Lepsch and Buol (1973).
0 - 1 0 68 19.7 3.510-25 68 20.5 3.325-40 67 20.5 3.340-47 75 2 2 . 6 3.347-82 76 24.3 3.182-100 77 25.4 3.0Cypic Palehumult, Sao Paulo, Brazil. Source: Lepsch ,
0 - 1 0 59 18.1 3.510-19 61 18.9 3.219-27 60 19.0 3.227-64 78 26.5 2.965-95 81 17.7 2.995-100 82 28.4 2.9

Table 3. Efffect of the proposed factor 3.5 as an estimate of clay content (JLclay =* 3.5 x 15 bar water) in the classification of selected oxic subgroups of Inceptisols.
APPENDIX VI
Depth(cm)
Horizon CECmeq/100 g soil
CECmeq/ 10 0 g clay
CECmeq/ 100 g clay
HorizonBoundary
Mica(%)
Hoolehua series, Oxic Ustropept, Hawaii. Source: SSIR No. 29, 1976, p 8 6.20.83 CS18.13 CW14.29 CW13.69 CW13.87 GW13.86
0-2323-3838-5353-6868-123
123-160
AplAp2BllB12B21B22
15.614.6 11.2 10.4 10.19.8
29.1625.39 20.0019.17 19.4219.40
15
15
15
Uwala series, Oxic Ustropept, Hawaii. Source: SSIR No. 29, 1976,0-1818-3838-7575-110
110-150
AplAp2B2B3C
11.910.7 12.0 12.411.8
20.916.916.415.5 16.2
p 92.14.912.1
*
**
CWAWCWCW
* Percent clay content greater than 100 when estimated with the factor 3.5.
N)OJ00

239
LITERATURE CITED
ALLAN, R. J., and F. 0. Hole. 1968. Clay accumulation in some Haplu- dalfs as related to calcareous till and incorporated loess on drumlins in Wisconsin. Soil Sci. Soc. Amer. Proc. 32:403-408.
ARNOLD, R. W. 1979. Concept of the argillic horizon and problems of its identification, p. 21-33. ^ F.H. Beinroth and S. Panichapong (Eds). Second International Soil Classification Workshop. Part II, Thailand.
BEINROTH, F. H. 1979. The Oxisols of Puerto Rico. p. 263-275. ^ F. H. Beinroth and S. Paramananthan. Second International Soil Classification Workshop Proc. Part I, Malaysia.
____________________ . Laboratory data and description of soils of theBenchmark Soils Project. University of Puerto Rico and University of Hawaii. Tech. Report 5, 8 p.
BENNEMA, J. and M. Camargo. 1979. Some remarks on Brazilian latosols in relation to the Oxisols of Soil Taxonomy, p. 233-261. In F. H. Beinroth and S. Paramananthan. Proc. Second International Soil Classification Workshop. Part I, Malaysia.
BENCHMARK SOILS PROJECT. 1981. Annual Report 1980-1981. 131 p. Dept.Agron and Soil Sci., College of Tropical Agric. and Human Resources, Univ* of Hawaii and Dept, of Agron. and Soil, College of Agric.Sci., Univt.Puerto Rico.
_____________________ _ . 1980. Annual Report 1979-1980. 114 p. Dept.Agron. and Soil Sci., College of Tropical Agric and Human Resources, Univ. Hawaii and Dept, of Agron. and Soil, College of Agric. Sci., Univ. Puerto Rico.
_______________________ . 1979. Development of the Transfer model andsoil taxonomic interpretations on a network of three soil families. Progress Report No. 2. 80 p. Dept. Agron. and Soil Sci., College . of Tropical Agric. and Human Resources, Univ. of Hawaii and Dept, of Agron. and Soil, College of Agric. Sciences, Univ. Puerto Rico.
1979. Research on agrotechnology transfer inthe tropics based on the soil family. Progress Report No. 1. Dept. Agron. and Soil Sci., College of Tropical Agric. and Human Resources, Univ. Hawaii, and Dept, of Agron. and Soil, College of Agric. Sciences, Univ. Puerto Rico.
___________________. 1977. Annual Report 1975-1976. Dept. Agron. andSoil Sci.,

College of Tropical Agric. and Human Resources, Univ. Hawaii, and Dept, of Agron. and Soil, College of Agric. Sciences, Univ. Puerto Rico.
BUOL, S.W. 1979. Geomorphology of some Oxisols. p. 37-45. IN F.H. Beinroth and S. Paramananthan. Proc. Second International Soil Classification Workshop. Part I, Malaysia.
■ 1979. Occurrence of soils with low activity clays in the U.S.
240
and Puerto Rico, p 147-165. ^ F.H. Beinroth and S. Panichapong (Eds). Proc. Second International Soil Classification Workshop.Part II. Thailand.
CLINE, M.G. 1980. Experience with Soil Taxonomy of the United States.Adv. Agron., 33.193-226.
__________ . 1955. Soil survey of the territory of Hawaii. Soil SurveySeries 1939, No. 25, SCS, USDA and Hawaii agricultural Expt. Station.
COMERMA, J.A. 1979. Low activity clay Alfisols and Ultisols in Venezuela, p. 139-145. ^ F.H. Beinroth and S. Panichapong (Eds.). Second International Soil Classification Workshops. Part II, Thailand.
DE ALWIS K.A. 1979. LAC Alfisols and Ultisols of Sri Lanka, p. 119-127.IN F.H. Beinroth and S. Panichapong (Eds.). Proc. Second International Soil Classification Workshop. Part II. Thailand.
DE DATTA, S.K., R.L. Fox, and G.D. Sherman. 1963. Availability of fertilizer phosphorus in three latossols of Hawaii. Agronomy Journal 55: 311-313.
ESWARAN, H. 1979. Micromorphology of Oxisols. p. 61-74. IN F.H. Beinroth and S. Paramananthan (Eds.). Proc. Second International Soil Classification Workshop. Part I, Malaysia.
1979. Micromorphology of Alfisols and Ultisols with low activity clays, p. 53-76. IN F.H. Beinroth and S. Panichapong (Eds.). Proc. Second International Soil Classification Workshop. Part II, Thailand.
FOOTE, D.E., E.L. Hill, S. Nakamura, and F. Stephens. 1972. Soil survey of the Islands of Rauai,Oahu, Maui, Molokai, and Lanai, State of Hawaii. SCS, USDA, in cooperation with Univ. of Hawaii Agr. Expt.Sta. U.S. Government Printing Office, Washington D.C.
FOX, R.L., D.L. Plucknett and A.S. Whitney. 1968. Phosphate requirements of Hawaiian latossols and residual effect of fertilizer phorphorus. Int. Congr. Soil Sci., Trans. 9th (Adelaide, Australia). II. 301-310.
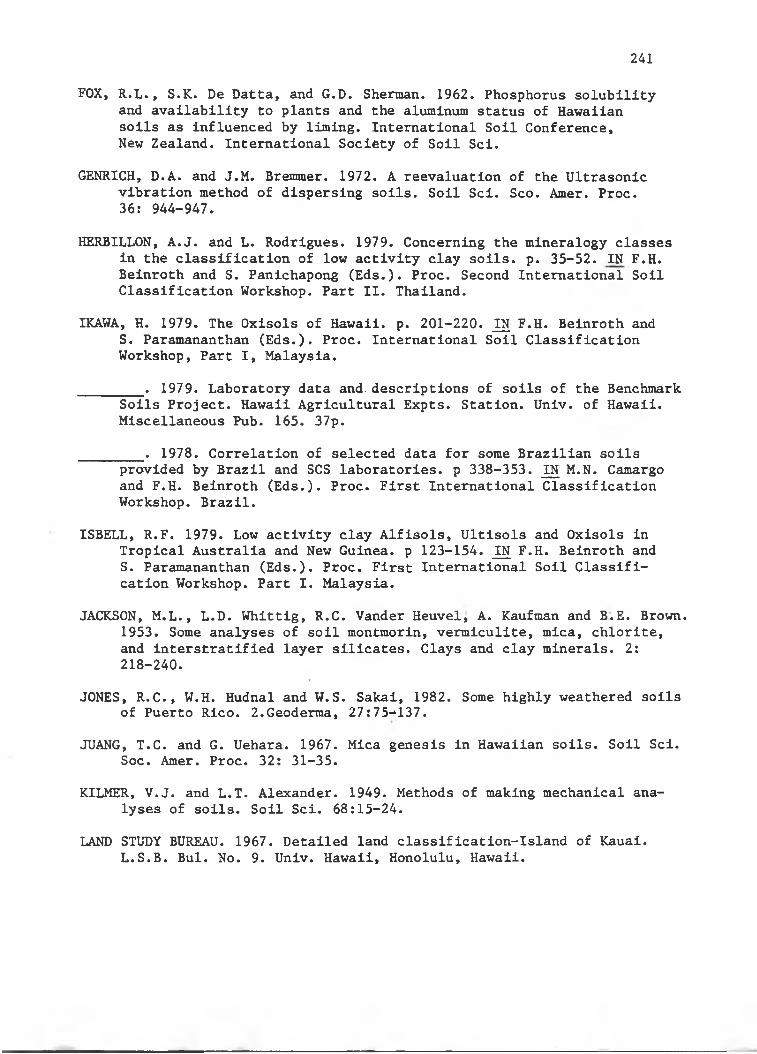
FOX, R.L., S.K. De Datta, and G.D. Sherman. 1962. Phosphorus solubility and availability to plants and the aluminum status of Hawaiian soils as influenced by liming. International Soil Conference,New Zealand. International Society of Soil Sci.
GENRICH, D.A. and J.M. Bremmer. 1972. A reevaluation of the Ultrasonic vibration method of dispersing soils. Soil Sci. Sco. Amer. Proc.36: 944-947.
HERBILLON, A.J. and L. Rodrigues. 1979. Concerning the mineralogy classes in the classification of low activity clay soils, p. 35-52. IN F.H. Beinroth and S. Panichapong (Eds.). Proc. Second International Soil Classification Workshop. Part II. Thailand.
IKAWA, H. 1979. The Oxisols of Hawaii, p. 201-220. ^ F.H. Beinroth and S. Paramananthan (Eds.). Proc. International Soil Classification Workshop, Part I, Malaysia.
________ . 1979. Laboratory data and. descriptions of soils of the Benchmark
241
Soils Project. Hawaii Agricultural Expts. Station. Univ. of Hawaii. Miscellaneous Pub. 165. 37p.
. 1978. Correlation of selected data for some Brazilian soilsprovided by Brazil and SCS laboratories, p 338-353. ^ M.N. Camargo and F.H. Beinroth (Eds.). Proc. First International Classification Workshop. Brazil.
ISBELL, R.F. 1979. Low activity clay Alfisols, Ultisols and Oxisols in Tropical Australia and New Guinea, p 123-154. ^ F.H. Beinroth andS. Paramananthan (Eds.). Proc. First International Soil Classification Workshop. Part I. Malaysia.
JACKSON, M.L., L.D. Whlttig, R.C. Vander Heuvel, A. Kaufman and B.E. Brown. 1953. Some analyses of soil montmorin, vermiculite, mica, chlorite, and interstratified layer silicates. Clays and clay minerals. 2: 218-240.
JONES, R.C., W.H. Hudnal and W.S. Sakai, 1982. Some highly weathered soils of Puerto Rico. 2.Geoderma, 27:75-137.
JUANG, T.C. and G. Uehara. 1967. Mica genesis in Hawaiian soils. Soil Sci. Soc. Amer. Proc. 32: 31-35.
KILMER, V.J. and L.T. Alexander. 1949. Methods of making mechanical analyses of soils. Soil Sci. 68:15-24.
LAND STUDY BUREAU. 1967. Detailed land classification-Island of Kauai. L.S.B. Bui. No. 9. Univ. Hawaii, Honolulu, Hawaii.

LATHAM, M. 1981. Oxisols. p 159-170. ^ R.J. Morrison and D.M. Leslie (Eds.). Proc. South Pacific Regional Forum on Soil Taxonomy,Suva, Fiji.
LEAMY, M.L., L.S. Blakemore and D.M. Leslie. 1979. Oxisols of the South Pacific, p. 155-200. ^ F.H. Belnroth and S. Paramananthan (Eds.). Proc. Second International Soil Classification Workshop. Part I . Malaysia.
LEPSCH, I.F. and S.W. Buol. 1974. Investigation in an Oxisol-Ultisol toposequence in Sao Paulo State, Brazil. Soil Sci. Soc. Amer.Proc. 38; 491-496.
LESLIE, D.M. and L.C. Blakemore. 1978. Properties and classification of the soils from Lakeba, Lau group, Fiji. ^ Lau Tonga (1977), Royal Society of New Zealand Bulletin 17, Wellington, pp 165-190.
MILL, John Stewart. 1891. A system of logic, 8th ed. Harper and Bros., New York. 659p.
MONCHAROEN, L. and P. Vijamsom. 1979. Low activity clay Ultisols andAlfisols in Thailand, p 91-106. IN F.H. Beinroth and S. Panichapong. (Eds.). Proc. Second International Soil Classification Workshop.Part II, Thailand.
MOORMANN, F.R. 1979. Taxonomic problems of low activity clay Alfisols and Ultisols. p 13-20. F.H. Beinroth and S. Panichapong (Eds.). Proc. Second International Soil Classification Workshop, Part II, Thailand.
NIX, H. A. 1980. Strategies for crop research. Proc. Agron. Soc. of New Zealand. 10:107-110.
242
PARAMANANTHAN, S. and C.P. Lim. 1979. Oxisols of Malaysia, p. 95-112.IN F.H. Beinroth and S. Paramananthan. (Eds.). Proc. Second International Soil Classification Workshop. Part I, Malaysia.
PARFITT, R.L. 1978. Anion adsorption by soils and soil materials. Adv. Agron. 30:1-50.
PERIASWAMY, S.P. 1976. Humults of Windward Oahu, Hawaii, and the potential ratings of these soils for selected uses. Unpublished Ph.D. dissertation, Univ. of Hawaii, Honolulu, Hawaii.
PERROT, K.W., B.F.L. Smith and B.D. Mitchell. 1976. Effect of pH on the reaction of sodium flouride with hydrous oxides of silicon, aluminum and iron and poorly ordered alumino silicate. J.Soil Sci. 27: 348-356.

QUANTIN, P. 1972-1978. Nouvelles Hebrides. Atlas des sols et de quelques donees du millieu naturel. ORSTOM Paris. 7. reports + maps.
RECEL, M.R. 1980. Reclassification of Andepts of the State of Hawaii in the proposed order Andisol. Unpublished M.S. Thesis. Univ. Hawaii, Honolulu, Hawaii.
REGASAMY, P., V.A. Sarma, R.S. Murthy, and G.S.R. Krishna Murti. 1978.J. Soil Sci. 29:431-445.
REPORT OF SEMI DETAILED SOIL SURVEY OF THE GUNUNGBATIN SUGARCANE RPOJECT AREA. 1975. Soil Research Institute, Indonesia.
ROJANASOONTHON, S. and S. Panichapong. 1979. Oxisols of Thailand. pll3-122. IN F.H. Beinroth and S-,..Paramananthan (Eds.). Proc. Second Interna-
: tional Soil Classification Workshop. Part I. Malayasia.
ROY.A.C., M.Y. Ali, R.L. Fox, and J.A. Silva. 1971. Influence of calcium silicate on phosphate solubility and availability in Hawaiian latos- sols. Int. Symp. Soil Fert. Evaluation.
SANGTIAN, Cherm. 1969. The nature of argillic horizon in Hawaiian Ultisols.Unpublished M.S. thesis, Univ. of Hawaii, Honolulu.
SCHOLTEN, J.J. and W.Boonyawat. 1872. Detailed reconnaissance soil survey of Nan province. Report SSR-90. Bangkok, Thailand.
SMITH,D.G., 1979. Problems of application of Soil Taxonomy with special reference to tropical soils with low activity clays. P. 5-12. IN F.H. Beinroth and S. Panichapong (Eds.). Proc. Second International Soil Classification Workshop, Part II, Thailand.
SOIL SURVEY INVESTIGATION REPORT NO. 12 (1967). Soil Survey laboratory data and description for some soils of Puerto Rico and the Virgin Islands. SCS, USDA.
________________________________ NO. 15 (1967). Soil Survey laboratory
243
data and descriptions for some soils of Tennessee. SCS, USDA.
_______________________• NO. 16 (1967). Soil survey laboratorydata and descriptions for some soils of Georgia, N. Carolina andS. Carolina. SCS, USDA.
____________________________ NO. 29 (1976). Soil survey laboratorydata and descriptions for some soils of Hawaii. SCS, USDA in cooperation with Hawaii Agr. Expt. Sta. and Hawaiian Sugar Planters' Assoc.

SOIL SURVEY OF THE SOUTHWEST REGION. 1967. Report prepared for the government of the Republic of Ivory Coast by Development and Resources Corporation, New York.
SOIL SURVEY PROJECT, BANGLADESH SOIL RESOURCES. 1971. AGL: SF/PAK 6 Tech. Rep. 3. FAO-UNDP, Rome.
SOIL SURVEY STAFF. 1976. Soil laboratory data and descriptions for some soils of Hawaii. SSIR No. 29. SCS, USDA.
- . . 1975. Soil Taxonomy; A basic system of soil classification for making and interpreting soil surveys. U.S. Dept, of Agric. Handbook A36, U.S. Govt. Printing Office, Washington, D.C. 754 p.
_________________ . 1973. Soil survey of Island of Hawaii, State of Hawaii.SCS, USDA and Univ. Hawaii. U.S. Govt. Printing Office, Washington,D.C. 20:402.
SOMBROEK, E.G. and F.N. Muchena. 1979. LAC Alfisols and Ultisols inEastern Africa, some problems of their identification and classification. p 129-138. IN F.H. Beinroth and S. Panichapong. (Eds.). Proc. Second International Soil Classification Workshop, Part II, Thailand.
SWINDALE, L.D. and G. Uehara. 1966. Ionic relationship in the pedogenesis of Hawaiian soils. Soil Sci. Soc. Amer. Proc. 30;726-730.
SYS, C. and R. Tavernier. 1979. African Oxisols. p 221-231. ^ F.H. Beinroth and S. Paramananthan (Eds.). Proc. second International Soil classification workshop. Part 1, Malaysia.
TSUJI, G.U., R.T. Watanabe, and W.S. Sakai. 1975. Influence of soil microstructure on water characteristics of selected Hawaiian soils. Soil Sci. Sco. Amer. Proc. 39;28-33.
UEHARA, G. 1981. Application of Soil Taxonomy for agricultural development in the South Pacific, p 7-16. IN R-.J. Moormann and D.M. Leslie (Eds.). Proc. South Pacific Regional Forum on Soil Taxonomy. Inst. Natural Resources. Univ. South Pacific, Suva, Fiji.
_______ . 1979. Mineralo-chemical Properties of Oxisols. p 45-60. ^F.H. Beinroth and S. Paramananthan (Eds.). Proc. second International Soil Classification Workshop. Part I. Malaysia.
1978. Mineralogy of the predominant soils in tropical and subtropical regions, p 21-36. IN C.S. Andrew and E.J. Kamprath (Eds.). Mineral Nutrition of Legumes in Tropical and subtorpical soils CSIRO, Australia. , and G. Gillman. 1981. The mineralogy, chemistry and physicsof tropical soils with variable charge clays. Westview Tropical Agriculture Series, No. 4.

UEHARA, G. and J. Keng. 1975. Management implications of soil mineralogy in Latin America, p 351-363. ^ F.Bdmemisza and A. Alvarado (Eds.). Soil Management in Tropical America. Proc. Seminar at CIAT, Cali, Colombia.
VAN DE WEG, R.F. and J.P. Mbuvi. 1975. Soils of the Kindaruma area.Kenya Soil Survey. Reconnaissance Soil Survey Report No. Rl.Draft Edition.
VAN WAMBEKE, A. 1975. Management properties of Oxisols in Savanna ecosystem. IN F. Bornemisza and A. Alvarado (Eds.). Soil Management in Tropical America. North Carolina State University, Raleigh,N.C., U.S.A.
WILLIAMS, R.S. and P.E. Harding (1979). Soil descriptions and analyses from Jambl Province, Sumatra. Land Resources Development Centre, Ministry of Overseas Development, United Kingdom.
YAIBUATHES, N. 1969. Comparative studies of oxic horizons. Unpublished M.S. Thesis, Univ. of Hawaii, Honolulu, Hawaii.
YOUNGE, O.R. and D.L Plucknett. 1966. Quencing the high phosphorus fixation of Hawaiian Latossols. Proc. Soil Sci. Soc. Amer. 30: 653-655.
245