rice situation - cornell university
TRANSCRIPT
6 RS-20 ALSE;~T R. MANN
LIBRAR''t' ITHACA, N. Y. 1 /.1.8~1"\
RICE Situation
ECONOMIC RESEARCH SERVICE
SEPTEMBER 1972
• U.S. DEPARTMENT OF AGRICULTURE
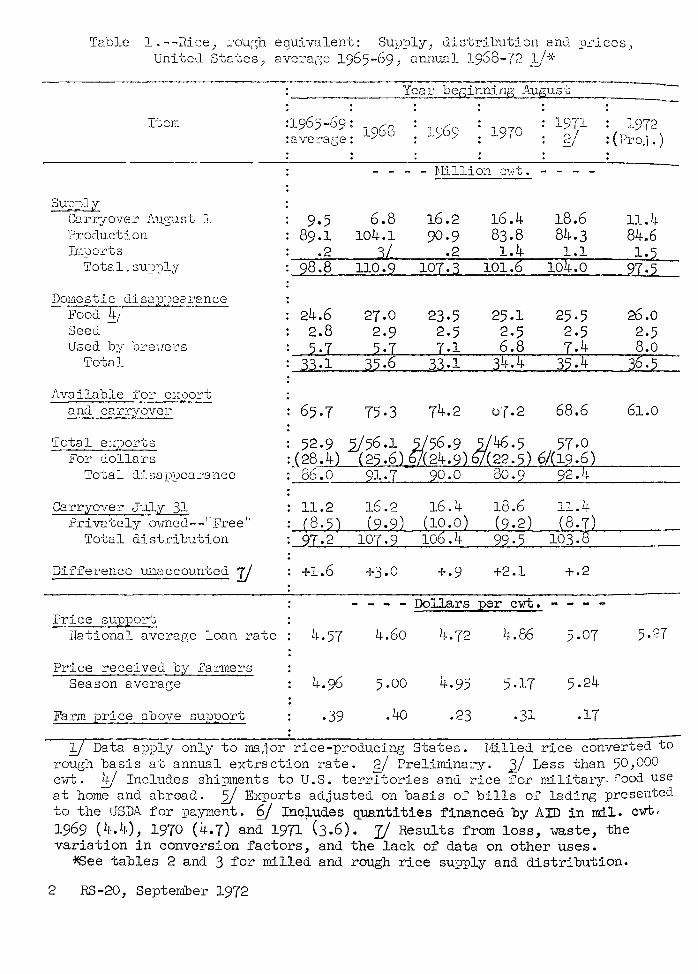
Ts:ole 1.--Rice, :.:o-u;;h eauivalent: SU}J~lly, distr:Llmtion an~'i. :p.c~J.ccs,
UnitcJ SJca·~es, ave:~ac;e 1965-69, oru'Lunl 19G8- -(2 _:!/-l<·
S1X.l:_Jl,Y CD rrJOVer l1.1J.,3,u.st · Production IT:l:ports
Total. su:y~'lY"
Food 4/ + _, Seed Used by orei:Cl~S
Total
Available f'or e~:oort and c2.rryover
Tota 1 e~~:loTt s For d.ollars
':!.'ota l :J.j_ sa lJ2;)CO. ..:·a nee
Cerryover July 31 Privately ovmcu--''Free''
Total dist~ibution
Difference lmaccountcd IJ
Price supporJc national average loan ~~ate
Price received by fa~ers Season ave:rac;e
Farm price nbove sm)port
9-5 89.1
.2 98.8
24.6 2.8 5·7
33.1
65.7
52·9
6.8 104.1
3L 110.9
27.0 2.9 5-7
75·3
Ycal' becinning August
1970 1971 ?I : .. :/
f.lillio:::1 c•:Tc. - - - -
16.2 90·9
.2 107.3
23·5 2.5 7.1
33-1
74.2
16.4 83.8 1.4
101.6
25.1 2.5 6.8
34.4
b'{ .2
18.6 84.3 1.1
104.0
25·5 2.5 7.4
68.6
: 1972 : (Pro,j.)
11.4 84.6 1.5
97·5
26.0 2.5 8.0
61.0
: _( 28~. 4_!_./_~L-:..;::;..J-:;..J.~~~~=...::....L-..;J..:;.~:;-t-----86.0 ____ L9~1~.~7----~~--~~~--~~~----------
11.2 (8.5)
+1.6
16.2 (9.9)
107.9
16.4 (10.0)
+.9
18.6 (9.2) 99·5
+2.1
- - - - Dollars per cvrt.
4.60 4.72 4.86
5.00 4.95
.4o .23 .31
11.4 (8.7)
103.8
+.2
5.07
5-24
.17
1 Data apply only to ma.ior rice-producing States. l!Jilled rice converted to rough basis at annual extraction rate. 2/ Preliminary. 3/ Less than 50,000 cwt. !±} Includes shipments to U.S. territories ancl rice for military. f'ood use at home and abroocL 2./ Exports adjusted on basis of bills of lading presented to the USDA for payment. 2/ Inc;Ludes quanti ties financed by AJJ) in mil. cwt · 1969 (4.4), 1970 (4.7) and 1971 (3.6). I/ Results from loss, ~~ste, the variation in conversion factors, and the lack of data on other uses. ~ee tables 2 and 3 for milled and rough rice supply and distribution.
2 RS-20, Septerooer 1972

RICE SITUATION
CONTENTS
Summary ........................ .
Situation and Outlook for 1972/73
World Rice Situation
List of Tables ...................... .
•••
Approved by The Outlook and Situation Board
and Summary released September 21, 1972
Principal contributors: James Naive
Frank R. Gomme
Economic and Statistical Analysis Division
Economic Research Service
U.S. Department of Agriculture Washington, D.C. 20250
•••
Page
3
4
6
19
The Rice Situation will be published in early 1973.
SUMMARY
Prospects for near-record exports and another sharp drawdown in stocks highlight the 1972/73 rice year.
Rice supplies are expected to fall 6% short of last year's 104 million cwt. as a sharp reduction in carryin stocks more than offsets the slight increase in the crop. Rice yields at 4,649 pounds per acre are again at record levels.
Total use is projected to exceed the 1972 crop. And by next summer, stocks could be substantially below the 11.4 million cwt. of this season. Domestic use may increase moderately, and strong demand and relatively tight supplies in Asia point to another good year for U.S. rice exports.
Prices at the farm will continue strong, reflecting the large demand and the 19-cent increase in the loan rate. For the season, farm prices may average 5 to 10% over loan.
A record rate of disappearance during 1971/72 plunged year-ending rice stocks 39% to their lowest level since 1968. Principally responsible were record exports of 57 million cwt.
World rice production (including Mainland China) in 1971/72 rose slightly for the fifth consecutive record. Larger crops in Mainland China and India more than offset smaller harvests in Japan and Pakistan. Slower production increases in the rest of the Asian rice belt restricted supplies for domestic consumption and export. Crop conditions point to a decline in world rice production in 1972/73. World import demand in calendar year 1972 is expected to continue at a relatively high level. Reflecting these situations, world rice prices have risen by a fourth since April.
USDA has announced several changes in grading standards for rice. Principal among these is a change in definition of milling yield of rough and brown rice. Milling yield will no longer be an estimate of the head rice yield but instead the mill yield of whole kernel rice (no brokens). Value factors will also be set on a whole kernel basis .
USDA has begun to estimate rice stocks and production by class. Stocks by class on August 1 are now available. Estimates of production by class will be released on November 9.
RS-20, SEPTEMBER 1972 3
SITUATION AND OUTLOOK FOR 1972/73
Crop Larger As Yields Hit New Record
The 1972 rice harvest, based on September indications, is expected to reach 84.6 million cwt. (rough), fractionally above last year's crop. Since the 1972 national rice allotment was unchanged, acreage was virtually the same as in 1971. Most of the increase in production can be attributed to higher yields. Rice yields are forecast at 4,649 pounds per acre. Much of the gain stems from the California crop, where seeding and growing conditions have been nearly optimum. In the major Southern States, growing conditions have ranged from normal to good. Yields are expected to be up moderately in Louisiana, but down in the rest of the rice producing areas of the South.
By mid-September, the rice harvests in Louisiana and Texas (first crop) were nearly completed and in Arkansas 15% completed. Combining in California has just started.
There has been remarkable stability in rice production since 1970, reflecting a slowdown in the increase in rice yields and the unchanged allotments.
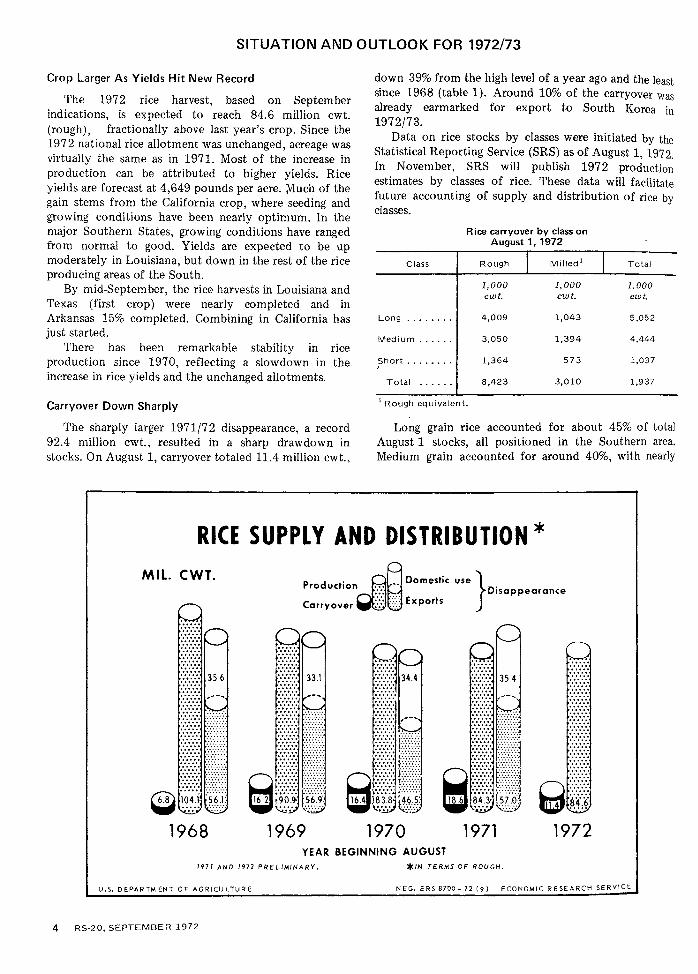
Carryover Down Sharply
The sharply larger 1971/72 disappearance, a record 92.4 million cwt., resulted in a sharp drawdown in stocks. On August 1, carryover totaled 11.4 million cwt.,
down 39% from the high level of a year ago and the least since 1968 (table 1). Around 10% of the carryover was already earmarked for export to South Korea in 1972/73.
Data on rice stocks by classes were initiated by the Statistical Reporting Service (SRS) as of August 1, 1972. In November, SRS will publish 1972 production estimates by classes of rice. These data will facilitate future accounting of supply and distribution of rice by classes.
Class
Long ..•.•.••
Medium •..•••
Short ••..••.. '
Total ••...•
Rice carryover by class on August 1, 1972
Rough Milled'
1,000 1,000 cwt. cwt.
4,oog 1,043
3,050 1,394
1,364 573
8,423 3,010
1 Rough equivalent.
Total
1,000 cwt.
5,052
4,444
1,037
1,937
Long grain rice accounted for about 45% of total August 1 stocks, all positioned in the Southern area. Medium grain accounted for around 40%, with nearly
RICE SUPPLY AND DISTRIBUTION* MIL. CWT.
1968
Production 8A Domestic use }Disappearance
Carryover ~LJ Exports
....... ..... ..... . ..... ...... .
~~II II!};
oM1{~~~~I~ 'Uv..:.,·: ~~fu? 1969 1970 1971 1972
YEAR BEGINNING AUGUST 1971 AND 1972 PRELIMINARY. *IN TERMS OF ROUCH.
U.S. DEPARTMENT OF AGRICULTURE NEG. ERS 87'00-72 (9) ECONOMIC RESEARCH SERVICE
4 RS-20, SEPTEMBER 1972
U.S. EXPORTS Of RICE, BY DESTINATION
MIL METRIC TONS
2
1
0 1964
World
1967 1973 1976 RICE EXPORTS IN TERMS OF MILLED.
t.PRELIMINARY. 1964 EUROPE DATA INCLUDES 90,300 TONS TO USSR AND EASTERN EUROPE.
U.S. DEPARTMENT OF AGRICULTURE
three-fourths positioned in California. The remainder was short grain rice, nearly all in California.
Smaller Supply for 1972/73
A sharp reduction in carryin stocks more than offsets the increased production and anticipated imports. The net result is a 6% smaller supply for the August-July, 1972/73 marketing season (table 1). Imports are estimated at 1.5 million cwt. mainly broken rice destined for brewers.
Domestic Use To Rise Further
Domestic rice use is expected to increase moderately from the 35.4 million cwt. of last season. Food use should continue the long-term uptrend. This component includes shipments to territories (principally Puerto Rico and the Virgin Islands) which figure heavily in the total because of their high level of rice consumption.
Brewer use of rice should rise from the 7.4 million cwt. of last season. This assumes that the brewers still using rice in their brewing process will continue to do so. Over the years, several major brewers have shifted to other grain products such as corn grits in their brewing process because of relatively lower input costs.
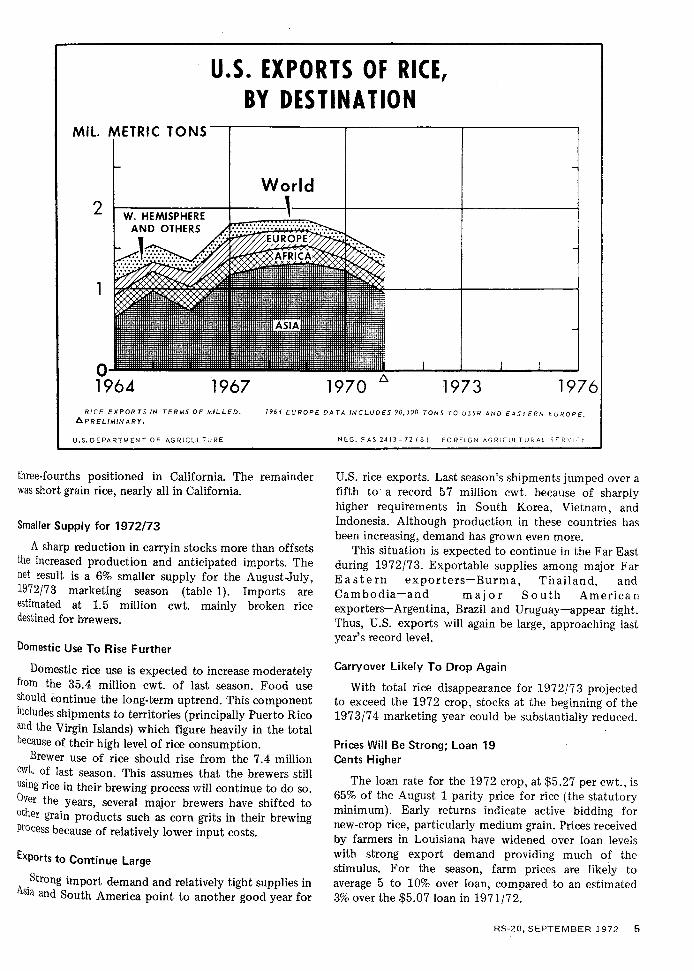
Exports to Continue Large
Strong import demand and relatively tight supplies in Asia and South America point to another good year for
NEG. FAS 2413-72 (8) FOREIGN AGRICULTURAL SfR,;J,-t
U.S. rice exports. Last season's shipments jumped over a fifth to a record 57 million cwt. because of sharply higher requirements in South Korea, Vietnam, and Indonesia. Although production in these countries has been increasing, demand has grown even more.
This situation is expected to continue in the Far East during 1972/73. Exportable supplies among major Far Eastern exporters-Burma, Thailand, and Cambodia-and major South American exporters-Argentina, Brazil and Uruguay-appear tight. Thus, U.S. exports will again be large, approaching last year's record level.
Carryover Likely To Drop Again
With total rice disappearance for 1972/73 projected to exceed the 1972 crop, stocks at the beginning of the 1973/74 marketing year could be substantially reduced.
Prices Will Be Strong; Loan 19 Cents Higher
The loan rate for the 1972 crop, at $5.27 per cwt., is 65% of the August 1 parity price for rice (the statutory minimum). Early returns indicate active bidding for new-crop rice, particularly medium grain. Prices received by farmers in Louisiana have widened over loan levels with strong export demand providing much of the stimulus. For the season, farm prices are likely to average 5 to 10% over loan, compared to an estimated 3% over the $5.07 loan in 1971/72.
RS-20, SEPTEMBER 1972 5
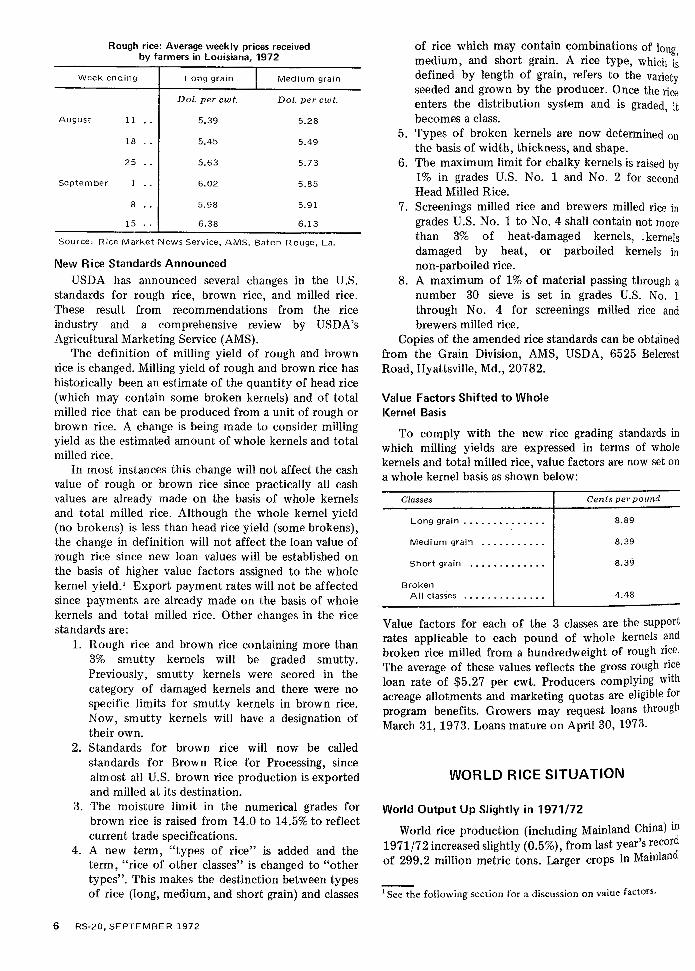
Rough rice: Average weekly prices received by farmers in Louisiana, 1972
Week ending Long grain Medium grain
Dol. per cwt. Dol. per cwt.
August 11 5.39 5.28
18 5.45 5.49
25 5.63 5.73
September 1 6.02 5.85
8 5.98 5.91
15 6.38 6.13
Source: Rice Market News Service, AMS. Baton Rouge, La.
New Rice Standards Announced USDA has announced several changes in the U.S.
standards for rough rice, brown rice, and milled rice. These result from recommendations from the rice industry and a comprehensive review by USDA's Agricultural Marketing Service (AMS).
The definition of milling yield of rough and brown rice is changed. Milling yield of rough and brown rice has historically been an estimate of the quantity of head rice (which may contain some broken kernels) and of total milled rice that can be produced from a unit of rough or brown rice. A change is being made to consider milling yield as the estimated amount of whole kernels and total milled rice.
In most instances this change will not affect the cash value of rough or brown rice since practically all cash values are already made on the basis of whole kernels and total milled rice. Although the whole kernel yield (no brokens) is less than head rice yield (some brokens), the change in definition will not affect the loan value of rough rice since new loan values will be established on the basis of higher value factors assigned to the whole kernel yield. 1 Export payment rates will not be affected since payments are already made on the basis of whole kernels and total milled rice. Other changes in the rice standards are:
1. Rough rice and brown rice containing more than 3% smutty kernels will be graded smutty. Previously, smutty kernels were scored in the category of damaged kernels and there were no specific limits for smutty kernels in brown rice. Now, smutty kernels will have a designation of their own.
2. Standards for brown rice will now be called standards for Brown Rice for Processing, since almost all U.S. brown rice production is exported and milled at its destination.
3. The moisture limit in the numerical grades for brown rice is raised from 14.0 to 14.5% to reflect current trade specifications.
4. A new term, "types of rice" is added and the term, "rice of other classes" is changed to "other types". This makes the destinction between types of rice (long, medium, and short grain) and classes
6 RS-20, SEPTEMBER 1972
5.
6.
7.
of rice which may contain combinations of long medium, and short grain. A rice type, which i~ defined by length of grain, refers to the variety seeded and grown by the producer. Once the rice enters the distribution system and is graded, it becomes a class. Types of broken kernels are now determined 011
the basis of width, thickness, and shape. The maximum limit for chalky kernels is raised by 1% in grades U.S. No. 1 and No. 2 for second Head Milled Rice. Screenings milled rice and brewers milled rice in grades U.S. No. 1 to No.4 shall contain not more than 3% of heat-damaged kernels, . kernels damaged by heat, or parboiled kernels in non-parboiled rice.
8. A maximum of 1% of material passing through a number 30 sieve is set in grades U.S. No. 1 through No. 4 for screenings milled rice and brewers milled rice.
Copies of the amended rice standards can be obtained from the Grain Division, AMS, USDA, 6525 Belcrest Road, Hyattsville, Md., 20782.
Value Factors Shifted to Whole Kernel Basis
To comply with the new rice grading standards in which milling yields are expressed in terms of whole kernels and total milled rice, value factors are now set on a whole kernel basis as shown below:
Classes Cents per pound
Long grain •.•..•••..••.. 8.89
Medium grain •••.••..••• 8.39
Short grain 8.39
Broken .All classes ••••..••.•.••• 4.48
Value factors for each of the 3 classes are the support rates applicable to each pound of whole kernels and broken rice milled from a hundredweight of rough rice. The average of these values reflects the gross rough rice loan rate of $5.27 per cwt. Producers complying with acreage allotments and marketing quotas are eligible for program benefits. Growers may request loans through March 31, 1973. Loans mature on April 30, 1973.
WORLD RICE SITUATION
World Output Up Slightly in 1971/72
World rice production (including Mainland China) in 1971/72 increased slightly (0.5%), from last year's record of 299.2 million metric tons. Larger crops in Mainland
1 See the following section for a discussion on value factors.
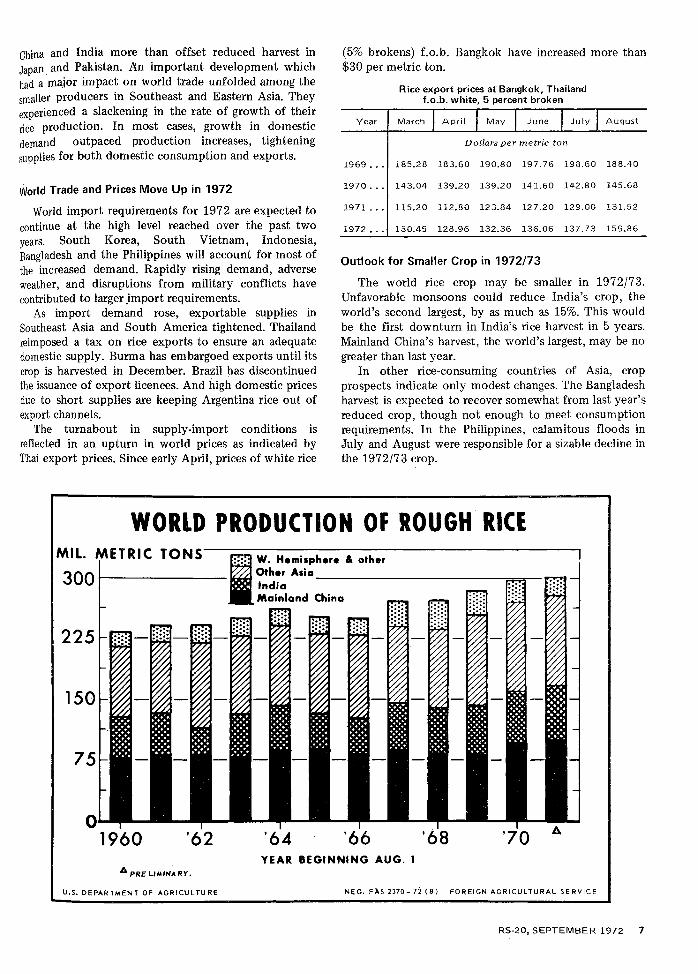
China and India more than offset reduced harvest in Japan. and Pakistan. An important development which had a major impact on world trade unfolded among the smaller producers in Southeast and Eastern Asia. They experienced a slackening in the rate of growth of their rice production. In most cases, growth in domestic demand outpaced production increases, tightening supplies for both domestic consumption and exports.
World Trade and Prices Move Up in 1972
World import requirements for 1972 are expected to continue at the high level reached over the past two years. South Korea, South Vietnam, Indonesia, Bangladesh and the Philippines will account for most of the increased demand. Rapidly rising demand, adverse weather, and disruptions from military conflicts have contributed to larger _import requirements.
As import demand rose, exportable supplies in Southeast Asia and South America tightened. Thailand reimposed a tax on rice exports to ensure an adequate domestic supply. Burma has embargoed exports until its crop is harvested in December. Brazil has discontinued the issuance of export licences. And high domestic prices due to short supplies are keeping Argentina rice out of export channels.
The turnabout in supply-import conditions is reflected in an upturn in world prices as indicated by Thai export prices. Since early April, prices of white rice
(5% brokens) f.o.b. Bangkok have increased more than $30 per metric ton.
Rice export prices at' Bangkok, Thailand f.o.b. white, 5 percent broken
Year March
Dollars per metric ton
August
1969... 185.28 183.60 190.80 197.76 198.60 188.40
1970. . . 143.04 139.20 139.20 141.60 142.80 145.68
1971... 115.20 112.80 123.84 127.20 129.00 131.52
1972... 130.45 128.96 132.36 136.06 137.73 159.86
Outlook for Smaller Crop in 1972/73
The world rice crop may be smaller in 1972/73. Unfavorable monsoons could reduce India's crop, the world's second largest, by as much as 15%. This would be the first downturn in India's rice harvest in 5 years. Mainland China's harvest, the world's largest, may be no greater than last year.
In other rice-consuming countries of Asia, crop prospects indicate only modest changes. The Bangladesh harvest is expected to recover somewhat from last year's reduced crop, though not enough to meet consumption requirements. In the Philippines, calamitous floods in July and August were responsible for a sizable decline in the 1972/73 crop.
WORLD PRODUCTION OF ROUGH RICE Ml L. ETRIC TONs--~--w-.-H-.-m-i-sp-h-.-,.-&-o-th-.-,------------,
300 1--------- Other Asia India --------------------------~~~
Mainland China
225
150
1960 '62 '64 '66 '68 '70 YEAR BEGINNING AUG. 1
II. PRE LIM IN~ RY.
U.S. DEPARTMENT OF AGRICULTURE NEG. Fl>.S 2370-72 (8) FOREIGN AGRICULTURAL SERVICE
RS-20, SEPTEMBER 1972 7
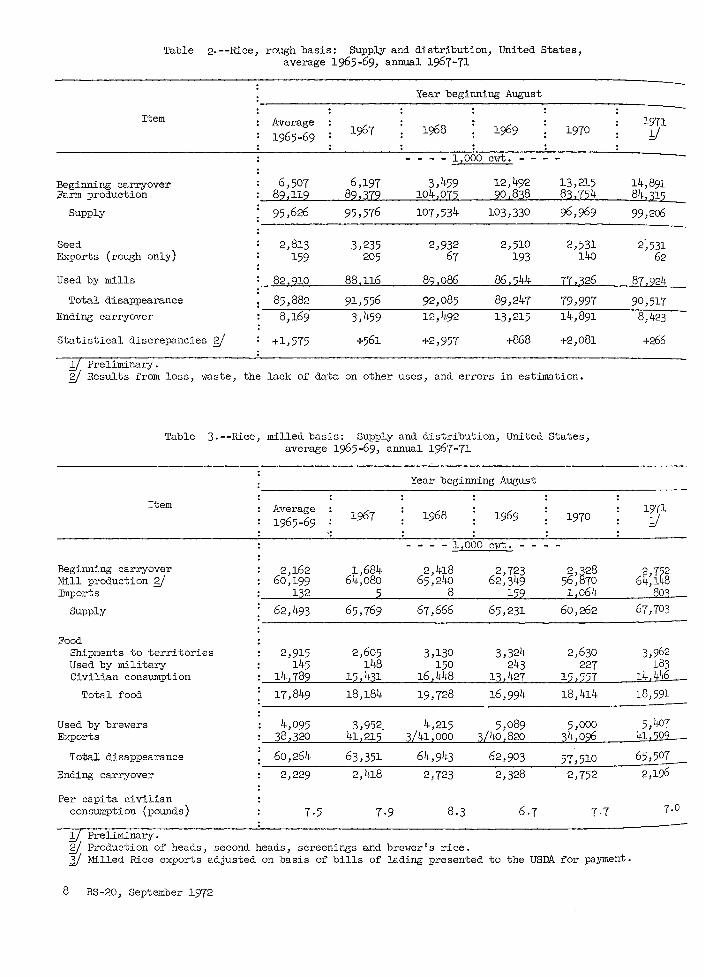
Table 2.--Rice, rough basis: Supply and distribution, United States, average 1965-69, annual 1967-71
Year beginning August
Item Average 1965-69 1967 1968 1969 1970
1,000 c-vrt. -
Beginning carryover 6,507 6,197 3,459 12,492 13,215 Farm production 89,ll9 89,379 104,075 90,838 83,754
Supply 95,626 95,576 107,534 103,330 96,969
Seed 2,813 3,235 2,932 2,510 2,531 Exports (rough only) 159 205 67 193 14o
Used by mills 82.910 88,ll6 89,086 86,544 77.326
Total disappearance 85,882 91,556 92,085 89,247 79,997 Ending carr"JOver 8,169 3,459 12,492 13,215 14,891
Statistical discrepancies gj +1,575 +561 +2,957 +868 +2,081
1 Preliminary. y Results from loss, w-aste, the lack of data on other uses, and errors in estimation.
Table 3.--Rice, milled basis: Supply and distribution, United States, average 1965-69, ·annual 1967-71
Year beginning August
Item Average 1965-69
1967 1968 1969 1970
1,000 cvrt. -
Beginning carryover 2,162 1,684 2,418 2,723 2,~28 Mill production gj 60,199 64,080 65,240 62,349 56, 70 Imports 132 2 8 122 1 2064
SUpply 62,493 65,769 67,666 65,231 60,262
Food Shipments to territories 2,915 2,605 3,130 3 ,32!~ 2,630 Used by military 145 148 150 243 227 Civilian consumption 14,782 12,431 16,448 13 2 427 15,527
Total food 17,849 18,184 19,728 16,994 18,414
Used by bre>-rers 4,095 3,952_ 4,215 5,089 5,000 Exports 38,320 !~1,212 ~L41 2 000 ~itfo,82o 34,o96
Total disappearance 60,264 63,351 6tf,943 62,903 57,510 Ending carr"JOVer 2,229 2,418 2,723 2,328 2,752
Per capita civilian consumption (pounds) 7·5 1·9 8.3 6.7 7-7
1 Preliminary. y Production of heads, second heads, screenings and breVTer's rice. }) Milled Rice exports adjusted on basis of bills of lading presented to the USDA for payment.
8 RS-20, September 1972
1971 y
14,891 84,315
99,206
2~531 62
87,924
90,517 8,423
+266
1971 y
2,7~ 64,1
803 67,703
3,962 183
14,446
18,591
5,407 41,202
65,507
2,196
7.0

Table 4.--Rice, rough: Price per 100 pounds received by farmers. by States qnd United States, 1966-7Q
:Season Year : Aug. Sept. Oct. Nov. Dec. : Jan. : Feb. : 1-nr. : Apr. :May : June :July :Average
: 1 - - Dollars
Arkansas
1966 5·15 4.45 4.9() 5-05 5-20 5-20 5-20 5.20 5-20 5-20 5-20 5-20 4.80 1967 5-00 4.80 5-30 5-20 5-20 5-30 5-30 5-30 5-30 5-30 5-30 5-30 5-12 1968 5-30 4-75 4.90 5-20 5-20 5-20 5-20 5.20 5·20 5-20 5-20 5-20 5-07 1969· 5.20 4-75 5.00 5-30 5-20 5-30 5-30 5-30 5-30 5-30 5-30 5·30 5-32 1970 5-30 5.h0 5-40 5-50 5-50 5-40 5.40 5.40 5.40 5-40 5-40 5-40 5 .1;1 1971 5·30 5.40 5·50 5-50 5.60 5·70 5-70 5.70 5-70 5.70 5-70 5-70 5-38 1972 ?./
Louisiana
1966 4.60 4.70 4.90 5.00 5.10 5-10 5-10 5-00 5.00 5-10 5-10 4.90 4.80 1967 4.65 4.70 4-75 5-00 ).20 5-30 5-40 5-50 5-50 5-50 5-50 5-40 4.91 1968 4.80 4-75 4.85 5.00 ).00 4-95 5-10 4.85 4.80 4.65 4.55 4.40 4.83 1969 4.50 4-75 4.70 4.90 4.85 4.85 4.85 4.70 4.75 4.85 5-00 4.65 4.71 1970 4-95 4.90 4-95 4.90 5.00 5-20 5-20 ).00 5-00 5.00 5-00 5.20 4.96 1971 1972 E./
5.10 5.4o
5-00 5.00 5-10 5.20 ').40 5·50 5-50 5-50 5.50 5-50 5-40 5.14
Mississi i
1966 4.90 4.80 4.80 4.80 4.90 5-10 5.10 ).10 5-20 5-20 5-20 5.20 4.90 1967 5.20 5-40 5.20 5-20 5-40 5-30 5-40 ).40 5-30 5-40 5-50 9-34 1968 5.20 5-20 5.10 5-20 5-40 5.40 5-20 5-20 5-20 5.20 5-20 1969 5-20 !;.90 5-20 5-30 5-30 5-30 5-30 5-30 5-30 5-20 5-20 5-20 5-27 1970 5.30 5-20 5-20 5-20 5-40 5-40 5-40 5-30 5-30 5-40 5-40 5-40 5-28 1971 5·40 5-20 1972 gj
5·40 5-40 5-40 5-40 5.40 5.40 ').40 5.40 5-40 5.40 5-45
Texus
1966 5.40 5.00 5-00 5.00 5-10 5-20 5-20 5.20 5-20 5-20 5-20 5-00 5-10 1967 ~~.so 4.70 4-75 5-00 4.90 5.00 5-30 5-30 5-30 5-30 5-30 5-30 4.94 1968 5-30 5.10 5.00 5-10 4.60 !f.30 4.30 4.30 4.30 4.50 4.40 4.97 1969 4.40 5-00 4.90 4.80 4.80 4.80 4.75 4.85 4.90 4-75 4-75 4-75 4.88 1970 5-!~ 5.20 5-10 5-20 4.85 5-30 5.60 5-50 5-50 5-50 5-50 5-40 5-25 1971 5·50 5-20 5.30 5.20 5.40 5.60 5.60 5.60 5-50 5-50 5-50 5-50 5-35 1972 2} 5.70
United States 3
1966 5-03 4.86 5-03 5-02 5-12 5.16 5-15 5-13 5-13 5-18 5-17 5.04 4-95 1967 4.74 4.74 5-08 5-04 5.08 5-16 5-32 5-36 5·37 5-34 5·37 5·33 4-97 1968 5-06 4.92 5-03 5-09 4.92 4.72 4.84 4.80 4.78 4.90 4.80 4.63 5.00 1969 4.71 4-99 5-23 5-05 4.98 4-99 4.96 5.01 5.00 4.98 5-10 4.80 4.95 1970 5-16 5-18 ).26 5-19 5-09 5-31 5.44 5-36 5·33 5-30 5.20 5-33 5-17 1971 5.2, 5-23 5·37 5.24 5·34 5-55 5·57 5-59 5·53 5-52 5·53 s.47 5.24 1972 gj 5.5
Y State and U.S. season average prices include an allowance for unredeemed loans and purchases by the Government, valued at the average loan rate, by States. Monthly prices do not include this all01·7ance. Y Preliminary. 3/ California is excluded in the monthly averages but is included in the U.S. season average.
RS-20, September, 1972 9

Table 5·· --Rice, Milled U.S. No. 2: Average price per 100 pounds of Southen> head rice at milling centers, by months, 1966·72
Class and Aug. Sept. Oct. Jiov. Dec. : Jan. : Feb. : M!<r. Apr. M!<y June July Average ear
----~
~Grain liQJ!i3:tQU rre~a hljJJeQ lJj~~ ~IQ. 2 t:.Q.l! mjJ l~ :cet cl:Z:t :baii;eC J:,l 196~ 10.05 10.00 10.00 10.00 10.00 10.00 10.00 10.00 10.10 10.05 10.00 9.90 10.00 1967 9·50 9· 55 9.70 10.00 10.05 10.15 10.15 10.35 10.50 10.25 10.25 10.25 10.05 1968 9·95 9·50 9.60 9·75 9·75 9·75 9·75 9·75 9·90 10.00 10.00 10.00 9.8o 1969 9·75 9·75 9·75 9·8o 10.00 10.00 10.00 10.00 10.00 10.00 10.00 10.00 9.90 1970 10.00 9·90 10.00 10.00 10.00 10.10 10.10 10.10 10.10 10.10 10.10 10.10 10.05 19Tl 1972 ?)
10.10 10.10 10.10 10.10 10.10 10.20 10.25 10.25 10.25 10.25 10.25 10.25 10.20
Mediu:& Grain: ~--, . 0 ·35 • 0 0 0 ·35
1967 1·90 7·75 8.10 9·25 9·25 9.25 8.65 1968 8.90 8.50 8.40 8.50 8.50 8.50 8.50 1969 8.50 8.50 8.50 8.70 8.70 8.70 8.6-5 1970 8.65 8.70 8.80 9.00 9-00 9.00 8.90 1971 1972 ?)
9.00 9.00 9.00 9·25 9·25 9.25 9·15
~Grain Arkansas Milled Rice No. 2 f.o.b. rn.H1s 196~ 9.90 9.90 9·90 9·95 9·90 9.90 9.90 9·90 9·90 9.90 9.90 1967 9·90 9·90 9·90 9.90 9.90 9·90 9·95 10;20 10.25 10.25 10.05 1968 10.25 10.15 9.20 9.85 9.90 9.90 9·90 9·90 9·90 9.85 9.90 1969 9·90 9.90 9·90 9.90 9·90 10.00 10.10 10.10 10.10 10.10 10.00 1970 10.10 10.10 10.10 10.10 10.10 10.10 10.10 10.10 10.10 10.10 10.10 10.10 1971 10.10 10.10 10.10 10.10 10.10 10.10 10.40 10.40 10.40 10.40 10.40 10.25 1972 ?) 10.40
MediUlll Grain: ~--, 8.15 8.15 .10 .20
1967 8.25 8.25 8.15 8.65 1_968 9·25 9.10 8.45 8.55 1969 8.45 8.45 8.60 8. 55 1970 8.55 8.70 8.90 8.95 1971 9.10 9.10 9.10 9·25 1972 2 .40
reported by variety Beginning August 1 2 Preliminary.
Consumer and Marketing Service, Grain Division.
Table 6 .--Rice: l·ionthly average :9rice at South\-Test Louisiana) 1968-'{2
Year Aug. Sept. Oct. Hov. Dec. Jan. : Feb. : Mw. Apr. Jley June July Average
- Dollars - - - -
1968 .00 1969 5.80 1970 5 ·95 1971 6.00 1972 ?)
Milled, mediwn-grain Second Head 2 Qer 100 J:!Ounds , bagged 1Z 1968 6.00 6.oo 6.00 6.00 6.00 6.00 6.00 6.oo 6.00 6 .oo 6.00 6.00 6.00 1969 6.oo 5·95 5·75 5. 75 5.80 5 .so 5·8o 5.80 5.80 5-Bo 5.80 5.80 5.80 1970 5 .so 5.80 5 ·90 5·90 5·90 5 ·90 5 ·95 6.10 6.10 6.10 6.10 6.10 5·95 1971 6.10 6.10 6.10 6.10 6.05 5·90 5·90 5·90 5.90 5 ·90 5.90 5 ·90 6.00 1972 ?) 5-90
1968 32.00 25.10 25 .oo 25 ·50 Rice Bran, f.o.b. mills, Qer ton 3Z
33.40 35·50 35·50 35-50 33·90 24.50 21.20 21.50 29-05 1969 22-50 24-30 30.00. 32-75 35-50 39-00 39-50 34.10 30-50 27-50 28.50 28.50 31.05 1970 28.75 33-40 35-00 41.40 47.00 t,8.oo 45.40 47.40 50.00 50.00 45.30 l,3.00 ~2.90
1971 37.00 29.60 26.25 30.80 39.00 38.50 38.00 37.00 34.00 34-00 34.00 34-00 34.35 1972 ?) 31.75
Rice l<iillfeed f.o.b. mills -oer ton ba ed 4 1968 17-00 1 ·30 15-50 15-75 17-50 18.00 19-50 21.00 19-90 15-50 15-50 15-50 17.25 1969 15·50 15.50 18.00 19.75 21.50 28.00 28.00 22.70 18.50 16 .oo 16.t,o 18.25 19.85 1970 18.90 21-50 21-50 23-30 27-35 28.00 26-90 30-10 35.00 35 .oo 28.70 25.00 26-75 19"11 15.10 n.oo 8.50 11.40 19.00 21.00 14.10 11.00 11.00 ll.oo 11.00 11.00 12.95
1972 ?) 11.00
: as y U.S. No. 4 or better at Southern mills. ?) Preliminary. Prices g_uoted as bulk, prior to July 19 , prices were quote
bagged. I:) Beginning August 1971, prices are g_uoted on a bulk basis.
10 RS-20, September 1972
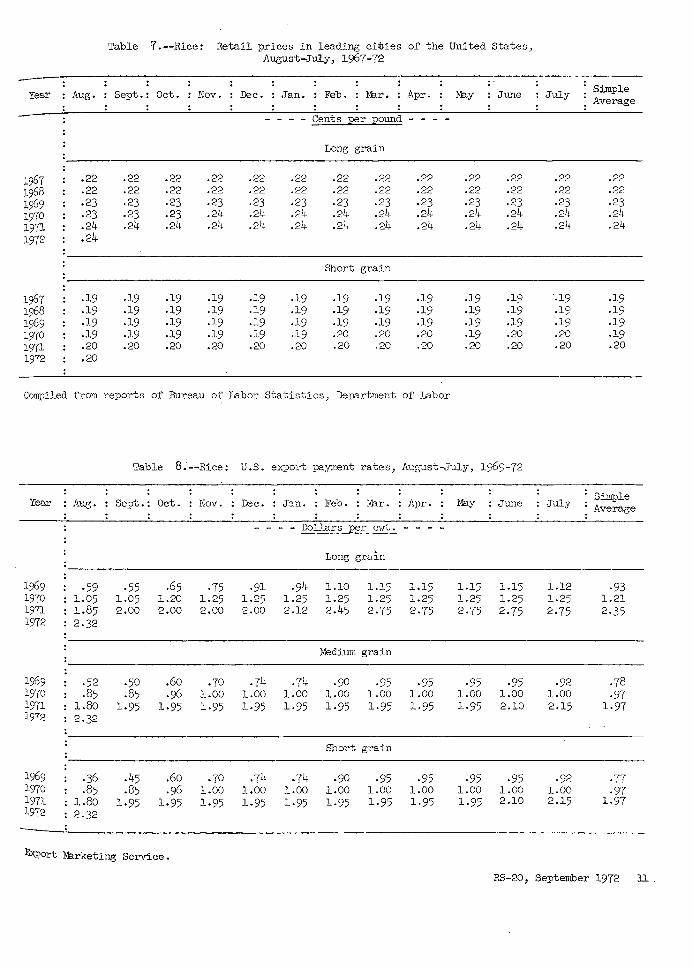
Table 7.-.-Rice: Retail prices in leading cities of the United States, August-Ju1y, 196Y-72
.. Year Aus. Sept.: Oct. Nov. Dec. : Jan. : Feb. : M3.r. : Apr. M3.y June July Simple
Average
- Cents per pound -
Long grain
1967 .22 .22 .22 .22 .22 .22 .22 .22 .22 .22 .22 .22 .22 1968 .22 .22 .22 .22 .22 .22 .22 .22 .22 .22 .22 .22 .22 1969 .23 .23 .23 .23 .23 .23 .23 .23 .23 .23 .23 .23 .23 1970 .23 .23 .23 .24 .24 .24 .24 .24 .24 .24 .24 .24 .24 1911 .24 .24 .24 .24 .24 .24 .24 .24 .24 .24 .24 .24 .24 1972 .24
Short grain
1967 .19 -19 .19 .19 .19 .19 .19 .19 .19 .19 .19 .19 .19 1968 .19 .19 -19 -19 .19 .19 .19 .19 .19 -19 .19 .19 .19 1969 .19 .19 .19 .19 -19 .19 .19 .19 .19 .19 -19 .19 .19 1970 -19 -19 .19 .19 .19 .19 .20 .20 .20 .19 .20 .20 .19 1971 .20 .20 .20 .20 .20 .20 .20 .20 .20 .20 .20 .20 .20 1972 .20
Compiled from reports of Bureau of Labor Statistics, Department of Labor
Table 8~--Rice: u.s. export payment rates, A11ooust-July, 1969-Y2
Year : Aus. Sept.: Oct. Nov. Dec. : Jan. : Feb. : Mar. : Apr. May :June July . Simple ; Average
- Dollars ;Eer c1·rt •
Lo11..g grain
1969 ·59 ·55 .65 ·Y5 -91 .94 1.10 1.15 1.15 1.15 1.15 1.12 ·93 1970 1.05 1.05 1.20 1.25 1.25 1.25 1.25 1.25 1.25 1.25 1.25 1.25 1.21 1971 1.85 2.00 2.00 2.00 2.00 2.12 2.45 2-Y5 2.75 2.Y5 2.Y5 2-75 2.35 1972 2.32
Medium grain
1969 -52 -50 .60 .yo .74 .y4 .90 ·95 ·95 ·95 ·95 .92 .78 1970 .85 .85 ·96 1.00 1.00 1.00 1.00 1.00 1.00 1.00 1.00 1.00 ·9Y 1971 1.80 1.95 1.95 1.95 1.95 1.95 1.95 1.95 1.95 1.95 2.10 2.15 L9Y 1972 2.32
Short grain
1969 -36 .45 .60 .yo ,yh .y4 ·90 ·95 ·95 ·95 ·95 -92 -77 1970 .85 .85 .96 1.00 1.00 1.00 1.00 1.00 1.00 1.00 1.00 1.00 ·9Y 1971 1.80 1.95 1.95 1.95 1.95 1.95 1.95 1.95 1.95 1.95 2.10 2.15 1.9Y 1972 : 2.32
ixport Marketing Service.
RS-20, September 1972 11
~
65 I
~ ~
fhl ~ ~ CD 'i
0 r;3
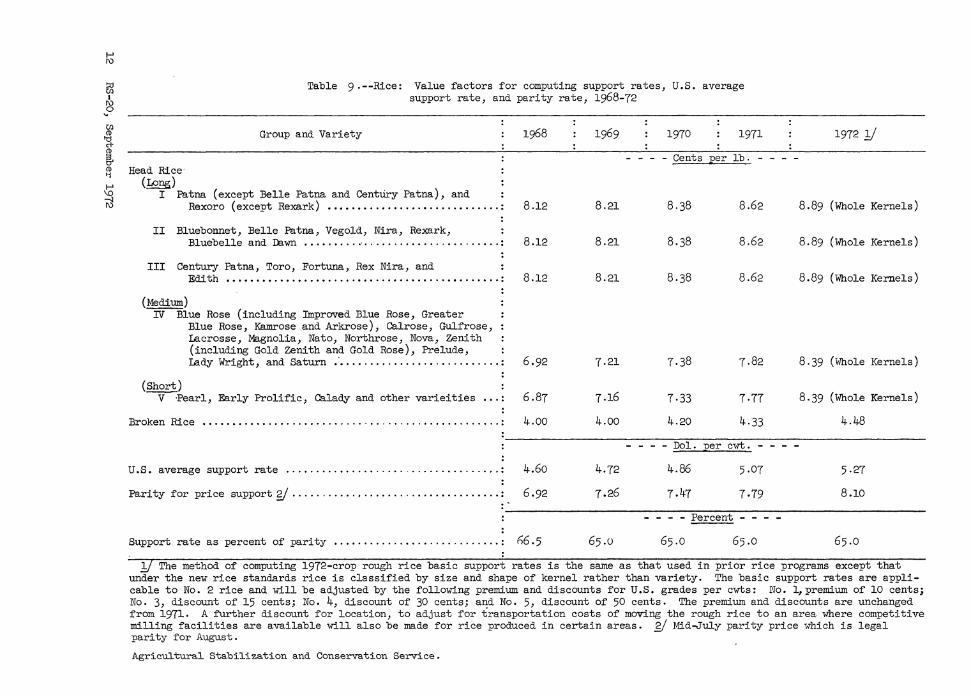
Table 9 .--Rice: Value factors for computing support rates, U.S. average support rate, and parity rate, 1968-72
Group and Variety :
Head Rice (~)
Patna (except Belle Patna and Centliry Patna), and I Rexoro (except Rexark) ••••.....•......•.....•...... :
II Bluebonnet, Belle Patna, Vegold, Nira, Rexark, Blue belle and Dawn •••••••....•..••.•••••...••...•••. :
: III Century Patna, Tore, Fortuna, Rex Nira, and
Edith •.•••••..••.••.••.....•.•.............•....... :
(Medium) -rv-:Blue Rose (including Improved Blue Rose, Greater
Blue Rose, Kamrose and Arkrose), Calrose, Gulfrose, Lacrosse, M9.gnolia, Nato, Northrose, Nova, Zenith (including Gold Zenith and Gold Rose), Prelude,
1968
8.12
8.12
8.12
Lady Wright, and Saturn •· ........................... : 6.92
(Short) ~Pearl, Early Prolific, Calady and other varieities
Broken Rice
U.S. average support rate .................................... .
6.87
4.00
4.60
Parity for price support y ................................... : 6. 92
Support rate as percent of parity ri6.5
: 1969 : 1970 : 1971 :
-Cents per lb. -
8.21 8.38 8.62
8.21 8.38 8.62
8.21 8.38 8.62
7.21 7·38 7.82
7.16 7·33 7·77
4.00 4.20 4.33
- ~er cwt.-
4.72 4.86 5·07
7.26 7.47 7·79
Percent - -
65.0 65.0 65.0
: 1972 y :
8.89 (Whole Kernels)
8.89 (Whole Kernels)
8.89 (Whole Kernels)
8.39 (Whole Kernels)
8.39 (Whole Kernels)
4.48
5·27
8.10
65.0
!7 The method of computing 1972-crop rough rice basic support rates is the same as that used in prior rice programs except that under the new rice standards rice is classified by size and shape of kernel rather than variety. The basic support rates are applicable to No. 2 rice and will be adjusted by the following premium and discounts for U.S. grades per cwts: No. l 1 premium of 10 cents; No. 3, discount of 15 cents; No. 4, discount of 30 cents; and No. 5, discount of 50 cents. The premium and discounts are unchanged from 1971. A further discount for location, to adjust for transportation costs of moving the rough rice to an area where competitive milling facilities are available will also be made for rice produced in certain areas. 2/ Mid-July parity price which is legal parity f'or August . -
Agricultural Stabilization and Conservation Service.

Table 10.--Rice, rough equivalent: CCC operations and privately held stocks, 1960-71
Placed under price support At ~ear end'Jull 31 Deliv- CCC stocks and loans
Crop of- : Direct ered Total outstanding Loans :purchases: Total to CCC carry- Stocks Under
: ' 1:/ : 1/ over owned by loan£/ Total .. CCC 2/ r
------ - 1 , 000 .£!:!:h -
1960 7,825 5,280 13,105 4,876 10,080. 4,124 8 4,132 1961 4,292 2,081 6,373 34 5,329 314 314 1962 5,602 6,622 12,224 1,841 7,730 1,852 8 1,860 1963 5,884 4,139 10,023 771 7,539 1,435 1,435 1964 7,629 99 7,728 787 7,677 1,041 3 1,044
1965 9,813 184 9,997 403 8,239 614 7 621 1966 14,362 5 14,367 119 8,511 140 92 232 1967 16,352 2 16,354 39 6,784 82 4 86 1968 23,640 640 24,280 6,320 16,210 6,o87 238 6,325 1969 22,671 1,841 24,512 2,993 16,446 6,407 10 6,417
1970 20,787 733 21,520 3,528 18,633 9,329 138 9,467 1971.!!/ 31,235 31,'235 1,214 11433 2,720 27 2 747
1/ Includes purchase agreements through 1963 marketing year and direct purchases thereafter.
gj May include small quantities of new-crop rice in last few years.
3/ Derived by subtracting CCC stocks and loans outstanding from total carryover.
':i/ Preliminary.
Table 11.--Rice, rough: Acreage, yield and production, by States, 1971 and 1972
Acreru?;e Yield per
: Private-: ly held : ("Free") :stocks 'jj
5,948 5,015 5,870 6,104 6,633
7,618 8,279 6,698 9,885
10,029
9,166 8,686
Planted Harvested harvested Production State acre
1971 : 1972 1/ 1971 1972 1/ 1971 : 1972 1/ 1971 : 1972 1/ - - - - 1,000 ~ - - - -~-- - - 1,000 cwt. - -
Southern States:
Missouri 5.0 5·0 4.9 4.9 4,8oo 4,700 235 230 Mississippi 52 52 51 51 4,450 4,300 2,270 2,193 Arkansas 442 442 441 441 4,.950 4,900 21,830 21,609 Louisiana 524 525 522 523 3,8oo 3,850 19,836 20,136 Texas 470 470 468 468 4.9QO 4 6oo 22 932 21 528
Total Southern 1,493·0 1,494.0 1,486.9 1,487.9 4,513 4,415 67,103 65,696
California 333 333 331 331 5,200 5,700 17,212 18,867
Total United States£/: 1,826.0 1,827.0 1,817·9 1,818.9 4,638 4,649 84,315 84,563
1/ Preliminary.
gj Total u.s. acreage and production reported by the Statistical Reporting Service. Excludes acreage and production in the minor Southern States.
RS-20, September 1972 13

Table 12.--Rice: Stocks, rough and milled, United States, for selected dates, 1967-72 1/ ROugh Milled
Year On farms :At mills and :In warehouses:In ports .• : Total :At mills and:In warehouses:In ports
or in : in attached :(not attached: or in all : in attached :(not attached: or in Total all
positions farm =warehouses gj: to mills) :transit :.positions:. warehouses .=. to mills) =transit warehouses: •
1967 1968 1969 1970 1971 1972 gj
1967 1968 1969 1970 1971 1972 gj
1967 1968 1969 1970 1971 1972 gj
1967 1968 1969 1970 1971 gj
8,252 9,619
14,548 10,415 10,090 10,707
2,056 2,491 9,491 4,815 3,312 3,455
226 120 331 242 202 132
17,926 16,925 18,ll2 16,854 13,388 12,999
ll,945 10,932 14,681 12,333 10,416 8,746
2,869 2,234 4,295 4,955 4,520 2,681
1,010 183
1,529 974
1,6o6
1,000 cwt. - - 1,000 cwt.
January 1 29,822 30,324 34,962 36,348 35,877 36,750
April 1 16,658 13,446 21,910 26,744 21,556 20,347
August 1 3,102 1,105 7,815 7,890
10,169 5,604
October 1 336 85
5,739 6,754 5,933
4
26 91 ll 27
16 2
17 30 29 ll
51 128
6
12 6
26
56,oo4 56,868 67,648 63,708 59,366 60,483
30,675 26,871 46,099 43,922 -35,313 32,559
6,197 3,459
12,492 13,215 14,891 8,423
1,346 268
7,280 7,734 7,565
2,843 1,977 3,151 1,699 2,6o6 2,666
2,710 1,836 3,754 2,007 3,684 2,548
1,274 1,103 1,696 1,743 2,273 1,966
477 607 384 446
l,llO
January 1 229 501 22
3 155 840
April 1 192 152 535
48 33
336
Arol!st 1 10
21 86 58 67
October 1 27 24 3
55 240
2,732 1,932 1,620 1,346 1,788 2,160
1,817 1,655 1,6ll l,Oo4
769 1,743
306 1,315 1,0o6
499 421 163
260 420 703 336 503
5,8o4 4,410 4,793 3,048 4,549 5,666
4,719 3,643 5,900 3,059 4,486 4,627
1,684 2,418 2,723 2,328 2,752 2,196
764 1,051 1,090
837 1,853
1/ These estimates do not include stocks located in States outside the major producing States of Missouri, Mississippi, Arkansas, Louisiana, Texas, and California.
sJ Preliminary.
Table 13.--Rice, U.S.: Rough milled, Total milled production and yields, 1965-71
Year beginning A st
Rough milled Total milled produced 1/
1965 1966 1967
1968 1969 1970 1971 gj
1/ Includes brown rice.
gj Preliminary.
- 1,000 cwt. - - -
70,594.6 80,209.8 88,ll5.7
89,086.4 86,544.3 77,325.6 87,924.6
50,377.3 58,381.6 64,079.7
65,24o.l 62,349.6 56,870.0 64,148.2
Milling yields Total heads produced 1/
Pounds per cwt. - 1.000 cwt. -
71.36 42,862.2 72.79 49,903.2 72.72 54,405.5
73.23 55,771.2 72.o4 53,138.3 73.55 49,533.4 72.96 55,346.8
Based on reports from the Rice Millers Association and San Francisco Rice Market News.
14 P£-20, September 1972
Milling yields
Pounds - - per cwt.
60.72 62.22 61.74
62.60 61.40 64.o6 62.95

Table 14·--Rice, rough: Acreage, yield and production in specified countnes, ave.raee 1965-69, f.lnnual 1970 and 1971 JJ
Region and country
Harth America Costa Rica CUba Dominican Republic El &llvad.or Guatemala Honduras l~xico Nicaragua Panama United States
Total
South America Argentina BoliVla Brazil Chile Colombia Ecuador Guyana Paraguay Peru SurJ.nam Uruguay Venezuela
Total
France Italy
Total EC Greece Portuc.al Spo.J..n
Total ;leste.cl'l Europe Dulearia nuneary RoL!S.n:ta Yueoslana
Total Eastern Europe Total Euro!_lC
Afric.a -Chad
Egy-~t
Gambia Ghana Guinea Ivory Coast Liberia Malagasy Republic ~li Morocco Mozambique Nigeria Portuguese Guinea Senegal Sierra Leone Tanzania Upper Volta Zaire
Total Asia Mghanis~~.-Sn
Burr1"18 Ceylon China, Rep. oi (Taivmn) India IndonesJ..a Iran Iraq Japan Khmer ReD . (Cambodia) :<area , Rep. of laos l:fllaysia :Lie pal Paldstan Philippines Sa bah Sara>18.k Thailand Turl,ey (Europe-Asia) Vietnam, Sout.h
Total (Excl. Comm. Asia) ljj China -Mainland
Oceania Australia
Total
:Ave.
119 172 211 54 31 15
400 72
320 2 042
183 81
89 316 25"1 67 35 12
494 106 301
l 815 3.492
190 91
19
99 321 257 69 35 l'l
418 111 309
l 818 3.454
230 94
Ave. J
1,345 1,631 1,653 72 66 74 1,338 2,274 2,271 104 326 330 1,801 1,887 172 210 220 2,115 1,349 52 '•1 43 1,479 1,638 1,638 21 26 26 1,029 1,102 nB 7 6 6 2,022 1,474 1,782 367 330 338 1,833 1,414 1,1,30 60 68 72 1.053 1,135 1,178 153 155 165 4.30~-----'!~''-':'6'e:5~---.,4C'763="8'----__ ---'!4~o'f'46"':'-___ -::3 ..... ::,79~9~----=-3 §gL_ 3,243 3.147 3,253 5 054 5.027 5 Q9JL__
283 56
315 77
10,873 66
751, 229 298
10,193 64
576 210 294
10,873 77
581 198 232
3,414 1,530 1,181 2,452 2,015 1, 773 1,605 2,299 3,483 2,961 3,184 1.78o
3,342 1, 505 1,366 2,515 2,8o9 1,932 1,663 2,612 4,027 2,9"18 3,396 1,978
3,017 l,Bo8 1,040 2,000 2,922 1,949 l, 759 2,694 4,oo6 2,978 3,391 1,669
5,825 73
689 184 217
288 62
6,315 73
734 184 222
5,130 70
770 175 185 6o 42
240 81 76
278 13,201
49 329 89 91
272 12,448
49 339 89 69
272 13.103 L368 l 601 1 317
44 379 109 no 224
8,194
58 601 120 140 244
616 120 lo6 ?06
7830
67 54 52 3,254 3,667 3,477 99 82 ·__J~59'fr-------'f4*27!-- 450 4,145 4 229 4 320 6 _____llB2___ · 426 481 5o2 4 oo5 lu66 4 233 774 ~-
49 42 37 4,283 3,989 4,648 95 78 85 104 101 3,963 4,134 4,147 153 190
---~1~51~. 158 1 6 ~______5~58~1~--~5~65~3~--·-~~37~4!---~~~---~W~o~ : ___ TI:1_. J_§2_ ___ J.9.Q_ __ ..!!-_,jg9__~lffi__ct4c,L5;u20;;L___ l 396 1 632
33 40 40 3,153 3.200 3,307 47 60 49 57 57 1,755 1,837 1,737 39 45 56 69 74 2,362 2,237 2,145 60 72
: __ - -ll- 20 22 J 5J8 2.100 2 182 21 10 22__ : _ __!>!_ 186 __123____sm ____ 2~_g_,ru___ 16 _l32_ _____ 1$._____
862 971 989 3 998 ____l,.Q_2;o4,__ __ _,4'-""o8"'2'-----'l"""56"'3~--__J,1+7.L7u2'-- _____j,_j)Jj,_ __
; ____ ~J2_ _____ ~86~5L-_____ ~9~l~4- 2~ ~3~,2~6~2 ____ ~3~1~3~1 _____ ~8~2~l _____ ~l~2~8o~---~'~3~0~0-
73 82 84 1,000 890 1,072 1,186 1,186 4,479 4,58o
69 74 74 1,246 1,189 98 138 146 1,031 942
849 1,008 1,025 852 766 684 68o 803 991 973 559 450 457 547 583
2,202 2,298 2,323 1, 719 1, 782 442 408 4 32 832 946 15 12 2 4,000 2,205
252 259 259 1,329 1,362 566 630 650 1,465 1,473 113 115 1,619 1,630
917 4,648 1,189 1,072
BoT 1.,076
627 1,774
894 3,307 1,362 1,458
211 222 230 1,223 1,192 1,200 812 778 788 1,102 1,204 1,194 215 230 230 1,099 1,150 1,200 99 124 124 889 711 7ll
33 2,178
39 46
328 308 139
l, 717 167
30 152 376 83
117 406 107
40
33 2 464 '40
59 350 300 ll9
1,858 175
12 160 421 85
120 425 125
40
35 2, 500
40 71
375 392 130
1.869 175
3 160 430
125 427 125 w
----,..-')3"'02,___ .3.34 4 _95c;;7 ___ -:;-;9~2,:.5 __ __2g5 ________ ~,-------,~~-------=-'!""----:___JLQ~33~--~9~______9 147.~---l~,6~48~--~l~,w7~0.L7 ___ 1~,fl~2---~~L---~~~----L~L--
566 58o 58o 2,103 2,186 2,186 540 575 575 12,230 l2,40o 12,855 1,387 1,445 1,415 7,694 8,128 8,250 1,560 1,658 1,658 1,569 1,928 1,928 1,110 1,450 1,450 1,940 1,917 1,875 3,498 3,339 3,851 3,078 2,903 3,275
89,753 92,498 93,902 1,319 1,519 1,551 53,68o 63,736 66,066 19,837 20,228 20,920 1,729 2,011 2,o62 15,554 18,452 19,563
568 667 692 3,659 3, 761 3,332 943 1,138 1,046 720 751 751 1,249 1,321 1,321 408 450 450
8,o68 7,223 6,659 4,651 4,841 4,493 17,019 15,865 13,570 5,755 5,928 5,599 945 1,418 1,076 2,467 3,814 2,732 3,039 3,039 3,039 3,619 l,,o4l 4,208 4,988 5,571 5,8oo 1, 731 2,224 2,251 964 8o3 8o3 757 810 820 1,121 1,317 1,337 2,354 2,513 2,531 1,197 1,500 1,534 2,n1 2,900 2.900 1,763 1,882 1,749 2,216 2,475 2,3oo
27,565 28,209 29,000 1,516 1,566 1,444 18,954 20,034 18,994 7,884 7,692 8,204 1,257 1,531 1,391 4,495 5.344 5,177
94 111 116 1,977 1,887 1,897 85 95 100
17,259 18, 7Bo 19,274 1,525 1,558 1,533 11,935 ~ 3,400 303 358 366 870 1,028 1,025 120 167 ~
138 166 173 3,051 3,187 3,250 191 ~
--20~~~:Ylil~71~3--~2~1t~:~lF~7~~-~2~l6~8·~.a~~~~--~i~:g~~~~~--~i~:~~~~~~--~i~.~~~~§~----=l~5~~~.~~i!s~5~----=l~7~i~.7~g~~~----=l-=n,.5 ,~g~ 78,677 78,334 79,075 2,533 2,745 2,788 90,390 97,540 100,000
8o lo6 6,175 6,009 6,173 104 224 289 so 10<5 6.175 6,009 104 6.173 224 289 291
liOl'1d Total Y ;_ 311,,241 320,114 ~ 1,858 2,022 1,998 264,739 293, o98 294,714 Exc1udi China-l1ain1and : 64 ?41 78Jl 246 163 1 632 1.788 1.744 174.349 196.058 194.714
l Crops harvested in the last half of the year shoym are col'lbined ,nth crops harvested in the first half' of the f'ollm-ring year~ ~.e., Aueus-c/July. 2 Harvested area as far as possible. 'jf Preliminary .. !:Jj Uorth Korea and Harth Vietnam Here excluded due to lack of: reliable data.
A ~reign Agricultural Service. Prepared or cstimat.ed on the basis of ofi'J..cial statJ..stics of' f'oreign goverr>.ments, other foreie;n source rmtenals, U.S. e;ncultural Attaches and Foreign Service Officers, results of office research and related J.nformation.
RS-20, Septeniber 1972 15

1-' 0\
Table 15.--Rice: Export prices at Thailand by months, white f.o.b. Bungkok, 1969-72 1./
65 I
1\) 0
: July : Aug. " Year : Jan. : Feb. : :tv'ar. : Apr. : May : June . Sept •. Oct. . Nov. Dec • . Cf.l CD 'd c+ : - - - - Dollars per metric ton -CD
~ : CD : 100% 1st. grade 1-:l
1-' 1969 : 192.Go 192.60 199.68 198 ·90 205.80 212.16 2Ql.l2 199.80 200 .4o 192-96 '0 213.00 205.05 ~
(\) 1970 : 166.20 164.4o 156.24 152.4o 152.4o 1)9.60 160.80 163.68 160.20 '160.50 159.60 156.00 1971 : 15'T .20 lh2.20 132.72 130.80 141.84 145.20 14'T .oo 149.52 158.38 157·50 151.68 147.1J5 1972 g/ : 145 .lL~ 139·3)+ 140.05 138.56 141.96 144.71 146 ·97 172.42
: . 100% 2nd. grade
1969 : 187-50 186 .oo 192.48 191.70 198.60 294.96 205 .so 195.60 193·92 192.60 193-20 185.84 1970 : 161.4o 159.60 151. 4L~ 147.60 147.60 150.00 151.20 154.08 150.60 150.90 150.00 146.4o 1971 : 147.60 132.60 123.12 121.20 132.24 135.60 l3'T .40 139·92 148.52 147.54 144.34 141-70 1972 gj : 14o.44 135.49 136.20 134.38 138.12 140.86 143.03 167.06
5% brokens . :
1969 : 181.20 1"(8.80 185.28 183.60 190.8o 197·76 198.60 188.40 186.68 185.40 186.oo 178-56 1970 : 154.20 151.20 143.04 139.20 139.20 141.60 142.80 145.68 142.20 142.50 141.60 138.00 1971 : 139.20 125.10 115.20 112.80 123.84 127.20 129.00 131.52 139.89 138.82 135-76 134.00 1972 gJ : 133-81 129.74 130.45 128.96 132.36 136.06 137.73 159.86 . .
y Milled rice, includes export premiu~, export tax and cost of bags. Packed in bags of 100 kgs. net.
gj Preliminary.
A11JS, Grain Dj_vision, f'rom weekly Bulletins of' San Francisco Msrket News.
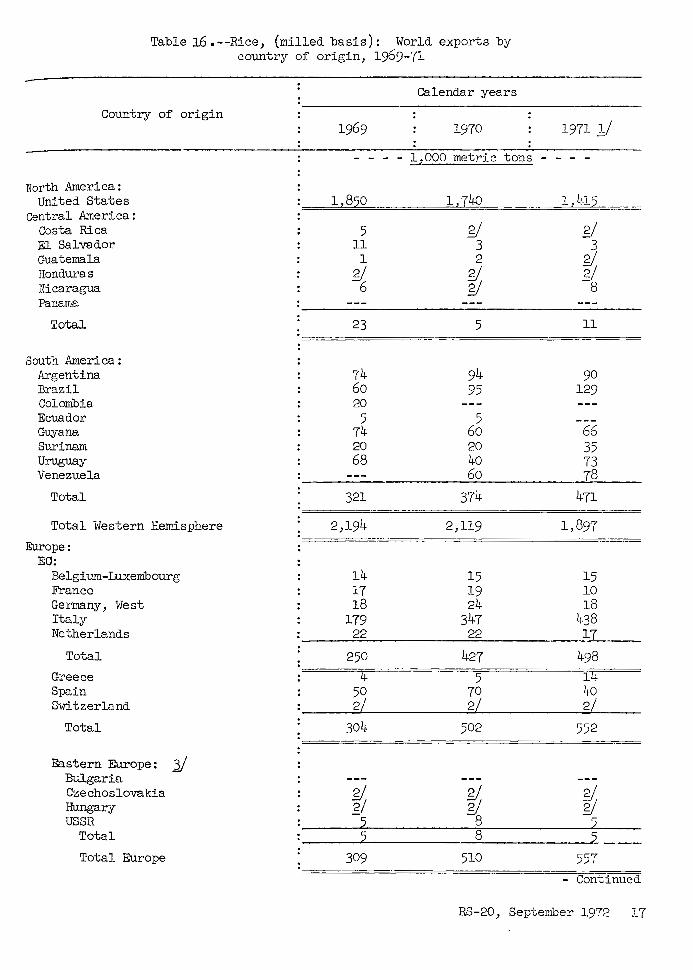
Table 16.--Rice, (milled basis): World exports by country of origin, 1969-71
Country of origin
North America: United States
Central America: Costa Rica El Salvador Guatemala Honduras Nicaragua Panama
Total
South America : Argentina Brazil Colombia Ecuador Guyana Surinam Uruguay Venezuela
Total
Total \vestern Hemisphere
Europe: EO:
Belgium-Luxembourg France Germany, \vest Italy Netherlands
Total
Greece Spain Switzerland
Total
Eastern Europe: J) Bulgaria Czechoslovakia Hungary USSR
Total
Total Europe
Calendar years
1970
1,000 metric tons -
1,850 l,74o
5 ~ 11 3 1 2 ~ 6
5/ g;
23 5
74 94 60 95 20
5 5 74 60 20 20 68 4o
60
321 374
2,194 2,119
14 15 17 19 18 24
179 347 22 22
250 427
5 50 70 2 2
304 502
5/ 5.1
5/ 5.1
8 8
309 510
1971 _])
11
90 129
66 35 73 78
471
1,897
15 10 18
438 17
i• 4o 2
552
2/ g;
557
- Continued
RS-20, September 1972 17

Table 16.--Rice, (milled basis): World exports by country of origin, 1969-71 (Continued)
Asia: Aden Burma Cambodia
Country of origin
China, l·i3.inland Hong Kong India Iran Jar>an Korea, North Korea, South Kuwait Malaysia Nepal Pakistan Philippines Singapore Taiwan Thailand Turkey Vietnam, North
Total Africa:
Angola Ivory Coast Kenya lY!alagasy Morocco Mozambique South Africa United Arab Republic
Total Oceania:
Australia
Horld Total
Calendar years
1970 1971 y 1,000 metric tons - - - -
5 541 110 710 17
9
3t 60
5 6
25 135 y 48 35
999 1
20
3,067
1 gJ
1 52 14 gj
2 770
B4o
719 170 BB5 12 22 gJ
630 4o
4 20
130 1
45 5
1,062
3,745
2 gJ
1 68
4 1 2
654
732
Boo 33
622 15 13 2/
Boo 4o
gJ 20
197
47 3L~
1,576
4,197
3 gJ
1 3B
2 1 2
515
=====11~7~=========1~1~1==========1==~~ 6,527 7,217 7,399
y Preliminary. g/ Less than 500 metric tons. Jl Based on actual imports by reci:pient countries·, intra -trade on calendar year basis, and official estimates by FAO, FAS and Co:mm.omrealth Secretariat. !!:,/ Only limited quantities for seed exported from Asian countries.
Foreign Agricultuxal Service Grain and Feed Division
18 RS-20, September 1972
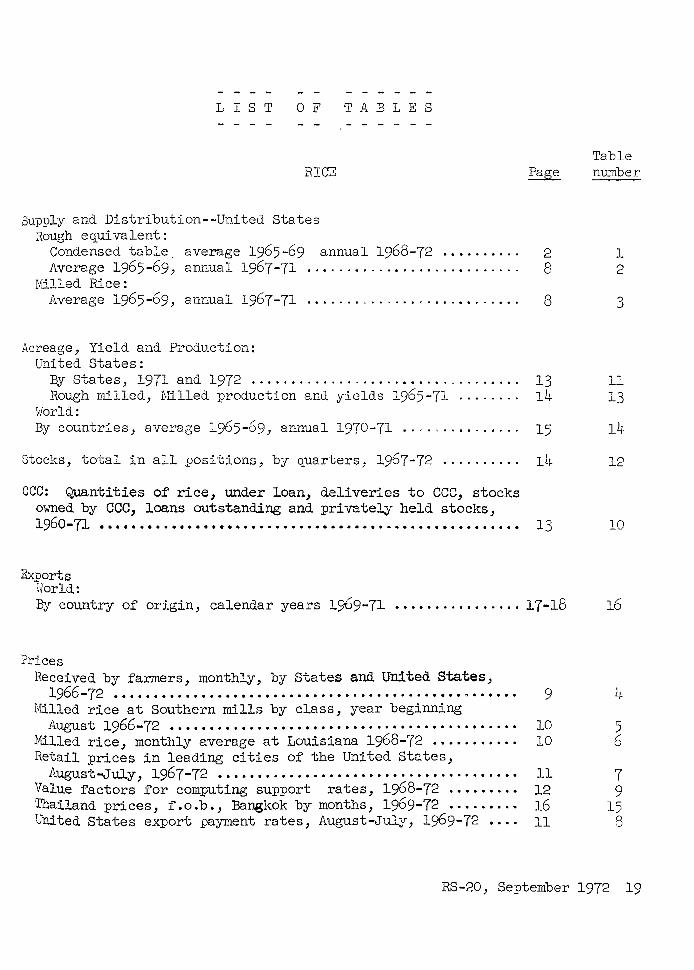
L I S T 0 F T A B L E S
Sup:9ly and Dist:t'i.bution--Unitecl States Rowjh equivalent:
Condensed table average 1965-69 annual 1968-72 .••....... 2 Average 1965-69: annual 1967-71 ..•.. ......•.. .. ......... .. 8
Milled Rice: Average 1965-69, annual 1967-71 ....... -·.. .... ... .... ..... 8
Acreage, Yield and Production: United States: ~J States, 1971 and 1972 ......................... - . . . . . . . . 13 Rough rdlled, J>lilled :production and yields 1965-71 . . . . . . . . 14
)·iorld: By countries, average 1965-69, annual 1970-71 ............... 15
Stocks, total in all :positions, by quarters, 1967-72 . . . . . . . . . . 14
CCC: Quantities of rice, under loan, deliveries to CCC, stocks owned by CCC, loans outstanding and privately held stocks, 1960-71 ••••••••••••••••••••••••••••••••••••••••••••••••e•••• 13
Exports \~Jorld:
Table number
l 2
3
ll 13
14
12
10
By country of origin, calendar years 1969-71 •.••............ 17-18 16
Prices Received by farmers, monthly, by States and United States,
1966-72 ............................................ !I •••••• Ivlilled rice at Southern mills by class, year beginning
August 1966-72 .............. · · · · · · · · • • · · · · · · · · · · · · • · • · · · · · IY!illed rice, monthly average at Louisiana 1968-72 ••••.••..•. Retail prices in leading cities of the United States,
August-July, 1967-72 ......... · ·. · · · · · · · · · · · · · · · · · · · · · · · · · · Value factors for computing support rates, 1968-72 •..•.•.•• Thailand prices, f.o.b., Bangkok by months, 1969-72 .••••...• United States export payment rates, August-July, 1969-72 •...
9 4
10 5 10 6
11 7 12 9 16 15 ll 8
RS-20, September 1972 19

UNITED STATES DEPARTMENT OF AGRICULTURE WASHINGTON, D.C. 20250
OFFICIAL BUSINESS PENALTY FOR PRIVATE USE, $300
NOTICE: If you don't want future issues of th1s ERS publication, check here I:==J and ma1l this sheet to the address below.
If your address should be changed, wnte your new address on th1s sheet and mall 1t to:
RS-20
Automated Mailing List Section Office of Plant and Operations U.S. Department of Agriculture Washington, D.C. 20250
SEPTEMBER 1972
POSTAGE AND FEES PAID U.S. DEPARTMENT OF
AGRICULTURE
AGR.101
FIRST CLASS
~ ~ U.S. MAIL ---
RICE REPORTS OF INTEREST
Item
Rice stocks (October 1 and January 1)
Milled rice production (Monthly)
U.S. rice production by classes (November)
Rice, rough and milled, U.S. exports (Monthly)
Price supP;ort loan activity (Released Mid-month)
Prices received by farmers (Monthly)
Retail prices (Monthly)
Market prices, Southern and California (Weekly)
Prices, milled, Southern head (Weekly)
Prices at Thailand (Weekly)
Review of World Rice Markets and Major Supplies
Major Structure of the Food Industries
Major Statistical Series of the USDA How they are constructed and used
33rd Annual Report of the Regional Grain Cooperatives
Report and Publisher
Rice Stocks, SRS, U.S. Dept. Agr.
Statistical Statement, The Rice Millers' Association
Crop Production, SRS, U.S. Dept. Agr.
Rice Market News, AMS, U.S. Dept. Agr.
Grain Loan Activity, ASCS, U.S. Dept. Agr.
Agriculture Prices, SRS, U.S. Dept. Agr.
R11tail Food Prices by Cities, U.S. Dept. Labor
Rice Market News, AMS, U.S. Dept. Agr.
Rice Market News, AMS, U.S. Dept. Agr.
Rice Market News, AMS, U.S. Dept. Agr.
Foreign Agricultural Service, FAS M-246, U.S. Dept. Agr.
Marketing Research Report No. 971, ERS, U.S. Dept. Agr.
Agriculture Handbook No. 365, U.S. Dept. Agr.
Service Report 126, FCS, U.S. Dept. Agr.