richard stockton college of new jersey cultural...
TRANSCRIPT

1
BRYANT ASSOCIATES CONSULTING LLC.
RICHARD STOCKTON COLLEGE OF NEW JERSEY
Cultural Audit 2008-9
BY
Frederick V. Bryant, Ph.D., Dianne Bryant, Ph.D.,
Sarah Halley, B.S.
Copyright © 2009 Bryant Associates Consulting LLC

2
Table of Contents Page
Sections
INTRODUCTION : Project Summary 4 Core Recommendations 7 History: Diversity and Inclusion Context 9 Mission Imperative Diversity and Inclusion Culture 10 Challenges of Diversity and Inclusion Culture Change 12 Dimensions of Campus Diversity and Inclusion Culture 18 A Research Model METHODS AND PROCEDURES 19 Design 19 Participants 19 Study Start-up 20 Focus Groups 21 Focus Group Data Coding 22 Survey 23 Survey Variable Recoding 24 Demographic Variables 24 Diversity Variables 25 Scale Scores 26 Survey Data Analytic Strategy 27 Document Review 28 Ethical Considerations 29 RESULTS 29 Focus Group Findings 29 Highlights; Macro/Themes and Trends 31 Survey Findings 35 Narrative Description of Participants 35 Chi-Square Results 40 Regression Analysis Findings 55 Targeted Document Observation Review Results 56 Discussion 62 Conclusion 81 Diversity and Inclusion Culture Change Model 82
3
REFERENCES 88 APPENDICES 92 A. FOCUS GROUP CONFIDENTIALITY AGREEMENT 93 B. INFORMED CONSENT FORM 94 C. FOCUS GROUP QUESTIONS AND PROTOCOL 96 D. FOCUS GROUP SUMMARIES THEMES, TRENDS AND UNIQUE IDEAS 98 E. TARGETED DOCUMENT OBSERVATION REVIEW 122 F. DEFINITIONS: SURVEY INSTRUMENT SUBSCALES 138 G. CULTURAL DIVERSITY SURVEY 140
LIST OF TABLES Table
1. Comparison of Two Cultures 13 2. Dimensions and Their Relationships 18 3. Analysis of Participant Demographic Data 37 4. Additional Student Demographics 39 5. Additional Administration/Faculty/Staff Demographics 39 6. Regression Analysis 55 7. Targeted Document Observation Key 124
LIST OF FIGURES Figures 1. Chi-Square Results: Figures 1-25 40
DIAGRAM
1. Dimensions of Campus Diversity and Inclusion Culture 17
4
INTRODUCTION
Project Summary
Most colleges and universities have responded to the environmental demands for
diversity and inclusion in higher education. As the faces of our nation change, so does
the face of college and university campuses. There is a growing recognition among
educators that if our students are to succeed in the twenty-first century and beyond
they must be prepared to function in a multicultural, multiethnic and multilingual
America. Reponses from institutions of higher education have run the gambit from views
that if left alone “diversity and inclusion will take care of its self” to views that “diversity
and inclusion will require mission critical efforts by educational institutions” to not only
create an inclusive educational environment, but to enhance and sustain it. Educators
have recognized that providing the full opportunity for their students to grow and
flourish in the twenty-first century mandates that Richard Stockton College of New
Jersey (RSCNJ) articulate its values for diversity and inclusion through its policies and
practices, as well as through internal organizational groups such as the College
Committee for Diversity, Equity and Affirmative Action (CCDEAA). Additional challenges
faced by many institutions are expectations of higher education and job market
demands that require higher education to produce culturally competent people prepared
to transition efficiently and function effectively in the emerging multicultural workforce
and the global community of the 21st century. In addition, colleges and universities have
to meet the requirements of accrediting and licensing bodies seeking accountability
(Smith, et al., 2000).
Fully aware of these challenges, the leadership of RSCNJ in the Fall of 2008
engaged Bryant Associates Consulting (BAC) to implement a cultural audit in the context
of diversity and inclusion. A cultural audit is a study and examination of an
organization’s cultural characteristics, including its norms, attitudes and values, to
determine whether they help or hinder its vision and mission
BRYANT ASSOCIATES
CONSULTING LLC.

5
(www.BusinessDictionary.com 2008). In this context, RSCNJ had a particular interest in
examining the current state of its organizational culture and its congruency with
espoused values such as the impressive message articulated in the College Committee
for Diversity, Equity and Affirmative Action Statement that follows below:
A diverse college environment is also necessary for students to gain a greater understanding of themselves. This process of self-discovery requires that students interact in a safe, respectful, and affirming environment with people – faculty and staff as well as other students – who have different life experiences than their own. This interaction teaches that people are individuals who cannot be characterized by stereotypes and overgeneralizations. (Richard Stockton College New Jersey 2005, College Committee for Diversity, Equity and Affirmative Action. (n.d.), Retrieved September 10, 2008 from http://www2.stockton.edu)
This cultural audit involved an examination of the institution’s current culture as
experienced by a wide range of social identity groups, e.g. sexual orientation, race,
ethnicity, religion, gender, age, language, people with disabilities, and student/employee
“college groups.” Generally, diversity and inclusion means different things to different
people. Given the persistent legacy of racial inequality in the United States, some
readers of this report may focus on diversity and inclusion regarding race. Still others
will attend to examining the degree of negative differential treatment possibly
experienced by people with disabilities, women, people with lower socio-economic
status, those with various LGBT orientations and identities, or those from a variety of
cultural groups for whom English may or may not be their first language. Jackson (2006)
defines “Diversity” as the range of social identity groups that comprise an organization
and “Inclusion” as fully, and respectfully, involving all members regardless of social
identity in the activities and life of an organization. Using Jackson’s definitions, this
study will attempt to portray a snap shot of these issues as they have emerged through
our findings.
The above influenced the direction of this exploratory study in the Fall and
Winter of 2008-9. A sample population of the college community was assessed using: an
on-line survey (n=789: 391 students and 398 employees); twenty-six focus groups
representing multiple affinity groups (n=168: 98 students and 70 employees); a
targeted review of organizational documents; and anecdotal observations by Bryant

6
Associates Consulting LLC (BAC), the external research team conducting the study. BAC
provided a survey instrument modified through feedback from CCDEAA and
collaboratively customized an on-line survey instrument for the assessment Cultural
Diversity Survey (CDS). The survey instrument consisted of 49 items. Demographic
variables comprised 12 items, the remaining 37 items designed to measure
organizational culture rated on a 4-point (9 items) and 5-point (28 items) Likert scale.
The items were sub-scaled into domains under the following categories: (1) Perception
of Fairness; (2) Exposure to Negative Comments; (3) Campus Climate; (4) Engagement
In Corrective Behaviors; (5) Cultural Sensitivity in College Policies and Practices; and (6)
Perceived Influence of Personal Characteristics on Self and Others. These items were
developed to assess the RSCNJ community membership experience of the
campus/organizational culture. (Bauman, Bustillos, Brown and Bartee, 2005)
CDS regression analysis results show that race (whites vs. people of color, i.e.,
racial/ethnic) was a significant predictor of domains 1, 2, 3, and 5; college group
(students vs. employees) was a significant predictor of domain 4; social identity group
was not a significant predictor of domain 6.
Regarding 28 of 37 Likert questions asked, CDS chi square results show
proportional differences related to gender (male vs. female), age (33 or under years vs.
34 or older years of age), ability (people with disabilities vs. non-disabled people),
college group (students vs. employees), and race (white vs. people of color i.e.,
racial/ethnic). Gender shows proportional difference on one question, while age and
ability shows proportional differences on two questions. In addition, college group shows
proportional differences on six questions. By race, 18 of the 28 questions show
proportional differences in response to the Likert questions on the CDS.
Focus groups generated several macro themes and macro trends,
themes/trends, and unique ideas that show interrelated support for some of the above
findings. Additional information was gleaned from a targeted review of organizational
documents, as well as from anecdotal observations by the research team Bryant
Associates Consulting LLC (BAC). All findings are presented in further detail in the
findings and appendices sections of this document.

7
Results from the Richard Stockton College of New Jersey Cultural Audit Project
(RSCNJ-CAP) influenced Bryant Associates Consulting LLC (BAC) to present the following
Core Recommendations for improving diversity and inclusion at Richard Stockton College
of New Jersey (RSCNJ). The recommendations are based on industry Best Practices and
the field experience of BAC. As these recommendations are translated into goals,
objectives, and action steps, they will support the institution in moving toward culture
change based on available resources, motivation, and level of commitment. All
recommendations are generated from the perspective of increasing cultural competence
(skills and interpersonal effectiveness) for individuals; effective collaboration (conflict
resolution, communication and team effectiveness) within and between groups (affinity,
departments, professional roles, organizational levels, etc.); and increased institutional
culture change capacity (policies, practices both formal and informal norms) that are
mission critical for diversity and inclusion culture.
Core Recommendations
• Set the tone and expectation, and promote college community buy-in for future
change by communicating to the entire organization the RSCNJ Cultural Audit
2008-9 report results and anticipated potential next steps.
• Conduct Diversity and Inclusion Leadership workshop(s) for members of the
president’s cabinet, diversity committee, and other key leadership personnel
throughout the institution.
• Make diversity and inclusion mission critical. Review, revise and update current
RSCNJ’s mission/vision/strategic plans and organizational goals to reflect greater
depth and commitment in support of substantive diversity and inclusion
institutional culture change. In addition, implement this process in every area of
the institution e.g., departments, programs, projects, etc; each should have
mission/vision/strategic/goals consistent with and reflective of the organization.
Create mechanisms for accountability.
• Develop, integrate and implement diversity and inclusion competencies as a
normative part of all employees’ performance management and work evaluation
process. Link these competencies to compensation, promotions, and tenure.
Create mechanisms for accountability.

8
• Provide management development and training thoroughly enhanced by diversity
and inclusion best practices for all levels of employees responsible for
managing/supervising others. Create mechanisms for accountability.
• Provide awareness and skills training for all employees that enable them to
behave as diversity and inclusion culture carriers (disseminators). Create
mechanisms for accountability.
• Increase awareness of all students of the college’s commitment to diversity and
inclusion and enable them to behave as diversity and inclusion culture carriers
(disseminators).
• Provide multiple opportunities for all students to interact and have meaningful
conversations across race, ethnicity, gender, religion, sexual orientation, etc.
• Conduct regular internal cultural audits; review, revise, and integrate diversity
and inclusion principles into documents, common language, practices, and
behaviors that are reflected in every area of the college.
• Review the 2020 Strategic Planning process and make sure that key stakeholders
at all levels of the College are included and have a voice in the goals and
priorities for the College.
• Use this study (RSCNJ Cultural Audit 2008-9) as part of a baseline for continued
research and evaluation of the organizational culture’s progress over time.
• Convene an academic committee to evaluate curriculum in more depth.
• Convene meetings with people with physical disabilities (students and
employees) to determine additional services and support RSCNJ can consider
providing.
• Create Diversity Champions initiative for both students and employees.
Sponsored by the office of the President, these groups would function as internal
consultants to campus groups implementing various diversity and inclusion
programs. They would receive in-depth advanced diversity and inclusion
education and skills training.

9
History: Diversity and Inclusion Context
The Richard Stockton College of New Jersey is named in honor of one of the 56
signers of the Declaration of Independence. Richard Stockton was a lawyer appointed
judge on the Supreme Court and elected Chief Justice prior to his death in 1781. In
1969, 188 years following his death, legislation establishing the school was passed.
Classes began on schedule with the commencement of the first academic year in
September of 1971.
Early in its history, the College reflected the democratic attributes embodied in
the man Richard Stockton. Faculty of Color were first hired in the nineteen seventies. In
1983, Vera King Farris, an African American woman, was named third President of the
College. In 1990, the College opened one of the nation's first Holocaust Resource
Centers hosted by a public college in the United States, an accomplishment that led in
1999 to the nation’s first Master of Arts program in Holocaust and Genocide Studies and
to teacher training in Holocaust education conducted for thousands of teachers.
In July of 1991, Stockton College was reaccredited unconditionally for another
ten years by the Middle States Association Commission on Higher Education, with a
special commendation for its efforts in achieving social and intellectual diversity. The
Templeton Foundation also recognized Stockton in 1999 for outstanding leadership in
the field of character development. The foundation lauded Stockton for the CHEER
(Civility, Harmony, Education, Environment, and Respect) Conference to reduce
prejudice, violence and bigotry in schools, its championing of cultural diversity, and for
the College's leadership role in Holocaust education. The Middle States Association
Commission on Higher Education reaccredited Stockton College in 2002. The action did
not ask for follow-up reporting prior to 2007.
Richard Stockton College of New Jersey has a distinguished history of
accomplishments in many areas of diversity and inclusion. As an institution, it is not
satisfied with achievements of the past regarding this work. In recent years, the College
was awarded a Bildner Family Foundation Grant to further the commitment to diversity
and inclusion. In addition, Richard Stockton College of New Jersey (RSCNJ) has engaged

10
Bryant Associates Consulting LLC (BAC) to implement a Cultural Audit. The stated
objectives of the Institution are as follows:
• Create an opportunity for dialogue among different constituencies on issues of
diversity.
• Recognize the issues of unintentional exclusion that may be found in formal and
informal policies and practices.
• Increase areas of our strengths and challenges as they relate to creating a more
inclusive community.
• Value to a greater extent multicultural perspectives and reality.
Mission Imperative Diversity and Inclusion Culture
Many institutions have achieved some degree of diversity and inclusion.
However, for many institutions this means merely having a representative population
(compositional diversity) that matches national and or local demographics.
Compositional Diversity is important; however, this does not address inclusion, which
most practitioners agree requires a paradigm shift in the organization, a breakthrough in
the status quo. Jackson (2006) suggests that “inclusion” requires full, respectful,
collaboration across the different social identities (compositional diversity) in the social
context. When applied in earnest, his definition is fundamental to organization
development-diversity and inclusion culture change. Genuine culture change must occur
on multiple levels of human systems (individual/interpersonal, group, and
organizational). This approach requires skilled institutional support for all levels of the
system. It requires an increase in cultural competence for individuals through the
development of better skills and greater interpersonal effectiveness; an increase in
effective collaboration among different social identity groups (affinity groups,
departments, professional roles, organizational levels etc.) through conflict resolution,
communication, and team effectiveness; and an increase in institutional culture change
capacity building (policies, practices, as well as both formal and informal norms) that are
mission critical for diversity and inclusion culture.

11
Similarly, authors Milem, Chang, and Antonio (2005) assert that diversity and
inclusion on college campuses require that institutions focus attention on: 1.
Compositional Diversity, the numerical and proportional representation of various racial
and ethnic groups on campus; 2. Psychological Climate, including views held by
individuals about intergroup relations as well as institutional responses to diversity,
perceptions of discrimination or racial conflict, and attitudes held toward individuals from
different social identity groups such as gender, age, sexual orientation, religion, people
with disabilities, cultures etc.; 3. Behavioral Climate, the status of social interaction on
the campus, the nature of interactions between and among individuals from different
social identity groups, and the quality of intergroup relations; and 4. Organizational/
Structural Diversity, the organizational and structural aspects of colleges and the ways in
which benefits for some groups become embedded into these organizational and
structural processes.
Furthermore, Smith et al., (2000) build on several decades of other researchers’
work that focused on many issues now known as diversity and inclusion, e.g., minority
representation, curricular content, organizational and institutional culture, and hiring and
recruiting practices. These previous works have led to an emerging framework of
Dimensions of Campus Diversity, a research model with the following four components:
1. Access and Success, which principally attends to inclusion and success of historically
underrepresented groups; 2. Climate and Inter-group Relations, which attends to
historically marginalized or underrepresented groups in the context of campus
environment; 3. Education and Scholarship, which is characterized by the scholarly role
of the institution in educating all students to function in a pluralistic society and global
community; and 4. Viability and Vitality, which focuses on perceptions of the institution
and its feelings of diverse constituencies that answers the following questions: How well
is the mission supporting the three previous dimensions mentioned? To what degree has
the college or university defined itself in light of the needs of a diverse society?
These authors suggest that compositional diversity alone will not automatically
yield an inclusive environment. That both diversity and inclusion on colleges and
universities campuses requires a change in the organizational culture, not just the

12
diversity represented in numbers. Miller and Katz (2002) argue that “It is impossible to
create an inclusion breakthrough if the organization fails to link and integrate strategic
initiatives with its mission, vision, values, external environment, people systems and
management practices” (p. 34). These demands require educational institutions to: (1)
become mission imperative regarding diversity and inclusion, (2) become more
deliberate and intentional when implementing these diversity and inclusion strategic
plans into daily practice, and (3) concretize the mission, make it tangible i.e.,
(measurable), and integrate diversity and inclusion into the organizational culture of the
institution. In essence, a transformation is required that reflects a notable and
sustainable quality of change in the organizational culture.
Challenges of Diversity and Inclusion Culture Change
Change is difficult for most large organizations. When contrasted with corporate
America, change is often even more difficult in higher education than in corporate
settings. Corporate America has led all other sectors of society in conducting cultural
audits, in implementing culture change efforts, and in assessing progress by
demonstrating how a diverse workforce and a culture of inclusion can increase
opportunity, provide for greater upward career mobility, break glass ceilings, and – at
the bottom line – increase business profits. The values and organizational dynamics of
higher education are different and particularly difficult for effecting significant and
sustainable culture change.
First, colleges and universities do not function like corporations or any other type
of profit or nonprofit organization. The contributions to society made by institutions of
higher education are acknowledged, valued, and immeasurable. However, those familiar
with academia have observed its tenuous and numerous goal structures. Multifaceted
and differentiated groups and functions, perceived and real disparity between adopted
and enacted values, and loosely connected structures of organization and governance
are just some of the institutional dynamics that make system level change in higher
education awkward, hard and complex (Sanaghan & Napier, 2002; Kotter & Heskitt,
1992).

13
Second, unlike the corporate workplace environment in which participant
behavior is directly linked to compensation (e.g., salary, bonuses, and promotions) and
compliance to law (e.g., hostile work environment, sexual harassment), the influence
over student behavior related to issues of diversity and inclusion is more fluid.
Organizational culture change requires a paradigm that enables intentional and
deliberate response to these complex campus dynamics as well as to the external
environment (Williams, et al. 2005). Table 1 below shows a comparison of
organizational cultures that highlights some challenging aspects of intentional change in
the higher education.
Table 1. Comparison of Two Cultures
Successful Corporate Culture Traditional University/College Culture
Climate encourages experimentation and risk taking. Attempt to maintain status quo and traditional ways
(outside of research).
Trouble shooting and inquiry is legitimized; feedback
supported.
Departments are self contained and often secretive, not
feedback driven.
Restructuring of systems and developing new policies
common.
Reluctance to restructure and rarely address problems
systemically.
Employee development a high priority; management is
valued.
Performance management minimal or nonexistent among
faculty and individual development optional throughout.
Personnel reluctant to change and model new values are
removed.
Tenure-based system gives protection and rise to
mediocrity and resistance to change. Typically, data-based
feedback is limited.
Change and adapting to new needs a way of
organizational life.
Change of any kind is viewed as a threat and typically
resisted.
Client or customer needs highly valued and motivates
change.
Reluctant to think of students as customers who should
influence the product (curriculum) or the educational
process.
In their classic study of corporate America, Kotter and Heskitt studied more than 200 organizations from 22 separate industries over an 11-year period (Kotter and Heskitt, l992) taken from Intentional Design and the Process of Strategies for Successful Change (Sanaghan and Napier 2002).

14
Third, often the magnitude of the change necessary to achieve both a diverse
and inclusive culture is often not fully understood or appreciated. As mentioned earlier,
compositional diversity refers to the numerical and proportional representation of
various racial and ethnic groups in the organization. Institutional programs and policies
that increase the compositional diversity provide a symbolic role that conveys to
interested constituents that diversity and inclusion is a priority for the college and its
leaders. Hence, it is not surprising that many diversity practitioners and field researchers
observe that compositional diversity is the dimension of the culture that most campus
leaders think about when they consider creating programs and initiatives to improve
climate. However, there is also a tendency for institutional leaders and policy makers to
focus only on this one dimension (Hurtado, Milem, Clayton-Pedersen, and Allen, 1998).
Miller et al. (2002) suggest that, often and mistakenly, Affirmative Action and
Diversity and Inclusion are used interchangeably as if they are equivalent. Affirmative
Action is a legal remedy used to help correct historic disadvantages that women and
people of color experienced in society, workplace, and higher education and has
expanded to address discrimination against other groups. Through Affirmative Action,
the diversity of the organization can increase; the change in the culture, however,
remains on the surface because often the institution is not prepared to include the full
range of social identity differences in daily activities and interactions in the organization.
Diversity, when viewed from solely an Affirmative Action perspective (numbers), creates
outward institutional change. From that stance, it often becomes something intended to
fit, shape, and molded into the existing organizational framework. The result is a
singular focus on representation and awareness, as opposed to diversity and inclusion.
Miller, et al. (2002) states that what you get is “Diversity in a Box” (p. 5), a strategy of
programs and policies often thought of as extraneous, untied to the culture or bottom
line as value added. Nor is diversity and inclusion a strategy explicitly espoused or
embodied in the vision and mission or observed in daily practice by everyone throughout
the institution. On the contrary, it is too often seen as a matter of concern only to the
Human Resources department, supported by a few committed diversity champions and/
or a dedicated diversity committee. In such cases, the committee itself can become the
“solution” rather than a channel through which to create change (Williams et al., 2005).
15
In addition, campus leaders often ask the same individuals to serve repeatedly because
these individuals—often people of color and some white women—have a personal
commitment to this work (p. 14). Institutions cannot benefit from their diversity until
Diversity and Inclusion is normative. It becomes normative when viewed as mission
imperative with supporting, congruent and persistent action supported by a wide range
of the institution’s constituencies and leadership.
Last, all change starts with an interruption in the status quo, notable change has
occurred when something once new, now feels normal. Williams, Berger, and
McClendon (2005) allude to work as a function of human element and interaction among
employees as opportunities to deepen diversity and inclusion culture. Purposeful
interruptions become opportunities to engage in the moment and dialogue about
challenging diversity issues as they arise and treat them as a natural part of work.
Whether the board of trustees, search committees, planning groups, or work crews that
maintain the physical plant, it is for them to embrace an expectation of working together
in a new way that includes interruptions if change in the culture is to occur. However,
more typical are conversations of diversity in higher education that too often happen in
a tone of polite conflict avoidance which leaves the issue intact. The unspoken rule is
that change occurs in a tidy, cogent, and prepared pattern –motionless, emotionless,
and removed from in the moment experience. The implicit assumption is that change
will happen almost by magic because it is mandated from above, a simple cause and
effect equation. Human systems change is not mechanical, but organic, so much of
what is necessary in building diversity and inclusion culture has to do with how people
feel and react in the moment when a diversity dynamic arises. When engaged as
respectful teachable moments, small daily individual interruptions have a contagious
effect and cumulative positive impact. The result is a shift in status quo. Evidence of the
change is observed when people working together interrupt the status quo applying
conscious self-examination, thoughtfulness, and assertive collaboration across social
identity differences in daily practice. When this happens frequently, the change will find
its way throughout the organization as a new normative institutional behavioral pattern.
As a result, institutional level capacity to engage effectively around diversity and
inclusion will increase. Conversely, disengagement, avoidance, fear, and withdrawal

16
from issues of diversity become abnormal behavior. In sum, on a daily basis individuals
must be willing to lean into their discomfort and interrupt diversity dynamics to insure
the intended culture change.
Because the aforementioned challenges exist in other colleges and universities,
there is a possibility that they also exist in varying degrees at Richard Stockton College
of New Jersey. Combined with these core challenges are those that accompany diversity
and inclusion culture change. The above challenges noted, the research consultants
prepared the following assumptions about this cultural audit given that it could mark a
new beginning of a significant and lasting change for the institution.
• RSCNJ is trying to establish and or confirm a baseline to determine what
improvements are available to enhance the campus environment regarding
diversity and inclusion.
• RSCNJ is a student centered organization and wishes to provide all students with
the best education and understand that a diverse and inclusive culture supports
all students.
• RSCNJ wants to attract and retain more diversity of all kind enhancing a
reputation as a leader among colleges of its size.
• RSCNJ cultural audit is viewed as a step to inform future planning processes.
• RSCNJ believes just having a level of awareness to issues that inhibit inclusion
and equity for all members is not enough, they plan to engage diversity more
effectively through a skill based approach supporting the total community i.e.,
students, faculty, administration, and staff, by assisting them in learning how to
create and sustain a social environment fair for all people.
Based on the assumptions mentioned and after a review of several research
frameworks, the following model was selected for this study.

17
DIAGRAM 1.
Dimensions of Campus Diversity and Inclusion Culture
For the purposes of this study the language has been changed to reflect
consistency; we modified the name of the model, however, not the content of
Dimensions of Campus Diversity (Smith, 2000) to Dimensions of Campus Diversity and
Inclusion Culture. This study is a cultural audit – exploratory in nature – with an
emphasis on an examination of the organization’s cultural characteristics such as its
norms, attitudes, and values to determine whether they help or hinder its vision and
mission (Business Dictionary. COM, 2008). By this definition, we can remain focused
and mindful of using this model purposefully for our research aims.
Dimensions of Campus Diversity & Inclusion Culture
Education and Scholarship
Access & Success
Institutional Viability and Vitality
Campus Climate Inter-Group Relations
National Context
Global Context
Local Context
Regional Context

18
Dimensions of Campus Diversity and Inclusion Culture: A Research Model
A robust research framework was used that accounts for multiple dimensions of
diversity (Smith et al., 2000). Dimensions of Campus Diversity is a research model that
has four components: 1. Access and Success principally attends to inclusion and success
of historically underrepresented groups. 2. Climate and Inter-group Relations attends to
historically marginalized or underrepresented groups in the context of campus
environment. 3. Education and Scholarship characterize the scholarly role of the
institution on educating all students to function in a pluralistic society and global
community. 4. Viability and Vitality focuses on perceptions of the institution and the
feelings of diverse constituencies. How well is the mission supporting the three previous
mentioned dimensions? To what degree has the college or university defined itself in
light of the needs of a diverse society (Garcia, Hudgins, Musil, Nettles, Sedlacek &
Smith, 2001). See below: Dimensions and Their Relationship is a chart that
encompasses the dimensions and their relationship to data sources used in the study.
Table 2. Dimensions and Their Relationship Access and Success Campus Climate and Inter-
group Relations Education and Scholarship Institutional Viability and
Vitality
Survey Domains:
1. Perception of Fairness
2. Exposure to Exclusionary Comments
3. Campus Climate
4. Inclusive Engagement Behaviors
5. Cultural Sensitivity in College Policies and Practices
6. Perceived Influence of Personal Characteristics on Self and Others
Employee/Student Focus Groups: Applicable Themes/Trends Targeted Documents Review: Relevant to Access and Success
Survey Domains:
1. Perception of Fairness
2. Exposure to Exclusionary Comments
3. Campus Climate
4. Inclusive Engagement Behaviors
5. Cultural Sensitivity in College Policies and Practices
6. Perceived Influence of Personal Characteristics on Self and Others
Employee/Student Focus Groups: Applicable Themes/Trends Targeted Documents Review: Relevant to Campus Climate and Inter-group Relations
Survey Domains:
1. Perception of Fairness
2. Exposure to Exclusionary Comments
3. Campus Climate
4. Inclusive Engagement Behaviors
5. Cultural Sensitivity in College Policies and Practices
6. Perceived Influence of Personal Characteristics on Self and Others
Employee/Student Focus Groups: Applicable Themes/Trends Targeted Documents Review: Relevant to Education and Scholarship
Survey Domains:
1. Perception of Fairness
2. Exposure to Exclusionary Comments
3. Campus Climate
4. Inclusive Engagement Behaviors
5. Cultural Sensitivity in College Policies and Practices
6. Perceived Influence of Personal Characteristics on Self and Others
Employee/Student Focus Groups: Applicable Themes/Trends Targeted Documents Review: Institutional Viability and Vitality

19
Methods and Procedures
Design
This exploratory study was conducted to determine the degree to which RSCNJ
was adhering to its diversity standards. Bryant Associates chose to use a multi-method
data collection strategy to increase the richness, vigor, and utility of the evaluation.
Multi-method strategies, employing several means of data collection, are considered the
gold standard for such evaluations. For example, Woolley (2009) recommends
integrating both quantitative and qualitative data to maximize the validity and reliability
of investigations. She states that such an integration of data collection techniques
provides the best data and a clear snap shot of the participants’ true perceptions and
experiences. Therefore, this study included a survey instrument (quantitative), focus
groups (qualitative), key informant interviews (qualitative), a review of documents
(quantitative and qualitative), as well as on-site observations by the consulting team
which provided anecdotal data.
Participants
Participation in this study was voluntary; students and employees were informed that
their participation in the study would serve as a valuable contribution to the College in
helping it continue meeting its goals related to diversity and inclusion. Invitations were
extended to all individuals identified as a student, faculty, administrator or staff person
of RSCNJ during the 2008-2009 academic years. RSCNJ reported having a student body
of approximately 7,013 students of which there were 6,437 undergraduates (freshmen,
sophomores, juniors, seniors, and non-matriculated students) and 576 graduate and
post-baccalaureate students. The total college affiliates were 8,341 individuals of that
number approximately 1,328 were employees 106 administrators, 267 full-time faculty
and 17 part-time/ adjunct faculty and 938 staff positions. Students and employees
received an electronic message from the College’s Diversity Committee providing
information about the purpose of and the scope of the study and a description of the
consultant group conducting the investigation. Additionally all students and employees
received a personal invitation from the President of RSCNJ inviting their participation in
the study. Of the 8,341 affiliates who were emailed surveys, 789 consenting individuals

20
responded and completed the instrument. This included 391 students and 398
employees. One hundred sixty eight individuals (98 students and 70 employees)
participated in the 26 focus group sessions. Focus groups had a maximum of 12
individuals per session. Students and employees had the option of completing the
online survey alone, the focus group alone, or both the survey and the focus group. As
the online assessment instrument was completely anonymous, there is no way of
determining whether some individuals participated in both data collection methods.
Focus group participants were asked to sign a consent form, which contained
their rights as participants in this study, a statement of confidentiality, and an
acknowledgement of their agreement to participate in this investigation was signed prior
to the start of the focus group session. Participants were free to withdraw their
participation in the focus group session at any time without prejudice or penalty. There
were no known risks associated with focus group participation (See Appendixes A and
B).
College affiliates who completed the online Cultural Diversity Survey were
informed that by completing the online instrument they were acknowledging their
consent to participate in this investigation. Their participation was voluntary, no
identifying information was collected and there were no possibilities for adverse
consequences for non-participation or partial participation.
Study Start-up
Prior to the start of this study the protocol of this investigation was submitted to
RSCNJ Institution Review Board (IRB) for approval which was granted in September
2008. Several meetings were held with the RSCNJ Diversity and Inclusion Committee
who helped to shape the fabric and texture and focus of this investigation. Their input
was an invaluable asset throughout this investigative process. The consultants
conducted several interviews with administrators, and faculty along with informal site
observations of campus life at RSCNJ. The above referenced information provided
greater understanding of the organizational context in which the study was situated.
The study was launched in October 2008, at which point the focus groups began and
took place throughout the Fall semester. During the Spring Semester 2009, the Cultural

21
Diversity Survey Instrument was launched and also the review of RSCNJ institutional
documents.
Focus Groups
The first phase of the study involved conducting focus groups with students and
employees. Focus Groups are an invaluable qualitative method for exploring individuals’
thoughts, feelings, beliefs, awareness, attitudes, perceptions and behavior of students
and employees. The 26 focus groups were facilitated by trained Organizational
Consultants from Bryant Associates Consulting, LLC who have years of experience
conducing focus group discussions on topics related to diversity, multiculturalism, and
inclusion.
Recruiting for focus group participation was done via email/internet. Both
students and employees were provided with the time and location when focus groups
would be held on campus. No more than 12 individuals could participate in any one
focus group. Once signups for a scheduled focus group met capacity, interested
individuals were scheduled to a subsequent group session. Bryant Associates are skilled
focus group facilitators who provide the highest level of safety and inclusion within each
group to help participants’ feel comfortable in disclosing sensitive material and sharing
diverse opinions. Research literature provides strong support for the benefits of focus
groups in identifying areas of concern that may be missed by more rigid data collection
techniques such as questionnaires and structured interviews.
Focus Groups comprised of affinity groupings were based on a self-selection
process. Participants were asked to select a Focus Group in which they would feel most
comfortable based on any of the following: race/ethnicity, gender, sexual orientation,
religion, or Student Council/Senate Affiliation. Focus Groups were also segregated by
college affiliation student or employee. Employees grouping included affinity groupings
based on the above criteria prefixed by college affiliation such as administrator, faculty,
or staff person. Although Focus Groups are, confidential they use an open discussion
format and it is important to note that individuals are often self- conscious in disclosing
sensitive or what they view as controversial material in a mixed group forum. This type
of grouping structure minimizes disclosure regret. Disclosure Regret: A phenomenon
22
often reported by participants after expressing their reality as a member of a particular
social identity, feeling embarrassed that they reveled too much information, and worse,
that others are judging them for their disclosure.
Consultants from Bryant Associates followed an identical protocol used to
facilitate each focus group session. The sessions were ninety minutes in duration and
were held on the main campus of RSCNJ. Prior to the start of the Focus Group
participant’s consent forms and confidentiality agreements were distributed. Participants
were provided the opportunity to ask any questions relating to their participation in this
study. Once participant’s questions were addressed, consent forms were signed and
collected. The facilitator then proceeded to explain the Focus Group process to
participants. The process was presented as follows: ten predetermined questions were
divided into three sets or rounds of inquiry. Each round consisted of approximately ten
minutes of writing followed by fifteen minutes of discussion. Each round of questions
was addressed by having them written on chart paper in advance and visibly hung
throughout the meeting room. Participants were instructed to respond to each set of
questions in written form on post-it notes, then place their answers on the
corresponding chart paper.
In silence, the facilitator tracked emergent themes of the written statements as
they were placed on chart paper during each round. Once all participants were finished
responding in written form, the facilitator would mention the general themes she/he
tracked from their collective responses. Participants were then invited to clarify, discuss,
and expand on the themes presented and engage in dialogue with each other guided by
the facilitator. The facilitator guided the conversations and scribed additional notes
during this phase. Once complete, the process was repeated until all questions were
answered. The facilitator thanked them for their participation, and collected all of the
chart pages from various locations throughout the meeting room (See Appendix B -
Focus Group Questions).
Focus Group Data Coding
The 26 Focus Group sessions were held over a 4-5 week period. Data from each
individual session were transcribed along with additional written notes from the

23
facilitator pertaining to that individual group session. Once all Focus Group sessions
were held, the data analysis aspect of the each Focus Group began. All groups were
analyzed and coded individually, then organized into categories themes, trends, and
unique ideas; by social identity groupings (i.e., race/ethnicity, gender, sexual
orientation, organizational affiliation student or employee etc.), then Focus Groups were
compiled into a composite of all group responses. Data was again reviewed, analyzed,
and organized into categories themes, trends, and unique ideas across all social identity
groupings.
A theme is a fact from a participant’s perspective and represents at least 60% or
more of the respondents report out to a question. A trend represents a pattern of
response that is about 30% of the respondents report out to a question. The difference
between a theme and trend is quantitative. A unique idea is something only reported by
only one or two respondents, but it is something the report writer believes would be
helpful for others to know about.
A summary was written for each question that captures the essence of
respondents’ themes, trends, and unique ideas. Each question is then viewed across all
focus group report outs. The researcher is observing for differences and similarities in
patterns of response to discern a sense of that particular social identity group’s
experience related to the question and to other groups. Often as result of the process
above, macro themes and trends emerge from the collective focus group data. Macro
themes and trends represent similar experience across multiple social identity groups.
When included with other data sources of the study, this information adds nuance and
texture otherwise unattainable by other data collection methods.
Survey
The second Phase of the study involved the use of an anonymous online survey.
The Cultural Diversity Survey was a 49-item questionnaire developed by Bryant
Associates in conjunction with direct feedback from RSCNJ Diversity and Inclusion
Committee. The development of this instrument was greatly influenced by the work of
Smith, et al, (2000) the authors refer to “The Dimensions of Campus Diversity Model”.
The survey instrument was designed to measure Campus Climate, Perception of

24
Fairness, Exposure to Negative Comments, Perceived Influence of Personal
Characteristics on Self and Others, Cultural Sensitivity in College Policies and Practices
and Engagement of Corrective Behaviors (See Appendix F Instrument Subscales;
Appendix G – Cultural Diversity Survey ). A number of research investigations, research
instruments and protocol were reviewed in developing the above assessment
instrument. Particularly helpful has been the work of the Association of American College
and Universities (Aponte, et al., 1999; Chang & Antonio, 2005; Bauman, Bustillos,
Brown, & Bartee, 2005; Garcia et al., 2001; Smith, et al. 2000). The survey was
completely anonymous no identifying information was collected on participants.
Although the letterhead identified (i.e., RSCNJ Diversity and Inclusion Committee and/or
the President of RSCNJ) as the sender data collection was administrated by Bryant
Associates. Participants were informed that their participation would help the college
determine how closely the college was putting its stated diversity standards into
practice. The instrument took approximately 10 – 15 minutes to complete, only one
response was allowed per participant. The survey was made available online for
students and employees to complete for a period of two weeks. After the online data
collection period ended, the data was exported from the online data collection system to
an excel spreadsheet. The spreadsheet was then modified to export the raw data
into the SPSS program for analysis.
Survey Variable Recoding
Several variables were recoded for data analytic purposes. A description of each
recoded variable is provided below.
Demographic Variables
University group (quaternary). Responses to item 1 were recoded to reflect
student (2), faculty: part-time faculty, full-time faculty (2), administration (3), and staff
(4).
University group (binary). Responses to item 1 were recoded to reflect student
(1) vs. employee (0; part-time faculty, full-time faculty, administration, and staff). The

25
recoding resulted in an approximately equal number of participants in each of the two
groups.
Employee group (binary). Responses to item 1 were recoded to reflect faculty
and administration (1), and staff (0).
Age (binary). Responses to item 6 were recoded to reflect 33 or under (1) vs. 34
or over (0). The recoding resulted in an approximately equal number of participants in
each of the two groups.
Gender (binary). Responses to item 7 were recoded to reflect female (1) vs.
male (0). Responses of ‘transgendered’ and ‘none of the above’ were recoded to
missing due to the low response rates for these options. The recoding resulted in a
65%/35% split between the two groups.
Sexual Orientation (binary). Responses to item 8 were recoded to reflect
heterosexual (1) vs. other (0; (bisexual, gay, lesbian, queer, and questioning). The
recoding resulted in a 90%/10% split between the two groups.
Race/Ethnicity (binary). Responses to item 9 were recoded to reflect white (1)
vs. other (0; African American, African/Caribbean, American Indian/Native American,
Asian American/Native Hawaiian/Pacific Islander, Asian, Latino/Hispanic,
Multiracial/Multiethnic, Other). The recoding resulted in a 75%/25% split between the
two groups.
Religion (binary). Responses to item 10 were recoded to reflect Christian (1) vs.
other (0; agnostic, atheist, Buddist, Hindu, Muslim, Jewish, Other). The recoding
resulted in a 62%/38% split between the two groups.
Diversity Variables
Item 13 (ternary). Responses to the questions in item 13 were recoded to
reflect disagree/strongly disagree vs. neutral vs. agree/strongly agree.
Item 14 (binary). Responses to the questions in item 14 were recoded to reflect
seldom/sometimes/often vs. never.

26
Item 15 (ternary). Responses to the questions in item 15 were recoded to
reflect disagree/strongly disagree vs. neutral vs. agree/strongly agree.
Item 16 (binary). Responses to the questions in item 16 were recoded to reflect
seldom/sometimes/often/always vs. never.
Scale Scores
Individual responses to items were used to create six summary scales. For each
scale, scores were calculated by summing responses to each item comprising the scale.
The scales are described below.
Perception of Fairness. The 5-item scale is composed of items 13a, 13b, 15b, 15l
(reverse scored), and 15m (reverse scored). Scores are computed by summing
responses to the 5 point Likert-type items. Scale scores can range from 5 to 25. Higher
scores on this scale are indicative of greater perceptions of fairness.
Exposure to Negative Comments. This 9-item scale is composed of items 14a
through 14i. Scores are computed by summing responses to the 4 point Likert scaled
items. Scale scores can range from 9 to 36. Higher scores on this scale are indicative of
more frequent exposure to negative comments about different groups.
Campus Climate. This 3-item scale is composed of items 15a, 15n, and 15q.
Scores are computed by summing responses to the 5 point Likert-type items. Scale
scores can range from 3 to 15. Higher scores on this scale are indicative of greater
agreement that there is a negative climate at the college.
Perceived Influence of Personal Characteristics on Self and Others. This 5-item
scale is composed of items 15c, 15d, 15e, 15f, and 15g. Scores are computed by
summing responses to the 5 point Likert-type items. Scale scores can range from 5 to
25. Higher scores on this scale are indicative of greater agreement that their personal
characteristics are influential on their own self-perception and how others perceive
them.
Engagement in Corrective Behaviors. This 10-item scale is composed of items
16a through 16j. Scores are computed by summing responses to the 5 point Likert-type

27
items. Scale scores can range from 10 to 50. Higher scores on this scale are indicative
of greater frequency with which they speak up to counter negative comments made
about different groups.
Cultural Sensitivity in College Policies and Practices. This 5-item scale is
composed of items 15b, 15h, 15i, 15j, and 15o. Scores are computed by summing
responses to the 5 point Likert-type items. Scale scores can range from 5 to 25. Higher
scores on this scale are indicative of greater agreement that the college is culturally
sensitive in its policies and practices.
Survey Data Analytic Strategy
The frequencies of demographic and diversity variables were generated for the
sample as a whole and separately for the student, faculty, staff, and administrative
samples (based on Student group-quaternary). In addition, frequencies for student and
employee specific questions (i.e., items 2 through 5) were calculated.
Cross tabulations were generated for responses to each of the diversity items
(i.e., items 13 through 16) as a function of the following demographic variables: student
group (student group-quaternary), gender (gender-binary), and race (race-binary).
These demographic variables were selected because they had adequate distributional
properties.
A series of chi-square analyses were used to explore group differences in
responses to each of the diversity items. The recoded diversity items were used in the
analyses (i.e., 13-ternary, 14-binary, 15-ternary, and 16-binary). Responses to diversity
items were examined as a function of student group (student group-binary), gender
(gender-binary), and race (race-binary). In addition, a series of chi-square sub-analyses
were also conducted to determine differences between faculty and administration vs.
staff.
Finally, a series of multivariate linear regression analyses were used to identify
significant predictors of scores on the following scales: (1) Perception of Fairness, (2)
Exposure to Negative Comments, (3) Campus Climate, (4) Perceived Influence of
Personal Characteristics on Self and Others, (5) Engagement in Corrective Behaviors,
28
and (6) Cultural Sensitivity in College Policies and Practices. Predictor variables included
in the model were (1) student group (student group-quaternary), (2) gender (gender-
binary), and (3) race (race-binary). Age was initially included as a predictor variable but
was removed from the analyses due to multicollinearity as it correlated .81 with college
group. For each predictor variable, beta weights, standard errors, and significance tests
and corresponding p-values were generated to identify which group membership
variables predicted scale scores (i.e., where there were significant group differences)
after controlling for the other variables in the model. The beta weights identify the
direction of the relationship and the p-values indicate the probability of rejecting the null
hypothesis that the beta weight is equal to zero (i.e., there is no difference between the
groups). This multivariate regression approach has two advantages over conducting a
series of separate between group analyses (e.g., ANOVA) for each predictor. First, it is
more parsimonious because it controls for the effects of other variables in the model.
Second, it is less likely to lead to a type I error (a false positive).
To control for the inflated risk of Type I error due to conducting a large number
of statistical tests, a more stringent alpha level than the customary level of a = 0.05 was
used for all of the analyses. For this reason, only results for Chi-square analyses
significant at < .01 are presented. We chose to use an alpha level of .01 rather than a
Bonferroni-corrected alpha due to the inflated risk of Type II error that would have
resulted from the large number of tests being performed.
Document Review
The third and final phase of the study involved an analysis of the college’s Vision,
Mission, and Strategic Plans. In addition, records were reviewed to gather information
on rates of student recruitment, retention, and graduation across race/ethnicity, gender,
sexual orientation, disability, and religious affiliation. In addition, information was
gathered on the existence of college programs designed to support students’ academic
and social growth and development. Also examined were the characteristics of college
employees’ including demographic information across race/ethnicity, gender and
disability, faculty recruitment, tenure and staff turnover and recruitment of minority
vendors. Finally, information was collected on college policies related to Affirmative

29
Action (i.e., The Richard Stockton College of New Jersey Policy Prohibiting Discrimination
In The Workplace, Strategic Plans to Enhance Diversity/Inclusion, and the development
of courses reflective of a diverse student population). For a full list of documents
reviewed (See Appendix E). The necessary documents and records required for this
review were provided by the College or accessed by the consultants via internet and
RSCNJ college publication manuals.
Ethical Considerations
In this study, ethical considerations were taken into account in order to protect
the rights of all participants. The field of discovery known as Diversity and Cultural
Audits on college campuses requires special care to be taken during the data collection
process in particular if Focus Groups are to be used. Many college students, in particular
students in their first year of college, tend to be in their late adolescence or early/young
adulthood; as such they may have limited insight into self-disclosure. Although Focus
Groups are confidential, there is a risk that information shared in an open group format
between participants can become public information. Disclosure Regrets and or other
ramifications relating to self-disclosures are less likely to occur when Focus Groups are
formed through a self-selection process of affinity groupings and participants are made
aware of the topic areas to be discussed in advance. These procedures were employed
to assure a higher standard of care and ethical consideration for participants and in this
study.
Results
Focus Group Findings
During the 2008-09 academic year, Bryant Associates Consulting, LLC
implemented a series of twenty- six focus group sessions, students (13) and employees
(13) ,which were held over a period of 4-5 weeks beginning October 2008. Focus
groups had a maximum number of 12 individuals per-group. One hundred sixty eight
individuals participated in the focus group sessions: 98 students and 70 employees,
divided into student and employee focus groups. Employee groups were divided into
affinity groups by ethnicity, gender, race, sexual orientation and functional roles such as

30
administration, faculty, staff, and levels such as management and non-management.
Student focus groups were divided by affinity group such as ethnicity, gender, race,
religion, people with disabilities, sexual orientation and functional roles such as Student
Senate. Each focus group followed a predetermined structured format (See Appendix C).
The participants responded to a series of questions related to their experiences,
needs, and perceptions of RSCNJ. (See Appendix B for a list of focus group questions.)
The focus group discussions revealed many similar experiences and perceptions among
the students and employees. At times an issue applied only to a particular social
identity grouping. For example, in some instances employees raised concerns or held
opinions not shared by the student population. To a significant degree, focus group data
supported data analysis from the Cultural Audit Survey instrument and the Review of
Documents.
Data from each focus group was analyzed and coded individually. The composite
of all data was then reviewed, analyzed, and organized into categories (themes, trends,
and unique ideas) across all social identity grouping. A theme is a fact from a
participant’s perspective and represents at least 60% or more of the respondents report
out to a question. A trend represents a pattern of response that is about 30% of the
respondents report out to a question. The difference between a theme and trend is
quantitative. A unique idea is something reported by one or two respondents that the
researcher believes would be helpful for others to know.
The following list of the focus group findings is presented based upon recurring
themes and trends across all social identity groupings. Theme Highlights presented are
presented below as follows. First the theme is presented, followed by the number of
groups responded. This is followed by a verbatim example given to demonstrate
meaning for the theme or trend. Focus group data are elaborated in Appendix D.
Additional verbatim focus group statements are integrated throughout the Discussion
and Conclusion section of this document.

31
Highlights: Macro/Themes and Trends
Rewarding Aspects at Stockton – (Environment), (People), (Learning Community) and
(Benefits- employees only) (26) Groups Reported These Themes
Environment
• Employees’ all thirteen focus groups reported about environment
Ex: Environment “I feel “safe” here – physically, mentally, socially, value of
existence”.
• Students’ all thirteen focus groups reported about environment
Ex: Environment “It is a small intimate and comfortable community; I have the
benefit of smaller classes at Stockton”.
People
• Employees’ all thirteen focus groups reported about People
Ex: People “Generally, there is positive attitude and support of peers, supervisors
and affecting students in positive ways”.
• Students’ all thirteen focus groups reported about People
Ex: People “I have met amazing people, I never would have encountered
otherwise”.
Learning Community
• Employees’ all thirteen focus groups reported about Learning Community
Ex: Learning Community “I enjoy my career and get lots of support many
opportunities for professional growth”.
• Students’ all thirteen focus groups reported about Leaning Community
Ex: Leaning Community “The college experience has helped me feel more
independent, that gives me the confidence to make it in the real world.”

32
Benefits
• Employees’ all thirteen focus groups reported about Benefits
Ex: Benefits “Four-day summer work weeks, medical benefits, paid vacations/sick
time and a pension”.
Challenging Aspects and Experiences at Stockton - (21) Groups These Reported
Themes
• Employees’ eleven focus groups reported
Ex: Fear of discussing race/ethnicity in class or among faculty. Many students
bristle at discussions of racism and classism. They have not been as reactive in a
negative way to sexism and ableism content and discussions.
• Students’ ten focus groups reported
Ex: The relationship students “fitting” into campus life” stereotypes still exists- it
is hard to form collaborative bonds with that around. Fitting in, I do not have
many Spanish- speaking friends”.
Discriminated Against - (19) Groups Reported These Themes
• Employees’ ten focus groups reported
Ex: “Blacks, there is lack of promotions and/or opportunity to advance.
• Students’ nine focus groups reported
Ex: Muslims, Asians and in general- I just saw 2 weeks ago that two White
male’s students were looking at my sisters who wraps/wears long shawl to cover
her body. I saw those two males were laughing at my sister.
Feel Included (12) vs. More Inclusion Needed (14) - Groups Reported These
Themes
Feel Included
• Employees’ seven focus groups reported

33
Ex: “I am very comfortable here, feel accepted, and, by most people, valued”. “I
think I am very included. It may be because I have a boss and department that
is very transparent”.
• Students’ five focus groups reported
Ex: “I feel included, and anyone can feel included if they wanted to”. “I don’t feel
that the school should change anything to try and make a kid feel more
included”.
More Inclusion Needed
• Employees’ eight focus groups reported
Ex: “I do not see change is possible- too late for me – hire more people of
color”.
• Students’ six focus groups reported
Ex: “As a student mostly I feel included, as a multi-racial student sometimes I
feel excluded”.
Feeling Unwelcome At Times (8) Groups Reported These Themes
• Employees’ eight focus groups reported
• Ex: “People equate accent and IQ. People correct my language in arrogant,
condescending ways”.
• Ex: “I get patronized, patted on the head, spoken to in a condescending way,
could be age (under 40) and gender being female”.
Least Highly Valued (18) Groups Reported These Themes
• Employees’ eight focus groups reported
Ex: “People of color blue collar and clerical employees and speakers of a foreign
language are least valued particularly the males”.
Ex: “Women who are younger and have not been here for a long duration”

34
Ex: “People with Disabilities have to fight the same battles over and over i.e.,
handicapped parking access, not enough elevators, can’t use shuttle, handicap
toilet seats, stalls to small, height of benches outside etc”.
Ex: “Black males’ both employees and students” least highly valued.
• Students’ ten focus groups reported
Ex: Eight out of ten groups reported themselves as a group least highly valued.
African American Students -related to race
African Caribbean Students -related to race
Jewish Students (2) – related to religion/culture
Latino/Hispanic Students -related to race
LGBTQ Students – women’s’ issues and sexual orientation
Muslim Students -related to religion and minority status
White Female Students- related to sororities
Ex: Two out of ten groups reported about other groups then themselves as least
highly valued
Asian Students-Commuter Students “Some commuting students don’t get
involved in events, which are sometimes held at night or other inconvenient
time”.
Student Senate- Academic clubs; “Groups that are based around academic
majors such as psyche club, Lit Society, or they are mainly ignored”.
As recorded in the participants’ own words, focus group data provided insight
into the multiple realities of the Richard Stockton College Community members. As
identified in the major themes stated above, some issues of concern did emerge.
However noteworthy these were, facilitator observations reveal that the volume of
responses and ease at which participants engaged each other during the sessions and
particularly regarding the first question (i.e., Rewarding Aspects of Stockton),
compared to other times in the process, show that a majority of people most of the
time have a very positive experience at the college.

35
Survey Findings
To assist, the College in its ongoing efforts for excellence in diversity and
inclusion, an online Diversity and Inclusion Survey was used to ascertain participants’
views in several domains. This section of the report will provide a Narrative Description
of Participants, Analysis of Participant Demographic Data, Chi-Square Findings, and
Regressions Analyses Findings. As previously discussed in the data analysis section of
this document, a more stringent level than the customary set for (level of significance
of < .05) was used for this study to decrease the likelihood of Type I and Type II errors.
Type I errors result in (α): rejecting the null hypothesis when the null hypothesis is true
and Type II errors (β): fail to reject the null hypothesis when the null hypothesis is false.
For that reason the significance level for this study was set at <.01 this heighten criteria
assures greater confidence in this investigation being able to provide useful and
insightful information to the RSCNJ. The Survey Instrument was designed to measure
Campus Climate, Perception of Fairness, Exposure to Negative Comments, Perceived
Influence of Personal Characteristics on Self and Others, Cultural Sensitivity in College
Policies and Practices, and Participant’s Engagement in Corrective Behaviors.
Narrative Description of Participants
As it relates to the Cultural Diversity Survey, Bryant Associates received
responses from 789 participants from the RSCNJ. Of this number 391 (50%) were
students. The employee grouping consisted of 398 participants; of that number, 48
(6%) were administrators; 169 (22%) were faculty, and 175 (22%) were staff persons.
The sample population was found to be a representative sample of the RSCNJ by race
and gender. Table 3 represents participant characteristics including age, gender,
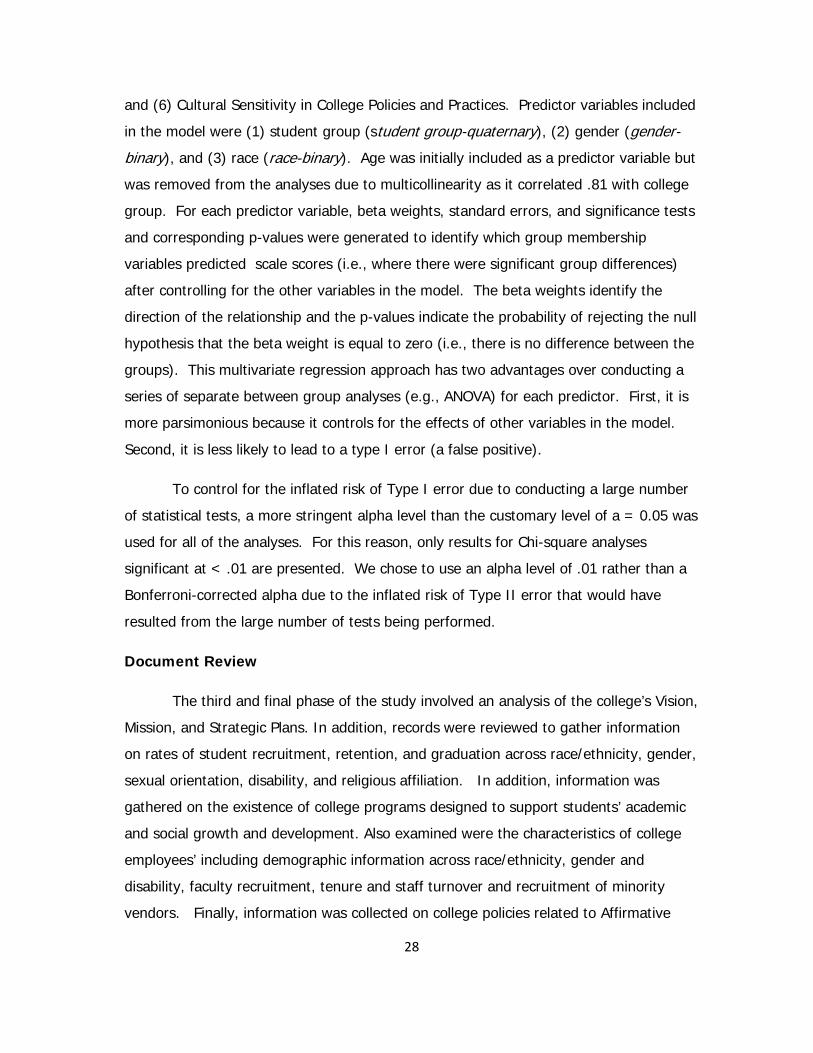
race/ethnicity, disability, sexual orientation, and religion. Table 4 represents additional
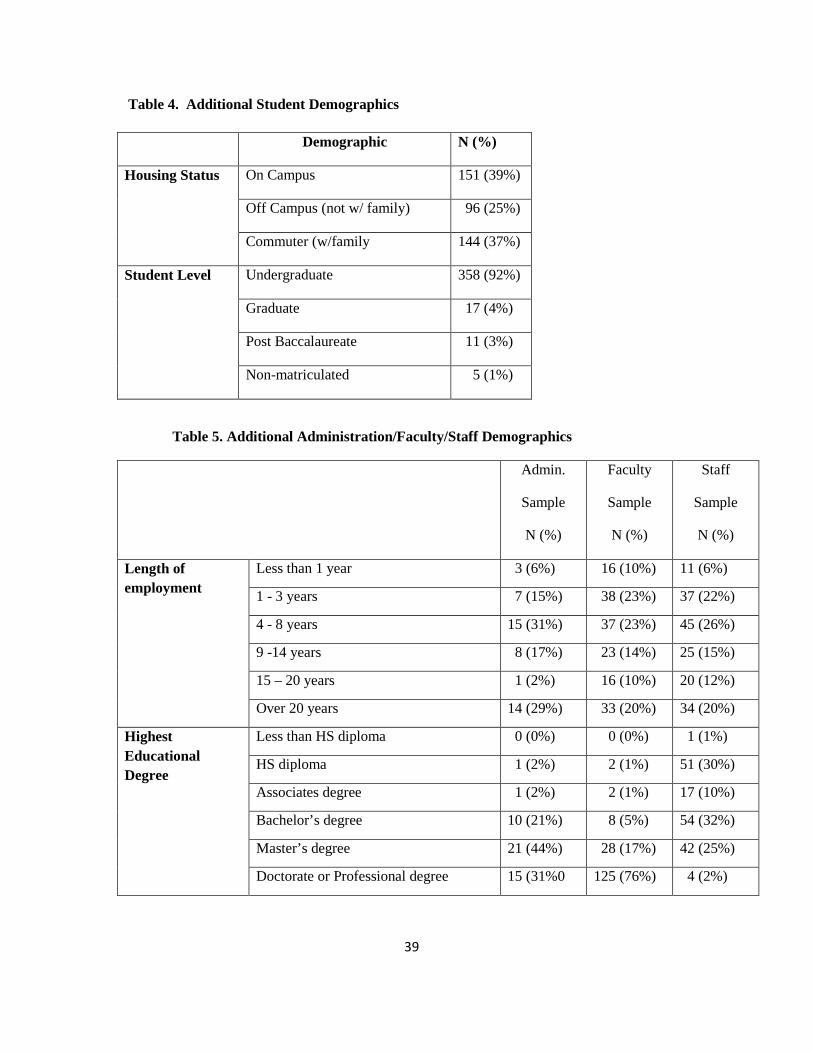
student demographics such as academic level and housing status. Table 5 represents
employee demographic information. Based on the relatively small number of
respondents in some categories, it was decided, for the sake of analysis, that many of
these groups had to be merged; for example, the category forming race/ethnic group
membership consisting of African American, African /Caribbean, Native American, Asian
American, Pacific Islander, Asian, Latino/Hispanic, Multiracial/Multiethnic and White was

36
merged to form two racial designations, “white” and “other. Gender, age, and sexual
orientation were also converted into binary variables.

37
Table 3. Analysis of Participant Demographic Data
Overall
Sample
N (%)
Admin.
Sample
N (%)
Faculty
Sample
N (%)
Staff
Sample
N (%)
Student
Sample
(N %)
Group Administration 48 (6%)
Faculty 169 (22%)
Staff 175 (22%)
Student 391 (50%)
Age Under 21 140 (18%) 0 (0%) 0 (0%) 1 (1%) 139 (36%)
21-25 170 (22%) 0 (0%) 1 (1%) 7 (4%) 162 (42%)
26-33 82 (11%) 3 (6%) 10 (6%) 17 (10%) 51 (13%)
34-41 78 (10% 6 (13%) 35 (22%) 21 (12%) 16 (4%)
42-55 164 (21%) 21 (44%) 53 (33%) 74 (44%) 16 (4%)
Over 55 133 (17%) 18 38%) 63 (39%) 50 (29%) 2 (1%)
Gender Female 494 (63%) 26 (54%) 87 (54%) 124 (74%) 256 (66%)
Male 266 (35%) 21 (44%) 73 (46%) 44 (25%) 128 (33%)
Transgender 3 (1%) 1 (1%) 0 (0%) 0 (0%) 2 (1%)
Sexual Orient. Heterosexual 673 (91%) 44 (94%) 135 (85%) 151 (96%) 342 (90%)
Bisexual 41 (5%) 1 (2%) 9 (6%) 6 (4%) 25 (7%)
Gay 14 (2%) 2 (4%) 8 (5%) 1 (1%) 3 (1%)
Lesbian 8 (1%) 0 (0%) 4 (3%) 0 (0%) 4 (1%)
Queer 1 (1%) 0 (0%) 1 (1% 0 (0%) 0 (0%)
Questioning 7 (1%) 0 (0%) 1 (1%) 0 (0%) 6 (2%)

38
Race/Ethnicity African American 62 (8%) 13 (27%) 12 (8%) 19 (11%) 18 (5%)
African/Caribbean 2 (1%) 0 (0%) 1 (1%) 0 (0%) 1 (1%
Native American 1 (1%) 0 (0%) 0 (0%) 0 (0%) 1 (1%)
Asian American, Pacific Islander
17 (2%) 1 (2%) 3 (2%) 1 (1%) 12 (3%)
Asian 22 (3%) 0 (0%) 1 (2%) 2 (1%) 19 (5%)
Latino/Hispanic 39 (5%) 2 (4%) 2 (1%) 11 (7%) 24 (6%)
Multiracial/ethnic 16 (2%) 0 (0%) 3 (2%) 2 (1%) 11 (3%)
White 576 (76%) 30 (63%) 128 (80%) 131 (78%) 286 (74%)
Other 28 (4%) 2 (4%) 10 (6%) 3 (2% 13 (3%)
Religion Agnostic 52 (7%) 5 (11%) 14 (9%) 1 (1%) 32 (8%)
Atheist 37 (5%) 1 (2%) 9 (6%) 2 (1%) 25 (7%)
Buddhist 17 (2%) 0 (0%) 4 (3%) 2 (1%) 11 (3%)
Christian 468 (62%) 28 (60%) 80 (50%) 138 (82%) 221 (58%)
Hindu 10 (1%) 0 (0%) 1 (1%) 0 (0%) 9 (2%)
Muslim 8 (1%) 0 (0%) 0 (0%) 1 (1%) 7 (2%)
Jewish 39 (5%) 5 (11%) 21 (13%) 5 (3%) 8 (2%)
Other 129 (17%) 8 (17%) 30 (19%) 20 (12%) 71 (19%)
Disability None 721 (95%) 45 (94%) 148 (92%) 160 (95%) 367 (95%)
Any 42 (5%) 3 (6%) 13 (8%) 9 (5%) 18 (5%)
Cognitive 5 (12%) 1 (33%) 2 (15%) 0 (0%)
Physical 26 (62%) 2 (67%) 9 (69%) 7 (78%)
Psychological 0 0 (0%) 0 (0%) 0 (0%)
Multiple 4 (10%) 0 (0%) 2 (15%) 0 (0%)
Other 7 (17%) 0 (0%) 0 (0%) 2 (22%)
39
Table 4. Additional Student Demographics
Table 5. Additional Administration/Faculty/Staff Demographics
Admin.
Sample
N (%)
Faculty
Sample
N (%)
Staff
Sample
N (%)
Length of employment
Less than 1 year 3 (6%) 16 (10%) 11 (6%)
1 - 3 years 7 (15%) 38 (23%) 37 (22%)
4 - 8 years 15 (31%) 37 (23%) 45 (26%)
9 -14 years 8 (17%) 23 (14%) 25 (15%)
15 – 20 years 1 (2%) 16 (10%) 20 (12%)
Over 20 years 14 (29%) 33 (20%) 34 (20%)
Highest Educational Degree
Less than HS diploma 0 (0%) 0 (0%) 1 (1%)
HS diploma 1 (2%) 2 (1%) 51 (30%)
Associates degree 1 (2%) 2 (1%) 17 (10%)
Bachelor’s degree 10 (21%) 8 (5%) 54 (32%)
Master’s degree 21 (44%) 28 (17%) 42 (25%)
Doctorate or Professional degree 15 (31%0 125 (76%) 4 (2%)
Demographic N (%)
Housing Status On Campus 151 (39%)
Off Campus (not w/ family) 96 (25%)
Commuter (w/family 144 (37%)
Student Level Undergraduate 358 (92%)
Graduate 17 (4%)
Post Baccalaureate 11 (3%)
Non-matriculated 5 (1%)
40
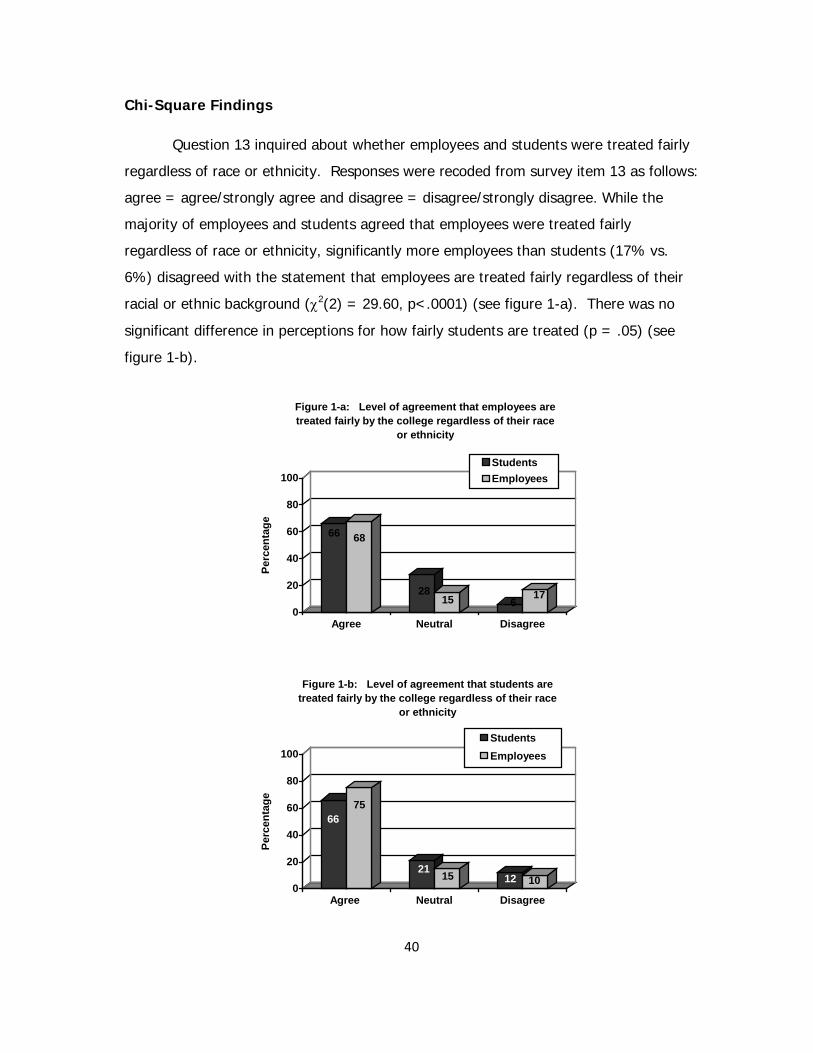
Chi-Square Findings
Question 13 inquired about whether employees and students were treated fairly
regardless of race or ethnicity. Responses were recoded from survey item 13 as follows:
agree = agree/strongly agree and disagree = disagree/strongly disagree. While the
majority of employees and students agreed that employees were treated fairly
regardless of race or ethnicity, significantly more employees than students (17% vs.
6%) disagreed with the statement that employees are treated fairly regardless of their
racial or ethnic background (χ2(2) = 29.60, p<.0001) (see figure 1-a). There was no
significant difference in perceptions for how fairly students are treated (p = .05) (see
figure 1-b).
66 68
2815 6
170
20
40
60
80
100
Perc
enta
ge
Agree Neutral Disagree
Figure 1-a: Level of agreement that employees are treated fairly by the college regardless of their race
or ethnicity
StudentsEmployees
6675
21 15 12 100
20
40
60
80
100
Perc
enta
ge
Agree Neutral Disagree
Figure 1-b: Level of agreement that students are treated fairly by the college regardless of their race
or ethnicity
StudentsEmployees

41
While the majority of individuals in all age groups agreed that employees were
treated fairly regardless of race or ethnicity, more individuals over the age of 33 (17%
vs. 6%) disagreed with the statement that employees are treated fairly regardless of
their racial or ethnic background (χ2(2) = 21.45, p< .0001) (see figure 2-a). There was
no significant difference in perceptions for how fairly students are treated (p = .38) (see
figure 2-b).
6866
25 18 617
0
20
40
60
80
100
Perc
enta
ge
Agree Neutral Disagree
Figure 2-a: Level of agreement that employees are treated fairly by the college regardless of their race
or ethnicity
Age ≤ 33Age ≥ 34
6873
20 17 11 110
20
40
60
80
100
Perc
enta
ge
Agree Neutral Disagree
Figure 2-b: Level of agreement that students are treated fairly by the college regardless of their race
or ethnicity
Age ≤ 33Age ≥ 34

42
While the majority of Whites and People of Color agreed that employees were
treated fairly regardless of race or ethnicity, more Whites than People of Color (70% vs.
57%) agreed with the statement that employees are treated fairly regardless of their
racial or ethnic background (χ2(2) = 10.04, p<.01) (see figure 3-a). There was not a
significant difference in perceptions for how fairly students are treated (p = .02) (see
figure 3-b).
70
57
2027
10 160
20
40
60
80
100
Perc
enta
ge
Agree Neutral Disagree
Figure 3-a: Level of agreement that employees are treated fairly by the college regardless of their race
or ethnicity
White
People of Color
7361
1723
1016
0
20
40
60
80
100
Perc
enta
ge
Agree Neutral Disagree
Figure 3-b: Level of agreement that students are treated fairly by the college regardless of their race
or ethnicity
White
People of Color
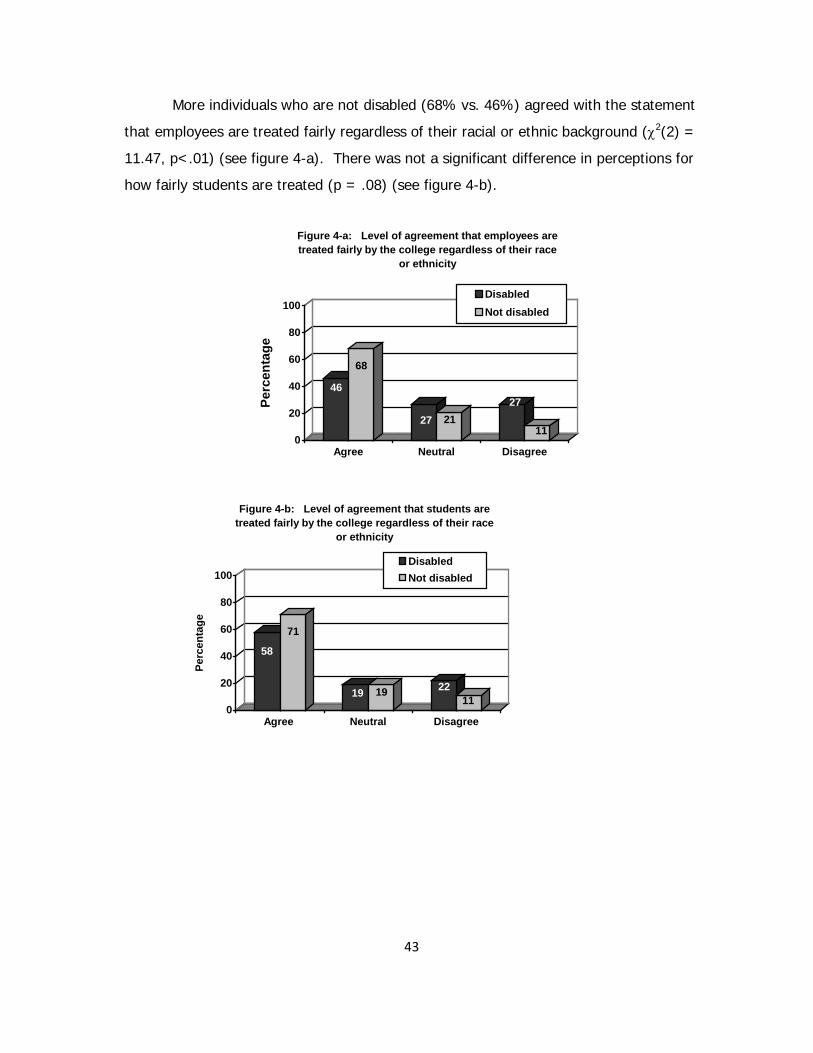
43
More individuals who are not disabled (68% vs. 46%) agreed with the statement
that employees are treated fairly regardless of their racial or ethnic background (χ2(2) =
11.47, p<.01) (see figure 4-a). There was not a significant difference in perceptions for
how fairly students are treated (p = .08) (see figure 4-b).
46
68
27 2127
110
20
40
60
80
100
Perc
enta
ge
Agree Neutral Disagree
Figure 4-a: Level of agreement that employees are treated fairly by the college regardless of their race
or ethnicity
DisabledNot disabled
58
71
19 19 2211
0
20
40
60
80
100
Perc
enta
ge
Agree Neutral Disagree
Figure 4-b: Level of agreement that students are treated fairly by the college regardless of their race
or ethnicity
DisabledNot disabled
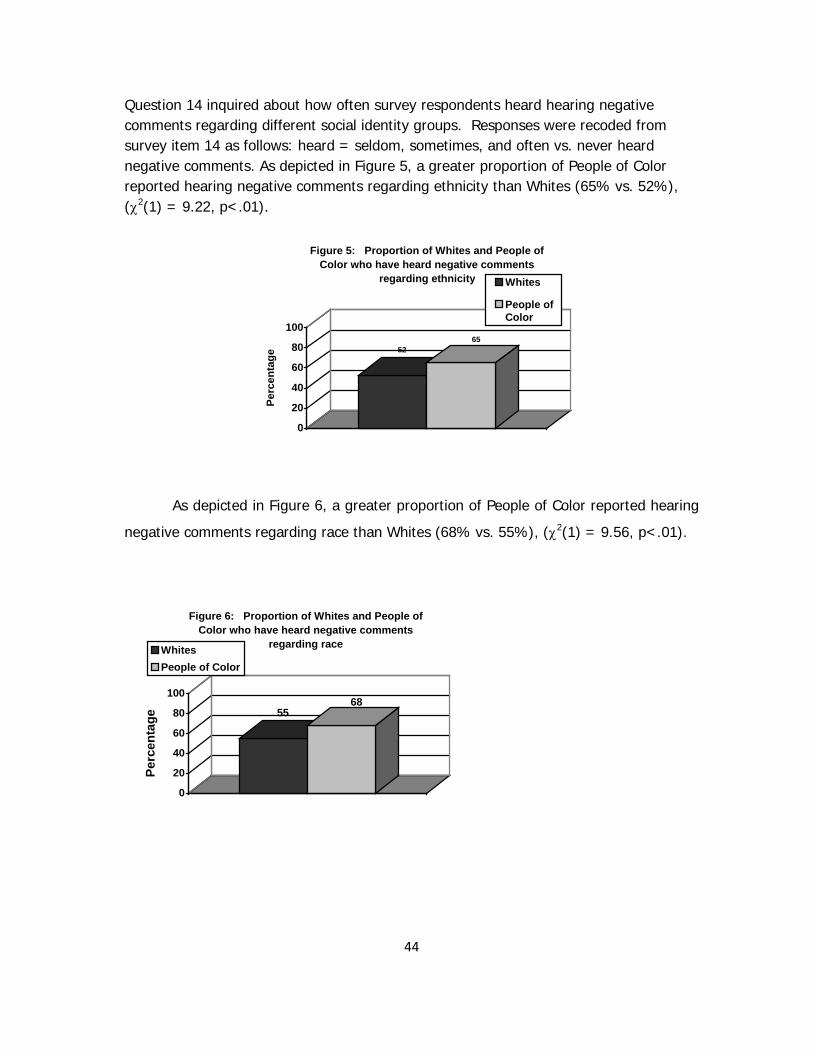
44
Question 14 inquired about how often survey respondents heard hearing negative comments regarding different social identity groups. Responses were recoded from survey item 14 as follows: heard = seldom, sometimes, and often vs. never heard negative comments. As depicted in Figure 5, a greater proportion of People of Color reported hearing negative comments regarding ethnicity than Whites (65% vs. 52%), (χ2(1) = 9.22, p<.01).
5265
0
20
40
60
80
100
Perc
enta
ge
Figure 5: Proportion of Whites and People of Color who have heard negative comments
regarding ethnicity Whites
People ofColor
As depicted in Figure 6, a greater proportion of People of Color reported hearing
negative comments regarding race than Whites (68% vs. 55%), (χ2(1) = 9.56, p<.01).
5568
0
20
40
60
80
100
Perc
enta
ge
Figure 6: Proportion of Whites and People of Color who have heard negative comments
regarding raceWhitesPeople of Color

45
As shown in Figure 7 below, a greater proportion of People of Color reported
hearing negative comments regarding gender than Whites (64% vs. 48%), (χ2(1)
=12.98, p<.001).
4864
0
20
40
60
80
100Pe
rcen
tage
Figure 7: Proportion of Whites and People of Color who have heard negative
comments regarding gender
Whites
People ofColor
As depicted in Figure 8, greater proportion of People of Color reported hearing
negative comments regarding low income than Whites (59% vs. 43%), (χ2(1) = 13.05,
p<.001).
4359
0
20
40
60
80
100
Perc
enta
ge
Figure 8: Proportion of Whites and People of Color who have heard
negative comments regarding low income Whites
People ofColor

46
As shown in Figure 9 below, a greater proportion of People of Color reported
hearing negative comments regarding native speakers of other languages than Whites
(70% vs. 56%), (χ2(1) = 10.12, p<.01).
5670
0
20
40
60
80
100
Perc
enta
ge
Figure 9: Proportion of Whites and People of Color who have heard negative comments
regarding native speakers of other languages
Whites
People of Color
As depicted in Figure 10, a greater proportion of People of Color reported
hearing negative comments regarding religion than Whites (55% vs. 43%), (χ2(1) =
7.81, p<.01).
4355
0
20
40
60
80
100
Perc
enta
ge
Figure 10: Proportion of Whites and People of Color who have heard negative comments
regarding religion
Whites
People ofColor

47
Question 15 inquired about a variety of respondent perceptions relating to
intrinsic and extrinsic issues of diversity. Responses for these items were recorded as
follows: agree = agree/strongly agree and disagree = disagree/strongly disagree. As
shown in Figure 11 below, a greater proportion of students vs. employees (64% vs.
51%) agreed that it was natural to notice the race of those with whom they interact
(χ2(1) = 11.03, p<.01).
6451
21 2915 20
020406080
100
Perc
enta
ge
Agree Neutral Disagree
Figure 11: Proportion of employees and students who agree that it is natural to
notice the race of those with whom they interact
StudentsEmployees
As displayed in Figure 12, more employees than students (24% vs. 14%) felt
that the college has adequate and appropriate support for LGBTQ employees (χ2(1) =
10.66, p<.01).
14 24
7363
12 13
020406080
100
Perc
enta
ge
Agree Neutral Disagree
Figure 12: Proportion of employees and students who felt that the college had adequate and appropriate support for
LGBTQ employees
StudentsEmployees
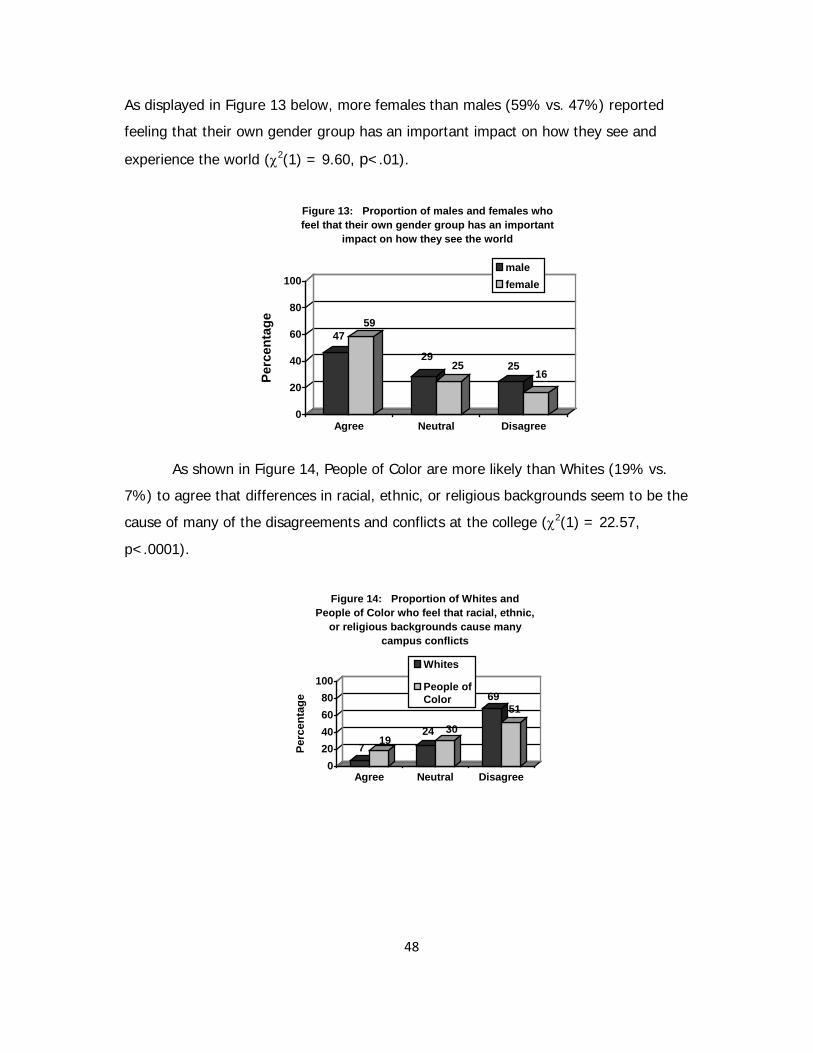
48
As displayed in Figure 13 below, more females than males (59% vs. 47%) reported
feeling that their own gender group has an important impact on how they see and
experience the world (χ2(1) = 9.60, p<.01).
4759
2925 25
16
0
20
40
60
80
100Pe
rcen
tage
Agree Neutral Disagree
Figure 13: Proportion of males and females who feel that their own gender group has an important
impact on how they see the world
malefemale
As shown in Figure 14, People of Color are more likely than Whites (19% vs.
7%) to agree that differences in racial, ethnic, or religious backgrounds seem to be the
cause of many of the disagreements and conflicts at the college (χ2(1) = 22.57,
p<.0001).
719
24 30
6951
020406080
100
Perc
enta
ge
Agree Neutral Disagree
Figure 14: Proportion of Whites and People of Color who feel that racial, ethnic,
or religious backgrounds cause many campus conflicts
Whites
People ofColor

49
People of Color are less likely than Whites (49% vs. 67%) to agree that college
policies are applied fairly to people of all racial or ethnic backgrounds (χ2(1) = 14.87,
p<.001).
6749
17 2516
25
020406080
100Pe
rcen
tage
Agree Neutral Disagree
Figure 15: Proportion of Whites and People of Color who feel that college
policies are applied fairly to people of all racial or ethnic backgrounds
Whites
People ofColor
As shown in Figure 16, more People of Color than Whites (53% vs. 41%)
reported feeling that their own racial group has an important impact on how they see
and experience the world (χ2(1) = 10.38, p<.01).
4153
28 28 3219
0
20
40
60
80
100
Perc
enta
ge
Agree Neutral Disagree
Figure 16: Proportion of Whites and People of Color who feel that their own racial group has an important impact on how they see and experience the world
Whites
People ofColor

50
As shown in Figure 17, more People of Color than Whites (57% vs. 44%)
reported feeling that their own racial group has an important impact on how others
perceive them (χ2(1) = 9.95, p<.01).
4457
3328 23 14
0
20
40
60
80
100Pe
rcen
tage
Agree Neutral Disagree
Figure 17: Proportion of Whites and People of Color who feel that that their own racial group has an important impact on how others perceive them
WhitesPeople of Color
As displayed in Figure 18 below, fewer People of Color than Whites (57% vs. 62%)
agree that the college does a good job of providing activities and avenues of expression
for students of diverse backgrounds (χ2(1) = 20.60, p<.0001).
6357
3124
618
0
20
40
60
80
100
Per
cent
age
Agree Neutral Disagree
Figure 18: Proportion of Whites and People of Color who feel that the college does a good job of providing activities and avenues of expression for
students of diverse backgrounds
Whites
People ofColor

51
More Whites than People of Color (33% vs. 19%) reported feeling that People of
Color have additional advantages at the college because of their race (χ2(1) = 28.71,
p<.0001).
33
1929
19
37
62
0
20
40
60
80
100
Perc
enta
ge
Agree Neutral Disagree
Figure 19: Proportion of Whites and People of Color who feel that people of color have additional
advantages at the college because of their race
Whites
People of Color
As can be seen in Figure 20, more People of Color than Whites (34% vs.
9%) reported feeling that White people have additional advantages at the college
because of their race (χ2(1) = 58.27, p<.0001).
9
34 31 28
60
38
0
20
40
60
80
100
Perc
enta
ge
Agree Neutral Disagree
Figure 20: Proportion of Whites and People of Color who feel that White people have additional advantages at the college because of their race
WhitesPeople of Color
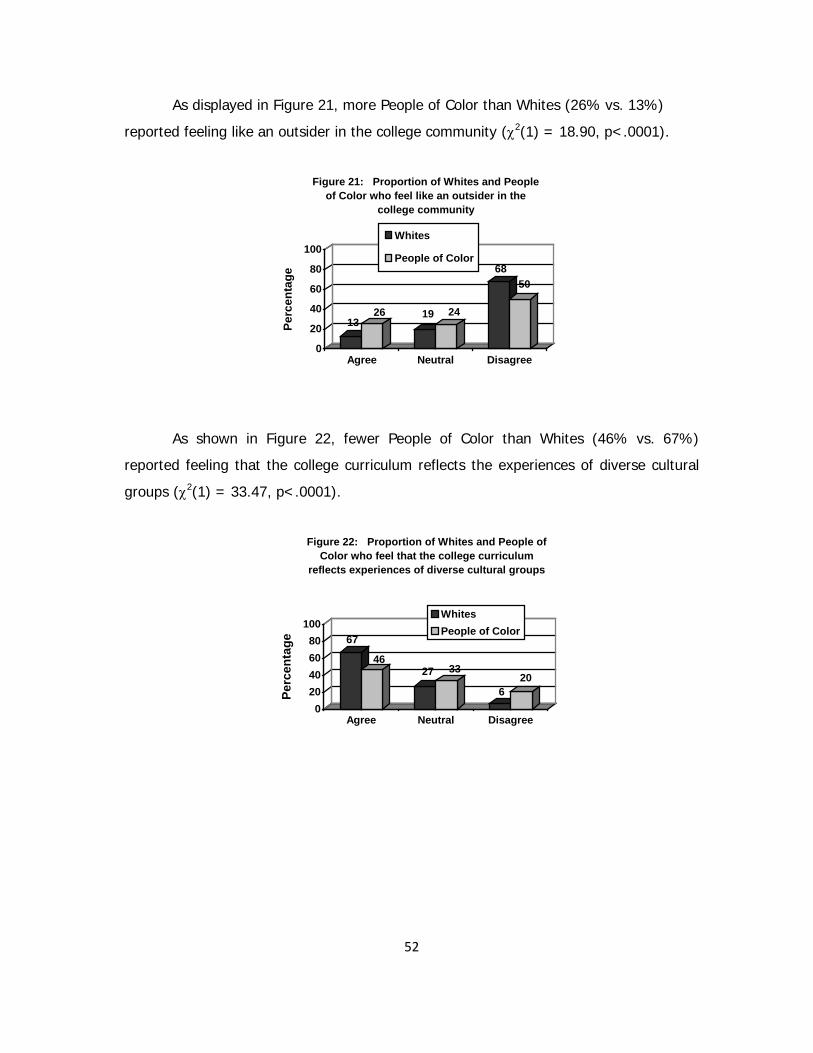
52
As displayed in Figure 21, more People of Color than Whites (26% vs. 13%)
reported feeling like an outsider in the college community (χ2(1) = 18.90, p<.0001).
1326 19 24
6850
0
20
40
60
80
100
Perc
enta
ge
Agree Neutral Disagree
Figure 21: Proportion of Whites and People of Color who feel like an outsider in the
college community
Whites
People of Color
As shown in Figure 22, fewer People of Color than Whites (46% vs. 67%)
reported feeling that the college curriculum reflects the experiences of diverse cultural
groups (χ2(1) = 33.47, p<.0001).
67
4627 33
620
020406080
100
Perc
enta
ge
Agree Neutral Disagree
Figure 22: Proportion of Whites and People of Color who feel that the college curriculum
reflects experiences of diverse cultural groups
WhitesPeople of Color

53
Question 16 inquires about the frequency that respondents spoke up to counter
negative comments directed towards various social identity groups. Responses were
recoded from survey item 16 as follows: spoken up = seldom, sometimes, often, or
always vs. never spoken up. As depicted in Figure 23 below, more employees than
students (85% vs. 76%) reported having spoken up to counter a negative comment
about native speakers of other languages (χ2(1) = 9.11, p<.01).
7685
0
20
40
60
80
100
Perc
enta
ge
Figure 23: Proportion of employees who have spoken up to counter negative comments about
native speakers of other languagesStudentsEmployees
As seen in Figure 24, more employees than students (81% vs. 72%) reported
having spoken up to counter a negative comment about someone being too young
(χ2(1) = 6.69, p<.01).
7281
0
20
40
60
80
100
Perc
enta
ge
Figure 24: Proportion of employees who have spoken up to counter negative comments about
someone being too young
StudentsEmployees

54
As shown in Figure 25, more employees than students (82% vs. 72%) reported
having spoken up to counter a negative comment about someone being too old (χ2(1) =
9.53, p<.01).
7282
0
20
40
60
80
100Pe
rcen
tage
Figure 25: Proportion of employees who have spoken up to counter negative comments about
someone being too old
StudentsEmployees

55
Regression Analysis Findings
Table 6, which contains the output from the six regression analyses, is shown below.
Table 6. Regression Analysis
Scale Predictor B SE p R2
Perception of Fairness College groupa 0.16 0.23 0.49 0.02
Genderb -0.42 0.24 0.08
Racec 0.91 0.28 < 0.01
Exposure to Negative Comments
College groupa 0.47 0.47 0.32 0.04
Genderb -0.27 0.49 0.59
Racec -2.77 0.56 <.0001
Campus Climate College groupa 0.19 0.18 0.28 0.03
Genderb 0.15 0.19 0.43
Racec -0.81 0.21 < 0.001
Perceived Influence of Personal Characteristics on Self and Others
College groupa 0.26 0.33 0.44 0.01
Genderb 0.32 0.35 0.36
Racec -0.65 0.39 0.10
Engagement in Corrective Behaviors
College groupa -4.69 0.90 <.0001 0.04
Genderb 0.37 0.96 0.70
Racec 0.23 1.07 0.83
Cultural Sensitivity in College
Policies and Practices
College groupa -0.06 0.25 0.79 0.02
Genderb 0.06 0.26 0.83
Racec 1.11 0.29 < 0.001
a student vs. employee; b female vs. male; c white vs. minority

56
• Race was a significant predictor of perceptions of fairness with Whites displaying
higher scores than People of Color members (B = .91, p < .01).
• Race was a significant predictor of exposure to negative comments with Whites
displaying lower scores than People of Color members (B = -2.77, p < .0001).
• Race was a significant predictor of perceptions of a campus climate at the college
with Whites displaying lower scores than People of Color members (B = - .81, p <
.0001).
• College group was a significant predictor of engagement in corrective behaviors with
students reporting lower engagement scores than employees (B = -4.69, p < .0001).
• Race was a significant predictor of perceptions of cultural sensitivity in college
practices and policies with Whites displaying higher scores than People of Color
members (B = 1.11, p < .0001).
• There were no significant predictors of perceived influence of personal
characteristics on self and others.
Targeted Document Observation Review Results
Institutional data was identified for review. The complete review included
numerous documents, many of which are not specifically mentioned here. However,
those mentioned in Appendix E were targeted for in-depth content assessment. The
documents reviewed were placed in observation areas (categories) and assessed for the
mission critical value they add for diversity and inclusion. The purpose for reviewing
organizational documents regarding policies and practices is to gain insight into cultural
characteristics such the norms, attitudes, and values of the institution and whether
these documents optimize or sub-optimize the Richard Stockton College of New Jersey
mission regarding diversity and inclusion. In addition, assessment of these documents
benchmarks the formal organizational support available in the system for mission
critically driven culture change regarding diversity and inclusion.
Although higher education is developing models and best practices for diversity
and inclusion, it is still a work in progress with each institution defining diversity and
inclusion for itself, influenced by both region and accrediting agencies. It is challenging

57
to compare higher education institutions because of individual uniqueness and variety.
“The unverified nature of the information from one institution to another and
unavailability of unbiased normalization metrics makes such comparisons even more
difficult. Users should therefore approach direct institution to institution comparisons
with caution and recognize that all comparisons between institutions are inherently
biased” (American College & Universities Presidents Climate Commitment, 2008, p. 1).
As a result of these challenges, the documents reviewed were assessed based on
explicit language that indicated a sense of mission critical culture change for diversity
and inclusion in conjunction with and support by the Dimensions of Campus Diversity
and Inclusion Culture: 1. Access and Success, 2. Campus Climate and Inter-group
Relations, 3. Education and Scholarship and 4. Institutional Viability and Vitality (Smith
et al, 2000, p. 6).
The following Observation Key was used during the assessment process.
Observation Key:
a. Observation Area RSCNJ: refers to category of document reviewed.
b. Demonstrated: refers to existence or non-existence of category.
c. Explicit Evidence: refers to brief description of Observation Area reviewed.
d. Support of Diversity and Inclusion: refers to activities, processes, policies,
systems, etc, that support diversity and inclusion excellence.
e. Diversity and Inclusion Rating: (C)-Consistent, (C*)-Consistent, (I)–
Inconsistent. (Bryant Associates Consulting Copyright© 2009)
In the sections that follow, findings from the review of documents are summarized. A
more detailed presentation and application of the Observation Key is available (See
Appendix E).
Institutional Viability and Vitality
In the dimension of Institutional Viability and Vitality, i.e., mission centrality to
diversity and inclusion, the document review suggests RSCNJ has an orientation towards

58
diversity and inclusion. With the Civil Rights Movement of the 1960s and affirmative
action policies established in the 1970s as a backdrop, the current mission statement,
written in 1984, includes the following statement: “We value diversity and the differing
perspectives it brings. Accordingly, we are unequivocally committed to implementing the
principles of affirmative action in the composition of our student body, faculty, and staff”
(RSCNJ, 1984).
As guiding elements for any institution, the mission espouses the organizational
context and purpose; the vision charts direction for the future and the organizational
leadership stance. For example, the RSCNJ Mission Statement and its Vision Statement,
individually and collectively, set in motion and in practice the expected organizational
tone and behavior. When viewed in their entirety and in combination with other
programs and committee’s mission statements, policies, and practices, there emerges an
emphasis at RSCNJ on affirmative action and compliance. The college has reflected this
emphasis in documents and has performed well in this regard. Affirmative action is an
important step in dimensions of campus diversity and inclusion culture change. Although
extremely important, affirmative action and compliance do not guarantee inclusion.
Diversity without inclusion does not work. Best practices suggest that when diversity
and inclusion are defined as mission critical, the organization is much more likely to
achieve true change and avoid “diversity in a box” (Miller & Katz, 2002). The institution’s
leadership stance, demonstrated by the President’s webpage message, reflects more
robust support for dimensions of campus diversity and inclusion culture change than do
the mission or vision statements.
Access and Success
The dimension of Access and Success (employee and student recruitment,
employee and student retention, student graduation rates, and tenure and promotion of
faculty and other employees) is essential for diversity and inclusion culture. A summary
of selected documents for review follows a more detailed presentation and application of
the Observation Key (See Appendices E). Workforce Analysis Data from 1996 until 2008
show progress in multiple areas, as well as mixed results in others, regarding
recruitment, retention, and tenure related to people of color and female employees.

59
However, progress regarding promotions for these groups was less discernable from the
documents observed. The general pattern for females reveals notable increases in
regards to Faculty, Professional Non-Faculty Career Services, Technical and
Paraprofessional Career Services, Service Maintenance Career Services, and Tenure. The
pattern for people of color during the same timeframe shows increases only in the areas
of Clerical Secretarial Career Services, Skilled Crafts Career Services, and Services
Maintenance Career Services. According to RSCNJ Workforce Analysis Data of the eight
categories tracked annually, women have increased in two upper level and two lower
level job categories, including a notable 8% increase in faculty tenure between the years
2000 and 2008. On the other hand, people of color numbers have remained relatively
constant in three of the four upper job categories, with an actual decline in the
Professional Non-Faculty Unclassified job category. Faculty of Color tenure increased a
mere 2% between the years 2000 and 2008 according to the RSCNJ Workforce Analysis
Data.
Regarding the above, it is important for RSCNJ to identify the reasons for its
success regarding females and to translate that success to other groups. On the other
hand, given where the College started from 12 years ago, perhaps the people of color
levels are adequate; only the leadership and other key opinion leaders can make that
determination. The College provided a significant number of documents that reflect
strengths in the areas of affirmative action compliance, discrimination policies and
procedures, search committees, and advertising guidelines for recruitment. Absent in
the documents reviewed were specific goals and timelines to achieve increased diversity.
Data regarding minority student recruitment, retention, and graduation rates
from 1996 through 2008 reveal progress in multiple areas and mixed results in others
(See Cohort 1996-2002 and Cohort 2003-2008). There has been relatively no change in
the number of Asian Pacific Islanders and Black-non Hispanic students entering the
College during those years. On the other hand, the population of Hispanic and White-
non Hispanic students has increased, most notably the number of Hispanic students.
Regarding graduation rates, Black-non Hispanic and White-non Hispanic show relatively
no change in graduation rates. On the other hand, Hispanic graduation rates were

60
increasing, while rates for Asian Pacific Islanders were declining. A more detailed
presentation and application of the Observation Key can be found in Appendix E.
The growth in the number of Hispanic students entering RSCNJ and the increase
in their graduation rates speak to the capacity of the College to improve its recruitment
and retention efforts with other students of color groups. The internal documents
reviewed did not provide evidence that could be used to develop an explanation for the
discrepancies noted above. However, there was evidence of recruitment programs that
target first generation college students, students with disabilities, and low-income
students – programs that contribute to the expansion of a more diverse pool of
candidates. Similar programs designed specifically for students of color recruitment and
retention with specific goals, timelines, and accountability measures would most likely
support greater diversity in the student population.
Regarding the dimension of Access and Success, recruitment, retention
(employees and students), graduation rates (students), and tenure and promotion for
(faculty and other employees) are all essential for components of campus diversity and
inclusion culture. Fundamentally, dimensions of campus diversity and inclusion culture
change requires work to move beyond isolated policies, programs and actions to a
connecting web of practical application. In practical terms, these policies, programs, and
actions must be continuously measured to determine if the intended change is
occurring. As practice improves and goals met, this ensures institutional viability only if
these efforts are tied inextricably to the institutional mission and vision. Practical,
deliberate, and intentional application offers an important secondary effect. As
individuals and teams do this work, it will foster individual learning about the required
skills for effective dimensions of campus diversity and inclusion culture change (Clayton-
Pedersen, Parker, Smith, Moreno, & Teraguchi, 2007).
Campus Climate and Inter-group Relations
The dimension of Climate and Inter-group Relations focuses on all students’
experiences and pays particular attention to inclusion of all social identity groups
through the offering of a wide range of organizations and activities designed to support
an environment that promotes quality interaction within affinity groups and between

61
different social identity groups. The College has 104 clubs and organizations providing
opportunities to the college community to enhance social learning and campus
residential life. The Student Manual for Organizations demonstrates excellent guidelines
and suggestions for establishing a new club or campus group. Consistent with the
RSCNJ culture, the manual includes a section describing the “Characteristics of a Good
Organization” that outlines clearly what the requirements are. It includes an explicit anti-
discrimination statement in its description of a good organization. Absent, however, is a
clear reference to diversity and inclusion; as previously mentioned, principles of
affirmative action and anti-discrimination practices are necessary but not sufficient to
integrate the culture of inclusion into the institutional climate.
Often a college that has done well in providing social identity group members
with some context to experience belonging in a comfortable and supporting way may
inadvertently foster greater potential for social identity group tension. On some college
campuses, student organizations promote a form of self-selected segregation. Groups
begin to perceive the positive intention of the institution in support of diversity (i.e.,
access to group memberships of interest) as a weak commitment to diversity and
inclusion – the opposite impact of the institution’s intentions. Antonio (2001 & 2004)
found that surface segregation, i.e., ethnic clustering on campus, is often interpreted by
observers as a failure of diversity and as evidence of tokenism. Chang and DeAngelo
(2002) found that on campuses with less than 17% students of color, White students
were more likely to participate in the Greek system-sororities and fraternities than those
with more than 17% enrollment of students of color. They found that on more racially
diverse college campuses White students found Greek organizations less appealing,
thereby avoiding conflict with their perceptions of the institution’s values and the
sensibilities of the student body. The dynamic described above may sometimes devolve
into an endless cycle: perceived low institutional commitment to diversity and inclusion
leads to increased ethnic clustering, which leads to increased perception of racial
tensions and increased conflict among groups over the limited resources available for
these student groups. When student groups form without some infusion of inclusion
principles, a greater chance the impact on campus climate can result in only surface
integration.

62
Education and Scholarship
The Education and Scholarship Dimension focuses on the scholarly role and impact
the institution has on preparing students for a pluralistic society and global community.
In reviewing the curriculum, there appears to be a large number of courses with
diversity related content at RSCNJ. A search in Spring 2009 for courses with
international/multicultural focus yielded 174 courses, ranging from “Race, Ethnicity,
Diversity”, to “Building a New Europe” to “Chinese Culture”. An in-depth analysis of
course content was not possible. Partly because the course offerings varied from
semester to semester and the scope of this study, it would have been difficult to assess
to what degree diversity and inclusion are a part of the course in terms of both content
and process. Course Curriculum tracking mechanisms that follows content , process and
enrollment demographics may prove useful in this regard.
As mentioned previously, for more detailed information about targeted document
observation review and application see Appendix E. Document reviews are challenging
and time-consuming. Moreover, on occasion documents reviewed are not the current
ones in use and or inaccurate information unintentionally gets reported by both the
research group and the institution. Given that the above is rare, the value added of such
a review enhances the study and provides useful information to the College by making
visible what might be hiding in plain sight.
Discussion
This study was exploratory in nature and was designed to determine how closely
RSCNJ is putting its diversity standards into practice. Bryant Associates Consulting, LLC
used several methods of data collection to add to the richness, vigor, and utility of this
study. The methods of data collection included Cultural Diversity Survey, Focus Groups,
and Review of Documents, as well as on-site observations by the consulting team which
provided anecdotal data. The survey instrument was designed to measure Campus
Climate, Perception of Fairness, Exposure to Negative Comments, Perceived Influence of
Personal Characteristics on Self and Others, Cultural Sensitivity in College Policies,
Practices, and Engagement of Corrective Behaviors. A total of 789 individuals
responded and completed the on-line Diversity and Inclusion Survey. This included 391
63
students and 398 employees. There were 26 Focus Group sessions held with a
maximum of 12 individuals per group. A total of 168 individuals – 98 students and 70
employees – participated in the 26 focus group sessions.
The findings show that the majority of the members of the RSCNJ community
reports many rewarding aspects of the college. The Diversity and Inclusion Survey
findings support the above statement. Findings suggest that 66% of students and 68%
and 75% of employees found RSCNJ to be an environment in which people (students
and employees) are treated fairly regardless of their racial or ethnic background; overall,
the focus group findings support similar conclusions. However, there were significant
differences found between groups (i.e., race/ethnicity, gender, sexual orientation,
religion, organizational affiliation student or employee, etc.) on this and a number of
other factors which were examined in this study.
It is difficult for any single study to summarize the complexity of the college
culture in a single report. Similarly, the data below present a perspective that constitutes
only a short chapter about RSCNJ. The full story is more highly nuanced, more richly
textured, and still in the making. However, this study may provide insight that is useful
for the institution. As presented throughout this document, information has tended to
focus on the perceived problems regarding diversity and inclusion at the Richard
Stockton College of New Jersey. While it is an aim of any study of this kind to uncover
opportunities for improvement, it is also important not to forget what is working well.
Often when receiving feedback as individuals, groups, and organizations when it is less
than our own ideal of how we perceive ourselves, we may lose sight of all the good
qualities and deeds that are also part of the story. RSCNJ is very highly ranked among
schools its size nationally and in the State of New Jersey for many reasons. Just to name
a few are its student centered focus, academic excellence, and persistent diversity and
inclusion efforts.
As mentioned earlier, the majority of members of the RSCNJ community report a
host of “great experiences” at the school. This was evident as the research consultants
interacted with people in the course of their work inside the context of the focus groups
and outside of it. The consultants often received friendly greetings and helpful directions

64
from employees and students as they traveled the campus. As they observed people, a
common experience was witnessing a campus alive with the energy and idealism that
often accompanies youth, as well as a sense of purpose and thoughtfulness that is often
achieved only by dint of maturity and years of living. This study is but one of many
steps RSCNJ has taken in the past, is engaged in at present, and is contemplating for
the future as it continues on a path of excellence in preparing its students for the world
they will inherit and will help shape. The world they will enter offers many challenges
and opportunities.
Diversity and Inclusion is a paradox – an opportunity and a challenge at the
same time. Diversity and inclusion is no longer just an issue of U.S. national politics,
social change, and social justice. It has become more basic, a necessary fundamental
philosophy for survival of Humankind. The world is now global in ways unimaginable
only a few years ago; each country and each continent is tethered to the others,
economically, environmentally, and politically. A tightly bound ethnocentric worldview is
antiquated and no longer functional in a world of instant communication and access to
information available at our fingertips. Humankind has survived for millennia using
exclusion of different “others” as a method to strengthen one’s own sense of belonging
and as a way of profiting one’s own group, community, or country. The next generation
and the generations to come must challenge the conventional wisdom of the past;
survival of the species is at stake. Richard Stockton College of New Jersey in its
diversity and inclusion efforts supports students to participate and lead in this new
world.
Through the lens of “Dimensions of Campus Diversity and Inclusion Culture,” this
section will discuss the data and their relevance to understanding the current
organizational dynamics and culture. In addition, this section will discuss and place
emphasis on the significant findings that pose the greatest potential challenges to and
ultimately present the greatest opportunities for RSCNJ moving forward in its Diversity
and Inclusion efforts. As previously noted, “Dimensions of Campus Diversity and
Inclusion Culture” consists of four dimensions that provide the framework of this study:
1. Access and Success principally attends to inclusion and success of historically
underrepresented groups. 2. Climate and Inter-group Relations attends to historically

65
marginalized or underrepresented groups in the context of campus environment. 3.
Education and Scholarship characterize the scholarly role of the institution on educating
all students to function in a pluralistic society and global community. 4. Viability and
Vitality focuses on perceptions of the institution feeling of diverse constituencies how
well is the mission supporting the three previous mentioned dimensions and to what
degree has the college or university defined itself reflected by the needs of a diverse
society (Garcia, et. al. 2001 pg. 33)”. These dimensions at times overlap each other;
therefore, the text below was organized from the perspective of how they interconnect
with the data, and is not necessarily presented in the order as listed above.
Access and Success
Race was a significant predictor of perceptions of fairness with Whites displaying
higher scores than People of Color (B = .91, p < .01). People of Color are less likely
than Whites (49% vs. 67%) to agree that college policies are applied fairly to all racial
or ethnic backgrounds (χ2(1) = 14.87, p<.001). Furthermore, more People of Color
than Whites (53% vs. 41%) reported feeling that their own racial group has an
important impact on how they see and experience the world (χ2(1) = 10.38, p<.01). In
addition, more People of Color than whites (57% vs. 44%) reported feeling that their
own racial group has an important impact on how others perceive them (χ2(1) = 9.95,
p<.01).
Consistent with statistical and employee focus group findings above that indicate
that People of Color in general “identified as groups discriminated against.” Several
macro-themes, macro-trends, themes, and trends emerged. Employee groups’
perspective, groups thought of as discriminated against in descending order: In terms of
race /ethnicity, People of Color in general and often paired with other social identity
descriptions. Such as African Americans, Blacks, Black Students, People of Color Faculty,
Students of Color, International Students, and International Faculty thought of as
discriminated against. As reported by six of the thirteen focus groups they are, White
Gender Mixed Professional Non-Faculty Represented by AFT, People of Color (Asian,
Black, Latino/Hispanic-Faculty, and all African American focus groups across all levels of
employment and function that participated in the study. For example following are some

66
direct quotes from focus group participants, which seem to best reflect the opinions of a
number of participants: “Blacks, there is lack of promotions and/or opportunity to
advance. Some African American and ethnic students because they are assigned lower
expectation to achieve academically, Asians – some departments do not have any
diversity of hiring; Latinos are almost invisible as a presence in the college. I think there
is little awareness particularly among students, of hardships many face, so there is more
of an ignorance of discrimination (and a discrimination of ignorance) than any overt
discrimination”.
Consistent with statistical and employee focus group findings above, three of five
Students of Color reported people of color in general “identified as groups discriminated
against”. Several macro-themes, macro-trends, themes, and trends emerged. Such as
African American, Latino/Hispanic, and Muslim student focus groups. For example
following are some direct quotes from focus group participants, which seemingly reflect
the opinions of a number of participants: “African Americans are discriminated against
the most, called names, looked at and treated differently. Black and Latino/Hispanic
individuals and organizations discriminated against- Blacks parties and get together(s)
are broken up quickly. In everything that is done on campus because the Whites over
power the Muslims, Asians and in general- I just saw 2 weeks ago that two White male’s
students were looking at my sisters who wraps/wears long shawl to cover her body. I
saw those two males were laughing at my sister. The (Muslim) focus group although
self-identified in terms of religion, demonstrates an example of the intersection of
race/ethnicity, gender, culture and religion. This focus group consisted of all “Women of
Color”. Contrary to the above, the Student Senate identified “White people discriminated
against”. For example following are some direct quotes from focus group participants,
which seemingly reflect the opinions of a number of participants: “UBSS (unified black
students society) is OK but if we had one for Caucasians a UWSS it would be frowned
upon. I personally feel everything directed towards blacks they get most resources,
attention. I know I would be stared at if I was to go to a minority’s event …but maybe
that is what we need to do”. The Student Senate focus group, identified formally by
participants’ leadership role, was comprised of seven white students and two students of
color.

67
Regarding the above, Jackson (2006) and Cox (2001) assert that racial/ethnic
inequalities are produced whether or not the individuals who maintain these practices
have racist intentions. In other words, the cultural/social context defines norms of
treatment – who is inside (the advantaged) and who is outside (the disadvantaged).
Support for this position is confirmed by data from the employee focus groups along
with survey data which indicate that Whites display higher scores than People of Color
when asked whether college policies are applied fairly to people of all racial or ethnic
backgrounds. These differences in experience and perception of inequality often occur
when persons from different racial and/or cultural out-groups are not well integrated
throughout the power structure of the institution and continue to occupy positions that
have been historically designated as lesser, i.e. at the lower end of the status and
economic pay scale. These differences in experience and perception are often more
pronounced when progress has been made in the organization regarding equity, but
that progress now seems to be stagnating. From a dominant culture perspective,
comments by members of the in-groups that most often take the form of “we have a lot
of women and minorities,” a position that emphasizes the progress that has been made,
as opposed to comments made by members of the out-groups which highlight their
concerns that things are not changing at a faster pace.
Batts (1995) articulated another form of unconscious discrimination:
“Overprotection” is applying lower standards to members of the targeted group. The
underlying motivation is that persons from the dominant culture do not expect people
from a different race to perform as well as those who have held comparable positions in
the past. Her work builds on earlier research by Vroom (1973) regarding “Expectation
Theory.” His landmark study describes two dimensions of a similar process. The first,
“over-expectations”, is a dynamic created when high or often unreasonable expectations
are set for a targeted group or individual without providing reasonable support, such as
resources, instruction, and emotional support. Second, “under-expectations” is a
dynamic created when low expectations are set for a targeted group or individual,
expectations that often lead to low productivity, negative learning results, and limited
social interaction. Often the targets of such expectations internalize the negative
environment and contribute their part to sabotage themselves, thereby generating a

68
negative self-fulfilling prophecy that affirms the low expectations operating in the social
system. Figuratively and literally speaking, this dynamic appears in classrooms and
boardrooms alike. Research suggests that these discriminatory practices often are not
overt or conscious; rather they are, more often than not, both unconscious and
unintentional.
Moreover, these previously mentioned experiences and perceptions expressed
above by People of Color employees, students, and some White focus groups are
consistent with reviews of selected RSCNJ documents. Regarding Access and Success,
there was very little formal evidence provided of the following activities or initiatives:
Recruitment and Retention Efforts of People of Color faculty and professional staff;
Mentor Programs for People of Color faculty; People of Color tenure analysis and goals;
People of Color recruitment programs; People of Color retention goals; Mentor programs
for People of Color staff. While the Student Manual for Organizations section concerned
with Establishing a New Organization included an anti-discrimination statement, neither
it nor the Characteristics of a Good Organization at RSCNJ section contained a clear
reference to diversity and inclusion and their value in the context of the College mission
and vision. (See Appendix E: Targeted Document Observation Review).
Viability and Vitality
Race was a significant predictor of exposure to negative comments with Whites
displaying lower scores than People of Color (B = -2.77, p < .0001). A greater
proportion of People of Color reported hearing negative comments regarding race than
whites (68% vs. 55%), (χ2(1) = 9.56, p<.01). A greater proportion of People of Color
reported hearing negative comments regarding ethnicity than Whites (65% vs. 52%),
(χ2(1) = 9.22, p<.01). These finding are consistent with employee focus group data,
people of color in general with respect to issues of difference, “what challenges have
you experienced at Stockton”. Several macro-themes, macro-trends, themes, and trends
emerged. Employee groups’ perspective the overarching theme “prejudicial,
exclusionary, and discriminatory employment experiences” expressed as challenging at
RSCNJ. In addition, many focus group themes mentioned negative comments regarding

69
accents related to speakers of a native language and; the ELS themes intersect with
race and ethnicities related to People of Color referenced below.
As reported by seven of the thirteen employees focus groups regarding the
above. African American -Gender Mix Faculty, African American and Latino (1) -Gender
Mix Management and Administrative (Non-aligned), African American - Gender Mix Non-
Faculty Represented By AFT, African American-Gender Mix Plant Management and
Support Staff Personnel, LGBTQ Faculty and Staff, People of Color (Asian, Black,
Latino/Hispanic-Faculty, White Gender Mixed Faculty, Women of Color (Latina) non-
faculty Represented By AFT. The following are some direct quotes from focus group
participants, which seemingly reflect the opinions of a number of participants: “Stockton
has shown me that you cannot get too comfortable because people are always ready to
pull you down before they help you up as a man of color. I struggle to be recognized for
work done; being made to feel less than qualified to do similar jobs; that I need to do
things better than other (Whites) who had the jobs. Common courtesy; not speaking
being ignored feeling as if you are below someone. Fear of discussing race/ethnicity in
class or among faculty. Many students bristle at discussions of racism and classism.
They have not been as reactive in a negative way to sexism and ableism content and
discussions. Speaking with an accent has been very challenging. If I say a word wrong
people look at each other and laugh. It gets to the point that I am afraid to speak. It is
more than just that they do not understand me, they make fun of me”.
Consistent with statistical and employee focus group findings above, four of five
People of Color student groups reported challenges related to minority status. One-
macro theme emerged from these groups “Out-group/Minority Status is challenging”.
Such as African American, African Caribbean, Asian and Latino/Hispanic student focus
groups. For example following are some direct quotes from focus group participants,
which seem to best reflect the opinions of a number of participants: “The relationship
between Black students and White students not much communication, and with
students and faculty, being the minority is the challenging experience. The relationship
students “fitting” into campus life” stereotypes still exists- it is hard to form collaborative
bonds with that around. Fitting in, I do not have many Spanish- speaking friends”.
White professors teach African Studies courses, it does not mean they are not qualified

70
it is just difficult to take seriously” Hunter (2009) cautions that diversity and inclusion
efforts may not be embraced by all. In fact, many systems experience resistance and
turbulence as some majority group members may experience systematic change
directed towards diversity and inclusion as a “loss of power and reverse discrimination”.
“Before you begin building diversity in your workplace, you should understand the
unique challenges that the minority employee faces as well as some of the possible
attitudes or resistance that you may encounter with your existing employees. None of
these problems is insurmountable; but, if not addressed, they can affect retention and
morale, which, of course, affects productivity “ (Hunter, 2009).
Boyd-Franklin (2004), Jamison (1984), and Chestang (1976) refer to members of
marginalized groups as typically experiencing innumerable episodes of these “little
things” daily, weekly, and continuously. Chestang (1976) & Boyd-Franklin (1982, 2004)
refer to this patterning of “little things” as “micro-aggressions”. Jamison (1984) refers to
these as “nibbles.” The inference is that under such conditions one’s dignity, self-
esteem, and sense of hopefulness is gradually eroded, resulting in devaluation. Often
these comments reflect negative stereotypes perpetuated through the media,
organizations, and interactions with peers and those in roles of authority. Even though
these discriminatory and oppressive attitudes and behaviors may be unconscious, the
effect on the targeted group is debilitating. For a person from the dominant culture,
examples of these behaviors seem “isolated,” or too “petty” to be concerned about.
One’s reaction may be that members from the targeted group are too sensitive and are
making “much ado about nothing!” However, as reported above, members of the
student and employee focus groups comprised principally of people of color, as well as
persons of color who responded to the survey, indicate that racial and ethnic “minority”
group members experience more exposure to negative comments than is reported by
Whites.
Moreover, previously mentioned experiences expressed above by People of Color
employees, students, and some White focus groups are consistent with reviews of
selected RSCNJ documents. Regarding Viability and Vitality RSCNJ Performance
Evaluation Standards PES2008 for employees: Shows one of seven standards listed,
evidence of some support for diversity and inclusion, however overall inconsistent with
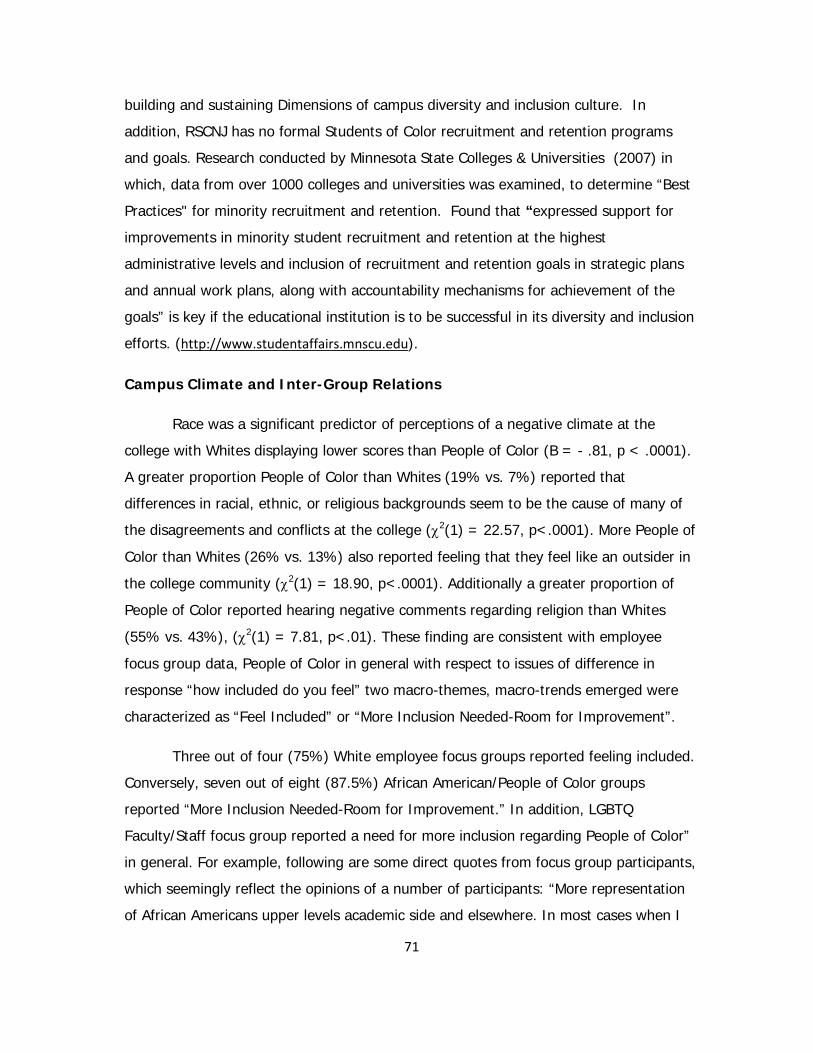
71
building and sustaining Dimensions of campus diversity and inclusion culture. In
addition, RSCNJ has no formal Students of Color recruitment and retention programs
and goals. Research conducted by Minnesota State Colleges & Universities (2007) in
which, data from over 1000 colleges and universities was examined, to determine “Best
Practices" for minority recruitment and retention. Found that “expressed support for
improvements in minority student recruitment and retention at the highest
administrative levels and inclusion of recruitment and retention goals in strategic plans
and annual work plans, along with accountability mechanisms for achievement of the
goals” is key if the educational institution is to be successful in its diversity and inclusion
efforts. (http://www.studentaffairs.mnscu.edu).
Campus Climate and Inter-Group Relations
Race was a significant predictor of perceptions of a negative climate at the
college with Whites displaying lower scores than People of Color (B = - .81, p < .0001).
A greater proportion People of Color than Whites (19% vs. 7%) reported that
differences in racial, ethnic, or religious backgrounds seem to be the cause of many of
the disagreements and conflicts at the college (χ2(1) = 22.57, p<.0001). More People of
Color than Whites (26% vs. 13%) also reported feeling that they feel like an outsider in
the college community (χ2(1) = 18.90, p<.0001). Additionally a greater proportion of
People of Color reported hearing negative comments regarding religion than Whites
(55% vs. 43%), (χ2(1) = 7.81, p<.01). These finding are consistent with employee
focus group data, People of Color in general with respect to issues of difference in
response “how included do you feel” two macro-themes, macro-trends emerged were
characterized as “Feel Included” or “More Inclusion Needed-Room for Improvement”.
Three out of four (75%) White employee focus groups reported feeling included.
Conversely, seven out of eight (87.5%) African American/People of Color groups
reported “More Inclusion Needed-Room for Improvement.” In addition, LGBTQ
Faculty/Staff focus group reported a need for more inclusion regarding People of Color”
in general. For example, following are some direct quotes from focus group participants,
which seemingly reflect the opinions of a number of participants: “More representation
of African Americans upper levels academic side and elsewhere. In most cases when I

72
am not included, I feel as though others are ignorant of the need or my potential to
shape the outcome. The college must take steps to have a diverse workforce throughout
the institution – both vertically and horizontally on the organization chart- Right now,
there is a pocket of people of color in some departments. Encourage good employees,
talk with them about their development, and help them get on track to move up. I do
not see change is possible- too late for me – hire more people of color. I would like to
see more staff that is diverse in particular more Asian members”.
Consistent with statistical and employee focus group findings above White Males
students, White Females students, Christian students and two Jewish students focus
groups reported feeling very included resulting in a macro-theme “Feel Very Included”.
African Caribbean, Latino/Hispanic and Asian Student focus groups reported a macro
theme “More Inclusion Needed-Room for Improvement”. Both (100%) White Male and
White Female student focus groups; in terms of race “Feel Very Included”. Conversely,
as mentioned three of five (60%) People of Color student focus groups reported “More
Inclusion Needed-Room for Improvement”. For example, following are some direct
quotes from focus group participants, which seemingly reflect the opinions of a number
of participants: “As a student mostly I feel included, as a multi-racial student sometimes
I feel excluded. If there are more Asians here, I might feel more included. I think there
is a huge separation at Stockton when it comes to certain things at Stockton they
choose what they want to include minority students. I would not want to see much
change other than having more come in as students and not EOF”.
In addition, in terms of religion the Christian and both Jewish student focus
groups reported macro theme “Feeling Very Included”. The Muslim student focus (all
Women of Color) group reported a theme “More Inclusion Needed-Room for
Improvement”. For example participant statements, “If anyone is going to join the
Muslims on the activities, other students will name them terrorists, or think they are with
those Muslims terrorist. I do not know why we have this name when we ourselves did
not know anything. I want that Muslims students should have a room to offer their daily
prayers. I know I offer my prayers in library, which is sometimes hard to perform there,
because there are many students all the time there, and sometimes they start looking,
what she is doing?... what I don’t like is when that happens. I think Stockton should
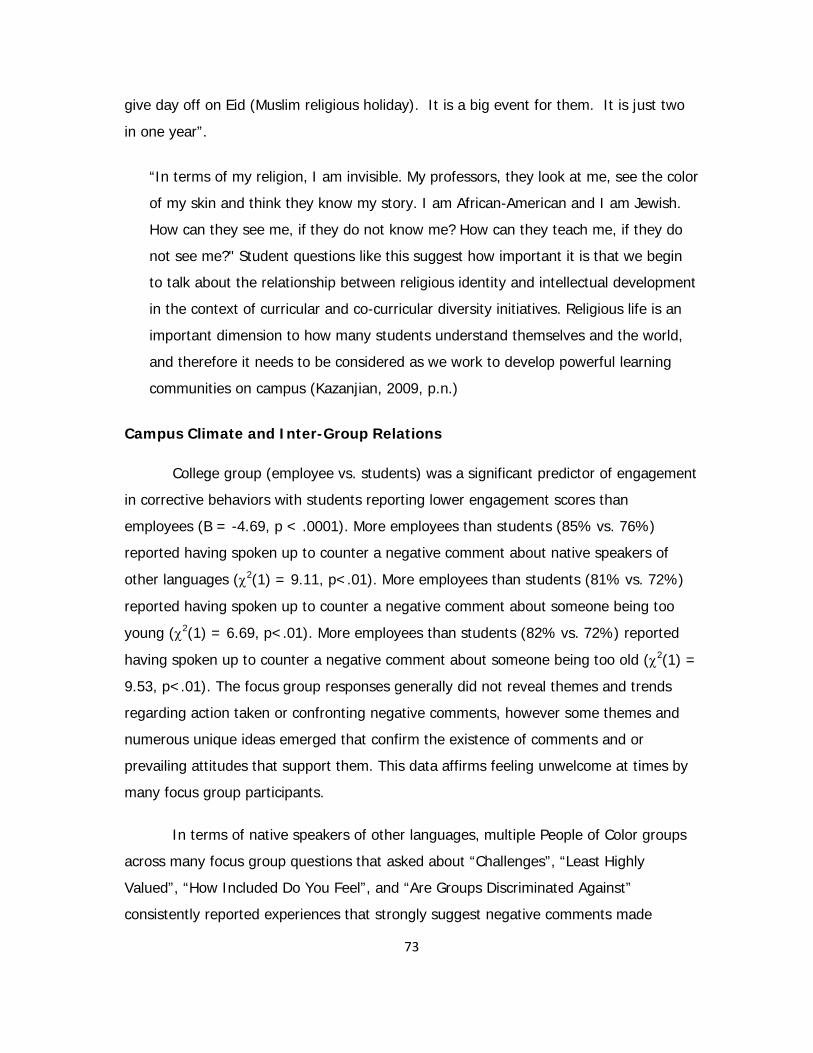
73
give day off on Eid (Muslim religious holiday). It is a big event for them. It is just two
in one year”.
“In terms of my religion, I am invisible. My professors, they look at me, see the color
of my skin and think they know my story. I am African-American and I am Jewish.
How can they see me, if they do not know me? How can they teach me, if they do
not see me?" Student questions like this suggest how important it is that we begin
to talk about the relationship between religious identity and intellectual development
in the context of curricular and co-curricular diversity initiatives. Religious life is an
important dimension to how many students understand themselves and the world,
and therefore it needs to be considered as we work to develop powerful learning
communities on campus (Kazanjian, 2009, p.n.)
Campus Climate and Inter-Group Relations
College group (employee vs. students) was a significant predictor of engagement
in corrective behaviors with students reporting lower engagement scores than
employees (B = -4.69, p < .0001). More employees than students (85% vs. 76%)
reported having spoken up to counter a negative comment about native speakers of
other languages (χ2(1) = 9.11, p<.01). More employees than students (81% vs. 72%)
reported having spoken up to counter a negative comment about someone being too
young (χ2(1) = 6.69, p<.01). More employees than students (82% vs. 72%) reported
having spoken up to counter a negative comment about someone being too old (χ2(1) =
9.53, p<.01). The focus group responses generally did not reveal themes and trends
regarding action taken or confronting negative comments, however some themes and
numerous unique ideas emerged that confirm the existence of comments and or
prevailing attitudes that support them. This data affirms feeling unwelcome at times by
many focus group participants.
In terms of native speakers of other languages, multiple People of Color groups
across many focus group questions that asked about “Challenges”, “Least Highly
Valued”, “How Included Do You Feel”, and “Are Groups Discriminated Against”
consistently reported experiences that strongly suggest negative comments made

74
regarding ESL as a second language. These groups include Women of Color (Latina) ,
non-faculty Represented By AFT, People Of Color (Asian, Black, Latino/Hispanic-Faculty,
African American-Gender Mix Plant Management and Support Staff Personnel, Men of
Color (Latino) Plant Management- Service Maintenance- Support Staff Personnel. For
example, following are some direct quotes from focus group participants, which
seemingly reflect the opinions of a number of participants: “People equate accent and
IQ. People correct my language in arrogant, condescending ways. I am always
wondering how much to say in an email. I can be too honest, or use “proper” English
and I end up looking too formal and stiff. People who speak English clearly and
representative of mainstream values are valued. Spanish/Mexicans who cannot speak
fluent English are least valued. The custodians – they do not speak English, they often
told to learn English. They should be taught not told to learn”.
In terms of age, a general thread ran through many employee focus groups,
these responses reference age in the context of “someone being too young”. This
thread intersected often with gender (female). White Gender Mixed Professional,
Support Staff thru Service Maintenance (CWA, IFPTE & PBA) focus group reported age
(too young) as a diversity issue. For example following are some direct quotes from
focus group participants, which seemingly reflect the opinions of a number of
participants: “Age has worked against me in this environment”. “I get patronized, patted
on the head, spoken to in a condescending way, could be age (too young) and gender
being female”.
In addition, this thread of age often intersected with race and years of service.
African American - Gender Mix Non-Faculty Represented by AFT focus group reported
age (under forty), race (non-White) and lack of years of service (unspecified). For
example following are some direct quotes from focus group participants, which
seemingly reflect the opinions of a number of participants: “White middle aged males
and 40 something females are valued and groomed for advancement. With support
staff: middle aged white females with years of seniority hold the keys to the kingdom
and use their “power” to create obstacles to be divisive”.

75
Regarding age “someone being too old”, multiple unique ideas comments made
across many focus group questions and a variety of groups. For example following are
some direct quotes from focus group participants, which seem to best reflect the
opinions of a number of participants: “People over 50, because not enough continuing
education programs. Older faculty must learn how to use technology or they left behind.
Older faculty – we should use them for their “wisdom” and we do not”.
Shaun (2008), Jackson (2006) and Cox (2001) suggest that members’ of
marginalized groups know they are a member of an out-group because of some social
identity, particularly if they are the first or of a few non-traditional social identities that
are new in the role or social context. Life experience informs them whether by race,
gender, age, speaker of a native language, or sexual orientation etc, that sometimes
depending on context may inform them if the feeling of marginalization is situational, or
systemic. An internal calculation and conversation occurs, one of many possible
questions they ask themselves: “if I address the negative comment made about my
social identity, is this a battle I choose to engage in this moment, will it advance or
inhibit my standing here?” Often the decision is to let it go and or swallow the cruelty.
Because experience teaches, that an array of defensive responses will follow from the
offender and the genuine concern one is trying to convey is lost in the encounter.
Batts (1998) identifies several of these reactions of dominant group members
when confronted about their behavior; (1) Self-protection, “I’m not prejudiced my
upbringing was different”. (2) Presence of racial or ethnic jokes, “you are being overly
sensitive”. (3) Solidarity with the dominant culture after a negative comment is
expressed, “s/he is really a very nice person” or s/he means no harm”. The target (out-
group member) is afraid of being accused of pulling the social identity card i.e., race
card, gender card etc, when one does respond to negative comments. These are
examples of why some individuals in marginalized groups do not engage in
correcting/engaging dominant group members on their behavior, in addition these
experiences have taught them not to expect support from other dominant group
members or public support from other out-group members. These are significant
inhibitors to creating an inclusive culture. Stewart (1995) states that “Diversity in the
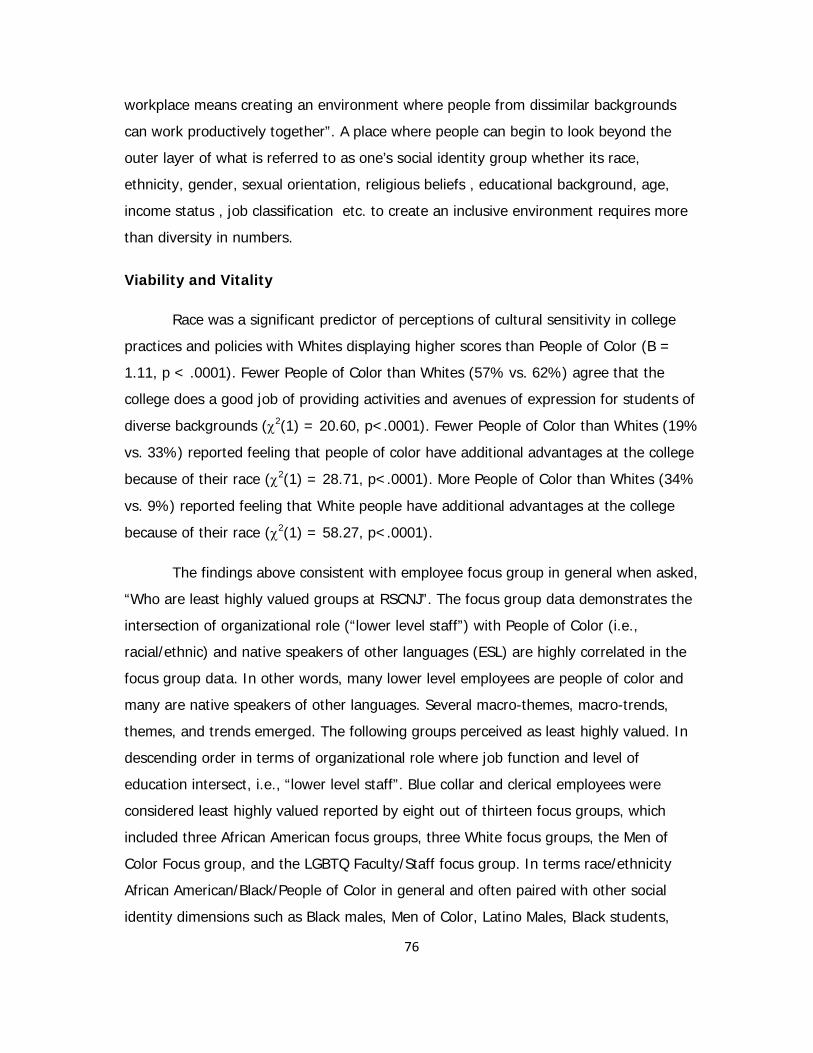
76
workplace means creating an environment where people from dissimilar backgrounds
can work productively together”. A place where people can begin to look beyond the
outer layer of what is referred to as one’s social identity group whether its race,
ethnicity, gender, sexual orientation, religious beliefs , educational background, age,
income status , job classification etc. to create an inclusive environment requires more
than diversity in numbers.
Viability and Vitality
Race was a significant predictor of perceptions of cultural sensitivity in college
practices and policies with Whites displaying higher scores than People of Color (B =
1.11, p < .0001). Fewer People of Color than Whites (57% vs. 62%) agree that the
college does a good job of providing activities and avenues of expression for students of
diverse backgrounds (χ2(1) = 20.60, p<.0001). Fewer People of Color than Whites (19%
vs. 33%) reported feeling that people of color have additional advantages at the college
because of their race (χ2(1) = 28.71, p<.0001). More People of Color than Whites (34%
vs. 9%) reported feeling that White people have additional advantages at the college
because of their race (χ2(1) = 58.27, p<.0001).
The findings above consistent with employee focus group in general when asked,
“Who are least highly valued groups at RSCNJ”. The focus group data demonstrates the
intersection of organizational role (“lower level staff”) with People of Color (i.e.,
racial/ethnic) and native speakers of other languages (ESL) are highly correlated in the
focus group data. In other words, many lower level employees are people of color and
many are native speakers of other languages. Several macro-themes, macro-trends,
themes, and trends emerged. The following groups perceived as least highly valued. In
descending order in terms of organizational role where job function and level of
education intersect, i.e., “lower level staff”. Blue collar and clerical employees were
considered least highly valued reported by eight out of thirteen focus groups, which
included three African American focus groups, three White focus groups, the Men of
Color Focus group, and the LGBTQ Faculty/Staff focus group. In terms race/ethnicity
African American/Black/People of Color in general and often paired with other social
identity dimensions such as Black males, Men of Color, Latino Males, Black students,

77
Women of Color (non-Black) as least highly valued. In addition, African American-
Gender Mix Plant Management and Support Staff, Personnel White Gender Mixed
Professional Non-Faculty Represented by AFT, and White Gender Mixed Professional,
Support Staff thru Service Maintenance (CWA, IFPTE & PBA) reported native speakers of
other languages ESL people as least highly valued.
The findings above consistent with student focus groups in general when asked,
“Who is the least highly valued groups at RSCNJ”. Often student groups identified
themselves as “least highly valued” as such, four of five People of Color student groups
reported. African American Students-Blacks Males and NAACP (Trend); “Black males
because they are the hardest for the majority of the student body to relate too”. “NAACP
they don’t program, and are not active”. African Caribbean Minority Status in General-
Blacks (Trend) “Blacks – because we are very small, and we play against one another
making it difficult to achieve many things no matter how involved we are”.
Latino/Hispanic Students- Black and Latino/Hispanic Individuals and Organizations
(Theme), “Hispanics and Blacks are least valued on this campus. We provide the most
for the community and receive the least”. Muslim Students (all Women of Color) -Muslim
and Minority Status in General (Trend); “Minority Groups in general they are not
represented as much they do not seem to fit the image of an all around American”.
The following groups, employees (χ2(2) = 29.60, p<.0001) were more likely to
disagree with the statement “employees are treated fairly regardless of their racial or
ethnic background”. In addition, majority of Whites (χ2(2) = 10.04, p<.01) and able-
bodied people (χ2(2) = 11.47, p<.01) agree with the same statement that, “employees
are treated fairly regardless of their racial or ethnic background” that is to say more
People of Color and People with Disabilities disagree. When the above data juxtaposed
with the following that more females (χ2(1) = 9.60, p<.01) and People of Color (χ2(1) =
10.38, p<.01) reported feeling that their own gender and racial group respectively has
an important impact on how they see and experience the world. Moreover also reporting
racial group has an important impact on how others perceive them (χ2(1) = 9.95,
p<.01). The data suggest that generally more White, able-bodied, males, and students
perceive people treated fairly regardless of racial or ethnic background, however, more

78
people of color, people with disabilities, and females may tend to disagree with the
statement generally.
Focus group data reporting in response to which groups are most highly valued
and least highly valued at Stockton suggest a connection to data above. Employee focus
group data reports in terms of (race) White and (gender) male social identity
combinations emerge most, followed closely by White female (race and gender) often
when describing most highly valued groups and often these are attached to faculty or
administration in terms of most highly valued function and or organizational level. For
example participants statements: In descending order race combined with other social
identity dimensions such as: White Faculty, White Males, White Females, White Middle
Aged, Whites with Many Years of Service with RSCNJ, this was reported by all four
African American focus groups across all levels of employment and function. As noted,
eight of thirteen focus groups reported on lower level staff as “least highly valued at
RSCNJ” here is an example of the intersection of job function (blue-collar and clerical
employees) level, (non-management) and minority status (People of Color). For
example participants statements, “Custodial, secretarial and other support staff treated
poorly by students and other employees because they are not in management positions;
non-degree personnel; Black males negative stereotypes of their work ethic and;
Spanish/ Mexican who cannot speak fluent English are not valued”.
In terms of People with Disabilities, neither a macro theme nor a trend evolved
from any single focus group question. However, voluminous responses of unique ideas
from several focus groups suggest they are less highly valued, discriminated against,
and having challenging experiences at RSCNJ. Other groups reported their experience
such as White Gender Mixed Faculty, White Gender Mixed Management (Non-Aligned)
White Gender Mixed Professional, Support Staff thru Service Maintenance (CWA, IFPTE
& PBA). For example participants statements, “It is a challenge for people with various
disabilities i.e., students/faculty/staff who need access, accommodations and encounter
invisible barriers”.
Similarly, for females neither a macro theme nor a trend evolved from any single
focus group question. However, voluminous responses of unique ideas from several
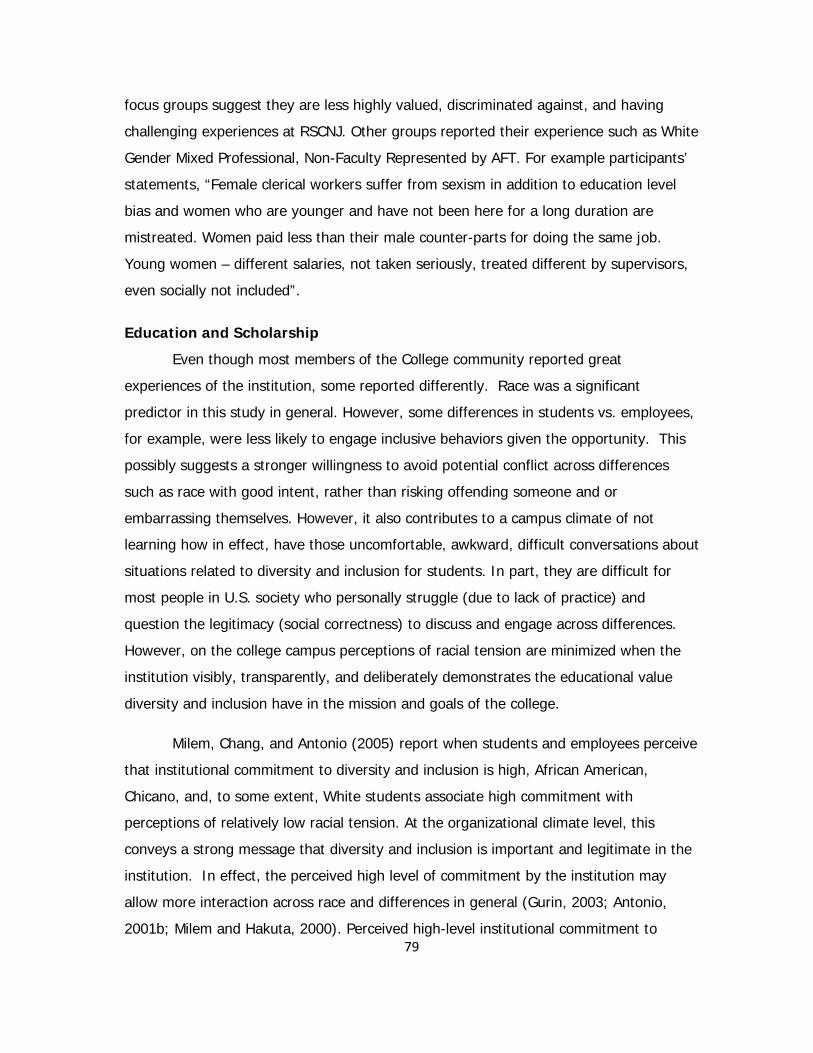
79
focus groups suggest they are less highly valued, discriminated against, and having
challenging experiences at RSCNJ. Other groups reported their experience such as White
Gender Mixed Professional, Non-Faculty Represented by AFT. For example participants’
statements, “Female clerical workers suffer from sexism in addition to education level
bias and women who are younger and have not been here for a long duration are
mistreated. Women paid less than their male counter-parts for doing the same job.
Young women – different salaries, not taken seriously, treated different by supervisors,
even socially not included”.
Education and Scholarship
Even though most members of the College community reported great
experiences of the institution, some reported differently. Race was a significant
predictor in this study in general. However, some differences in students vs. employees,
for example, were less likely to engage inclusive behaviors given the opportunity. This
possibly suggests a stronger willingness to avoid potential conflict across differences
such as race with good intent, rather than risking offending someone and or
embarrassing themselves. However, it also contributes to a campus climate of not
learning how in effect, have those uncomfortable, awkward, difficult conversations about
situations related to diversity and inclusion for students. In part, they are difficult for
most people in U.S. society who personally struggle (due to lack of practice) and
question the legitimacy (social correctness) to discuss and engage across differences.
However, on the college campus perceptions of racial tension are minimized when the
institution visibly, transparently, and deliberately demonstrates the educational value
diversity and inclusion have in the mission and goals of the college.
Milem, Chang, and Antonio (2005) report when students and employees perceive
that institutional commitment to diversity and inclusion is high, African American,
Chicano, and, to some extent, White students associate high commitment with
perceptions of relatively low racial tension. At the organizational climate level, this
conveys a strong message that diversity and inclusion is important and legitimate in the
institution. In effect, the perceived high level of commitment by the institution may
allow more interaction across race and differences in general (Gurin, 2003; Antonio,
2001b; Milem and Hakuta, 2000). Perceived high-level institutional commitment to
80
diversity and inclusion thereby lowering racial tension contributes to learning outcomes.
Higher perceived levels of commitment associated with higher reported college grade-
point averages and increased personal goals to promote racial understanding. In
contrast, lower perceived levels of commitment to diversity result in higher levels of
perceived hostility and discrimination and are associated with (1) low grades for African
American students, (2) feeling isolated for Native American students, (3) college
adjustment issues and sense of belonging for Latino students and (4) greater sense of
alienation among all students in the college community (Chang, 2001).
As noted above, discrimination and a sense of feeling less highly valued than
others reflect to some degree current campus/college climate. The following comment
captures the essence of the RSCNJ diversity experience for this student, “As a student
mostly I feel included, but as a multi-racial student sometimes I feel excluded”. This
statement may speak for many in this study who reported that they are unlikely to
engage in inclusive behaviors given the opportunity; in other words, they are also less
likely to confront exclusive behaviors, thereby perpetuating more of the above. Herein
lies the paradox of diversity. In addition, our review of documents suggests that
Richard Stockton College of New Jersey has numerous helpful policies, practices, and
programs in support of improving diversity and inclusion. However, all documents are
not created equal. A clear strong message in major organizational documents, such as
mission and vision statements and strategic plans, is the first step in conveying the high
level of commitment necessary to minimize negative climate. Furthermore, the message
must be echoed until it reverberates in every hallway, classroom, dorm, and office
throughout the institution. As Miller and Katz (2002) remark, this is an example of taking
diversity “out of the box.” This reinforces a high commitment and support a climate that
invites students to engage across differences in social identity.

81
Conclusion
Richard Stockton College of New Jersey is uniquely poised to shape itself into a
diversity and inclusion culture. It has advantages compared to many other institutions.
First, RSCNJ has the advantage of not having a history of overt discrimination. Created
in 1971 and born of the Civil Rights era, a legacy of overt racism and sexism is absent
from its history and organizational memory. Many institutions of higher education have
had to apply great efforts overcoming their reputation of historical social injustice.
Secondly, early in its development the College named an African American woman as
President of the College. In that appointment, a significant message placed in the
organizational memory was clear that both a female and African American could attain
the most powerful and prestigious position in the College. When generalized, that
message suggests a level playing field for all members of the RSCNJ community. Finally,
the institution is motivated to create a more inclusive culture, as evidenced by
commissioning this Cultural Audit.
As previously mentioned, this research is only a short chapter in the Richard
Stockton College of New Jerseys’ story. The study was exploratory in approach. It
revealed some strengths and challenges currently operating in the culture. It gives the
institution an opportunity to build on the strengths and effectively engage the challenges
as opportunities for organizational improvement. This study provides some insight into
the RSCNJ culture. Organizational culture is often defined as deeply shared values,
assumptions, norms, and beliefs. Bryant Associates Consulting has a simple, but
powerful model that approximates the developmental stage(s) of an organization’s
diversity and inclusion culture. The model is based on Maslow (1954) and his work from
which many current change and learning theories are derived. Simply, his theory
(unconscious-conscious, incompetence- competence) suggests as one’s awareness
increases, opportunity for competence increases. As one becomes more competent, less
conscious awareness, (energy) is required to accomplish the same task. It postulates
that individuals, groups and organizations effectiveness increases as they move from a
state of (1) unconscious-incompetence, (2) conscious-incompetence, (3) conscious-
competence, and (4) unconscious-competence. As a diagnostic tool related to diversity

82
and inclusion culture change, see an abbreviated and simplified version of the model
below.
Diversity and Inclusion Culture Change Model (Bryant 2005)
Conforming Phase I: Unconscious-Incompetence i.e. the organization is unaware and
ineffective regarding diversity and inclusion issues.
Characteristics
• Mono-Cultural- Dominant group is intentional about exclusion of difference.
• Maintains Status Quo- withholds power from out-groups.
• State of Denial- Dominant groups see status quo as normal and not a problem;
the benefits of diversity and inclusion not appreciated or explored.
Reforming Phase II: Conscious-Incompetence i.e. the organization is aware of some
diversity and inclusion issues however it is ineffective regarding diversity and inclusion
in addressing them.
Characteristics
• Dominant Culture-maintains the unearned privilege (entrenchment), power
and influence traditionally held by dominant groups.
• Select Few-limited number of different other social identity access the
organization. Often these e.g., women and people of color are subjected to
anonymous criticism, questioning of their credentials, attitudes and behaviors
highly scrutinized by dominant group members.
• Compliance Focus-provides some access for some members of previously
excluded groups, “but don’t rock the boat”. Anxiety about social identity
differences and conflict avoidance starts to emerge. Mixture of intentional and
unintentional discrimination exist in the organization.
Performing Phase III: Conscious-Competence i.e. the organization is “consciously”
aware and effective regarding diversity and inclusion issues.
Characteristics
Phase 3a.
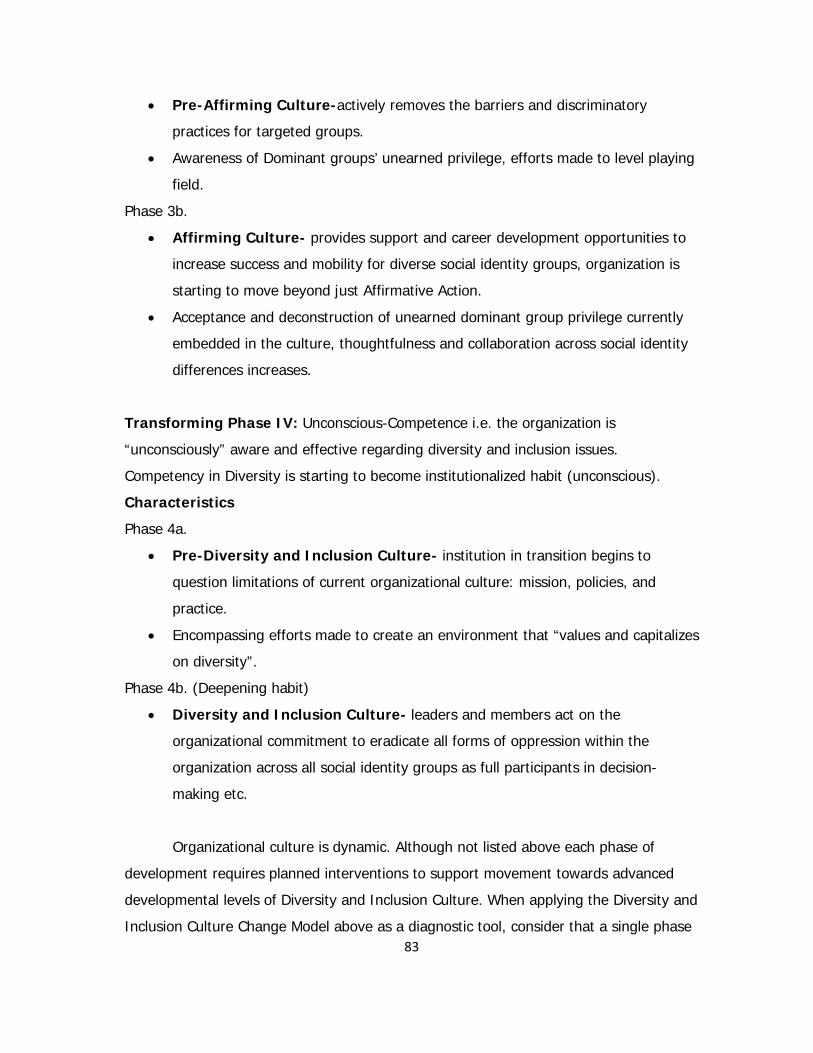
83
• Pre-Affirming Culture-actively removes the barriers and discriminatory
practices for targeted groups.
• Awareness of Dominant groups’ unearned privilege, efforts made to level playing
field.
Phase 3b.
• Affirming Culture- provides support and career development opportunities to
increase success and mobility for diverse social identity groups, organization is
starting to move beyond just Affirmative Action.
• Acceptance and deconstruction of unearned dominant group privilege currently
embedded in the culture, thoughtfulness and collaboration across social identity
differences increases.
Transforming Phase IV: Unconscious-Competence i.e. the organization is
“unconsciously” aware and effective regarding diversity and inclusion issues.
Competency in Diversity is starting to become institutionalized habit (unconscious).
Characteristics
Phase 4a.
• Pre-Diversity and Inclusion Culture- institution in transition begins to
question limitations of current organizational culture: mission, policies, and
practice.
• Encompassing efforts made to create an environment that “values and capitalizes
on diversity”.
Phase 4b. (Deepening habit)
• Diversity and Inclusion Culture- leaders and members act on the
organizational commitment to eradicate all forms of oppression within the
organization across all social identity groups as full participants in decision-
making etc.
Organizational culture is dynamic. Although not listed above each phase of
development requires planned interventions to support movement towards advanced
developmental levels of Diversity and Inclusion Culture. When applying the Diversity and
Inclusion Culture Change Model above as a diagnostic tool, consider that a single phase

84
rarely represents where an organization expends most of its energy; typically, with
100% representing all available time, resources and energy in an organization. For
example, it may exist using 65% of its time, resources and energy in a particular phase,
25% in another and 10% in another developmental phase all happening simultaneously.
Certain areas of the organization may be more evolved than other parts. Therefore,
even as an organization evolves into a diversity and inclusion culture, remnants of
previous developmental phases may persist to operate in the culture.
Overall, most participants in this study reported RSCNJ as a rewarding learning
community. Based on the findings of this report, it is the opinion of the research group,
Bryant Associates Consulting, that RSCNJ organizational culture currently operates in
multiple phases of development. Stockton seems to exhibit mostly Performing behaviors
in relationship to diversity and inclusion culture and demonstrates some Reforming
characteristics. These characteristics were demonstrated throughout the study; the
following example is one of many that exemplify both developmental phases. The
findings suggest that (66% of students and 68% of employees regarding employees)
and (66% of students and 75% of employees regarding students) found RSCNJ to be an
environment in which people are treated fairly regardless of their racial or ethnic
background (survey question #13). Overall, the focus group findings (focus group
question #1) support similar conclusions. However, there were statistically significant
differences found between groups (i.e., race/ethnicity, gender, sexual orientation,
religion, organizational affiliation student or employee etc.) on this and a number of
other factors which were examined in this study. If one thought of these results in
terms of customer satisfaction scores (students 66% regarding employees and 66%
regarding students) and employment satisfaction scores (employees 68% regarding
employees and 75% regarding students). One should take pause given that more than
30% of the college community respondents did not affirmatively endorse the statement
that “people are treated fairly regardless of their racial or ethnic background”. As
demonstrated above, RSCNJ has both strengths and challenges as it pursues a
heightened level of diversity and inclusion culture.

85
The Reforming phase is operating to some extent. The study suggests some
degree of entrenched unearned privilege operating in the institutional system. For
example, the focus group data include many experiences reported as negative
comments, comments that lead some people to feel like outsiders and that they are
constantly scrutinized. These respondents often feel the pressure of over or under-
expectations regarding academic and work performance related to race, gender, sexual
orientation, people with disabilities, age, religion, language, organizational roles and
levels. Another example of the Reforming phase is the impact on people with disabilities.
Some have reported experiencing physical (i.e., structural) barriers, and social (i.e.,
attitudinal) barriers from the dominant group of able-bodied people. They often
experience a lack of sensitivity and sense the discomfort that others, including faculty
and students, have just being in their presence.
In sum, the RSCNJ culture reflects the removal of many barriers to having a
more inclusive culture for females, people of color, and many other social identity
groups. In moving forward toward more evolved diversity and inclusion culture phases,
RSCNJ perhaps will consider the following. First, before an organization can successfully
move out of one developmental phase into another it must complete the less evolved
phase that currently expends its energy and time. Secondly, deeper movement and
completion of the Performing phase requires RSCNJ to begin to re-invent itself starting
with reflection and dialogue about its mission and vision for the institution. Thirdly, the
mission is the organizing principle for the change process. Once RSCNJ makes that
decision, it will start to move forward in the developmental process. Organizations
progress readily through the phases when they encourage their members to action
regarding self-examination, thoughtfulness, and collaboration when engaging across
social identity differences groups and individuals. In essence, diversity and inclusion
culture is action oriented, more humane and productive, less stressful and anxious. It is
both the “right thing to do” and the “smart thing to do.” However, doing the right thing
is not the same as trying not to do the wrong thing. Below please find a set of Core
Recommendations as previously listed in the Project Summary.

86
The recommendations are based on industry Best Practices and the field
experience of BAC. When translated and applied, they become purposeful goals,
objectives, and action steps that will support the institution in moving towards culture
change based on available resources, motivation, and level of commitment. All
recommendations are from the perspective of increasing cultural competence at multiple
levels of human system, including skills and interpersonal effectiveness for individuals,
effective collaboration within and between groups, and increased institutional culture
change capacity, all of which are mission critical for diversity and inclusion culture.
Core Recommendations
• Set the tone and expectation, and promote college community buy-in for future
change by communicating to the entire organization the RSCNJ Cultural Audit
2008-9 report results and anticipated potential next steps.
• Conduct Diversity and Inclusion Leadership workshop(s) for members of the
president’s cabinet, diversity committee, and other key leadership personnel
throughout the institution.
• Make diversity and inclusion mission critical. Review, revise and update current
RSCNJ’s mission/vision/strategic plans and organizational goals to reflect greater
depth and commitment in support of substantive diversity and inclusion
institutional culture change. In addition, implement this process in every area of
the institution e.g., departments, programs, projects, etc; each should have
mission/vision/strategic/goals consistent with and reflective of the organization.
Create mechanisms for accountability.
• Develop, integrate and implement diversity and inclusion competencies as a
normative part of all employees’ performance management and work evaluation
process. Link these competencies to compensation, promotions, and tenure.
Create mechanisms for accountability.
• Provide management development and training thoroughly enhanced by diversity
and inclusion best practices for all levels of employees responsible for
managing/supervising others. Create mechanisms for accountability.

87
• Provide awareness and skills training for all employees that enable them to
behave as diversity and inclusion culture carriers (disseminators). Create
mechanisms for accountability.
• Increase awareness of all students of the college’s commitment to diversity and
inclusion and enable them to behave as diversity and inclusion culture carriers
(disseminators).
• Provide multiple opportunities for all students to interact and have meaningful
conversations across race, ethnicity, gender, religion, sexual orientation, etc.
• Conduct regular internal cultural audits; review, revise, and integrate diversity
and inclusion principles into documents, common language, practices, and
behaviors that are reflected in every area of the college.
• Review the 2020 Strategic Planning process and make sure that key stakeholders
at all levels of the College are included and have a voice in the goals and
priorities for the College.
• Use this study (RSCNJ Cultural Audit 2008-9) as part of a baseline for continued
research and evaluation of the organizational culture’s progress over time.
• Convene an academic committee to evaluate curriculum in more depth.
• Convene meetings with people with physical disabilities (students and
employees) to determine additional services and support RSCNJ can consider
providing.
• Create Diversity Champions initiative for both students and employees.
Sponsored by the office of the President, these groups would function as internal
consultants to campus groups implementing various diversity and inclusion
programs. They would receive in-depth advanced diversity and inclusion
education and skills training.

88
REFERENCES
Antonio, A. L. (2004). “When Does Race Matter in College Friendships: Exploring
the Role of Race Within Men’s Diverse and Homogeneous Friendship Groups”. Review of
Higher Education 27 (4): 553-75.
Antonio, A. L. (2001). “The Role of Interracial Interaction in the Development of
Leadership Skills and Cultural Knowledge and Understanding”. Research in Higher
Education 42(5): 593-617.
“American College & Universities Presidents Climate Commitment”. (2008).
Report for the Richard Stockton College of New Jersey. Retrieved April 24, 2009 from
http://acupcc.aashe.org/ghg-report.php?id=740.
Batts, V. (1998). “Modern Racism: New Melody for the Same Old Tunes”. MA:
Episcopal Divinity School Occasional Papers. Foster, Charles. Retrieved July 10, 2009
from
http://www.elca.org/~/media/Files/Women%20of%20the%20ELCA/Radical%20Welcome/Biblio
graphy.
Bauman, L. G., Bustillos, B., Brown, C., & Bartree, R. D. (2005). “Achieving
Equitable Educational Outcomes with All Students: The Institution’s Roles and
Responsibilities”. Association of American Colleges and Universities. Retrieved from
http:// www.aacu.org.
Benjamin, R. & R. Wigand. (1995). “Electronic Markets and Virtual value Chains
on the Information Superhighway”. Sloan Management Review 36(2): 62-72. Retrieved
on July 2, 2009 from http://www2.bc.edu/~gallaugh
Bryant, V. F. (2009). The Proper Consultant’s Stance in Diversity and Inclusion:
“Be All You Can Be”. Typified by the Four “Be Attitudes.” Diversity Training Evolves,
Privilege Persists, Volume 17, (1), The Diversity Factor Winter @2009. ISSN 1545-2808
Retrieved from http:// www.divsersity.com
89
Boyd-Franklin, N. (2004). Black Families in Therapy: Understanding the African
American Experience. Rutgers University. Guilford Press.
Business Dictionary. COM (2008). Retrieved from http://
www.businessdictionary.com
Chang, M. J., & DeAngelo, L. ( 2002). “Going Greek: The Effects of Racial
Composition on White Students’ Participation Patterns”. Journal of College Student
Development 43 (6): 809-23.
Chestang, L.W. (1976). The Diverse Society: Implications for Social Policy.
Washington DC: NASW Press.
Clayton-Pedersen, R.A., Parker, S., Smith, G. G., Moreno, F. J., & Teraguchi, H.D.
(2007). “Making a Real Difference with Diversity”. DC: Association of American Colleges
and Universities.
Cox, T. (2001). Creating the Multicultural Organization. Jossey-Bass.
Clawson, D. J. (1999). Three Levels of Leadership. NY: Prentice Hall.
Garcia. , Hudgins, A. C, Musil, M. C., Nettles, T. M, Sedlacek, E. W., & Smith, G.
D. (2001). “Assessing Campus Diversity Initiatives: A Guide for Campus Practitioners”.
DC: Association of American Colleges and Universities.
Hunter, A. (2009). Guide to Diversity Recruiting. July 18, 2009. Retrieved:
http://www.business.Con/directory/human.
Hurtado, S., Dey, E. L., Gurin, P. & Gurin, G. (2003). “College Environments,
Diversity, and Student Learning” in Higher Education: Handbook of Theory and
Research 18, Ed. J. C. Smart, 145-90. UK: Kluwer Academic Publishers.
Jackson, B.W. (2006). “Theory and Practice of Multicultural Organization
Development” in Jones, B. B. & Brazzel, M. (Eds.). The NTL Handbook of Organization
Development and Change. San Francisco, CA: Pfeiffer.

90
Jamison. (2004). The Nibble Theory and the Kernel of Power. New York: Paulist
Press.
Kazanjian, V. (2009). “Religious Identity and Intellectual Development: Forging
Powerful Learning Communities”. Retrieved July 07, 2009 from
http://www.diversityweb.org/Digest/Sp99/religious.html.
Kotter, P. J., Heskitt, L. J. (1992). Corporate Culture and Performance. New
York: The Free Press.
Media Daily (1996). “Report: 7% Growth Predicted For College Publishers”.
December 5, 4 (235). Review from http://www.mediacental.com/Magazines/Media
Daily/OldArchieves/199612/1996120410.html.
Milem, J. F., & Kakuta, K. (2000). “The Benefits of Racial and Ethnic Diversity in
Higher Education” in Minorities in Higher Education: Seventeenth Annual Status Report
Washington, DC: American Council on Education.
Milem, J.F., Change, J. M., & Antonio, L. A. (2005). Making Diversity Work on
Campus: A Research-Based Perspective. Association of American Colleges and
Universities. Retrieved from http:/ www.aacu.org.
Miller, F. A. & Katz, H. J. (2002). The Inclusion Breath Through: Unleashing the
Power of Real Diversity. CA: Berrett-Koehler.
Musil, M. C., Garcia, M, Moses, Smith, D.G. (1995). Diversity in Higher Education:
A Work In Progress. DC: Association of American Colleges and Universities.
O’Rourke, S. (2008). “Diversity and Merit: How one university rewards faculty
work that promotes equity”. Chronicle of Higher Education. September 26, 55 (5): B 41.
Richard Stockton College New Jersey 2005, College Committee for Diversity,
Equity and Affirmative Action. Retrieved September 10, 2008 from
http://www.2stockton.edu

91
Sanagahan, P., & Napier. R. (2002). “Intentional Design and the Process of
Change: Strategies for Successful Change”. National Association of College and
University Business Officers NACUBO Washington, DC: Retrieved from
http://www.nacubo.org
Smith, G. S. (2008). “Reframing Diversity as an Institutional Capacity.
Association of American Colleges and Universities”. www. aacu.org. Editor’s Note: This
article originated in a presentation at AAC&U’s Diversity, Learning, and Inclusive
Excellence meeting on October 17, 2008. A podcast of the presentation is available at
www.aacu.org/meetings/diversityandlearning.
Smith, D., Garcia. M., Hugins, C., A., Musil, M., T., MC Tighe, Nettles, &
Sedlacke, W. (2000). A Research Diversity Agenda. Published by Association of
American Colleges and Universities. http:// www. aacu.org.
The Student Affairs Division of the Minnesota State Colleges & Universities.
(2007). System Office provides technical assistance on best practices, policy and legal
compliance for international students.
http://www.academicaffairs.mnscu.edu/studentaffairs/internationalstudent/index.html.
Vroom, V., (1973). Leadership and Decision Making. PA: University of Pittsburgh
Press.
Williams, A.D., Berger, B. J., Mc Clendon, A.S. (2005). “Toward a Model of
Inclusive Excellence and Change in Postsecondary Institutions”. Association of American
Colleges and Universities. Retrieved from http:// www.aacu.org

92
APPENDICES

93
APPENDIX A
Focus Group Confidentiality Agreement
I, hereby agree to maintain the confidentiality of information disclosed during focus group or interview sessions that are observed live, recorded, or conducted in any other manner as follows:
1) Definition - For purposes of this agreement, “Confidential Information” means information or material obtained or observed while attending a Focus Group session conducted at the Richard Stockton College of New Jersey. By example and without limitation, Confidential Information includes a) Any information about any participant in the Focus Group that is not currently in
the public domain or readily available to the public. b) Also included as confidential is any participant’s Respondent’s Personally
Identifiable Information. This includes a person’s identity or information that might reasonably allow identification of the person.
2) I shall at all times hold in trust, keep confidential and not disclose to any third party or make any use of the Confidential Information.
3) I shall at all times hold in trust, keep confidential and not disclose to any third party or make any use of the identity or Personally Identifiable Information of any Respondent involved in the Focus Group.
4) I will use reasonable efforts to keep the Respondent’s Confidential Information and Personally Identifiable Information secure from any third party access.
5) I will comply with all state, federal, and institutional statues and regulations governing privacy, data security, and the use of Personally Identifiable Information. I will use this information only in the manner consented to by the Respondent, and for none other unless explicit written or recorded permission has been previously obtained from the Respondent.
6) All notes, reference materials, memoranda, documentation and records in any way incorporating or reflecting any of the Confidential Information shall belong exclusively to The Richard Stockton College of New Jersey.
The undersigned agrees to the above terms of this agreement.
Signed_________________________________________ Date______________
Printed_________________________________________

94
APPENDIX B
INFORMED CONSENT FORM
You are invited to participate in a study of Diversity and Inclusion at the Richard Stockton College of New Jersey. Bryant Associates LLC, an organizational development firm, is conducting this study on behalf of the college. Your participation in this study will help us to determine how closely the college is putting its diversity standards into practice.
You are a participant in this study because you are a student, faculty, administrator, or staff person, of this college. You must be eighteen (18) years of age or older in order to participate in this study. The researcher and or his associates will ask you to participate in a structured Focus Group to talk about your experiences at Richard Stockton College of New Jersey. The Focus Group will meet for one hour and thirty minutes. There are no correct or incorrect answers. No identifying information will be revealed about you as an individual and only aggregate information will be will be made available to the Stockton community. There are no known risks associated with you participating in this study. However there is the possibility that some of the questions may make you feel a little uncomfortable. If this should occur, the researcher will be available to answer any of your questions. If in the unlikely event, after talking to the researcher, you feel the need for additional assistance a referral will be made.
You will not receive any formal compensation for your participation. However, your participation in this study is very important and will provide valuable information to the college to help Richard Stockton College of New Jersey continue meeting its goals related to diversity and inclusion. Bryant Associates and the college will share the report based on the study only within the Stockton community
A copy of this form will be given to you during the focus group session for contact purposes. Your decision whether or not to participate will not prejudice your future relations with Richard Stockton College of New Jersey nor Bryant Associates LLC. If you have any questions, please ask Dr. Frederick V. Bryant (856 - 228-8613. He will be happy to answer any of your questions. If you have any questions about your rights as a research participant, you may contact Dr. Rachel Martin, Associate Professor, School of Education,

95
[email protected], Richard Stockton College of New Jersey, PO Box 195, Pomona, NJ 08240. Your signature indicates that you have read the information provided above and have decided to participate. You may withdraw at any time without prejudice after signing this form, should you choose to discontinue participation in this study. Statement of Confidentiality: Your participation in this study is confidential no identifying information will be revealed about you as an individual. All focus group Consent Forms, and notes taken by facilitators will be held in passion of Bryant Associates LLC for a period three years in a secured environment. The specific content of focus group discussions will not be directly known to college officials. Richard Stockton College of New Jersey will receive a summary report and recommendations which will be furnished to assist the college in continuing to promote an open exchange of ideas in a setting that embodies the values of academic freedom, responsibility, integrity and cooperation. ___________________ Signature ___________________ Date

96
APPENDIX C
Focus Group Questions
1. What are three rewarding aspects of being a member of the Stockton College?
2. What are three challenging aspects of being a member of the Stockton College?
3. On a scale of 1 – 10, how included to you feel at Stockton? Is there something you would want to see changed to feel more included here?
4. When you hear the word "diversity," what are the first things that come to your mind?
5. With respect to issues of difference, what challenges have you experienced at Stockton?
Facilitator summarizes themes, and encourages dialogue and discussion for questions 1-5
6. Identify the groups that appear to be most highly valued on campus. Why do you think this is true?
7. Identify the groups that appear to be least highly valued on campus. Why do you think this is true?
8. What groups of people do you think are discriminated against at Stockton, and can you give specific examples?
9. What three things must be addressed immediately to make this a more inclusive campus for all people?
Facilitator summarizes themes, and encourages dialogue and discussion for questions 6-9
10. Are there additional comments you'd like to provide? Please do so here:

97
Focus Group Protocol - 90 minutes
Materials:
• Chart paper with focus group questions (1-2 questions per sheet) on which participants will post written responses
• Large post-its (5x7) same color (30 per facilitator per day) on which participants will write (in block letters) their responses to each question
• Pens for participants • 2 Markers for consultants • 2 legal (8.5 x 11) pads • Stand and Chart Paper • 1 roll of Masking Tape
Procedures
I. Introduction of facilitator, participants and the process (10 minutes). The concept of facilitator and participant confidentiality is explained and asked for from participants. Participants given informed consent forms and the purpose for them explained. Facilitator explains confidentiality agreement and has it signed by participants.
II. Participants are invited to respond in writing to Questions 1-5, then post
responses on corresponding pieces of chart paper (10 minutes)
III. Facilitator summarizes posted responses to Questions 1-5 then leads a discussion focusing on common themes and particular responses that require further clarity and detail. (15 minutes)
IV. Participants are invited to respond in writing to Questions 6-9, then post responses on corresponding pieces of chart paper (10 minutes)
V. Facilitator summarizes posted responses to Questions 6-9 then leads a discussion focusing on common themes and particular responses that require further clarity and detail. (15 minutes)
VI. Facilitator thanks participants for engaging in the focus group process and invites them to respond in writing to Questions 10 then post responses on corresponding pieces of chart paper as they leave. (10 minutes)

98
APPENDIX D
Focus Group Summaries Themes, Trends and Unique Ideas (Bryant Associates Consulting Copyright© 2009)
Employee Focus Groups
All of the groups were analyzed and coded individually, then organized into categories themes, trends, and unique ideas; by social identity groupings (i.e., race/ethnicity, gender, sexual orientation, organizational affiliation, students, employee, organizational level, people with disabilities, etc.), then Focus Groups were complied into a composite of all group responses. Data again reviewed, analyzed and organized into categories themes, trends, and unique ideas across all social identity grouping.
A theme is a fact i.e., (from participants perspective) and represents at least 60% or more of the respondents report out to a question. A trend represents a pattern of response that is about 30% of the respondents report out to a question. The difference between a theme and trend is quantitative. A unique idea is something reported by one or two respondents, but it is something the report writer believes would be helpful for others to know about.
Summaries below, written for each question that captures the essence of respondents’ themes, trends, and unique ideas. Each question then viewed across all focus group report outs. The researcher was observing for differences and similarity in patterns of response to discern a sense of that particular social identity group’ s experience related to the question and to other groups. Often as result of the process above are macro themes and trends emerge from the collective focus group data. Macro themes and trends represent similar experience across multiple social identity groups. This information when included with other data sources of the study adds nuance and texture otherwise unattainable by other data collection methods.
Employee Focus Group Question 1: What are three rewarding aspects of being a member of the Stockton College?
Four macro-themes emerged across all groups social identity groups Environment, People, Learning Community Rewarding and Benefits. Environment included physical space and surroundings such as class size and proximity to students’ home, feeling like a welcomed member of a community and comfort with the campus in general. People refer to the level of friendly interaction and activities between students,

99
staff, administration and faculty. Learning Community Rewarding refers to a climate of openness to new ideas, opportunity for growth, a collegial spirit and gaining life experience. Benefits specifically as a function of those things earned through employment policy such as health coverage, paid vacation and sick leave etc. All groups had positive comments regarding these macro-themes.
Employee Focus Group Question 2: What are three challenging aspects of being a member of the Stockton College?
Three broad macro-themes, macro-trends, themes, and trends emerged Responses to the question coalesced into Relational Challenges, Functional Challenges and Combined Relational/Functional Challenges are the lack of support in these areas as it relates to diversity and inclusion. Relational challenges are issues relevant to how people interact across difference in terms of diversity and inclusion. Functional issues are those more relevant to processes, and structures that help or hinder the facilitation of diversity and inclusion. Combined Relational and Functional Challenges are the intersection or overlap of these so intricately connected cannot separate one from the other. In terms of race, there were four White focus groups and eight African American/People of Color focus groups. White focus groups reported more functional issues (12), than People of Color groups reported (9) were as White focus groups reported (1) relational issue, while People of Color focus groups reported (6) relational issues. White Gender Mixed Faculty and LGBTQ Faculty and Staff reported combined relational and functional Challenges.
The majority of African American/People of Color focus groups’ relational and functional challenges are characteristic of prejudicial, exclusionary, and discriminatory employment experiences racially/ethnically specific. For example, they reported, “we’re expected to work harder than White counter-parts (i.e., relational challenge) and “institution provides whites jobs and careers, provide us with programs” (i.e., functional challenge). The majority of White focus groups functional challenges are characteristic of troublesome Bureaucratic Policies/ Procedures / Barriers e.g., “it takes me two weeks to buy lead for my pencil” and limited resources (time and material). LGBTQ Faculty/Staff groups’ combined relational and functional challenges are characteristic of “Balancing personal and professional life, including connecting with other LGBTQ folks and being “out” in the public”
In terms of employment-level those in job categories other than management and faculty i.e. professional, non-faculty, plant maintenance, clerical etc. and inclusive of all racial groups represented Whites and African American/People of Color, reported incompetent supervision as challenging from higher level employees such as managers, administration and faculty.

100
Employee Focus Group Question 3: On a scale of 1 – 10, how included do you feel at Stockton? Is there something you would want to see changed to feel more included here?
Two macro-themes, macro-trends in addition to, themes, trends and unique ideas emerged. The question intended for participants to express how included they feel in the Stockton campus community. The two macro-themes, macro-trends were characterizes as “Feel Included” or “More Inclusion Needed-Room for Improvement”. Three out of four White employee focus groups reported feeling included. Conversely, seven out of eight African American/People of Color groups and the LGBTQ Faculty/Staff focus group reported More Inclusion Needed. The White Gender Mixed Faculty and Men of color (Latino) reported unique ideas.
Those groups that felt included, two of the three had specific caveats within this macro trend such as the White Gender Mixed Management (Non-Aligned) group reported, “More communication needed top down and community events”. In addition, the White Gender Mixed Professional, Non-Faculty Represented by AFT reported wanting a greater sense of unity “No more “racial, ethnic” groupings, just one greater group (all staff, faculty, etc.) for one cause – the education of our students”. Those groups that reported “More Inclusion Needed-Room for Improvement”, one of the eight had a specific caveat within this macro trend as such “Communication and Collaboration”.
Employee Focus Group Question 4: When you hear the word "diversity," what are the first things that come to your mind?
Three macro-themes, macro-trends, themes, and trends emerged. The question intended to evoke participants association with the word diversity in terms of a Positive, Neutral, or Negative Valance. It also provided the researchers with insight about participants’ receptivity-non-receptivity to diversity and inclusion. A positive association expressed in terms of diversity as having representation of difference in social identity and having positive meaningful contact i.e., inclusion for example “allowance for all opinions without feeling threat or exclusion”. A neutral association expressed in terms of diversity as only representative of difference i.e., having multiple social identity differences in the same context for example “differences in race, nationality, religion, socioeconomic status, cultural preferences, and academic-values, learning and teaching styles”. A negative association expressed in terms of diversity as something uncomfortable, feared and or avoided for example “people say diversity is old hat, the work is finished, what you are complaining again!”. Most groups reported multiple

101
combinations of the three overarching themes and trends Positive, Neutral, or Negative Valance.
Overall seven out of eight People of Color employee groups and the LGBTQ Faculty and Staff group reported two positive, five neutral, and six negative associations with the word diversity with the Men of Color (Latino) group reporting unique ideas. Moreover, six of the eight People of Color employee groups reported a range of association neutral to negative, while the African American - Gender Mix Non-Faculty Represented by AFT and LGBTQ Faculty and Staff focus groups reported a polarity both positive and negative associations.
In addition, the White employee groups reported two positive, five neutral, and zero negative associations with the word diversity. White Gender Mixed Faculty and White Gender Mixed Professional, Non-Faculty Represented by AFT both reported positive to neutral association were as all other White employee groups reported neutral associations with the word diversity. In terms of Faculty - focus group’s two out of three LGBTQ Faculty and White Gender Mixed Faculty reported positive associations’ while the African American -Gender Mix Faculty did not.
Employee Focus Group Question 5: With respect to issues of difference, what challenges have you experienced at Stockton?
Two broad macro-theme emerged (Functional and Relational) in response to challenges experienced at Stockton Responses to the question. They coalesced into Relational Challenges, Functional Challenges that are the lack of support in these areas as it relates to diversity and inclusion. Relational challenges are issues relevant to how people interact across difference in terms of diversity and inclusion. Functional issues are those more relevant to processes, and structures that help or hinder the facilitation of diversity and inclusion. Furthermore, they expressed and characterized these Relational/ Functional Challenges in context with “Prejudicial, exclusionary and discriminatory employment experiences at Stockton”.
All but two focus groups reported the theme/trend above “Prejudicial, exclusionary and discriminatory employment experiences at Stockton”. The Men of Color (Latino) and People of Color (Asian, Latino) Professional, Non-Faculty Represented by AFT reported unique ideas. Even though eleven groups expressed this overall theme, there were specific focuses that were different. As such, six groups focused on African Americans/Blacks as the primary social identity group with this challenge. They are: African American -Gender Mix Faculty; African American (6) and Latino (1) -Gender Mix Management and Administrative (Non-aligned); African American - Gender Mix Non-

102
Faculty Represented By AFT; African American-Gender Mix Plant Management and Support Staff Personnel; LGBTQ Faculty and Staff; and White Gender Mixed Faculty.
These groups articulated the negative impact “Prejudicial, exclusionary and discriminatory employment experiences at Stockton” has on African American/Blacks as a group. However, within this same context the White Gender Mixed Faculty focus groups’ caveat described the impact it has on them as a group. For example making decisions (bias checks) “Very difficult to look for “diverse” candidates in our field” We have very specific needs for faculty so a small pool to draw from when hiring, and this becomes even smaller when we need to be “diverse”. Similarly, the White Gender Mixed Professional, Non-Faculty Represented by AFT expressed a trend “I now feel that being white is discriminated against” and “being white, pressure to include people of color over whites, like hiring”.
In term of People of Color (other than African American), other focus groups cited prejudice, exclusion and discrimination regarding them selves. People of Color (Asian, Black, Latino/Hispanic-Faculty and Women of Color (Latina) , non-faculty Represented By AFT identified ESL employees (language Accents)- Unfair hiring processes for People of Color (Non-African American), and immigration formalities regarding People of Color.
In terms of People with Disabilities, the theme of prejudice, exclusion and discrimination cited by White Gender Mixed Management (Non-Aligned) and White Gender Mixed Professional, Support Staff thru Service Maintenance (CWA, IFPTE & PBA) reported access issues. Such as: Distance of handicapped parking from building; Not enough elevators; Can’t use shuttle can’t climb on the bus; Handicap toilet seats, not high enough stalls not big enough help is needed every time you have to go; Height of benches outside too low, hard or impossible to get up can’t stop and rest.
In terms of gender the theme of prejudice, exclusion and discrimination was cited by the White Gender Mixed Professional, Non-Faculty Represented By AFT reported gender bias “At a meeting where I was the only woman, someone said “is she allowed to talk?” after I spoke up”.
In terms of ideology the theme of prejudice, exclusion and discrimination was cited by the White Gender Mixed Faculty reported intolerance for those with conservative views “I have to walk past pro-democratic, anti-republican signs, ignore pro-democratic, anti-republican emails, and have my complaints dismissed as “part of a campaign strategy”
In terms of age and gender the theme of prejudice, exclusion and discrimination was cited by White Gender Mixed Professional, Support Staff thru Service Maintenance (CWA, IFPTE & PBA) reported age (too young) “Age has worked against me in this

103
environment”. “I get patronized, patted on the head, spoken to in a condescending way, could be age and gender being female”.
Employee Focus Group Question 6: Identify the groups that appear to be most highly valued on campus. Why do you think this is true?
Several macro-themes, macro-trends, themes, and trends emerged. The following groups perceived as most highly valued. In descending order in terms of race, White people in general and often paired with other social identity dimensions such as: White Faculty, White Males, White Females, White Middle Aged, Whites with Many Years of Service with RSC, this was reported by all four African American focus groups across all levels of employment and function. In addition, African American (6) and Latino (1) -Gender Mix Management and Administrative (Non-aligned) and White Gender Mixed Faculty reported Black Faculty and People of Color as most highly valued respectively. In terms of job-function one African American focus group, all People of Color focus groups and all of the White focus groups reported Faculty as most highly valued. Regarding organizational-status (level) Men of Color (Latino) Plant Management- Service Maintenance- Support Staff Personnel, White Gender Mixed Faculty, White Gender Mixed Management (Non-Aligned), White Gender Mixed Professional, Support Staff thru Service Maintenance (CWA, IFPTE & PBA) reported Upper level Administrators and Managers as most highly valued. LGBTQ Faculty/Staff and Women of Color (Latina) non-faculty Represented by AFT reported unique ideas.
Employee Focus Group Question 7: Identify the groups that appear to be least highly valued on campus. Why do you think this is true?
Several macro-themes, macro-trends, themes, and trends emerged. The following groups perceived as least highly valued. In descending order in terms of organizational role where job function and level of education intersect, i.e., “lower level staff”. Therefore, Blue collar and clerical employees were considered least highly valued reported by eight out of thirteen focus groups, which included three African American focus groups, three White focus groups, the Men of Color Focus group, and the LGBTQ Faculty/Staff focus group. In terms race/ethnicity African American/Black/People of Color in general and often paired with other social identity dimensions such as Black males, Men of Color, Latino Males, Black students, Women of Color (non-Black) as least highly valued. In addition, African American-Gender Mix Plant Management and Support Staff, Personnel White Gender Mixed Professional Non-Faculty Represented By AFT, and White Gender Mixed Professional, Support Staff thru Service Maintenance (CWA, IFPTE & PBA) reported ESL people, women, and people with disabilities as least highly valued. White

104
Gender Mixed Faculty, Women of Color (Latina) Non-faculty Represented by AFT and People of Color (Asian, Latino) Professional, Non-Faculty Represented by AFT reported unique ideas.
Employee Focus Group Question 8: What groups of people do you think are discriminated against at Stockton, and can you give specific examples?
Several macro-themes, macro-trends, themes, and trends emerged. Groups thought of as discriminated against in descending order: In terms of race / ethnicity, People of Color in general and often paired with other social identity descriptions. Such as African Americans, Blacks, Black Students, People of Color Faculty, Students of Color, International Students, and International Faculty thought of as discriminated against. As reported by White Gender Mixed Professional, Non-Faculty Represented by AFT, People of Color (Asian, Black, Latino/Hispanic-Faculty, and all four African American focus groups across all levels of employment and function that participated in focus groups. Also in terms of race / ethnicity Whites in general, White Students and Non-Black students thought of as discriminated against as reported by White Gender Mixed Professional, Non-Faculty Represented by AFT focus group. The White Gender Mixed Management (Non-Aligned) focus group reported a trend “don’t know not sure who is discriminated against”.
n terms of ability White Gender Mixed Faculty, White Gender Mixed Management (Non-Aligned) and White Gender Mixed Professional, Support Staff thru Service Maintenance (CWA, IFPTE & PBA) focus groups reported People with Disabilities thought of as discriminated against.
In terms of language African American-Gender Mix Plant Management and Support Staff Personnel and Men of Color (Latino) Plant Management- Service Maintenance- Support Staff Personnel focus groups reported ESL People thought of as discriminated against.
In terms of education/job function Blue Collar i.e., custodial, clerical etc. “Anyone who doesn’t have a degree” thought of as discriminated against as reported by Men of Color (Latino) Plant Management- Service Maintenance-Support Staff Personnel and African American-Gender Mix Plant Management and Support Staff Personnel focus groups. In addition, non-tenured faculty thought of as discriminated against as reported by White Gender Mixed Faculty focus group.
In terms of gender, Women thought of as discriminated against as reported by White Gender Mixed Professional, Non-Faculty Represented by AFT focus group.
105
In terms of sexual orientation, LGBTQ students thought of as discriminated against as reported by White Gender Mixed Professional, Non-Faculty Represented by AFT focus group.
Employee Focus Group Question 9: What three things must be addressed immediately to make this a more inclusive campus for all people?
Several macro-themes, macro-trends, themes, and trends emerged. “More and Better Recruitment of Diversity and Minorities” was thematic as reported by African American -Gender Mix Faculty, LGBTQ Faculty and Staff, People of Color (Asian, Black, Latino/Hispanic-Faculty, and White Gender Mixed Professional, Non-Faculty Represented by AFT focus groups. Were as, “Better Retention and More Promotions for Minorities and Women” was thematic as reported by African American-Gender Mix Plant Management and Support Staff Personnel, People of Color (Asian, Black, Latino/Hispanic-Faculty and White Gender Mixed Professional, Non-Faculty Represented by AFT focus groups. In addition, White Gender Mixed Professional, Non-Faculty Represented by AFT focus groups reported a trend “Gender Inequities in Hiring and Pay” and a need for “More Internal Hiring” across the board.
“Equity in pay, respect, appreciation for differences regarding race and gender” was thematic as reported by Men of Color (Latino) Plant Management- Service Maintenance- Support Staff Personnel White Gender Mixed Faculty White Gender Mixed Professional, Non-Faculty Represented by AFT focus groups.
“Education” was thematic as reported by African American (6) and Latino (1) -Gender Mix Management and Administrative (Non-aligned) Men of Color (Latino) Plant Management- Service Maintenance- Support Staff Personnel focus groups regarding increase awareness and competency in diversity and inclusion for all and particular emphasis for managers and supervisors.
“Better Communication and Interaction” was thematic as reported by White Gender Mixed Faculty White Gender Mixed Professional, Non-Faculty Represented By AFT, White Gender Mixed Professional, Support Staff thru Service Maintenance (CWA, IFPTE & PBA) and Women of Color (Latina) non-faculty Represented By AFT focus groups.
Unique Ideas reported by African American - Gender Mix Non-Faculty Represented by AFT, People of Color (Asian, Latino) Professional, Non-Faculty Represented by AFT, and White Gender Mixed Management (Non-Aligned) focus groups.

106
Employee Focus Group Question 10: Are there additional comments you would like to provide? Responses to this question are listed below.
One theme and one trend emerged. African American (6) and Latino (1) - Gender Mix Management and Administrative (Non-aligned) reported a theme Richard Stockton College is a “Good place to work, still work to do”. Women of Color (Latina), non-faculty Represented by AFT reported a trend regarding minority representation “Hire more minority administrators, including deans”
All other Groups reported unique ideas or no comment.
African American Faculty- Gender Mix
NA
African American (6) and Latino (1) - Gender Mix Management and Administrative (Non-aligned)
Theme
Good Place Work, Still Work to Do
• Stockton is a special place and the story is yet to be finalized. Let’s work towards a happy ending.
• Overall, Stockton has a great place to work. What keep’s me here are the people that I work with. We try to be more “inclusive”, but we still have a long way to go.
• Stockton is already a diverse place but we must have inclusion in literature and publishing. We need to celebrate the Stockton diversity.
Unique Idea • This audit is a great start
African American - Gender Mix Non-Faculty Represented By AFT
Unique Ideas
• Stockton must be proactive in enriching the application to include a diverse representation of people of color; not just Black and Latino.
• They should market to those audiences vs. self selecting candidates of color because they are candidates of color.
• Stockton has a major case of “good old boy” syndrome and must look to diversity that. It’s transparent and does not make for a healthy work environment for anyone.
• I am participating with the hope – but not the expectation – this survey/study will result will be implemented and not merely tabulated.

107
• Stockton should provide an opportunity for the campus to come together and celebrate and appreciate various cultures. In addition, provide workshops for the campus community to attend. Actions speak louder than words .. Walk your talk!!!
African American-Gender Mix Plant Management and Support Staff Personnel
NA
LGBTQ Faculty and Staff
Unique Ideas
• Mentoring is key in retaining minority hires • Professional development is lacking • Union dinners focused on LGBTQ
Men of Color (Latino) Plant Management- Service Maintenance- Support Staff Personnel
Unique Ideas
• The world is not perfect and neither is Stockton, but it is still a great place to work. • No • Thank you for bring out this information
People Of Color (Asian, Black, Latino/Hispanic-Faculty-
NA
People of Color (Asian, Latino) Professional, Non-Faculty Represented by AFT
NA
White Gender Mixed Faculty
Unique Ideas
• We had a vocal member in our group whom I think played some incidents up too much that bothered her. That’s important but issues that are not common or widespread may have gotten overemphasized
• Despite many of the comments made here, this is an inclusive place for the most part

108
• Next focus groups provide nametags or tent cards so we get to know each other. Go around room earlier to intro each other
White Gender Mixed Management (Non-Aligned)
Unique Ideas
• Good job! • Stockton s a very good place. I would like to see it even better!
White Gender Mixed Professional, Non-Faculty Represented By AFT
Unique Ideas
• I am really happy that Stockton too the time to address the issues around diversity
• I enjoyed speaking with a group of people from different backgrounds about cultural diversity, It was eye opening and well organized. Thanks
White Gender Mixed Professional, Support Staff thru Service Maintenance (CWA, IFPTE & PBA)
Unique Ideas
• My division (wellness center) is open and communicative. Our boss includes us in everything. I feel blessed to work here. Thank you for your participation
• There has been increased staff marginalization with the new administration, we’ve been taken off the directory. There seems to be a concern that the staff is not able to represent the college well. The new administration seems to value image over reality.
Women of Color (Latina), non-faculty Represented By AFT
Trend
Minority Representation
• Hire more minority administrators, including deans • What is minority representation on the board?

109
Student Focus Groups
All of the groups were analyzed and coded individually, then organized into categories themes, trends, and unique ideas; by social identity groupings (i.e., race/ethnicity, gender, sexual orientation, organizational affiliation, students, employee, organizational level, people with disabilities, etc.), then Focus Groups were compared into a composite of all group responses. Data again reviewed, analyzed and organized into categories themes, trends, and unique ideas across all social identity grouping.
A theme is a fact i.e., (from participants perspective) and represents at least 60% or more of the respondents report out to a question. A trend represents a pattern of response that is about 30% of the respondents report out to a question. The difference between a theme and trend is quantitative. A unique idea is something reported by one or two respondents, but it is something the report writer believes would be helpful for others to know about.
Summaries below, written for each question that captures the essence of respondents’ themes, trends, and unique ideas. Each question then viewed across all focus group report outs. The researcher was observing for differences and similarity in patterns of response to discern a sense of that particular social identity group’ s experience related to the question and to other groups. Often as result of the process above are macro themes and trends emerge from the collective focus group data. Macro themes and trends represent similar experience across multiple social identity groups. This information when included with other data sources of the study adds nuance and texture otherwise unattainable by other data collection methods.
Student Focus Group Question 1: What are three rewarding aspects of being a member of the Stockton College?
Three macro-themes emerged across all groups Environment, People and Learning Community. Environment included physical space and surroundings such as class size and proximity to students’ home, feeling like welcomed member and comfort with the campus in general. People refer to the level of friendly interaction and activities between students, staff, administration and faculty. Learning Community refers to a climate of openness to new ideas, a collegial spirit and gaining life experience. All groups had positive comments regarding these macro-themes.
Student Focus Group Question 2: What are three challenging aspects of being a member of the Stockton College?

110
Several macro-themes, macro-trends, themes, and trends emerged and in part characterized in the context of in-group/out-group dynamics. In-groups are social identities that hold dominate position within that social identity category, in the U.S. for example gender-male, religion-Christian, sexual orientation-heterosexual etc. Out-groups hold the subordinate position for example gender-female, religion-Jewish, Muslim etc, sexual orientation-LGBTQ. Minority group students across race, ethnicity, language, sexual orientation, disability, religion, except Muslims students expressed with emphasis a macro-theme as having an out-group feeling and experience regarding challenges at Richard Stockton College. Out-group students also reported similar challenges as the in-groups referenced below. However, it is important to point out the differential pattern of impact these diverse student groups felt. In-group students around race (White), high status level (i.e., student senate members), and religion (Christian) expressed their challenges differently from out-group members. Common challenge for White Females, White Males, Senate Members, and Christians were challenges about Academics Class Selectivity (macro-theme). In addition, a common challenge for White Females, White Males, Senate Members were environmental/commuter (macro-theme) issues. White Females having challenging commuter experiences (trend) on top of the environmental i.e., parking issues. Common to White Females, Senate Members, and Christians were challenges about social life (macro-trend). Unique challenges these in-groups had were White Females’ extracurricular activities (trend), White Males living on your own (theme), and Senate Members struggles with professors (theme). Christians also reported difficulty with transportation regarding the suburban setting of the campus (trend). It is important to note that the Student Senate and Christian groups were composed of mixed race, ethnicity and gender members.
Student Focus Group Question 3: On a scale of 1 – 10, how included to you feel at Stockton? Is there something you would want to see changed to feel more included here?
Several macro-themes, macro-trends, themes, and trends emerged. Macro theme/trend was student focus groups that reported feeling included. Such as White Males range (7-10) and underlying theme (You can be included if you want to be, by getting involved) White Females range (3-10) underlying trend (Inclusion is something a person chooses and then makes happen) Christian Students range (7-10), and both Jewish Student Focus groups range (7-9) felt included.
In general, the way students scaled the question was not always consistent with their comments. For example, Students with Disabilities range (4-10) with underlying theme (More inclusion needed –room for improvement), Latino/Hispanic Students range

111
(4-10) underlying theme (More inclusion needed –room for improvement) is similar in theme but not range for LGBTQA (4-8) Muslim Students (7-8) Asian Students (7-9). Were as African American Students range (4-8), and Student Senate range (7-10) all reported unique ideas rather then generating specific trends or themes. African Caribbean Students range (4-8) presented a duality theme feeling both included and excluded simultaneously. In their words “as a student mostly I feel included, as a multi-racial student sometimes I feel excluded”.
In sum, White Males, White Females, Christian and Jewish students reported feeling very included resulting in a macro-theme “feel very included”. Students with Disabilities, Latino/Hispanic, LGBTQA, Muslim, and Asian Students reported a macro theme “more inclusion needed for their social identity groups”. African American, and Student Senate Students did not generate a trend or theme about how included they felt at Richard Stockton College and African Caribbean students reported both feeling included and excluded.
Student Focus Group Question 4: When you hear the word "diversity," what are the first things that come to your mind?
Several macro-themes, macro-trends, themes, and trends emerged. This question designed to evoke a level of association from participants when one hears the word diversity in terms of a Positive, Neutral or Negative Valance regarding the word. It also provided the researchers with insight about participants’ receptivity-non-receptivity to diversity and inclusion. A positive association is expressed in terms of diversity as having representation of difference and having meaningful contact i.e., inclusion for example “Respect and understanding of people’s differences”. A neutral association expressed in terms of diversity as only representative of difference i.e., having multiple social identity differences in the same context for example “Diversity – differences in ethnicity/race/religion etc”. A negative association expressed in terms of diversity as something uncomfortable, feared and or avoided. All student focus groups reported positive and neutral association only, with no negative valances reported.
All groups reported positive to neutral association to the word diversity. African American, LGBTQA, white females and one of the Jewish student groups reported a macro-theme “positive association” with all other student groups reporting a macro-theme “neutral association”. A macro-trend “positive association” was reported by African Caribbean, Asian, and white male students. African American students also reported a trend “neutral association” for the word diversity.

112
Student Focus Group Question 5: With respect to issues of difference, what challenges have you experienced at Stockton?
Two broad macro-themes, macro-trends, themes, and trends emerged. Challenges coalesced into relational and functional issues, which are the lack of support in these areas as it relates to diversity and inclusion. Relational challenges are issues relevant to how people interact across difference in terms of diversity and inclusion. Functional issues are those more relevant to processes, and structures that help or hinder the facilitation of diversity and inclusion. Many of these Relational and Functional issues experienced as “Prejudicial, exclusionary and discriminatory”. Overall most social identity groups reported more lack of relational support than functional. Within this context most groups reported challenges they experience as it relates to their own identity group where as the Christian Student focus group reported no challenges for them as a group and the Student Senate focus group reported challenges they observed people with disabilities having (functional) and across race campus wide (relational)
Nine out of Thirteen Student focus groups reported Relational Challenges, while four Student groups reported Functional Challenges both in context with “Prejudicial, exclusionary and discriminatory experiences”.
In terms of religion, both Jewish Student focus groups and the Muslim Student focus groups reported Relational Challenge regarding negative stereotyping associated with their religion. In addition, one of the Jewish Student focus groups reported a Functional Challenge regarding the absence of Jewish groups other than Hillel.
In terms of sexual orientation LGBTQA Relational Challenge- “For a Lesbian it’s very small amount of homophobic. “People who won’t come to your meeting because they aren’t gay. It just seems most don’t know and what you don’t know your afraid of”.
In terms of ability/disability, Students with Disabilities reported Relational Challenge- “Lack of understanding for people with disabilities” - “Feeling dumb in the classroom, put on the spot by some professors” and; Functional Challenge- “ Sometimes I arrive slightly late for class due to the distance traveled between classes, especially when I need to use an elevator”. In addition, Student Senate Students reported Functional Challenge- “Disability awareness, access to bathroom and getting needs met is a problem”.
In terms of Greek Organizations’ White Female Students’ report Relational Challenge-Negative Attitudes Toward Sororities-, “A lot of people hold negative stereotypes of sororities”.

113
In terms of racial tension, White Male Students report Relational Challenge and Functional Challenges-“I’ve seen issues of racially bigoted graffiti and protests over racial issues, events like concerts have been turned into racial issues. We have had different concert performers in the same year to appease racial groups”. In addition, the Student Senate observed a Relational Challenge “Self Segregation in dorms gradually go from light to dark, until you get to D block, which is all Black men-
In terms of ethnicity the Asian Student Focus group reported “Cross Cultural Communication” as a -Relational Challenge- “There was an incident involving Asian students and Black students. We were watching an Asian comedian who makes fun of Asians and one comment on a Chinese word Nagah, which sounded like the “N”-word. The Black students heard it and were offended. It was all miscommunication”.
Student Focus Group Question 6: Identify the groups that appear to be most highly valued on campus. Why do you think this is true?
One macro-theme, macro-trends, themes, and trends emerged. The following groups perceived as most highly valued in descending order in terms of organizations, Greeks (Sororities/ Fraternities) were reported by seven out of thirteen student focus groups Asian, Christian, Jewish, LGBTQA, Student Senate, White Female, and White Male. The reasons they gave was “they have most people involved; do the most on campus; have the most funding; are most known/recognized by the overall college population.
Multicultural Clubs (African American/ Hispanic) reported by three student focus groups as most highly valued, African Caribbean, White Female and Student Senate. African Caribbean reasons, “The minority groups because we hold high leadership positions and contribute to the success of the school... silently valued”. White Female reasons, “The school seems to value multicultural clubs more when it comes to funding”. The Student Senate gave no reason for their choice.
Student Education Team reported by three student focus groups as most highly valued, one Jewish focus group, Student Senate and White Male Students, reasons given all three groups reasons, “because it provides entertainment, it has the most funding and members have influence”.
Environmentalist Groups reported by student focus groups as most highly valued, Asian and Student Senate reasons, “Everyone attending Stockton becomes green, or has green-awareness. I feel they have the greatest impact” and Groups that give back, like Water Watch” respectively.

114
The other Jewish Student focus group reported Sports groups “Athletes” most highly valued. Latino/Hispanic Student focus group reported White organizations most highly valued reasons, “I believe that this is true by just looking at what groups receive more help, financial assistance, and event attendance. Muslim Student focus group reported Jewish and Christian Faith most highly valued, “because we get off on their holiday”.
Student Focus Group Question 7: Identify the groups that appear to be least highly valued on campus. Why do you think this is true?
Several macro-themes, macro-trends, themes, and trends emerged. Most groups with minority status (i.e., out-group social identity status) in terms of representation (numbers) and or perceived level of social power (lack of societal privilege) reported themselves as a group that is least highly valued on campus, with the exception of students with disabilities and Asian students. The pattern was consistent across religion (Jewish and Muslim) and race/ethnicity (people of color) groups.
Groups that identified themselves as least highly valued on campus.
African American Students-Blacks Males and NAACP (Trend); “Black males because they are the hardest for the majority of the student body to relate too”. “NAACP they don’t program, and are not active”.
African Caribbean Minority Status in General- Blacks and, Jews (Trend); “Blacks – because we are very small, and we play against one another making it difficult to achieve many things no matter how involved we are”.
Jewish Students #1 and Jewish Students #2- Jewish Religion/Culture (Theme);
“Hillel it’s valued by the staff and faculty but not the students”. “Religious groups because students are not interested in them”.
Latino/Hispanic Students- Black and Latino/Hispanic Individuals and Organizations (Theme); “Hispanics and Blacks are least valued on this campus. We provide the most for the community and receive the least”.
LGBTQA Students- Women’s Rights Groups (Theme); “Maybe because people don’t understand us”.
Muslim Students -Muslim and Minority Status in General (Trend); “ If anyone going to join the Muslims on the activities, other students will name them terrorists, or

115
think they are with those Muslims terrorist”. “Minority Groups in General they are not represented as much they do not seem to fit the image of an all around American”.
White Female Students (Consisted of mostly Sorority members) - Greeks (Trend); “Greek life may be valued more by students but is less valued by school itself, faculty and staff”.
Groups that identified other groups as least highly valued on campus.
Asian Students-Commuter Students (Theme); “Some commuting students don’t get involved in events, which are sometimes held at night or other inconvenient time”.
Student Senate- Academic clubs (Theme); “Groups that are based around academic majors such as psyche club, Lit Society, or they are mainly ignored”.
Groups reported unique ideas.
• Christian Student focus group • Students with Disabilities focus group • White Male Student focus group
Student Focus Group Question 8: What groups of people do you think are discriminated against at Stockton, and can you give specific examples?
Several macro-themes, macro-trends, themes, and trends emerged. Over sixty percent of student focus groups reported discrimination against their social identity group. LGBTQA, Latino/Hispanic, Christians, Muslims, African Americans; White female and White male focus groups, which also were a vast majority sorority and fraternity members reported that Greeks were discriminated against. Similarly, the Student Senate focus group was a vast majority white student participants’ that reported discrimination towards Whites. Moreover, the Asian and Student Senate focus groups reported discrimination towards students with disabilities. In addition, both Jewish focus groups reported no discrimination of any groups at Stockton. While the African Caribbean and students with disabilities reported unique ideas only.
Student Focus Group Question 9: What three things that must be addressed immediately to make this a more inclusive campus for all people?
Several macro-themes, macro-trends, themes, and trends emerged. Only one of the Jewish focus groups reported a trend that Stockton was already inclusive. All other student social identity groups offered suggestions i.e., themes and trends for more inclusiveness through: Increased, awareness, education, training, diversity,

116
collaboration, interaction all constituencies. Provide opportunities, activities, resources, events, communication, fairness, and support for and across multiple differences such as, race/ethnicity, commuters, students with disabilities, ESL students, LGBTQ students, and Muslim students, in relationship to different other students, staff, faculty and administration.
Student Focus Group Question 10: Are there additional comments you would like to provide? Responses to this question listed below.
The majority of focus groups reported unique ideas to the question, rather than themes and trends that naturally formulated in response to the other focus group questions. There were three exceptions. The Asian student group reported a truth “Stockton is an underestimated college”; The Muslim student group reported a truth “a need to increase awareness about the Muslim religion” and; the white male student group reported a trend that the focus group process was a “Good activity, well done”.
Question 10: Are there additional comments you'd like to provide?
African American
Unique Idea:
Stockton has the ability to become more diverse- The question is who is going to take the torch and carry it
African Caribbean
Unique Ideas (2 Responses)
• Stockton is continuously trying to better understand and educate on diversity but they do need to add more cultural courses
• Stockton is very diverse and should continue not just because of a quota but because they want too
Asian Students
Theme
Underestimated College
• I haven’t heard that much about Stockton. I’m from Central Jersey and one of my professor’s at my old college informed me that Stockton was an underestimated school.
• It had the potential to become a great university or to grow as one.

117
• My opinion of this college is that people do underestimate them. This is a great school. Even though it’s my first semester here as a transfer, I can actually call it my second home.
Christian
Unique Ideas (8 Responses)
• Interaction is important to inclusion. The more people you meet and like the more involved you want to be.
• I agree with many of the things other people said • The simple fact that it’s extremely hard for a small group to get anything done
because they are not “recognized” • Give more opportunities to people and give the younger classes a chance to get
into certain classes. • Should be required for all majors to have a diversity studies • Every major on campus should be offered either online or evenings. • Maybe we should have a counselor assigned to every incoming freshman. It
might be an overwhelming change from high school, so other that preceptors, one should have someone to guide them into getting involved in clubs and other activities.
• Nothing more to add – this focus group was very comprehensive
Jewish
Unique Ideas (5 Responses)
• Diversity seminar to introduce all religions. For example, just outside of the multicultural month, make it a big event that all students must go to. Ethics and morals workshop – the anti-Semitism thought.
• Stockton is a great place. It has helped me grow tremendously. • I think the religious and less “valued” groups should make efforts to reach
people who do not know what those groups are and explain to them what they are about.
• Stockton is already doing a wonderful job but it would help if there was more emphasis that there is a place for all different religions, interest, etc.
• There needs to be more Jewish culture on campus, and more education about Jewish culture so students can learn about Jewish culture.
Jewish
• I think we have touched on everything- I just think it’s a good idea to make other students aware of the different religions and ethnicities around them
Latino/Hispanic
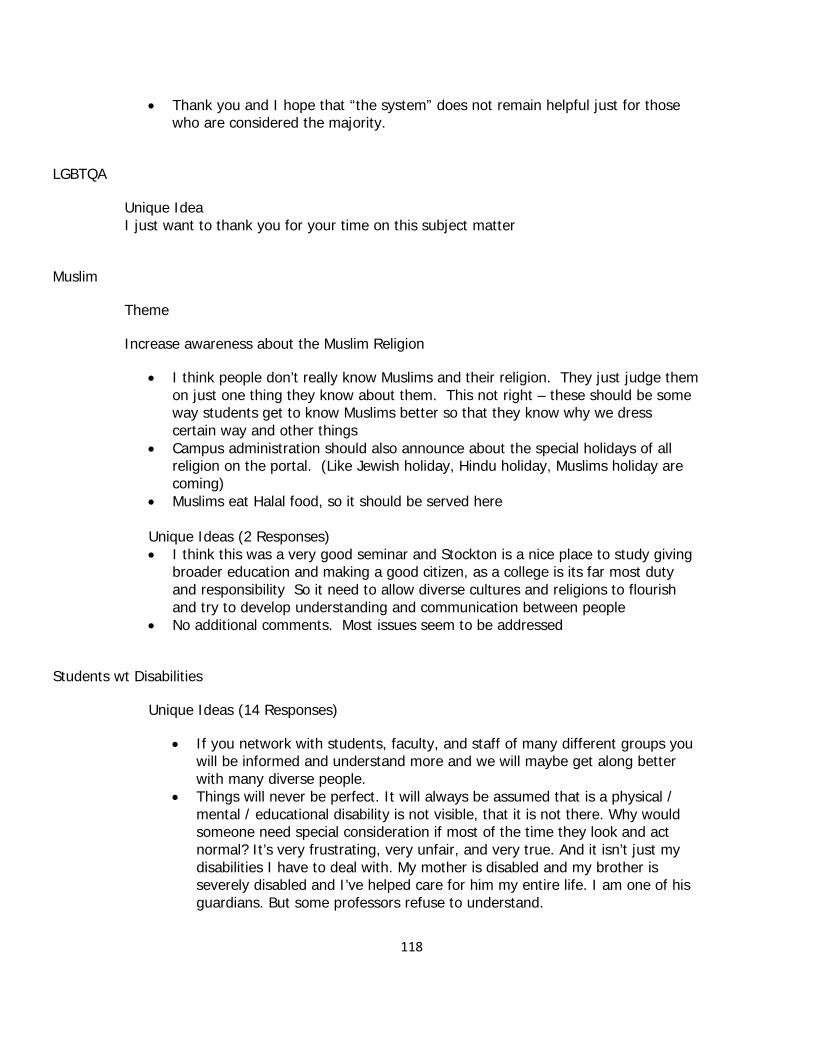
118
• Thank you and I hope that “the system” does not remain helpful just for those who are considered the majority.
LGBTQA
Unique Idea I just want to thank you for your time on this subject matter
Muslim
Theme
Increase awareness about the Muslim Religion
• I think people don’t really know Muslims and their religion. They just judge them on just one thing they know about them. This not right – these should be some way students get to know Muslims better so that they know why we dress certain way and other things
• Campus administration should also announce about the special holidays of all religion on the portal. (Like Jewish holiday, Hindu holiday, Muslims holiday are coming)
• Muslims eat Halal food, so it should be served here Unique Ideas (2 Responses) • I think this was a very good seminar and Stockton is a nice place to study giving
broader education and making a good citizen, as a college is its far most duty and responsibility So it need to allow diverse cultures and religions to flourish and try to develop understanding and communication between people
• No additional comments. Most issues seem to be addressed
Students wt Disabilities
Unique Ideas (14 Responses)
• If you network with students, faculty, and staff of many different groups you will be informed and understand more and we will maybe get along better with many diverse people.
• Things will never be perfect. It will always be assumed that is a physical / mental / educational disability is not visible, that it is not there. Why would someone need special consideration if most of the time they look and act normal? It’s very frustrating, very unfair, and very true. And it isn’t just my disabilities I have to deal with. My mother is disabled and my brother is severely disabled and I’ve helped care for him my entire life. I am one of his guardians. But some professors refuse to understand.
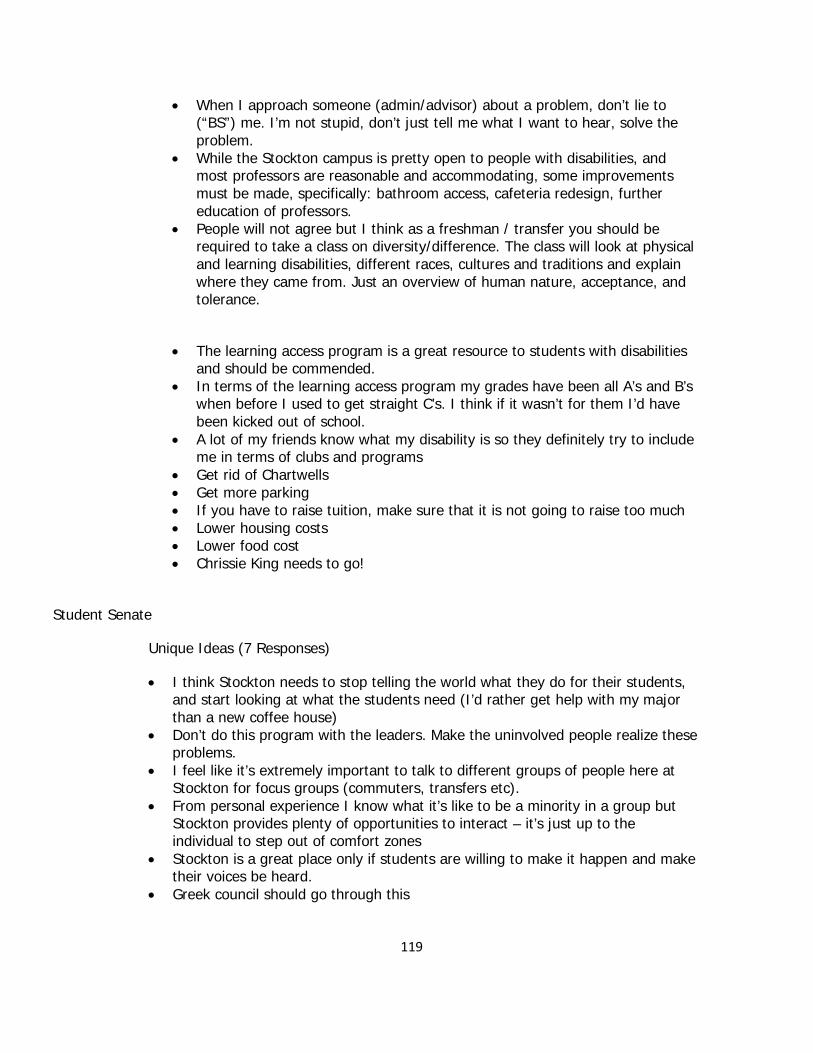
119
• When I approach someone (admin/advisor) about a problem, don’t lie to (“BS”) me. I’m not stupid, don’t just tell me what I want to hear, solve the problem.
• While the Stockton campus is pretty open to people with disabilities, and most professors are reasonable and accommodating, some improvements must be made, specifically: bathroom access, cafeteria redesign, further education of professors.
• People will not agree but I think as a freshman / transfer you should be required to take a class on diversity/difference. The class will look at physical and learning disabilities, different races, cultures and traditions and explain where they came from. Just an overview of human nature, acceptance, and tolerance.
• The learning access program is a great resource to students with disabilities and should be commended.
• In terms of the learning access program my grades have been all A’s and B’s when before I used to get straight C’s. I think if it wasn’t for them I’d have been kicked out of school.
• A lot of my friends know what my disability is so they definitely try to include me in terms of clubs and programs
• Get rid of Chartwells • Get more parking • If you have to raise tuition, make sure that it is not going to raise too much • Lower housing costs • Lower food cost • Chrissie King needs to go!
Student Senate
Unique Ideas (7 Responses)
• I think Stockton needs to stop telling the world what they do for their students, and start looking at what the students need (I’d rather get help with my major than a new coffee house)
• Don’t do this program with the leaders. Make the uninvolved people realize these problems.
• I feel like it’s extremely important to talk to different groups of people here at Stockton for focus groups (commuters, transfers etc).
• From personal experience I know what it’s like to be a minority in a group but Stockton provides plenty of opportunities to interact – it’s just up to the individual to step out of comfort zones
• Stockton is a great place only if students are willing to make it happen and make their voices be heard.
• Greek council should go through this

120
• Stockton is a good school but maturity is a big part of college. Because of the small student body, the immaturity of some is magnified. This is the root of most social flaws here.
White Female
Unique Ideas (6 Responses)
• Before construction of the new college center even began, word spread and everyone knew. So why was nothing said about installing lights on the “nature path?” Is it because there would be opposition? Because at this point, what’s done is done. I came to this school partially for it’s environmental aspects
• I just think that students need to be treated with a little more respect, and like adults, from staff (especially in Bursar’s and Financial Aid)
• For studies like these, let the different clubs and majors know so it’s more than one groups, like sororities, which is important but there are many other groups within the “white females”
• I think we covered everything pretty well • I love the college experience I have had so far. I hope something can be
done to group Stockton students together. Thank you • Stockton is overall a good school and it is what you make of it
White Male
Trend
Good activity, well done
• This activity was a great experience. I got to listen to viewpoints I may not have thought of before.
• This is a very good survey. I felt I could voice my opinions openly without repercussions.
• Well done 44
Unique Ideas (5 Responses)
• I believe we are a diverse campus where not one specific group is discriminated or segregated. People hang out and interact with the people they feel most comfortable with.
• Good safe school • Plenty of ways to get involved • Good education

121
• Although Stockton is very diverse, to myself, I feel as if this school is very close knit and a community

122
APPENDIX E
Targeted Document Observation Review
Institutional data were identified for review. The complete review included numerous
documents many of which are not mentioned here however, those mentioned below
were targeted for in-depth content assessment. The documents reviewed were placed in
observation areas (categories) and assessed for the mission critical value they add for
diversity. The purpose for reviewing organizational documents e.g. policies and practices
is to gain insight into cultural characteristics such the norms, attitudes, and values of the
institution whether these documents optimize or sub-optimize RSCNJ mission regarding
diversity and inclusion. The content assessment of these documents benchmarks the
formal organizational support available in the system for mission critically driven culture
change regarding diversity and inclusion.
Although, higher education is developing models and best practices for diversity and
inclusion, it is still a work in progress with each institution defining diversity and
inclusion for themselves and by region, and accrediting agencies etc. It is challenging to
compare higher education institutions, due to individual uniqueness and variety. “The
unverified nature of the information in the “table below” and unavailability of unbiased
normalization metrics such comparisons are even more difficult. Users should therefore
approach direct institution to institution comparisons with caution and recognize that all
comparisons between institutions are inherently biased (American College & Universities
Presidents Climate Commitment 2008 pg. 1)”. Therefore the documents reviewed were
assessed based on explicit language that indicated a sense of mission critical culture
change for diversity and inclusion in conjunction with and support by “Dimensions of
Campus Diversity and Inclusion Culture: 1. Access and Success, 2. Climate and
Intergroup Relations, 3. Education and Scholarship and 4. Viability and Vitality (Daryl
Smith et, al. 2000 pg. 6)”. See Diversity and Inclusion Rating Descriptions, Observation
Key and Table 1 below.

123
Diversity and Inclusion Descriptions
Consistent (C) – Practices- Policies, Programs, Goals or initiatives that create, enhance
and or sustain institutionalization of diversity and inclusion initiatives. Such initiatives;
programs; policies, practices and outreach efforts, demonstrates institutional
commitment to diversity and inclusion and are integrated into the fabric and culture of
the educational institution and provides mission critical support for diversity and
inclusion in the identified domain. Such practices when employed by colleges and
universities tend to produce positive tangible/measurable results.
Consistent (C*) - If an Observation Area receives a (C*) consistent rating and the
educational institution did not substantiate the existence of such a practice, program,
goals or policy a brief narrative will be provided by Consultant to explicate the reason
for the educational institution receiving a favorable rating in the absence of a formal
initiative. In such cases, the statistical findings from the RSCNJ Work Force Analysis
Data - Access and Success and Students Entering and Graduation Data – Access and
Success must clearly substantiate the constituent rating by demonstrating statistical
progress in the identified category during the observation period (1996 – 2008).
I - Inconsistent - Either the practice, program goal or policy does not exist at the
college as “acknowledged by RSCNJ”, or in its current state the practice, program, goal
or policy has evidenced stagnation or decrease in women and people of color
representation. Alternatively, it is an area, which the college may wish to further clarify
and delineate its efforts or position as it relates to diversity and inclusion. As such,
areas rated (I) should be reviewed by the college to ascertain if the identified item in its
present state is sufficient to support the college’s diversity and inclusion initiatives, and
clearly articulates the college’s level of commitment to diversity and inclusion.
Prohibited by Law As Per RSCNJ - RSCNJ reports that NJ state laws/regulations prohibits the existence of the referenced item (e.g., practices-policies-programs-initiatives and or formal goals) by a state affiliated college/university as it relates to diversity and inclusion.
While diversity addresses many dimensions of difference other than race, ethnicity,
gender and age, statistical information on those dimensions is readily accessible. It will
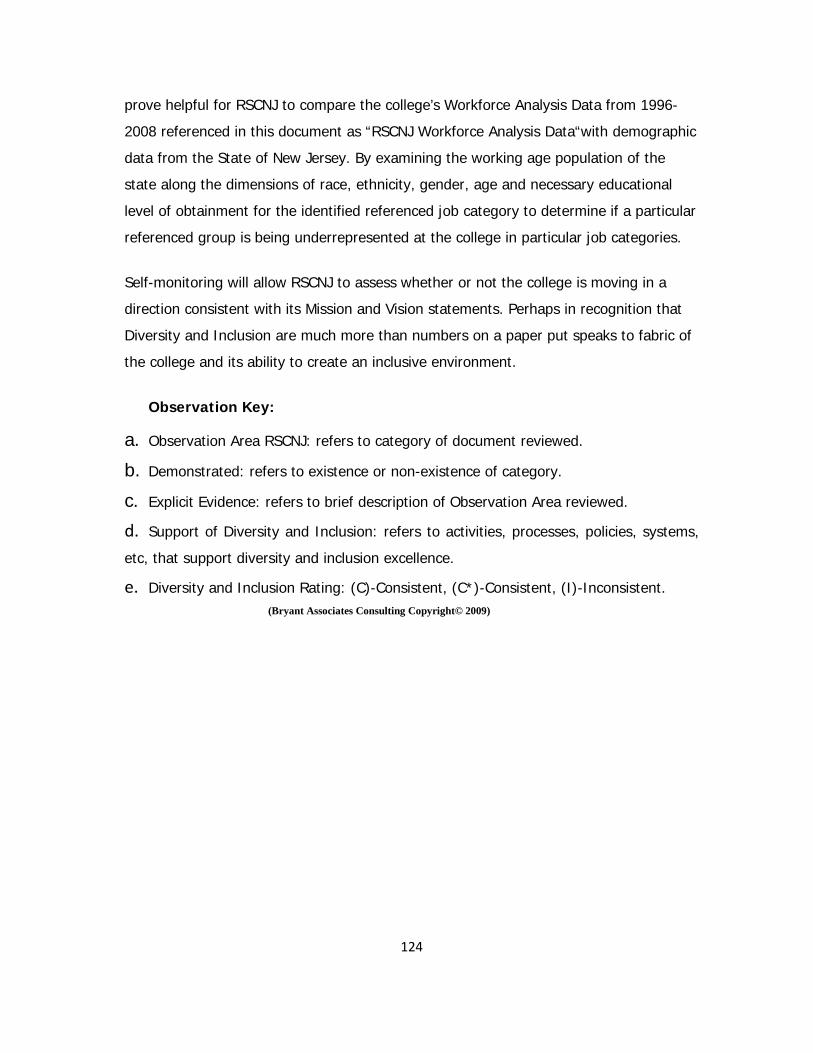
124
prove helpful for RSCNJ to compare the college’s Workforce Analysis Data from 1996-
2008 referenced in this document as “RSCNJ Workforce Analysis Data“with demographic
data from the State of New Jersey. By examining the working age population of the
state along the dimensions of race, ethnicity, gender, age and necessary educational
level of obtainment for the identified referenced job category to determine if a particular
referenced group is being underrepresented at the college in particular job categories.
Self-monitoring will allow RSCNJ to assess whether or not the college is moving in a
direction consistent with its Mission and Vision statements. Perhaps in recognition that
Diversity and Inclusion are much more than numbers on a paper put speaks to fabric of
the college and its ability to create an inclusive environment.
Observation Key:
a. Observation Area RSCNJ: refers to category of document reviewed.
b. Demonstrated: refers to existence or non-existence of category.
c. Explicit Evidence: refers to brief description of Observation Area reviewed.
d. Support of Diversity and Inclusion: refers to activities, processes, policies, systems,
etc, that support diversity and inclusion excellence.
e. Diversity and Inclusion Rating: (C)-Consistent, (C*)-Consistent, (I)-Inconsistent. (Bryant Associates Consulting Copyright© 2009)

125
a. b. c. d. e.
Observation Area RSCNJ- Areas, which have been identified by Best Practices as important in diversity and inclusion; cultural change efforts in institutions of higher education (i.e., colleges and or universities).
Demonstrated- (YES) Written documents were provided by the educational institution, which provides a narrative description of the (a.) Observation Area (i.e., the practice, program, policy or goals).
(NO) Indicates that the educational institution did not substantiate the existence of such a practice, program, policy or goal at this educational institution or RSCNJ has informed the Consultants that NJ Law prohibits the college from such practices, programs, policies, goals or initiatives. In instances in which RSCNJ has reported to the Consultants that a practice is prohibited by NJ law it will be noted in the (NO) column.
Please note a (YES) or (NO) notation does not speak to the quality of such an initiative it only references the existence or non-existence and documentation thereof.
Explicit Evidence- Identifies specifically what document(s) were reviewed and information which may prove helpful to the reader in understanding rating description (e.) of this document.
No clear references -indicates that documentation reviewed does not allow a definitive statement to be made in reference to the particular category under review. In such a case, the college is encouraged to review the observation area to determine if the goals of diversity and inclusion are being supported in this “Observation Area”.
Support of Diversity and Inclusion– Practices, policies, programs, goals or initiatives create /enhance and or support diversity and inclusion change process. Such practices when employed by colleges and universities tend to produce positive tangible and measurable results.
.
Diversity and Inclusion Rating- Consistent (C) – Practices- policies, programs, goals or initiatives that create, enhance and or sustain institutionalization of diversity and inclusion initiatives. Such initiatives; programs; policies, practices and outreach efforts, demonstrates institutional commitment to diversity and inclusion and are integrated into the fabric and culture of the educational institution and provides mission critical support for diversity and inclusion in the identified Observation Area. Such practices when employed by colleges and universities tend to produce positive tangible/measurable results.
Consistent (C*)- If an Observation Area receives a (C*) consistent rating and the educational institution did not substantiate the existence of such a practice, program, goals or policy a brief narrative will be provided by Consultant to explicate the reason for the educational institution receiving a favorable rating in the absence of a formal initiative. In such cases, the statistical findings from the RSCNJ Work Force Analysis Data - Access and Success and Students Entering and Graduation Data – Access and Success must clearly substantiate the constituent rating by demonstrating statistical progress in the identified area during the observation period (1996 – 2008).
I - Inconsistent-Either the practice, program goal or policy does not exist at the college as “acknowledged by RSCNJ”, or in its current state the practice, program, goal or policy has evidenced stagnation or decrease in women and or people of color representation. Alternatively, it is an area, which the college may wish to further clarify and delineate its efforts or position as it relates to diversity and inclusion. As such, areas rated (I) should be reviewed by the college to ascertain if the identified item in its present state is sufficient to support the college’s diversity and inclusion initiatives, and clearly articulate and or demonstrates the college’s level of commitment to diversity and inclusion.
(Bryant Associates Consulting Copyright© 2009)

126
Table 7
a. b. c. d. e.
Observation Area RSCNJ Demonstrated
Explicit Evidence
Support of Diversity and Inclusion
Support of Diversity and Inclusion Rating
I - inconsistent
C- consistent
C * consistent
Yes No Yes No
College Vision/Mission Statements- Viability and Vitality
1. Vision Statement X No References X I
2. Vision and Goals for 2010-2020
X Eight priority areas-1 reference-priority area seven (affordability)
X I
3. MS- College Wide X Explicit Evidence X C
4. MS-Graduate Programs X 1 unclear reference X I
5. MS-(CCDEAA) X Explicit Evidence X C
Office of President- Web Page - Viability and Vitality
1. Message from the President X Explicit Evidence X C
2. Principles of Ethical Code (NJ-State)
X No References NA-(NJ-State)
NA-(NJ-State)
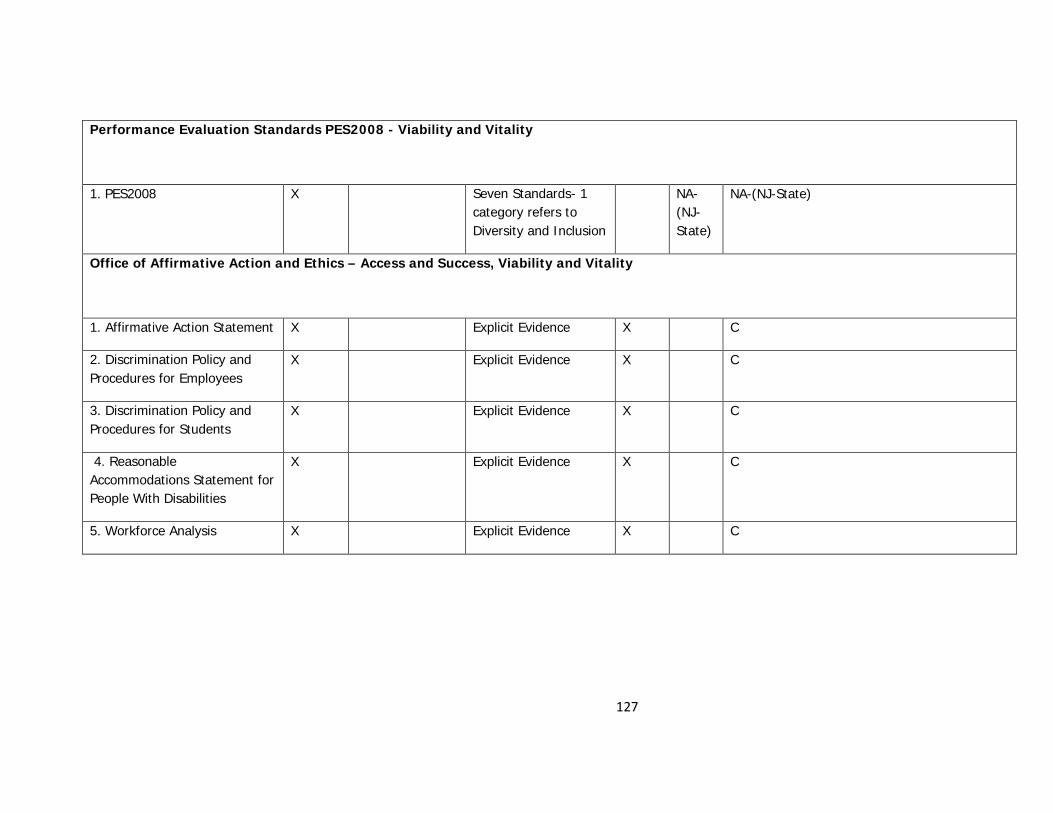
127
Performance Evaluation Standards PES2008 - Viability and Vitality
1. PES2008 X Seven Standards- 1 category refers to Diversity and Inclusion
NA-(NJ-State)
NA-(NJ-State)
Office of Affirmative Action and Ethics – Access and Success, Viability and Vitality
1. Affirmative Action Statement X Explicit Evidence X C
2. Discrimination Policy and Procedures for Employees
X Explicit Evidence X C
3. Discrimination Policy and Procedures for Students
X Explicit Evidence X C
4. Reasonable Accommodations Statement for People With Disabilities
X Explicit Evidence X C
5. Workforce Analysis X Explicit Evidence X C
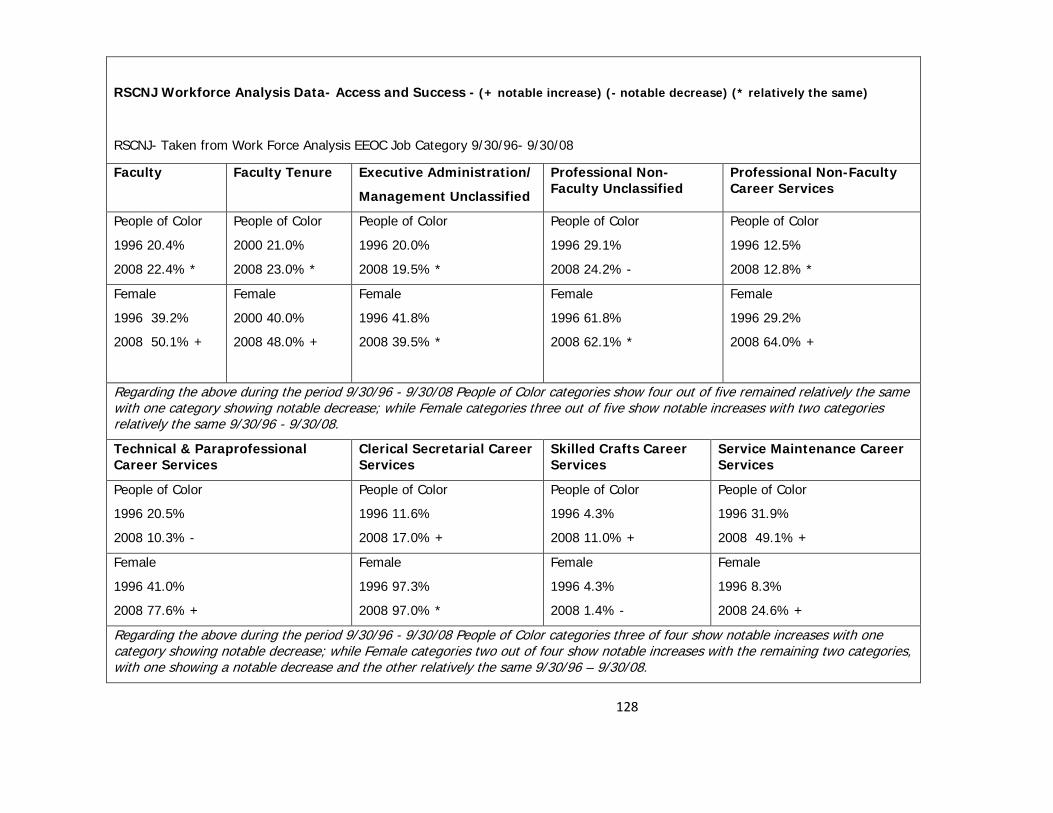
128
RSCNJ Workforce Analysis Data- Access and Success - (+ notable increase) (- notable decrease) (* relatively the same)
RSCNJ- Taken from Work Force Analysis EEOC Job Category 9/30/96- 9/30/08
Faculty
Faculty Tenure Executive Administration/
Management Unclassified
Professional Non-Faculty Unclassified
Professional Non-Faculty Career Services
People of Color
1996 20.4%
2008 22.4% *
People of Color
2000 21.0%
2008 23.0% *
People of Color
1996 20.0%
2008 19.5% *
People of Color
1996 29.1%
2008 24.2% -
People of Color
1996 12.5%
2008 12.8% *
Female
1996 39.2%
2008 50.1% +
Female
2000 40.0%
2008 48.0% +
Female
1996 41.8%
2008 39.5% *
Female
1996 61.8%
2008 62.1% *
Female
1996 29.2%
2008 64.0% +
Regarding the above during the period 9/30/96 - 9/30/08 People of Color categories show four out of five remained relatively the same with one category showing notable decrease; while Female categories three out of five show notable increases with two categories relatively the same 9/30/96 - 9/30/08.
Technical & Paraprofessional Career Services
Clerical Secretarial Career Services
Skilled Crafts Career Services
Service Maintenance Career Services
People of Color
1996 20.5%
2008 10.3% -
People of Color
1996 11.6%
2008 17.0% +
People of Color
1996 4.3%
2008 11.0% +
People of Color
1996 31.9%
2008 49.1% +
Female
1996 41.0%
2008 77.6% +
Female
1996 97.3%
2008 97.0% *
Female
1996 4.3%
2008 1.4% -
Female
1996 8.3%
2008 24.6% +
Regarding the above during the period 9/30/96 - 9/30/08 People of Color categories three of four show notable increases with one category showing notable decrease; while Female categories two out of four show notable increases with the remaining two categories, with one showing a notable decrease and the other relatively the same 9/30/96 – 9/30/08.

129
a. b. c. d. e.
Observation Area RSCNJ Demonstrated Explicit Evidence
Support of Diversity and Inclusion
Support of Diversity and Inclusion Rating
I – inconsistent
C- consistent
C * consistent
YES NO YES NO
Recruitment Faculty – Access and Success
1. Formal People of Color Faculty Recruitment Program/Goals
Prohibited by New Jersey State Law as per RSCNJ
No Clear References X I
2. Formal Female Faculty Recruitment Program/Goals
Prohibited by New Jersey State Law as per RSCNJ
Female
1996 39.2%
2008 50.1% +
X C *- Although there is no Formal Recruitment Program for Female Faculty RSCNJ has demonstrated consistent efforts in this Observation Area as evidenced by the workforce analysis data. RSCNJ has demonstrated excellence in this area by sustaining an environment that attracts and supports female faculty. Such practices when employed tend to produce positive sustainable/ measurable results as evidenced by the RSCNJ Workforce Analysis Data- Access and Success (1996-2008).
Retention Faculty – Access and Success
1. Mentor Programs for People of Color Faculty
Prohibited by New Jersey State Law as per RSCNJ
No Clear References X I
2. Mentor Programs for Female Faculty
Prohibited by New Jersey State Law as per RSCNJ
No Clear References X I
3. People of Color Tenure Data Analysis and Goals
Prohibited by New Jersey State Law as per RSCNJ
No Clear References X I
4. Female Tenure Data Analysis and Goals
Prohibited by New Jersey State Law as per RSCNJ
Female
2000 40.0%
2008 48.0% +
X C* - Although there are no formal goals related to Tenure of Female Faculty The college has demonstrated consistent (i.e., outstanding) efforts in this area as evidenced by the RSCNJ Work Force Analysis Data - Access and Success (1996-2008
5. New Faculty Mentoring X X C

130
Recruitment Executive Administration/Management Unclassified - Access and Success
1. People of Color Recruitment Program
Prohibited by New Jersey State Law as per RSCNJ
No Clear References X I
2. Female Recruitment Program Prohibited by New Jersey State Law as per RSCNJ
Female
1996 41.8%
2008 39.5% *
X C* - Although there are no formal goals related to recruitment of Females for Executive Administration Management /Unclassified positions the college has demonstrated consistent efforts in this area as evidenced by the RSCNJ Workforce Analysis Data- Access and Success (1996-2008).
Recruitment Professional Non-Faculty Unclassified - Access and Success
1. People of Color Recruitment Program
Prohibited by New Jersey State Law as per RSCNJ
No Clear References
X I
2. Female Recruitment Program Prohibited by New Jersey State Law as per RSCNJ
Female
1996 61.8%
2008 62.1% *
X C *- Although there is no formal recruitment program designed to attract Female Professional Non-Faculty Career Services employees the college has demonstrated outstanding efforts in this area as evidenced by the RSCNJ Workforce Analysis Data- Access and Success (1996-2008).
Recruitment Professional Non-Faculty Career Services - Access and Success
1. People of Color Recruitment Program
Prohibited by New Jersey State Law as per RSCNJ
No Clear References X I
2. Female Recruitment Program Prohibited by New Jersey State Law as per RSCNJ
Female
1996 29.2%
2008 64.0% +
X C *- Although there is no formal recruitment program designed to attract Female Recruitment Professional Non-Faculty Career Services employees the college has demonstrated outstanding efforts in this area as evidenced by the RSCNJ Workforce Analysis Data- Access and Success (1996-2008).
Recruitment Technical & Paraprofessional Career Services - Access and Success
1. People of Color Recruitment Program
Prohibited by NewJersey State Law as per RSCNJ
People of Color
1996 20.5%
2008 10.3% -
X I
2. Female Recruitment Program Prohibited by New Jersey State Law as per RSCNJ
Female
1996 41.0%
2008 77.6% +
X C *- Although there is no formal female recruitment program designed to attract Female Technical and Paraprofessionals Career Service employees the college has demonstrated outstanding efforts in this area as evidenced by the RSCNJ Workforce Analysis Data- Access and Success (1996-2008).

131
Recruitment Clerical Secretarial Career Services - Access and Success
1. People of Color Recruitment Program
Prohibited by New
Jersey State Law as per RSCNJ
People of Color
1996 11.6%
2008 17.0% +
X C *- Although there is no formal recruitment program designed to attract People of Color Clerical Secretarial Career Service employees the college has demonstrated consistent efforts in this area as evidenced by the RSCNJ Workforce Analysis Data- Access and Success (1996-2008).
2. Female Recruitment Program
Prohibited by New
Jersey State Law as per RSCNJ
Female
1996 97.3%
2008 97.0% *
X
C *- Although there is no formal recruitment program designed to attract Female Clerical Secretarial Career Service employees the college has demonstrated consistent efforts in this area as evidenced by the RSCNJ Workforce Analysis Data- Access and Success (1996-2008). Perhaps recruitment efforts directed more toward males would increase diversity in this job category, as this category tends to be female dominated.
Recruitment Skilled Crafts Career Services - - Access and Success
1. People of Color Recruitment Program
Prohibited by New
Jersey State Law as per RSCNJ
People of Color
1996 4.3%
2008 11.0% +
X C *- Although there is no formal recruitment program designed to attract People of Color Skilled Crafts Career Service employees the college has demonstrated consistent efforts in this area as evidenced by the RSCNJ Workforce Analysis Data- Access and Success (1996-2008).
2. Female Recruitment Program Prohibited by New
Jersey State Law as per RSCNJ
Female
4.3%
1.4% -
X I

132
Recruitment Service Maintenance Career Services - - Access and Success
1. People of Color Recruitment Program
Prohibited by New
Jersey State Law as per RSCNJ
People of Color
1996 31.9%
2008 49.1% +
X C *- Although there is no formal recruitment program designed to attract People of Color Maintenance employees the college has demonstrated consistent efforts in this area as evidenced by the RSCNJ Workforce Analysis Data- Access and Success (1996-2008).
1. Female Recruitment Program Prohibited by New
Jersey State Law as per RSCNJ
Female
1996 8.3%
2008 24.6% +
X C *- Although there is no formal recruitment program designed to attract Female Maintenance employees the college has demonstrated consistent efforts in this area as evidenced by the RSCNJ Workforce Analysis Data- Access and Success (1996-2008).
Professional Development and Training -Access and Success
1. New Hire Orientation Includes Some Form of Diversity and Inclusion Training
X No clear references
Affirmative Action Statement Provided During Orientation
X I
2. Tuition Remission for Staff X Explicit Evidence X C
3. Diversity and Inclusion Training X No clear references X I

133
Students Entering and Graduation Data- Access and Success
Comparing 1996 with 2008 (+ notable increase) (- notable decrease) (* relatively the same) not applied to (American Indian or Alaska
Native, Non – Specific and Other) social group categories RSCNJ-Data as reported by IPEDS GRS 9/30/96-9/30/08
Entering #
Class 96’
Graduation %
Class 96’
Entering #
Class 02’
Graduation %
Class 02’
Entering #
Class 08’
Graduation % Class 08’
American Indian or Alaska
Native
1 0% 2 100% 2 100%
Asian Pacific Islander 43 62.5% 25 52.2% 41* 52% -
Black - non Hispanic 63 52.4% 50 50% 69* 51%*
Hispanic 38 50% 45 55.6% 63 + 57% +
White - non Hispanic 555 64.4% 677 66% 643 + 67% *
Non – Specific ///////////// ////////////////// /////////////// ////////////////// 22 ///////////////////
Other ///////////// ///////////////// /////////////// ////////////////// 2 ///////////////////
Total
705 Mean 62.5 799 Mean 64.6 847 Mean 65

134
a. b.
c. d. e.
Observation Area RSCNJ Demonstrated Explicit Evidence
Support of Diversity and Inclusion
Support of Diversity and Inclusion Rating I - inconsistent C- consistent C * consistent YES NO YES NO
Recruitment Students- Access and Success
1. Students of Color Recruitment Program
X Explicit Evidence X C *- Although there are no formal recruitment programs or goals designed to attract Students of Color the college has demonstrated consistent efforts in this Observation Area as evidenced by the recruiting locations. However this area could benefit from more focused attention.
2. Formal People of Color Recruitment and Retention Goals
X
1998-Initial Cohort Caucasian Students 80.2% -------------- 2008 Initial Cohort Caucasian Students 76%
X
I
Retention Students - Access and Success 1. Support programs for Students of Color
X No Clear References
X
I
2. First Generation College Students X Explicit Evidence X C
3. Low Income COS X Explicit Evidence X C 4. Support Programs for Students With Disabilities Instructional Strategies and Services
X
Explicit Evidence X C
5. Accommodations: Building ingress/egress ease of access to dining halls, laboratories, etc
X Explicit Evidence X C – Although this Observation Area is consistent with diversity and inclusion, this area could benefit from more focused attention.
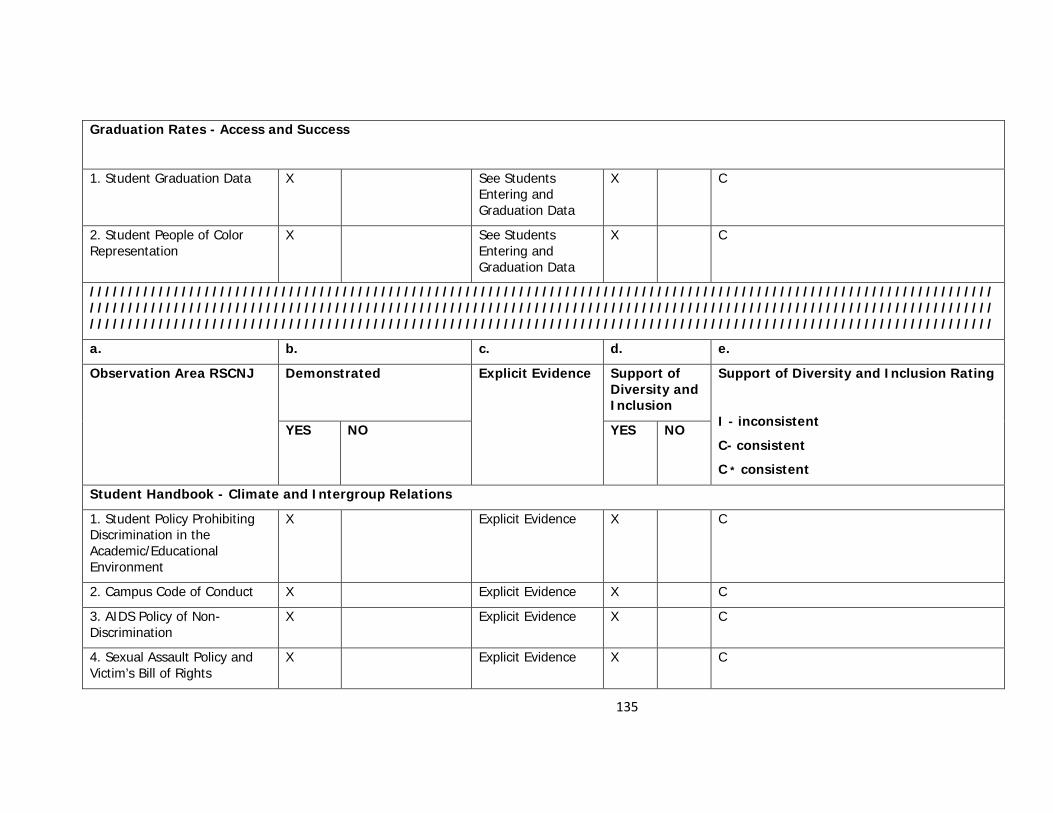
135
Graduation Rates - Access and Success
1. Student Graduation Data X See Students Entering and Graduation Data
X C
2. Student People of Color Representation
X See Students Entering and Graduation Data
X C
//////////////////////////////////////////////////////////////////////////////////////////////////////////////////////////////////////////////////////////////////////////////////////////////////////////////////////////////////////////////////////////////////////////////////////////////////////////////////////////////////////////////////////////////////
a. b. c. d. e.
Observation Area RSCNJ Demonstrated
Explicit Evidence Support of Diversity and Inclusion
Support of Diversity and Inclusion Rating
I - inconsistent
C- consistent
C * consistent
YES NO YES NO
Student Handbook - Climate and Intergroup Relations
1. Student Policy Prohibiting Discrimination in the Academic/Educational Environment
X Explicit Evidence X C
2. Campus Code of Conduct X Explicit Evidence X C
3. AIDS Policy of Non-Discrimination
X Explicit Evidence X C
4. Sexual Assault Policy and Victim’s Bill of Rights
X Explicit Evidence X C

136
Student Development - Climate and Intergroup Relations
1. STUDENT MANUAL FOR ORGANIZATIONS 2008-09
X One mention - “Establishing a New Organization” has 1 reference (anti-discrimination statement)
“Characteristics of a Good Organization at RSCNJ” - no clear reference
X I
2. Clubs and Organizations – Office of Student Development webpage
X 104 clubs and organizations in total
X C
3. Living Learning Communities
X One of the four is called Diversity. Clear mission statement, least number of activities listed in spring (3 vs. 6, 10, and 12 for other communities)
X I
4. Office of Multicultural Affairs
X No Clear References
X I

137
a. b. c. d. e.
Observation Area RSCNJ Demonstrated
Explicit Evidence Support of Diversity and Inclusion
Support of Diversity and Inclusion Rating
I - inconsistent
C- consistent
C * consistent
Curriculum Diversity and Inclusion Titles - Education and Scholarship
*See Paragraph in Summary of Document Review
X Explicit Evidence X C
Campus Safety
1 Mission Statement X Explicit Evidence X C

138
APPENDIX F
DEFINITIONS: CULTURAL DIVERSITY SUBSCALES (Bryant Associates Consulting Copyright© 2009)
Campus Climate: Measures how comfortable students and or employees feel on campus. Do
students and or employees experience a sense of belonging? Do they feel that they are valued
as a part of the RSCNJ community? Miller and Katz (2002) define a sense of belonging as
“Feeling respected, valued and seen for who we are as individuals” (p.1). Higher scores on this
scale are indicative of greater agreement that there is a negative climate at the college.
Cultural Sensitivity in College Policies and Practices: As the college continues to
diversify, are policies, practices, curriculum and support services reflective of the diversity of
students and employees? Higher scores on this scale are are indicative of greater agreement
that the college is culturally sensitive in its policies and practices.
Engagement In Corrective Behaviors: This domain seeks to make tangible what is often
more abstract by moving from thoughts and feelings into measures of behavior by asking
questions which require the individual to make a self- assessment of what behaviors they are
likely to exhibit. When or if conformed with negative comments directed towards their own
group and or other social identity groups different from them. Higher scores on this scale are
indicative of greater frequency in which one speaks up to counter negative comments made
about different groups.
Perception of Fairness: As measured by the students and or employees perception that
students and or employees are fairly treaded by the college regardless of his or her sexual
orientation, racial, ethnic, or religious background. This domain measures the individual’s sense
of how fairly people are treated at the college. Higher scores on this scale are indicative of
greater perceptions of fairness.
Exposure to Negative Comments: Specifically is RSCNJ an environment in which mutual
respect is shown for all groups? What are the norms and values on campus related to respect
for others as measured by how often one hears or is exposed to disparaging remarks (e.g.

139
jokes or negative comments) related to racial/ ethnicity , gender, sexual orientation, dialect,
age, economic status or disability etc. High scores on this scale are indicative of frequent
exposure to negative comments at RSCNJ.
Perceived Influence of Personal Characteristics on Self and Others: Seeks to explore
the individual’s perception of self. Specifically does ones’ social identity group membership
influence how one experiences RSCNJ? Higher scores on this scale are indicative of greater
agreement that their personal characteristics are influential on their own self-perception and
how others perceive them.

140
APPENDIX G
CULTURAL DIVERSITY SURVEY
Cultural Diversity Survey 2008-09
You are invited to complete this survey being conducted by an independent consulting firm,
Bryant Associates, about the status of diversity matters at Stockton. By doing so, you will help
the College to determine how closely we are putting our diversity standards into practice.
Please answer by clicking on the options that best describe you, your affiliation, identification, or
position. There are no tracking capabilities for the responses, so your answers are anonymous.
By completing this survey, you are acknowledging your consent to participate in research. Your
participation is completely voluntary and there are no possibilities for adverse consequences for
non-participation or partial participation.
Should you need technical assistance, please call the Stockton Help Desk: 609.652.4309.
Thank you very much!

141
Cultural Diversity Survey (Bryant Associates Consulting Copyright© 2009) 1. Please select the college group that best describes you. _____ Student _____ Part-time Faculty _____ Full-time Faculty _____ Administration _____ Staff 2. Please indicate your housing status. _____ On campus _____ Off campus (not living with family) _____ Commuter (living with family) 3. What is your student level? _____ Undergraduate _____ Graduate _____ Post-Baccalaureate _____ Non-Matriculated 4. How long have you worked at Stockton? _____ Less that 1 year _____ Between 9 and 14 years _____ Between 1 and 3 years _____ Between 15 and 20 years _____ Between 4 and 8 years _____ More than 20 years 5. What is your highest level of education? _____ Less than high school diploma _____ Bachelors degree _____ High school diploma _____ Masters degree _____ Associate degree _____ Doctorate or Professional Degree 6. Please indicate your age range. _____ Under 21 _____ 34 - 41 _____ 21- 25 _____ 42 - 55 _____ 26 - 33 _____ Over 55 7. Please indicate your gender. _____ Female _____ Male _____ Transgender _____ None of the above

142
8. Please indicate your sexual orientation. _____ Bisexual _____ Lesbian _____ Gay _____ Queer _____ Heterosexual _____ Questioning 9. How do you identify yourself racially and/or ethnically? (Check the one that BEST describes you)? _____ African American _____ African/Caribbean _____ Latino(a), Hispanic _____ Multiracial or multiethnic _____ American Indian or other native American _____ White _____ Asian American, Native Hawaiian, or Pacific Islander _____ Asian _____ I don’t identify with any of these categories 10. What is your religious or spiritual affiliation? (Check the one that BEST describes it). _____ Agnostic _____ Atheist _____ Buddhist _____ Christian _____ Hindu _____ Muslim _____ Jewish _____ I don’t identify with any of these categories 11. Do you have a disability? _____ Yes _____ No 12. How would you characterize your disability? _____ Cognitive _____ Physical _____ Psychological _____ Multiple _____ Other
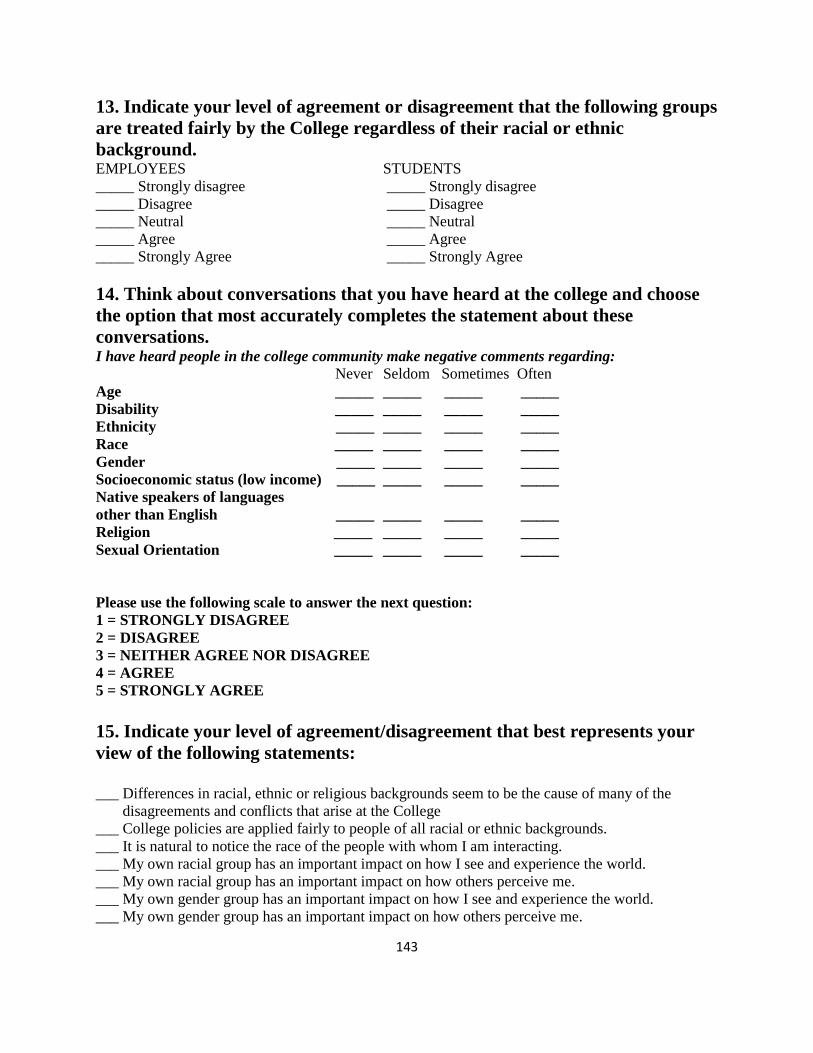
143
13. Indicate your level of agreement or disagreement that the following groups are treated fairly by the College regardless of their racial or ethnic background. EMPLOYEES STUDENTS _____ Strongly disagree _____ Strongly disagree _____ Disagree _____ Disagree _____ Neutral _____ Neutral _____ Agree _____ Agree _____ Strongly Agree _____ Strongly Agree 14. Think about conversations that you have heard at the college and choose the option that most accurately completes the statement about these conversations. I have heard people in the college community make negative comments regarding:
Never Seldom Sometimes Often Age _____ _____ _____ _____ Disability _____ _____ _____ _____ Ethnicity _____ _____ _____ _____ Race _____ _____ _____ _____ Gender _____ _____ _____ _____ Socioeconomic status (low income) _____ _____ _____ _____ Native speakers of languages other than English _____ _____ _____ _____ Religion _____ _____ _____ _____ Sexual Orientation _____ _____ _____ _____ Please use the following scale to answer the next question: 1 = STRONGLY DISAGREE 2 = DISAGREE 3 = NEITHER AGREE NOR DISAGREE 4 = AGREE 5 = STRONGLY AGREE 15. Indicate your level of agreement/disagreement that best represents your view of the following statements: ___ Differences in racial, ethnic or religious backgrounds seem to be the cause of many of the disagreements and conflicts that arise at the College ___ College policies are applied fairly to people of all racial or ethnic backgrounds. ___ It is natural to notice the race of the people with whom I am interacting. ___ My own racial group has an important impact on how I see and experience the world. ___ My own racial group has an important impact on how others perceive me. ___ My own gender group has an important impact on how I see and experience the world. ___ My own gender group has an important impact on how others perceive me.

144
___ The College has adequate and appropriate support services for lesbian, gay, bisexual, queer, and transgender STUDENTS. ___ The College has adequate and appropriate support services for lesbian, gay, bisexual, queer and transgender EMPLOYEES. ___ The College does a good job of providing activities and avenues of expression for students of diverse backgrounds. ___ I am reluctant to address conflicts or disagreements with people from racial and ethnic groups different from my own. ___ Because of their race, people of color have additional advantages at the College. ___ Because of their race, white people have additional advantages at the College ___ I feel like an outsider in the college community. ___ The college curriculum reflects the experiences of diverse cultural groups. ___ It is important that the college community reflect the diversity of the surrounding geographical area. ___ People in the college community spend too much time talking about their differences, rather than focusing on what we have in common. 16. How often do you speak up to counter a negative comment made regarding the following:
Never Seldom Sometimes Often Always Disability _____ ______ ______ _____ _____ Ethnicity _____ ______ ______ _____ _____ Race _____ ______ ______ _____ _____ Gender _____ ______ ______ _____ _____ Socioeconomic status (low income) _____ ______ ______ _____ _____ Native speakers of languages other than English _____ ______ ______ _____ _____ Religious beliefs and practices _____ ______ ______ _____ _____ Sexual orientation _____ ______ ______ _____ _____ Someone being too young _____ ______ ______ _____ _____ Someone being too old _____ ______ ______ _____ _____