rights / license: research collection in copyright - non ... assumptionthat thebest alignmenthas the...
TRANSCRIPT

Research Collection
Doctoral Thesis
Nearly neutral evolutionary distancea new dating tool and its applications
Author(s): Caraco, Matthias Daniel
Publication Date: 2002
Permanent Link: https://doi.org/10.3929/ethz-a-004377606
Rights / License: In Copyright - Non-Commercial Use Permitted
This page was generated automatically upon download from the ETH Zurich Research Collection. For moreinformation please consult the Terms of use.
ETH Library

Diss. ETH No. 14437
Nearly Neutral Evolutionary Distance:
A new dating tool and its applications
A dissertation submitted to the
SWISS FEDERAL INSTITUTE OF TECHNOLOGY
ZURICH
for the degree of
Doctor of Natural Sciences
presented byMATTHIAS DANIEL CARACO
dipl. chem. ETH
born February 14, 1968
citizen of Basel, Basel-Stadt
accepted on the recommendation of
Prof. G. Folkers, examiner
Prof. S. A. Benner, co-examiner
2002
1
Acknowledgments
I would like to thank
• My Boss Steven Benner for giving me the opportunity to develop new skills and for
the help he provided me in realizing this work.
• My dear wife Sophie for her patience and love that helped me finally finish this
work after all.
• EraGen Biosciences Inc. for their generosity to let me use their data, software and
infrastructure.
• Steve Chamberlin and Sridharg Govindarajan for their help when I really needed it.
• Barbara and René for supporting me all these years.
• Corsin for the generosity to harbor me every year.
11
Abstract
The development of a tool that can correlate the change in genomic sequences with ge¬
ological time is the central goal of this dissertation work. Here, a very narrow sampleof silent substitution in coding regions of genes has been examined. This considers only
transitions (pyrimidine to pyrimidine, or purine to purine) at the third position of two fold
redundant coding systems, where the encoded amino acid is conserved. This gives rise
to 7*2 values, the fraction of such sites that are conserved relative to the total number of
such sites. The rate constants for transitions at such sites has been found to be remark¬
ably constant (within a factor of two) in vertebrate lineages, and useful for correlating
paleontology and genomics. Further, the f2 values can be transformed into a distance
measurement by assuming an exponential approach to equilibrium in these sites. This is
given the name: the "Nearly Neutral Evolutionary Distance", or N2ED.
The N2EDhas been shown to be suitable for dating events in the vertebrate genome
record, and correlating these with events in the paleontological record. Further, the
N2 EDdates chronologically order duplications within a single genome, duplications that
create paralogs. The resulting time-ordered duplication events prove to be useful in de¬
tecting genes that operate together in pathways. In the yeast genome, in particular, events
leading to the origin of the fermentation pathway are contemporaneous, and contempo¬
raneous with the emergence of fermentable fruits. In the human genome, the dating tool
correlates events in the paleontological record at the time of the great Oligocène cool¬
ing with duplications in the human genome related to higher order neurobiology. In the
pig genome within the aromatase family, N2EDdates provide a high level annotation.
Thus, the N2 EDvalues provide a surprisingly useful bioinformatics tool when approach¬
ing many of the problems in contemporary genomics and proteomics.
Ill
Zusammenfassung
Die Entwicklung eines Werkzeugs, das Änderungen in genetischen Sequenzen mit ge¬
ologischer Zeit korrelieren kann, ist der zentrale Punkt dieser Dissertation. Dazu wurde
ein kleiner Anteil der stillen Mutationen in den codierenden Regionen von Genen unter¬
sucht. Es wurden nur Transitionen (Pyrimidin zu Pyrimidin, oder Purin zu Purin) in der
dritten Position von zweifach-redundanten Codonsystemen in Betracht gezogen, wobei
die codierte Aminosäure konserviert sein muss. Dies ergibt /VWerte, das Verhältnis von
derartigen Positionen mit konserviertem Codon zu derartigen Positionen insgesamt. Die
Geschwindigkeitskonstante der Transitionen an solchen Positionen ist innerhalb der ver-
tebrata erstaunlich konstant (Innerhalb eines Faktors von 2), und kann deshalb zur Ko¬
rrelierung von Paläontologie mit Genetik herbeigezogen werden. Im weiteren können
die /2-Werte zur Distanzmessung herbeigezogen werden unter Annahme einer expo-
nentiellen Annäherung an das Gleichgewicht derartiger Positionen. Wir nennen dies
"Quasi-Neutrale Evolutionäre Distanz" (Nearly Neutral Evolutionary Distance), oder
kurz N*ED.
Es hat sich erwiesen, dass N2 ED-Werte Ereignisse in den vertebrata-Genen datieren
und diese Ereignisse mit paläontologischen Ereignissen korrelieren können. Im weiteren
können NsED's Duplikationen innerhalb eines Genoms, welche zu Paralogen führen,
chronologisch ordnen. Diese Reihenfolge von Duplikationen hat sich als nützlich er¬
wiesen beim Erkennen von Genen, welche in Stoffwechselwegen kooperieren. Im
Speziellen hat sich bei der Analyse des Hefe-Genoms gezeigt, dass sich die Fruchtfer¬
mentation zeitgleich mit dem Erscheinen von Früchten entwickelte. Bei der Analysedes menschlichen Genoms konnten Ereignisse zur Zeit der grossen Oligozänabkühlungim paläontologischen Bereich mit solchen in der höheren Neurobiologie im genetis¬chen Bereich zeitkorreliert werden. Im weiteren konnte die Familie der Aromatasen
der Schweine mit genaueren Anmerkungen versehen werden. Im ganzen sind N2 EDe'm
überraschend nützliches Werkzeug in der Bioinformatik zur Lösung mancher Probleme
im Bereich der Genomik und Proteomik.

IV
Glossary
Codon bias The preference for an organism to encode a particular amino acid with one
of many redundant codons
MYA Million years ago
orthologs Genes in two taxa that diverged at the time that the two taxa diverged by spe-
ciation
PAM Point Accepted Mutations - The measure of the total number of mutations per 100
amino acids, including multiple mutations.
paralogs Genes that diverged independent of speciation
transition A pyrimidine-for-pyrimidine mutation, or a purine-for-purine mutation
transversions A pyrimidine-for-purine mutation, or a purine-for-pyrimidine mutation

Contents
Abstract ii
Zusammenfassung iii
Glossary iv
1 Introduction: Computational Biology behind Interpretive Genomics 1
1.1 Sequence alignment 1
1.1.1 Comparing two sequences 1
1.1.2 Scoring an alignment 4
1.1.3 Gaps in alignments 5
1.1.4 Unequal probabilities of replacement 6
1.1.5 Amino acid frequencies 6
1.1.6 Attempting to intuit the side chain substitution matrix 8
1.2 The concept of evolutionary distance 8
1.2.1 Distance matrices 10
1.2.2 Matrices derived for more distant protein pairs 10
1.2.3 Powering replacement matrices 11
1.3 The Dayhoff matrix 11
1.3.1 Using the Dayhoff matrix as a scoring matrix 12
1.3.2 Estimating the PAM distance 13
v

vi Contents
1.3.3 Dynamic programming algorithms 13
1.3.4 Some sites are more mutable than others 14
1.4 Using pairwise comparisons and distances 14
1.5 Silent substitutions as molecular clocks 16
1.5.1 The need for dating. Interpretive genomics 16
1.6 Molecular clocks based on protein sequences 18
1.7 Molecular clocks based on silent mutation 20
1.7.1 Pseudogenes 20
1.7.2 Introns 20
1.7.3 Silent positions in coding sequences 20
2 Restricted Analysis of Silent Substitution in Coding Regions: The NearlyNeutral Evolutionary Distance 23
2.1 Definition of the N2ED 23
2.2 Fluctuation of the /2-values 25
2.3 Comparison of restricted silent substitutions with PAM distances 25
2.4 Comparison of pyrimidine- and purine transitions 27
2.4.1 The details of the/2 plots 27
2.4.2 Modeling the plots 29
3 Evaluating N2ED's. Interspecies Analysis 31
3.1 Theoretical and practical considerations 31
3.1.1 The fossil record 31
3.1.2 The ortholog paralog problem 32
3.2 Mammalian taxa and the N2ED 34
3.2.1 Reading the histograms 35
3.2.2 Uninformative histograms due to small sample sizes 38
3.2.3 N2ED can be used date some speciation events 38

Contents vii
3.3 Addressing the ortholog-paralog problem 39
3.4 N2ED distances to build trees 40
3.4.1 Getting the data 40
3.4.2 Comparison of N2ED trees with other trees 41
3.5 Rooting a tree 42
3.6 Aromatase: an example of N2ED analysis 44
3.6.1 The problem 44
3.6.2 Classical analysis 44
3.6.3 Analysis using N2ED's 45
3.6.4 The paralogs enable large litter sizes 46
4 Using N2ED's. Intraspecies Analysis 51
4.1 The evolution of paralogs 51
4.1.1 What is a paralog 51
4.2 Paralogs in the yeast genome 52
4.2.1 Getting the data 52
4.2.2 The episode at f2 ca. 0.82 52
4.2.3 N2ED is a useful too to identify pathways 55
4.3 The human genome 56
4.3.1 Getting the data 56
4.3.2 Examining the histogram 56
4.3.3 A promising start 58
5 Conclusions 59
A Methods 61
A.l General 61
A.2 Inter-taxon analysis 61
A.3 Intra-species analysis 62
viii Contents
A.4 Yeast analysis 62
A.5 Elimination of duplicate entries in the database 62
A.6 Calculation of /2-values 62
A.7 PAM-distances 63
A.8 Codon bias 63
B Example ofaiV2ED Calculation 65
C Bibliography 69
Curriculum Vitae 77

Chapter 1
Introduction: Computational Biologybehind Interpretive Genomics
1.1 Sequence alignment
One of the fundamental tasks in bioinformatics is the alignment of two sequences. The
completion of this task will help answer some questions of the evolutionary relationshipbetween those two sequences. For Example: Are they likely to be related by a common
ancestor, and if so how distant are they? If they are indeed related, are they likely to serve
a similar function?
1.1.1 Comparing two sequences
In some cases aligning two sequences is straightforward, one does not need any
bioinformatics-tool to do it. This is especially true in the case that the proteins com¬
pared are very similar in sequence. Such an example is given in Figure 1.1 where two
sequences of the leptins (the obesity gene in rodents) lend themselves transparently to a
preferred sequence alignment. The sequences, when aligned as in alignment A, display97% identity. Other sequence alignments B-E, created by shifting the sequences relative
to each other, have far fewer identities. Given the assumption that the best alignment has
the most identities these are not as good as the first one.
Alignment becomes increasingly more difficult as pairs of protein sequences become
increasingly dissimilar. For example the the two protein kinase sequences in Figure 1.2
have far fewer identities. Further, they are not of equal length, meaning that an alignmentmust contain a gap. It is no longer a trivial problem to create the best alignment, and
visual inspection alone is not a defensible way to find that alignment.
1

2 Chapter 1. Introduction
A
rat
B
rat
C
rat
D
rat
E
rat
mouse
VPIHKVQDDTKTLIKTIVTRINDISHTQSV
Ml ! I I I I I I I I I I I I II ! I I i I 1 I i I I !
VPIQKVQDDTKTLIKTIVTRINDISHTQSV
VPIHKVQDDTKTLIKTIVTRINDISHTQSV
I
VPIQKVQDDTKTLIKTIVTRINDISHTQSV
VPIHKVQDDTKTLIKTIVTRINDISHTQSV
I
VPIQKVQDDTKTLIKTIVTRINDISHTQSV
VPIHKVQDDTKTLIKTIVTRINDISHTQSV
I I
VPIQKVQDDTKTLIKTIVTRINDISHTQSV
VPIHKVQDDTKTLIKTIVTRINDISHTQSV
III I
VPIOKVODDTKTLIKTIVTRINDISHTOSV
Figure 1.1: The alignment of two leptin sequences
from two mammals. The alignment A is better by vi¬
sual inspection than the remaining alignments: 29 ofthe 30 aligned sites hold identical amino acids in the
first. The others have four orfewer sites holding iden¬
tical amino acids.
To find the solution of this alignment problem, two classes of questions must be an¬
swered:
a "Which alignment is the best?" To answer this question, a scoring scheme that
allows comparison of these two alternative alignments is needed. One then must
search alignment space, the set of all possible alignments, to identify the alignmentthat gives the highest score. Once the alignment with the highest score is identified,
one might also ask how much better the best alignment is compared to the second
best alignment. This comparison might be used to give a degree of confidence that
the correct alignment has been found.
b "Is the degree of similarity found in the best alignment significantly higher than
the degree of similarity that might be found in the best alignment of two random
sequences?" Here, a null hypothesis is needed, a reference pair of sequences that
have no systematic similarities.

1.1. Sequence alignment 3
DLYTYLSRRLNPLGRPQIAAVSRQLLSAVDYIHRQGIIHRD descendent A
DLFDFITERGALQEDLARGFFWQVLEAVRHCHNCGVLHRD descendent B
Figure 1.2: Twoprotein kinase sequences.
Understanding the model of evolution can help to answer these questions. Consider a
simple analogy drawn from language:
Biomformatics is dependent on an understanding of both organic chemistry and computers
If there is no selection for sentences that have meaning, then letters will be replacedat random in the sequence:
Biomformatics is dxpendent on an understanding of both qrganic chemistry and computers
Bioizformatics is dxpendent ow anvunderttandmg of both qrganic cheqistry and cohputers
Bioizformmticsris dxpendent ow anvundkrttandmg of both qrgau c cheqistry and ^ohpwters
Bioizfyr mticsriszdxpendent ow anvundkrttandmgsdf both qrgau c gheqistrybynd johpwters
libizfyr mticsriszdxpendezt owfanvundkrtttndmgsdf bofheqrgau c gheqistrybynd johpwters
lioizfyr mticsriszdx endeztgowfanvundk tttndmgsdf jofheqrgau c gheqistrybynd ;johputhrs
The information is rapidly lost. If, however, mutant sentences that do not convey
understandable information are removed from a population via natural selection, this will
lead to a slower evolution of protein sequences, and to an evolution of sequences that have
conservative replacements. Replacements that conserve the information that the proteincontains:
Biomformatics is dependent on an understanding of both organic chemistry and computers
Biomformatiks is dependant on an understanding of both organic chemistry and computers
Biomformatiks is dipendant on an unterstandmg of both organik kemistry and komputersBiomfurmatix is dipendant on an unterstandmg of both organik khemistry and komputers
Biomfurmatix is dipendunt on a unterstandmg of both organik khemistry und komputers
The spelling will be bad, but the information is retained. That information would helpto align the sentences. The same principle applies for proteins, they are not just strings of
letters, but rather entities that have a biological function and are encoded by underlying
genes.
Two genes that encode proteins that are related by common ancestry are defined as
homologous. They are therefore expected to be identical, except to the extent that theyhave diverged. Divergence envisions a model where by an ancestral gene is duplicated,and the duplicates evolve independently. That means mutations arise in each of the genes,
some of which lead to replacements in the encoded protein sequences. This is why two
homologous sequences are not identical, even though they started as exact duplicates of

4 Chapter 1. Introduction
the same ancestral gene. The correct alignment is therefore one that matches codons in
the descendent genes that arose from a single ancestral codon in the ancestral gene.
The two questions above are reformulated to reflect a model that is contains these
elements of the theory of evolution:
a' (reformulated) "Which alignment best places amino acids that are encoded by
codons descendent from a single codon in an ancestral gene?" To answer this ques¬
tion, a scoring scheme that allows one not just to compare alternative alignments,
but also that allows the discernment of the true relationship between individual parts
of the sequence, is needed. Thus, the scoring scheme must give the highest score
when homologous codons are matched in the alignment.
b' (reformulated) "Does the degree of similarity found in the best alignment signifi¬
cantly support the hypothesis that these two proteins are homologous?" Here as be¬
fore one compares the best alignment with a null alignment between two sequences
that are not homologous. The scoring scheme must capture reliably the signals that
differentiate the true alignment from the null.
The process of alignment makes a statement about the historical past. No such tools
that provide direct information about that past exist. Instead, only tools that manipulate
and analyze strings of letters in the context of some scoring tool are available. The scoring
tools are conjectural; one has no a priori reason to believe that they will capture the
essence of the historical past. This is the paradox at the center of the alignment task.
1.1.2 Scoring an alignment
To find the best alignment one needs to deduce a scoring tool that on one hand represents
the underlying evolutionary model as accurate as possible, and on the other hand can
be implemented in computer language. There are different aspects of evolution that the
scoring tool must respect.
1. Not all amino acids are equally represented. This is especially important when
comparing an alignment with an alignment of random sequences.
2. Different amino acids have different chemical properties. Therefore the scoring
should favor those with more similar properties to be aligned with each other.
3. During evolution, parts of proteins can be deleted and new parts inserted. The
scoring must therefore consider gaps in the alignment.

1.1. Sequence alignment 5
1.1.3 Gaps in alignments
One of the central problems during the alignment process is the placements of gaps. In the
example of the two leptin sequences, a gap needs to be introduces into the alignment since
one sequence is one residue shorter than the other. That gap can be put at one end of the
shorter sequence but when put inside the shorter sequence, the identity of the sequences
increases from less than 10% to 31.7% (Figure 1.3 alignment A). If one introduces more
gaps, the percentage identity increases to 46.9% (alignment B and C).
A
DLYTYLSRRLNPLGRPQIAAVSRQLLSAVDYIHRQGIIHRD descendent A
II 1 1 1 1 1 1 1 1 1 1 1
DLFDFITERGA-LQEDLARGFFWQVLEAVRHCHNCGVLHRD descendent B
B
DLYTYLSRRLNPLGRPQIAAVSR QLLSAVDYIHRQGIIHR descendent A
II 1 1 1 1 1 1 1 1 1 1 1 1
DLFDFITERGA-LQEDL-A RGFFWQVLEAVRHCHNCGVLHR descendent B
c
DLY TYLSRRLNPLGRPQIAAVSR QLLSAVDYIHRQGIIHR
II 1 1 1 1 1 1 1 1 1 III
descendent A
DLFDFIT ERGA-LQEDL-A RGFFWQVLEAVRHCHNCGVLHR descendent B
Figure 1.3: Pairwise alignments of two kinase sequences. Introducing
one gap increases the pairwise sequence identity to 31.7% (alignmentA). Introducing more gaps increases the pairwise sequence identity to
40.0% (alignmentB)and then to 46.9% (alignment C).
Introducing gaps into an alignments can increase the percentage identity, but the align¬ment is a reflection of evolutionary history. Gaps in the alignment mean that either a dele¬
tion has occurred in the gapped sequence, or an insertion has occurred in the ungapped
sequence (Figure 1.4). These indel-events are assigned a penalty in the scoring of an
alignment.
The "penalty for introduction plus incremental penalty" formula carries an assumptionabout the length distribution of gaps, and the probability of finding a gap as a function of
the length of the gap. Because a number is added to the logarithm of a probability (see
below), the gap length distribution is modeled as an exponential function. That is, the
probability of a gap falls off exponentially with its length [Ben93b].
Assuming that an indel does not alter the fitness of a protein at all, the probability of
an indel is expected to be an increasing function with time, and one might infer increasingtime by looking for increasing dissimilarity between sequences.

6 Chapter 1. Introduction
DLY TYLSRRLNPLGRPQIAAVSR QLLSAVDYIHRQGIIHR descendent A
II i I I I I I I I I I I I I
DLFDFIT ERGA-LQEDL-A RGFFWQVLEAVRHCHNCGVLHR descendent B
DL????T????R???L?????A???R????Q?L?AV???H??G??HR ancestor
lost xn
lxneage
leading
to A
_ _
lost in
lineage
leadxngto B
Figure 1.4: Introducing gaps in the alignment corresponds to a story
about the historical past, in particular, aboutpast events that led to the
loss ofcoding materialfrom an ancestral gene, here we assume that onlydeletions tookplace.
1.1.4 Unequal probabilities of replacement
The only scoring measure for ungapped regions considered so far has been percent iden¬
tity. This simple identity/non-identity scheme captures some of the key assumptions,listed below:
1. Each site in the sequence samples 20 amino acids independently of all other sites.
2. Each of the 20 amino acids is equally likely to be found in a given site.
3. All identities count equally.
4. Non-identities also all count equally.
Several of these approximations are inconsistent with the empirical reality of protein
sequences. For example, different amino acids appear with different frequencies in a
typical protein.
1.1.5 Amino acid frequencies
With non-equal sampling of the twenty amino acids, two random sequences have a higheridentity than two random sequences that sample each of the 20 amino acids equally. For
example, if Ala occupied 90% of the sites, and the remainder of the sites are occupied bythe other 19 amino acids, an alignment of two random sequences might appear with an
overall identity of more than 80% (Figure 1.5).

1.1. Sequence alignment 7
Figure 1.5: If the frequencies of the 20 standard amino acids are not
equal, two random sequences will have higher than 5% overall identity.
The fact that different amino acids appear at different frequencies means that their
replacement probabilities must be different (The frequencies of the different amino acids
in a recent database is shown in Table 1.1). Thus, if the amino acid distribution represents
any kind of an equilibrium, then the rate of conversion of Thr to Pro, for example, must
be 5.94/5.18 times greater than the conversion of Pro to Thr.
Table 1.1: Frequencies ofthe 20 standard amino acids in the protein sequence database.
9.14% Leu 7.20 (average) 6.23% Glu 4.12 (average)
7.23% Ser 6 fold 5.80% Lys 2 fold
5.22% Arg 5.19%
4.39%
Asp
Asn
7.58% Ala 6.4 7 (average) 4.17% Gin
7.18% Gly 4 fold 3.93% Phe
6.48% Val 3.24% Tyr
5.94% Thr 2.25% His
5.1 8% Pro 1 .85% Cys
5.35% He 5.35 (average) 2.30% Met 1.83 (average)
3 fold 1 .35% Trp 1 fold
These differential probabilities of replacement are usually captured by a 20 by 20
matrix that captures the information about the probability that each of the 20 amino acids
will be replaced by each of the others. The diagonal terms give the probability that no
replacement will have occurred.
Sequence databases contain only sequences from those organisms that have survived
and reproduced; the concept of fitness that underlies the theory of evolution. To the extent
that the protein sequence contributes to fitness at all, one expects some replacements to
be more consistent with continued fitness than others. Therefore, the off diagonal terms
of a substitution matrix that reflects the amino acid frequencies, reflect more than just the
frequencies of codons for the amino acids in the genetic code. It is a statement that protein
sequences are diverging under conditions where they feel the impact of natural selection.
In general, one does not expect all amino acid replacements to be equally able to

8 Chapter 1. Introduction
sustain continuing function. The side chains of amino acids display different chemical
properties: Differences in size, charge and hydrophobicity. This gives them distinctive
roles in the behavior of a protein.
1.1.6 Attempting to intuit the side chain substitution matrix
If one assumes that the side chain of a specific amino acid must play a specific role in
a protein's behavior, and that only this specific side chain can serve, and that role is
conserved between two homologs, then the amino acid must be conserved in the two
sequences. At some positions, such conservation is absolute. This may be the case for
catalytic residues at the active site, for example.
Less stringently, that role can be played by a subset of the 20 amino acids. For ex¬
ample, if the side chain of an amino acid must bind to the negatively charged phosphate
group of a DNA molecule, the side chain must carry a complementary positive charge:Either Lys or Arg would serve. Thus, Lys might be freely replaced by Arg.
Side chains that share physical chemical similarities might be viewed as being more
likely to be interchangeable without loss of functional behavior, than side chains that have
different physical chemical properties.
Following this logic, Grantham built a substitution matrix that assigned the probabil¬ities for replacement between physical chemically similar side chains that were higherthan the probabilities for replacement between physical chemically different side chains,
which is still widely used as a scoring matrix. [Gra74]
The assumptions behind its use are:
• Individual positions mutate independently.
• Patterns of substitution are the same at all positions
• All positions are equally likely to suffer a mutation.
If some residues play no role in the fitness of a protein, or when their role is not con¬
served during evolution, substitution at that site need not display the patterns of mutation
expected by the Grantham matrix.
1.2 The concept of evolutionary distance
An alternative way to get patterns of amino acid replacement in a protein is to get a set
of homologous protein pairs, and see how amino acids have been replaced between them

1.2. The concept of evolutionary distance 9
during an episode of divergence. For this the concept of "evolutionary distance" between
two protein sequences must be introduced. This is because two sequences will become
less similar as the evolutionary distance between them increases.
From a biologist's perspective, two types of distance are central to the analysis of the
distance between two biological objects.
Time This is a linear distance that is directly additive, and constant over all lineages.Time as a unit of distance will play a critical role in interpretive genomics.
Sequence similarity This kind of distance concerns the number of amino acid replace¬ments that separates two protein sequences. This is distinct from the measure of
time. For example in two homologous proteins of human and chimpamsee the
number of mutations that occurred along the lineage leading to the chimp need not
be the same as the number of mutations that occurred along the lineage leading to
the human, even though the time since the two taxa diverged is the same.
Percent identity has been used above as a metric to generate an idea of the likelihood
that two sequences might be homologous. This can be converted into a distance metric
by subtracting percentage identity from 100: More replacements must have occurred for
a sequence pair to have a higher "percentage non-identity". This metric for distance has
long been the most common statement about the relation between two protein sequences
in the literature.
Unfortunately, mutations can occur more than just once at a single site during evolu¬
tionary history. For this reason, the percent identity is not a linear function of the number
of replacements. After suffering a large number of replacements, a sequence will reach
an equilibrium. At this equilibrium, the likelihood of a replacement restoring the amino
acid found in the original sequence becomes equal to the likelihood that a replacementwill make the descendent still more dissimilar from the parent. If the 20 amino acids
were introduced/lost with equal frequency, this equilibrium would be reached when the
sequences were 5% identical. This process is well understood as an approach to equilib¬rium problem.
The measure of the total number of mutations per 100 amino acids, including multiplemutations at a single site, is therefore a better metric for evolutionary distance. This metric
is called PAM (Point Accepted Mutations) distance.
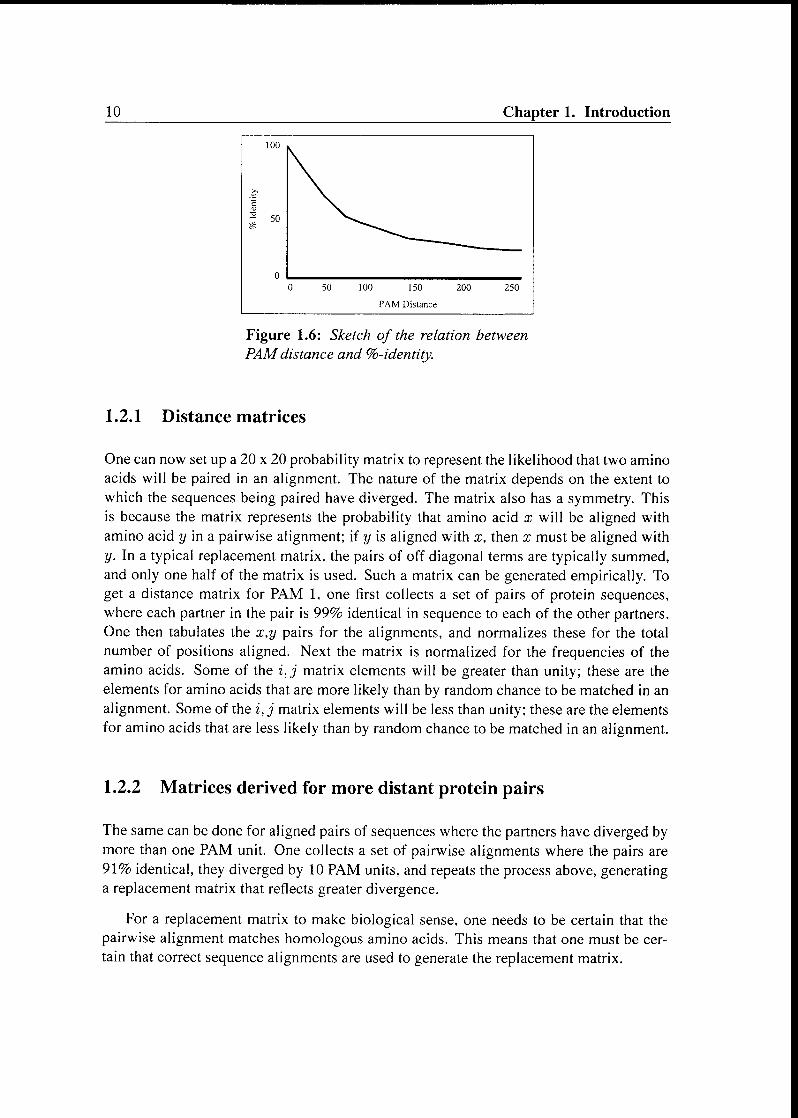
Figure 1.6 shows a correlation between percentage identity and PAM distance. In
practice, one can use the curve to determine the PAM distance between any two se¬
quences. One simply determines the percentage identity, goes to the figure, finds the
percentage identity on the y axis, and reads off the PAM distance on the x axis.
The PAM distance is additive. That is, given two consecutive episodes of evolution, A
and B, where the protein has suffered a replacements during episode A and b replacements
during episode B, the number of replacements during the two episodes should be a + b.
10 Chapter 1. Introduction
100
c
o
0 50 100 150 200 250
PAM Distance
Figure 1.6: Sketch of the relation between
PAMdistance and %-identity.
1.2.1 Distance matrices
One can now set up a 20 x 20 probability matrix to represent the likelihood that two amino
acids will be paired in an alignment. The nature of the matrix depends on the extent to
which the sequences being paired have diverged. The matrix also has a symmetry. This
is because the matrix represents the probability that amino acid x will be aligned with
amino acid y in a pairwise alignment; if y is aligned with x, then x must be aligned with
y. In a typical replacement matrix, the pairs of off diagonal terms are typically summed,and only one half of the matrix is used. Such a matrix can be generated empirically. To
get a distance matrix for PAM 1, one first collects a set of pairs of protein sequences,
where each partner in the pair is 99% identical in sequence to each of the other partners.One then tabulates the x,y pairs for the alignments, and normalizes these for the total
number of positions aligned. Next the matrix is normalized for the frequencies of the
amino acids. Some of the i,j matrix elements will be greater than unity; these are the
elements for amino acids that are more likely than by random chance to be matched in an
alignment. Some of the i, j matrix elements will be less than unity; these are the elements
for amino acids that are less likely than by random chance to be matched in an alignment.
1.2.2 Matrices derived for more distant protein pairs
The same can be done for aligned pairs of sequences where the partners have diverged bymore than one PAM unit. One collects a set of pairwise alignments where the pairs are
91% identical, they diverged by 10 PAM units, and repeats the process above, generatinga replacement matrix that reflects greater divergence.
For a replacement matrix to make biological sense, one needs to be certain that the
pairwise alignment matches homologous amino acids. This means that one must be cer¬
tain that correct sequence alignments are used to generate the replacement matrix.
1.3. The Dayhoff matrix 11
This works when the two proteins are 90% identical, and the pairwise alignment has
no gaps. As illustrated in Figure 1.1, the next best alignment is typically so much worse
that there is little danger of mistaking it for the correct alignment.
But once the sequences diverge further, and gaps are introduced, the correct alignmentis not easily identified. At some point, one begins to worry about whether the sites pairedin the alignment are truly homologous. This occurs in typical proteins at ca. PAM 100
[Ben93a].
1.2.3 Powering replacement matrices
Alternatively, one assumes that the patterns of amino acid substitution are the same in
proteins that have suffered one PAM unit of replacement and in protein pairs separated
by 10 PAM units. This requires that patterns of substitution in the future be the same as
patterns of substitution in the past. Therefore one raises the PAM 1 matrix to its tenth
power to get the PAM 10 matrix.
1.3 The Dayhoff matrix
This logic was used by Margaret Dayhoff to construct what is now known as the Day¬hoff matrix for scoring sequence alignments [Day78]. Dayhoff collected data from pairsof sequences 5-10 PAM units distant. She then took the replacement matrices that she
obtained, and powered them to get the equivalent of a PAM 250 matrix. Dayhoff chose
this distance because she felt that this was the most distant sequences that anyone would
ever be productively able to align. She then normalized the terms for the frequency of the
amino acids in her database. Dayhoff then noted that this matrix contained a large num¬
ber of fractional terms. Recognizing that logarithms are easy ways of representing small
numbers (and anticipating the use of the matrix as a scoring matrix, see next section), she
replaced the terms in the matrix by their logarithms (base ten). Dayhoff multiplied these
logarithms by ten, for no good reason except to get a majority of the matrix elements to
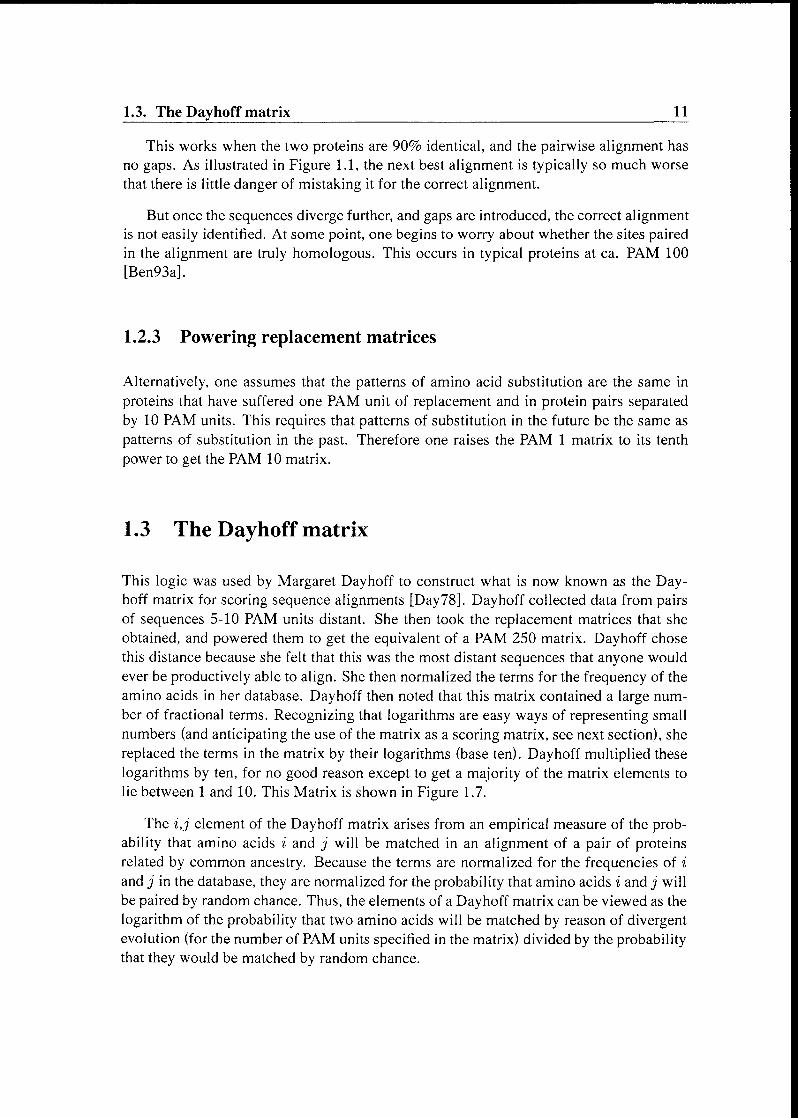
lie between 1 and 10. This Matrix is shown in Figure 1.7.
The i,j element of the Dayhoff matrix arises from an empirical measure of the prob¬
ability that amino acids i and j will be matched in an alignment of a pair of proteinsrelated by common ancestry. Because the terms are normalized for the frequencies of i
and j in the database, they are normalized for the probability that amino acids i and j will
be paired by random chance. Thus, the elements of a Dayhoff matrix can be viewed as the
logarithm of the probability that two amino acids will be matched by reason of divergentevolution (for the number of PAM units specified in the matrix) divided by the probabilitythat they would be matched by random chance.
12 Chapter 1. Introduction
r 1 2 1
S 0 9 2 1
T 5 5 2 4
P 2 7 4 0 6 6 5
A 4 1 7 1 1 2 5
G 1 3 0 8 0 5 1 0 8 8
N 1 6 2 0 5 1 1 0 0 0 1 3 6
D 3 n 0 4 2 2 8 0 6 0 8 2 5 5 2
E 4 t 6 2 6 0 0 5 1 4 4 5 2
Q 3 2 4 1 0 1 1"
1 6 0 0 6 2 1 5 3
H 1 2 0 9 1 7 0 4 2 1 2 1 4 0 1 0 2 3 2 6 1
R 0 4 0 9 1 3 1 3 / 0 1 0 1 1 5 0 4 2 5 1 8 5 1
K 2 8 2 1 1 2 3 1 9 1 4 1 0 0 2 0 9 2 5 0 9 4 3 5 G
M 3 7 j 0 6 1 8 0 2 3 2 5 4 j 4 1 3 1 3 4 3 0 2 9 4 8
I 3 6 2 0 7 2 0 0 3 4 2 5 4 2 4 1 3 8 3-
3 8 3 8 4 0 4 4
L 3 8 5 0 4 0 2 1 3 4 G 3 4 5 3 5 0 2 4 2 2 3 2 4 1 2 9 2 4 4 8
V 3 1 0 9 0 6 1 6 0 7 2 3 2 4 3 3 3 0 3 5 3 8 3 7 ' 8 3 3 3 9 1 9 4 0
F 0 1 8 2 4 J 2 3 2 5 3 5 5"
6 7 4 4 0 1 4 9 6 3 0 1 0 0 2 4 0 5 8 3
Y 2 6 8 3 4 3 8 4 0 4 9 0 9 2 3 4 1 4 4 4 2 6 4 C 3 6 3 3 1 6 3 8 5 6 9 5
W 1 6 2 9 2 6 4 8 4 ^ 1 7 4 4 6 3 5 6 2 6 2 8 2 0 1 4 4 4 5 0 3 0 4 8 1 6 0 3 14 7
C S T P A G N D E Q H R K M I L V F Y W
Figure 1.7: A Dayhoff mutation matrix. The numbers are ten times the logarithm of the
probability that two index amino acids will be aligned by reason of common ancestry,
divided by the probability that the two amino acids will be aligned by random chance, fortwo proteins that are separated by 250 PAM units ofdivergent evolution underfunctionalconstraints.
1.3.1 Using the Dayhoff matrix as a scoring matrix
The Dayhoff matrix can be used to score to a pairwise alignment. Considering a sequence
alignment exactly one position in length, with an arbitrary PAM distance, the Dayhoffmatrix element represents the probability that the two amino acids arose by divergencefrom a common ancestor at that PAM distance, divided by the probability that they arose
by random chance.
The Dayhoff matrix records logarithms of probabilities. The logarithm of the productof probabilities is the same as the sum of the logarithms probabilities. Therefore, to
score an alignment, the terms of the Dayhoff matrix for each position in the alignmentare added up. This sum is the logarithm of the probability that the two sequences arose
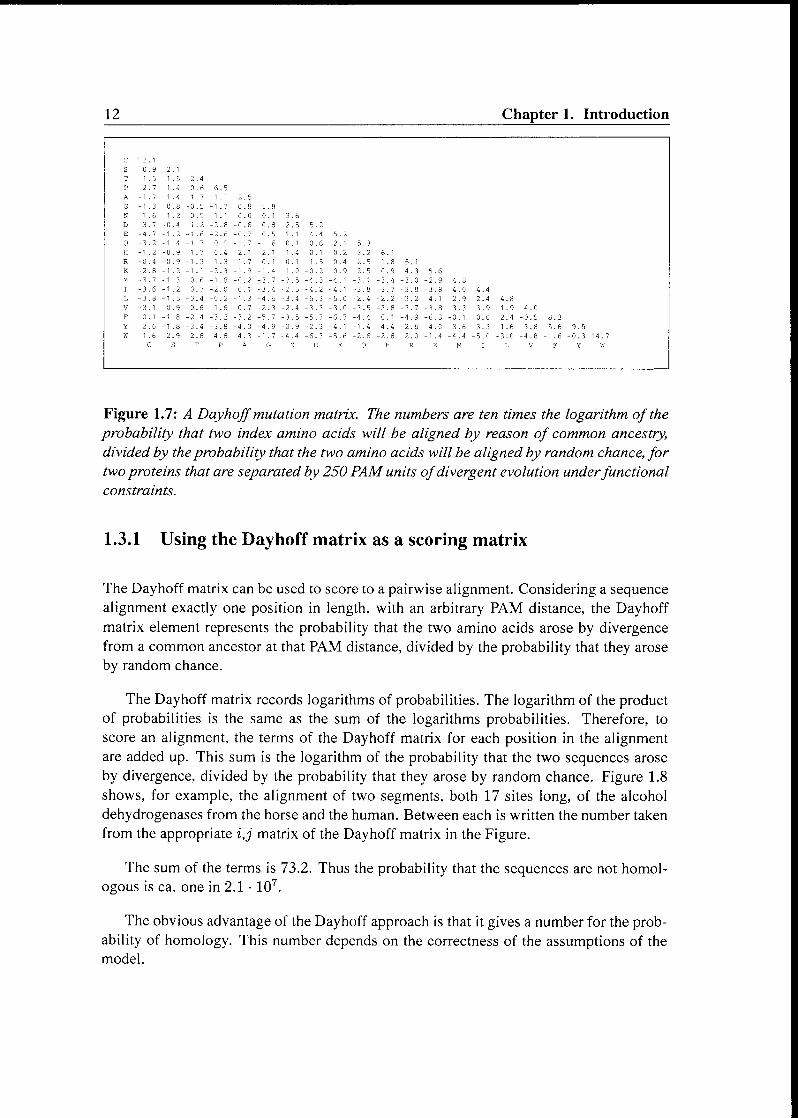
by divergence, divided by the probability that they arose by random chance. Figure 1.8
shows, for example, the alignment of two segments, both 17 sites long, of the alcohol
dehydrogenases from the horse and the human. Between each is written the number taken
from the appropriate i,j matrix of the Dayhoff matrix in the Figure.
The sum of the terms is 73.2. Thus the probability that the sequences are not homol¬
ogous is ca. one in 2.1 • 107.
The obvious advantage of the Dayhoff approach is that it gives a number for the prob¬
ability of homology. This number depends on the correctness of the assumptions of the
model.

1.3. The Dayhoff matrix 13
EGFDL LRSGK SIRTI LTjn t/i pe tn U u^hiinin bj ^ t/i K> ^ j^ o
w» wwae os be U bo bs h* £•. *- «k. £. bo b\
EGFDL LHSGK SIRTI LM
Figure 1.8: Scoring an alignmentbetween two segments, each 17sites
long, ofthe alcohol dehydrogenases
from human and horse.
Specifically, the model assumes that:
• Individual positions mutate independently.
• Patterns of substitution are the same at all positions
• All positions are equally likely to suffer a mutation.
These are the same assumptions as those implies in the use of Grantham's matrix.
1.3.2 Estimating the PAM distance
Using the Dayhoff matrix to determine the PAM distance between two sequences is not
a trivial task. In principle, to know the number of replacements that took place in the
evolutionary time separating two sequences is to know the entire historical past of each
protein lineage since the two diverged in the historical past. This is obviously not possible.
One could estimate the PAM distance between two sequences by recognizing the re¬
lationship between PAM distance and percentage identity, and construct a plot explicitlyrelating these two from a particular theory for evolution. The percentage identity between
two sequences would be determined and used as an index to read the PAM distance.
The Dayhoff matrix offers an alternative tool to determine PAM distance, by the pro¬
cess of comparing the scores given to the alignment using different PAM matrices. The
PAM of the matrix that gives the highest score is the PAM distance separating the two
sequences.
1.3.3 Dynamic programming algorithms
The alignment of two strings has been studied outside the domain of biology for decades
before the emergence of bioinformatics as a field. People interested in string manipulation
14 Chapter 1. Introduction
have developed an approach known as dynamic programming [Nee70, Smi81]. Dynamic
programming algorithms are provably able to find the alignment with the highest score,
given a scoring scheme.
The scoring scheme is important to the outcome of a dynamic programming heuristic.
The Dayhoff matrix is widely used as the scoring matrix in this context. The dynamic
programming algorithm supports processes that correspond to the introduction of gaps.
1.3.4 Some sites are more mutable than others
Three assumptions have been listed for the models outlined above for calculating distance.
• Individual positions mutate independently.
• Patterns of substitution are the same at all positions.
• All positions are equally likely to suffer a mutation.
The Benner group, frequently in collaboration with the Gönnet group, analyzed over
the past decade each of these assumptions. Each was found to be an approximation for
reality, in some cases severe. For example, inspection of a multiple sequence alignmentshows that different sites suffer replacements with different frequencies. The Benner
group used this as the foundation for its tools to predict the folded structure of proteinsfrom sequence data [Ben97]. This fact has an impact on distances calculated using the
Dayhoff model: The existence of more and less mutable sites will cause a Dayhoff anal¬
ysis to provide an inaccurate distance.
1.4 Using pairwise comparisons and distances
How can one use distances between two sequences. In the literature, a variety of applica¬tions can be found, including:
• As a metric of structural dissimilarity.
• As a metric of functional dissimilarity.
• To build evolutionary trees.
• To calculate the length of branches within an evolutionary tree.

1.4. Using pairwise comparisons and distances 15
The first two approaches are straightforward. Thus, the greater the distance, the less
similar the sequences, their folded structures, and presumably their functions. The most
useful application of distances is to build trees. Consider, for example, the distance matrix
shown in Table 1.2.
Table 1.2: The evolutionary distance (measured in PAM units) separating the alcohol
dehydrogenasesfrom human, horse, plant andyeast.
Horse Human Plant Yeast
Horse 0 12 47 76
Man 0 49 74
Plant 0 78
Yeast 0
An evolutionary tree can be constructed from these distances. In this tree (Figure 1.9),
the lengths of the lines indicate PAM distances. Note that it is possible to obtain distances
between contemporary sequences and vertices on the tree that represent proteins that are
the most recent common ancestors of contemporary proteins.
ancestral alcohol
dehydrogenase
horse-man distance
a+b = 12
e / horse-plant distance
a+c+d=47
man-plant distancec / \ V b+c+d=49
aAb horse-yeast distance
a+c+e+f=76
rr
o
C/3
3es
Cù P
3 a*
man-yeast distance
b+c+e+f=74
ft
ooOl
plant-yeast distance
d+e+f=78
Figure 1.9: Evolutionary tree showingthe evolutionary distances between branch
points, calculatedfrom the evolutionary dis¬
tances between end points in the Table
above.
The lengths of each branch of the tree can be obtained by solving the 6 equationswith 6 unknowns listed in Figure 1.9. a=5; b=7; c=18; d=24; e+f=53. The distances

16 Chapter 1. Introduction
in these trees are of the second type of distance. They represent the number PAM units
that separate the nodes in the tree. A linear relationship between time distance and PAM
distance exists only if the rate constant for amino acid replacement is time-invariant.
This sets up the problem for this dissertation: We wish to correlate the two types of
distance, a distance that represents a change in a sequence, and a distance that represents
a change in time. We will accept the notion in the standard theory that mutation at the
DNA level is uniform across a gene. We will see, however, that accepted mutations at the
protein sequence level, those that enter the database, are not. Therefore, we must do a
more sophisticated search for a correlation between sequence change and time change.
1.5 Silent substitutions as molecular clocks
1.5.1 The need for dating. Interpretive genomics
The value of tools that date events in the molecular record by analysis of sequence data
has long been recognized [Zuc65, Fit76, Wil77]. They offer the promise of a solution to
some of the most intractable problems in molecular evolution.
For example, anyone who constructs an evolutionary tree would like to place a root
on it. The root of a tree is the point that represents the oldest, most ancient sequence in
the family. It is impossible to place a root on an evolutionary tree using classical methods
starting from sequence data alone. If dates could be placed on nodes of a tree, however,
this would help place the root, or at least constrain it to a specific branch of a tree.
Likewise, a classical problem in molecular evolutions attempts to distinguish between
orthologs (genes in two taxa that diverged at the time that the two taxa diverged by speci-ation) from paralogs (genes that diverged independent of speciation). Many believe that
orthologous genes in two taxa are more likely to have analogous function than paralogs,
making the identification of true orthologs an important problem in the sequence assign¬ment problem [HuyOO]. Dating would permit this assignment, in cases where the date of
divergence of the taxa themselves can be estimated.
Other factors, however, have intensified the drive to develop tools for estimating dates
of divergence from molecular sequence data. These comes from the recognition by Ben¬
ner and coworkers more than a decade ago that dating offers a powerful way to annotate
sequence databases [Ben88, Ben89a, Ben89b, Ben90, Ben93a]. These strategies are il¬
lustrated by the cartoons in Fig. 1.10 for two specific applications: suggesting pathways,and suggesting function.
The first strategy correlates events in the molecular record of a protein family with
events in the paleontological and geological records [Jer95]. When a family of proteinssuffers an evolutionary event (a gene duplication, for example, or an episode of rapid

1.5. Silent substitutions as molecular clocks 17
S 004-
y\ j/kS. 003-
s ^\. s ^\*
A| 002-
3 001-
1 000- abcdefgh abcdefgh
Twofamilies m organism show adaptive evolution at the same time
fhpothe^is The proteins interact as theyfunction
1 004-| yv wS. 003- x\ x\
B 2 002-
A A A A3 001-
I 000-
AA AA A A A Aabcdefgh abcdefgh
Twofamilies do not show adaptively evolution at the same time
Ihpothesis The proteins do not interact as theyfunction
5 004-
yv
C
i. 003-
1 002-
1 001-
^r ^^ origin of immune system
S 000- a bed e fgh
Episode concurrent with emergentphysiologyHypothesis The protein is involved m the immune system
Figure 1.10: Cartoons showing strategiesfor extractingfunctional information by corre¬
lating events in the molecular records of two families (panels A and B) and correlatingevents in the molecular record with events in the paleontological geobiological records
(panel B). Iftwo proteinfamilies show correlated episodes (dotted branches in the trees)
in their evolutionary history that occur at the same time (A), this is consistent with the
hypothesis that members of the two families are functionally connected. If two protein
families do not show correlated episodes in their evolutionary history that occur at the
same time (B), this is consistent with the hypothesis that members ofthe two families are
notfunctionally connected. If episodes in the evolutionary history are contemporaneouswith the emergence of a new physiology (C), this suggests the hypothesis that the new
protein family is relevant to thatphysiology.
sequence evolution) at the same time as the paleontological/geological record suggeststhat a new physiology emerged, the hypothesis is, that members of the protein familyare involved in the new physiology. For example, genes involved in the disease known
as osteoporosis are expected to have emerged only when vertebrate bones emerged. The
date of emergence of vertebrate bones is approximately known from the fossil record. If
events in various families of proteins encoded by the human genome could be dated, we
might gain direction towards understanding which proteins are involved in this disease of
aging.
The second strategy is used to suggest pathways by identifying sets of proteins that
interact with each other as they function. When two protein families suffer evolution¬
ary events contemporaneously, this suggests, again as a hypothesis, that members of the
two families interact as they evolve, and therefore may interact as they function. This

18 Chapter 1. Introduction
is the classical definition of a pathway, and applies equally to metabolic and regulatory
pathways.
1.6 Molecular clocks based on protein sequences
The first efforts to analyze biomacromolecular sequences to obtain a clock focused on pro¬
tein sequences, simply because DNA sequences were not yet available [Goo82, Wil77].
Implicit in any tree construction process is the concept that the greater the number of
differences between homologous protein sequences, the greater the time that separates
them. This follows from the expectation that the number of replacements in a sequence is
an increasing function of time. This means that the sequences represented by the leaves
of two diverging branches of an evolutionary tree will become increasingly dissimilar as
time passes. Even early studies recognized the improbability of sequence convergence,
which would corrupt a clock by making it appear to run backwards.
If a plot of the number of replacements versus evolutionary time is a straight line, then
the "rate constant" for amino acid replacement (having the units of replacements/time)is independent of time. Time-independent rate constants would, of course, permit the
calculation of the time since the divergence of two sequences from a simple measurement
of the number of amino acid replacements between them.
Remarkably, early studies suggested that proteins diverge with an approximatelyclock-like behavior. Wilson, for example, made estimates of dates [Wil77] for a variety of
proteins, and estimated a clock like behavior dating back over 1 billion years. Likewise,
early work with hemoglobin sequences (which became abundant early in the history of
genomics) suggested a clock-like behavior [Can82].
The hope for time-independent rate constants was reinforced by the emergence of
the neutral theory of molecular evolution in the early 1970s [Kin69, Kim72]. The neutral
theory of molecular evolution hypothesizes that amino acid replacements do not influence
the survival of the host organism. Therefore, natural selection acts neither to remove the
protein holding the replacement from the population, nor to increase its presence in the
population. Rather, neutral theory predicts that replacement will be a Poisson process,
and that molecular replacement will occur at rates that persist through time and across
lineages. In most of its formulations, the rate at which the molecular clock ticks will not
be measured in years, but rather generation times [Wu85, Li87].
A more comprehensive study by Langley and Fitch [Lan74] covering seven proteinsfrom 18 vertebrate taxa showed, however, that the rate at which proteins suffer replace¬ment varies significantly in different branches, even within the same protein family.
Many have examined the detailed evolution of various families since, identifying cases
of episodic evolution and constant evolution. In some cases, episodes of rapid evolution
have been correlated with specific adaptive events in the protein family [Jer95, Mes97].

1.6. Molecular clocks based on protein sequences 19
This behavior is entirely consistent with chemical intuition. In proteins, we might hypoth¬esize as a generalization that behavior diverges linearly with sequence divergence. This
hypothesis has a partial analogy with the concepts used in classical organic chemistry,where two molecules with more similar structure are expected to behave more similarlythan two molecules with very different structures.
As in the classical case, the hypothesis must be violated by many specific cases. In
enzymes, for example, changes near the active site can dramatically change behavior. As
a generalization, however, one expects proteins with similar behaviors to have similar
sequences, and proteins with more different behaviors to have more different sequences.
This analysis leads to the expectation that the rate constant for amino acid replacementwill be slower in proteins whose role must be conserved for optimal fitness, and faster in
proteins where the role associated with optimal fitness is changing.
Differential absence of constraints imposed by natural selection can lead to different
replacement rates. Episodic evolution in proteins reflects the different extents to which
behavior is changed or conserved in response to selective pressures, and makes protein
sequence divergence unreliable for dating.
The time-dependent rate constants for amino acid replacement leaves open the ques¬
tion of dating. One approach to smooth this variation in replacement rates caused bynatural selection, in the hope of obtaining a more accurate clock, involves aggregating
replacement data over many families of proteins. Such approximate clocks have been
used by Hedges and others to provide a correspondingly approximate dating scheme for
a range of taxa, including many chordate taxa [Kum98, HedOl]. Many use the protein
clock, despite its well known deficiencies, simply because no other approach is avail¬
able that might estimate dates of such antiquity. It might be better to have incorrect or
imprecise dates than no dates at all.
Others recognized that episodes of rapid and slow sequence evolution that characterize
most proteins defeat even the averaging process. This compromise is especially great near
major episodes in the history of life. For example, efforts to date the divergence of the
major metazoan phyla have been based on protein clocks that have been calibrated since
the phyla have become quite distinct, and extrapolating the dates using that rate constant
to time periods as the metazoan phyla were emerging. It is not unreasonable to expect,
however, that as metazoan phyla were emerging, many (and perhaps most) of the proteinsin the metazoan genomes were evolving much more rapidly, as their bioenvironment was
changing more rapidly. Ayala has gone so far as to refer to this as molecular clock miragesbased on an analysis of a wide range of proteins [Aya99].

20 Chapter 1. Introduction
1.7 Molecular clocks based on silent mutation
Protein sequences often make poor clocks, as the rate of amino acid replacement in most
protein sequences changes episodically, in response to changing selection pressure, adap¬tation, and recruitment. The key to a clock, therefore, was to find some neutral changes.This way, one could capture the neutral mutation idea. One well known approach to avoid
at least some of the influence of selection on the clock is to examine mutations at non-
coding sites in the gene [Li97]. These include 5'- and 3'-untranslated regions, introns,
and pseudogenes. Each has been explored as a dating tool.
1.7.1 Pseudogenes
Pseudogenes are genes that may have encoded a transcribed messenger RNA at some
point, but do no longer. Often, they have suffered a defect (an internal stop signal or frame
shift, for example), that makes them unable to encode an active protein). Presuming that
they are correctly identified, pseudogenes are presumably free of selective constraint, and
are free to suffer substitution without any selective pressure. A considerable amount of in¬
formation has emerged about the relative frequency of events at the nucleotide level from
these studies. The difficulties inherent in this approach is that few people are interested
in dating the divergence of pseudogenes themselves. For dating events in the molecular
record involving specific genes, pseudogenes are not useful, as they are not connected to
the genes of interest. They may be useful for dating the divergence of the species that
hold them, however, assuming that a true orthologous relationship can be found between
them. Pseudogenes have also been the focus of the studies that analyze genomes to extract
information about nucleotide substitution [Li81, Pet99, Goj82, Li84].
1.7.2 Introns
The sequences of intervening sequences, or introns, are believed to be largely function-
less. They should also drift neutrally. Further, they are believed to be reasonably tightlycoupled to the divergence of the genes that contain them (although intron gain and loss
are frequent). Both introns and 5'- and 3'-untranslated regions provide an opportunity to
analyze the pattern of nucleotide substitution [Cha96, RodOO, DebOl].
1.7.3 Silent positions in coding sequences
In practice, the gene of interest may not contain an intron. Further, 5'- and 3'-untranslated
regions are frequently difficult to align in orthologous proteins; they appear to suffer
insertion and deletion rapidly.

1.7. Molecular clocks based on silent mutation 21
All genes that encode proteins, however, contain sites within the coding region where,
if a nucleotide substitution occurs, the sequence of the encoded protein does not change.These sites arise from the degeneracy (or redundancy) in the genetic code. Such "silent
sites" have been suggested as useful molecular clocks.
For silent sites to be useful as a clock requires that mutations have little or no impact
on fitness of an organism. This is true only as an approximation. Literature shows that
genomes are biased with respect to the selection of third position codons, suggesting that
mutation that interconverts degenerate codons cannot be entirely neutral [Gra80]. Codon
biases, the preference for an organism to encode a particular amino acid with one of
many redundant codons, is especially prominent in microorganisms, and in these, even
more in highly expressed proteins [Ben82]. This, presumably, reflects the need for highly
expressed proteins to have mRNA molecules that are efficiently translated.
These facts suggests that a good tool to exploit silent positions as a molecular clock
must accommodate codon bias. Fortunately, codon bias does not appear to be strong in
vertebrates, and when it exists, it seems to be similar in the different vertebrate classes
(zebra fish, xenopus amphibia, reptiles, birds, and mammals)
Other problems are associated with the use of silent sites as a molecular clock. As
is evident from Figure 1.11, twelve different mutations are possible (A to G, G to A, A
to C, etc.). These need not occur by analogous mechanisms; they need not have similar
rate constants. Indeed, a precise model for mutation must have 12 different rate con¬
stants. While simulation might, given enough data, permit these to be deconvoluted, this
is complicated.
A «* C
12 different
rate constants transitions
G «» T
transversions
Figure 1.11: Transitions and transversion in
nucleotide replacement. No two arrows need
be associated with the same rate constant.
For this reason, early models assumed that all types of mutations at silent sites are
equally likely [Juk69]. As experimental data emerged, it became clear that this ap¬
proximation is clearly too severe to accommodate experimental data (see Li's textbook
[Li97]). At the very least, different rate constants must be proposed for transitions (a
pyrimidine-for-pyrimidine mutation, or a purine-for-purine mutation) than for transver¬
sions (a pyrimidine-for-purine mutation, or a purine-for-pyrimidine mutation) [Goj82j.
Another problem involves the definition of a silent site. For the two fold redundant
transitions

22 Chapter 1. Introduction
coding systems, when the amino acid is conserved, the definition of a silent site is direct:
It is the third site. This definition applies to four fold redundant coding systems as well.
The existence of both two and four fold redundant systems makes the definition more
complicated, however, as does the existence of three fold and six fold redundant codon
systems. For example, consider the conversion of ATG (Met) to CTC (Leu). Here, we can
imagine the path ATG to ATC (He) to CTC, involving two non-synonymous mutations.
Alternatively, we can imagine the path ATG to CTG (Leu) to CTC, involving one non-
synonymous mutation and one synonymous mutation. If a Met is paired with a Leu in a
protein sequence alignment, how many silent substitutions occurred?
Some complicated heuristics have been developed to capture information in cases
such as these. One of these was developed by Pamilio and Bianchi [Pam93] based on an
approach described by Li [Li85] to give the Pamilio-Bianchi-Li (PBL) method. The PBL
method compares two DNA sequences, codon by codon, and tries to consider all possiblepaths that could be traversed as one codon mutates into another. These paths are assignedprobabilities by assessing the probability of the amino acid change taking place on that
leg based on Grantham's 20x20 mutation matrix [Gra74].
Clearly, such an approach has problems if one wishes to exclude as much chance of
selective influence on the substitution pattern as possible. Grantham's matrix applies onlyin cases where selective pressure constrains the amino acid that is encoded. Thus, the
calculation of relative probabilities introduces a non-neutral factor into the analysis.
For all these reasons, the dating problem remains very much unresolved. The search
for a sequence-based measure for time is the central goal of this dissertation work.

Chapter 2
Restricted Analysis of Silent
Substitution in Coding Regions: The
Nearly Neutral Evolutionary Distance
2.1 Definition of the N2ED
For this study, to date gene duplications within a single genome, we adopted a very con¬
servative dating tool based on silent mutations at the third positions of codons. We con¬
jectured, based on database-wide analysis, that transitions (pyrimidines replacing pyrim-idines, or purines replacing purines) at silent sites might have the least impact on fitness,
and the most consistent rate constants. To exploit this conjecture, homologous genes were
aligned, and sites were identified where silent transitions might occur. To avoid compe¬
tition between transitions and transversions, we examined the third position of "two fold
redundant codon systems" only, these are amino acids that are encoded by exactly two
codons (in the standard code, the nine amino acids CDEFHKNQY). To ensure that the
positions examined had a simple evolutionary history, sites in a pairwise sequence align¬ment were examined only if the encoded amino acids were also conserved.
We then asked, for each pair of paralogous sequences, what fraction of the codons
are conserved at positions in the pairwise alignment holding a conserved CDEFHKNQY.This number was defined as f2.
If the rate constant for transitions is independent of evolutionary time and location
within a gene, a plot of /2 as a function of time should display an exponential decay curve
in an "approach to equilibrium" process (Fig. 2.1). In this process, immediately after a
gene is duplicated, the f2 of the pair is unity, as no time has allowed the sequences to
diverge. After infinite time, f2 will be an equilibrium value, the codon bias b. In between,
f2 decays following the equation:
23

24 Chapter 2. The Nearly Neutral Evolutionary Distance
f2 = (e-kt-(l-b))+b
Where t is the time since divergence, and k is the rate constant in units of transi¬
tions/site/year (for the sites being considered). The f2 can be converted to an additive
distance, kt, by converting the formula:
N2ED = kt = -In(/2 - b)
(1-6)
We define this as the "Nearly Neutral Evolutionary Distance", or N2ED.
Figure 2.1: The first order process by which the fraction
of silent positions diverges from 1.0 (all positions identi¬
cal) to an equilibrium value of 0.6) with a rate constant
of 3 10~9 transitions/two fold redundant site/year, with
f2 = fraction conserved/two fold redundant site. Note that
dates can be be obtainedfrom f2 up to ca. 500 MYA.
For example, consider a conserved His, encoded by a two fold redundant coding sys¬
tem (CAT and CAC). At zero time, a CAC encoding His in protein 1 will correspond to
a CAC encoding His in protein 2 (as zero time has elapsed since the two genes diverged,
they are identical). The likelihood that the CAC in protein 1 will be matched with a CAC
in protein 2 (as opposed to CAT, the other codon for His) fall off from unity as the pro¬
teins diverge. After infinite time, the rate at which any CAT (encoding His) is replaced
by CAC (also encoding His) is equal to the rate at which any CAC is replaced by CAT,
2.2. Fluctuation of the /2-values 25
with the C—>T rate constant divided by the T-»C rate constant being equal to b (or its
reciprocal, depending on which is larger). This is the "equilibrated" situation. This model
can mathematically be described as an exponential approach to equilibrium rate law. A
detailed example of a A^.E'Dcalculation is given in Appendix B.
The bias b can be calculated from the genome as a whole (in which case, it correspondsto the GC bias or the AT bias of the genome whichever is greater), or from codon tables.
In mammals, for example, the G/A ratio in the Codon Usage Database is ca. 0.55 - 0.60
[NakOO].
2.2 Fluctuation of the /2-values
The actual number of mutations in each gene fluctuates amongst pairs of sequences that
started to diverge at the same time. This will generate a statistical distribution of the f2values. Since we know the number of characters used to calculate the f2 value, we can
fit this to a binomial distribution, as long as the distribution is expected from fluctuation
alone:
U{x'\ (100 - x')\)
2 l 2)
Where x' = 100 • x, x is the the actual /2-value, F2 is the expected value, N is the
number of sequence-pairs analyzed, and y is the number of pairs that will have an f2 of
x. (This equation is for genes with 100 characters used in the iV2i?Z)-calculation and will
need to be normalized to adjust for different numbers of characters.)
If the measured distribution of f2 fits the distribution expected from fluctuation alone,
we need not invoke differential rates of silent substitutions in different genes ("hot spots"),different codon biases in different genes, or other non-first order processes to account for
them.
This analysis will be illustrated later in 3.5.
2.3 Comparison of restricted silent substitutions with
PAM distances
The N2ED\s a distance calculated from a particular set of DNA sequences. Thus, it
parallels the PAM distance between two protein sequences calculated using the Dayhoffmethod (see Chapter 1). We can therefore compare the two.

26 Chapter 2. The Nearly Neutral Evolutionary Distance
For this purpose, a set of matched pairs of protein sequence from mammals were
extracted from the MasterCatalogby EraGen Biosciences for the purpose of supporting
interpretive genomics). This represented all pairs from GenBank release 114. For each
pair, both a PAM distance and an f2 were calculated. Fig. 2.2 shows a plot of PAM versus
i
08
0 100 200
PAM
Figure 2.2: Plot ofPAM versus f2.
PAM and /2 do generally correlate, since, on average, two genes with a lower f2 will
have a higher PAM distance separating the encoded proteins than two genes with a higherf2. A large variance exists in the plot:
Many proteins that have a low PAM nevertheless are encoded by genes having a very
low f2, for some, the f2 is close to equilibrium. These should, according to theory behind
N2ED, be genes that diverged a long time ago. Since their encoded protein have a low
PAM distance, those proteins under strong selective constraints. This means since the time
when they diverged, their functional behaviors have been largely conserved, implying that
their amino acid sequences have been largely conserved as well.
Conversely, some protein pairs have a higher PAM and a f2 value close to unity. The
high value for /2 implies that the pair diverged only recently. If this is true, these can be
explained as proteins that are under positive selection. This implies that the mutant forms
of the protein have higher selective value than the ancestral form, causing them to move
rapidly across the sequence-fitness landscape. This, in turn, implies that the two proteinsare separated by an evolutionary episode where the sequence was changing to create new
functional behaviors, and adapting the protein to a new environment or a new function.
As there is no database of protein homologs with the same or different functions, we
2.4. Comparison of pyrimidine- and purine transitions 27
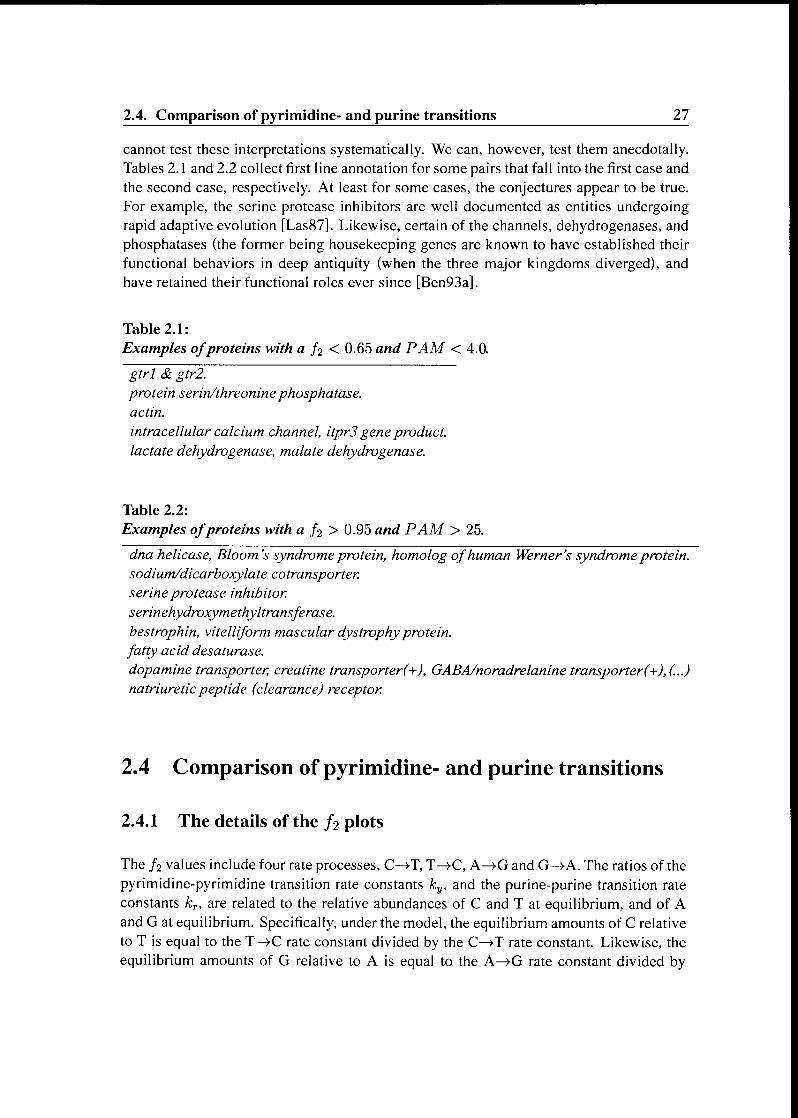
cannot test these interpretations systematically. We can, however, test them anecdotally.Tables 2.1 and 2.2 collect first line annotation for some pairs that fall into the first case and
the second case, respectively. At least for some cases, the conjectures appear to be true.
For example, the serine protease inhibitors are well documented as entities undergoing
rapid adaptive evolution [Las87]. Likewise, certain of the channels, dehydrogenases, and
phosphatases (the former being housekeeping genes are known to have established their
functional behaviors in deep antiquity (when the three major kingdoms diverged), and
have retained their functional roles ever since [Ben93a].
Table 2.1:
Examples ofproteins with a f2 < 0.65 and PAM < 4.0.
gtrl & gtr2.
protein serin/threoninephosphatase.actin.
intracellular calcium channel, itpr3 gene product.lactate dehydrogenase, malate dehydrogenase.
Table 2.2:
Examples ofproteins with a f2 > 0.95 and PAM > 25.
dna helicase, Bloom's syndromeprotein, homolog ofhuman Werner's syndrome protein.
sodium/dicarboxylate cotransporter.
serine protease inhibitor.
serinehydroxymethyltransferase.
bestrophin, vitelliform mascular dystrophyprotein.
fatty acid desaturase.
dopamine transporter, creatine transporter(+), GABA/noradrelanine transporter(+),(...)natriuretic peptide (clearance) receptor.
2.4 Comparison of pyrimidine- and purine transitions
2.4.1 The details of the /2 plots
The f2 values include four rate processes, C-»T, T—>-C, A—>-G and G-»A. The ratios of the
pyrimidine-pyrimidine transition rate constants ky, and the purine-purine transition rate
constants kr, are related to the relative abundances of C and T at equilibrium, and of A
and G at equilibrium. Specifically, under the model, the equilibrium amounts of C relative
to T is equal to the T—>C rate constant divided by the C—>T rate constant. Likewise, the
equilibrium amounts of G relative to A is equal to the A—>G rate constant divided by

28 Chapter 2. The Nearly Neutral Evolutionary Distance
the G—»A rate constant. Further, the two processes cannot be unrelated genome-wide, as
genomic DNA is nearly entirely in a duplex form, meaning that G^C and A«T.
These various reactions need not have identical rate constants; they almost certainlydo not proceed via the exactly identical microscopic mechanisms. For example, C can
deaminate by a chemical process to give U, which might form a base pair with A, leadingto a mutation. Conversely, a minor tautomer of G might pair with T leading to a mutation.
These mechanisms are not available to create the other mutation. Indeed, analysis of
these plots, especially at initial divergences, may give information about the microscopic
processes behind mutation.
For this reason, we explored plots that compared f2r to f2y in various collections of
mammalian sequences. Figure 2.3 shows such comparisons for human-human paralogs
(panel A) and mouse-mouse paralogs (panel B). The comparison of paralogous sequences
does not ensure that the rate constants are time-independent, of course. But it does en¬
sure that over any given period of history, the genes being compared are in the same
genome. The model assumes that the transition rate constants are constant within the
entire genome. In their general shape, these plots are as expected: f2r sa f2y, starting at
(1,1) on the plot (the upper right corner of the diagram) and ending near (0.5,0.5), the
position where equilibrium is reached. The equilibrium position is a bit higher than 0.5,
as the codon bias in mice and humans is between 0.55 and 0.60. A linear fit gave a slopeof 0.905 for the human paralogs, and a slope of 0.912 for the mouse paralogs.
A B
1 1 1 ' ' ' ' ' .'.;' im1 1 ' 1 1 i ' i ' i ' i ' i ,'M
0.9
-
'
'
/'
*^ **s
"
0.8 - *v»*^*ïçHsp 0.8 -
0.7
0.6
-
.:Ä^' :0.6
•
f2r 0.5
. •'•$$p*r£"'~ f2r
04 • <"t*rfi' 04 -
0.3
0.2 0.2 -
0.1
- , 1 , 1,1,1,1,1,1,° , ,1,1 1,1,1,1,! 1 ,
0.1 0.2 0.3 0.4 0.5 0.6 0.7 0.8 0 9 01 0.2 0.3 0.4 0.5 0.6 0.7 0.8 0.9
f2y f2y
Figure 2.3: A plot of fly versus f2r overall for human-human paralogs (panel A)
and mouse-mouse paralogs (panel B). The darker spots correspond to longer sequences,
where the fluctuation error is smaller.
The human and mouse plots corresponded closely. This implies that the relative rate
constants for transition processes are similar in humans and mice. It does not, of course,

2.4. Comparison of pyrimidine- and purine transitions 29
imply that the absolute rate constants are the same. This suggested that the rate processes
were similar in all mammals. We therefore constructed the same plot for all mammal
pairs. This is shown in Figure 2.4. A linear fit gave a slope of 0.906.
1
*^^^^^^%
08
06 *l;«fä»W*f2r
04 / *~^
02
| f2r = 0 09376? + 0 90609 f2y |
02 04 06 08
f2y
Figure 2.4: A plot offly versus fir overall
for all mammalianparalogouspairs.
2.4.2 Modeling the plots
It is perhaps surprising that the relationship between f2r and f2y has a linear fit with a
slope near unity. This implies that the rate constant for pyrimidine-pyrimidine transitions
is nearly the same as the rate constant for purine-purine transitions. This is not requiredby chemistry, for the reasons outlined above.
The slope of the linear fit is, however not exactly unity, and if one did a fit by hand,
that line would curve slightly. This can be explained by the hypothesis that the purinetransition rate constant is smaller than the pyrimidine transition rate constant, but the
pyrimidine and the purine transitions approach similar equilibrium values.
To estimate the relative values of these transition rate constants, an equation was de¬
rived to relate f2r and f2y:
f2y = (e-k^-{l-by)) + by
f2r = (e-k*t-(l-br)) + br
30 Chapter 2. The Nearly Neutral Evolutionary Distance
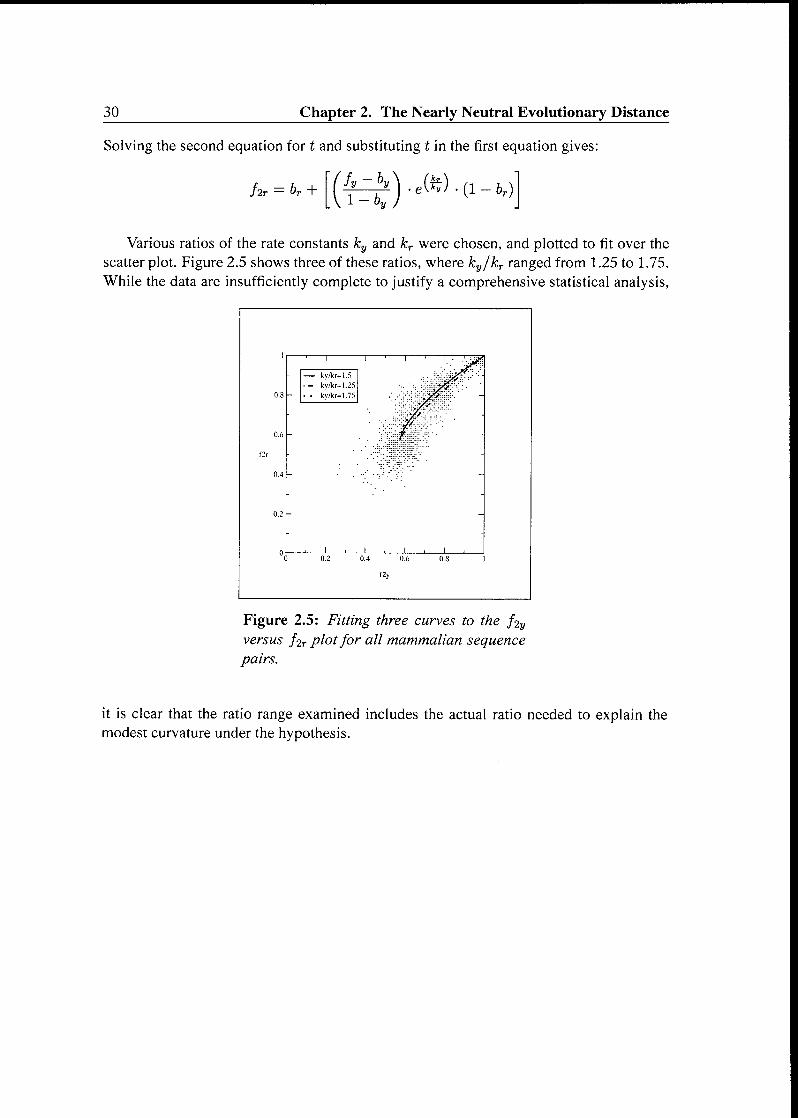
Solving the second equation for t and substituting t in the first equation gives:
Ht — br + (Äzi)..(«.a_fcVarious ratios of the rate constants ky and kr were chosen, and plotted to fit over the
scatter plot. Figure 2.5 shows three of these ratios, where ky/kr ranged from 1.25 to 1.75.
While the data are insufficiently complete to justify a comprehensive statistical analysis,
1 1 1 1 ' 1 ' 1 '
- k>/kr=l 5
- ky/kr=l 25 ,y*~08 ky/kr=l 75
$06 " "
04 - -
02 -
01 1,1,1,
0 02 04 06 08 1
f2y
Figure 2.5: Fitting three curves to the f2yversus f2r plotfor all mammalian sequence
pairs.
it is clear that the ratio range examined includes the actual ratio needed to explain the
modest curvature under the hypothesis.

Chapter 3
Evaluating N2ED9s. Interspecies
Analysis
3.1 Theoretical and practical considerations
The -/V2£Z)distances are readily calculated. But do they provide dates? To extract dates
from JV2i£Ddistances, the rate constants for transitions be must time-independent. Con¬
versely, the quality of dates extracted from N2EDva\ues depends on the extent to which
the rate constants are time-independent. To assess the value of N2ED's in dating, we
need to obtain non-molecular data for calibration. For this, we turn to the fossil record.
3.1.1 The fossil record
Four centuries of natural history have provided us with a marvelously detailed picture of
the history of life on Earth, at least for the past 500 million years, when the radiation of
multicellular animals and plants began. This is told in the strata of sedimentary rocks and
the fossil that they contain.
The subjects of geology, stratigraphy, and paleontology are too vast to review here.
For our work with vertebrate genomes, we made reference to two classic books on verte¬
brate paleontology, one by Carroll [Car88], the other by Romer [Rom66]. Both providedates for major episodes of vertebrate divergence, presumably accurate to within 10-20%.
Many have used the paleontological record to calibrate the molecular record. Three
studies were especially important in the work reported here. The first is work by
Miyamoto et al., at the University of Florida [LiuOl], who analyzed mammalian radia¬
tions with great detail. Their tree is shown in Figure 3.2.
31

32 Chapter 3. Evaluating N2ED's. Interspecies Analysis
The second is by Dilcher and his coworkers, also working at the University of Florida.
These workers have done studies on the origin and radiation of angiosperms (flower¬
ing/fruiting plants) [DilOO].
The last is work done by Blair Hedges and his coworkers at the Pennsylvania State
University. They have developed a model for vertebrate divergences based on proteinmolecular sequence data. [Kum98, HedOl].
While we have used the work of Miyamoto, Hedges, and their colleagues in analyzingmammalian radiative divergence, it should be noted that their trees are generated from
protein sequence data. Given the vagaries of the molecular clocks, the limited amount of
sequence data, and other issues, trees generated using protein clocks do not necessarilyall have the same topology, at least in their details. On the positive side, dates through¬out the tree can be corroborated using the fossil record and classical cladistics based on
morphological characters.
3.1.2 The ortholog paralog problem
How can we validate the iV2updating tool using the fossil record?
In principle, we might find (somewhere) a large collection of pairs of gene sequences
that have diverged at a known date. We then would determine the ./V2i£Dseparatingthe members in each pair. The rate constant would be extracted from a plot of the
N2EDva\ues versus the time of divergence (the slope of the line in the plot). Unfor¬
tunately, it is not trivial to find this set of sequences diverging at a known date. Indeed,
this is why we need a tool to date sequence divergences in the first place.
One approach is to identify pairs of proteins in two species (humans and mice, for
example), one from each species, where the date of the divergence of the two speciesis known from the fossil record, perhaps only approximately. We would then calcu¬
late the N2EDbetween each pair. If all of the pairs represent true orthologs, then the
iV2.EDbetween the two should all be the same.
While this approach is direct, it is complicated by the realities of gene duplication, re¬
cruitment, and loss during divergent evolution in real protein families. Consider different
ways in which homologous genes might be distributed in the genomes of two species, in
this example, human and mouse (Fig. 3.1). These species diverged ca. 80 million years
ago (MYA).
The simplest case, represented by Tree A (Fig. 3.1), is discussed in the previous
paragraph. It is possible, however, for the gene families being examined to have suffered
duplication (independent of speciation) to create paralogous genes. Duplications may, for
example, have occurred after speciation (Tree B, Fig. 3.1) to give two homologs in mouse
Mi and M2) and two in humans {H\ and H2). The family will be overrepresented in the
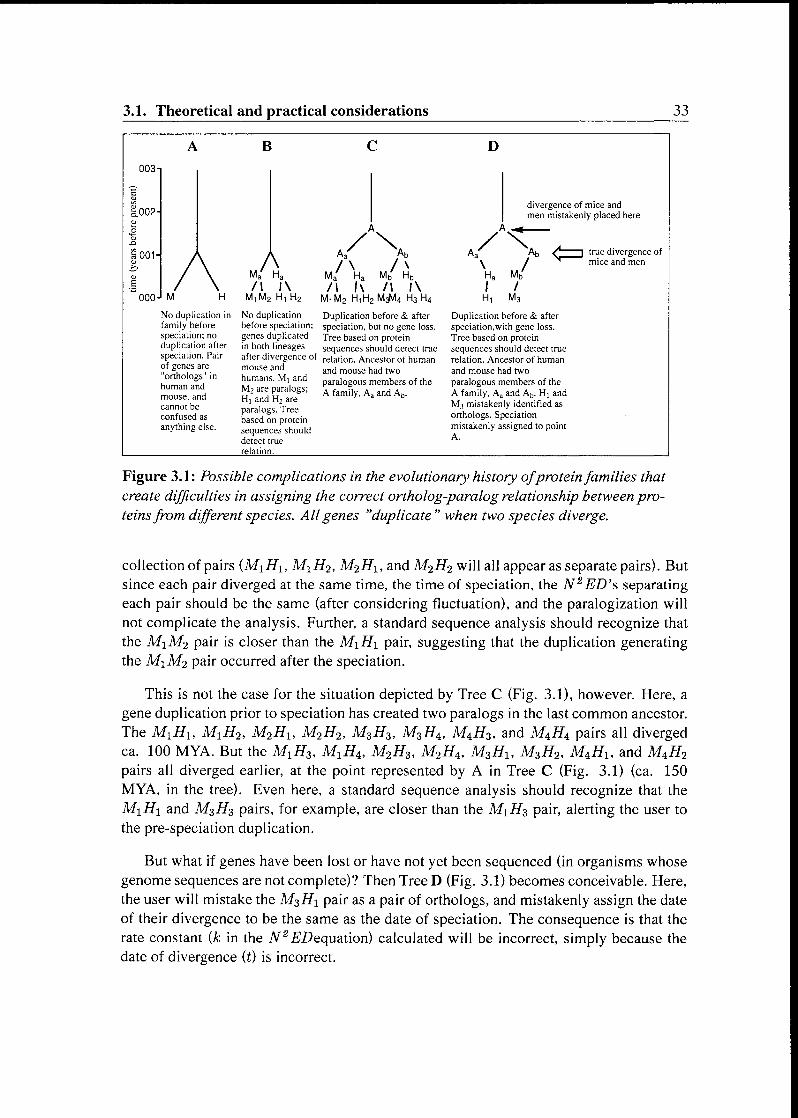
3.1. Theoretical and practical considerations 33
A B c D
003-
S onndivergence of mice and
O.002- men mistakenly placed here
ie
(yearsbefore
o
/\ ÀMa Ha
A
Af XAb/ \ / X
Ma Ha Mb Hb
A •<
/ "\Aa Ab <_ 1 true divergence of
\ / ^mice and men
Ha M/E / \ /I /\ /I l\ l\ \\ / /"OOCH M H M,M2 Hi H2 I^Wfe H1H2M^vl4 H3H4 H! M3
No duplication in No duplication Duplication before & after Duplication before & after
family before before speciation, speciation but no gene loss speciation with gene loss
speciation, no genes duplicated Tree based on protein Tree based on proteinduplication after m both lineages sequences should detect true sequences should detect true
speciation Pair after divergence o relation Ancestor of human relation Ancestor of humanof genes are mouse and and mouse had two and mouse had two
orthologs in
human and
mouse and
cannot be
humans Mi and
M2 are paralogsHj and H2 are
paralogs Tree
based on protein
sequences should
paralogous members of the
A family Ad and A|,paralogous members of the
A family Ad and Ab Hj and
M3 mistakenly identified as
confused as
anything else
orthologs Speciation
mistakenly assigned to point
detect trueA
relation
Figure 3.1: Possible complications in the evolutionary history ofproteinfamilies that
create difficulties in assigning the correct ortholog-paralog relationship between pro¬teinsfrom different species. All genes "duplicate" when two species diverge.
collection of pairs (M\Hi, M\H2, M2H\, and M2H2 will all appear as separate pairs). But
since each pair diverged at the same time, the time of speciation, the N2ED's separatingeach pair should be the same (after considering fluctuation), and the paralogization will
not complicate the analysis. Further, a standard sequence analysis should recognize that
the M\M2 pair is closer than the M\H\ pair, suggesting that the duplication generatingthe M\M2 pair occurred after the speciation.
This is not the case for the situation depicted by Tree C (Fig. 3.1), however. Here, a
gene duplication prior to speciation has created two paralogs in the last common ancestor.
The MiHi, MXE2, M2HX, M2H2, M3H3, M3H4, M4H3, and M4.H4 pairs all divergedca. 100 MYA. But the MXH3, Mi#4, M2H3, M2H4, M3HX, M3H2, Af4#i, and M4H2
pairs all diverged earlier, at the point represented by A in Tree C (Fig. 3.1) (ca. 150
MYA, in the tree). Even here, a standard sequence analysis should recognize that the
M\H\ and M3H3 pairs, for example, are closer than the M\H3 pair, alerting the user to
the pre-speciation duplication.
But what if genes have been lost or have not yet been sequenced (in organisms whose
genome sequences are not complete)? Then Tree D (Fig. 3.1) becomes conceivable. Here,
the user will mistake the M3Hi pair as a pair of orthologs, and mistakenly assign the date
of their divergence to be the same as the date of speciation. The consequence is that the
rate constant (k in the iV2£'Z)equation) calculated will be incorrect, simply because the
date of divergence (t) is incorrect.

34 Chapter 3. Evaluating N2ED's. Interspecies Analysis
3.2 Mammalian taxa and the N^ED2
With these complexities in mind, sets of data comparing proteins across the vertebrate tree
as provided by Miyamoto and his coworkers [LiuOl], were generated. The same analysiswas also done based on the tree presented by Hedges and his coworkers [Kum98]. We
will illustrate two individual cases.
eutheria
edentata
epithena
f2=0 83
f2=0 75/148MYAafrothena
f2=0 78/121MYA
f2=0 84/ 79MYA
eurarchonta
pnmata,scandentia,
scrotifena
_J,
dermoptera fer^gulata ohiroptera
f2=0 89/ 50MYA
ferae
I
macroscelldea, napniinnulatatubulidentata paenunguiata
tethytena hyracoidea
proboscidea
glires
| f2=0 90/ 44Mya|Carnivora phofidota cetartiodactyla penssodactyla
| f2=0 93/ 30MYA |cetacea hippoptamidea,
ruminatia, suina,
tylopoda
I f2=0 86/67MYA |lagomorpha rodentia
Figure 3.2: Miyamoto tree showing the radiative divergence ofmammal orders, from[LiuOl]
The input for the analysis was the MasterCatalogby EraGen Biosciences version
1.0, which contains a set of modularized families assembled from GenBank 114. For each
pair of taxa, families within the Master Catalog containing at least one representative of
each taxon were identified. If the family contained more than one sequence from a speciesthat belongs to a taxon in question, the two sequences were examined individually to
determine whether they were duplicate entries into the database. Duplicates were defined
as sequences that belong to the same species, are separated by a PAM distance of less than
4, and have a /2-value of greater than 0.98. Of such duplicates, only one was retained for
the analysis.
A database of alignments of protein sequences, one from each taxon, was then as¬
sembled after the duplicates were removed. An f2 value was then calculated for each
alignment. The f2 values were then sorted by decreasing f2 values, and histograms were
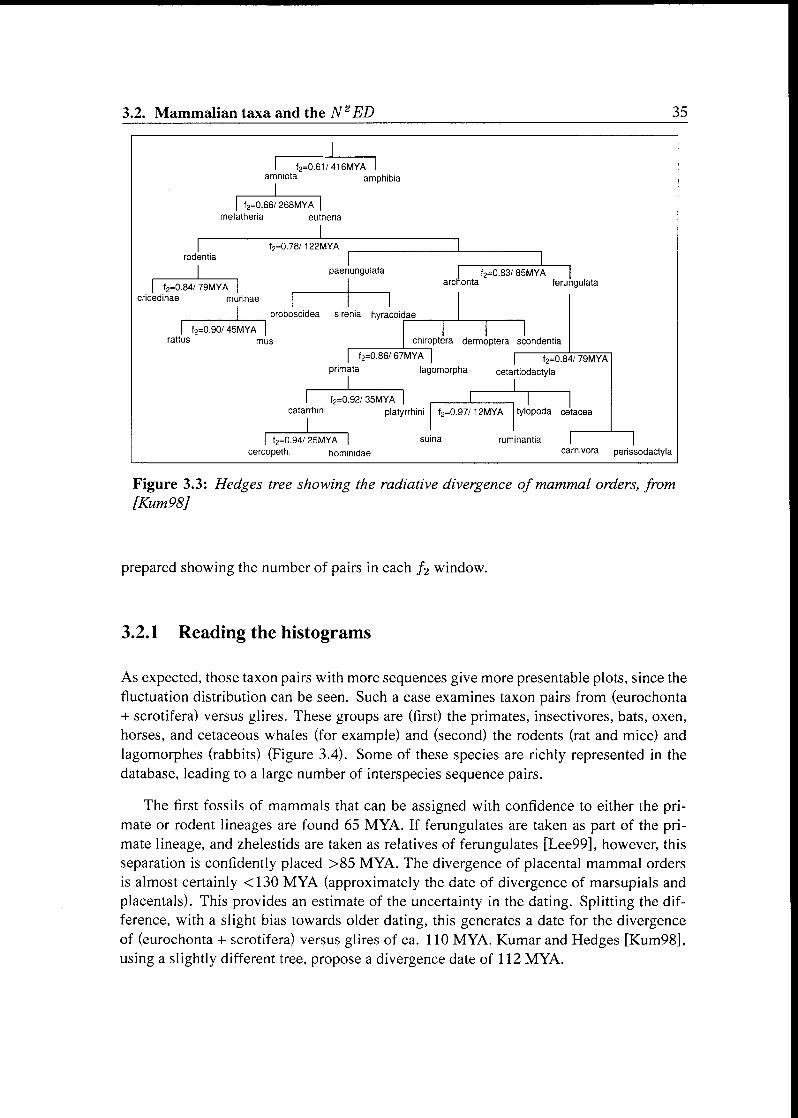
3.2. Mammalian taxa and the N2ED 35
11 f2=0 61/416MYA I
amniota amphibia
| f2=0 66/ 268MYA |metathena eutheria
| f2=0 78/122MYArodentia
ungulata
|I paer f2=0 83/ 85MYA
| f2=0 84/79MYA | archonta ferungulata
cncedmae murmae I
I probosoidea sirenia hyracoidae
| f2=0 90/45MYA |rattus mus chiroptera dermoptera scondentia
12=UBb/b7MYA | | fs=08primata lagomorpha cetartiodactyla
I I
4/ 79MYA
tacea
I f2=0 92/ 35MYA I |catarrhini platyrrhini f2=0 97/12MYA tylopoda ce
| f2=0 94/25MYA |cercopeth hominidae
suina ruminantia I |Carnivora perissodactyla
Figure 3.3: Hedges tree showing the radiative divergence of mammal orders, from
[Kum98]
prepared showing the number of pairs in each f2 window.
3.2.1 Reading the histograms
As expected, those taxon pairs with more sequences give more presentable plots, since the
fluctuation distribution can be seen. Such a case examines taxon pairs from (eurochonta
+ scrotifera) versus glires. These groups are (first) the primates, insectivores, bats, oxen,
horses, and cetaceous whales (for example) and (second) the rodents (rat and mice) and
lagomorphes (rabbits) (Figure 3.4). Some of these species are richly represented in the
database, leading to a large number of interspecies sequence pairs.
The first fossils of mammals that can be assigned with confidence to either the pri¬mate or rodent lineages are found 65 MYA. If ferungulates are taken as part of the pri¬mate lineage, and zhelestids are taken as relatives of ferungulates [Lee99], however, this
separation is confidently placed >85 MYA. The divergence of placental mammal orders
is almost certainly <130 MYA (approximately the date of divergence of marsupials and
placentals). This provides an estimate of the uncertainty in the dating. Splitting the dif¬
ference, with a slight bias towards older dating, this generates a date for the divergenceof (eurochonta + scrotifera) versus glires of ca. 110 MYA. Kumar and Hedges [Kum98],
using a slightly different tree, propose a divergence date of 112 MYA.

36 Chapter 3. Evaluating N2ED's. Interspecies Analysis
1000
800
=- 600
§ 40(1
200
|!|| ÜH !
nrfjEPP^^l, , , , , 1
0 4 OS 0 6 0"
f2
' a 09 1
Figure 3.4: Histogram showing the f2 distribution ofpairs ofsequences, where one se¬
quences comes from a taxon within the (eurochonta + scrotifera) orders, and the other
comes from a taxon within the glires orders. The (eurochonta + scrotifera) orders in¬
clude primates, insectivores, bats, oxen, horses, and cetaceous whales. The glires orders
include rodents and rabbits (lagomorpha). Panel A. Collects f2 values from all pairs
regardless of the number of characters. Some of the pairs have only a few conserved
characters (including some with only one, two or three characters). This accounts, ofcourse, for the prominentpeaks with an f2 of 1.0, 0.5, 0.67, and 0.33. Panel B. Collects
f2 values from pairs that generate more than 75 characters, with the pair of sequenceshaving diverged less than 150 PAM units (to ensure a reasonableplacement ofgaps, and
a reasonably reliable alignment). Panel C. Collects f2 values from pairs that generate
more than 100 characters, with the pair ofsequences having diverged less than 120 PAM
units.

3.2. Mammalian taxa and the N2ED 37
As Figure 3.4 shows, the quality of the histogram is determined by the number of
characters used to generate the f2 value. Clearly, short sequences generate f2 values with
a relative larger error. For this reason, only pairs with more than 100 characters were
routinely used, and PAM distances less than 120.
The distribution constructed from the most stringent criteria has several obvious fea¬
tures. First, very few sequence pairs have f2 values greater than ca. 0.90. This implies that
there has been little lateral transfer between the taxa, in addition to suggesting that there
are no extremely "cold spots" shared by the genomes, regions that suffer an abnormallylow level of mutation (even at silent sites).
The other features of the plots likewise meet expectations based on the model. The
histogram shows a steep fall off (left to right) with a midpoint around f2 « 0.84, startingfrom a peak at f2 = 0.79. There is a long "tail" towards lower f2 values, including the
hint of a second peak at f2 ~ 0.58. This second peak is more pronounced in Figure 3.4
(Panel B), where more divergent sequences are included with the higher PAM and lower
N cutoffs.
The maximum corresponding to the peak at f2 « 0.79 is presumed to reflect true
orthologs. These are pairs of genes, one from a representative taxon descending from
either side of the branch point, that diverged at the same time as the taxa diverged. The f2value corresponds to a N2EDof 0.68 transitions/site. If we assume a divergence time of
110 MYA, and a codon bias of 0.575 (typical for mammals), the transition rate constant
is calculated to be ca. 3.1 • 10-9 transitions/site/year. This value is consistent with values
presented by others [Li97].
In contrast, most of the pairs of genes that have lower f2 values are interspecies pairswhose divergence predates the speciation. These have paralogous relationships [FitOO]
(see Figure 3.4).
The peak at f2 » 0.58 represents (according to the model) interspecies pairs that di¬
verged so long ago that the N2EDsites have equilibrated. These are certainly paralogous
pairs, if the transition rate constant is ca. 3.1 • 10~9 transitions/site/year.
We can ask whether the breadth of the distribution requires an explanation more com¬
plicated than simple fluctuation error. To do this, we superimposed a binomial distribution
curve for 150 characters (see 2.2) and the first peak of a set of proteins where 120<N<180
(Figure 3.5).
The fit is surprisingly good, reproducing the rise in the distribution on the right side
(high f2 values) quite well. This does not rule out differential rate constants, hot spots, or
cold spots, of course. But it does imply that we need not invoke these factors to explainthe gross features of the distribution. This is important. It means that N2ED's can at least
rank-order duplications events.

38 Chapter 3. Evaluating N2ED's. Interspecies Analysis
wo
ZiO
C 200
â i>o
= 100
0
Figure 3.5: Superimposing a binomial
distribution for 150 characters on the
histogram collecting f2 values from the
taxon pair: (eurochonta + scrotifera) ver¬
sus glires. Thepeak ofthe distribution was
chosen to correspond to the first plausiblemaximum ofthe measured data.
3.2.2 Uninformative histograms due to small sample sizes
Less useful plots are obtained, if the sample has fewer aligned sequence pairs. For ex¬
ample, Figure 3.6 compares the pholidota (the scaly anteater) with the Carnivora. With a
total of seven pairs, the analysis can proceed no further.
3.2.3 N2ED can be used date some speciation events
The other sets have intermediate numbers of aligned sequence pairs, and need no specialcomment. We did extract a f2 value by estimating were the first peak lies. These values
are placed on the tree in Figures 3.2 and 3.3 (above).
They are remarkably consistent with expectations drawn from the fossil record. One
problematic pair is at the top of the eutherian (placental mammals) tree 3.2. Here, the /2is 0.83. Higher than the /2's values estimated for nodes farther down the tree. The number
of sequence pairs in the peak that putatively represent true orthologs is, of course, small.
This analysis shows the primary disadvantage of the -/V2i£Dapproach; it is extremelyconservative.
The 7V5.E.Dapproach follows the instincts of the chemist, which are to focus the sam¬
pling to collect only those events that are likely to follow analogous mechanisms. This
04 OS 06 07 08 09 1
f2

3.3. Addressing the ortholog-paralog problem 39
0 01 02 Oi 04 OS 06 07 U8 09 1
f2
Figure 3.6: Histogram showing the f2distribution ofpairs of sequences, where
one sequences comes from a taxon within
the pholidota (the scaly anteater), and the
other comes from a taxon within the Car¬
nivora. With a total ofseven pairs, the his¬
togram is uninformative.
is done to minimize systematic error. The advantage of the N2EDapproach comes from
its greater chance of identifying "pure" rate constants. By looking at sites where the
amino acid is conserved, we remove any need for a model that incorporates selection
bias at the level of the protein sequence. We expect the iVsEZ)distance to be a better
(more clock-like) metric to date events in the molecular record. The disadvantage of the
iV5i?Dapproach is that the number of characters used to calculate f2 is lower, and there¬
fore the potential for fluctuation error is larger.
In contrast, the underlying philosophy of the PBL method (see: 1.7.3) for examplefollows the instincts of the statistician, which are to increase the size of a data sampleas much as possible for the purpose of minimize error due to fluctuation. Therefore, it
structures the search to include any replacement that could possibly be silent.
3.3 Addressing the ortholog-paralog problem
We are now prepared to address the problem of distinguishing orthologs from paralogs. It
is believed that one can adopt annotation from a protein in one taxon to the homologous
protein in another if the proteins are orthologous.
As discussed above, in the absence of a dating tool, and given the possibility of selec-

40 Chapter 3. Evaluating N2ED's. Interspecies Analysis
tive gene loss, it is difficult to distinguish orthologs from paralogs. With the N2EDdates,
however, it is possible to make this distinction. Here, an paralogous pair of genes is recog¬
nized as being a pair separated by a N2EDthat is (significant) greater than the N2EDpakfor the majority of the genes between two taxons. Thus orthologous pairs of proteins in
the human and mouse taxa can be found in the main peak at f2 = 0.79 in the histogramin Figure 3.7, whereas pairs that are represented to the left side of that peak. They were
Figure 3.7: Histogram showing the f2 distribution ofpairs
ofsequences, where one sequences comesfrom man (Homo
sapiens), and the other comesfrom mouse (Mus musculus).
Sequence-pairs were only used if they have more than 100
positionsfor the f2 calculation and had diverged less than
120 PAM units. The arrow to left of the main peakpointsto pairs ofproteins in human and mouse that have a paral¬
ogous relationship.
generated by a duplication in the ancestral lineage before humans and mice diverged.
'23.4 N^ED distances to build trees
3.4.1 Getting the data
Since N2ED's, are distances, one should be able to use them to build a tree interrelating
species using a distance matrix approach. We tested this on a set of species that have a

3.4. N2ED distances to build trees 41
large number of entries in the database: human, rat, pig, mouse, rabbit and cow. To build
this tree, families from the MasterCatalogcontaining at least one representative of two
species were identified, as above. The /2-values were calculated for all pairs between the
species. If more than one pair is found in any family between the identical species, the
pair with the highest /2-value was chosen, under the assumption that this was the most
likely pair to have members having an orthologous relationship.
The f2 values were then plotted in a histogram, and the maximum estimated to give an
optimal f2 value for all species pairs. From this, the N2EDwas calculated using a codon
bias of 0.575. These are collected in Table 3.1.
Table 3.1: The N2EDvalue. A codon bias of0.575.
manrat rabbit pig mouse
rabbit 0.729
pig 0.51 1 0.472
mouse 0.268 0.779 0.729
man 0.681 0.435 0.435 0.729
cow 0.832 0.681 0.365 0.887 0.511
A tree was then calculated from the N2EDva\ues using the distance matrix tool im¬
plemented in PAML [Swo98]. This tree is shown in Figure 3.8.
3.4.2 Comparison of N2ED trees with other trees
The trees 3.8 corresponds well with the consensus view of the tree relating these mam¬
malian orders [Car88, LiuOl, Kum98], obtained by a combination of the paleontological,
geological, and molecular records.For example, the view holds that primates and artio-
dactyls are more closely allied than either is with the rodents. The only difficulty seems
to be where the lineage that leads to rabbit ties in.
Again as noted in the last section the separation between primate and rodent lineagesis confidently placed >85 MYA [Lee99]. Likewise, the mouse/rat divergence is certainly>20 MYA, but some view the data as old as 60 MY. The divergence of placental mammal
orders is almost certainly <130 MYA, and is variously placed at ca. 90 MYA. Given the
best tree, the transition rate constant in primates is 2 • 10~9, in rabbit 3 • 10-9, in artiodactyl3 • 10-9, and in rodents 5 • 10-9 transitions/site/year.
The fact that the rodent genomes evolve more rapidly than the primate and ungulate(ox and pig) genomes is well documented in the literature.
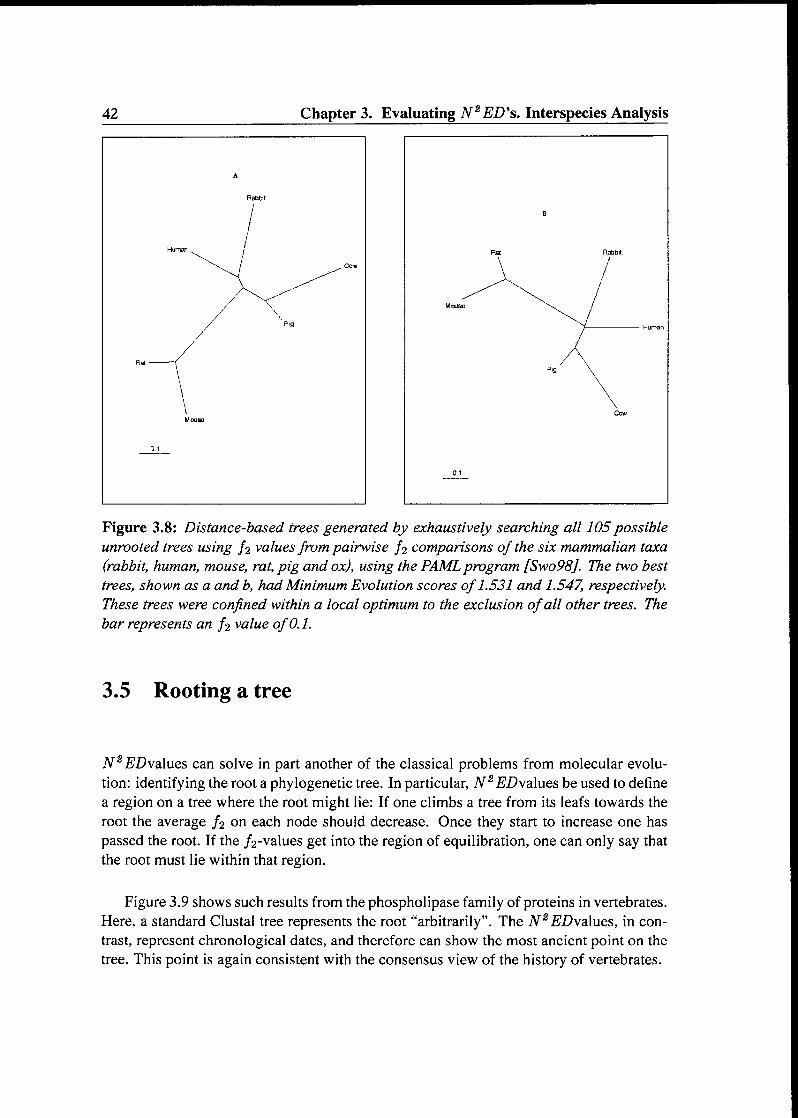
42 Chapter 3. Evaluating N2ED\. Interspecies Analysis
Figure 3.8: Distance-based trees generated by exhaustively searching all 105possibleunrooted trees using f2 valuesfrompairwise f2 comparisons of the six mammalian taxa
(rabbit, human, mouse, rat, pig and ox), using the PAMLprogram [Swo98]. The two best
trees, shown as a and b, had Minimum Evolution scores of1.531 and 1.547, respectively.These trees were confined within a local optimum to the exclusion ofall other trees. The
bar represents an f2 value of0.1.
3.5 Rooting a tree
iV2 upvalues can solve in part another of the classical problems from molecular evolu¬
tion: identifying the root a phylogenetic tree. In particular, N2EDva\ues be used to define
a region on a tree where the root might lie: If one climbs a tree from its leafs towards the
root the average f2 on each node should decrease. Once they start to increase one has
passed the root. If the /2-values get into the region of equilibration, one can only say that
the root must lie within that region.
Figure 3.9 shows such results from the phospholipase family of proteins in vertebrates.
Here, a standard Clustal tree represents the root "arbitrarily". The JV2upvalues, in con¬
trast, represent chronological dates, and therefore can show the most ancient point on the
tree. This point is again consistent with the consensus view of the history of vertebrates.

3.5. Rooting a tree 43
IMEgiB04795__Najst naja bpirtaifix [24] ox
gi804797Najanajasputatnx[231
gi4i 15520 Naja kaouthis [22] CV
gjîgi804797Najanajasputatnx[231
cw
ovo IT 9i4115S22_Najakaouthia[21] cu
,y;l '" |.3]
o 0 g:395191_Js'«ja aaja atra [201 ta
gi4Sê27Q._Naja naja ana [19J CS
gi62505 Bungaras multkiocLUS [
JjJ QI62473 JBtmganisxiii!kiiicius[13] cm
M61 g!62501 Bungaras iEuldcmetus[t 5] CO
œf - IT a^105 Noeechis scutatui [25] cy
,^î gi624G1 Aipyumislaevispai cr
gB924334_Auaielaps superbus [30] CD
" gi5924326_A-astr«]aps superbus [28] c8
ÎJg gi5924322_Ausirelsps superbus [27] cA
gi5924332_Ajstrel»ps superbus [29] cC
gi641D9 Notechis scutum [26] c*
gi9049434_ Latkautk semifasciata [17] eg
,gj giS4047 lAtc«idataticaudata(16] Op
DufaXfT gi5924340_A"j3!fdaps superbus [31] <£
3563 i l'ë]
0«? gi5924346_Ajsttelsps superb« [32] cF
M., gi5924348„A'jstreIaps superbus [33] CG
CS52 0.«
013 I""* 914406187_Mus imuaiius [03] cc
This, node is associated with the
lowest va.ue Tor fi (0.556), indicating
the potential root of the tree.
\
IK?
0E21
\ 0183
3te:
PI
K]
tl
'25
HI
0JS3
13,
jjjj gi220874_RBtW5norvégiens [02] cb
ai»
p; gi164041_„Canisfarmliaris[0?] eg
d^J" gi190009_Homc sapiens [OS] Ci
g!164611__Sus scrota [05] ce
07« giS34_ _Bos tau-us [04] cdS
040£
ej" : iss
gi398i28_Cav»aporceIïucfQ1] ca
gi26e2294_Chrysophrys major [09] i
0473E' 9I26S2
913171_• gI3171740_DicciuiarehuslabnK(08] ChC336
333
162?
185
I «6
gi5923909„AüitiBlaps superbus [10] cj —
gi£230717_Pseudonajatej!Dlis!12] cl J"
gi5230715_Pscudoflaja textilis [11] ck
Figure 3.9: Thephospholipase tree, courtesy ofDr. Stephan Audétat, with f2 values
placed on the nodes. Theproposed root is marked with an arrow.

44 Chapter 3. Evaluating N2ED,s. Interspecies Analysis
3.6 Aromatase: an example of N^ED analysis
Limits on the quality of the data and the number of sequences make it premature to exam¬
ine this approach for all vertebrates. Nevertheless, for some specific gene families, there
are enough data to provide useful hypotheses. Aromatase provided one example.
3.6.1 The problem
The example was posed by Logan Graddy, a Masters Degree candidate with Dr. Ros¬
alia Simmen in the in the Animal Science Laboratory at the University of Florida. Mr.
Graddy had just completed a molecular biology study of the aromatase gene family in
pigs (Sus scrofa). This study that showed that the pig genomic had three distinct genes
for aromatase isozymes, differing by ca. 30 PAM units. Graddy found this surprising in
light of a report of Callard and Tchoudakova [Cal97], who had found two genes for two
aromatase iso forms in goldfish. Because two genes were also known in ox, Callard and
Tchoudakova proposed that two aromatases were present in the ancestor of fish and ox,
which diverged some 350 million years ago. If this were true, it implied that the paral¬
ogous aromatase genes were generated by gene duplication early in vertebrate evolution.
This in turn implies that the distinction between the function of these two genes had some
basis in a rather primitive function of estrogens in vertebrates.
Upon further inspection, the molecular biology of the aromatase family in vertebrates
proved to be complicated. Only a single aromatase gene was found in horse [Boe97], rat
[Hic90], mouse [Ter91], human [Har88], and rabbit [Del96]. The second gene in oxen
is in fact a severely nonfunctional pseudogene built from pieces of exons 2, 3, 5, 8, and
9 and a bovine repeat element [Fur95]; it is transcribed but not translated. In several
mammalian species, a single gene yields multiple forms of the mRNA for aromatase in
different tissues via alternative splicing mechanisms. This is certainly the case in humans
[Sim97] and rabbits [Del98], and may be so in many mammals that have not yet been
studied. The different phenomenology in pig simply added to the confusion.
3.6.2 Classical analysis
An interpretive proteomics analysis was performed using the N2EDdates. These were
used to place the aromatase family members within their evolutionary contexts. A tree
for the aromatase family was generated that included the swine sequences. A normalized
ratio of non-synonymous to synonymous changes (Ka/Ks) [Ben98] was assigned to each
branch of the evolutionary tree. A predicted secondary structure was used to align aro¬
matases to distant homologs whose conformations were known by X-ray crystallography[Ben97].
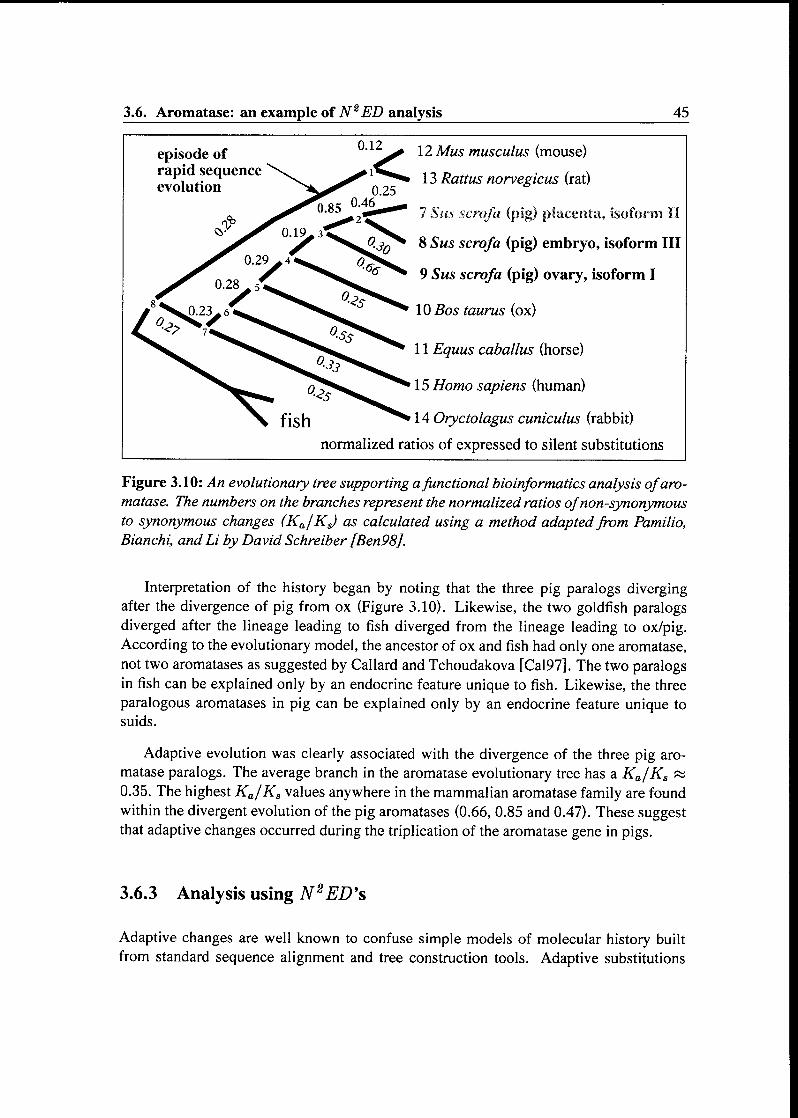
3.6. Aromatase: an example of N2ED analysis 45
12 Mus musculus (mouse)
13 Rattus norvegicus (rat)
7 Sus scrofa (pig) placenta, îsoform ÏI
8 Sus scrofa (pig) embryo, isoform III
9 Sus scrofa (pig) ovary, isoform I
10 Bos taunts (ox)
11 Equus caballus (horse)
15 Homo sapiens (human)
14 Oryctolagus cuniculus (rabbit)
normalized ratios of expressed to silent substitutions
Figure 3.10: An evolutionary tree supporting afunctional bioinformatics analysis ofaro¬matase. The numbers on the branches represent the normalized ratios ofnon-synonymousto synonymous changes (Ka/KJ as calculated using a method adapted from Pamilio,
Bianchi, and Li by David Schreiber [Ben98].
Interpretation of the history began by noting that the three pig paralogs divergingafter the divergence of pig from ox (Figure 3.10). Likewise, the two goldfish paralogsdiverged after the lineage leading to fish diverged from the lineage leading to ox/pig.According to the evolutionary model, the ancestor of ox and fish had only one aromatase,
not two aromatases as suggested by Callard and Tchoudakova [Cal97]. The two paralogsin fish can be explained only by an endocrine feature unique to fish. Likewise, the three
paralogous aromatases in pig can be explained only by an endocrine feature unique to
suids.
Adaptive evolution was clearly associated with the divergence of the three pig aro¬
matase paralogs. The average branch in the aromatase evolutionary tree has a Ka/Ks «
0.35. The highest Ka/Ks values anywhere in the mammalian aromatase family are found
within the divergent evolution of the pig aromatases (0.66, 0.85 and 0.47). These suggestthat adaptive changes occurred during the triplication of the aromatase gene in pigs.
3.6.3 Analysis using N2ED's
Adaptive changes are well known to confuse simple models of molecular history built
from standard sequence alignment and tree construction tools. Adaptive substitutions
46 Chapter 3. Evaluating N2ED's. Interspecies Analysis
do not conform to stochastic rules modeling divergent evolution, do not accumulate in a
clock-like fashion, and may arise through convergent and parallel evolution [Ste87].
Therefore, the evolutionary history of the aromatase family was then re-analyzed us¬
ing N2ED's. As is generally the case for vertebrates (other than rodents), a single lineagefirst order rate constant of 3 • 10-9 changes per base per year gave reasonable dates of
divergence across the tree. Using this rate constant, the divergence of fish and land verte¬
brates was dated at 340 MYA, birds and mammals at 250 MYA, primates and ungulatesat 73 MYA, horse and artiodactyls at 71 MYA, and pigs and ruminants at 62 MYA. Each
of these dates is close to the date suggested by the paleontological record [Car88]. This
result shows that N2ED's are applicable back at least 300 million years.
The N2ED's separating the three pig isoforms range from 0.154 (corresponding to a
distance of 51 million years between the proteins) to 0.199 (corresponding to a distance
of 66 million years). Recognizing that the total distances between two proteins are twice
the distance along a single lineage from the point of divergence to the modern protein(half of the distance occurs along one lineage after divergence, and half of the distance
occurs along the other lineage), the N2ED's suggest that the first duplication led to the
three porcine aromatase genes occurred ca. 33 MYA, and the second occurred ca. 25
MYA. The evolutionary model that holds that the ancestor of pig and oxen (approximatedin the fossil record most closely by the now extinct Diacodexis, which lived perhaps 55
MYA) contained a single aromatase gene, and that the paralogous genes in pig arose ca.
25 million years later. Thus, the paralogs in pig can be explained neither in terms of the
fundamentals of vertebrate development, nor as a consequence of swine domestication.
3.6.4 The paralogs enable large litter sizes
An understanding of why pigs have three genes for aromatase must lie in the environment
of (and events that occurred during) a time on Earth 25-33 MYA. For this we turned to the
paleontological, paleogeographical, and paleoclimatological records of that period, which
is near the boundary between the Oligocène (38-25 MYA) and the Miocene (25-5 MYA),two epochs in the Cenozoic "Age of Mammals" [Pro94]. This period is an unusual one
in the history of the Earth. When characterized globally, the Earth during the Eocene (54- 38 MYA) was warm and tropical, evidently free of ice over the entire planet. By the
end of the Eocene, however, the Earth had begun to suffer a dramatic cooling that was
to lower the mean annual temperature by as much as 15°C[Wol78]. Areas of the planetbecame covered with ice. This climate change has been associated with the closing of the
Drake passage due to continental drift.
The impact of the cooling on the biosphere was dramatic. For example, per¬
haps 80% of the North American faunal genera became extinct (Prothero pp 113-114;
[Pro94, Stu90]). By the end of the Oligocène and into the Miocene 25 MYA, however,
the global cooling abated, the climate turned warmer, and the biosphere became more

3.6. Aromatase: an example of N2ED analysis 47
tropical.
Immediately thereafter, the suids underwent a significant radiative divergence, and
came to occupy all of the Old World. Why might a change in climate with a return of
forested (and perhaps tropical) ecosystems have led to a selection of pigs that had three
different aromatase genes? The porcine reproductive physiology gave us some insight. It
was recently found that the type III aromatase is expressed by the embryo between day11 and day 13 following fertilization, during the late pre-implantation period [Cho97a,
Cho97b]. The estrogen generated by the type III isoform causes uterine undulation. This
undulation, in turn, is expected to cause the spacing of the ca. 30 eggs that are fertilized
in a typical conception, which eventually yield the 8-12 piglets that are normally birthed.
In pigs, if the litter does not contain at least 5 individuals, the entire conception is aborted.
Thus, the embryonic form of aromatase may have a role in spacing the embryos uniformlyaround the uterus, and preventing abortion. These are useful adaptations if one wants to
have an increased litter size.
Evidence in the paleontological record suggests that the size of the litter in pigs in¬
creased dramatically 25-30 MYA, at the same time as isoform III of aromatase was gener¬
ated by triplication, the local paleoclimate warmed, and the pigs began a major radiative
divergence. The ancestral suid Archaeotherium, disappearing from the fossil record at
the end of the Oligocène, may have given birth to a single pup. All of the contempo¬
rary forms of pigs arising from the divergence of Hyotherium and Xenochoerus, known
from the Early Miocene, have large litter sizes. Further, Archaeomeryx, the early Eocene
artiodactyl that is presumed to be the ancestral ruminant, resembles the contemporary
chevrotain, which also births a single pup.
The value of an evolutionary analysis based on a naturally organized Master Catalogis in part how the hypotheses that it generates leads to new experiments. If the hypothesisoutlined above is true, then the peccary should have only a single gene for aromatase.
To test this prediction, peccary seminal plasma (from the Center for Reproduction of En¬
dangered Species, Zoological Society of San Diego) was subjected to PCR amplification
using exon 4-specific primers as described above. Bands having the expected sizes were
observed by agarose gel electrophoresis. Five clones derived from the PCR products were
found to have identical sequences, all different from the sequences of the pig aromatase.
The iVs£"J9comparison (using a rate constant of 3 • 10-9 changes per base per year) sug¬
gested that the peccary diverged 40 MYA from the pig, a date that corresponds well to the
fossil record and the known isolation of the New and Old World paleoecosystems.
The molecular biological, fossil, paleoecological, and physiological evidence are all
consistent with a model that proposes that climate changes in Europe at the end of the
Oligocène selected for pigs that had larger litter sizes. The successful lineage generated a
new embryo aromatase by gene duplication, and expressed it at the time of implantation,
forming the molecular basis of the physiology that enabled large litter sizes. It is possibleto speculate on why a conversion from an open, savanna like environment to a forested
48 Chapter 3. Evaluating N2ED's. Interspecies Analysis
environment might enable larger litter sizes. Contemporary savanna babies are large and
born with the ability to run, presumably because hiding is no alternative. In contrast, in
a forested environment, pups are easier to hide, permitting them to be smaller and less
precocious at birth, permitting in turn a larger number of pups for the same total birth
weight. Indeed, the contemporary Sus scrofa sow hides her piglets in earthen hollows
covered with leaves [Eis81].
Implantation is one of the least well understood steps in mammalian reproductive bi¬
ology, including human reproductive biology. Implantation is, of course, found only in
mammal reproductive physiology, and is itself therefore a relatively recent innovation in
physiology, emerging perhaps 200 MYA. This analysis emphasizes the degree of innova¬
tion and experimentation that is continuing in mammalian reproductive physiology.
Figure 3.11 reproduces the entry in GenBank for the same gene. At no point does the
standard annotation convey the same functional information.
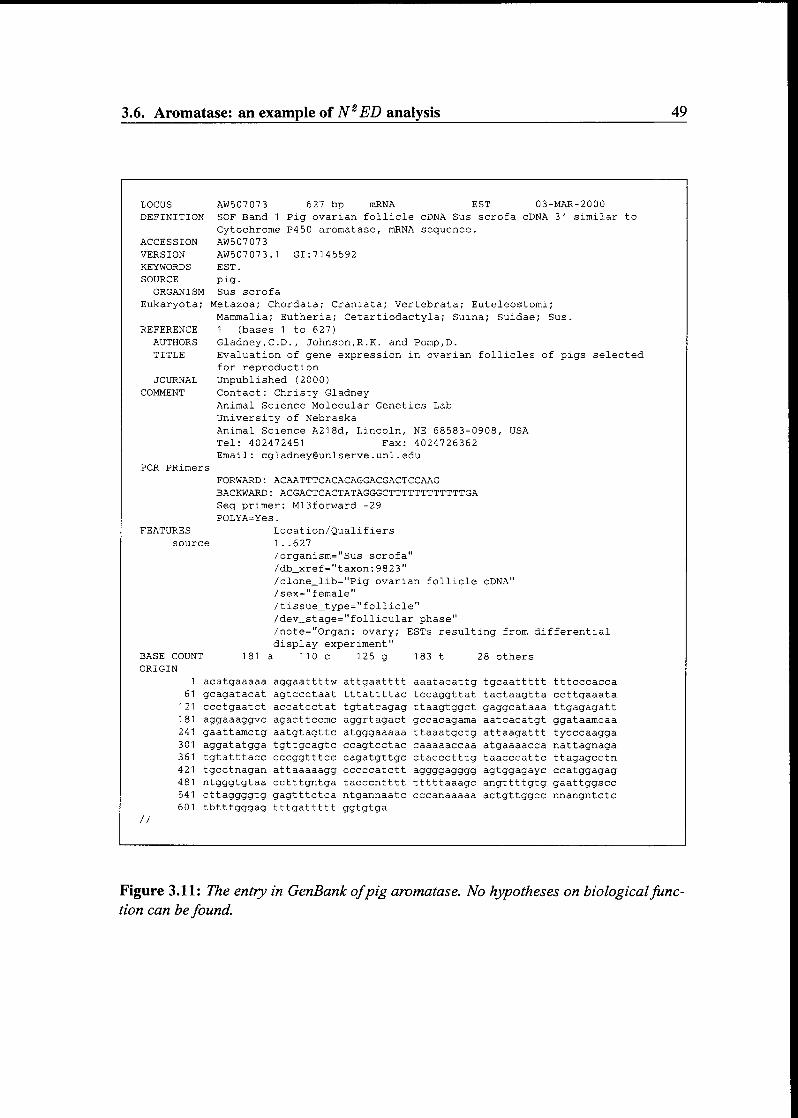
3.6. Aromatase: an example of N2ED analysis 49
LOCUS AW507073 627 bp mRNA EST 03 -MAR-2000
DEFINITION SOF Band 1 Pig ovarian follicle cDNA Sus scrofa cDNA 3' similar to
Cytochrome P450 aromatase, mRNA sequence.
ACCESSION AW507073
VERSION AW507073.1 GI:7145592
KEYWORDS EST.
SOURCE pig.
ORGANISM Sus scrofa
Eukaryota • Metazoa; Chordata; Craniata; Vertebrata; Euteleostomi
Mammalia; Eutheria; Cetartiodactyla; Suina; Suidae; 3us.
REFERENCE 1 (bases 1 to 627)
AUTHORS Gladney,C.D., Johnson,R.K. and Pomp,D.
TITLE Evaluation of gene expression in ovarian follicles o
for reproduction
f pigs selected
JOURNAL Unpublished (2000)
COMMENT Contact: Christy Gladney
Animal Science Molecular Genetics Lab
University of Nebraska
Animal Science A218d, Lincoln, NE 68583-0908, USA
Tel: 402472451 Fax: 4024726362
Email: [email protected]
PCR PRimers
FORWARD : ACAATTTCACACAGGACGACTCCAAG
BACKWARD : ACGACTCACTATAGGGCTTTTTTTTTTTTGA
Seq primer: M13forward -29
POLYA=Yes.
FEATURES Location/Qualifiers
source 1..627
/organism="Sus scrofa"
/db_xref="taxon:9823"
/clone_lib="Pig ovarian follicle cDNA"
/sex="female"
/tissue_type="follicle"
/dev_stage="follicular phase"
/note="Organ: ovary; ESTs resulting from differential
display experiment"BASE COUNT 181 a 110 c 125 g 183 t 28 others
ORIGIN
1 acatgaaaaa aggaattttw attgaatttt aaatacattg tgcaattttt tttcccacca
61 gcagatacat agtccctaat tttattttac tccaggttat tactaagtta ccttgaaata
121 ccctgaatct accatcctat tgtatcagag ttaagtggct gaggcataaa ttgagagatt
181 aggaaaggvc agacttccmc aggrtagact gccacagama aatcacatgt ggataamcaa241 gaattamctg aatgtagttc atgggaaaaa ttaaatgctg attaagattt tycccaagga301 aggatatgga tgttgcagtc ccagtcctac caaaaaccaa atgaaaacca nattagnaga361 tgtatttacc cccggtttcc cagatgttgc ctaccctttg taacccattc ttagagcctn421 tgcctnagan attaaaaagg cccccatctt aggggagggg agtggagayc ccatggagag481 ntgggtgtaa cctttgntga tacccntttt tttttaaagc angttttgtg gaattggscc
541 cttaggggtg gagtttctca ntgannaatc cccanaaaaa actgttggcc nnangntctc
601
//
tbtttgggag tttgattttt ggtgtga
Figure 3.11: The entry in GenBank ofpig aromatase. No hypotheses on biologicalfunc¬tion can befound.
Seite Leer /
Blank leaf

Chapter 4
Using N^ED's. Intraspecies Analysis
4.1 The evolution of paralogs
4.1.1 What is a paralog
Two paralogous genes are two homologous genes that are found in the same organisms.These have been discovered in abundance ever since Clement Markert at Yale first re¬
ported "isozymes" [Mar59]. For example, lactate dehydrogenase is found in mammals in
several forms, including the "heart" form, the "muscle" form, and the "liver" form. They
are clearly related by common ancestry. They catalyze the same interconversion of the
same substrates. Their expression is different in different tissues (as their names imply).
They have been studied from a functional perspective for years.
Why do paralogs exist? From an evolutionary perspective, they cannot be truly redun¬
dant. If they were one would be lost without negative impact on fitness which, under the
Darwinian model, means that they simply would be lost. That they remain must reflect
the need for both for fitness. This, in turn, implies functional niches.
For this reason, paralogs confuse functional interpretation. If two paralogs in speciesA have different functions, even though they are homologous, and two paralogs in speciesB have different functions, then the question becomes: Which homolog in A is func¬
tionally analogous to which in species B? This gives rise to the unacceptable locution
"functional orthologs".
From a Darwinian perspective, if the gene duplication that gave rise to the two par¬
alogs in A and B occurred before taxa A and B diverged, then it is possible that the func¬
tional distinction represented by the two paralogs in species A was already made in the
last common ancestor of A and B. Indeed, it implies that the time when the paralogs were
created by gene duplication was the time at which this functional distinction first became
51
52 Chapter 4. Using N2ED's. Intraspecies Analysis
relevant. As we know (or can estimate) from paleontology approximately when various
functions arose, dating paralog creation is potentially a key tool in functional annotation
of genomes.
4.2 Paralogs in the yeast genome
4.2.1 Getting the data
To test this idea, we examined the first genome completed from a eukaryote, that for
Saccharomyces cerevisiae (bakers yeast). We extracted from the yeast genome all pairsof paralogs whose sequences could be aligned with a similarity score greater than 120.
For each alignment, we found all of the conserved amino acids encoded by two fold
redundant coding systems. We then tabulated the /2 for each sequence pair, and the pairs
were sorted by decreasing f2 values. We then generated a histogram showing the number
of genes that were duplicated in various f2 windows (Fig. 4.1). A database was created
that stored the top line annotation for proteins represented in the histogram.
4.2.2 The episode at J2 ca. 0.82
The most striking feature of the histogram is that it suggests that duplications are not
randomly distributed across the geological time scale, but rather occur episodically.
A substantial number of gene pairs were characterized by high f2 values (approaching
unity). This suggested that these gene duplications occurred relatively recently. A large
number of the alignments were characterized by an f2 value between 0.5 and 0.6, the
codon bias for genes in Saccharomyces cerevisiae. In these pairs, mutations at the third
position of the two-fold redundant sites were sufficient to equilibrate the nucleotide. The
gene duplications that generated these pairs occurred, therefore, at a time more ancient
than a dating method exploiting silent mutation can accurately date.
A prominent episode of duplication in an ancestral yeast generated a number of pair-wise alignments with an f2 of 0.815 - 0.845. It turns out after inspection of the annotation
of the genes involved that these duplications created several new hexose transporter pairs(YEL069C and YDL245C, YJR158W and YNR072W, and YDR343C and YDR342C,
using the yast database annotation), three glyceraldehyde-3-phosphate dehydrogenases
(YJL052W, YGR192C and YJR009C), the non-oxidative pyruvate decarboxylase that
generates acetaldehyde (YLR044C and YLR134W), a transporter for the thiamin vita¬
min that is used by this enzyme (YBR092C and YBR093C), and alcohol dehydrogenasethat converts acetaldehyde to alcohol (YOL086C and YMR303C).
If one looks at the metabolic pathways, it is clear that this is not a collection of random

4.2. Paralogs in the yeast genome 53
Figure 4.1: A histogram counting duplication events that generatedparalogousproteinsin the Saccharomyces cerevisiae genome, as a function of fe the fraction of identical
nucleotidesper silent site in twofold redundant codon systems where the encoded amino
acid is conserved in the two paralogs. Note the episode ofgene duplication in yeast
at f2 = 0.815 - 0.845 during which at least seven enzymes involved in the fermentation
pathway were created. Time scale is based on a transition rate constant k = 3.5 x 10⁻⁹
transitions/site/year, and a codon bias of 0.6. Because the f2 value is logarithmic with
respect to the evolutionary distance, the time scale is logarithmic.

54 Chapter 4. Using N2ED's. Intraspecies Analysis
genes. Instead, every one of these genes is involved in the pathway for the fermentation
of glucose to alcohol (Fig. 4.2). This process has long exploited by human society.
The role of these genes in fermentation is documented by genetic studies on yeast as
well [FH97]. The only gene suffering duplication in the 0.815 < f2 < 0.845 window
not obviously involved in fermentation was an inosine monophosphate dehydrogenase
(YHR216W and YLR432W). A gene annotated as "unknown" (YDR387C) is probably
also a hexose transporter.
H^O Hv^O
H-
HO-
H-
H-
-OH
-H
-OH
-OH
CH2OH
hexoseH-
Hv^O-OH ATP ADP
H-
transport HO H K^£ HQ H
H OH hexokinase u au
H OH H
CH2OH
OHH>•
H- -OH
hexose
outside
glyccraldehyde ^O3-phosphatcdehydrogenase—: *-
H
hexose
outside
OH
CH2OP03=
ghicose-6-phosphate
V
-OH
CH2OP03=
0ii
O'f'OH
o—
H2C^COOH
OI
H3C COOH
CH2OP03=
oxidative
decarboxylation
citric acid cycle
pyruvatedecarboxylase
alcohol
OH
h3CTh "
Hc
alcohol
dehydrogenase
thiamine
o
H3C^H
^*- CO? non-oxidative
decarboxylation
Figure 4.2: The fermentation metabolic pathway in the yeast Saccharomyces cere¬
visiae. Proteins resulting from genes duplicating in the duplication episode at
0.815 < f2 < 0.845 inyeast are underlined.
Coincidence may, of course, account for the eight (perhaps nine) nearly-
contemporaneous duplications that all involved genes encoding enzymes involved in fer¬
mentation. More likely, however, these nearly simultaneous events may reflect the emer¬
gence of fermentation itself. The paleontological record does not explicitly date the ori¬
gin of fermentation. It does, however, place limits on dates for the origin of fermentable
fruits by angiosperms. Angiosperms bearing fermentable fruit are well known in the
fossil record by the start of the Cenozoic 65 MYA.[Cha64] The earliest fossil record of
angiosperms of any kind is ca. 140 MYA.[Cra95, Sun98] Assuming that fermentation
arose only after fermentable fruits arose, this provides limits for the rate constant k of
between 1.8xl0-9 and 3.9a;10-9 transitions/site/year.
Correlations of this type are perhaps the best way to estimate rate constants for silent
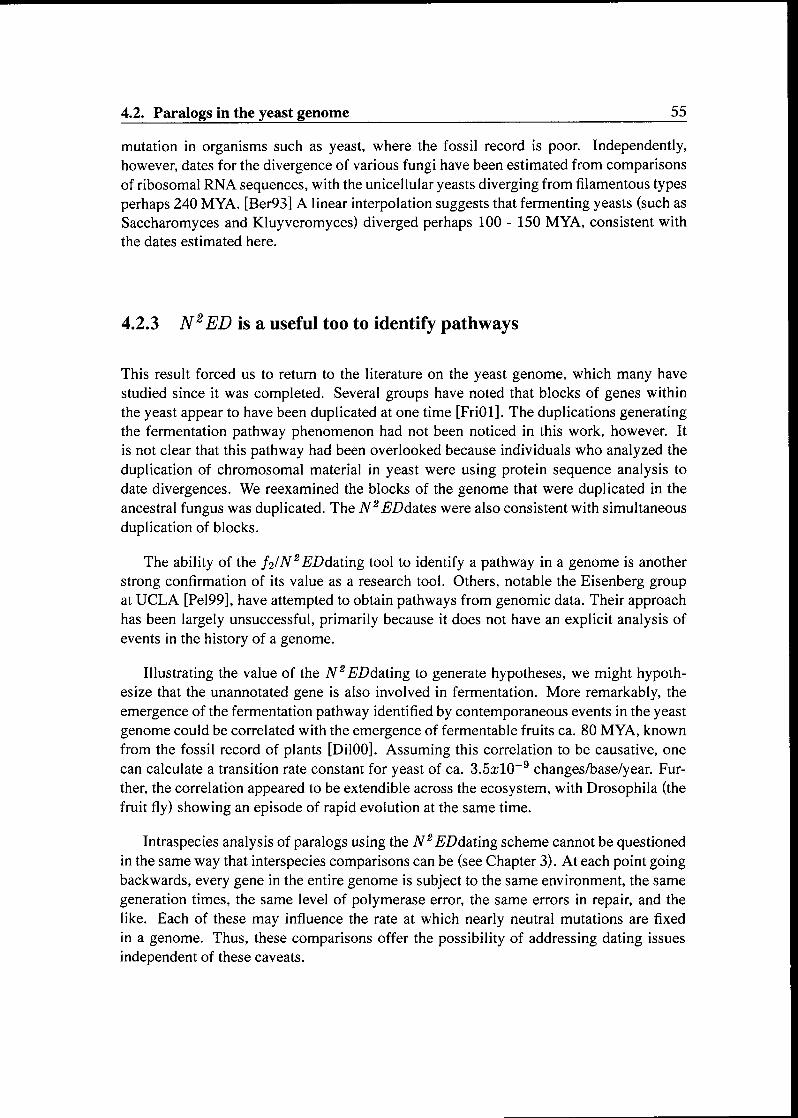
4.2. Paralogs in the yeast genome 55
mutation in organisms such as yeast, where the fossil record is poor. Independently,
however, dates for the divergence of various fungi have been estimated from comparisonsof ribosomal RNA sequences, with the unicellular yeasts diverging from filamentous types
perhaps 240 MYA. [Ber93] A linear interpolation suggests that fermenting yeasts (such as
Saccharomyces and Kluyveromyces) diverged perhaps 100 - 150 MYA, consistent with
the dates estimated here.
4.2.3 N2ED is a useful too to identify pathways
This result forced us to return to the literature on the yeast genome, which many have
studied since it was completed. Several groups have noted that blocks of genes within
the yeast appear to have been duplicated at one time [FriOl]. The duplications generatingthe fermentation pathway phenomenon had not been noticed in this work, however. It
is not clear that this pathway had been overlooked because individuals who analyzed the
duplication of chromosomal material in yeast were using protein sequence analysis to
date divergences. We reexamined the blocks of the genome that were duplicated in the
ancestral fungus was duplicated. The N2EDdates were also consistent with simultaneous
duplication of blocks.
The ability of the f2/N2 EDdating tool to identify a pathway in a genome is another
strong confirmation of its value as a research tool. Others, notable the Eisenberg group
at UCLA [Pel99], have attempted to obtain pathways from genomic data. Their approachhas been largely unsuccessful, primarily because it does not have an explicit analysis of
events in the history of a genome.
Illustrating the value of the N2EDdating to generate hypotheses, we might hypoth¬esize that the unannotated gene is also involved in fermentation. More remarkably, the
emergence of the fermentation pathway identified by contemporaneous events in the yeast
genome could be correlated with the emergence of fermentable fruits ca. 80 MYA, known
from the fossil record of plants [DilOO]. Assuming this correlation to be causative, one
can calculate a transition rate constant for yeast of ca. 3.5xl0-9 changes/base/year. Fur¬
ther, the correlation appeared to be extendible across the ecosystem, with Drosophila (the
fruit fly) showing an episode of rapid evolution at the same time.
Intraspecies analysis of paralogs using the N2 EDdating scheme cannot be questionedin the same way that interspecies comparisons can be (see Chapter 3). At each point goingbackwards, every gene in the entire genome is subject to the same environment, the same
generation times, the same level of polymerase error, the same errors in repair, and the
like. Each of these may influence the rate at which nearly neutral mutations are fixed
in a genome. Thus, these comparisons offer the possibility of addressing dating issues
independent of these caveats.

56 Chapter 4. Using N2ED's. Intraspecies Analysis
4.3 The human genome
With this evidence supporting the use of f2 values and N2ED's to date events within a
single genome, and to identify pathways using these dates, we generated an analogous
histogram from the human genome (Fig. 4.3).
4.3.1 Getting the data
All families in the MasterCatalogthat contain more than one human sequence were
identified. In such families the f2 between the human sequences were calculated and
recorded. Since the database is heavily "contaminated" with duplicate entries we identi¬
fied such duplicates as sequence pairs with an f2 > 0.98and a PAM distance of less then
4. When duplicates were found only one sequence entered our analysis. Again we made
a histogram sorting the duplications by f2.
As before, gene duplications occurred throughout the lineage leading to modern hu¬
man. Many of the duplicate pairs had f2 values sufficiently close to equilibrium (here b =
0.56, the contemporary codon bias in Homo sapiens). Many pairs also had f2 values close
to unity making clear that our method to identify duplicates needs improvement. But as
with yeast, many duplications occurred with intermediate f2 values where N2ED's could
be calculated with some accuracy.
4.3.2 Examining the histogram
The primate genome encodes many more genes and pathways than the yeast genome, and
the primate lineage undoubtedly has suffered more adaptive change and innovation within
this date range than yeast. For this reason, it was perhaps not surprising that no isolated
episodes for duplication were observed in the histogram in Figure 4.3 Nevertheless, it was
clear from annotation associated with the genes that suffered duplication over the past100 million years that this history did not focus on metabolic pathways in primates, as it
did in yeast. Instead, transcription factors, regulatory proteins, adhesion molecules, and
proteins related to immunology and placental reproduction are richly represented amongthe duplications, as are (of course) unannotated proteins.
With many more genes, no isolated episodes of duplication were observed in the hu¬
man histogram. We were nevertheless able to select interesting episodes based on what
we know about the paleontology and paleoecology of mammals [Eis81], and the transi¬
tion rate constant calculated from the inter-species comparisons. In particular, we know
that ca. 40 MYA, the Earth suffered an episode of global cooling (the average temper¬
ature dropped perhaps 15°C) [Wol78, Pro94]. We know that this dramatic cooling had
repercussions throughout the biosphere. Grasses emerged for the first time, adapted to
4.3. The human genome 57
Figure 4.3: A histogram counting duplication events that generatedparalogousproteinsin the human genome, as a function of f^ the fraction of identical nucleotidesper silent
site in twofold redundant codon systems where the encoded amino acid is conserved in
the two paralogs. Time scale is based on a transition rate constant k = 2:rl0-9 transi¬
tions/site/yearfor the most recent 100 millionyears, k = 3xl0~9 transitions/site/yearforearlier times, and a codon bias of0.575.

58 Chapter 4. Using N2ED's. Intraspecies Analysis
survive in the newly formed savannas that replaced tropical rain forests throughout much
of the temperate zone. Artiodactyls responded with a spate of gene duplication and rapidevolution at this time leading to the emergence of ruminant digestion [Ros82, Jer95].
We wondered how primates responded to this global cooling. To answer this question,we examined duplications events that generated paralogs with a f2 values in the range
from 0.935 to 0.965. We assumed a transition rate constant of 2xl0-9 transitions/site/year(see 3.4.2), and a codon bias of 0.575. A total of 22 gene families that suffered duplication
during the Oligocène cooling. Over half of these are not annotated. Remarkably, all of
the genes that are annotated are involved in neurological development (Table 4.1), either
directly or conceivably.
Table 4.1:
Some genes duplicated in the human genome at the time ofthe great Oligocène cooling.
protocadherin 68, neuronal networkpatterning [HilOl]
protocadherin 43, neuronal networkpatterning [HilOl]
serine kinase PAK homolog, mental retardation [BlaOO, A1198J
MNBprotein kinase; Down syndrome [KenOO]
desmolase, neurosteroid biosynthesis
butyrophilin, putative neurosteroid receptor
Especially of interest are the recently discovered protocadherins, proteins involved
in the patterning of neural networks. These suffered massive duplication, together with
serine kinases associated with X-linked mental retardation, and a kinase associated with
Down syndrome. This raises the interesting hypothesis: Did primates respond to the
Oligocène cooling by altering the structure of their central nervous systems?
4.3.3 A promising start
This work is obviously preliminary, but this illustrates the type of hypotheses that are
generated when correlating events in the genome with events known from the paleonto¬
logical and geological records. Once the human genome project provides us with more
and cleaner date we will be able to draw a much better picture of the history of such
paralogization events.

Chapter 5
Conclusions
The analysis of a restricted set of silent substitutions at the third positions of codons
within genes encoding expressed proteins appears to be an exceptionally valuable ap¬
proach towards solving important parts of the problem of extracting geological dates from
the molecular record. It is useful for vertebrates over the past 500 million years, a periodover which this phylum achieve the visible domainance of the "large animal niche" on
planet Earth. It also appears to be valuable in yeast and invertbrates, although not for as
long a period (because of higher rate constants). While the accuracy of the N2EDdate
suffers because of the smaller number of characters, this is more than made up for by the
constancy of the clock. Thus, the dates can be put to practical use: understanding aro-
mataase paralogs, identifying pathways, and building trees are three examples providedin this dissertation. Histograms in Figures 4.1 and 4.3 have features whose explorationwill require many years of effort, including experimental. It is clear, however, that a strat¬
egy coupling events in the paleontological record with events encoded in the molecular
record using the N2EDdating tool will be important in genome analysis. At the very
least, it narrows significantly the number of hypotheses that needs to be tested to establish
pathways, metabolic and regulatory. Together with other comparative genomics tools,
N2ED's should prove extremely valuable in the ongoing effort to annotate genomic se¬
quences. A next target should be a plant genome, where a rich paleontological history
supports genome interpretation. The N2EDtoo\ is also useful for developing generalheuristics for analyzing sequence evolution. For example, the most significant remaining
problem in the construction of multiple sequence alignments involves the placement of
gaps. Understanding the processes by which segments of genes are inserted and deleted
(to create gaps) is hampered by the absence of a tool to measure the time since diver¬
gence. The gapping parameters are known to depend strongly on this. The N2EDtoo\
should help solving this problem as well.
59

Seite Leer/
Blank leafi
*...
. .
-.._--

Appendix A
Methods
A.l General
All calculations were done under RedHat Linux 6.3 on a Intel-Pentiumlll-system usingBlackdown's Java-SDK 1.1.8.
All the analysis was done using the Gene Product Catalog built within the 2000 ver¬
sion of the MasterCatalog, derived from GenBank release 114 (October, 15 1999). The
MasterCatalogwas provided by EraGen Biosciences, Inc. This Gene Product Catalogof MasterCataloggroups GenBank into ca. 32,000 families of proteins and provides
pre-aligned multiple sequence alignments (MSAs) and evolutionary trees.
A.2 Inter-taxon analysis
In the inter-taxon analysis the families in MasterCatalogthat contained at least one of
either taxons were identified. For these families the protein-MSA and the DNA were
retrieved, and the DNA aligned according to the MSA. If a family contained more than
one sequence of a species belonging to one of the taxons analyzed, then those sequences
were checked whether they were duplicate entries into the database (see: A.5). If this
was the case, only one of the duplicate sequences was retained in the analysis. For each
remaining pair between the two taxons the f-values (see: A.6) and the PAM-distance (see:
A.7) were calculated and reported.
61

62 Appendix A. Methods
A.3 Intra-species analysis
For the intra-species analysis, the families in MasterCatalogthat contained at least two
sequences of the given species were identified. For these families the protein-MSA and
the DNA were retrieved, and the DNA aligned according to the MSA. For each pairbetween oof sequences of that species the f-values (see: A.6) and the PAM-distance were
calculated. The sequences were then checked whether they are duplicate entries into the
database (see: A.5). If that was the case, only one of the duplicate sequences was retained.
The values using the remaining sequences were reported.
A.4 Yeast analysis
For the intra-species analysis, the families in MasterCatalogthat contained at least two
entries from the Yeast-Genome-Sequencing-Project [BalOl] were identified. For these
families the protein-MSA and the DNA were retrieved, and the DNA aligned accordingto the MSA. For each pair of yeast sequences in these families the f-values (see: A.6)
and the PAM-distance (see: A.7) were calculated and reported. They were not checked
whether they pass the duplicate test (see: A.5).
A.5 Elimination of duplicate entries in the database
If a family contained more than one sequence of the same species, these sequences were
examined whether they are duplicate entries of the same sequence into the database. Two
sequences were considered duplicates if they were no farther than two PAM-units apart
(see: A.7) and their /2-value was bigger than 0.98. In that case only one sequence was
used in the further analysis.
A.6 Calculation of /2-values
The /2-values for a pair of aligned sequences was calculated by the formula:
f2 = c2/n2
n2 is the number of amino acids conserved in the two aligned protein-sequences that have
both a 2-fold-redundant codon in their respective translation-table.

A.7. PAM-distances 63
C2 is the number of such conserved amino acids which are conserved in their DNA as
well. That is no silent substitution has occurred. In the standard-translation-table
these are: CDEFHKNQY.
A.7 PAM-distances
The PAM-distance for a sequence pair were estimated applying the PamEstimator-
package of the MasterCatalog-api using the classical Dayhoff-Matrix [Day78]. This
package uses the method described in the Introduction. The pairwise alignments were
based on the MSA of the family the sequences belonged to Before estimating the PAM-
distance all gaps that both sequences shared were eliminated. Otherwise the PAM-
distance would have been too high.
A.8 Codon bias
The overall mammalian codon bias was calculated using CUTG (Codon Usage Tabulated
from GenBank) by Kazusa DNA Research Institute Foundation, Japan [NakOO]. Codon
Usage frequencies at the third position for all sequences of primates, rodents, and the
other mammals were simply added up not using sequences annotated as mitochondrion
sequences.
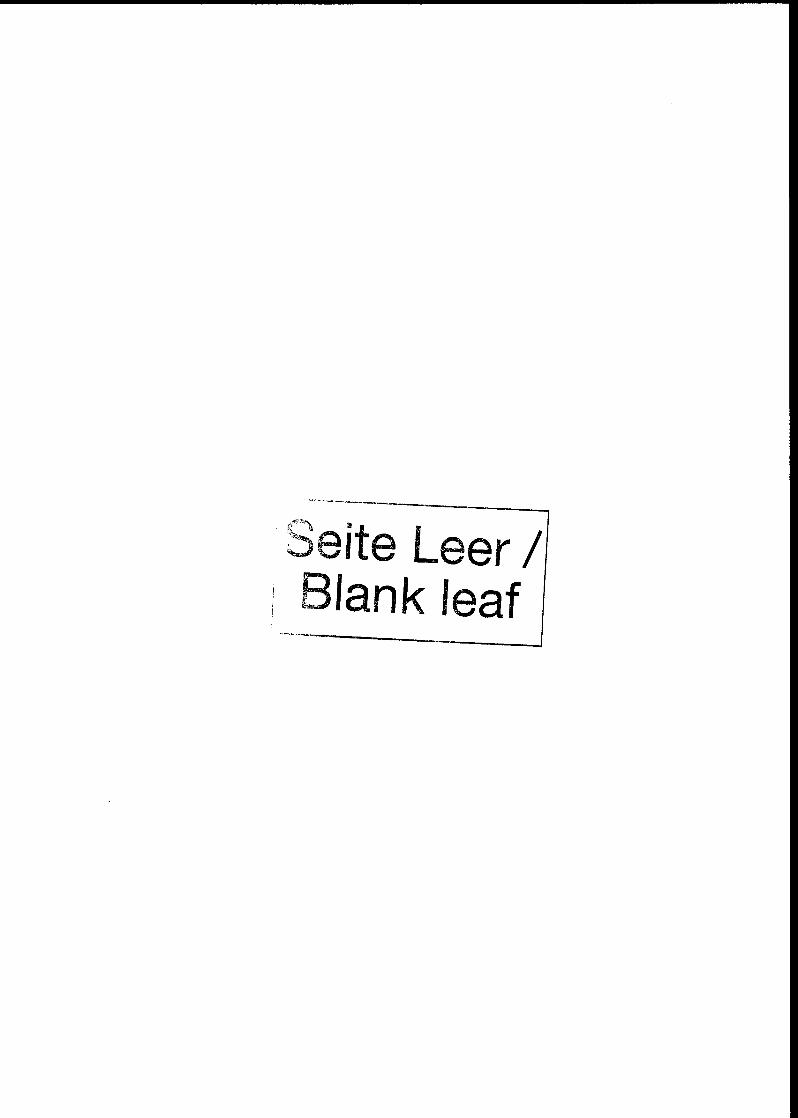
Seite Leer /Blank leaf

Appendix B
Example of a N2ED Calculation
To calculate N2EDfor two proteins one has to:
1. Align the amino-acid sequences.
2. Align the coding DNA sequences accordingly.
3. Count the number of conserved amino-acids in the alignment that have a twofold-
redundant codon system.
4. Count the number of these positions that have a conserved codon.
5. Do the math.
Figures B.l and B.2 Show such a calculation for alcoholdehydrogenase I and alco-
holdehydrogenase I in Saccharomyces cerevisiae:
The PAM-distance between these sequences is 7.71. There are 111 sites in the align¬ment that are conserved and have twofold redundant codon system (CDEFHKNQY):
n2 = 111. At 94 of those sites the same codon is used in both genes C2 = 94. Therefore
the f2 is 0.85 (/2 = c2/n2 = 94/111 = 0.847). A look at the Codon Usage Database
[NakOO] shows us that the codon bias b in Saccharomyces cerevisiae at the third positionis 0.620 (Fig. B.3)
Using the formula to calculate N2ED:
N*ED = u = -in(^)
N'ED = kt = -lnß0M7-°^)= 0.515V 0.380 J
65

66 Appendix B. Example of a NSED Calculation
If we assume a rate constant of k = 3 • 10~9 transitions/base/year the date t when the
alcoholdehydrogenases duplicated is 85.9 MYA.
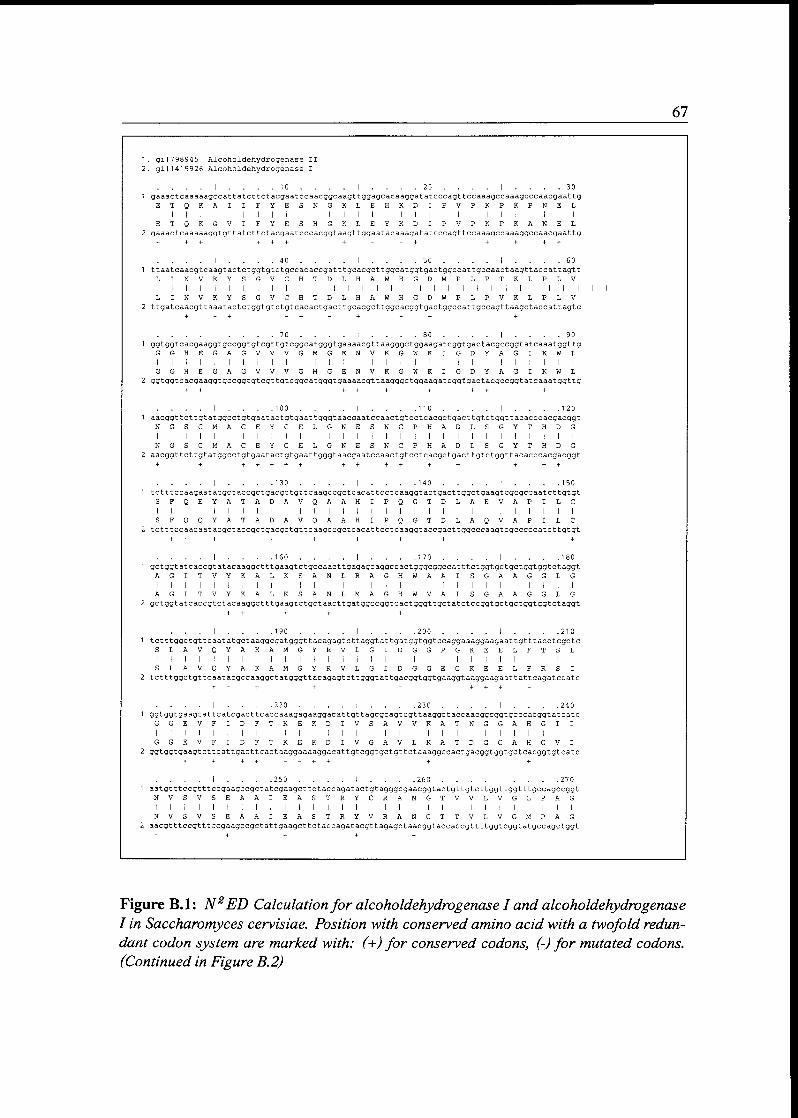
67
1 giI 798945 Alcoholdehydrogenase II
2 giI 1419926 Alcoholdehydrogenase I
I 10 I 20 I 30
1 gaaactcaaaaagccattatcttctacgaatccaacggcaagttggagcataaggatatcccagttccaaagccaaagcccaacgaattg
ETQKAIIFYESNGKLEHKDIPVPKPKPNEL
I I j I ! I I ! I I I ! I I I ! I I I ! I I III
ETQKGVIFYESHGKLEYKDIPVPKPKANEL
2 gaaactcaaaaaggtgttatcttctacgaatcccacggtaagttggaatacaaagatattccagttccaaagccaaaggcraacgaattg+ ++ + + + +--+ + + + +
I 40 I 50 I 60
1 ttaatcaacgtcaagtactctggtgtctgccacaccgatttgcacgcttggcatggtgactggccattgccaactaagttaccattagttLINVKYSGVCHTDLHAWHGDWPLPTKLPLV
I I I I I I I I I I I I I I I I I I I I I I I I III
LIHVKYSGVCHTDLHAWHGDWPLPVKLPLV
2 ttgatcaacgttaaatactctggtgtctgtcacactgacttgcacgcttggcacggtgactggccattgccagttaagctaccattagtc
+ + +-+-+ +
I 70 I 80 I 90
1 ggtggtcacgaaggtgeeggtgtcgttgtcggcatgggtgaaaacgttaagggctggaagatcggtgactacgccggtatcaaatggttgGGHEGAGVVVGMGENVKGWKIGDYAGIKWL
I I I I I I I I I I I I I I I I I I I I I I I I I I I I I I
GGHEGAGVVVGMGENVKGWKIGDYAGIKWL
2 ggtggtcacgaaggtgccggtgtcgttgtcggcatgggtgaaaacgttaagggctggaagatcggtgactacgccggtatcaaatggttg+ + +++ + ++ +
I 100 I 110 I 120
1 aacggttcttgtatggcctgtgaatactgtgaattgggtaacgaatccaactgtcctcacgctgacttgtctggttacacccacgacggtNGSCMACEYCELGNESNCPHADLSGYTHDG
II I I i I I I I I I I I I I I I I I I I I I I I I I I I I
NGSCMACEYCELGNESNCPHADLSGYTHDG
2 aacggttcttgtatggcctgtgaatactgtgaattgggtaacgaatccaactgtcctcacgctgacttgtctggttacacccacgacggt+ + + + + + + ++++ + + ++ +
130 I 140 I 150
1 tctttccaagaatacgctaccgctgacgctgttcaagccgctcacattcctcaaggtactgacttggctgaagtcgcgccaatcttgtgt
SFQEYATADAVQAAHIPQGTDLAEVAPILC
III I I I I I I I I I I I I I I I I I I I I I I I I I
SFQQYATADAVQAAHIPQGTDLAQVAPILC
2 tctttccaacaatacgctaccgctgacgctgttcaagccgctcacattcctcaaggtaccgacttggcccaagtcgcccccatcttgtgt
+ ++ + + + + + +
I 160 I 170 I 180
1 gctggtatcaccgtatacaaggctttgaagtctgccaacttgagagcaggccactgggcggccatttctggtgctgctggtggtctaggtAGITVYKALKSANLRAGHWAAI SGAAGGLG
I I I I I I I I I I I I I I I I I I I I I I I I I I I I
AGITVYKALKSANLMAGHWVAISGAAGGLG
2 gctggtatcaccgtctacaaggctttgaagtctgctaacttgatggccggtcactgggttgctatctccggtgctgctggtggtctaggt+ + + + +
I 190 I 200 I 210
1 tctttggctgttcaatatgctaaggcgatgggttacagagtcttaggtattgatggtggtccaggaaaggaagaattgtttacctcgctc
SLAVQYAKAMGYRVLGIDGGPGKEELFTSL
I I I I I I I I I I I I I I I I I I I I I I I I I I I
SLAVQYAKAMGYRVLGIDGGEGKEELFRSI
2 tctttggctgttcaatacgccaaggctatgggttacagagtcttgggtattgacggtggtgaaggtaaggaagaattattcagatccatc+ -+ + - + + +-
I 220 I 230 I 240
1 ggtggtgaagtattcatcgacttcaccaaagagaaggacattgttagcgcagtcgttaaggctaccaacggcggtgcccacggtatcatcGGEVFIDFTKEKDIVSAVVKATNGGAHGII
I I I I I I I I I I I I I I I II III I I I I I I
GGEVFIDFTKEKDIVGAVLKATDGGAHGVI
2 ggtggtgaagtcttcattgacttcactaaggaaaaggacattgtcggtgctgttctaaaggccactgacggtggtgctcacggtgtcatc+ + ++-- + + + +
I 250 I 260 I 270
1 aatgtttccgtttccgaagccgctatcgaagcttctaccagatactgtagggcgaacggtactgttgtcttggttggtttgccagccggtNVSVSEAAIEASTRYCRANGTVVLVGLPAG
I I I I I I I I I I I I I I I I I I I I I I I I III
NVSVSEAAIEASTRYVRANGTTVLVGMPAG
2 aacgtttccgtttccgaagccgctattgaagcttctaccagatacgttagagctaacggtaccaccgttttggtcggtatgccagctggt
Figure B.l: N2ED Calculation for alcoholdehydrogenase I and alcoholdehydrogenaseI in Saccharomyces cervisiae. Position with conserved amino acid with a twofold redun¬
dant codon system are marked with: (+) for conserved codons, (-) for mutated codons.
(Continued in Figure B.2)

68 Appendix B. Example of a N2ED Calculation
I 280 I 290 I 300
1 gcaaagtgctcctctgatgtcttcaaccacgttgtcaagtctatctccattgtcggctcttacgtggggaacagagctgataccagagaa
AKCSSDVFNHVVKSISIVGSYVGNRADTRE
III I I I I I I I I I ! I I I I I I I I I I I I I I I
AKCCSDVFNQVVKSISIVGSYVGNRADTRE
2 gccaagtgttgttctgatgtcttcaaccaagtcgtcaagtccatctctattgttggttcttacgtcggtaacagagctgacaccagagaa+ -+++ + + + - +
I 310 I 320 I 330
1 gccttagatttctttgccagaggtctagtcaagtctccaataaaggtagttggcttatccagtttaccagaaatttacgaaaagatggagALDFFARGLVKSPIKVVGLSSLPEIYEKME
I I I I I I I I I I I I I I I I I I I I I I I I I I I I I
ALDFFARGLVKSPIKVVGLSTLPEIYEKME
2 gctttggacttcttcgccagaggtttggtcaagtctccaatcaaggttgtcggcttgtctaccttgccagaaatttacgaaaagatggaa+ + + + -f + +
I 340
1 aagggccaaattgctggtagatacgttgttgacact
KGQIAGRYVVDT
III I I I I I I I
KGQIVGRYVVDT
2 aagggtcaaatcgttggtagatacgttgttgacact
Figure B.2: Continuation of the N2ED calculationfor alcoholdehydrogenase I and al¬
coholdehydrogenase I in Saccharomyces cervisiae. Position with conserved amino acid
with a twofold redundant codon system are marked with: (+) for conserved codons, (-)
for mutated codons.
Saccharomyces cerevisiae [gbpln] 11644 CDS's (5624171 codons)
field [triplet] [amino acid fraction] [frequency per thousand] ([number])
UUU F 0 59 26 0 (146412) UCU S 0 27 23 6 (132621) UAU Y 0 56 18 8 (105557) UGU C 0 63 8 0 ( 44797)
UUC F 0 41 18 2 (102353) UCC S 0 16 14 2 ( 79920) UAC Y 0 44 14 7 ( 82477) UGC C 0 37 4 7 ( 26363)
UUA L 0 28 26 4 (148212) UCA S 0 21 18 8 (105618) UAA * 0 48 1 0 ( 5537) UGA * 0 30 0 6 ( 3456)
UUG L 0 29 27 1 (152577) UCG S 0 10 8 6 ( 48192) UAG * 0 23 0 5 ( 2629) UGG W 1 00 10 3 ( 58084)
CUU L 0 13 12 2 ( 68500) ecu P 0 31 13 6 ( 76383) CAU H 0 64 13 7 ( 77276) CGU R 0 15 6 5 ( 36513)
CUC L 0 06 5 4 ( 30213) CCC P 0 16 6 8 ( 38245) CAC H 0 36 7 8 ( 43867) CGC R 0 06 2 6 ( 14559)
CUA L 0 14 13 4 ( 75415) CCA P 0 41 18 2 (102307) CAA 0 0 69 27 5 (154545) CGA R 0 07 3 0 ( 16965)
CUG L 0 1 1 10 4 ( 58568) CCG p 0 12 5 3 ( 29760) CAG Q 0 31 12 2 ( 68453) CGG R 0 04 1 7 ( 9806)
AUU I 0 46 30 2 (169875) ACU T 0 35 20 2 (113664) AAU N 0 59 36 0 (202449) AGU S 0 16 14 2 ( 79666)
AUC I 0 26 17 1 ( 96127) ACC T 0 22 12 6 ( 70760) AAC N 0 41 24 9 (140174) AGC S 0 1 1 9 7 ( 54339)
AUA I 0 27 17 8 (100079) ACA T 0 30 17 7 ( 99786) AAA K 0 58 42 1 (236838) AGA R 0 48 21 3 (119693)
AUG M 1 00 20 9 (117420) ACG T 0 14 8 0 ( 44816) AAG K 0 42 30 8 (173181) AGG R 0 21 9 3 ( 52060)
GUU V 0 39 22 0 (123771) GCU A 0 38 21 1 (118604) GAU D 0 65 37 8 (212747) GGU G 0 47 23 9 (134536)
GUC V 0 21 11 6 ( 65195) GCC A 0 22 12 6 ( 70752) GAC D 0 35 20 3 (114444) GGC G 0 19 9 7 ( 54619)
GUA V 0 21 1 1 8 ( 66110) GCA A 0 29 16 2 ( 91026) GAA E 0 71 45 9 (258028) GGA G 0 22 10 9 ( 61498)
GUG V 0 19 10 7 ( 60001) GCG A 0 1 1 6 1 ( 34530) GAG E 0 29 19 1 (107579) GGG G 0 12 6 0 ( 33624)
Coding GC 39 72% 1st letter GC 44 60% 2nd letter GC 36 58% 3rd letter GC 37 97%
Genetic code 1 Standard
Figure B.3: Codonusagefor Saccharomyces cerevisiae as presented in the Codon UsageDatabase [NakOO]

Bibliography
[AU98] K. M. Allen, J. G. Gleeson, S. Bagrodia, M. W. Partington, J. C. MacMil-
lan, R. A. Cerione, J. C. Mulley, and C. A. Walsh, Pak3 mutation in non-
syndromic x-linked mental retardation., Nature Genetics 20 (1998), 25-30.
[Aya99] F. J. Ayala, Molecular clock mirages, Bioessays 21 (1999), no. 1, 71-75.
[BalOl] C. A. Bail, H. Jin, G. Sherlock, S. Weng, J. C. Matese, R. Andrada, G. Bink-
ley, K. Dolinski, S. S. Dwight, M. A. Harris, L. Issel-Tarver, R. Schroeder,
D. Botstein, and J. M. Cherry, Saccharomyces genome database providestools to survey gene expression and functional analysis data., Nucl. Acids
Res. 29 (2001), no. 1, 80-81.
[Ben82] J. L. Bennetzen and B. D. Hall, Codon selection in yeast., J. Biol. Chem.
257(1982), 3026-3031.
[Ben88] S. A. Benner and A. D. Ellington, Interpreting the behavior of enzymes,
purpose or pedigree?, CRC Crit. Rev. Biochem. 23 (1988), 369-426.
[Ben89a] S. A. Benner, A. D. Ellington, and A. Tauer, Modern metabolism as a
palimpsest of the rna world, Proc. Natl. Acad. Sei. U. S. A. 86 (1989),
no.18, 7054-7058.
[Ben89b] S. A. Benner, Patterns of divergence in homologous proteins as indicators
of tertiary and quaternary structure., Adv. Enz. Regul. 28 (1989), 219-236.
[Ben90] S. A. Benner and A. D. Ellington, Evolution and structural theory, the fron¬
tier between chemistry and biochemistry., Bioorganic Chemistry Frontiers
1 (1990), 1-70.
[Ben93a] Steven A. Benner, Mark A. Cohen, Gaston H. Gönnet, David B. Berkowitz,
and Kai Johnsson, Reading the palimpsest: Contemporary biochemical
data and the rna world, The RNA world : the nature of modern RNA sug¬
gests a prebiotic RNA world (Raymond F. Gesteland and John F Atkins,
eds.), Cold Spring Harbor monograph series ; 24, Cold Spring Harbor Lab¬
oratory Press, Cold Spring Harbor, NY, 1993.
69
70 Bibliography
[Ben93b] S. A. Benner, M. A. Cohen, and Gönnet G. H., Empirical and structural
models for insertions and deletions in the divergent evolution of proteins.,J. Mol. Evol. 4 (1993), 1065-1082.
[Ben97] S. A. Benner, G. Cannarozzi, G. Chelvanayagam, and M. Turcotte, Bona
fide predictions of protein secondary structure using transparent analysesof multiple sequence alignments, Chem. Rev. 97 (1997), 2725-2843.
[Ben98] S. A. Benner, N. Trabesinger, and D. Schreiber, Post-genomic science:
Converting primary structure into physiological function., Adv. Enzyme
Regul. 38 (1998), 155-180.
[Ber93] M. L. Berbee and J. W. Taylor, Dating the evolutionary radiations of the
true fungi., Can. J. Bot. 71 (1993), 1114-1127.
[BlaOO] P. Blanco, C. A. Sargent, C. A. Boucher, M. Mitchell, and N. A. Affara,
Conservation of pcdhx in mammals; expression of human x/y genes pre¬
dominantly in brain., Mamm. Genome 11 (2000), 906-914.
[Boe97] D. Boerboom, A. Kerban, and J. Sirois, Molecular characterization of the
equine cytochrome p450 aromatase cdna and its regulation in preovulatoryfollicles., Biol. Reprod. 56 (1997), 479-479 Suppl.l.
[Cal97] G. V. Callard and A. Tchoudakova, Evolutionary and functional signifi¬cance of two cypl9 genes differentially expressed in brain and ovary of
goldfish, J. Steroid. Biochem. Mol. Biol. 61 (1997), no. 3-6, 387-392.
[Can82] R.L. Cann and A.C. Wilson, Models of human-evolution, Science 217
(1982), no. 4557, 303-304.
[Car88] Robert L. Carroll, Vertebrate paleontology and evolution, Freeman, New
York, N.Y., 1988.
[Cha64] M. Chandler, The lower tertiary floras of southern england iv. a summary
and survey of findings in the light of recent botanical observations., British
Museum of Natural History, London, 1964.
[Cha96] B. H. J. Chang, D. HewettEmmett, and W.-H. Li, Male-to-female ratios of
mutation rate in higher primates estimated from intron sequences., Zool.
Studies 35 (1996), no. 1, 36-48.
[Cho97a] I. Choi, D. L. Troyer, D. L. Cornwell, K. R. Kirby-Dobbels, W. R. Col¬
lante, and F. A. Simmen, Closely related genes encode developmental and
tissue isoforms of porcine cytochrome p450 aromatase, DNA Cell. Biol. 16
(1997), no. 6, 769-777.
Bibliography 71
[Cho97b] I. Choi, W. R. Collante, R. C. Simmen, and F. A. Simmen, A develop¬mental switch in expression from blastocyst to endometrial/placental-type
cytochrome p450 aromatase genes in the pig and horse, Biol. Reprod. 56
(1997), no. 3, 688-696.
[Cra95] P. Crane, E. Friis, and R. Pedersen, The origin and early diversification of
angiosperms., Nature 374 (1995), no. 6517, 27-33.
[Day78] M. O. Dayhoff, R. M. Schwartz, and B. C. Orcutt, A model for evolutionary
change in proteins, Atlas of Protein Sequence and Structure (Margaret O.
Dayhoff, ed.), vol. 5, 1978, pp. 345-352.
[DebOl] R. W. DeBry and S. Seshadri, Nuclear intron sequences for phylogeneticsof closely related mammals: An example using the phylogeny of mus., J.
Mammalogy 82 (2001), no. 2, 280-288.
[Del96] B. Delarue, H. Mittre, C. Feral, A. Benhaim, and P. Leymarie, Rapid se¬
quencing of rabbit aromatase cdna using race per, C. R. Acad. Sei. HI 319
(1996), no. 8, 663-670.
[Del98] B. Delarue, E. Breard, H. Mittre, and P. Leymarie, Expression of two aro¬
matase cdnas in various rabbit tissues, J. Steroid Biochem. Mol. Biol. 64
(1998), no. 1-2, 113-119.
[DilOO] D. Dilcher, Toward a new synthesis: major evolutionary trends in the an-
giosperm fossil record, Proc. Natl. Acad. Sei. U. S. A. 97 (2000), no. 13,
7030-7036.
[Eis81] John Frederick Eisenberg, The mammalian radiations : an analysis of
trends in evolution, adaptation, and behavior, University of Chicago Press,
Chicago, 1981.
[Fit76] W. Fitch, Molecular evolutionary clocks., In Molecular Evolution (F. J.
Ayala, ed.), Sinauer Assoc, Sunderland, MA, 1976.
[FitOO] W. M. Fitch, Homology, a. personal view on some of the problems., Trends
Genet. 16 (2000), 227-231.
[FH97] M. T. Flikweert, J. P. van Dijken, and J.T. Pronk, Metabolic responses of
pyruvate decarboxylase-negative saccharomyces cerevisiae to glucose ex¬
cess., Appl. Environ. Microbiol. 63 (1997), 3399-3404.
[FriOl] R. Friedman and A. L. Hughes, Gene duplication and the structure of eu-
karyotic genomes., Genome Res. 11 (2001), 373-381.
[Fur95] R. Fuerbass and J. Vanselow, An aromatase pseudogene is transcribed in
the bovine placenta, Gene 454 (1995), 287-291.

72 Bibliography
[Goj82] T. Gojobori, W. H. Li, and D. Graur, Patterns of nucleotide substitution in
pseudogenes and functional genes, J Mol Evol 18 (1982), no. 5, 360-369.
[Goo82] Morris Goodman, Macromolecular sequences in systematic and evolu¬
tionary biology, Monographs in evolutionary biology, Plenum Press, New
York, 1982.
[Gra74] R. Grantham, Amino acid difference formula to help explain protein evo¬
lution, Science 185 (1974), no. 4154, 862-864.
[Gra80] R. Grantham, C. Gautier, M. Gouy, R. Mercier, and A. Pave, Codon catalog
usage and the genome hypothesis, Nucleic Acids Res. 8 (1980), no. 1, r49-
r62.
[Har88] N. Harada, Cloning of a complete cdna encoding human aromatase: im¬
munochemical identification and sequence analysis, Biochem. Biophys.Res. Commun. 156 (1988), no. 2, 725-732.
[HedOl] S. B. Hedges, H. Chen, S. Kumar, D. Y. Wang, A. S. Thompson, and
H. Watanabe, A genomic timescale for the origin of eukaryotes, BMC Evol.
Biol. 1 (2001), no. 1, 4.
[Hic90] G. J. Hickey, J. S. Krasnow, W. G. Beattie, and J. S. Richards, Aromatase
cytochrome p450 in rat ovarian granulosa cells before and after luteiniza-
tion: adenosine 3',5'-monophosphate-dependent and independent regula¬tion, cloning and sequencing of rat aromatase cdna and 5' genomic dna,
Mol. Endocrinol. 4 (1990), no. 1, 3-12.
[HilOl] N. Hilschmann, H. U. Barnikol, S. Barnikol-Watanabe, H. Götz,
H. Kratzin, and F. P. Thinnes, The immunoglobulin-like genetic prede¬termination of the brain: The proto-cadherins, blueprint of the neuronal
network., Naturwissenschaften 88 (2001), 2-12.
[HuyOO] M. Huynen, B. Snel, W. Lathe, and P. Bork, Exploitation of gene context,
Curr. Opin. Struct. Biol. 10 (2000), no. 3, 366-370.
[Jer95] T. M. Jermann, J. G. Opitz, J. Stackhouse, and S. A. Benner, Reconstructingthe evolutionary history of the artiodactyl ribonuclease superfamily, Nature
374 (1995), no. 6517, 57-59.
[Juk69] T.H. Jukes and CR. Cantor, Evolution of protein molecules, Mammalian
protein metabolism (H.M. Munro, ed.), Academic Press, New York, 1969,
pp. 21 -132.
[KenOO] H. Kentrup, H. G. Joost, G. Heimann, and W. Becker, Minibrain/dyrkla-
gene: Candidate gene for mental retardation in down syndrome?, Klin.
Padiatr. 11 (2000), 60-63.

Bibliography 73
[Kin69] J. L. King and T. H. Jukes, Non-darwinian evolution, Science 164 (1969),
no. 3881, 788-798.
[Kim72] M. Kimura and T. Ota, On the stochastic model for estimation of mutational
distance between homologous proteins, J. Mol. Evol. 2 (1972), no. 1, 87-
90.
[Kum98] S. Kumar and S. B. Hedges, A molecular timescale for vertebrate evolution,
Nature 392 (1998), no. 6679, 917-920.
[Lan74] C. H. Langley and W. M. Fitch, An examination of the constancy of the
rate of molecular evolution, J. Mol. Evol. 3 (1974), no. 3, 161-177.
[Las87] Jr. Laskowski, M., I. Kato, W. J. Kohr, S. J. Park, M. Tashiro, and H. E.
Whatley, Positive darwinian selection in evolution of protein inhibitors of
serine proteinases, Cold Spring Harb Symp Quant Biol 52 (1987), 545-
553.
[Lee99] M. S. Lee, Molecular clock calibrations and metazoan divergence dates, J.
Mol. Evol. 49 (1999), no. 3, 385-391.
[Li81] W. H. Li, T. Gojobori, and M. Nei, Pseudogenes as a paradigm of neutral
evolution, Nature 292 (1981), no. 5820, 237-239.
[Li84] W. H. Li, C. I. Wu, and C. C. Luo, Nonrandomness of point mutation as
reflected in nucleotide substitutions in pseudogenes and its evolutionary
implications, J. Mol. Evol. 21 (1984), no. 1, 58-71.
[Li85] W. H. Li, C. I. Wu, and C. C. Luo, A new method for estimating syn¬
onymous and nonsynonymous rates of nucleotide substitution consideringthe relative likelihood of nucleotide and codon changes, Mol. Biol. Evol. 2
(1985), 150-174.
[Li87] W. H. Li, M. Tanimura, and P. M. Sharp, An evaluation of the molecular
clock hypothesis using mammalian dna sequences, J. Mol. Evol. 25 (1987),
no. 4, 330-342.
[Li97] Wen-Hsiung Li, Molecular evolution, Sinauer Associates, Sunderland,
Mass., 1997.
[LiuOl] F. G. Liu, M. M. Miyamoto, N. P. Freire, P. Q. Ong, M. R. Tennant, T. S.
Young, and K. F. Gugel, Molecular and morphological supertrees for eu-
therian (placental) mammals, Science 291 (2001), no. 5509, 1786-1789.
[Mar59] C. L. Markert and F. Moller, Multiple forms of enzymes - tissue, onto¬
genetic, and species specific patterns., Proc. Natl. Acad. Sei. U. S. A. 45
(1959), no. 5, 753-763.
74 Bibliography
[Mes97] W. Messier and C. B. Stewart, Episodic adaptive evolution of primate
lysozymes, Nature 385 (1997), no. 6612, 151-154.
[NakOO] Y Nakamura, T. Gojobori, and T. Ikemura, Codon usage tabulated from
the international dna sequence databases: status for the year 2000., Nucl.
Acids Res. 28 (2000), 292.
[Nee70] S. B. Needleman and C. D. Wunsch, A general method applicable to the
search for similarities in the amino acid sequence of two proteins, J. Mol.
Biol. 48 (1970), no. 3, 443-453.
[Pam93] P. Pamilo and N. O. Bianchi, Evolution of the zfx and zfy genes: rates
and interdependence between the genes, Mol. Biol. Evol. 10 (1993), no. 2,
271-281.
[Pel99] M. Pellegrini, E. M. Marcotte, M. J. Thompson, D. Eisenberg, and T. O.
Yeates, Assigning protein functions by comparative genome analysis: pro¬
tein phylogenetic profiles, Proc. Natl. Acad. Sei. U. S. A. 96 (1999), no. 8,
4285-4288.
[Pet99] D. A. Petrov and D. L. Hard, Patterns of nucleotide substitution in
drosophila and mammalian genomes, Proc. Natl. Acad. Sei. U. S. A. 96
(1999), no. 4, 1475-1479.
[Pro94] Donald R. Prothero, The eocene-oligocene transition : paradise lost, Criti¬
cal moments in paleobiology and earth history series, Columbia UniversityPress, New York, 1994.
[RodOO] F. Rodriguez-Trelles, R Tarrio, and F. J. Ayala, Disparate evolution of par¬
alogous introns in xdh gene of drosophila., J. Mol. Evol. 50 (2000), no. 2,
123-130.
[Rom66] Alfred Sherwood Romer, Vertebrate paleontology, 3d ed., University of
Chicago Press, Chicago,, 1966.
[Ros82] K. D. Rose, Skeleton of diacodexis, oldest known artiodactyl., Science 216
(1982), no. 4546, 621-623.
[Sim97] E. R. Simpson, M. D. Michael, V. R. Agarwal, M. M. Hinshelwood, S. E.
Bulun, and Y. Zhao, Cytochromes p450 11: expression of the cypl9 (aro¬
matase) gene: an unusual case of alternative promoter usage, Faseb J. 11
(1997), no. 1, 29-36.
[Smi81] T. F. Smith and M. S. Waterman, Identification of common molecular sub¬
sequences, J. Mol. Biol. 147 (1981), no. 1, 195-197.
Bibliography 75
[Ste87] C. B. Stewart, J. W. Schilling, and A. C. Wilson, Adaptive evolution in the
stomach lysozymes of foregut fermenters, Nature 330 (1987), no. 6146,
401-404.
[Stu90] R. K. Stucky, Evolution of land mammal diversity in north america duringthe cenozoic, Curr. Mammalogy 2 (1990), 375-432.
[Sun98] G. Sun, D. L. Dilcher, S. Zheng, and Z. Zhou, In search of the first flower:
A Jurassic angiosperm, archaefructus, from northeast china, Science 282
(1998), no. 5394, 1692-1695.
[Swo98] D. L. Swofford, Paup* 4.0 - phylogenetic analysis using parsimony (*and
other methods), Sinauer Assoc, Sunderland, MA, 1998.
[Ter91] M. Terashima, K. Toda, T. Kawamoto, I. Kuribayashi, Y. Ogawa, T. Maeda,
and Y Shizuta, Isolation of a full-length cdna encoding mouse aromatase
p450, Arch. Biochem. Biophys. 285 (1991), no. 2, 231-237.
[Wil77] A. C. Wilson, S. S. Carlson, and T. J. White, Biochemical evolution, Ann.
Rev. Biochem. 46 (1977), 573-639.
[Wol78] J. A. Wolfe, A paleobotanical interpretation of tertiary climates in the
northern hemisphere., American Sei. 66 (1978), 694-703.
[Wu85] C I. Wu and W. H. Li, Evidence for higher rates of nucleotide substitution
in rodents than in man, Proc. Natl. Acad. Sei. U. S. A. 82 (1985), no. 6,
1741-1745.
[Zuc65] E. Zuckerkandl and L. Pauling, Evolutionary divergence and convergence
in proteins., Evolving genes and proteins: a symposium held at the Institute
of Microbiology of Rutgers, with support from the National Science Foun¬
dation (Vernon Bryson and Henry J. Vogel, eds.), Academic Press, New
York,, 1965.

Seite Leer l\Blank leaf j
i

Curriculum Vitae
February 14 1968 Born in Basel, Switzerland.
1986 Matura (type B) at Gymnasium am Kohlen¬
berg Basel, Switzerland.
1988-1993 Studies and diploma in chemistry at
E.T.H. Zurich. Diploma thesis supervised byDr. Hiroshi D. Nakano: "Rekonstruktion des
gemeinsamen Vorgängers Alkoholdehydro-
genasen I & II von Saccharomyces cervisiae
mittels gentechnischen Arbeitsmethoden" in
the research group of Prof. Steven A. Benner
1995-2001 Research at the Department of Chemistryat E.T.H. Zurich. Since summer 1995
in residence at the University of Florida,
Gainesville, FL, USA
77