rigorous mathematical steps for sensitivity analysis of ...calculations, harmonic analysis, motor...
TRANSCRIPT
ELECTRICAL & ELECTRONIC ENGINEERING | RESEARCH ARTICLE
Rigorous Mathematical Steps for SensitivityAnalysis of High Impedance Ground FaultDetection in Power Distribution SystemsP. Velmurugan1* and A. B. Chattopadhayay2
Abstract: A literature survey indicated that high impedance fault (HIF) detectionmethods employ simulation techniques using very low voltage signals generatedusing software such as PSCAD, and MATLAB, among others. While software plat-forms are used to derive satisfactory results, small fault current signals cannot beaccurately tapped from high transformation ratio current transformers owing to thedominant load currents in real power systems. Therefore, a sensitivity analysisbased on a power system background is considered essential. A set of well-knownpower system equations are used to analyse and select a parameter to tune thissensitivity, from several available parameters, such as source, transformer, line,neutral, and earth impedance. The analysis reveals that when the detection of HIFin the field is challenging, then fault or neutral impedance emerges as an importantparameter for tuning the system. To achieve this, certain rigorous mathematicalsteps are derived to develop a suitable formulation for sensitivity analysis usingdifferential calculus. Based on the analysis, the sensitivity results and tuning para-meters are tabulated, and sensitivity dependency curves are plotted.
Subjects: Engineering Mathematics; Electrical & Electronic Engineering; Power Engineering
P. Velmurugan
ABOUT THE AUTHORMr. P. Velmurugan is currently a Research Scholarat BITS-Pilani, U.A.E Campus. His area of researchincludes Detection of High Impedance Fault(DoHIF).Author possesses an extensive experi-ence of over 33 years in Power Generation,Transmission and Distribution including Systemstudies (Power Flow, Fault Analysis, GradedProtection and Unit Protection settingCalculations, Harmonic Analysis, Motor Starting,Substation Earthing, and Stability analysis) usingCYME, EDSA, EMTP and/or ETAP software. In 2014,he worked as Lead Power system Engineer ina rare kind of project in UAE. He has got vastexperience in the area of power system protec-tion and power system grounding.
PUBLIC INTEREST STATEMENTHigh impedance faults do not produce sufficientfault current to be detected by conventionalovercurrent relays or fuses. Developing a suitabletechnique to detect high impedance faults witha reasonable degree of reliability is a safetychallenge for engineers and power supply provi-ders. Literature surveys spanning over 34 yearsof high impedance fault (HIF) detection methodsindicate that research on this topic is underway.The detection of fallen live conductors in desertregions is critical to ensuring the safety ofhumans and livestock (camels) in the area. Tounderstand the characteristics and magnitude ofthe current produced by the fallen conductors inthe desert, under different situations, live linefault simulations were conducted by power sup-ply providers. The author(1), who was involved asa lead engineer in conducting such tests, ana-lysed the power system to identify methods tomeasure such low fault currents.
Velmurugan & Chattopadhayay, Cogent Engineering (2020), 7: 1747373https://doi.org/10.1080/23311916.2020.1747373
© 2020 The Author(s). This open access article is distributed under a Creative CommonsAttribution (CC-BY) 4.0 license.
Received: 28 September 2019Accepted: 14 March 2020
*Corresponding author:P. Velmurugan, Electrical andElectronics Engineering, TWINVEYElectric Consultancy, Dubai, U.A.EE-mail: [email protected]
Reviewing editor::Kun Chen, Wuhan University ofTechnology, China
Additional information is available atthe end of the article
Page 1 of 16

Keywords: differential calculus; symmetrical components; neutral voltage; sensitivityanalysis; sequence impedance; line voltages
1. IntroductionHigh impedance faults do not produce sufficient fault current (Tengdin et al., 1996). For anextended period, it has been a challenge to detect high impedance faults with a reasonable degreeof reliability. The state-of-the-art research surrounding this topic for a period spanning over33 years has been summarised in (Ghaderi et al., 2017) published in 2017. Recent literaturesurveys on HIF detection (Costa et al., 2015; Chakraborty & Das, 2018; Cui et al., 2019; Gomeset al., 2017; Papathanassiou et al., 2007; Song et al., 2019) also indicate that studies concerningthis area of interest are underway. The methods identified in the literature are mostly based onsoftware tools such as MATLAB/SIMULINK and PSCAD (Papathanassiou et al., 2007), and hence,reflect satisfactory results for the identification of HIF. A study that discusses a new model for highimpedance fault in electrical distribution systems presents a HIF (Emanuel arc model) simulatedusing ATP/EMTP. This analysis was performed for five different models of several amplitudes (9–90A) of HIF current, providing results with high accuracy (Sedighi, 2014). We observed that the resultsare satisfactorily derived owing to the high amplitude currents selected, and such currents aredetectable by the currently available protection relays. The study concerning a novel high impe-dance fault detection technique in distribution systems with distributed generators also considersPSCAD/EMTDC software used for generating data for different test cases, and the method isimplemented using the MATLAB software. The magnitude of current in this study is in the rangeof several tens of amperes (Nayak et al., 2016). The research on high impedance fault identificationand classification using a discrete wavelet transform and artificial neural networks (Hubana et al.,2018) indicates that there are no current and voltage measuring transformers used, and hence, nodifficulty is faced while capturing real-time data. The research on high impedance fault detectionin a medium voltage distribution network, using a discrete wavelet transform and adaptive neuro-fuzzy inference system (Veerasamy et al., 2018), considers the DWT and ANFIS networks forgenerating data for different test cases and the method is implemented using MATLAB the soft-ware. This also considers Emanuel two-diode arc model for HIF detection. No current and voltagemeasuring transformers are used in this model and no difficulty was faced in capturing real-timedata. The study on high impedance fault detection and isolation in power distribution networksusing support vector machines (Sarwar et al., 2019) considers the well-known arc model and thecurrent amplitude selected is about 35 A, which is easily detectable.
Field survey and experience in existing electrical substations indicate that real-time current andvoltage measurements, with sufficient quantity derived from medium voltage distribution systems,are essential in providing suitable and reliable methods for the detection of HIF. The presentlyavailable methods implemented by various protection relay manufacturers in use, in substations,in the United Arab Emirates desert regions are not sufficient for detecting a fallen live conductoron highly resistive desert soil (which does not permit adequate ground-fault current). Such HIFproduces small ground-fault currents that cannot be accurately tapped from the high transforma-tion ratio current transformers used in the lines due to the dominant load currents. Practically, thecurrent transformation ratio is 400/1 for a 6 MVA real power transmission line in an 11 kV system.
Live line fault simulations were conducted by power supply providers to understand the char-acteristics and magnitude of the current produced by fallen conductors on the desert soil underdifferent situations. The author(1) was involved as a lead engineer when these tests were con-ducted (Velmurugan, 2012) and were therefore motivated to analyse the power system para-meters to find ways to transform such low fault currents for the purpose of detection. The authors,therefore, decided to focus on conducting a sensitivity analysis of single line to ground fault, ina medium voltage overhead line circuit, by varying the zero-sequence impedance (fault impedanceor neutral circuit impedance) based on a set of power system Equation (15). There were very fewstudies with direct references to sensitivity analysis applied in the area towards the detection of
Velmurugan & Chattopadhayay, Cogent Engineering (2020), 7: 1747373https://doi.org/10.1080/23311916.2020.1747373
Page 2 of 16

HIF. It has been observed that studies on the topic of sensitivity analysis are also limited. However,some papers have been found to deal with the sensitivity aspects of the network. The insights from(Gomes et al., 2017) lie in the involvement of signal processing aspects. However, these authorshave not investigated the sensitivity analysis of the network. Another study (Hayward & Cruz-Hernandez, 1998) refers to sensitivity, where the main concern is the behaviour of a mass-spring-damper system. Therefore, based on the aforementioned references, the authors could notcompare the engineering results for the works mentioned above with the results of the presentpaper.
This paper is divided into six sections. Section 2 describes a simple radial power system and a setof equations that are considered for the sensitivity analysis. Section 3 introduces the mathematicalfoundation of the sensitivity analysis. Section 4 provides rigorous mathematical steps for sensitiv-ity analysis. Section 5 contains the sample results of the sensitivity analysis for a practical system,and Section 6 presents the conclusions.
2. Set of equations for a simple radial power systemThe single line representation of a simple radial power distribution system is shown in Figure 1. Tofeed MV loads (L) via the overhead lines in a desert region, a 33/11 kV Station Transformer (ST) witha 20 MVA capacity, employing a delta/star arrangement, and possessing a per unit impedance of12% is used. For the analysis, the chosen values of the neutral earthing impedance “Zn” are 0.1,63.5, and 635 Ω and the selected values of the fault impedance “Zf” are 0.1, 100, and 1000 Ω.
The sequence impedances of the lines and transformer are real-world values derived froma practical case and are tabulated in the relevant section. The power distribution capability ofthe overhead line to feed to various loads (L) is approximately 6 MVA at 11 kV. The rated loadcurrent is approximately 315 A. The current transformer ratio on the line at MV bus is 400/1considering the line capability of 120% of 315 A. In desert regions, the resistivity values of soil arehigh and therefore, the ground-fault current due to a fallen conductor is minimal in many cases.
A single-phase to ground fault “Ifa” at “F” through fault impedance “Zf” and voltage acrossneutral “Vn” are represented in Figure 2 to understand the reflections of fault current and voltages.This will aid the reader in visualising the potential rise across the transformer neutral with respectto the faulted phase and the flow of fault current through the fault impedance and the neutral.The three-phase representation provided in Figure 2 is limited to the MV system since the earth’sfault current flow is only limited to the MV system owing to the delta formation of the HV windings.Having provided these explanations, the authors believe that Figures 1 and 2 are sufficient toproceed with the analysis using a set of well-known Equations (1)–(4) defined in standard text-books (Kothari & Nagrath, 2008), (Grainger et al., 1994).
The fault current “Ifa,” healthy phase voltages “Vb,” “Vc”, and the voltage across neutral “Vn” inFigure 2 are expressed by the following set of four Equations (1)–(4) and are considered forrigorous mathematical inspection in Section 4.
Figure 1. Single linerepresentation.
Velmurugan & Chattopadhayay, Cogent Engineering (2020), 7: 1747373https://doi.org/10.1080/23311916.2020.1747373
Page 3 of 16

Ifa ¼ 3Ia0 ¼ 3Va
Z1þZ2þZ0þ3Znþ3Zf� � (1)
Vb ¼ Va 3α2ZfþZ2 α2�α� �þ Z0 þ 3Znð Þ α2�1
� �� �Z1þZ2þZ0þ3Znþ3Zf� � (2)
Vc ¼Va 3αZfþZ2 α�α2
� �þ Z0 þ 3Znð Þ α� 1ð Þ� �Z1þZ2þZ0þ3Znþ3Zf� � (3)
Vn ¼ 3Va
Z1þZ2þZ0þ3Znþ3Zf� ��Zn (4)
3. Sensitivity analysisTo provide fundamental explanations, the following details are provided considering two variables“x” and “y.” When a small change in x produces a large change in function y = f (x), then y isrelatively sensitive to changes in x. The derivative f’(x) is a measure of this sensitivity (Weir et al.,2005), (Hayward & Cruz-Hernandez, 1998). The equation dy = f’(x) dx conveys the sensitivity of theoutput of “f” to change in input for different values of “x”. The larger the value of f’ at x, the greaterthe effect of a given change dx.
Sensitivity “S” of “y” with respect to “x” is defined as follows:
Δy=yΔx=x
ffi f 0� xy
(5)
Note:
True change: Δy ¼ f x0þdxð Þ�f x0ð Þ and Estimated change: dy ¼ f0x0ð Þ � dx; and thus, employs
Δy ffi dy. In the analysis, Δyis taken to be equal to dy under the condition that change in dx is verysmall, and its limit extends to zero.
If we consider a function of two variables asu ¼ fðx; yÞ, then a small change in “u” (du) can beexpressed using the partial differentiation technique (Weir et al., 2005) as
du ¼ @f@x
dxþ @f@y
dy (6)
Similarly, applying differentiation to the power system, Equations (1)–(4) requires rigorous math-ematical steps, which are presented in Section 4.
Figure 2. Representation ofa single-phase to the groundfault of the MV system.
Velmurugan & Chattopadhayay, Cogent Engineering (2020), 7: 1747373https://doi.org/10.1080/23311916.2020.1747373
Page 4 of 16
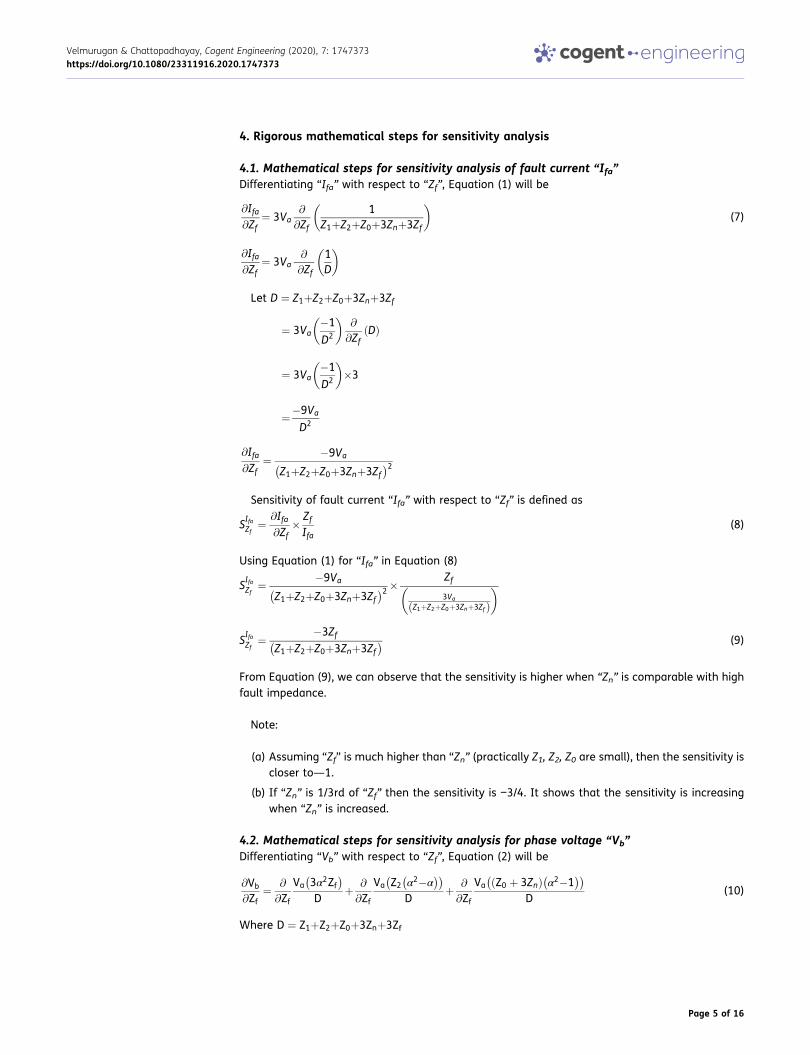
4. Rigorous mathematical steps for sensitivity analysis
4.1. Mathematical steps for sensitivity analysis of fault current “Ifa”Differentiating “Ifa” with respect to “Zf”, Equation (1) will be
@Ifa@Zf
¼ 3Va@
@Zf
1Z1þZ2þZ0þ3Znþ3Zf
� �(7)
@Ifa@Zf
¼ 3Va@
@Zf
1D
� �
Let D ¼ Z1þZ2þZ0þ3Znþ3Zf
¼ 3Va�1
D2
� �@
@ZfðDÞ
¼ 3Va�1
D2
� ��3
¼�9Va
D2
@Ifa@Zf
¼ �9Va
Z1þZ2þZ0þ3Znþ3Zf� �2
Sensitivity of fault current “Ifa” with respect to “Zf” is defined as
SIfaZf
¼ @Ifa@Zf
� ZfIfa
(8)
Using Equation (1) for “Ifa” in Equation (8)
SIfaZf
¼ �9Va
Z1þZ2þZ0þ3Znþ3Zf� �2 � Zf
3Va
Z1þZ2þZ0þ3Znþ3Zfð Þ� �
SIfaZf
¼ �3ZfZ1þZ2þZ0þ3Znþ3Zf� � (9)
From Equation (9), we can observe that the sensitivity is higher when “Zn” is comparable with highfault impedance.
Note:
(a) Assuming “Zf” is much higher than “Zn” (practically Z1, Z2, Z0 are small), then the sensitivity iscloser to—1.
(b) If “Zn” is 1/3rd of “Zf” then the sensitivity is −3/4. It shows that the sensitivity is increasingwhen “Zn” is increased.
4.2. Mathematical steps for sensitivity analysis for phase voltage “Vb”
Differentiating “Vb” with respect to “Zf”, Equation (2) will be
@Vb
@Zf¼ @
@Zf
Va 3α2Zf� �D
þ @
@Zf
Va Z2 α2�α� �� �D
þ @
@Zf
Va Z0 þ 3Znð Þ α2�1� �� �
D(10)
Where D ¼ Z1þZ2þZ0þ3Znþ3Zf
Velmurugan & Chattopadhayay, Cogent Engineering (2020), 7: 1747373https://doi.org/10.1080/23311916.2020.1747373
Page 5 of 16

Let
@Vb
@Zf¼ A1þB1þC1ð Þ
Solving for A1
A1 ¼ @
@Zf
Va3α2Zf� �
D(11)
¼ 3Vaα2
D @@Zf
Zf� ��Zf @
@ZfDð Þ
� �D2
¼ 3Vaα2 D�Zf�3� �
D2 (12)
Substituting D = Z1 + Z2 + Z0 + 3Zn + 3Zf in Equation (12)
¼ 3Vaα2 Z1þZ2þZ0 þ 3Znþ3Zf�3Zf� �
Z1þZ2þZ0þ3Znþ3Zf� �2
Therefore
A1 ¼ 3Vaα2 Z1þZ2þZ0 þ 3Znð Þ
Z1þZ2þZ0þ3Znþ3Zf� �2 (13)
Solving for B1
B1 ¼ @
@Zf
VaZ2 α2�α� �� �D
(14)
¼ VaZ2 α2�α� � �1
D2
� �@D@Zf
¼ VaZ2 α2�α� � �1� 3
D2
� �(15)
Substituting D = Z1 + Z2 + Z0 + 3Zn + 3Zf in Equation (15)
Therefore
B1 ¼ �3VaZ2 α2�α� �
Z1þZ2þZ0þ3Znþ3Zf� �2 (16)
Similarly, solving for C1
C1 ¼ @
@Zf
Va Z0 þ 3Znð Þ α2�1� �� �
D(17)
¼ Va Z0 þ 3Znð Þ α2�1� � �1
D2
� �@D@Zf
¼ Va Z0 þ 3Znð Þ α2�1� � �1� 3
D2
� �(18)
Substituting D = Z1 + Z2 + Z0 + 3Zn + 3Zf in Equation (18)
Therefore
Velmurugan & Chattopadhayay, Cogent Engineering (2020), 7: 1747373https://doi.org/10.1080/23311916.2020.1747373
Page 6 of 16

C1 ¼ �3 Z0 þ 3Znð ÞVa α2�1� �
Z1þZ2þZ0þ3Znþ3Zf� �2 (19)
Adding Equations (13), (16) and (19) to find
@Vb
@Zf¼ A1þB1þC1ð Þ
@Vb
@Zf¼ 3Va Z1þZ2þZ0 þ 3Znð Þα2�Z2 α2�α
� �� Z0 þ 3Znð Þ α2�1� ��
D2
@Vb
@Zf¼ 3Va Z1α2þZ2αþZ0 þ 3Zn
� D2 (20)
Applying Equation (20) and Equation (2) to the sensitivity formulae defined in Equation (5)
SVbZf
¼ @Vb
@Zf� ZfVb
SVbZf
¼ 3Va Z1α2þZ2αþZ0 þ 3Zn� ��Zf�D
D2�Va 3Zfα2þZ2 α2�αð Þþ Z0 þ 3Znð Þ α2�1ð Þ� � (21)
Substituting D = Z1 + Z2 + Z0 + 3Zn + 3Zf in Equation (21)
Therefore
SVbZf
¼ 3Zf Z1α2þZ2αþZ0 þ 3Zn� �
Z1þZ2þZ0þ3Znþ3Zf� �
3Zfα2þZ2 α2�αð Þþ Z0 þ 3Znð Þ α2�1ð Þ� � (22)
Sensitivity of voltage “Vb” with respect to fault impedance “Zf” can be calculated for a range of “Zf”and keeping other parameters constant.
4.3. Mathematical steps for sensitivity analysis for phase voltage “Vc”
Differentiating “Vc” with respect to “Zf”, Equation (3) will be
@Vc
@Zf¼ @
@Zf
Va 3αZf� �D
þ @
@Zf
Va Z2 α�α2� �� �D
þ @
@Zf
Va Z0 þ 3Znð Þ α� 1ð Þð ÞD
(23)
where D = Z1 + Z2 + Z0 + 3Zn + 3Zf
Let
Solving for A2@Vc@Zf
¼ A2þB2þC2ð Þ
A2 ¼ @
@Zf
Va3αZf� �
D(24)
¼ 3VaαD @
@ZfZf� ��Zf @
@ZfDð Þ
� �D2
¼ 3VaαD�Zf�3� �
D2 (25)
Substituting D = Z1 + Z2 + Z0 + 3Zn + 3Zf in Equation (25)
¼ 3VaαZ1þZ2þZ0 þ 3Znþ3Zf�3Zf� �
Z1þZ2þZ0þ3Znþ3Zf� �2
Velmurugan & Chattopadhayay, Cogent Engineering (2020), 7: 1747373https://doi.org/10.1080/23311916.2020.1747373
Page 7 of 16

Therefore
A2 ¼ 3VaαZ1þZ2þZ0 þ 3Znð Þ
Z1þZ2þZ0þ3Znþ3Zf� �2 (26)
Solving for B2
B2 ¼ @
@Zf
VaZ2 α�α2� �� �D
(27)
¼ VaZ2 α�α2� � �1
D2
� �@D@Zf
¼ VaZ2 α�α2� � �1
D2
� ��3 (28)
Substituting D = Z1 + Z2 + Z0 + 3Zn + 3Zf in Equation (28)
Therefore
B2 ¼ �3VaZ2 α�α2� �
Z1þZ2þZ0þ3Znþ3Zf� �2 (29)
Similarly, solving for C2
C2 ¼ @
@Zf
Va Z0 þ 3Znð Þ α� 1ð Þð ÞD
(30)
C2 ¼ @
@Zf
Va Z0 þ 3Znð Þ α� 1ð Þð ÞD
C2 ¼ Va Z0 þ 3Znð Þ α� 1ð Þ �1� 3
D2
� �(31)
Substituting D = Z1 + Z2 + Z0 + 3Zn + 3Zf in Equation (31)
Therefore
C2 ¼ �3Va Z0 þ 3Znð Þ α� 1ð ÞZ1þZ2þZ0þ3Znþ3Zf� �2 (32)
Adding Equations (26), (29) and (32)
@Vc
@Zf¼ A2þB2þC2ð Þ
@Vc
@Zf¼ 3Va Z1þZ2þZ0 þ 3Znð Þα�Z2 α�α2
� �� Z0 þ 3Znð Þ α� 1ð Þ� D2
@Vc
@Zf¼ 3Va Z1þZ2þZ0�Z2�Z0ð ÞαþZ2α2þZ0 þ 3Zn
� D2
@Vc
@Zf¼ 3Va Z2α2þZ1αþZ0 þ 3Zn
� D2 (33)
Applying Equation (33) and Equation (3) to the sensitivity formulae defined in Equation (5)
SVcZf
¼ @Vc
@Zf� ZfVc
Velmurugan & Chattopadhayay, Cogent Engineering (2020), 7: 1747373https://doi.org/10.1080/23311916.2020.1747373
Page 8 of 16
SVcZf
¼ 3Va Z2α2þZ1αþZ0 þ 3Zn� �
D 3ZfαþZ2 α�α2ð Þþ Z0 þ 3Znð Þ α� 1ð Þ� � (34)
Substituting D = Z1 + Z2 + Z0 + 3Zn + 3Zf in Equation (34)
SVcZf
¼ 3Zf Z2a2 þ Z1aþ Z0 þ 3Zn� �
Z1 þ Z2 þ Z0 þ 3Zn þ 3Zf� �
3Zfaþ Z2 a� a2ð Þ þ Z0 þ 3Znð Þ a� 1ð Þ� � (35)
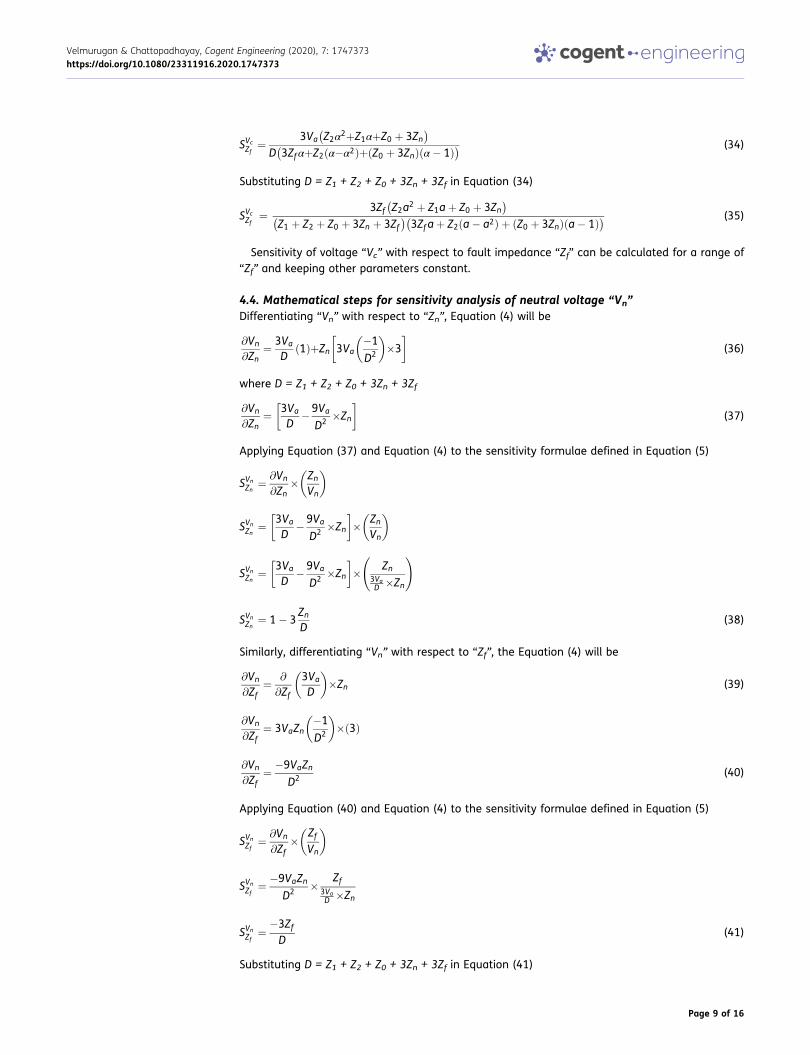
Sensitivity of voltage “Vc” with respect to fault impedance “Zf” can be calculated for a range of“Zf” and keeping other parameters constant.
4.4. Mathematical steps for sensitivity analysis of neutral voltage “Vn”
Differentiating “Vn” with respect to “Zn”, Equation (4) will be
@Vn
@Zn¼ 3Va
D1ð ÞþZn 3Va
�1
D2
� ��3
�(36)
where D = Z1 + Z2 + Z0 + 3Zn + 3Zf
@Vn
@Zn¼ 3Va
D�9Va
D2 �Zn
�(37)
Applying Equation (37) and Equation (4) to the sensitivity formulae defined in Equation (5)
SVnZn ¼ @Vn
@Zn� Zn
Vn
� �
SVnZn ¼ 3Va
D�9Va
D2 �Zn
�� Zn
Vn
� �
SVnZn ¼ 3Va
D�9Va
D2 �Zn
�� Zn
3VaD �Zn
!
SVnZn ¼ 1� 3
ZnD
(38)
Similarly, differentiating “Vn” with respect to “Zf”, the Equation (4) will be
@Vn
@Zf¼ @
@Zf
3Va
D
� ��Zn (39)
@Vn
@Zf¼ 3VaZn
�1
D2
� �� 3ð Þ
@Vn
@Zf¼ �9VaZn
D2 (40)
Applying Equation (40) and Equation (4) to the sensitivity formulae defined in Equation (5)
SVnZf
¼ @Vn
@Zf� Zf
Vn
� �
SVnZf
¼ �9VaZnD2 � Zf
3VaD �Zn
SVnZf
¼ �3ZfD
(41)
Substituting D = Z1 + Z2 + Z0 + 3Zn + 3Zf in Equation (41)
Velmurugan & Chattopadhayay, Cogent Engineering (2020), 7: 1747373https://doi.org/10.1080/23311916.2020.1747373
Page 9 of 16

SVnZf
¼ �3ZfZ1þZ2þZ0þ3Znþ3Zf� � (42)
The focus of this manuscript remains in the zone of mathematical modelling of sensitivity of HIFsystem by deriving the above Equations (7)–(42).
The right-hand side of the Equations (9) and (42) is same. By this, it is inferred that the sensitivityof fault current S(Ifa) and the sensitivity of voltage across the neutral earthing impedance S(Vn) issame for any values of “Zf”.
The sensitivity value has both magnitude and angle. With reference to the HIF phenomena ina distribution system, the practical problem becomes exactly how to detect a high impedancefault. Hence, the magnitude of sensitivity is only supposed to be considered and analysed, the“angle” is not analysed in this paper. Sensitivity analysis has been used to transfer the concept of“parameter tuning” followed in control system applications. This use is backed by the experience-based knowledge imparted in practical power system work. In which parameter to be chosen aresource impedance, transformer impedance, line impedance, neutral impedance, earth impedance.
A sample sensitivity calculation of a practical system is presented in the following section 5. Inorder to understand the above mathematical steps, a flow chart is given in Figure 3.
4.5. Flow chart for mathematical steps and sensitivity analysis5. Sample sensitivity calculation of a practical system (MV OHL)The total sequence impedance for a practical system (Velmurugan, 2012) is given below in Table 1.A fault level of 571.56 MVA at the HV bus is considered for ground-fault current computations.
5.1. Neutral earthing impedance “Zn” valuesTo align with the IEEE Std. 142–1991 recommendation (IEEE Std. 142-), which allowsa maximum fault current of 10 A for high resistance earthing, the neutral earthing impedance“Zn” is chosen as 635 Ω for analysis, and the selected value of 63.5 Ω is 10% of 635 Ohms.Other different values of “Zn” can be selected for analysis. Particularly, Zn = 0.1 Ω, which isa practical value for a neutral, directly grounded system. The fault impedance “Zf” value can beconsidered above 1000 Ω, but for the sake of presenting the results, the authors decided tolimit this value.
5.2. Contribution of sensitivity analysisContributions of this analysis are broad and aim to (a) develop a suitable formulation for thesensitivity of the performance figures in a faulted power system and (b) fix a suitable tuningparameter in the case of a power system with a high fault impedance, subjected to a single phaseto ground fault for controlling the sensitivity. Given the broad contributions of this analysis, thesample sensitivity calculations for a medium voltage overhead line system (MV OHL) are per-formed, and the results are presented in both tabular and graphical forms.
5.3. Sensitivity analysis of phase voltage “Vb”
Equation (22) is used for the analysis of the sensitivity of voltage “Vb” at the fault location. The sensitivityresults S(Vb) for the phase voltage “Vb” are presented in Table 2 and Figure 4. For a higher range of faultimpedances, it can be observed that the sensitivity varies, based on the neutral earthing impedance.Notably, the sensitivity results S(Vb) are higher at a high neutral earthing impedance. Thus, a high neutralearthing impedance (resistance) is recommended for the detection of HIF. Measuring the voltage “Vb” isimpractical at the fault location in real-time.
5.4. Sensitivity analysis of phase voltage “Vc”Equation (35) is used for the analysis of the sensitivity of voltage “Vc” at the fault location. Thesensitivity results S(Vc) for phase voltage “Vc” are presented in Table 3 and Figure 5. For a higher
Velmurugan & Chattopadhayay, Cogent Engineering (2020), 7: 1747373https://doi.org/10.1080/23311916.2020.1747373
Page 10 of 16

range of fault impedances, it can be observed that the sensitivity varies, based on the neutralearthing impedance. Notably, the sensitivity results S(Vc) are higher at a high neutral earthingimpedance. Thus, a high neutral earthing impedance (resistance) is recommended for the detec-tion of HIF. Measuring the voltage “Vc” is impractical at the fault location in real-time.
Table 1. Total sequence impedances (Z1, Z2, Z0) in a practical system
Total Sequence Impedance ValuesPositive seq. impedance (Z1 S + Z1 t+ Z1 L) 0.969+ j1.778 Ω
Negative seq. impedance (Z2 S + Z2 t+ Z2 L) 0.969+ j1.778 Ω
Zero seq. impedance (Z0 L + Z0 t) 1.671+ j5.154 Ω
Fault impedance (Zf) 0.1 to 1000 Ω
Figure 3. Flowchart.
Velmurugan & Chattopadhayay, Cogent Engineering (2020), 7: 1747373https://doi.org/10.1080/23311916.2020.1747373
Page 11 of 16

5.5. Sensitivity analysis of fault current “Ifa” and neutral voltage “Vn”
Equation (9) is used for the analysis of the sensitivity of the fault current “Ifa” and Equation (42) isused for the analysis of the sensitivity of the neutral voltage “Vn.” The sensitivity results S(Ifa) forthe fault current “Ifa” and the sensitivity results S(Vn) for the neutral voltage “Vn” are exhibited inTables 4–5 and Figure 6. For a higher range of fault impedances, it can be observed that thesensitivity varies based on the neutral earthing impedance. It should also be noted that thesensitivity results for S(Ifa) and S(Vn) are higher at high neutral earthing impedance. Therefore,a high neutral earthing impedance (resistance) is recommended for the detection of HIF. Theneutral earthing impedance value should be selected carefully for a given system keeping in mindthe protection requirements to avoid over voltages in the system. Measuring the fault current “Ifa”and neutral voltage “Vn” is practical and can be implemented at the site.
Figure 4. Sensitivity of phasevoltage S (Vb) curve for various“Zn”.
Table 3. Magnitude of the sensitivity of healthy phase voltage S(Vc)
Zf Zn (Ω)(Ω) 0.1 63.5 635
0.1 0.01 0.00 0.00
100 0.01 0.19 0.07
1000 0.00 0.05 0.19
Note: Sensitivity values of Tables 2 and 3 are identical.
Table 2. Magnitude of the sensitivity of healthy phase voltage S(Vb)
Zf Zn (Ω)
(Ω) 0.1 63.5 635
0.1 0.01 0.00 0.00
100 0.01 0.19 0.07
1000 0.00 0.05 0.19
Velmurugan & Chattopadhayay, Cogent Engineering (2020), 7: 1747373https://doi.org/10.1080/23311916.2020.1747373
Page 12 of 16

(1) Sensitivity of fault current S(Ifa) and neutral voltage S(Vn) in the case of the neutral directlygrounded system:
It can be noted from Figure 6 that the sensitivity of S(Ifa) and S(Vn) is poor when the faultimpedance is high, say 15 Ω or more in the case of the neutral directly grounded system (refer0.1 Ω curve in Figure 6). This also suggests a high resistance grounded system for the detection ofhigh impedance fault.
6. ConclusionIt has been observed on-site that a high impedance fault leads to a low value of fault currentwhose appearance is in the form of a weak flash or flow. Despite this, the controlling parametermust be known for which the sensitivity analysis is essential. Thus, a sensitivity analysis wasperformed to analyse the degree of severity of the high impedance fault. The concept of
Figure 5. Sensitivity of phasevoltage S (Vc) curve for various“Zn”.
Table 4. Magnitude of the sensitivity of fault current S(Ifa)
Zf Zn (Ω)
(Ω) 0.1 63.5 635
0.1 − 0.03 0.00 0.00
100 − 0.99 − 0.61 − 0.14
1000 − 1.00 − 0.94 − 0.61
Table 5. Magnitude of the sensitivity of neutral Voltage S(Vn)
Zf Zn (Ω)(Ω) 0.1 63.5 635
0.1 − 0.03 0.00 0.00
100 − 0.99 − 0.61 − 0.14
1000 − 1.00 − 0.94 − 0.61
Note: Sensitivity values of Tables 4 and 5 are identical.
Velmurugan & Chattopadhayay, Cogent Engineering (2020), 7: 1747373https://doi.org/10.1080/23311916.2020.1747373
Page 13 of 16

a mathematical function of several variables was employed to analyse the behaviour of the HIF,logically. The essence of this statement lies in the fact that a specific parameter needs to beselected to tune the sensitivity of the parameter from several available parameters (e.g., source,transformer, line, neutral, and earth impedance). The same sensitivity analysis can be used asa design tool to fix the value of the neutral earthing impedance and observe and optimise thevoltages in the healthy phases by an expert power system engineer.
Based on the analysis, it can be concluded that HIF detection signals should be tapped from theneutral of the supply system with high neutral earthing impedance (resistance). It is also sug-gested that the high current transformation ratio for signal transformation from a real powersystem distribution lines should be avoided.
FundingThe authors received no direct funding for this research.
Author detailsP. Velmurugan1
E-mail: [email protected] ID: http://orcid.org/0000-0002-2664-4627A. B. Chattopadhayay2
E-mail: [email protected] Electrical and Electronics Engineering, TWINVEY ElectricConsultancy, Dubai, U.A.E.
2 Electrical and Electronics Engineering, Bits-Pilani, U.A.ECampus, Dubai, U.A.E.
Abbreviations
G Generation
HV High Voltage (33 kV)
HIF High ImpedanceFault
MV Medium Voltage (11kV)
ST Station Transformer
L LV Load via stepdown transformer
F Fault
OHL Overhead line
DWT Discrete wavelettransform
ANFIS Adaptive neuro-fuzzyinference system
EMTP Electromagnetictransient program
ETAP Electrical transientand analysis program
PSCAD Power system com-puter-aided design
Figure 6. Sensitivity of faultcurrent S (Ifa) and neutral vol-tage S (Vn) curves for various“Zn”.
Velmurugan & Chattopadhayay, Cogent Engineering (2020), 7: 1747373https://doi.org/10.1080/23311916.2020.1747373
Page 14 of 16
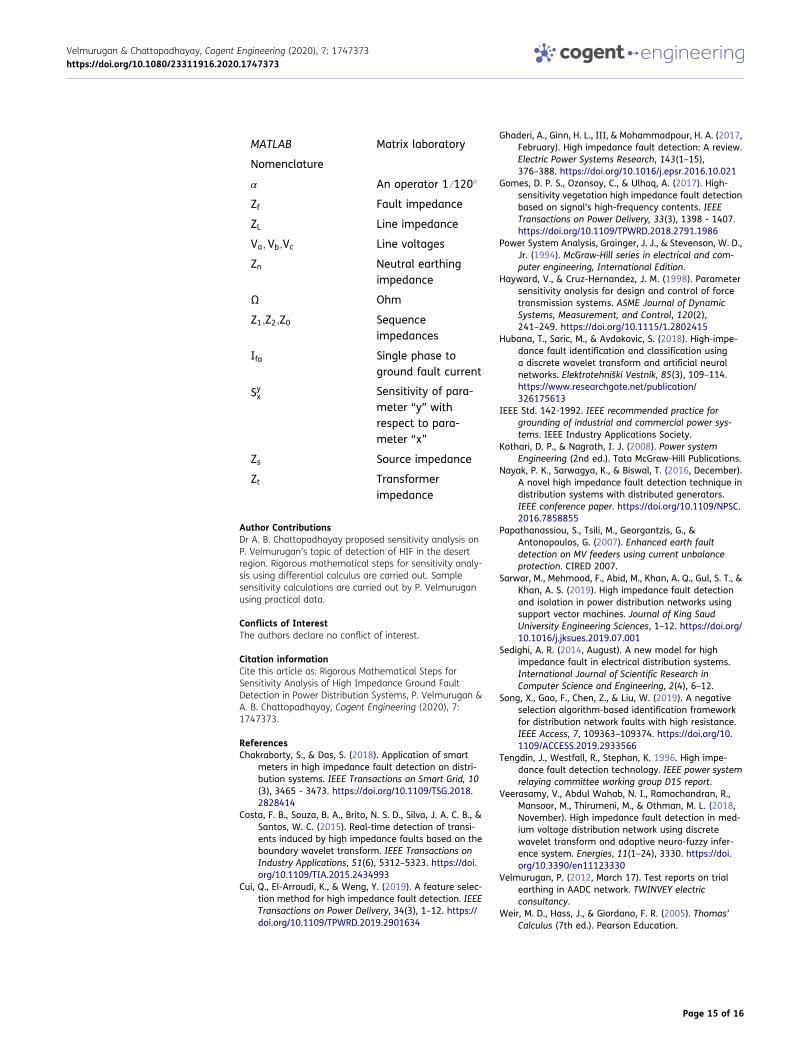
MATLAB Matrix laboratory
Nomenclature
α An operator 1ff120�
Zf Fault impedance
ZL Line impedance
Va;Vb;Vc Line voltages
Zn Neutral earthingimpedance
Ω Ohm
Z1;Z2;Z0 Sequenceimpedances
Ifa Single phase toground fault current
Syx Sensitivity of para-meter “y” withrespect to para-meter “x”
Zs Source impedance
Zt Transformerimpedance
Author ContributionsDr A. B. Chattopadhayay proposed sensitivity analysis onP. Velmurugan’s topic of detection of HIF in the desertregion. Rigorous mathematical steps for sensitivity analy-sis using differential calculus are carried out. Samplesensitivity calculations are carried out by P. Velmuruganusing practical data.
Conflicts of InterestThe authors declare no conflict of interest.
Citation informationCite this article as: Rigorous Mathematical Steps forSensitivity Analysis of High Impedance Ground FaultDetection in Power Distribution Systems, P. Velmurugan &A. B. Chattopadhayay, Cogent Engineering (2020), 7:1747373.
ReferencesChakraborty, S., & Das, S. (2018). Application of smart
meters in high impedance fault detection on distri-bution systems. IEEE Transactions on Smart Grid, 10(3), 3465 - 3473. https://doi.org/10.1109/TSG.2018.2828414
Costa, F. B., Souza, B. A., Brito, N. S. D., Silva, J. A. C. B., &Santos, W. C. (2015). Real-time detection of transi-ents induced by high impedance faults based on theboundary wavelet transform. IEEE Transactions onIndustry Applications, 51(6), 5312–5323. https://doi.org/10.1109/TIA.2015.2434993
Cui, Q., El-Arroudi, K., & Weng, Y. (2019). A feature selec-tion method for high impedance fault detection. IEEETransactions on Power Delivery, 34(3), 1–12. https://doi.org/10.1109/TPWRD.2019.2901634
Ghaderi, A., Ginn, H. L., III, & Mohammadpour, H. A. (2017,February). High impedance fault detection: A review.Electric Power Systems Research, 143(1–15),376–388. https://doi.org/10.1016/j.epsr.2016.10.021
Gomes, D. P. S., Ozansoy, C., & Ulhaq, A. (2017). High-sensitivity vegetation high impedance fault detectionbased on signal’s high-frequency contents. IEEETransactions on Power Delivery, 33(3), 1398 - 1407.https://doi.org/10.1109/TPWRD.2018.2791.1986
Power System Analysis, Grainger, J. J., & Stevenson, W. D.,Jr. (1994). McGraw-Hill series in electrical and com-puter engineering, International Edition.
Hayward, V., & Cruz-Hernandez, J. M. (1998). Parametersensitivity analysis for design and control of forcetransmission systems. ASME Journal of DynamicSystems, Measurement, and Control, 120(2),241–249. https://doi.org/10.1115/1.2802415
Hubana, T., Saric, M., & Avdakovic, S. (2018). High-impe-dance fault identification and classification usinga discrete wavelet transform and artificial neuralnetworks. Elektrotehniški Vestnik, 85(3), 109–114.https://www.researchgate.net/publication/326175613
IEEE Std. 142-1992. IEEE recommended practice forgrounding of industrial and commercial power sys-tems. IEEE Industry Applications Society.
Kothari, D. P., & Nagrath, I. J. (2008). Power systemEngineering (2nd ed.). Tata McGraw-Hill Publications.
Nayak, P. K., Sarwagya, K., & Biswal, T. (2016, December).A novel high impedance fault detection technique indistribution systems with distributed generators.IEEE conference paper. https://doi.org/10.1109/NPSC.2016.7858855
Papathanassiou, S., Tsili, M., Georgantzis, G., &Antonopoulos, G. (2007). Enhanced earth faultdetection on MV feeders using current unbalanceprotection. CIRED 2007.
Sarwar, M., Mehmood, F., Abid, M., Khan, A. Q., Gul, S. T., &Khan, A. S. (2019). High impedance fault detectionand isolation in power distribution networks usingsupport vector machines. Journal of King SaudUniversity Engineering Sciences, 1–12. https://doi.org/10.1016/j.jksues.2019.07.001
Sedighi, A. R. (2014, August). A new model for highimpedance fault in electrical distribution systems.International Journal of Scientific Research inComputer Science and Engineering, 2(4), 6–12.
Song, X., Gao, F., Chen, Z., & Liu, W. (2019). A negativeselection algorithm-based identification frameworkfor distribution network faults with high resistance.IEEE Access, 7, 109363–109374. https://doi.org/10.1109/ACCESS.2019.2933566
Tengdin, J., Westfall, R., Stephan, K. 1996. High impe-dance fault detection technology. IEEE power systemrelaying committee working group D15 report.
Veerasamy, V., Abdul Wahab, N. I., Ramachandran, R.,Mansoor, M., Thirumeni, M., & Othman, M. L. (2018,November). High impedance fault detection in med-ium voltage distribution network using discretewavelet transform and adaptive neuro-fuzzy infer-ence system. Energies, 11(1–24), 3330. https://doi.org/10.3390/en11123330
Velmurugan, P. (2012, March 17). Test reports on trialearthing in AADC network. TWINVEY electricconsultancy.
Weir, M. D., Hass, J., & Giordano, F. R. (2005). Thomas’Calculus (7th ed.). Pearson Education.
Velmurugan & Chattopadhayay, Cogent Engineering (2020), 7: 1747373https://doi.org/10.1080/23311916.2020.1747373
Page 15 of 16

©2020 The Author(s). This open access article is distributed under a Creative Commons Attribution (CC-BY) 4.0 license.
You are free to:Share — copy and redistribute the material in any medium or format.Adapt — remix, transform, and build upon the material for any purpose, even commercially.The licensor cannot revoke these freedoms as long as you follow the license terms.
Under the following terms:Attribution — You must give appropriate credit, provide a link to the license, and indicate if changes were made.You may do so in any reasonable manner, but not in any way that suggests the licensor endorses you or your use.No additional restrictions
Youmay not apply legal terms or technological measures that legally restrict others from doing anything the license permits.
Cogent Engineering (ISSN: 2331-1916) is published by Cogent OA, part of Taylor & Francis Group.
Publishing with Cogent OA ensures:
• Immediate, universal access to your article on publication
• High visibility and discoverability via the Cogent OA website as well as Taylor & Francis Online
• Download and citation statistics for your article
• Rapid online publication
• Input from, and dialog with, expert editors and editorial boards
• Retention of full copyright of your article
• Guaranteed legacy preservation of your article
• Discounts and waivers for authors in developing regions
Submit your manuscript to a Cogent OA journal at www.CogentOA.com
Velmurugan & Chattopadhayay, Cogent Engineering (2020), 7: 1747373https://doi.org/10.1080/23311916.2020.1747373
Page 16 of 16