rim16: medidas ópticas del color del océano con el espectroradiómetro de campo
DESCRIPTION
RIM16: Medidas ópticas del color del océano con el espectroradiómetro de campo de alta resolución espectral HR4000CG para su aplicación en teledetección. Autor / Editor: Stéfani Novoa (AZTI-Tecnalia), Guillem Chust (AZTI-Tecnalia), Jean-Marie Froidefond (UMR EPOC). Año: 2009. Contenido: Esta contribución describe el desarrollo de un protocolo para la adquisición de signaturas espectrales del agua con el espectrómetro de campo "Ocean Optics High-Resolution Fiber Optic Spectrometer HR4000CG". La implementación del protocolo de medidas ópticas permitirá, en un futuro, estimar propiedades biofísicas del agua, como la concentración de clorofila, mediante imágenes de satélite en el golfo de Bizkaia.TRANSCRIPT

16Optical measurements of ocean colour with the field-based High-Resolution Fiber Optic Spectrometer (HR4000CG) for remote sensing applications
Stéfani NovoaGuillem Chust
Jean-Marie Froidefond
revi
sta
de
inve
stig
ació
n m
arin
a

Ocean colour measurements with a HR4000CG fi eld spectrometer for remote sensing applications
1 | Revista de Investigación Marina, 2009, 16
Novoa, S., Chust, G., Froidefond, J.M., 2009. Optical measurements of ocean colour with the fi eld-based High-Resolution Fiber Optic Spectrometer (HR4000CG) for remote sensing applications ‘Revista de Investigación Marina’ . 16: 11 pp.
La serie ‘Revista de Investigación Marina’, editada por la Unidad de Investigación Marina de Tecnalia, cuenta con el siguiente Comité Editorial:
Editor: Dr. Ángel Borja
Adjunta al Editor: Dña. Mercedes Fernández Monge e Irantzu Zubiaur (coordinación de las publicaciones)
Comité Editorial: Dr. Lorenzo Motos Dr. Adolfo Uriarte Dr. Michael Collins Dr. Javier Franco D. Julien Mader Dña. Marina Santurtun D. Victoriano Valencia Dr. Xabier Irigoien Dra. Arantza Murillas Dr. Josu Santiago
La ‘Revista de Investigación Marina’ de Tecnalia edita y publica investigaciones y datos originales resultado de la Unidad de Investigación Marina de Tecnalia. Las propuestas de publicación deben ser enviadas al siguiente correo electrónico [email protected]. Un comité de selección revisará las propuestas y sugerirá los cambios pertinentes antes de su aceptación defi nitiva.
Edición: 1.ª Diciembre 2009© AZTI-TecnaliaISSN: 1988-818XUnidad de Investigación MarinaInternet: www.azti.esEdita: Unidad de Investigación Marina de TecnaliaHerrera Kaia, Portualdea20010 PasaiaFoto portada: © Pedro J. Pacheco
© AZTI-Tecnalia 2009. Distribución gratuita en formato PDF a través de la web: www.azti.es/RIM

S. Novoa, G. Chust, J.M. Froidefond
Revista de Investigación Marina, 2009, 16 | 2
Optical measurements of ocean colour with the fi eld-based High-Resolution Fiber Optic Spectrometer (HR4000CG) for remote sensing applicationsStéfani Novoa1, Guillem Chust1, Jean-Marie Froidefond2
AbstractNumerous types of anthropogenic discharges pollute and weaken the ecosystems in coastal and transitional waters. Traditional methodologies for water quality assessment can present time and physical constraints. Satellite sensors provide the most effective means for frequent, synoptic, water-quality observations over large areas. Hence, ocean colour data is used increasingly as a tool to assess water quality by means of water constituent concentration estimation in coastal waters across Europe. However, algorithms designed for assessments at global scales are less accurate at a locally due to the variability of optically active in-water constituents; hence, regionally parameterized empirical algorithms are necessary. This contribution presents the implementation of an adapted measurement protocol and a custom-built platform for the High-Resolution Fiber Optic Spectrometer HR4000CG (200-1100 nm, 3648 channels) developed to perform in-situ spectral measurements at sea. The platform consisted of a stainless steel fl otation device to mount the sensor on and measure the upwelling radiance, and a stand to measure downwelling radiance on a diffuse lambertian target. The measurement protocol was established in the laboratory and tested along with the platforms developed in the fi eld. The protocol established consisted of: 1) Measurements performed below the water surface measurements; 2) Electric dark correction for noise reduction; 3) A boxcar smoothing of 8 nearest channels; 4) Integration times of 0.3 seconds for downwelling radiance and 1 second for upwelling radiance measurements; 5) Scan averaging and fi ltering posterior to optical data acquisition; 6) Valid spectral range for sea surface measurements between 450 and 750 nm. Coherent spectral signatures and refl ectance data were obtained. This document shows that the custom-built platform and the protocol established for the High-Resolution Fibre Optic Spectrometer HR4000CG can be used to retrieve refl ectance measurements at sea surface.
1 AZTI Foundation,Marine Research Division, Sukarrieta, Spain2 UMR EPOC, Université Bordeaux 1, Talence Cedex, France
Introduction
European Marine Strategy
The quality of coastal waters and estuaries is increasingly threatened by anthropogenic activities, such as population growth, urbanization, maritime traffi c, fi shing, aquaculture, primary production exploitations and tourism, among others. These activities produce discharges that pollute and weaken ecosystems in these particular environments.
Water quality is assessed by monitoring water parameters via in-situ biogeochemical measurements (Revilla et al., 2009). One of the criterions used for this assessment is the eutrophication risk, which is estimated through chlorophyll-a concentration (Chla), determined by colour spectrophotometry. This phenomenon, considered as one of the major environmental problems across Europe (Bøgestrand et al., 2005), is caused by the input of large quantities of anthropogenic nutrients (mainly nitrate and phosphate) to the aquatic ecosystems (Nixon, 1995). These contributions enhance phytoplankton growth and cause a disturbance of the
balance of organisms in the water as well as a decrease of water quality (i.e., reduction of dissolved oxygen, increase of organic matter and turbidity).
In Europe, since the publication of the Water Framework Directive (2000/60/EC), there is comprehensive water quality assessment coverage of a small fraction of European waters (19.8%, according to Borja, 2005). However, the need of a more integrated and extensive protection of water bodies, as well as a needed increase of the implementation and enforcement of the WFD, led to the creation, in October 2005, of the European Marine Strategy (EMS). This strategy aims to “promote the sustainable use of the seas and conserve marine ecosystems’’ and increases the extension of marine waters that need to be protected to 200 nautical miles (including the water column, the sea bed and its sub-surface geology; Borja, 2006). Therefore, the implementation of this directive, requires an intense and continuous monitoring of water bodies, for which the application and development of new tools and technologies is essential.
Ocean colour remote sensing
Traditional in-situ methods employed for water quality assessment, present time and physical constraints. Only a limited number of sampling points can be performed, making it diffi cult to capture the range and variability of coastal processes and

Ocean colour measurements with a HR4000CG fi eld spectrometer for remote sensing applications
3 | Revista de Investigación Marina, 2009, 16
constituents. In addition, the mixing between fresh and oceanic water creates complex physical, chemical and biological processes that are diffi cult to understand, causing the existing measurement methodologies to have signifi cant logistical, technical, and economic challenges and constraints. At the present time, satellite sensors provide the most effective means for frequent, synoptic, water-quality observations over large areas (Miller et al., 2005). Hence, ocean colour imagery is increasingly used as a tool to complete data sets collected by traditional means and are considered as potential tool for the implementation of the EMS (Gohin et al., 2008; Hellweger, 2004). Optical satellite sensors such as SeaWiFS (Sea-viewing Wide Field-of-view Sensor) and MODIS (Moderate-Resolution Imaging Spectroradiometer) provide global and daily ocean information (http://oceancolor.gsfc.nasa.gov/). Also, satellite-derived [Chla] maps are a key data source to study the distribution pattern of organisms and nutrients (Guillaud et al., 2008), harmful algal blooms monitoring (Miller et al., 2005) and fi shery research (e.g., Zainuddin et al., 2006), among other applications.
The “colour” of the ocean is determined by the interactions of light with the water. When light hits the surface of the water, the different colours can be absorbed, transmitted, scattered, or refl ected in differing intensities. The properties of water that are only dependent on its constituents are called inherent optical properties (IOP, i.e. absorption, scatter, backscatter) (Figure 1 (a)), they are the same regardless of light conditions, whereas the apparent optical properties (refl ectance and attenuation coeffi cient) depend on IOPs and the angle of the sun, whether it is day or night and cloud coverage. Remote sensors resolve the water components based on spectral appearance: i.e. the colour shifts from blue to green, when the amount of dissolved or suspended constituents in the water increases. The water leaving radiance, Lw, results from the interaction of the downward irradiance Ed (radiant fl ux per unit surface area), having penetrated the sea surface, with
the different optically active water constituents (Figure 1 (b)). The retrieval of water components involves estimation of the remote sensing refl ectance (hereinafter referred as Rrs) optical parameter, which is the ratio between the up- and down-welling irradiances. A detailed description on the calculation of Rrs is presented in the following section.
The substances in seawater which most affect the colour refl ected are phytoplankton, inorganic particles, dissolved organic chemicals, and the water itself. Chlorophyll absorbs red and blue light and refl ects green light. Particles can refl ect and absorb light, which reduces the clarity (light transmission) of the water. Dissolved organic matter strongly absorbs blue light, and its presence can interfere with measurements of chlorophyll. Water colour is therefore used as an input to empirically or analytically derive water properties of interest, such as chlorophyll concentration, suspended particulate or organic matter (Morel and Prieur, 1977; Gordon and Morel, 1983; Mobley 1994).
In the past, remote sensing of ocean colour has mostly been centred on the retrieval of chlorophyll-a concentration in Case 1 or “clear” waters. However, in optically-complex waters, such as coastal (from the coast seaward to the continental margin, at a depth of 500 m) or estuarine waters (or Case 2), the standard algorithms used in former waters show inaccuracies (Carder et al., 1991; Gohin et al., 2005). The optical properties in Case 1 waters are controlled by chlorophyll-a and associated detrital pigments. On the other hand, in waters where substances, such as coloured dissolved organic matter (CDOM or yellow substances) and suspended particulate matter (referred here as SPM), are present in addition to phytoplankton, the optical signal becomes more complex. The colour of the water in Case 2 areas is determined by scattering and absorption of visible light by the organic and inorganic water constituents (Tzortziou et al., 2007), which are independent of each other and do not covary with chlorophyll. These parameters are region- and season-specifi c due to the
Figure 1. Ocean colour physics. (a) Apparent optical properties: downwelling irradiance and water-leaving radiance. (b) Inherent optical properties: absorption, backscatter and scatter. Adapted from Doxaran (2002).

S. Novoa, G. Chust, J.M. Froidefond
Revista de Investigación Marina, 2009, 16 | 4
intrinsic variability of these optically-active substances caused by factors such as river input (Carder et al., 1999). Algorithms designed for use at global scales are therefore less accurate in Case 2 waters due to this variability. According to Mobley (1994), the validation of ocean colour remote sensing data requires accurate fi eld determinations of the water-leaving radiance signal Lw (the amount of light that is emitted from the ocean). Hence, in order to interpret satellite imagery in specifi c coastal waters, empirical relationships between the parameters of interest and in-situ optical measurements need to be estimated (Doxaran et al. 2002; Froidefond et al. 2002; Ouillon and Petrenko, 2005; Gitelson et al. 2008, Petus et al. 2008). For that reason, the development of regionally parameterized algorithms is needed to better assess water quality (IOCCG, 2000). Algorithm development for Case 2 waters is more complex than single-variable algorithms for Case 1 waters, since they demand to separate non-linear interactions between at least three independent variables (Phytoplankton, suspended particulate matter and organic matter) and the remotely sensed signals (IOCCG, 2000). For instance, two or more substances may infl uence the optical signal in a similar manner, making it diffi cult to distinguish the different constituents present in the media. Therefore, special attention has to be paid to the choice of wavelengths, and to the number of wavelengths used in an algorithm.
Field spectrometry
Field spectrometers have been widely employed in the validation of satellite ocean colour data products as a way of establishing measurement uncertainties, assessing their scientifi c utility, and most importantly, to develop empirical algorithms for the quantitative and qualitative estimation of water constituents. Such efforts require a considerable amount of high quality in-situ data, processed as consistently as possible. However, obtaining high quality in-situ optical and biogeochemical data for those purposes can be challenging: other than the diffi culty of performing accurate measurement at sea, various other obstacles, such as the corrosiveness of the sea on instruments or the challenge of the measurements at a reasonable cost, can really complicate data acquisition.
Remote sensors, such as SeaWiFS and MODIS, are commonly validated and calibrated with in-situ measurements performed with fi eld spectrometers, i.e. Marine Optical Buoy program, (MOBY) (Bailey et al., 2008). Dall´Olmo et al. (2003 and 2005) and Gitelson et al. (2007 and 2008) used refl ectance spectra obtained with the Ocean optics USB2000 spectrometer, with a similar methodology to the one exposed in this document, to evaluate the extent to which refl ectance ratios could be applied to remote sensors to estimate [Chla] in turbid, Case 2 waters. Froidefond and Ouillon (2005) developed an innovative platform, a mini-catamaran fi tted with a TriOS radiance sensor, to perform refl ectance measurements at sea. Measurements were performed away from the ship to avoid the hull infl uence, and the sensor was placed below and above the water surface. They showed it was preferable to perform upwelling radiance measurements below the surface, except for highly turbid waters.
Objectives
The objective of this study was to develop a platform and establish a measurement protocol for the High-Resolution Fiber Optic Spectrometer, HR4000CG, for a subsequent calculation of Rrs, with the acquired. Several experiments were performed in the laboratory and in the fi eld to determine the optimal parameters and conditions for in-situ refl ectance measurements. This approach will permit the validation of remote sensing data products for the Bay of Biscay (coastal and estuarine areas) in the future.
MATERIAL AND METHODS
Estimation of remote sensing reflectance
Remote sensing refl ectance estimation provides an essential connection between imagery from satellite sensors and in-situ concentrations of water constituents (Gordon and Morel, 1983; O’Reilly et al., 1998). Rrs is a parameter that indicates the effective refl ectance of a body of water when viewed by a remote sensor and is used to derive biophysical parameters such as [Chla]. It is defi ned as the ratio of water-leaving radiance Lw measured above the water surface, to the incident downwelling irradiance Ed just above the water surface. Rrs is expressed as (Mobley, 1999):
The water-leaving radiance Lw cannot be measured directly with an instrument, instead the upwelling radiance Lu (λ) is measured just above (0+) or just beneath (0-) the air-water interface. For measurements above the water surface, the radiance measured when the sensor views the sky Lsky and the refl ected sky radiance when the spectrometer views the sea surface Lu need to be taken into account. These two parameters are related through the refl ectance factor ρ, a complex factor that depends on incident light, viewing directions, wavelength, wind speed and cloud coverage (Mobley, 1999). Thus, the water-leaving radiance above water surface Lw is equal to Lu - Lsky * ρ.
When the sensor is placed below the water surface, the conversion of the upwelling radiance into water-leaving radiance is performed by taking into account the variation of the refraction index of water in relation to the air n (1.33 for freshwater and 1.34 for seawater) and the radiance transmittance t (0.98 for a sensor pointing towards the nadir) at the water-air interface (Mobley, 1999). Therefore, to obtain water-leaving radiance Lw(λ), the upwelling radiance Lu is multiplied by the conversion factor t/n2.
The index of refraction changes when the sensor is placed below the water surface since the spectrometer was calibrated for air measurements. In the water, the semi-opening angle (θwater) is different and it is given by the Descartes´ law:
The solid angle (angle in three-dimensional space) corresponding to a measurement performed with a 4º semi-opening angle in the

Ocean colour measurements with a HR4000CG fi eld spectrometer for remote sensing applications
5 | Revista de Investigación Marina, 2009, 16
air (ΩIFOV = 2π(1-cosθ)), corresponds to 1.53 x 10⁻² steradians, whereas in seawater it is of 0.85 x 10⁻² and in freshwater of 0.66 x 10⁻². This results in an angle decrease by a factor of 1.796 for seawater (Froidefond and Ouillon, 2005) and 1.770 for freshwater. Therefore, this factor multiplied by the t/n2 factor, results in a multiplication factor of 0.98 for the Lu measurements acquired in both media.
The downwelling radiance Ld is measured directly when the sensor views a Lambertian Spectralon plate and is kept pointing in the same direction as for the upwelling radiance. The Ed downwelling irradiance can be then calculated by taking into account the known irradiance refl ectance of the Lambertian surface Rg (Labsphere WS-1 Diffuse Refl ectance Standard = 0.99) as follows (Doxaran et al., 2002):
Instrumentation and platform
Spectroradiometers are designed to measure the spectral power distributions of illuminants in the visible region of the spectrum. They transform the photon energy resulting from the incident solar beam, into electrical signals.
Radiance measurements were performed using an Ocean Optics High-Resolution Fiber Optic Spectrometer HR4000CG (Ocean Optics Inc., 2001-2006; Figure 2 (a)). This device measures radiance (expressed in relative intensity units, i.e., digital counts; Dall´Olmo, 2005) between 200 to 1100 nm in 3648 channels, with a spectral resolution of 0.75 nm (FWHM). The HR4000CG spectrometer is connected to a computer via USB, from which it draws power. Data is stored into a memory chip on the HR4000CG spectrometer and is processed by the Ocean Optics operating software Spectrasuite (www.oceanoptics.com/Products/spectrasuite.asp) (Ocean Optics Inc., Spectrasuite Manual, 1999-2007). The spectrometer is then connected to a Gershun tube, of fi eld-of-view of 8º, by means of a 20 m-long optical fi bre. The calibration of the device was performed in the factory, which provided a calibration certifi cation data sheet.
To measure the upwelling radiance (Lw) of water surface on the fi eld, we developed a stainless steel fl otation device to mount the sensor (Figure 2 (b)), mainly based on the mini-catamaran platform implemented by Froidefond and Ouillon (2005). Its dimensions are of 50 x 50 x 15 cm, and the weight is of 8 kg approximately. The dimensions were chosen in order to minimise its infl uence on the optical measurements. The symmetrical square shape avoids the anisotropic infl uence of its shade on the measurements. This device enables the measurements to be taken far from the ship and therefore away from its shade. With this prototype, the Gershun tube is maintained approximately 1 cm below the water surface (under calm sea conditions) allowing upwelling radiance measurements below the surface and away from any shade-producing objects, except for the fl otation device.
The downwelling irradiance (Ld) was measured on a Labsphere Spectralon® (www.labsphere.com) target, which was placed on a special stand (Figure 2 (c)) designed to measure the irradiance at nadir (90°). The Gershun tube was held pointing directly towards the target (perpendicularly) and the platform was placed facing the sun for the downwelling radiance measurement (Figure 3). The Gershun tube is placed on the platform approximately 6 cm perpendicularly above the Spectralon target. The measurement is performed with the platform facing the sun.
Laboratory experiments:
a) Above and below water surfaceThe estimation of water-leaving radiance and the radiative
transfer theory have been established by Mobley (1999) and later studies (Mobley et al. 1993, 1997; Maffi one et al. 1998; Hoge et al. 2003). The protocol developed by Mobley (1999) for the estimation of Rrs at sea has been widely used and even adopted by NASA for the calibration and validation of products (Mueller et al. 2000). This protocol entails the measurements to be performed above the water surface, with a nadir angle of 40° and an azimuth viewing direction of 135° (with an accuracy of ± 5°), in order to minimize the refl ection at the sea surface, also referred as sun glint. This phenomenon is the specular refl ection of sunlight off the sea surface. Its signal is much greater than the sunlight refl ected
Figure 2. (a) Ocean Optics High-Resolution Fiber Optic Spectrometer HR4000CG. (b) Upwelling radiance measuring platform (Lu). (c) Downwelling radiance measuring platform (Ld).

S. Novoa, G. Chust, J.M. Froidefond
Revista de Investigación Marina, 2009, 16 | 6
from below the water surface, affecting the correct acquisition of spectral information concerning in-water constituents. While sun glint distortion in the upwelling radiance measurements above the surface is diffi cult to correct, this effect can be highly mitigated measuring below the water surface (Froidefond and Ouillon, 2005).
For that reason, an experiment was carried out to estimate the difference between measurements performed above and below the water surface, using the protocol established by Froidefond and Ouillon (2005) for the TriOS radiance/irradiance sensors as a reference. Figure 3 shows the laboratory setup for the experiment. Upwelling radiance was measured by placing the Gershun tube directly 1 cm above and 1 cm below the water surface, pointing towards the nadir. The experiment was performed in a dark room, with a 100 watt light bulb as the only source of light, which pointed the sensor at a 50º angle. At the bottom of the container fi lled with water, a white paper was placed to obtain signifi cant radiance intensity.
b) Measurement parametersIn order to establish a sampling protocol for the Ocean Optics
spectrometer, several acquisition parameters needed to be adjusted: integration time, averaging of the number of acquired scans, dark correction, and spectral signature smoothing. Measurements were performed below the water surface as shown in the diagram of Figure 3.
Integration time is the time the sensor monitors incoming light (photons). It is a similar parameter to the shutter speed of a camera. The integration time needs to be adjusted so that the greatest amount of light that is anticipated for the application chosen causes a signal of about 85% of the spectrometer’s capability (Ocean Optics Inc., Spectrasuite Manual, 1999-2007). The appropriate integration time has to capture enough light intensity without signal saturation that can occur in high-light level applications. Therefore, the light intensity determines the integration time needed to be adjusted in every experiment. Tests performed in the laboratory and on fi eld pre-established an integration time of 0.3 seconds for downwelling radiance measurements (i.e. on Spectralon®) and of 1 second for upwelling radiance measurements (i.e. target, mainly for water
surface). These settings were eventually modifi ed in accordance with the specifi c environmental conditions of each measurement.
The discrete spectral acquisitions were stored individually in order to remove spectral observations that are distant from the rest of the spectra (for instance, affected by accidental shades caused by the movement of the vessel). The deviations of each spectrum from the mean spectra were calculated. The percent deviation of each spectrum with respect to the mean with the following equation:
The spectra with a deviation higher than 10% were removed.
In order to obtain accurate spectral radiance data, the inherent noise in the instrument (i.e., background electronic noise caused by the power supply) needs to be removed. With this purpose, in addition to the conventional subtraction of the dark spectrum (measured under dark conditions; Dall´Olmo and Gitelson, 2005) the electric dark correction was applied to both upwelling and downwelling irradiance measurements. This correction enables a dark-level correction during temperature changes caused by the power supply.
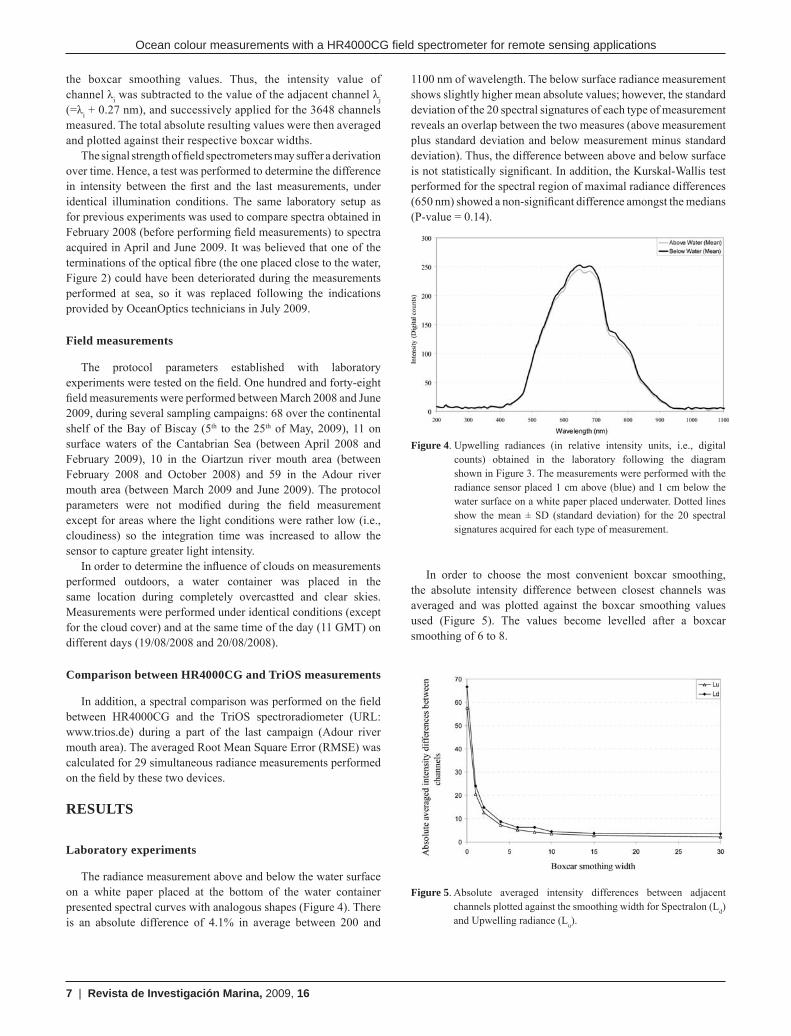
Smoothing is an additional way of reducing noise in the data and reveal the important underlying shape of the spectral signature. The simplest form of smoothing is the “moving average” or “moving box”, which substitutes each data value with the average of adjacent channel values. The boxcar smoothing parameter allows setting the width of this averaging box. The greater the smoothing width, the smoother the data and the higher the signal-to-noise ratio (S:N). If the smoothing width is too high, there will be a loss in spectral resolution (Ocean Optics Inc., Spectrasuite Manual, 1999-2007). The same experimental setup as in previous section was used to determine the suitable boxcar width. Intensity of the downwelling and upwelling radiances was measured with nine different boxcar smoothing values: 0, 1, 2, 4, 6, 8, 10, 15, 30. In order to choose the most convenient boxcar smoothing the average intensity difference between closest channels was calculated and was plotted against
Figure 3. Experimental laboratory setup. (a) Downwelling radiance measurement on the Spectralon target. (b) Upwelling radiance measurement on container fi lled with water.
Ocean colour measurements with a HR4000CG fi eld spectrometer for remote sensing applications
7 | Revista de Investigación Marina, 2009, 16
the boxcar smoothing values. Thus, the intensity value of channel λi was subtracted to the value of the adjacent channel λj (=λi + 0.27 nm), and successively applied for the 3648 channels measured. The total absolute resulting values were then averaged and plotted against their respective boxcar widths.
The signal strength of fi eld spectrometers may suffer a derivation over time. Hence, a test was performed to determine the difference in intensity between the fi rst and the last measurements, under identical illumination conditions. The same laboratory setup as for previous experiments was used to compare spectra obtained in February 2008 (before performing fi eld measurements) to spectra acquired in April and June 2009. It was believed that one of the terminations of the optical fi bre (the one placed close to the water, Figure 2) could have been deteriorated during the measurements performed at sea, so it was replaced following the indications provided by OceanOptics technicians in July 2009.
Field measurements
The protocol parameters established with laboratory experiments were tested on the fi eld. One hundred and forty-eight fi eld measurements were performed between March 2008 and June 2009, during several sampling campaigns: 68 over the continental shelf of the Bay of Biscay (5th to the 25th of May, 2009), 11 on surface waters of the Cantabrian Sea (between April 2008 and February 2009), 10 in the Oiartzun river mouth area (between February 2008 and October 2008) and 59 in the Adour river mouth area (between March 2009 and June 2009). The protocol parameters were not modifi ed during the fi eld measurement except for areas where the light conditions were rather low (i.e., cloudiness) so the integration time was increased to allow the sensor to capture greater light intensity.
In order to determine the infl uence of clouds on measurements performed outdoors, a water container was placed in the same location during completely overcastted and clear skies. Measurements were performed under identical conditions (except for the cloud cover) and at the same time of the day (11 GMT) on different days (19/08/2008 and 20/08/2008).
Comparison between HR4000CG and TriOS measurements
In addition, a spectral comparison was performed on the fi eld between HR4000CG and the TriOS spectroradiometer (URL: www.trios.de) during a part of the last campaign (Adour river mouth area). The averaged Root Mean Square Error (RMSE) was calculated for 29 simultaneous radiance measurements performed on the fi eld by these two devices.
RESULTS
Laboratory experiments
The radiance measurement above and below the water surface on a white paper placed at the bottom of the water container presented spectral curves with analogous shapes (Figure 4). There is an absolute difference of 4.1% in average between 200 and
1100 nm of wavelength. The below surface radiance measurement shows slightly higher mean absolute values; however, the standard deviation of the 20 spectral signatures of each type of measurement reveals an overlap between the two measures (above measurement plus standard deviation and below measurement minus standard deviation). Thus, the difference between above and below surface is not statistically signifi cant. In addition, the Kurskal-Wallis test performed for the spectral region of maximal radiance differences (650 nm) showed a non-signifi cant difference amongst the medians (P-value = 0.14).
Figure 4. Upwelling radiances (in relative intensity units, i.e., digital counts) obtained in the laboratory following the diagram shown in Figure 3. The measurements were performed with the radiance sensor placed 1 cm above (blue) and 1 cm below the water surface on a white paper placed underwater. Dotted lines show the mean ± SD (standard deviation) for the 20 spectral signatures acquired for each type of measurement.
In order to choose the most convenient boxcar smoothing, the absolute intensity difference between closest channels was averaged and was plotted against the boxcar smoothing values used (Figure 5). The values become levelled after a boxcar smoothing of 6 to 8.
Figure 5. Absolute averaged intensity differences between adjacent channels plotted against the smoothing width for Spectralon (Ld) and Upwelling radiance (Lu).

S. Novoa, G. Chust, J.M. Froidefond
Revista de Investigación Marina, 2009, 16 | 8
The change of the optical fi bre termination showed an improvement on the spectra acquisition signal under identical illumination conditions, higher digital counts were recorded (Figure 6). However, not complete recovery of the initial conditions could be reached.
Figure 6. Upwelling radiance measurements, in digital counts, obtained in the laboratory in February 2008, before any fi eld measurements were performed, and in April and June 2009, after the sampling campaigns. The radiance obtained, after the optical fi bre termination was changed in July 2009, is also represented.
Field measurements
The stainless steel fl otation developed for the measurement of upwelling radiance, performed well under relatively rough sea conditions (2 to 3 meter waves, 10-15 knot winds). It showed good fl oatability, it was fairly stable, and also permitted the measurement of the radiance in a rapid and consistent manner (Figure 2, (a)). The downwelling radiance measuring stand worked also well under the same sea conditions, allowing for the acquisition of spectra in a rather fast and consistent way (Figure 2, (c)).
Figure 7. Averaged RMSE comparing the 29 fi eld measurements performed with the TRIOS and the HR4000CG spectrometers.
The averaged RMSE curve (Figure 7) for the comparison between the HR4000CG spectrometer and the TriOS, illustrates
the increase in error at lower (< 450 nm; RMSE > 0.003) and higher (>750 nm; RMSE > 0.003) wavelengths.
Figure 8. Difference in upwelling radiance intensity (digital counts) between measurements performed under clear and covered skies conditions. The measurements were performed in the same location, at the same time of the day (11 GMT), on different days (19th and 20th of August 2008). The only difference was the cloud coverage. An averaging box of 5 nm was applied for display purposes.
Figure 8 shows that under clear skies conditions, the refl ectance is higher, although the shape of the curve does not appear affected. There is also an increase in noise at lower (< 450 nm) and higher (>750 nm) wavelengths. Hence, ideally, measurements should be performed under clear skies conditions.
Spectra measured on the fi eld were nosier than the ones acquired under laboratory conditions. The spectral range considered, was limited to 450-750 nm, due to the high noise recorded at wavelengths below and above this range (Figure 9).
Figure 9. Subset of samples showing Rrs for three different water types: 1) continental or oceanic waters; 2) plume infl uenced waters and 3) estuarine waters. Rrs measurements were performed on the fi eld with a boxcar width of 8 (averaged 8 adjacent channels) plus an averaging of 10 adjacent channels was performed for display purposes.
Figure 9 shows the Rrs spectra of a subset of sampling stations, obtained at the sea water surface. Three different types of spectra,

Ocean colour measurements with a HR4000CG fi eld spectrometer for remote sensing applications
9 | Revista de Investigación Marina, 2009, 16
corresponding to different water masses, could be distinguished: (1) oceanic waters (2) plume infl uenced waters; and (3) estuarine waters. The oceanic water spectrum shows a peak emerging in the blue area around 450 nm, which decreases with higher wavelengths. With the increasing infl uence of river freshwater, a depression can be observed in the blue area of the spectrum around 450 nm, as well as a peak emerging between 500 and 600 nm. With increasing suspended matter input from the river, the highest spectral peak shifted towards higher wavelengths. Also, a peak of lower magnitude appears around 670 and 700 nm (0.001-0.002 sr-1).
Figure 10. Table relating chlorophyll-a and turbidity with respect to water colour (the pictures were taken under direct sun light, without clouds nor fog and avoiding sun refl ection). Empty cells (na) are due to the absence of water bodies with coincident high values for both chlorophyll-a and turbidity.
Figure 10 illustrates the colour of the different types of waters, taken with conventional digital photography, an innovative method developed for water quality monitoring (Goddijn-Murphy et al., 2009). The fi gure shows: i) River freshwater with high turbidity (64 NTU), show a brownish colour. An example of these loaded waters is the Adour river mouth plume appreciated on Figure 11. There is a clear difference in colour between river freshwater with high suspended matter load and low chlorophyll-a concentration (64 NTU; na µg.l-1), and coastal water, with low suspended matter and chlorophyll-a content (0.01 NTU; 0.90 µg.l-1). None or really low Chla is measured in highly turbid waters, mainly because the presence of suspended sediments does not allow enough sunlight penetration in the water column, for the phytoplankton to photosynthesize. ii) Transitional or plume infl uenced water present a greener colour (1.28 NTU; 9.51 µg.l-1; 0.97 NTU 5.03 µg.l-1; and 3.84 NTU; 3.76 µg.l-1) and coastal water, with low sediment and chlorophyll-a content (0.01 NTU; 0.90 µg.l-1). iii) Water bodies with low chlorophyll and SPM (0.01 NTU; 0.90 µg.l-1) concentrations appear blue.
Figure 11. Turbid plume caused by the Adour river freshwater (Light colour), close to the river mouth, occurred on the 6th of June, 2007 at 3:00 pm.
DISCUSSIONThe main advantages of the upwelling-radiance measuring
platform (a stainless steel fl otation device) developed include: its relative lightness (it can be easily released overboard), its stability (the sensor is maintained at a fairly constant distance just below the water surface, approx. 1 cm), and the fact that measurements can be performed at nadir (perpendicular to the water surface). The advantages of the downwelling radiance measuring platform are also that it allows performing the measurements at a fi xed distance from the Spectralon® target and at nadir. Thanks to these two platforms, the in-situ spectral sampling can be carried out fast and in a consistent manner, since the sensor is easily adjusted to the correct position and its stability is guaranteed by the design.
The good consistency of the Rrs derived from the radiance measurements (at sea surface under different meteorological conditions) and the similarity to the refl ectance spectral signatures obtained with semi-analytically modelled refl ectance spectra (Morel and Maritorena, 2001), show that the experimental protocol provides coherent results. That is, there is a correspondence between peaks and depressions in the spectral signatures of surface water containing different concentration of water constituents. The adoption of the below surface measurement method was therefore appropriate and in accordance with Froidefond and Ouillon´s conclusions (2005). Even if the measurements performed just below and above the water surface are not identical, they are not statistically different. As Froidefond and Ouillon (2005) explained, the slight difference in raw signal is due to measurements being performed in different media (air and water) and the device being factory calibrated for air measurements. Hence, the conversion factor for below water measurements used when calculating Rrs (0.98), takes into account the loss of signal at the passage through the air-water interface and levels off the differences.

S. Novoa, G. Chust, J.M. Froidefond
Revista de Investigación Marina, 2009, 16 | 10
With the aim of reducing the signal noise, a boxcar smoothing of 8 nearest channels was selected for measurements performed on the fi eld. This value was considered, from the experiments performed, as a good compromise between the loss of data information and the reduction of noise. However, some data still returned a relatively high amount of background noise in some parts of the spectral signatures so posterior spectral smoothing was performed by passing a 5 nm running mean fi lter over the entire spectrum (Dall’Olmo et al., 2005). An increase of the boxcar smoothing value was considered while performing measurements at sea; however, it was preferred to acquire the data as raw as possible for its posterior treatment using different approaches (i.e., test different levels of smoothing to fi nd the optimal one). The scans were also kept raw by not averaging them on acquisition to facilitate posterior treatment of the data. Hence, scans that presented a higher deviation than 10% from the mean (of 40 scans) were discarded. If the scans would have been averaged when measured, it would have not been possible to fi lter the data set and fi nd invalid scans.
CONCLUSIONSThe protocol established for the HR4000CG spectrometer
to acquire refl ectance measurements at sea surface included: 1) the performance of measurements below the water surface; 2) the application of electric dark correction for noise reduction; 3) smoothing of spectral data during the acquisition with boxcar widths of 8 channels; 4) the use of integration times of 0.3 seconds for downwelling radiance and 1 second for upwelling radiance measurements; 5) averaging of scans and fi ltering of spectral curves posterior to optical data acquisition; 6) limitation of the representative spectral range for sea surface measurements between 450 and 750 nm.
Spectral signatures acquired are consistent with reported algal culture refl ectance spectra (Gitelson et al., 1999) and refl ectance spectra acquired at sea (Morel, 2006). That is, a depression in the blue part of the spectra and a red peak near 675 nm with increasing [Chla] are noticeable. The signatures are also in agreement with refl ectance spectra acquired over waters with high suspended matter content. There is a shift of the highest spectral peak (around 570 nm) towards higher wavelengths, with increasing infl uence of sediment loaded river water.
ACKNOWLEDGEMENTSThis research was supported by the Ministry of Education
and Science (Spanish Government, Ref.: ESP2006-10411) and the Funds for Aquitania–Euskadi cooperation (Basque Government). S. Novoa benefi ts from a PhD scholarship granted by the Fundación de Centros Tecnológicos Iñaki Goenaga. The authors wish to acknowledge: the contribution of Dr. J. Franco for his valuable technical support, on chlorophyll estimation; to M. Santos, coordinator of 2008 BIOMAN campaign; and to Dr. A. Borja and the Professor Michael Collins (School of Ocean and
Earth Science, University of Southampton and AZTI-Tecnalia) for their useful comments. This is the contribution 478 from the AZTI-Tecnalia Marine Research Division.
REFERENCESBøgestrand, J., P. Kristensen, B. Krovang, 2005. Source apportionment
of nitrogen and phosphorus inputs into the aquatic environment. European Environmental Agency (EEA) 7: 1-48.
Borja, A., 2005. The European Water Framework Directive: a challenge for nearshore, coastal and continental shelf research. Continental Shelf Research, 25 (14): 1768–1783.
Borja, A., 2006. The new European Marine Strategy Directive: Diffi culties, opportunities, and challenges. Marine Pollution Bulletin, 52: 239–24
Carder, K.L., K.A. Hawes, R.C. Baker, R.G. Smith, R.J. Steward, B.G. Mitchell, 1991. Refl ectance model for quantifying chlorophyll-a in the presence of productivity degradation products, Journal of Geophysical Research, 96: 20599–20611.
Carder, K. L., F.R. Chen, Z.P. Lee, S.K. Hawes, 1999. Semi-analytic Moderate-Resolution Imaging Spectrometer algorithms for chlorophyll-aand absorption with bio-optical domains based on nitrate-depletion temperatures. Journal of Geophysical Research, 104: 5403-5421.
Clark, D.K, H.R. Gordon, K.J. Voss, Y. Ge, W. Broenkow, C.C. Trees, 1997. Validation of atmospheric corrections over oceans. Journal of Geophysical Research, 102: 17209-17217.
Dall’Olmo, G., A.A Gitelson, 2005. Effect of bio-optical parameter variability on the remote estimation of chlorophyll-a concentration in turbid productive waters: experimental results. Applied optics, 44: 412-422.
Dall’Olmo, G., A.A Gitelson, D.C. Runquist, 2003. Towards a unifi ed approach for remote estimation of chlorophyll-a in both terrestrial vegetation and turbid productive waters. Geophysical Research Letters, 30:1938-1941.
Dall’Olmo, G., A.A Gitelson, D.C. Runquist, B. Leavitta, T. Barrow, J.C. Holz, 2005. Assessing the potential of SeaWiFS and MODIS for estimating chlorophyll concentration in turbid productive waters using red and near-infrared bands. Remote Sensing of Environment, 96: 176-187.
Darecki, M., D. Stramski, 2003. An evaluation of MODIS and SeaWiFS bio-optical algorithms in the Baltic Sea. Remote Sensing of Environment, 89: 326-350.
Doxaran, D., ‘Télédetection et modelisation numérique des fl ux sedimentaires dans l’estuaire de la Gironde’ , 2002. PhD Thesis. University of Bordeaux 1, France.
Doxaran, D., J.M. Froidefond, S. Lavender, P. Castaing, 2002. Spectral signature of highly turbid waters: Application with SPOT data to quantify suspended particulate matter concentrations. Remote Sensing of Environment, 81: 149–161.
Froidefond, J.M, S. Ouillon, 2005. Introducing a mini-catamaran to perform refl ectance measurements above and below the water surface. Optics Express, 13: 926-936.
Froidefond, J.M., S. Lavender , P. Laborde, A. Herbland, V. Lafon, 2002. SeaWiFS data interpretation in a coastal area in the Bay of Biscay. International Journal of Remote Sensing, 23: 881-904.
Gitelson, A. A., J.F. Schalles, D.C. Runquist, F.R. Schiebe, Y.Z. Yacobi, 1999. Comparative refl ectance properties of algal cultures with manipulated densities. Journal of Applied Phycology, 11: 345–354.
Gitelson, A. A., J.F. Schalles, C.M Hladik, 2007. Remote chlorophyll-a retrieval in turbid, productive estuaries: Chesapeake Bay case study. Remote Sensing of Environment, 109: 464–472.
Gitelson, A. A., G. Dall´Olmo, W. Moses, W., D.C. Runquist, T. Barrow, T.R. Fisher, D. Gurlin, J. Holz,, 2008. A simple semi-analytical model for remote estimation of chlorophyll-a in turbid waters: Validation. Remote Sensing of Environment, 112: 3582-3593.

Ocean colour measurements with a HR4000CG fi eld spectrometer for remote sensing applications
11 | Revista de Investigación Marina, 2009, 16
Goddijn-Murphy, L.; D. Dailloux, M. White, D. Bowers, 2009. Fundamentals of in Situ Digital Camera Methodology for Water Quality Monitoring of Coast and Ocean. Sensors, 9: 5825-5843.
Gohin, F., S. Loyer, M. Lunven, C. Labry, J.M. Froidefond, D. Delmas, M. Huret, A. Herbland, 2005. Satellite-derived parameters for biological modelling in coastal waters: Illustration over the eastern continental shelf of the Bay of Biscay. Remote Sensing of Environment, 95: 29–46.
Gohin, F., B. Saulquin, H. Oger-Jeanneret, L. Lozac´h , L. Lampert, A. Lefebvre, P. Riou, F. Bruchon, 2008. Towards a better assessment of the ecological status of coastal waters using satellite-derived chlorophyll-a concentrations. Remote Sensing of Environment, 112: 3329–3340.
Gordon, H.R., A.Y. Morel, 1983. Remote Assessment of Ocean Colour for Interpretation of Satellite Visible Imagery: A Review. (New York: Springer-Verlag).
Guillaud, J.F., A. Aminot, D. Delmas, F. Gohin, M. Lunven, C. Labry, A. Herbland. 2008. Seasonal variation of riverine nutrient inputs in the northern Bay of Biscay (France), and patterns of marine phytoplankton response. Journal of Marine Systems, 72: 309-319.
Hellweger, F.L., P. Schlosser, U. Lall, J.K. Weissel, 2004. Use of satellite imagery for water quality studies in New York Harbor. Estuarine, Coastal and Shelf Science, 61: 437–448.
Hoge, F., E.P. Lyon, L.K. Sundman, 2003. Radiative transfer equation inversion: Theory and shape factor models for retrieval of oceanic inherent optical properties. Journal of Geophysical Research-Oceans, 108, Chapter 12.
IOCCG, 2000. Remote Sensing of Ocean Colour in Coastal, and Other Optically-Complex, Waters. Reports of the International Ocean-Colour Coordinating Group, 3, IOCCG. Sathyendrath, S.(ed.), pp. 144.
IOCCG, 2006. Remote Sensing of Inherent Optical Properties: Fundamentals, Tests of Algorithms and Applications. Reports of the International Ocean-Colour Cordinating Group, 5. Lee, Z. 2006 (ed.)
Maffi one, R. A., J. M Voss, C.D. Mobley, 1998. Theory and measurements of the complete beam spread function of sea ice. Limnology and Oceanography, 43: 34-43.
Miller, R.L., C.E. Del Castillo, B.A. McKee, 2005 (Eds). Remote Sensing of Coastal Aquatic Environments: Technologies, Techniques and Applications, pp. 347 (New York: Spinger).
Mobley, C. D., 1994. Light and Water: Radiative Transfer in Natural Waters, pp. 592 (San Diego, CA: Academic press)
Mobley, C. D., 1999, Estimation of the remote-sensing refl ectance from above-surface measurements. Applied Optics, 38: 7442–7455.
Mobley, C. D., R.A. Maffi one, 1997. Effects of absorption and boundary conditions on the utility of diffusion theory. Ocean Optics, 2963: 16-20.
Mobley, C. D, B. Gentilli, H.R. Gordon, Z. H. Jin., G.W. Kattawar , A. Morel, P. Reinersman, K. Stamnes, R.H. Stavm, 1993. Comparison of Numerical-Models for Computing Underwater Light Fields. Applied Optics, 32: 7484-7504.
Morel, A., 2006. Meeting the Challenge of Monitoring Chlorophyll in the Ocean from Outer Space. Chlorophylls and Bacteriochlorophylls: Biochemistry, Biophysics, Functions and Applications, Grimm, B., Porra, R.J., Rüdiger, W., Scheer, H. (Eds.), pp. 521–534. (The Netherlands: Springer)
Morel, A., and Y.H. Ahn, 1990. Optical effi ciency factors of free-living marine bacteria: Infl uence of bacterioplankton upon the optical properties and particulate organic carbon in oceanic waters, Journal of Marine Research, 48: 145-175.
Morel, A., and Y.-H. Ahn, 1991. Optics of heterotrophic nanofl agellates and ciliates: A tentative assessment of their scattering role in oceanic waters compared to those of bacterial and algal cells, Journal of Marine Research, 49: 177-202.
Morel, A., S. Maritorena, 2001. Bio-optical properties of oceanic waters: A reappraisal. Journal of Geophysical Research, 106: 7163–7180.
Morel, A., L. Prieur, 1977. Analysis of variations in ocean colour. Limnology and Oceanography, 22: 709-722.
Mueller, J.L., C. Davis, R. Amone, R. Frouin, K. Carder, Z.P. Lee, R.G. Steward, S. Hooker, C.D. Mobley, S. McLean. “Above-water radiance and remote sensing refl ectance measurement and analysis protocols,” Ocean Optics for satellite ocean color sensor validation, rev. 2, G.S. Fargion and J.L. Mueller, eds. (NASA, Greenbelt, MD, 2000), pp 98-107.
Nixon, S.W., 1995. Coastal marine eutrophication: A defi nition, social causes, and future concerns, Ophelia, 41: 199–219.
Ocean Optics Inc., 2001-2006. High-Resolution Fiber Optic Spectrometers HR4000 / HR4000CG-UV-NIR. Installation and Operation Manual: 1-40. (Document Number 210-00000-000-02-1006).
Ocean Optics Inc., 1999-2007. Spectrasuite manual. Spectrometer Operating Software Installation and Operation Manual: 1-154. (Document Number 000-20000-300-02-0307).
O’Reilly, J.E., S. Maritorena, B.G. Mitchell, D.A. Siegel, K.L. Carder, S.A. Garver, M. Kahru, M. McClain, 1998. Ocean colour chlorophyll algorithms for SeaWiFS. Journal of Geophysical Research, 103: 24937–24953.
Ouillon, S., A. Petrenko, 2005. Above-water measurements of refl ectance and chlorophyll-a algorithms in the Gulf of Lions, NW Mediterranean Sea. Optics Express, 13: 2531-2548.
Petus, C., Chust, G., Sagarminaga, Y., Froidefond, J.M., 2008. Estimating turbidity indicators and total suspended matter in the Bay of Biscay using MODIS 250-m imagery. Revista de Investigación Marina, 3: 180-181.
Revilla, M., J. Franco, J. Bald, Á. Borja, A. Laza, S. Seoane, V. Valencia, 2009. Assessment of the phytoplankton ecological status in the Basque coast (northern Spain) according to the European Water Framework Directive. Journal of Sea Research, 61: 60-67.
Tzortziou, M., A. Subramaniam, J.R. Herman, C.L. Gallegos, P.J. Neale, L.W. Jr. Harding, 2007. Remote sensing refl ectance and inherent optical properties in the mid Chesapeake Bay. Estuarine, Coastal and Shelf Science, 72: 16-32.
Zainuddin, M., H. Kiyofuji, K. Saitoh, S. Saitoh, 2006. Using multi-sensor satellite remote sensing and catch data to detect ocean hot spots for albacore (Thunnus alalunga) in the northwestern North Pacifi c. Deep Sea Research Part II: Topical Studies in Oceanography, 53: 419-431.

Herrera Kaia, Portualdea z/g 20110 Pasaia (Gipuzkoa) Tel.: +34 943 00 48 00 Fax: +34 94 657 25 55
Txatxarramendi ugartea z/g 48395 Sukarrieta (Bizkaia) Tel.: +34 94 602 94 00Fax: +34 94 657 25 55
ww
w.a
zti.e
s
Parque Tecnológico de BizkaiaAstondo bidea. Edificio 609. 48160 Derio (Bizkaia)Tel.: +34 94 657 40 00Fax: +34 94 657 25 55