t-rec-g.957-200603 - caracteristicas interfaces Ópticas sdh.pdf
TRANSCRIPT

I n t e r n a t i o n a l T e l e c o m m u n i c a t i o n U n i o n
ITU-T G.957TELECOMMUNICATION STANDARDIZATION SECTOR OF ITU
(03/2006)
SERIES G: TRANSMISSION SYSTEMS AND MEDIA, DIGITAL SYSTEMS AND NETWORKS Digital sections and digital line system – Digital line systems
Optical interfaces for equipments and systems relating to the synchronous digital hierarchy
ITU-T Recommendation G.957
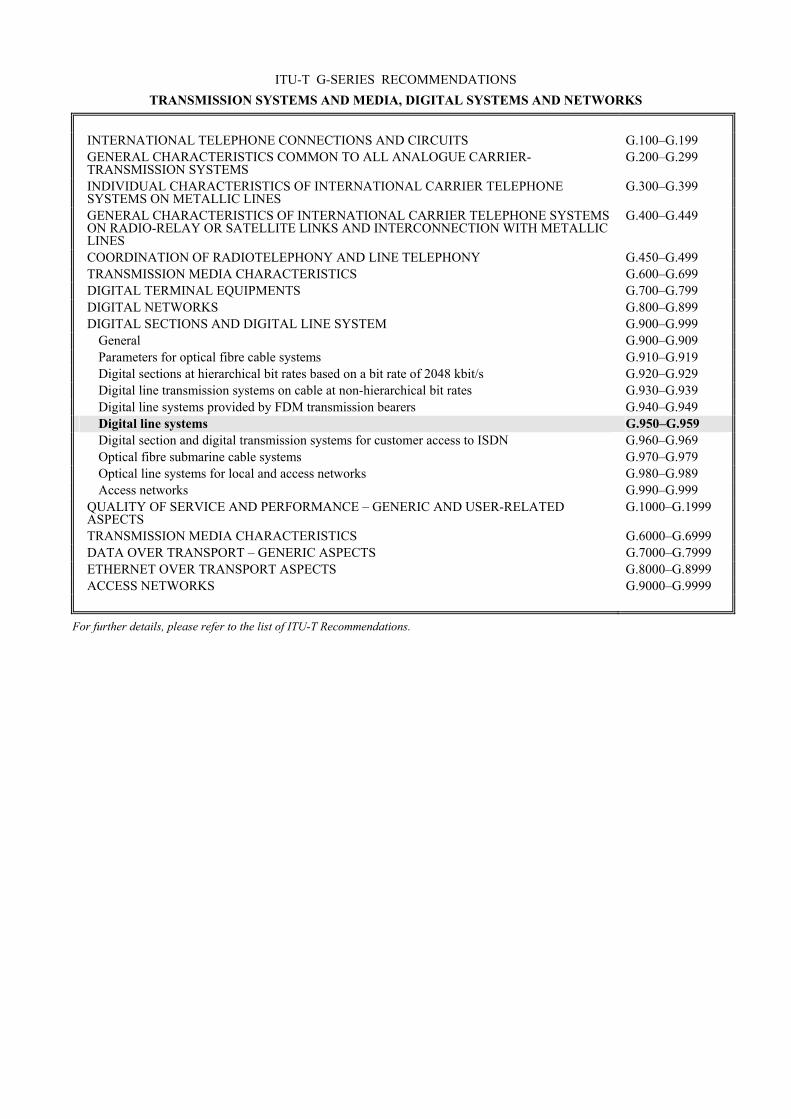
ITU-T G-SERIES RECOMMENDATIONS TRANSMISSION SYSTEMS AND MEDIA, DIGITAL SYSTEMS AND NETWORKS
INTERNATIONAL TELEPHONE CONNECTIONS AND CIRCUITS G.100–G.199 GENERAL CHARACTERISTICS COMMON TO ALL ANALOGUE CARRIER-TRANSMISSION SYSTEMS
G.200–G.299
INDIVIDUAL CHARACTERISTICS OF INTERNATIONAL CARRIER TELEPHONE SYSTEMS ON METALLIC LINES
G.300–G.399
GENERAL CHARACTERISTICS OF INTERNATIONAL CARRIER TELEPHONE SYSTEMS ON RADIO-RELAY OR SATELLITE LINKS AND INTERCONNECTION WITH METALLIC LINES
G.400–G.449
COORDINATION OF RADIOTELEPHONY AND LINE TELEPHONY G.450–G.499 TRANSMISSION MEDIA CHARACTERISTICS G.600–G.699 DIGITAL TERMINAL EQUIPMENTS G.700–G.799 DIGITAL NETWORKS G.800–G.899 DIGITAL SECTIONS AND DIGITAL LINE SYSTEM G.900–G.999
General G.900–G.909 Parameters for optical fibre cable systems G.910–G.919 Digital sections at hierarchical bit rates based on a bit rate of 2048 kbit/s G.920–G.929 Digital line transmission systems on cable at non-hierarchical bit rates G.930–G.939 Digital line systems provided by FDM transmission bearers G.940–G.949 Digital line systems G.950–G.959 Digital section and digital transmission systems for customer access to ISDN G.960–G.969 Optical fibre submarine cable systems G.970–G.979 Optical line systems for local and access networks G.980–G.989 Access networks G.990–G.999
QUALITY OF SERVICE AND PERFORMANCE – GENERIC AND USER-RELATED ASPECTS
G.1000–G.1999
TRANSMISSION MEDIA CHARACTERISTICS G.6000–G.6999 DATA OVER TRANSPORT – GENERIC ASPECTS G.7000–G.7999 ETHERNET OVER TRANSPORT ASPECTS G.8000–G.8999 ACCESS NETWORKS G.9000–G.9999
For further details, please refer to the list of ITU-T Recommendations.

ITU-T Rec. G.957 (03/2006) i
ITU-T Recommendation G.957
Optical interfaces for equipments and systems relating to the synchronous digital hierarchy
Summary This Recommendation specifies optical interface parameters for equipments and systems based on the Synchronous Digital Hierarchy to enable transverse compatibility.
Source ITU-T Recommendation G.957 was approved on 29 March 2006 by ITU-T Study Group 15 (2005-2008) under the ITU-T Recommendation A.8 procedure.

ii ITU-T Rec. G.957 (03/2006)
FOREWORD
The International Telecommunication Union (ITU) is the United Nations specialized agency in the field of telecommunications. The ITU Telecommunication Standardization Sector (ITU-T) is a permanent organ of ITU. ITU-T is responsible for studying technical, operating and tariff questions and issuing Recommendations on them with a view to standardizing telecommunications on a worldwide basis.
The World Telecommunication Standardization Assembly (WTSA), which meets every four years, establishes the topics for study by the ITU-T study groups which, in turn, produce Recommendations on these topics.
The approval of ITU-T Recommendations is covered by the procedure laid down in WTSA Resolution 1.
In some areas of information technology which fall within ITU-T's purview, the necessary standards are prepared on a collaborative basis with ISO and IEC.
NOTE
In this Recommendation, the expression "Administration" is used for conciseness to indicate both a telecommunication administration and a recognized operating agency.
Compliance with this Recommendation is voluntary. However, the Recommendation may contain certain mandatory provisions (to ensure e.g. interoperability or applicability) and compliance with the Recommendation is achieved when all of these mandatory provisions are met. The words "shall" or some other obligatory language such as "must" and the negative equivalents are used to express requirements. The use of such words does not suggest that compliance with the Recommendation is required of any party.
INTELLECTUAL PROPERTY RIGHTS
ITU draws attention to the possibility that the practice or implementation of this Recommendation may involve the use of a claimed Intellectual Property Right. ITU takes no position concerning the evidence, validity or applicability of claimed Intellectual Property Rights, whether asserted by ITU members or others outside of the Recommendation development process.
As of the date of approval of this Recommendation, ITU had received notice of intellectual property, protected by patents, which may be required to implement this Recommendation. However, implementors are cautioned that this may not represent the latest information and are therefore strongly urged to consult the TSB patent database.
ITU 2006
All rights reserved. No part of this publication may be reproduced, by any means whatsoever, without the prior written permission of ITU.

ITU-T Rec. G.957 (03/2006) iii
CONTENTS
Page 1 Scope ............................................................................................................................ 1
2 References..................................................................................................................... 1
3 Terms and definitions ................................................................................................... 2 3.1 Definitions ...................................................................................................... 2 3.2 Terms defined in other Recommendations..................................................... 2
4 Abbreviations................................................................................................................ 2
5 Classification of optical interfaces................................................................................ 3
6 Parameter definitions .................................................................................................... 8 6.1 System operating wavelength range............................................................... 8 6.2 Transmitter ..................................................................................................... 9 6.3 Optical path .................................................................................................... 11 6.4 Receiver.......................................................................................................... 13
7 Optical parameter values for SDH applications ........................................................... 13
8 Optical engineering approach ....................................................................................... 14 8.1 Design assumptions ........................................................................................ 14 8.2 Worst-case design approach ........................................................................... 14 8.3 Statistical design approach ............................................................................. 15 8.4 Upgradeability considerations ........................................................................ 16 8.5 Joint engineering ............................................................................................ 16
Annex A – System operating wavelength considerations........................................................ 17 A.1 Operating wavelength ranges determined by fibre attenuation...................... 17 A.2 Operating wavelength ranges determined by fibre dispersion ....................... 18
Annex B – Measurement of the mask of the eye diagram of the optical transmit signal ........ 20 B.1 Measurement set-up........................................................................................ 20 B.2 Transfer function of the optical reference receiver ........................................ 20
Appendix I – Methods for measuring reflections .................................................................... 22 I.1 Optical continuous-wave reflectometer.......................................................... 22 I.2 Optical time-domain reflectometer................................................................. 22
Appendix II – Implementation of the Consecutive Identical Digit (CID) immunity measurement ................................................................................................................. 24 II.1 Introduction .................................................................................................... 24 II.2 Method............................................................................................................ 25
Appendix III – Possible method for evaluating aging margin contribution in receiver sensitivity specifications............................................................................................... 26 III.1 Receiver sensitivity and eye opening ............................................................. 26 III.2 S/X test method ............................................................................................... 27

iv ITU-T Rec. G.957 (03/2006)
Page Appendix IV – Upgradeability examples................................................................................. 29
IV.1 Example 1....................................................................................................... 29 IV.2 Example 2....................................................................................................... 29

ITU-T Rec. G.957 (03/2006) 1
ITU-T Recommendation G.957
Optical interfaces for equipments and systems relating to the synchronous digital hierarchy
1 Scope This Recommendation covers optical interface parameter specifications for equipments and systems supporting the Synchronous Digital Hierarchy (SDH) defined in ITU-T Rec. G.707/Y.1322 and operating on single-mode optical fibres conforming to ITU-T Recs G.652, G.653 and G.654.
The purpose of this Recommendation is to provide specifications for the optical interfaces of SDH equipment, described in ITU-T Rec. G.783, to achieve the possibility of transverse (multivendor) compatibility on elementary cable sections, i.e., the possibility of mixing various manufacturers' equipments within a single optical section. However, the specifications in this Recommendation are also intended to be in accordance with ITU-T Rec. G.955 which provides the possibility to achieve longitudinal compatibility for equipment of comparable hierarchical level and application.
This Recommendation is based on the use of one fibre per direction. Any other optical arrangements may require different specifications and are for further study.
2 References The following ITU-T Recommendations and other references contain provisions which, through reference in this text, constitute provisions of this Recommendation. At the time of publication, the editions indicated were valid. All Recommendations and other references are subject to revision; users of this Recommendation are therefore encouraged to investigate the possibility of applying the most recent edition of the Recommendations and other references listed below. A list of the currently valid ITU-T Recommendations is regularly published. The reference to a document within this Recommendation does not give it, as a stand-alone document, the status of a Recommendation.
– ITU-T Recommendation G.652 (2005), Characteristics of a single-mode optical fibre and cable.
– ITU-T Recommendation G.653 (2003), Characteristics of a dispersion-shifted single-mode optical fibre and cable.
– ITU-T Recommendation G.654 (2004), Characteristics of a cut-off shifted single-mode optical fibre and cable.
– ITU-T Recommendation G.655 (2006), Characteristics of a non-zero dispersion-shifted single-mode optical fibre and cable.
– ITU-T Recommendation G.707/Y.1322 (2003), Network node interface for the synchronous digital hierarchy.
– ITU-T Recommendation G.783 (2006), Characteristics of synchronous digital hierarchy (SDH) equipment functional blocks.
– ITU-T Recommendation G.826 (2002), End-to-end error performance parameters and objectives for international, constant bit-rate digital paths and connections.
– ITU-T Recommendation G.955 (1996), Digital line systems based on the 1544 kbit/s and the 2048 kbit/s hierarchy on optical fibre cables.
– ITU-T Recommendation I.432.2 (1999), B-ISDN user-network interface – Physical layer specification: 155 520 kbit/s and 622 080 kbit/s operation.

2 ITU-T Rec. G.957 (03/2006)
– IEC 60825-1 (2001), Safety of laser products – Part 1: Equipment classification, requirements and user's guide.
– IEC 60825-2 (2005), Safety of laser products – Part 2: Safety of optical fibre communication systems (OFCS).
3 Terms and definitions
3.1 Definitions This Recommendation defines the following terms:
3.1.1 transverse compatibility: The capability to mix various manufacturers' equipments within a single optical section.
3.1.2 joint engineering: The process by which Administrations/operators agree on a set of interface characteristics of an optical link that meet agreed performance characteristics of the link when the available interface specifications in ITU-T Recommendations are insufficient to ensure the performance level.
3.2 Terms defined in other Recommendations This Recommendation uses the following terms defined in other ITU-T Recommendations as indicated: – S/R reference points: see ITU-T Rec. G.955. – Synchronous Digital Hierarchy (SDH): see ITU-T Rec. G.707/Y.1322. – Synchronous Transport Module (STM): see ITU-T Rec. G.707/Y.1322. – Longitudinal compatibility: see ITU-T Rec. G.955.
4 Abbreviations This Recommendation uses the following abbreviations:
BER Bit Error Ratio
EX Extinction ratio
LED Light-Emitting Diode
MLM Multi-Longitudinal Mode
NA Not Applicable
NRZ Non-Return to Zero
ORL Optical Return Loss
RMS Root-Mean-Square
SDH Synchronous Digital Hierarchy
SLM Single-Longitudinal Mode
STM Synchronous Transport Module
UI Unit Interval
WDM Wavelength-Division Multiplexing

ITU-T Rec. G.957 (03/2006) 3
5 Classification of optical interfaces It is expected that optical fibres will be used in SDH-based systems for both inter-office transport between stations and in intra-office applications for connecting equipment within a single station. By appropriate combinations of transmitters and receivers, power budgets for optical fibre line systems can be achieved which are optimized in terms of attenuation/dispersion and cost with respect to the various applications. However, to simplify the development of transverse compatible systems, it is desirable to limit the number of application categories and corresponding sets of optical interface specifications for standardization.
As shown in Table 1, this Recommendation recognizes three broad application categories: – intra-office corresponding to interconnect distances less than approximately 2 km; – short-haul inter-office corresponding to interconnect distances of approximately 15 km; – long-haul inter-office corresponding to interconnect distances of approximately 40 km in the
1310 nm window and approximately 80 km in the 1550 nm window.
Table 1/G.957 – Classification of optical interfaces based on application and showing application codes
Inter-office Application Intra-
office Short-haul Long-haul
Source nominal wavelength (nm)
1310 1310 1550 1310 1550
Type of fibre G.652 G.652 G.652 G.652 G.652 G.654
G.653
Distance (km)a) ≤ 2 ∼ 15 ∼ 40 ∼ 80
STM-1 I-1 S-1.1 S-1.2 L-1.1 L-1.2 L-1.3 STM-4 I-4 S-4.1 S-4.2 L-4.1 L-4.2 L-4.3 STM
level STM-16 I-16 S-16.1 S-16.2 L-16.1 L-16.2 L-16.3
a) These are target distances to be used for classification and not for specification. The possibility of applying the set of optical parameters in this Recommendation to single-channel systems on G.655 fibre is not to be precluded by the designation of the fibre types in the application codes.
Within each category, it is possible to consider use of either nominal 1310 nm sources on optical fibre complying with ITU-T Rec. G.652 or nominal 1550 nm sources on optical fibre complying with ITU-T Recs G.652, G.653 or G.654. This Recommendation covers both possibilities for the two inter-office applications and considers only nominal 1310 nm sources on G.652 fibre for the intra-office application. Since the overall system characteristics and specific values for the optical parameters generally depend on system bit rate, it is convenient to classify the SDH optical interfaces based on applications considered in this Recommendation using the set of application codes shown in Table 1. This application code is constructed in the following way:
Application-STM level. Suffix number
with the application designations being I (Intra-office), S (Short-haul), or L (Long-haul), and the suffix number being one of the following: – (blank) or 1 indicating nominal 1310 nm wavelength sources on G.652 fibre; – 2 indicating nominal 1550 nm wavelength sources on G.652 fibre for short-haul applications
and either G.652 or G.654 fibre for long-haul applications; – 3 indicating nominal 1550 nm wavelength sources on G.653 fibre.

4 ITU-T Rec. G.957 (03/2006)
NOTE – The use of the term intra-office is not meant to exclude any other applications consistent with the set of optical parameters specified (e.g., B-ISDN user network interfaces – physical layer specifications defined in ITU-T Rec. I.432.2).
The distances chosen for the application codes in Table 1 are based on parameter values that are achievable with present technology and which are thought to suit network requirements. The intra-office and short-haul inter-office application codes have been proposed as low-cost equipment implementations. The long-haul application codes have been proposed to provide maximum length repeater spans consistent with limits set by present technology and the objective of transverse compatibility. The distances proposed may allow for the upgrading of present systems by exploiting the 1550 nm region. The distances in Table 1 represent approximate maximum repeater span distances. Specific distance limits consistent with the attenuation limits given in Tables 2 to 4, but including allowances for extra connectors or margins, can be derived through consideration of maximum fibre attenuation and dispersion values for each application in Tables 2 to 4.

5 ITU-T Rec. G.957 (03/2006)
Table 2/G.957 – Parameters specified for STM-1 optical interfaces
Unit Values
Digital signal Nominal bit rate
kbit/s
STM-1 according to ITU-T Rec. G.707/Y.1322 155 520
Application code (Table 1) I-1 S-1.1 S-1.2 L-1.1 L-1.2 L-1.3
Operating wavelength range nm 1260a)-1360 1261a)-1360 1430-1576 1430-1580 1263a)-1360 1480-1580 1534-1566/1523-1577 1480-1580
Transmitter at reference point S Source type MLM LED MLM MLM SLM MLM SL
M SLM MLM SLM
Spectral characteristics: – maximum RMS width (σ) nm 40 80 7.7 2.5 – 3 – – 3/2.5 – – maximum −20 dB width nm – – – – 1 – 1 1 – 1 – minimum side mode
suppression ratio dB – – – – 30 – 30 30 – 30
Mean launched power: – maximum dBm −8 −8 −8 0 0 0 – minimum dBm −15 −15 −15 −5 −5 −5 Minimum extinction ratio dB 8.2 8.2 8.2 10 10 10 Optical path between S and R Attenuation rangeb) dB 0-7 0-12 0-12 10-28 10-28 10-28 Maximum dispersion ps/nm 18 25 96 296 NA 246 NA NA 246/296 NA Minimum optical return loss of cable plant at S, including any connectors dB NA NA NA NA 20 NA
Maximum discrete reflectance between S and R dB NA NA NA NA –25 NA Receiver at reference point R Minimum sensitivityb) dBm −23 −28 −28 −34 −34 −34 Minimum overload dBm −8 −8 −8 −10 −10 −10 Maximum optical path penalty dB 1 1 1 1 1 1 Maximum reflectance of receiver, measured at R
dB NA NA NA NA −25 NA
a) Some Administrations may require a limit of 1270 nm. b) See clause 6.

6 ITU-T Rec. G.957 (03/2006)
Table 3/G.957 – Parameters specified for STM-4 optical interfaces
Unit Values Digital signal Nominal bit rate
kbit/s
STM-4 according to ITU-T Rec. G.707/Y.1322 622 080
Application code (Table 1) I-4 S-4.1 S-4.2 L-4.1 L-4.2 L-4.3
Operating wavelength range nm 1261a)-1360 1293-1334/1274-1356 1430-1580 1300-1325/
1296-1330 1280-1335 1480-1580 1480-1580
Transmitter at reference point S Source type MLM LED MLM SLM MLM SLM SLM SLM Spectral characteristics: – maximum RMS width (σ) nm 14.5 35 4/2.5 – 2.0/1.7 – – – – maximum –20 dB width nm – – – 1 – 1 < 1b) 1 – minimum side mode suppression ratio dB – – – 30 – 30 30 30 Mean launched power: – maximum dBm −8 −8 −8 +2 +2 +2 – minimum dBm −15 −15 −15 −3 −3 −3 Minimum extinction ratio dB 8.2 8.2 8.2 10 10 10 Optical path between S and R Attenuation rangeb) dB 0-7 0-12 0-12 10-24 10-24 10-24 Maximum dispersion ps/nm 13 14 46/74 NA 92/109 NA 1600 NA Minimum optical return loss of cable plant at S, including any connectors
dB NA NA 24 20 24 20
Maximum discrete reflectance between S and R dB NA NA −27 −25 −27 −25 Receiver at reference point R Minimum sensitivityb) dBm −23 −28 −28 −28 −28 −28 Minimum overload dBm −8 −8 −8 −8 −8 −8 Maximum optical path penalty dB 1 1 1 1 1 1 Maximum reflectance of receiver, measured at R dB NA NA −27 −14 −27 −14 a) Some Administrations may require a limit of 1270 nm. b) See clause 6.

ITU-T Rec. G.957 (03/2006) 7
Table 4/G.957 – Parameters specified for STM-16 optical interfaces
Unit Values
Digital signal Nominal bit rate
kbit/s
STM-16 according to ITU-T Rec. G.707/Y.1322 2 488 320
Application code (Table 1) I-16 S-16.1 S-16.2 L-16.1 L-16.2 L-16.3 Operating wavelength range nm 1266a)-1360 1260a)-1360 1430-1580 1280-1335 1500-1580 1500-1580Transmitter at reference point S Source type MLM SLM SLM SLM SLM SLM Spectral characteristics: – maximum RMS width (σ) nm 4 – – – – – – maximum –20 dB width nm – 1 < 1b) 1 < 1b) < 1b) – minimum side mode – suppression ratio
dB – 30 30 30 30 30
Mean launched power: – maximum dBm −3 0 0 +3 +3 +3 – minimum dBm −10 −5 −5 −2 −2 −2 Minimum extinction ratio dB 8.2 8.2 8.2 8.2 8.2 8.2 Optical path between S and R Attenuation rangeb) dB 0-7 0-12 0-12 12-24d) 12-24d) 12-24d) Maximum dispersion at upper wavelength limit
ps/nm 12c) NA 800c) NA 1600c) 450c)
Maximum dispersion at lower wavelength limit
ps/nm 12c) NA 420c) NA 1200c) 450c)
Minimum optical return loss of cable plant at S, including any connectors
dB 24 24 24 24 24 24
Maximum discrete reflectance between S and R
dB −27 −27 −27 −27 −27 −27
Receiver at reference point R Minimum sensitivityb) dBm −18 −18 −18 −27 −28 −27 Minimum overload dBm −3 0 0 −9 −9 −9 Maximum optical path penalty dB 1 1 1 1 2 1 Maximum reflectance of receiver, measured at R
dB −27 −27 −27 −27 −27 −27
a) Some Administrations may require a limit of 1270 nm. b) See clause 6. c) For wavelengths between the upper and lower wavelength limits, the maximum dispersion is linearly interpolated
between the values given for the wavelength extremes. Where the maximum dispersion values are the same, this value is required to be met across the entire wavelength range.
d) Some Administrations may require 10 dB minimum attenuation instead of 12 dB, to do this, it is required to decrease the maximum output power of the transmitter or to increase the minimum overload of the receiver (or a combination of both).

8 ITU-T Rec. G.957 (03/2006)
6 Parameter definitions For the purposes of this Recommendation, optical fibre line system interfaces can be represented as shown in Figure 1. In Figure 1, point S is a reference point on the optical fibre just after the transmitter optical connector (CTX) and point R is a reference point on the optical fibre just before the receiver optical connector (CRX). Additional connectors at a distribution frame (if used) are considered to be part of the fibre link and to be located between points S and R. In this Recommendation, optical parameters are specified for the transmitter at point S, for the receiver at point R, and for the optical path between points S and R.
Figure 1/G.957 – Representation of optical line system interface
All parameter values specified are worst-case values, assumed to be met over the range of standard operating conditions (i.e., temperature and humidity ranges), and they include aging effects. These conditions and effects are for further study. The parameters are specified relative to an optical section design objective of a Bit Error Ratio (BER) not worse than 1 × 10⁻¹⁰ for the extreme case of optical path attenuation and dispersion conditions in each application of Table 1. For systems with improved performance (e.g., BER of 10−12 or better according to ITU-T Rec. G.826), either improved receiver sensitivity or reduced attenuation range for the applications in Table 1 may be required.
The optical line coding used for all system interfaces is binary Non-Return to Zero (NRZ), scrambled according to ITU-T Rec. G.707/Y.1322.
6.1 System operating wavelength range To provide flexibility in implementing transversely compatible systems and future usage of Wavelength-Division Multiplexing (WDM), it is desirable to allow as wide a range as possible for the system operating wavelengths. The choice of operating wavelength range for each of the applications of Table 1 depends on several factors including fibre type, source characteristics, system attenuation range, and dispersion of the optical path. The following general considerations affect the specification of operating wavelength ranges in this Recommendation. More detailed description of the system aspects used to develop the operating wavelength range requirements in this Recommendation is contained in Annex A.
The operating wavelength range is the maximum allowable range for source wavelength. Within this range, the source wavelength can be selected for different fibre-related impairments (and different amplifier implementations should they be included). The receiver must have the minimum

ITU-T Rec. G.957 (03/2006) 9
operating wavelength range that corresponds to the maximum allowable range for the source wavelength. For SDH networks utilizing optical fibre amplifiers, it could be necessary to limit the operating wavelength range.
The wavelength regions permitting system operation are partially determined by either the cut-off wavelength values of the fibre or of the fibre cable. For G.652 and G.653 fibres, these values have been chosen to allow single-mode operation of the fibre cable at 1270 nm and above, with values as low as 1260 nm permitted by some Administrations. For G.654 fibre cables, the cut-off wavelength values have been accepted for single-mode operation at 1530 nm and above.
The allowable wavelength regions are further defined by the fibre attenuation. Although the intrinsic scattering attenuation generally decreases with increasing wavelength, OH-ion absorption can manifest itself around 1385 nm, and to a smaller extent around 1245 nm. These absorption peaks and the cut-off wavelength therefore define a wavelength region centred around 1310 nm. Dispersion-unshifted fibres complying with ITU-T Rec. G.652 are optimized for use in this wavelength region. At longer wavelengths bending attenuation occurs towards 1600 nm or beyond, and infra-red absorption occurs beyond 1600 nm. These attenuations and the 1385 nm water peak therefore define a second operating wavelength region around 1550 nm. ITU-T Rec. G.654 for cut-off shifted fibre is limited to this region only. However, both G.652 and dispersion-shifted G.653 fibres may be used in this region.
Apart from cut-off wavelength and attenuation that determine the broad operating wavelength regions, the allowable wavelength ranges are determined by the interaction of the fibre dispersion with the spectral characteristics of the transmitter. Parts of this range may lie inside or outside the wavelength range determined by attenuation. The overlap of the two ranges is the permissible wavelength range for system operation.
6.2 Transmitter
6.2.1 Nominal source type Depending on attenuation/dispersion characteristics and hierarchical level of each application in Table 1, feasible transmitter devices include Light-Emitting Diodes (LEDs), Multi-Longitudinal Mode (MLM) lasers and Single-Longitudinal Mode (SLM) lasers. For each of the applications, this Recommendation indicates a nominal source type. It is understood that the indication of a nominal source type in this Recommendation is not a requirement and that SLM devices can be substituted for any application showing LED or MLM as the nominal source type and MLM devices can be substituted for any application showing LED as the nominal source type without any degradation in system performance.
6.2.2 Spectral characteristics For LEDs and MLM lasers, spectral width is specified by the maximum Root-Mean-Square (RMS) width under standard operating conditions. The RMS width or value is understood to mean the standard deviation (σ) of the spectral distribution. The measurement method for RMS widths should take into account all modes which are not more than 20 dB down from the peak mode.
For SLM lasers, the maximum spectral width is specified by the maximum full width of the central wavelength peak, measured 20 dB down from the maximum amplitude of the central wavelength under standard operating conditions. Additionally, for control of mode partition noise in SLM systems, a minimum value for the laser side-mode suppression ratio is specified.
There is currently no agreed reliable method for estimating the dispersion penalties arising from laser chirp and finite side-mode suppression ratio for SLM lasers. Because of this, SLM laser linewidths for the L-4.2, S-16.1, S-16.2, L-16.1, L-16.2 and L-16.3 applications are under study.

10 ITU-T Rec. G.957 (03/2006)
Present indications are that spectral width definitions based on time-averaged spectral measurements are not sufficiently well correlated with path penalty to allow them to be used to ensure adequate performance for SLM devices.
A need to specify dynamic laser characteristics more accurately is recognized, particularly for long-haul systems. Currently, the best method available is a fibre transmission test. Its configuration consists of a transmitter under test, test fibres with maximum dispersion specified for the maximum system length, and a reference receiver. The dynamic characteristics of the transmitter are then evaluated using a bit error ratio measurement.
The above method is also used for the purposes of laser acceptance testing. Thus, the laser is evaluated by incorporation into the transmitter of an emulated transmission system. Lasers having acceptable spectral characteristics are identified on the basis of satisfactory error performance of the emulated system. Alternative methods for characterizing laser dynamic performance are for further study.
For SDH networks utilizing optical amplifiers, a transmitter with appropriate spectral characteristics is necessary to achieve target distances exceeding those defined for long-haul applications.
6.2.3 Mean launched power The mean launched power at reference point S is the average power of a pseudo-random data sequence coupled into the fibre by the transmitter. It is given as a range to allow for some cost optimization and to cover allowances for operation under the standard operating conditions, transmitter connector degradations, measurement tolerances, and aging effects. These values allow the calculation of values for the sensitivity and overload point for the receiver at reference point R.
The possibility of obtaining cost-effective system designs for long-haul applications by using uncooled lasers with maximum mean launched powers exceeding those of Tables 2 to 4, necessitating external, removable optical attenuators in low-loss sections, is for further study.
In the case of fault conditions in the transmit equipment, the launched power and maximum possible exposure time of personnel should be limited for optical fibre/laser safety considerations according to IEC 60825.
6.2.4 Extinction ratio The convention adopted for optical logic level is: – emission of light for a logical "1"; – no emission for a logical "0".
The Extinction ratio (EX) is defined as:
EXAB
=
10 10log
where A is the average optical power level at the centre of the logical "1" and B is the average optical power level at the centre of the logical "0". Measurement methods for the extinction ratio are under study.
6.2.5 Eye pattern mask In this Recommendation, general transmitter pulse shape characteristics including rise time, fall time, pulse overshoot, pulse undershoot, and ringing, all of which should be controlled to prevent excessive degradation of the receiver sensitivity, are specified in the form of a mask of the transmitter eye diagram at point S. For the purpose of an assessment of the transmit signal, it is important to consider not only the eye opening, but also the overshoot and undershoot limitations. The parameters specifying the mask of the transmitter eye diagram are shown in Figure 2. Annex B considers measurement set-ups for determining the eye diagram of the optical transmit signal.

ITU-T Rec. G.957 (03/2006) 11
Figure 2/G.957 – Mask of the eye diagram for the optical transmit signal
6.3 Optical path
To ensure system performance for each of the applications considered in Table 1, it is necessary to specify attenuation and dispersion characteristics of the optical path between reference points S and R.
6.3.1 Attenuation In this Recommendation, attenuation for each application is specified as a range, characteristic of the broad application distances indicated in Table 1. However, to provide flexibility in implementing transverse compatible systems, this Recommendation recognizes some overlap between attenuation ranges between the intra-office applications and the short-haul inter-office applications and between the short-haul inter-office applications and the long-haul inter-office applications. Attenuation specifications are assumed to be worst-case values including losses due to splices, connectors, optical attenuators (if used) or other passive optical devices, and any additional cable margin to cover allowances for: 1) future modifications to the cable configuration (additional splices, increased cable lengths,
etc.);

12 ITU-T Rec. G.957 (03/2006)
2) fibre cable performance variations due to environmental factors; and 3) degradation of any connector, optical attenuators (if used) or other passive optical devices
between points S and R, when provided.
6.3.2 Dispersion Systems considered limited by dispersion have maximum values of dispersion (ps/nm) specified in Tables 2 to 4. These values are consistent with the maximum optical path penalties specified (i.e., 2 dB for L-16.2, 1 dB for all other applications). They take into account the specified transmitter type, and the fibre dispersion coefficient over the operating wavelength range.
Systems considered limited by attenuation do not have maximum dispersion values specified and are indicated in Tables 2 to 4 with the entry NA (not applicable).
6.3.3 Reflections Reflections are caused by refractive index discontinuities along the optical path. If not controlled, they can degrade system performance through their disturbing effect on the operation of the laser or through multiple reflections which lead to interferometric noise at the receiver. In this Recommendation, reflections from the optical path are controlled by specifying the: – minimum Optical Return Loss (ORL) of the cable plant at point S, including any
connectors; and – maximum discrete reflectance between points S and R.
The possible effects of reflections on single fibre operation using directional couplers have not been considered in this Recommendation and are for further study.
Measurement methods for reflections are described in Appendix I. For the purpose of reflectance and return loss measurements, points S and R are assumed to coincide with the endface of each connector plug (see Figure 1). It is recognized that this does not include the actual reflection performance of the respective connectors in the operational system. These reflections are assumed to have the nominal value of reflection for the specific type of connectors used.
The maximum number of connectors or other discrete reflection points which may be included in the optical path (e.g., for distribution frames, or WDM components) must be such as to allow the specified overall optical return loss to be achieved. If this cannot be done using connectors meeting the maximum discrete reflections cited in Tables 2 to 4, then connectors having better reflection performance must be employed. Alternatively, the number of connectors must be reduced. It also may be necessary to limit the number of connectors or to use connectors having improved reflectance performance in order to avoid unacceptable impairments due to multiple reflections. Such effects may be particularly significant in STM-16 and STM-4 long-haul systems.
In Tables 2 to 4, the value –27 dB maximum discrete reflectance between points S and R is intended to minimize the effects of multiple reflections (e.g., interferometric noise). In Tables 3 and 4, the value −27 dB for maximum receiver reflectance will ensure acceptable penalties due to multiple reflections for all likely system configurations involving multiple connectors, etc. Systems employing fewer or higher performance connectors produce fewer multiple reflections and consequently are able to tolerate receivers exhibiting higher reflectance. As an extreme example, if only two connectors exist in the system, a 14 dB receiver return loss is acceptable.
For systems in which reflection effects are not considered to limit system performance, no values are specified for the associated reflection parameters and this is indicated in Tables 2 to 4 by the entry NA (not applicable). However, when using this Recommendation for a particular application, it should be noted that if upgradeability to other applications having more stringent requirements is contemplated, then these more stringent requirements should be used.

ITU-T Rec. G.957 (03/2006) 13
The possible need to develop a specification for transmitter signal-to-noise ratio under conditions of worst-case optical return loss for the applications in Tables 2 to 4 is for further study.
6.4 Receiver Proper operation of the system requires specification of minimum receiver sensitivity and minimum overload power level. These are taken to be consistent with the mean launched power range and attenuation range specified for each application.
In addition, proper operation of the system requires that the receiver tolerate the regions of relatively low transition rate within the SDH signal, due to the structure of the SDH frame format (ITU-T Rec. G.707/Y.1322). A possible method to assess the consecutive identical digit immunity of the receiver subsystem is presented in Appendix II.
6.4.1 Receiver sensitivity Receiver sensitivity is defined as the minimum value of average received power at point R to achieve a 1 × 10⁻¹⁰ BER. This must be met with a transmitter with worst-case values of transmitter eye mask, extinction ratio, optical return loss at point S, receiver connector degradations and measurement tolerances. The receiver sensitivity does not have to be met in the presence of dispersion or reflections from the optical path; these effects are specified separately in the allocation of maximum optical path penalty. NOTE – The receiver sensitivity does not have to be met in the presence of transmitter jitter in excess of the appropriate jitter generation limit (e.g., G.783 for SDH optical tributary signals).
Aging effects are not specified separately since they are typically a matter between a network provider and an equipment manufacturer. Typical margins between a beginning-of-life, nominal temperature receiver and its end-of-life, worst-case counterpart are desired to be in the 2 to 4 dB range. An example of a measurement method for determining aging effects on receiver sensitivity is given in Appendix III. The receiver sensitivities specified in Tables 2 to 4 are worst-case, end-of-life values.
6.4.2 Receiver overload
Receiver overload is the maximum acceptable value of the received average power at point R for a 1 × 10⁻¹⁰ BER.
6.4.3 Receiver reflectance Reflections from the receiver back to the cable plant are specified by the maximum permissible reflectance of the receiver measured at reference point R.
6.4.4 Optical path power penalty The receiver is required to tolerate an optical path penalty not exceeding 1 dB (2 dB for L-16.2) to account for total degradations due to reflections, intersymbol interference, mode partition noise, and laser chirp.
7 Optical parameter values for SDH applications Optical parameter values for the applications of Table 1 are given in Table 2 for STM-1, Table 3 for STM-4, and Table 4 for STM-16. Parameters defining the mask of the transmitter eye diagram at reference point S for each of the three hierarchical levels are given in Figure 2. These tables do not preclude the use of systems which satisfy the requirements of more than one application for any given bit rate.

14 ITU-T Rec. G.957 (03/2006)
8 Optical engineering approach The selection of applications and set of optical parameters covered by this Recommendation are chosen to reflect a balance between economic and technical considerations to provide the possibility for transverse compatible systems using the synchronous digital hierarchy. This clause describes the use of the parameters in Tables 2 to 4 to obtain a common system design approach for engineering SDH optical links.
8.1 Design assumptions To meet the greatest number of application possibilities with the smallest number of optical interface component specifications, three-interface categories are assumed for each level of the SDH hierarchy. These are distinguished by different attenuation/dispersion regimes rather than by explicit distance constraints to provide greater flexibility in network design while acknowledging technology and cost constraints for the various applications.
Worst-case, end-of-life parameter values are specified in this Recommendation to provide simple design guidelines for network planners and explicit component specifications for manufacturers. As a result, neither unallocated system margins nor equipment margins are specified and it is assumed that transmitters, receivers, and cable plant individually meet the specifications under the standard operating conditions. It is recognized that, in some cases, this may lead to more conservative system designs than could be obtained through joint engineering of the optical link, the use of statistical design approaches, or in applications and environments more constrained than those permitted under the standard operating conditions.
8.2 Worst-case design approach For a worst-case design approach, the optical parameters of Tables 2 to 4 are related as shown in Figure 3. In loss-limited applications, a system integrator may determine the appropriate application code and corresponding set of optical parameters by first fixing the total optical path attenuation, which should include all sources of optical power loss and any cable design margin specified by the system integrator. For those situations in which the system attenuation falls within the attenuation overlap region of two applications, then either set of optical parameters would apply. The most economical designs will generally correspond to the application code having the narrower attenuation range. For each installation, it should be verified that the total optical path penalty, which includes combined dispersion and reflection degradations, does not exceed the value given in 6.4.4 and Tables 2 to 4 since a higher value may lead to rapidly deteriorating system performance.

ITU-T Rec. G.957 (03/2006) 15
Figure 3/G.957 – Relationship of the optical parameters
For dispersion-limited systems, the system integrator may select an appropriate application code and corresponding set of optical parameters by determining the total dispersion (ps/nm) expected for the elementary cable section to be designed. The most economical design generally corresponds to the selection of the application having the smallest maximum dispersion value exceeding the dispersion value determined for the system design. Again, the total optical path power penalty should be verified as described above.
8.3 Statistical design approach The statistical approach is based on designing an enhanced elementary cable section, possibly exceeding the section length obtained by a worst-case design. By admitting a certain probability that the attenuation or dispersion between points S and R is larger than specified system values or that a transverse compatible design may not be obtained, cost savings may be achieved in long-haul high bit-rate optical systems through the reduction of the number of repeaters.
When using the statistical approach, the subsystem parameters are expressed in terms of the statistical distributions, which are assumed to be available from the manufacturers. Such distributions can be handled either numerically (e.g., by Monte Carlo methods) or analytically (e.g., Gaussian averages and standard deviations).
Examples of parameters which can be considered statistical in nature are the following: – cable attenuation; – cable zero-dispersion wavelength and zero-dispersion slope; – splice and connector loss; – transmitter spectral characteristics (central wavelength, spectral width, etc.); – available system gain between points S and R (e.g., optical power available at point S and
receiver sensitivity at point R. These parameters may need to be considered separately for transverse compatibility considerations).
According to design practices, each of the above parameters can be considered either statistical or worst-case. In a semi-statistical approach, those parameters assumed deterministic may be given a zero-width distribution around the worst-case value. Details are given in ITU-T Rec. G.955.

16 ITU-T Rec. G.957 (03/2006)
8.4 Upgradeability considerations Two possibilities arise with regard to system upgradeability: 1) It may be desired to upgrade from existing plesiochronous systems to SDH systems (e.g.,
from a 139 264 kbit/s system complying with G.955 specifications to an STM-1 system based on this Recommendation).
2) It may be desired to upgrade from one SDH hierarchical level to another (e.g., from STM-1 to STM-4).
It is not always feasible to satisfy both possibilities simultaneously for long-haul applications, and opinions differ on the best approach to be taken for system upgrade. For example, to maintain compatibility with 139 264 kbit/s and 4 × 139 264 kbit/s systems complying with ITU-T Rec. G.955, maximum attenuation values for STM-1 and STM-4 long-haul applications in this Recommendation are taken to be 28 dB and 24 dB, respectively. The difference in maximum attenuation for these two levels reflects the current wide-scale availability of STM-4 receivers meeting the sensitivity requirements of the lower attenuation value compared to the current relatively high cost of STM-4 receivers meeting the sensitivity requirements of the higher attenuation value.
Two examples for accomplishing upgradeability are described in Appendix IV.
8.5 Joint engineering
For a limited number of cases, joint engineering may be envisaged to meet the requirements of optical sections where the interface specifications of this Recommendation prove inadequate. This will probably occur where the required section loss is greater (e.g., 2 dB) than that specified in this Recommendation but may also be considered for other parameters.
For those cases, it is up to the Administrations/operators concerned to specify more closely the aspects of the system where the specifications of this Recommendation are not satisfactory. It is important to stress that every situation requiring "joint engineering" is likely to be different – hence it is meaningless to try to standardize any of the parameter values for these systems. Instead, it is for the Administrations/operators concerned to come to an agreement as to what is required and then negotiate with manufacturers as to what is actually feasible. This process is very likely to lead to both ends of a transmission link being supplied by the same manufacturer, who meets the required performance by jointly optimizing the transmitters and receivers.
It should be pointed out that, in spite of the futility of specifying any parameter values for "jointly engineered" systems, it would be advisable for Administrations/operators or manufacturers involved to follow the general guidelines and system engineering approach used in this Recommendation. In particular, it would be helpful to use the same parameter definitions (e.g., receiver sensitivity at R reference point including all temperature and aging effects).

ITU-T Rec. G.957 (03/2006) 17
Annex A
System operating wavelength considerations
This annex provides further information on the choice of range of operating wavelengths specified in Tables 2 to 4.
A.1 Operating wavelength ranges determined by fibre attenuation The general form of attenuation coefficient for installed fibre cable used in this Recommendation is shown in Figure A.1. Included here are losses due to installation splices, repair splices, and the operating temperature range. ITU-T Rec. G.652 states that attenuation values in the range 0.3-0.4 dB/km in the 1310 nm region and 0.15-0.25 dB/km in the 1550 nm region have been obtained.
The wavelength ranges indicated in Tables 2 to 4 have been confirmed by data from fibre manufacturers combined with assumptions for a total margin to account for cabling, installation splicing, repair splicing and temperature operating range. Therefore, the following reference maximum attenuation coefficient values are considered appropriate only for systems calculations: 3.5 dB/km in case of intra-office, 0.8 dB/km in case of short-haul, 0.5 dB/km in case of 1310 nm long-haul and 0.3 dB/km in case of 1550 nm long-haul applications. By using these attenuation coefficient values, it is indicated that the approximate target distances in Table 1 are achievable.
Figure A.1/G.957 – Typical spectral attenuation coefficient for the installed fibre cable between S and R

18 ITU-T Rec. G.957 (03/2006)
A.2 Operating wavelength ranges determined by fibre dispersion For G.652 fibres, the zero-dispersion wavelength lies between 1300 nm and 1324 nm, so the fibre is dispersion-optimized in the 1310 nm region. These wavelengths and corresponding requirements on the zero-dispersion slope result in the maximum permitted absolute value of the dispersion coefficient (as determined by fibres having the minimum or maximum zero-dispersion wavelengths) shown in Figure A.2-a. However, the G.652 fibres can be used also in the 1550 nm region, for which the maximum dispersion coefficient is comparatively large as shown in Figure A.2-b.
For G.653 fibre, the permitted range of the zero-dispersion wavelength lies between 1500 nm and 1600 nm, so the fibre is dispersion-optimized in the 1550 nm region. The analytical expressions for the dispersion coefficient result in the maximum permitted values are shown in Figure A.3. The G.653 fibres can be used also in the 1310 nm region, for which the maximum dispersion coefficient is comparatively large. However, this possible application is currently not considered in ITU-T Rec. G.957.
For G.654 fibres in the 1550 nm region, the dispersion coefficient is similar but slightly larger than that for G.652 fibres. This is still under study and has not been taken into account in Tables 2 to 4.
For G.652 fibres in the 1310 nm region and for G.653 fibres in the 1550 nm region, the dispersion-limited wavelength range is chosen such that the absolute values of the dispersion coefficient at the limiting wavelengths are approximately equal. As can be seen from the shapes of Figure A.2-a and Figure A.3, absolute dispersion values are therefore smaller within the operating wavelength range.
For G.654 fibres, and also for G.652 fibres in the 1550 nm region, Figure A.2-b shows that dispersion limits the upper operating wavelength while attenuation limits the lower operating wavelength.
Figure A.2/G.957 – Maximum absolute value, D, of the dispersion coefficient for G.652 () and G.654 fibres (----)

ITU-T Rec. G.957 (03/2006) 19
Figure A.3/G.957 – Maximum absolute values, D, of the dispersion coefficient for G.653 fibres
The interaction between the transmitter and the fibre is accounted for by a parameter epsilon. It is defined as the product of 10−6 times the bit rate (in Mbit/s) times the path dispersion (in ps/nm) times the RMS spectral width (in nm). For a 1 dB power penalty due to dispersion, epsilon has a maximum value. For intersymbol interference alone, the value 0.306 is applied to LEDs and SLM lasers. The 20 dB width for SLM lasers is taken as 6.07 times the RMS width. (For L-16.2 only, it is necessary to increase epsilon to 0.491, corresponding to a 2 dB power penalty.) For intersymbol interference plus mode partition noise, the maximum value 0.115 is applied to MLM lasers. (For I-1 and I-4, the large spectral widths may not often occur, but they are retained here for possible cost savings.) For wavelength chirp, no known value is applied to SLM lasers.
For a particular spectral width, the optical path dispersion is fixed for a particular application code. With the appropriate path distance from Table 1, the maximum allowed dispersion coefficient follows. The spectral dependence of the dispersion coefficient then determines the dispersion-limited wavelength range. (The use of the dispersion coefficient beyond the wavelength ranges stated in ITU-T Recs G.652, G.653 or G.654 is for further study.)

20 ITU-T Rec. G.957 (03/2006)
Annex B
Measurement of the mask of the eye diagram of the optical transmit signal
B.1 Measurement set-up In order to ensure the suitability of the optical transmit signal for the performance of the receiver, a measurement set-up according to Figure B.1 is recommended for the eye diagram of the transmit optical signal. An optical attenuator may be used for level adaptation at the reference point OI. An electrical amplifier may be used for level adaptation at the reference point EO. Values for the mask of the eye diagram in Figure 2 include measuring errors such as sampling oscilloscope noise and manufacturing deviations of the low-pass filter.
Figure B.1/G.957 – Measurement set-up for transmitter eye diagram
B.2 Transfer function of the optical reference receiver The nominal transfer function of the optical reference receiver is characterized by a fourth-order Bessel-Thomson response according to:
( )432 1045105105105
1)( yyyypH ++++=
with:
p = r
jωω
y = 2.1140p ωr = 1.5πf0
f0 = bit rate
The reference frequency is fr = 0.75 f0. The nominal attenuation at this frequency is 3 dB, where 0 dB is defined to be the attenuation at 0.03 fr. The corresponding attenuation and group delay distortion at various frequencies are given in Table B.1. Figure B.2 shows a simplified circuit diagram for the low-pass filter used for measuring the mask of the eye diagram of the optical transmit signal. NOTE – This filter is not intended to represent the noise filter used within an optical receiver.

ITU-T Rec. G.957 (03/2006) 21
Table B.1/G.957 – Nominal values of attenuation and group delay distortion of the optical reference receiver
f/f0 f/fr Attenuation (dB) Group delay distortion (UI)
0.15 0.2 0.1 0 0.3 0.4 0.4 0 0.45 0.6 1.0 0 0.6 0.8 1.9 0.002 0.75 1.0 3.0 0.008 0.9 1.2 4.5 0.025 1.0 1.33 5.7 0.044 1.05 1.4 6.4 0.055 1.2 1.6 8.5 0.10 1.35 1.8 10.9 0.14 1.5 2.0 13.4 0.19 2.0 2.67 21.5 0.30
Figure B.2/G.957 – Low-pass receiver filter for measuring the transmitter eye diagram
To allow for tolerances of the optical reference receiver components including the low-pass filter, the actual attenuation should not deviate from the nominal attenuation by more than the values specified in Table B.2. The flatness of the group delay should be checked in the frequency band below the reference frequency. The tolerable deviation is for further study.
Table B.2/G.957 – Tolerance values of the attenuation of the optical reference receiver
∆ a (dB)a) f/fr
STM-1 STM-4 STM-16
0.001 .. 1 ± 0.3 ± 0.3 ± 0.5 1 .. 2 ± 0.3 … ± 2.0 ± 0.3 … ± 2.0 ± 0.5 … ± 3.0
a) Provisional values.
NOTE – Intermediate values of ∆ a should be interpolated linearly on a logarithmic frequency scale.

22 ITU-T Rec. G.957 (03/2006)
Appendix I
Methods for measuring reflections
Two methods are in general use. The Optical Continuous-Wave Reflectometer (OCWR) utilizes a continuous or modulated stable light source with a high sensitivity time-averaging optical power meter. It is suitable for measuring the optical return loss of the cable plant at point S or the reflectance of the receiver at point R. The Optical Time-Domain Reflectometer (OTDR) utilizes a pulsed source having a low-duty cycle along with a sensitive time-resolving optical receiver. It is suitable for measuring discrete reflectances between S and R or the receiver reflectance at R.
Both instruments utilize 2 × 1 optical couplers, and both are available commercially. Instructions contained with the instrument may supersede those given below. Moreover, test procedures are under development.
For calibration purposes, a jumper with a known end reflector may be used. The value of reflectance may be near zero (as obtained with careful index matching and/or a tight bend in the fibre), or about −14.5 dB (as with a good cleave), or some other known reflectance R0 (as with an imperfect cleave or an applied thin film coating). The connection between the jumper and the instrument must have a low reflectance.
I.1 Optical continuous-wave reflectometer The coupler nomenclature is shown in Figure I.1, and the following calibration measurement needs to be performed only once. Power Ps is measured by connecting the optical source directly to the power meter. The source is then connected to output port 3 of the coupler, while the power meter measures P32 at the input port 2. The source is now connected to input port 1, while the meter measures power P13 at port 3. Finally, the non-reflecting jumper is connected to port 3, while power P0 is measured at port 2.
Figure I.1/G.957 – Coupler arrangement for OTDR and OCWR
To measure the reflectance of the detector, the connector at point R is connected to port 3; to measure the ORL of the cable plant, the connector at point S is connected to port 3. In either case, power PR is measured by the meter at port 2. The reflectance of the detector is:
( )
RP P P
P Ps R=
−10 10
0
13 32log
The ORL of the cable plant is:
ORL R= −

ITU-T Rec. G.957 (03/2006) 23
I.2 Optical time-domain reflectometer Here the coupler is usually internal to the instrument. A variable optical attenuator, and a pigtail of length beyond the dead-zone of the instrument are both supplied, if they are not already internal to the instrument. The following calibration measurement needs to be performed only once. A jumper with known reflectance R0 is attached, giving an OTDR trace schematically shown in Figure I.2. The optical attenuator is adjusted until the reflection peak falls just below the instrumental saturation level, and the peak height H0 is noted. The calibration factor:
F RH
= − −
0 1010 10 1
05log
is calculated. (If the temporal duration D of the pulse is measured, the backscatter coefficient of the fibre is B = F − 10 log10 D. If D is in ns, B is about −80 dB.)
To measure the maximum discrete reflectance between S and R, the OTDR is connected to point S or R. The peak height H is noted for a particular reflectance. The resulting value is:
−+= 110log10 5
10
H
FR
Figure I.2/G.957 – OTDR trace at a discrete reflector
24 ITU-T Rec. G.957 (03/2006)
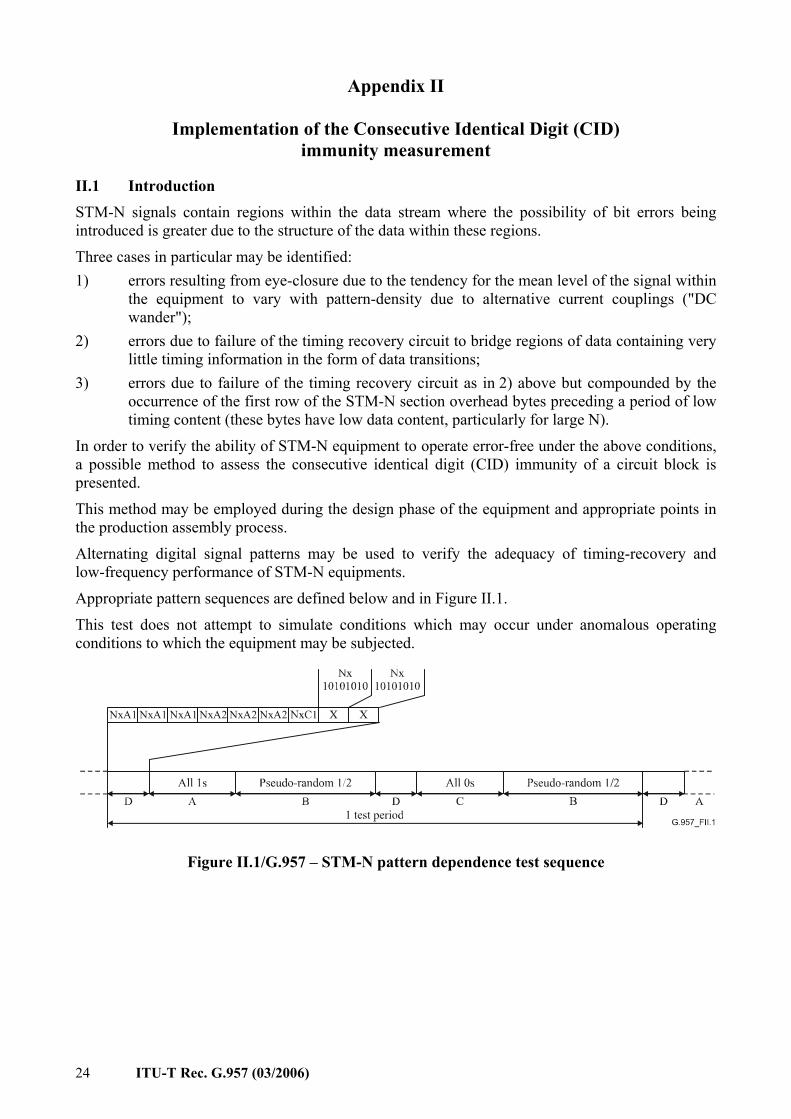
Appendix II
Implementation of the Consecutive Identical Digit (CID) immunity measurement
II.1 Introduction STM-N signals contain regions within the data stream where the possibility of bit errors being introduced is greater due to the structure of the data within these regions.
Three cases in particular may be identified: 1) errors resulting from eye-closure due to the tendency for the mean level of the signal within
the equipment to vary with pattern-density due to alternative current couplings ("DC wander");
2) errors due to failure of the timing recovery circuit to bridge regions of data containing very little timing information in the form of data transitions;
3) errors due to failure of the timing recovery circuit as in 2) above but compounded by the occurrence of the first row of the STM-N section overhead bytes preceding a period of low timing content (these bytes have low data content, particularly for large N).
In order to verify the ability of STM-N equipment to operate error-free under the above conditions, a possible method to assess the consecutive identical digit (CID) immunity of a circuit block is presented.
This method may be employed during the design phase of the equipment and appropriate points in the production assembly process.
Alternating digital signal patterns may be used to verify the adequacy of timing-recovery and low-frequency performance of STM-N equipments.
Appropriate pattern sequences are defined below and in Figure II.1.
This test does not attempt to simulate conditions which may occur under anomalous operating conditions to which the equipment may be subjected.
NxA1 NxA1 NxA1 NxA2 NxA2 NxA2
Figure II.1/G.957 – STM-N pattern dependence test sequence

ITU-T Rec. G.957 (03/2006) 25
II.2 Method The specific test patterns are made up of consecutive blocks of data of four types: a) all ones (zero timing content, high average signal amplitude); b) pseudo-random data with a mark-density ratio of 1/2; c) all zeros (zero timing content, low average signal amplitude); d) a data block consisting of the first row of section overhead bytes for the STM-N system
under test.
The test pattern is shown in Figure II.1 where the regions A, B, C and D are identified.
The duration of the zero-timing-content periods A and C is made equal to the longest like-element sequences expected in the STM-N signal. A value of nine bytes (72 bits) is provisionally proposed for this.
The duration of the pseudo-random periods should allow recovery of both the zero base line offset of the signal and of the timing recovery circuit following occurrence of the A and C periods. Therefore, it should be longer than the longest time constant in the receiver subsystem. In the case of a PLL based clock extraction, this could give a value of the order of 10 000 bits. Taking into account possible limitations of test equipment, a minimum value of 2000 bits is considered acceptable.
The content of the pseudo-random section should be generated by a scrambler having the same polynomial as defined in ITU-T Rec. G.707.Y.1322. Ideally, the scrambler should "free-run", i.e., the beginning of the pattern should be uncorrelated with the frame alignment section. This arrangement will ensure that the system experiences the worst possible phasing of the pseudo-random binary sequence (PRBS) at some point during the course of the test. However, it is recognized that test equipment limitations may preclude the use of a free running scrambler. Hence, it may be necessary to specify a worst-case phasing of the PRBS. This is for further study.
The D-period is defined as the first row of the section overhead of the STM-N signal, including valid C1 bytes (consecutive binary numbers) as described in 9.2/G.707/Y.1322.
It is recommended that this test be applied to SDH systems at any appropriate point in time during the design or production phase. This would be done to demonstrate the ability of both timing-recovery and decision circuits adequately to handle worst-case SDH signals.
It should be emphasized that the test pattern may be rejected by or cause malfunction of certain equipments because, for example, the occurrence of the frame alignment bytes within the pattern. The test should therefore only be used for assemblies not so affected, such as timing-recovery units, receiver amplifier chains, etc.
However, the test may be applicable in certain cases at the available user ports. It is not proposed as a general acceptance test which might require special defined access ports and connection arrangements within the equipment.

26 ITU-T Rec. G.957 (03/2006)
Appendix III
Possible method for evaluating aging margin contribution in receiver sensitivity specifications
This appendix presents a possible method for determining the contribution due to aging effects in the specification of receiver sensitivity used in this Recommendation.
III.1 Receiver sensitivity and eye opening Figure III.1 shows eye opening at the receiver as a function of optical received power. The eye opening value, E, is the value which is determined by the system designer for operation at a BER of 10−10. The received power P2 corresponds to the power required for maximum eye opening at the receiver. For stable system operation, the optical received power is typically set to a level higher than P1 such that, at the end of system life, the specified eye opening, E, is still satisfied. Thus, P1 is the end-of-life receiver sensitivity and P0 is the beginning-of-life receiver sensitivity. M is the margin between P1 and P0 to account for the effects of receiver aging. The amount of eye margin depends on receiver characteristics and the values, for example, may be E1 – E and E2 – E for different receivers (e.g., type I or type II). An appropriate eye margin cannot be obtained if the received power is P0.
Figure III.1/G.957 – Eye opening characteristics
With respect to the effects of aging on receiver performance, it may be assumed that the eye opening as a function of received optical power is shifted parallel to the initial characteristics as shown in Figure III.2. For the purposes of simulating aging effects, it may also be assumed that the shifted curve can be obtained by adding a certain amount of intersymbol interference noise to the signal corresponding to the initial value of eye margin. The test method proposed for evaluation of the eye opening by this technique is the S/X test.

ITU-T Rec. G.957 (03/2006) 27
Figure III.2/G.957 – Eye opening due to intersymbol interference
III.2 S/X test method
To simulate intersymbol interference noise, the S/X test is performed by using an NRZ signal modulated at a low frequency compared to the system operating bit rate. This interfering signal is combined optically with a normal optical signal and injected into the receiver under test.
In the S/X test, the normal optical signal power is usually set to P1. The amount of the optical power of the interference noise, X, can be determined by a relationship between eye opening and S/X ratio whose characteristics are shown in Figure III.3. From Figure III.3, the S/X ratio can be determined as (S/X)E by the relationship between E1 and E. The aging margin M and (S/X)E are given by:
( )XPXS
PPM
E1
01
/ =
−=
Figure III.3/G.957 – Eye opening and S/X ratio parameter

28 ITU-T Rec. G.957 (03/2006)
The test configuration is shown in Figure III.4.
ED
1 UI1 UI
COUPLER
OPT. ATT.
X Signal
OPT. ATT.
COUPLEREDOPT.ATT.PPGRXTXX SIGNAL
Optical coupler
Optical AttenuatorError Detector
Pulse Pattern GeneratorReceiverTransmitterOptical Interference Signal Generator
TX1 3 P X1 +
RX4
2
X
X
EE1
b) = ( )S/X S/X Ea) S/X =
1
3
2
4
PPG
X
Figure III.4/G.957 – S/X measurement configurations

ITU-T Rec. G.957 (03/2006) 29
Appendix IV
Upgradeability examples
Two examples for accomplishing upgradeability are described below:
IV.1 Example 1 To realize low-cost designs optimized for a particular hierarchical level by using current, widely available optical components, the following maximum attenuation ranges may be adopted for the long-haul applications: – STM-1 28 dB; – STM-4 24 dB; – STM-16 24 dB.
For upgrading from one hierarchical level to a higher one when it is desired to maintain regenerator spacings for the original and upgraded system, the following options are available: i) The original system design may be based on the smallest attenuation (i.e., highest
hierarchical level) expected for the upgraded long-haul system. ii) If the original system operates in the 1310 nm region on G.652 fibre, then the upgraded
system may be chosen to operate in the 1550 nm region to obtain lower cable attenuation, although with increased dispersion penalty.
iii) Relatively high-loss components (e.g., connectors) may be replaced with lower-loss components for the upgraded system.
iv) Statistical design approaches may be employed to provide enhanced cable sections for the upgraded system.
IV.2 Example 2 Another approach to upgradeability is to employ the concept of a set of grades in higher order STM-N systems for the long-haul inter-office interfaces. Table IV.1 and Figure IV.1 show the grade classification based on maximum attenuation. Parameter values for the various grades are for further study. These grades might be applied by users when considering network planning and cost performance, etc. Moreover, higher grade system design should allow incorporation of future technology advances and changing service requirements.
Table IV.1/G.957 – Grade classification for long-haul applications
Maximum attenuation STM-1 STM-4 STM-16
28 dB Grade 1 Grade 2 Grade 2 24 dB – Grade 1 Grade 1

30 ITU-T Rec. G.957 (03/2006)
Figure IV.1/G.957 – Maximum attenuation for STM-N long-haul inter-office interfaces with two grades


Printed in Switzerland Geneva, 2006
SERIES OF ITU-T RECOMMENDATIONS
Series A Organization of the work of ITU-T
Series D General tariff principles
Series E Overall network operation, telephone service, service operation and human factors
Series F Non-telephone telecommunication services
Series G Transmission systems and media, digital systems and networks
Series H Audiovisual and multimedia systems
Series I Integrated services digital network
Series J Cable networks and transmission of television, sound programme and other multimedia signals
Series K Protection against interference
Series L Construction, installation and protection of cables and other elements of outside plant
Series M Telecommunication management, including TMN and network maintenance
Series N Maintenance: international sound programme and television transmission circuits
Series O Specifications of measuring equipment
Series P Telephone transmission quality, telephone installations, local line networks
Series Q Switching and signalling
Series R Telegraph transmission
Series S Telegraph services terminal equipment
Series T Terminals for telematic services
Series U Telegraph switching
Series V Data communication over the telephone network
Series X Data networks, open system communications and security
Series Y Global information infrastructure, Internet protocol aspects and next-generation networks
Series Z Languages and general software aspects for telecommunication systems