riocan 2008 q2confident that riocan is on the right road to take advantage of the financial winds...
TRANSCRIPT

ROOTED IN THE MAJOR MARKETS
CANADA’S MAJOR MARKET REIT
RIOCAN REAL ESTATE INVESTMENT TRUST
SECOND QUARTER REPORT 2008
2RioCan Real Estate Investment TrustRioCan Yonge Eglinton Centre2300 Yonge Street, Suite 500 P.O. Box 2386, Toronto, Ontario M4P IE4T 416-866-3033 or 1-800-465-2733F 416-866-3020W www.riocan.com

Senior Management , Board o f Trus tees and Uni tho lder In format ion
Senior Management
Edward Sonshine, Q.C.President and Chief Executive Officer
Frederic A. WaksExecutive Vice President and Chief Operating Officer
Raghunath DavloorSenior Vice President and Chief Financial Officer
Donald MacKinnonSenior Vice President, Real Estate Finance
Jordan RobinsSenior Vice President, Planning and Development
Jeff RossSenior Vice President, Leasing
John BallantyneVice President, Asset Management
Michael ConnollyVice President, Construction
Therese CornelissenVice President and Chief Accounting Officer
Jonathan GitlinVice President, Investments
John HoVice President, Property Accounting
Danny KissoonVice President, Operations
Suzanne MarineauVice President, Human Resources
Maria RicoVice President, Risk Management and Process Improvement
Kenneth SiegelVice President, Leasing
Board of Trustees
Paul Godfrey, C.M. 1,2,3,4
(Chairman of Board of Trustees)President and Chief Executive Officer,Toronto Blue Jays Baseball Club
Clare R. Copeland 1,2
Chair of Toronto Hydro Corporation
Raymond Gelgoot 4
Partner, Fogler, Rubinoff LLP
Frank W. King, O.C. 1,2
President, Metropolitan Investment Corporation
Dale H. Lastman 3
Co-Chair and Partner, Goodmans LLP
Ronald W. Osborne 1
Corporate Director
Sharon Sallows 3,4
Partner, Ryegate Capital Corporation
Edward Sonshine, Q.C.President and Chief Executive Officer,RioCan Real Estate Investment Trust1 member of the Audit Committee2 member of the Human Resources & Compensation Committee3 member of the Nominating & Governance Committee4 member of the Investment Committee
Unitholder Information
Head Office
RioCan Real Estate Investment TrustRioCan Yonge Eglinton Centre, 2300 Yonge Street, Suite 500P.O. Box 2386, Toronto, Ontario M4P 1E4Tel: 416-866-3033 or 1-800-465-2733Fax: 416-866-3020Website: www.riocan.comE-mail: [email protected]
Unitholder and Investor Contacts
Correna CraigDirector of Public and Investor RelationsTel: 416-864-6483E-mail: [email protected]
Nancy MedlockInvestor Relations AdministratorTel: 416-306-2406E-mail: [email protected]
Auditors
Ernst & Young LLP
Transfer Agent and Registrar
CIBC Mellon Trust CompanyP.O. Box 7010, Adelaide Street Postal Station, Toronto, Ontario M5C 2W9Answerline: 1-800-387-0825 or 416-643-5500Fax: 416-643-5501Website: www.cibcmellon.comE-mail: [email protected]
Unit Listing
The units are listed on the Toronto Stock Exchange under the symbol REI.UN.
Con
cept
et p
rodu
ctio
n :
Impr
imé
au C
anad
a
Con
cept
et p
rodu
ctio
n :
Impr
imé
au C
anad
a
RIO
CAN
REA
L ES
TATE
INVE
STM
ENT
TRU
ST S
ECO
ND
QU
ART
ER R
EPO
RT 2
008
69
The results for the second quarter of 2008 were quite satisfactory for RioCan, particularly having in mind the uncertaineconomic times in which we find ourselves. We are gratified to note that our occupancy rate has increased to 97% while theamount lost to tenant defaults during the period in question was negligible.
While the indicators noted above are positive, there is no doubt that we are currently in a time of economic pessimism,which has resulted in reduced capital availability to the real estate sector. This is a theme that I noted in my report to youlast quarter and one that continues to be played out.
RioCan’s response to this climate is based on having the strongest capital position that we can achieve consistent with ourdesires for growth. To that end, we successfully completed an equity offering in April 2008 and we are pleased that theoffering was not only taken up in full but that the overallotment was also purchased, with the result that RioCan increased itsequity capital base by about $150 million. At the same time, our refinancing program has continued successfully and at thispoint in the year, we are able to advise that virtually all mortgages maturing in 2008 have been refinanced or committed atoverall interest rates lower than the debt being repaid.
The net result is that our current leverage ratio is as low as it has been in many years while our cash position is extremelystrong. While this stance can be mildly dilutive in the short term, we are confident that this will be more than made up in thelonger term by our being one of the few real estate entities that is currently in a position to react quickly and aggressively onacquisition opportunities.
One of the first of these acquisition opportunities was completed at the end of June, namely the purchase of a 1.1 millionsquare foot portfolio of ten shopping centres at a purchase price of $156 million. This portfolio was acquired at a yieldconsiderably higher than what we would have expected to be the case in the recent past, and as a result, will be extremelyaccretive for us commencing in the third quarter of this year.
This transaction was also noteworthy in that it was the first transaction in over five years that we undertook in our jointventure with Kimco Realty Corporation (“Kimco”). We were pleased that we were able to come to terms with Kimco on a feeschedule that made sense to RioCan. From RioCan’s perspective, extending our capital resources through joint ventures ofthis type is a strategy that is sensible in a time when capital is becoming relatively more expensive. At the same time, by wayof the fee income stream created, the returns on funds invested is considerably enhanced.
This theme of capital preservation and enhancing returns through fees was a basic part of the other major transaction thattook place in this past quarter, namely our sale of a 50% non managing interest in two development projects to CPPInvestment Board (“CPPIB”). Our relationship with CPPIB commenced several years ago with the sale of a half interest inthree shopping centres that were in early development stage, and the expansion of this relationship through these newtransactions is certainly one that we welcome and that we believe will be beneficial for all.
Finally, we believe that the strategies put into place at RioCan over the last several years are commencing to bear fruit inthat they correctly anticipated some of the trends that are becoming apparent to all. Our urban focus as well as ourintensification strategy fit perfectly with the time of high fuel prices and people’s desire to live, work and shop in muchtighter geographical areas.
Accordingly and notwithstanding the economic clouds that seem to be very thick in the current environment, we are quietlyconfident that RioCan is on the right road to take advantage of the financial winds that are scattering others.
As always, we thank you, our unitholders, for your continued confidence in us.
Edward Sonshine, Q.C.President and Chief Executive Officer
July 22, 2008
Dear Fe l low Uni tho l der :
Edward Sonshine, Q.C.President and ChiefExecutive Officer,RioCan Real Estate Investment Trust
ROOTED IN THE MAJOR MARKETS

Real Es ta te P or t f o l i o Fact S heet
RIO
CAN
REA
LES
TATE
INVE
STM
ENT
TRU
STSE
CON
DQ
UA
RTER
REPO
RT20
08
1
Total Net Leasable Area (“NLA”) (sq. ft.): Retail Office TotalIncome producing properties 30,954,375 1,583,391 32,537,766Properties under development 3,272,867 3,272,867
Total 34,227,242 1,583,391 35,810,633
Number of Tenancies 5,590
Occupancy:Retail occupancy 97.0%Office occupancy 98.0%
Total Occupancy 97.0%
Geographic DiversificationNumber of properties
Percentage of annualized Income producing Properties underrental revenue properties development Total
Ontario 62.8% 136 12 148Quebec 17.0% 32 32Alberta 10.2% 18 2 20British Columbia 5.9% 13 13New Brunswick 2.1% 6 1 7Saskatchewan 0.7% 2 2Manitoba 0.5% 1 1Prince Edward Island 0.4% 1 1Newfoundland 0.3% 2 2Nova Scotia 0.1% 1 1
100.0% 212 15 227
Anchor and National TenantsPercentage of annualized Percentage
rental revenue of total NLA
anchor and national tenants 83.5% 82.9%
Top Ten Sources of Revenue by TenantPercentage of annualized Weighted average
Ranking Tenant rental revenue remaining lease term (yrs)
1. Metro/A&P/Dominion/Super C/Loeb/Food Basics 5.4% 9.62. Famous Players/Cineplex/Galaxy Cinemas 5.4% 14.63. Zellers/The Bay/Home Outfitters 3.7% 9.54. Canadian Tire/PartSource/Mark's Work Wearhouse 3.6% 11.85. Loblaws/No Frills/Fortinos/Zehrs/Maxi 3.4% 6.76. Wal-Mart 3.4% 9.87. Winners/HomeSense 3.2% 5.78. Staples/Business Depot 2.5% 8.79. Reitmans/Penningtons/Smart Set/Addition-Elle/Thyme Maternity 2.0% 5.2
10. Shoppers Drug Mart 1.7% 9.8Total 34.3%
Lease Expiries Lease expiries (NLA)
Retail Class Total NLA 2008 (1) 2009 2010 2011 2012
New format retail 14,773,844 258,586 840,801 981,534 1,402,528 1,028,841 1.8% 5.7% 6.6% 9.5% 7.0%
Grocery anchored centre 6,878,721 227,945 887,433 933,281 1,010,334 1,031,603 3.3% 12.9% 13.6% 14.7% 15.0%
Enclosed shopping centre 6,459,517 247,446 530,483 790,749 792,202 434,004 3.8% 8.2% 12.2% 12.3% 6.7%
Non-grocery anchored centre 1,545,701 47,051 112,159 111,967 102,460 124,789 3.0% 7.3% 7.2% 6.6% 8.1%
Urban retail 1,296,592 122,300 99,841 64,838 77,061 124,495 9.4% 7.7% 5.0% 5.9% 9.6%
Office 1,583,391 52,138 181,577 272,361 334,298 54,884 3.3% 11.5% 17.2% 21.1% 3.5%
Total 32,537,766 955,466 2,652,294 3,154,730 3,718,883 2,798,616 2.9% 8.2% 9.7% 11.4% 8.6%
Average net rent per square foot $14.19 $16.37 $15.32 $14.11 $14.21 $15.60
(1) Tenant lease expires for the six months ended June 30, 2008.
At June 30, 2008

Table of Contents3 Consolidated Balance Sheets4 Consolidated Statements of Unitholders’ Equity5 Consolidated Statements of Earnings and Comprehensive Income (Loss)6 Consolidated Statements of Cash Flows7 Notes to Consolidated Financial Statements7 Significant Accounting Policies7 Basis of Accounting7 Changes in Accounting Policies7 Future Accounting Changes7 Income Properties8 Amortization8 Properties Under Development9 Capitalization of Carrying Costs9 Mortgages and Loans Receivable10 Receivables and Other Assets10 Mortgages Payable11 Debentures Payable12 Accounts Payable and Other Liabilities12 Trust Units13 Unit Based Compensation Plans13 Incentive Unit Option Plan14 Trustees’ Restricted Equity Unit Plan15 Employee Future Benefits15 Investments in Co-ownerships16 Changes in Non-cash Operating Items and Other16 Income Taxes17 Segmented Disclosures and Additional Information18 Capital Management19 Financial Instruments19 Fair Value of Financial Instruments20 Risk Management20 Credit Risk20 Interest Rate and Liquidity Risks21 Contingencies and Commitments21 Guarantees21 Contractual Obligations on Real Estate Investments21 Litigation
22 Management’s Discussion and Analysis22 Overview and Highlights24 Vision and Business Strategy26 Outlook27 2008 Objectives28 Asset Profile28 Income Properties37 Capital Expenditures on Income Properties38 Co-Ownership Activities Included in Income Properties40 Equity Investments in Income Properties40 Properties Under Development42 Properties Under Development45 Properties Held for Resale45 Mortgages and Loans Receivable47 Capital Structure48 Debt48 Revolving Lines of Credit48 Debentures Payable49 Mortgages Payable50 Aggregate Debt Maturities51 Trust Units51 Other Capital Commitments and Contingencies52 Future Income Taxes53 Off Balance Sheet Liabilities and Guarantees54 Liquidity54 Distributions to Unitholders55 Difference between Cash Flows Provided by Operating Activities
and Distributions to Unitholders56 Difference between Net Earnings and Distributions
to Unitholders57 Results of Operations57 Net Operating Income60 Other Revenue60 Fees and Other Income60 Interest Income60 Other Expenses60 Interest61 General and Administrative62 Amortization62 Other Items62 Funds from Operations63 Significant Accounting Policies63 Changes in Accounting Policies63 Future Changes in Significant Accounting Policies63 Goodwill and Intangible Assets64 International Financial Reporting Standards (“IFRS”)64 Risks and Uncertainties64 Tenant Concentrations65 Interest Rate and Other Debt and Equity Related Risks66 Liquidity Risk of Real Estate Investments66 Unexpected Costs or Liabilities Related to the
Acquisition of Real Estate Investments66 Construction Risk66 Environmental Risk66 Unitholder Liability67 Income Taxes68 Selected Quarterly Consolidated Information
FINANCIALREVIEW

(unaudited – in thousands)As at As atJune December
30, 31,2008 2007
RIO
CAN
REA
LES
TATE
INVE
STM
ENT
TRU
STSE
CON
DQ
UA
RTER
REPO
RT20
08
3
Consol ida ted B al ance S heet s
AssetsReal estate investments
Income properties (Note 2) $ 4,543,515 $ 4,419,473
Properties under development (Note 4) 377,714 390,160
Mortgages and loans receivable (Note 6) 206,147 210,564
5,127,376 5,020,197
Receivables and other assets (Note 7) 146,204 105,322
Cash and short term investments 57,137 124,537
$ 5,330,717 $ 5,250,056
LiabilitiesMortgages payable (Note 8) $ 2,326,348 $ 2,251,506
Debentures payable (Note 9) 874,435 983,742
Accounts payable and other liabilities (Note 10) 185,106 193,076
Future income taxes (Note 16) 149,000 144,000
3,534,889 3,572,324
Unitholders’ EquityUnitholders’ equity 1,795,828 1,677,732
$ 5,330,717 $ 5,250,056
The accompanying notes are an integral part of the consolidated financial statements

Trust units (Note 11)
Balance, beginning of period $ 2,261,740 $ 2,178,378 $ 2,240,078 $ 1,976,868
Unit issue proceeds, net 164,605 22,559 186,070 223,844
Future income taxes (Note 16) 700 – 700 –
Value associated with unit option grants exercised 322 304 519 529
Balance, end of period 2,427,367 2,201,241 2,427,367 2,201,241
Value associated with unit option grants
Balance, beginning of period 7,665 4,665 6,882 4,185
Value associated with compensation expense for unit options granted 707 917 1,687 1,622
Value associated with unit option grants exercised (322) (304) (519) (529)
Balance, end of period 8,050 5,278 8,050 5,278
Cumulative earningsBalance, beginning of period 1,366,285 1,341,043 1,336,001 1,301,522
Transition adjustment –financial instruments – – – 2,121
Net earnings (loss) 44,926 (106,107) 75,210 (68,707)
Balance, end of period 1,411,211 1,234,936 1,411,211 1,234,936
Cumulative distributions to unitholders
Balance, beginning of period (1,976,628) (1,696,166) (1,905,229) (1,628,541)
Distributions to unitholders (74,172) (68,851) (145,571) (136,476)
Balance, end of period (2,050,800) (1,765,017) (2,050,800) (1,765,017)
Total unitholders' equity $ 1,795,828 $ 1,676,438 $ 1,795,828 $ 1,676,438
Units issued and outstanding (Note 11) 220,106 209,101 220,106 209,101
The accompanying notes are an integral part of the consolidated financial statements
For the three months ended June 30, For the six months ended June 30,2008 2007 2008 2007
RIO
CAN
REA
LES
TATE
INVE
STM
ENT
TRU
STSE
CON
DQ
UA
RTER
REPO
RT20
08
4
Consol ida ted S t a t ement s o f U ni t ho l der s ’ Equi ty
(unaudited – in thousands)
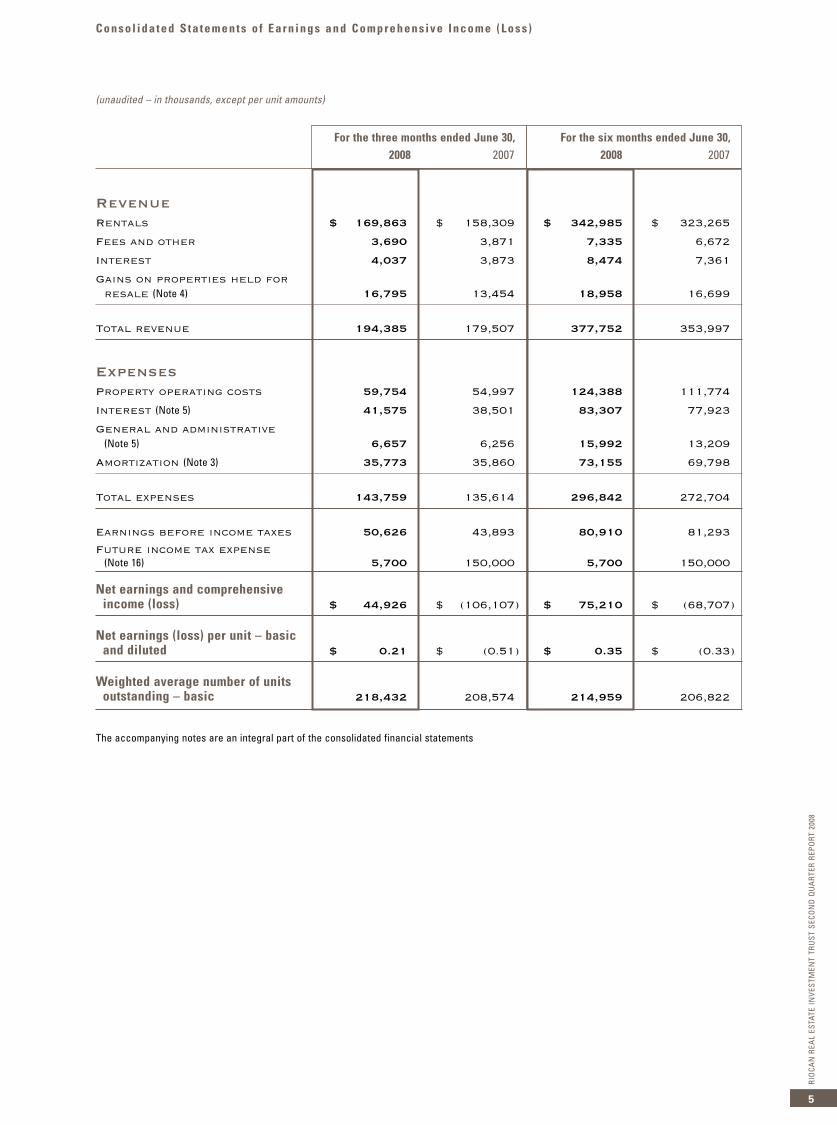
RevenueRentals $ 169,863 $ 158,309 $ 342,985 $ 323,265
Fees and other 3,690 3,871 7,335 6,672
Interest 4,037 3,873 8,474 7,361
Gains on properties held for resale (Note 4) 16,795 13,454 18,958 16,699
Total revenue 194,385 179,507 377,752 353,997
ExpensesProperty operating costs 59,754 54,997 124,388 111,774
Interest (Note 5) 41,575 38,501 83,307 77,923
General and administrative (Note 5) 6,657 6,256 15,992 13,209
Amortization (Note 3) 35,773 35,860 73,155 69,798
Total expenses 143,759 135,614 296,842 272,704
Earnings before income taxes 50,626 43,893 80,910 81,293 Future income tax expense
(Note 16) 5,700 150,000 5,700 150,000
Net earnings and comprehensive income (loss) $ 44,926 $ (106,107) $ 75,210 $ (68,707)
Net earnings (loss) per unit – basic and diluted $ 0.21 $ (0.51) $ 0.35 $ (0.33)
Weighted average number of units outstanding – basic 218,432 208,574 214,959 206,822
The accompanying notes are an integral part of the consolidated financial statements
RIO
CAN
REA
LES
TATE
INVE
STM
ENT
TRU
STSE
CON
DQ
UA
RTER
REPO
RT20
08
5
Consol ida ted S t a t ement s o f Ear n i ngs and Com prehensive Incom e (Loss )
(unaudited – in thousands, except per unit amounts)
For the three months ended June 30, For the six months ended June 30,2008 2007 2008 2007

(unaudited – in thousands, except per unit amounts)
For the three months ended June 30, For the six months ended June 30,2008 2007 2008 2007
Consol ida ted S t a t ement s o f C ash F l ow s
Cash Flows Provided By (Used In):Operating activities
Net earnings (loss) $ 44,926 $ (106,107) $ 75,210 $ (68,707)Items not affecting cash
Amortization 36,136 36,167 74,631 70,393
Recognition of rents on a straight-line basis (1,745) (1,733) (3,438) (3,174)Amortization of the differential between
contractual and market rents on in-place leases (579) (150) (1,213) (369)
Future income tax expense 5,700 150,000 5,700 150,000
Properties held for resale 62,994 4,231 81,818 4,643 Acquisition and development of properties held
for resale (27,274) (22,576) (41,944) (33,253)Changes in non-cash operating items and other
(Note 15) (1,225) (8,779) (29,986) (21,105)
Cash flows provided by operating activities 118,933 51,053 160,778 98,428
Investing activitiesAcquisition of income properties and properties
under development (55,839) (35,477) (65,275) (190,748)Capital expenditures on properties under
development and income properties (46,316) (34,339) (84,036) (65,381)
Tenant installation costs (3,822) (5,570) (8,617) (9,812)
Mortgages and loans receivable
Advances (55,854) (17,487) (71,622) (25,526)
Repayments 30,601 700 59,836 1,643
Proceeds on sale of investments – 7,960 – 3,777
Cash flows used in investing activities (131,230) (84,213) (169,714) (286,047)
Financing activities
Mortgages payable
Borrowings 143,308 51,703 203,393 202,181
Repayments (104,538) (83,823) (193,394) (153,525)Advances drawn (repayments made)
against line of credit (84,734) 27,121 – 27,121
Repayment of debentures payable – – (110,000) –
Distributions paid (73,256) (68,734) (144,534) (135,528)
Units issued under distribution reinvestment plan 17,820 17,412 36,733 33,874
Issue of units 146,786 5,147 149,338 168,969
Cash flows provided by (used in) financing activities 45,386 (51,174) (58,464) 143,092
Increase (decrease) in cash and equivalents 33,089 (84,334) (67,400) (44,527)
Cash and equivalents, beginning of period 24,048 86,910 124,537 47,103
Cash and equivalents, end of period $ 57,137 $ 2,576 $ 57,137 $ 2,576
Supplemental cash flow informationAcquisition of real estate investments
through assumption of liabilities $ 54,412 $ – $ 80,577 $ 65,028 Acquisition of real estate investments through
issuance of exchangeable limited partnership units – – – 21,000
Mortgages and loans taken back on property dispositions (306) (10,031) (306) (11,511)
Interest paid 38,169 36,260 94,569 85,990
Cash equivalents, end of period 43,000 – 43,000 –
Distributions to unitholders per unit 0.3375 0.3300 0.6750 0.6600
The accompanying notes are an integral part of the consolidated financial statementsRIO
CAN
REA
LES
TATE
INVE
STM
ENT
TRU
STSE
CON
DQ
UA
RTER
REPO
RT20
08
6

Notes to Consol i da t ed F i nanci a l S t a t ements
1. Significant Accounting Policies
(a) Basis of accounting
RioCan Real Estate Investment Trust’s (the “Trust” or “RioCan”) unaudited interim consolidated financial statementshave been prepared in accordance with Canadian generally accepted accounting principles (“GAAP”) and areconsistent with the significant accounting policies reported in the Trust’s audited consolidated financial statementsfor the two years ended December 31, 2007 and 2006, except as described in Note 1 (b) below. Under GAAP,additional disclosures are required in annual financial statements; therefore, these unaudited consolidated interimfinancial statements should be read in conjunction with the Trust’s audited consolidated financial statements for thetwo years ended December 31, 2007 and 2006.
Certain comparative figures have been reclassified to conform to the current period's financial statement presentation.
(b) Changes in accounting policies
The Canadian Institute of Chartered Accountants (“CICA”) issued three new accounting standards that are effectivefor the Trust’s fiscal year commencing January 1, 2008: Section 1535, Capital Disclosures; Section 3862, FinancialInstruments – Disclosures; and Section 3863, Financial Instruments – Presentation.
Section 1535 includes required disclosures of an entity’s objectives, policies and processes for managing capital,and quantitative data about what the entity regards as capital (Note 18).
Sections 3862 and 3863 replace the existing Section 3861, Financial Instruments – Disclosure and Presentation.These new sections revise and enhance disclosure requirements, and carry forward unchanged existingpresentation requirements. These new sections require disclosures about the nature and extent of risks arising fromfinancial instruments and how the entity manages those risks (Note 19).
The new standards have no impact on the classification and valuation of the Trust’s financial instruments.
(c) Future accounting changes
The CICA has issued a new accounting standard, Section 3064, Goodwill and Intangible Assets, which clarifies thatcosts can be capitalized only when they relate to an item that meets the definition of an asset. The Trust is in theprocess of evaluating the impact of this standard on its consolidated financial statements. Section 1000, FinancialStatement Concepts, was also amended to provide consistency with this new standard. The new and amendedstandards will be effective for the Trust’s 2009 fiscal year, and will be adopted on a retroactive basis withrestatement of the prior years.
2. Income PropertiesNet
Accumulated carryingJune 30, 2008 Cost amortization amount
Land $ 1,063,875 $ – $ 1,063,875
Buildings 3,590,578 (433,129) 3,157,449
Leasing costs 261,298 (70,886) 190,412
Intangible assets 163,829 (41,385) 122,444
Equity investments in properties 9,335 – 9,335
$ 5,088,915 $ (545,400) $ 4,543,515
(unaudited – tabular amounts in thousands, except per unit amounts and other data)
As at June 30, 2008
RIO
CAN
REA
LES
TATE
INVE
STM
ENT
TRU
STSE
CON
DQ
UA
RTER
REPO
RT20
08
7
Notes to Consol i da t ed F i nanci a l S t a t ementsRI
OCA
NRE
AL
ESTA
TEIN
VEST
MEN
TTR
UST
SECO
ND
QU
ART
ERRE
PORT
2008
8
Net Accumulated carrying
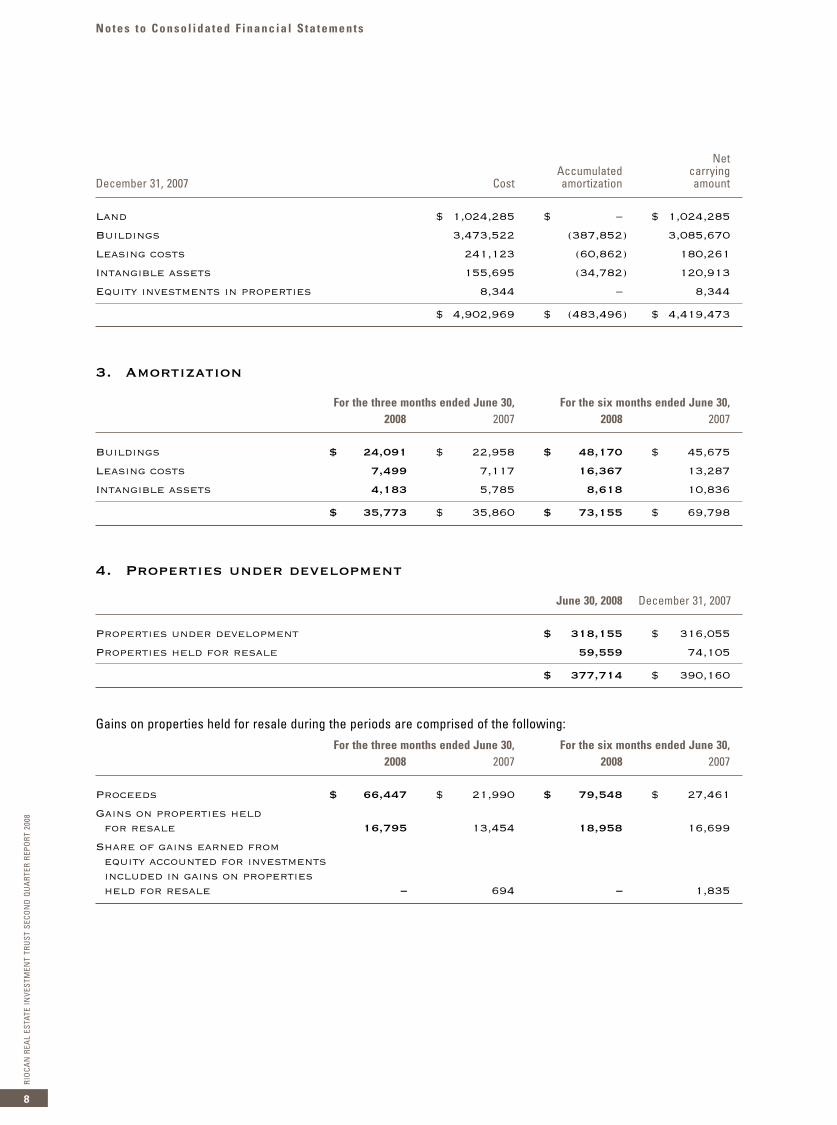
December 31, 2007 Cost amortization amount
Land $ 1,024,285 $ – $ 1,024,285
Buildings 3,473,522 (387,852) 3,085,670
Leasing costs 241,123 (60,862) 180,261
Intangible assets 155,695 (34,782) 120,913
Equity investments in properties 8,344 – 8,344
$ 4,902,969 $ (483,496) $ 4,419,473
3. Amortization
For the three months ended June 30, For the six months ended June 30,2008 2007 2008 2007
Buildings $ 24,091 $ 22,958 $ 48,170 $ 45,675
Leasing costs 7,499 7,117 16,367 13,287
Intangible assets 4,183 5,785 8,618 10,836
$ 35,773 $ 35,860 $ 73,155 $ 69,798
4. Properties under development
June 30, 2008 December 31, 2007
Properties under development $ 318,155 $ 316,055
Properties held for resale 59,559 74,105
$ 377,714 $ 390,160
Gains on properties held for resale during the periods are comprised of the following:
For the three months ended June 30, For the six months ended June 30,2008 2007 2008 2007
Proceeds $ 66,447 $ 21,990 $ 79,548 $ 27,461
Gains on properties held for resale 16,795 13,454 18,958 16,699
Share of gains earned from equity accounted for investments included in gains on properties held for resale – 694 – 1,835

Notes to Consol i da t ed F i nanci a l S t a t ements
5. Capitalization of Carrying Costs
For the three months ended June 30, For the six months ended June 30,2008 2007 2008 2007
Interest
Interest expense $ 45,751 $ 43,309 $ 92,287 $ 86,698
Capitalized to real estate investments (4,176) (4,808) (8,980) (8,775)
Net interest expense $ 41,575 $ 38,501 $ 83,307 $ 77,923
General and administrative
General and administrative expense $ 7,128 $ 7,062 $ 17,044 $ 14,474
Capitalized to real estate investments (471) (806) (1,052) (1,265)
Net general and administrative expense $ 6,657 $ 6,256 $ 15,992 $ 13,209
6. Mortgages and Loans Receivable
At June 30, 2008 mortgages and loans receivable bear interest at effective rates ranging between 4.09% and 8%(contractual rates between 0% and 8%) per annum with a weighted average quarter end rate of 6.44% (contractualrate of 6.09%) per annum, and mature between 2008 and 2015. Future repayments are as follows:
For the year ending December 31: 2008 (i) $ 121,216
2009 41,427
2010 9,792
2011 13,488
Thereafter 20,801
Contractual mortgages and loans receivable 206,724
Unamortized differential between contractual and market interest rates on mortgages and loans receivable (577)
$ 206,147
(i) The 2008 principal maturities include $75,510,000 of mortgages and loans receivable that are due on demand. RI
OCA
NRE
AL
ESTA
TEIN
VEST
MEN
TTR
UST
SECO
ND
QU
ART
ERRE
PORT
2008
9
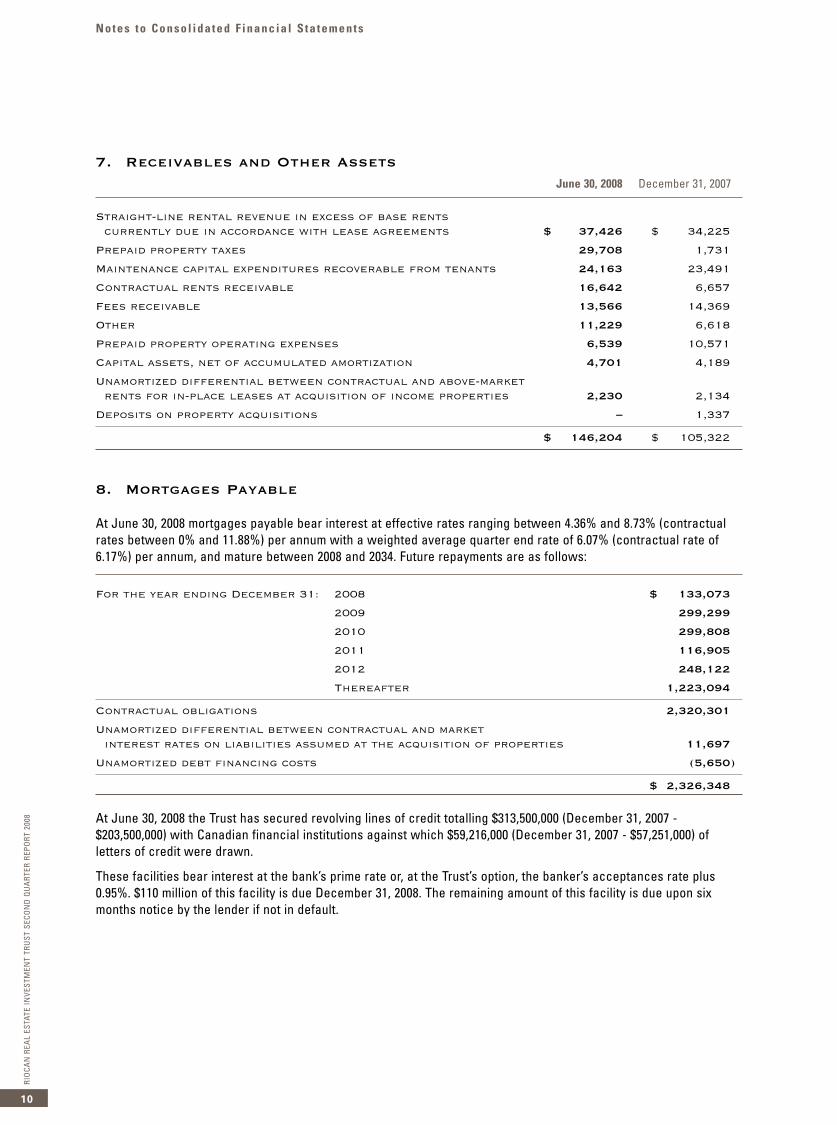
7. Receivables and Other AssetsJune 30, 2008 December 31, 2007
Straight-line rental revenue in excess of base rents currently due in accordance with lease agreements $ 37,426 $ 34,225
Prepaid property taxes 29,708 1,731
Maintenance capital expenditures recoverable from tenants 24,163 23,491
Contractual rents receivable 16,642 6,657
Fees receivable 13,566 14,369
Other 11,229 6,618
Prepaid property operating expenses 6,539 10,571
Capital assets, net of accumulated amortization 4,701 4,189
Unamortized differential between contractual and above-market rents for in-place leases at acquisition of income properties 2,230 2,134
Deposits on property acquisitions – 1,337
$ 146,204 $ 105,322
8. Mortgages Payable
At June 30, 2008 mortgages payable bear interest at effective rates ranging between 4.36% and 8.73% (contractualrates between 0% and 11.88%) per annum with a weighted average quarter end rate of 6.07% (contractual rate of6.17%) per annum, and mature between 2008 and 2034. Future repayments are as follows:
For the year ending December 31: 2008 $ 133,073
2009 299,299
2010 299,808
2011 116,905
2012 248,122
Thereafter 1,223,094
Contractual obligations 2,320,301
Unamortized differential between contractual and market interest rates on liabilities assumed at the acquisition of properties 11,697
Unamortized debt financing costs (5,650)
$ 2,326,348
At June 30, 2008 the Trust has secured revolving lines of credit totalling $313,500,000 (December 31, 2007 -$203,500,000) with Canadian financial institutions against which $59,216,000 (December 31, 2007 - $57,251,000) ofletters of credit were drawn.
These facilities bear interest at the bank’s prime rate or, at the Trust’s option, the banker’s acceptances rate plus0.95%. $110 million of this facility is due December 31, 2008. The remaining amount of this facility is due upon sixmonths notice by the lender if not in default.
Notes to Consol i da t ed F i nanci a l S t a t ementsRI
OCA
NRE
AL
ESTA
TEIN
VEST
MEN
TTR
UST
SECO
ND
QU
ART
ERRE
PORT
2008
10

Notes to Consol i da t ed F i nanci a l S t a t ements
9. Debentures Payable
The Trust had the following series of debentures outstanding:
(i) $110,000,000 Series D senior unsecured, maturity on September 21, 2009, bearing contractual interest at 5.29%per annum, and payable semi-annually.
(ii) $200,000,000 Series F senior unsecured, maturity on March 8, 2011, bearing contractual interest at 4.91% perannum, and payable semi-annually.
(iii) $150,000,000 Series G senior unsecured, maturity on March 11, 2013, bearing contractual interest at 5.23% perannum, and payable semi-annually.
(iv) $100,000,000 Series H senior unsecured, maturity on June 15, 2012, bearing contractual interest at 4.70% perannum, and payable semi-annually.
(v) $100,000,000 Series I senior unsecured, maturity on February 6, 2026, bearing contractual interest at 5.953% perannum, and payable semi-annually.
(vi) $100,000,000 Series J senior unsecured, maturity on March 24, 2010, bearing contractual interest at 4.938% perannum, and payable semi-annually.
(vii) $120,000,000 Series K senior unsecured, maturity on September 11, 2012, bearing contractual interest at 5.70%per annum, and payable semi-annually.
On January 4, 2008 the Trust repaid the $110,000,000 Series E debentures payable at their maturity.
At June 30, 2008 debentures payable bear interest at a weighted average quarter end effective rate of 5.49%(contractual rate of 5.22%) per annum. Future repayments are as follows:
For the year ending December 31: 2009 $ 110,000
2010 100,000
2011 200,000
2012 220,000
Thereafter 250,000
Contractual obligations 880,000
Unamortized debt financing costs (5,565)
$ 874,435
RIO
CAN
REA
LES
TATE
INVE
STM
ENT
TRU
STSE
CON
DQ
UA
RTER
REPO
RT20
08
11

10. Accounts Payable and Other Liabilities June 30, 2008 December 31, 2007
Development costs and other capital expenditures $ 49,084 $ 62,197
Interest on mortgages and debentures payable 24,744 27,078
Distributions to unitholders 24,669 23,631
Property operating costs 22,212 24,761
Property taxes 19,047 5,367
Deferred income 17,019 16,378
Unamortized differential between contractual and below-market rents for in-place leases at acquisition of income properties 11,892 12,463
Tenant installation costs 7,064 8,461
Other 5,640 9,467
Employee pension benefits (Note 13) 3,037 2,694
Trustees’ restricted equity unit plan (Note 12) 698 579
$ 185,106 $ 193,076
11. Trust Units
For the six months ended June 30 2008 2007
Units $ Units $
Units outstanding, beginning of period 211,966 $ 2,261,740 208,043 $ 2,178,378
Units issued:
Public offering 7,130 150,087 – –
Distribution reinvestment and direct purchase plans 860 17,834 704 17,427
Unit option plan 150 2,933 354 5,240
Value associated with unit option grants exercised – 322 – 304
Unit issue costs – (6,249) – (108)
Future income taxes (Note 16) – 700 – –
Units outstanding, end of period 220,106 $ 2,427,367 209,101 $ 2,201,241
Notes to Consol i da t ed F i nanci a l S t a t ementsRI
OCA
NRE
AL
ESTA
TEIN
VEST
MEN
TTR
UST
SECO
ND
QU
ART
ERRE
PORT
2008
12

For the six months ended June 30 2008 2007
Units $ Units $
Units outstanding, beginning of period 210,883 $ 2,240,078 199,647 $ 1,976,868
Units issued:
Public offering 7,130 150,087 6,600 166,650
Exchangeable limited partnership units (i) – – 829 21,000
Distribution reinvestment and direct purchase plans 1,801 36,762 1,378 34,007
Unit option plan 292 5,487 647 9,381
Value associated with unit option grants exercised – 519 – 529
Unit issue costs – (6,266) – (7,194)
Future income taxes (Note 16) – 700 – –
Units outstanding, end of period 220,106 $ 2,427,367 209,101 $ 2,201,241
(i) RioCan acquired an income property for consideration including the issuance to the vendors of exchangeablelimited partnership units (“LP units”). RioCan is the general partner of the limited partnership. The LP units areentitled to distributions equivalent to distributions on RioCan units, must be exchanged for RioCan units on aone-for-one basis, and are exchangeable at any time at the option of the holder. No LP units have beenexchanged by the vendors for RioCan units.
12. Unit Based Compensation Plans
(i) Incentive unit option plan
The Trust’s incentive unit option plan (the “plan”) provides for option grants to a maximum of 19,200,000 units.At June 30, 2008: 10,164,000 unit options were granted and exercised; 5,850,000 unit options were granted and remain outstanding; and 3,186,000 unit options remain available for issuance. Each option has an exerciseprice equal to the closing price of the Trust’s units at the date prior to the day the option is granted and anoption’s maximum term is 10 years. All options granted through December 31, 2003 vest at 20% per annum fromthe grant date, becoming fully vested after four years. All options granted after December 31, 2003 vest at 25%per annum commencing on the first anniversary of the grant, becoming fully vested after four years.
A summary of unit options granted under the plan at June 30, 2008 and 2007 is as follows:
For the three months ended June 30 2008 2007
Weighted average Weighted averageOptions Units exercise price Units exercise price
Outstanding, beginning of period 5,100 $ 20.63 4,549 $ 18.83
Granted 1,000 21.19 860 26.35
Exercised (150) 19.56 (355) 14.77
Forfeited (100) (26.35) – –
Outstanding, end of period 5,850 $ 20.65 5,054 $ 20.40
Options exercisable at end of period 2,548 $ 18.51 1,782 $ 16.87
Weighted average fair value per unit of options granted during the period $ 1.72 $ 2.83
Notes to Consol i da t ed F i nanci a l S t a t ements
RIO
CAN
REA
LES
TATE
INVE
STM
ENT
TRU
STSE
CON
DQ
UA
RTER
REPO
RT20
08
13

For the six months ended June 30 2008 2007
Weighted average Weighted averageOptions Units exercise price Units exercise price
Outstanding, beginning of period 4,867 $ 20.62 4,342 $ 17.80
Granted 1,575 21.17 1,360 25.88
Exercised (292) 18.79 (648) 14.47
Forfeited (300) 24.62 – –
Outstanding, end of period 5,850 $ 20.65 5,054 $ 20.40
Options exercisable at end of period 2,548 $ 18.51 1,782 $ 16.87
Weighted average fair value per unit of options granted during the period $ 1.75 $ 2.69
The Trust accounts for its unit based compensation plan using the fair value method, under whichcompensation expense is measured at the grant date and recognized over the vesting period. Unit basedcompensation expense and assumptions utilized in the calculation thereof using the Black-Scholes Model foroption valuation are as follows:
For the three months ended June 30, For the six months ended June 30,2008 2007 2008 2007
Unit based compensation expense $ 707 $ 917 $ 1,687 $ 1,624
Unit options granted 1,000 860 1,575 1,360
Unit option holding period
(years) 7 7 7 7
Volatility rate 19.0% 16.7% 18.7% 16.6%
Distribution yield 6.4% 5.1% 6.4% 5.0%
Risk free interest rate 3.3% 4.1% 3.6% 4.0%
(ii) Trustees’ restricted equity unit plan
The restricted equity unit plan provides for an allotment of restricted equity units (“REUs”) to each non-employee trustee (“member”). The value of REUs allotted appreciate or depreciate with increases ordecreases in the market price of the Trust’s units. Members are also entitled to be credited with REUs fordistributions paid in respect of units of the Trust based on an average market price of the units. REUs vest and are settled three years from the date of issue by a cash payment equal to the number of vested REUscredited to the member based on an average market price of the Trust’s units at the settlement date. At June 30, 2008 accounts payable and other liabilities included accrued compensation costs relating to the REUs of $698,000 (December 31, 2007 - $579,000).
Notes to Consol i da t ed F i nanci a l S t a t ementsRI
OCA
NRE
AL
ESTA
TEIN
VEST
MEN
TTR
UST
SECO
ND
QU
ART
ERRE
PORT
2008
14
Notes to Consol i da t ed F i nanci a l S t a t ements
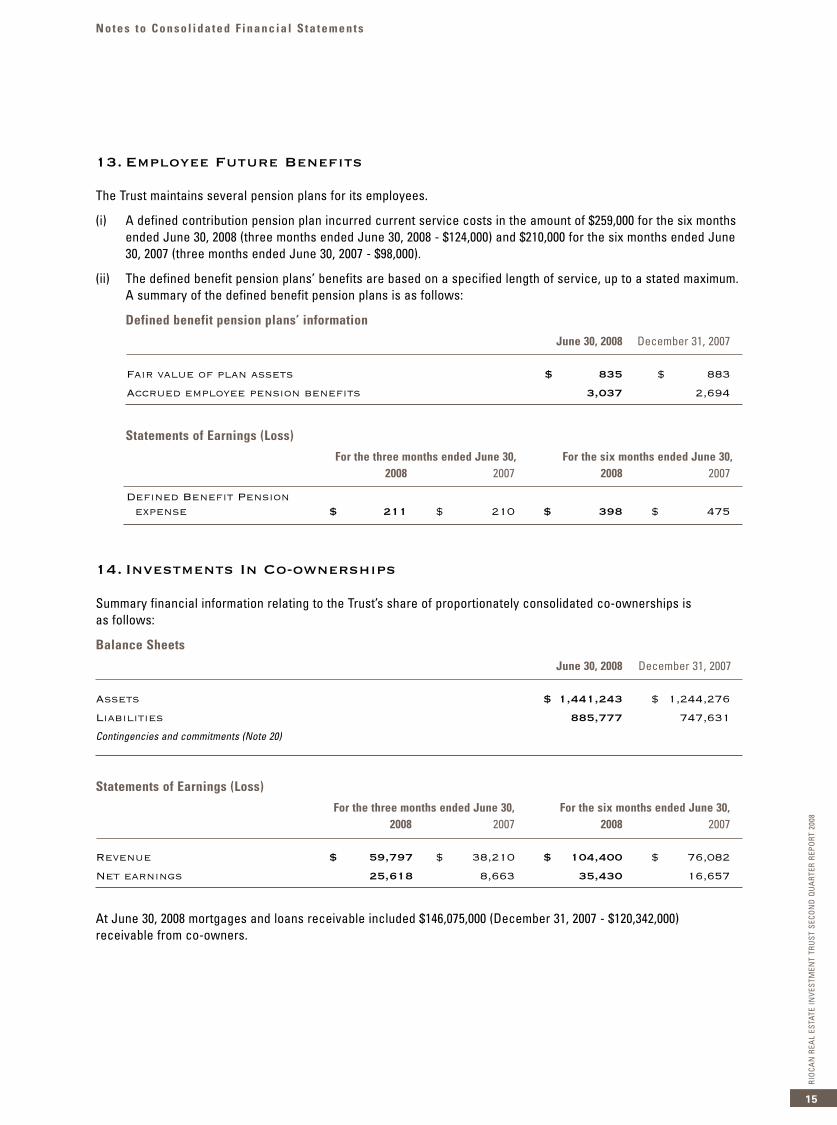
13. Employee Future Benefits
The Trust maintains several pension plans for its employees.
(i) A defined contribution pension plan incurred current service costs in the amount of $259,000 for the six monthsended June 30, 2008 (three months ended June 30, 2008 - $124,000) and $210,000 for the six months ended June30, 2007 (three months ended June 30, 2007 - $98,000).
(ii) The defined benefit pension plans’ benefits are based on a specified length of service, up to a stated maximum.A summary of the defined benefit pension plans is as follows:
Defined benefit pension plans’ information
June 30, 2008 December 31, 2007
Fair value of plan assets $ 835 $ 883
Accrued employee pension benefits 3,037 2,694
Statements of Earnings (Loss)
For the three months ended June 30, For the six months ended June 30,2008 2007 2008 2007
Defined Benefit Pension expense $ 211 $ 210 $ 398 $ 475
14. Investments In Co-ownerships
Summary financial information relating to the Trust’s share of proportionately consolidated co-ownerships is as follows:
Balance Sheets
June 30, 2008 December 31, 2007
Assets $ 1,441,243 $ 1,244,276
Liabilities 885,777 747,631
Contingencies and commitments (Note 20)
Statements of Earnings (Loss)
For the three months ended June 30, For the six months ended June 30,2008 2007 2008 2007
Revenue $ 59,797 $ 38,210 $ 104,400 $ 76,082
Net earnings 25,618 8,663 35,430 16,657
At June 30, 2008 mortgages and loans receivable included $146,075,000 (December 31, 2007 - $120,342,000)receivable from co-owners.
RIO
CAN
REA
LES
TATE
INVE
STM
ENT
TRU
STSE
CON
DQ
UA
RTER
REPO
RT20
08
15

15. Changes in Non-cash Operating Items and Other
Cash flows provided by (used in)
For the three months ended June 30, For the six months ended June 30,2008 2007 2008 2007
Amounts receivable $ 2,260 $ 4,629 $ (8,880) $ 95
Prepaid expenses and other assets (17,423) (15,823) (29,316) (25,878)
Accounts payable and other liabilities 13,283 5,122 7,806 4,113
Other 655 (2,707) 404 565
$ (1,225) $ (8,779) $ (29,986) $ (21,105)
16. Income Taxes
The Trust currently qualifies as a mutual fund trust for income tax purposes. The Trust is required by its Declarationof Trust (“Declaration”) to distribute all of its taxable income to unitholders and is entitled to deduct suchdistributions for income tax purposes. Accordingly, no provision for current income taxes payable is required.
Future income taxes are accounted for using the liability method. This method requires the Trust to: (i) determine itstemporary differences; (ii) determine the periods over which those temporary differences are expected to reverse;and (iii) apply the tax rates enacted at the balance sheet date that will apply in the periods those temporarydifferences are expected to reverse.
Bill C-52, the Budget Implementation Act, 2007 (“Bill C-52”) received Royal Assent on June 22, 2007. Bill C-52 is notexpected to apply to RioCan until 2011 as it provides for a transition period for publicly traded entities that existedprior to November 1, 2006. Bill C-52 will not apply to impose a tax on an entity that meets specific definedrequirements under the legislation for the real estate investment trust exemption (the “REIT Exemption”). RioCanintends to take the necessary steps to qualify for the REIT Exemption prior to 2011.
Where an entity does not qualify for the REIT Exemption certain distributions will not be deductible by that entity incomputing its income for tax purposes. As a result, the entity will be subject to tax at a rate substantially equivalentto the general corporate income tax rate. Distributions paid in excess of taxable income will continue to be treatedas a return of capital to unitholders.
GAAP requires RioCan to recognize future income tax assets and liabilities based on temporary differencesexpected to reverse after January 1, 2011, and on the basis of its structure at the balance sheet date. GAAP doesnot permit the Trust to consider future changes to its structure that it will make to enable it to qualify for the REITExemption. The impact (including the reversal of the Trust’s future income taxes set out below) of any changesundertaken by the Trust to qualify for the REIT Exemption will not be recognized in the financial statements untilsuch time as it so qualifies.
Components of future income taxes on the Balance Sheets
June 30, 2008 December 31, 2007
Tax effected temporary differences betweenaccounting and tax basis of:
Real estate investments $ 145,000 $ 139,000
Other 4,000 5,000
Future income taxes $ 149,000 $ 144,000
Notes to Consol i da t ed F i nanci a l S t a t ementsRI
OCA
NRE
AL
ESTA
TEIN
VEST
MEN
TTR
UST
SECO
ND
QU
ART
ERRE
PORT
2008
16

Notes to Consol i da t ed F i nanci a l S t a t ements
For the three months ended June 30, For the six months ended June 30,2008 2007 2008 2007
Statements of Earnings (Loss)Current income taxes at
Canadian statutory tax rate $ – $ – $ – $ –
Increase in future income taxes resulting from a change in tax status with enactment of Bill C-52 on June 22, 2007 – 150,000 – 150,000
Increase in future income taxes resulting from a change during the period in temporary differences expected to reverse after 2010 5,700 – 5,700 –
Future income tax expense $ 5,700 $ 150,000 $ 5,700 $ 150,000
Statements of Unitholders' EquityImpact of future income
taxes resulting from a change during the period in temporarydifferences from unit issue costs expected to reverse after 2010 $ (700) $ – $ (700) $ –
17. Segmented Disclosures and Additional Information
The Trust owns, develops and operates shopping centres located in Canada. Management, in measuring the Trust’sperformance, does not distinguish or group its operations on a geographical or other basis. Accordingly, the Trusthas a single reportable segment for disclosure purposes in accordance with GAAP.
No single tenant accounts for 10% or more of the Trust’s rental revenue.
Additional information on the Trust’s activities in Canadian provinces providing more than 10% of rental revenue andnet carrying amount of income properties is as follows:
Rental revenue for the three Rental revenue for the sixmonths ended June 30, months ended June 30,
Province 2008 2007 2008 2007
Ontario $ 105,238 $ 98,924 $ 213,325 $ 199,862
Quebec 30,195 25,805 60,073 56,624
Alberta 17,329 16,098 34,841 32,024
All others 17,101 17,482 34,746 34,755
$ 169,863 $ 158,309 $ 342,985 $ 323,265
RIO
CAN
REA
LES
TATE
INVE
STM
ENT
TRU
STSE
CON
DQ
UA
RTER
REPO
RT20
08
17

Net carrying amount of income properties as at Province June 30, 2008 December 31, 2007
Ontario $ 2,787,922 $ 2,719,375
Quebec 797,434 762,795
Alberta 487,930 472,060
All others 470,229 465,243
$ 4,543,515 $ 4,419,473
18. Capital Management
The Trust defines capital as the aggregate of unitholders’ equity and debt. The Trust’s capital managementframework is designed to maintain a level of capital that: complies with investment and debt restrictions pursuant toRioCan’s Declaration; complies with existing debt covenants; enables the Trust to achieve target credit ratings;funds its business strategies; and builds long-term unitholder value. The key elements of RioCan’s capitalmanagement framework are approved by its unitholders as related to the Trust’s Declaration and by its Board ofTrustees (“Board”) through their annual review of the Trust’s strategic plan and budget, supplemented by periodicBoard and Board Committee meetings. Capital adequacy is monitored by the Trust by assessing performance againstthe approved annual plan throughout the year, which is updated accordingly, and by monitoring adherence toinvestment and debt restrictions contained in the Declaration and debt covenants.
RioCan’s Declaration provides for maximum total debt levels up to 60% of Aggregate Assets (herein referred to as“Debt to Aggregate Assets ratio” with Aggregate Assets defined in the Declaration as total assets plus accumulatedamortization of income properties as recorded by the Trust and calculated in accordance with GAAP). As incomeproperties are not defined in the Declaration or in GAAP, RioCan considers income properties to include thosecomponents in Note 2, with certain exceptions. As a matter of policy, RioCan would not likely incur indebtednesssignificantly beyond 58% of Aggregate Assets.
Additionally, RioCan’s Declaration contains provisions that have the effect of limiting capital expended by the Trustfor, among other items, the following:
• Direct and indirect investments (net of related mortgages payable) in non-income producing properties(including greenfield developments and mortgages receivable to fund the Trust’s co-owners’ share of suchdevelopments) to no more than 15% of the Adjusted Unitholders’ Equity of the Trust (herein referred to as the“Basket ratio” with Adjusted Unitholders’ Equity defined in the Declaration as total unitholders’ equity plusaccumulated amortization of income properties as recorded by the Trust and calculated in accordance withGAAP). The Trust is in compliance with this restriction;
• Total investment by the Trust in mortgages receivable, other than mortgages taken back by the Trust on thesale of its properties, to no more than 30% of the Adjusted Unitholders’ Equity of the Trust. The Trust is incompliance with this restriction;
• Any property acquired by the Trust, directly or indirectly, if the cost to the Trust of such acquisition (net of theamount of mortgages payable assumed) exceeds 10% of the Adjusted Unitholders’ Equity of the Trust. The Trustis in compliance with this restriction;
• Subject to the Basket ratio, securities of an entity other than to the extent that such securities would, for the purposeof the Declaration, constitute an investment in real estate. The Trust is in compliance with this restriction; and
• The amount of space which can be leased or subleased to any tenant, with certain exceptions, to a maximumspace having an aggregate gross leasable area of 20% of the aggregate gross leasable area of all real estateinvestments held by the Trust. The Trust is in compliance with this restriction.
Notes to Consol i da t ed F i nanci a l S t a t ementsRI
OCA
NRE
AL
ESTA
TEIN
VEST
MEN
TTR
UST
SECO
ND
QU
ART
ERRE
PORT
2008
18

Notes to Consol i da t ed F i nanci a l S t a t ements
The Trust’s Declaration also requires it to distribute to its unitholders in each year an amount not less than theTrust’s income for the year, as calculated in accordance with the Income Tax Act (Canada) (the “Act”) after allpermitted deductions under the Act have been taken. RioCan’s trustees rely upon forward looking cash flowinformation including forecasts and budgets to establish the level of cash distributions.
The Trust’s debentures have covenants that are consistent with the Debt to Aggregate Assets ratio as discussedabove, with maintenance of at least $1 billion of Adjusted Book Equity (defined as unitholders’ equity plusaccumulated building amortization calculated in accordance with GAAP), and maintenance of at least an interestcoverage ratio of 1.65 times. Interest coverage is defined as GAAP net earnings for a rolling twelve month period,before net interest expense, income taxes and income property amortization (including provisions for impairment)divided by total interest expense.
IncreaseJune 30, 2008 December 31, 2007 (decrease)
Capital
Mortgages payable (Note 8) $ 2,326,348 $ 2,251,506 $ 74,842
Debentures payable (Note 9) 874,435 983,742 (109,307)
Unitholders’ equity 1,795,828 1,677,732 118,096
Total capital $ 4,996,611 $ 4,912,980 $ 83,631
Debt to aggregate assets ratio 54.5% 56.3% (1.8%)
Basket ratio 9.7% 6.0% 3.7%
For the twelve month period ended June 30 2008 2007 Decrease
Interest coverage ratio 2.6 2.7 (0.1)
The period over period decrease for the Debt to Aggregate Assets ratio primarily arises as a result of the issuanceby the Trust of 7,130,000 units in April 2008.
The period over period increase in the Basket ratio is consistent with new non-income producing developmentproperties acquired, and development expenditures incurred on such development projects, by RioCan during the period.
The period over period decrease in the interest coverage ratio arises as a result of increased aggregateindebtedness during the periods which proceeds were partially used to fund the Trust’s ongoing developmentpipeline, which is not yet income producing.
19. Financial Instruments
(i) Fair value of financial instruments
The Trust’s amounts receivable, mortgages and loans receivable, cash and short term investments, guarantees,and accounts payable and other liabilities are substantially carried at amortized cost, which approximates fairvalue. The fair value of other financial instruments is based upon discounted future cash flows using discountrates that reflect current market conditions for instruments with similar terms and risks. Such fair value estimatesare not necessarily indicative of the amounts the Trust might pay or receive in actual market transactions.Potential transaction costs have also not been considered in estimating fair value.
RIO
CAN
REA
LES
TATE
INVE
STM
ENT
TRU
STSE
CON
DQ
UA
RTER
REPO
RT20
08
19

June 30, 2008 December 31, 2007
Carrying Fair Carrying Fair value value value value
Mortgages payable $ 2,326,348 $ 2,351,403 $ 2,251,506 $ 2,316,954
Debentures payable 874,435 835,138 983,742 957,165
(ii) Risk management
The main risks arising from the Trust’s financial instruments are credit, interest and liquidity risk. The Trust’sapproach to managing these risks is summarized below.
(a) Credit risk
Credit risk arises from the possibility that tenants may experience financial difficulty and be unable to fulfilltheir lease commitments. Further risks arise in the event that borrowers default on the repayment of theirmortgages to the Trust.
As discussed in Note 18, RioCan’s Declaration contains provisions that have the effect of limiting theamount of space which can be leased to one tenant and its investment in mortgages receivable.
Additionally, the Trust mitigates tenant credit risk through geographical diversification (Note 17), staggered lease maturities, diversification of revenue sources resulting from a large tenant base, avoidingdependence on any single tenant by ensuring no individual tenant contributes a significant percentage ofthe Trust’s gross revenue, ensuring a considerable portion of the Trust’s revenue is earned from nationaland anchor tenants, and conducting credit assessments for new tenants.
As at June 30, 2008:
• Minimum annualized rentals (exclusive of recoverable property operating costs and taxes) fortenant leases expiring in each of the next five years ending December 31 are as follows: 2008 –$15,636,000; 2009 – $40,621,000; 2010 – $44,517,000; 2011 – $52,835,000; and 2012 – $43,666,000.
The above aggregate renewals over the next five years represent annual lease payments of$197,275,000 based on current contractual rental rates. Should such tenancies be released uponmaturity at an aggregate rental rate differential of 100 basis points, the Trust’s operations would beimpacted by approximately $2,000,000 annually.
• No individual tenant comprises more than 5.4% of the Trust’s annualized rental revenue ascompared to 5.7% for the comparative period of 2007.
• Approximately 83.5% of the Trust’s annualized rental revenue is derived from national and anchortenants (which tenant covenants are expected to be of higher credit quality than other tenants) ascompared to 82.6% for the comparative period of 2007.
(b) Interest rate and liquidity risks
The Trust is exposed to interest rate risk on its borrowings. Liquidity risk arises from the possibility of nothaving sufficient debt and equity capital available to the Trust to fund its growth program and refinance itsdebts as they mature. Given the relatively small size of the Canadian marketplace, there may come a pointin the future at which time accessing domestic capital may become more difficult.
As discussed in Note 18, RioCan’s Declaration establishes a Debt to Aggregate Assets ratio limit of 60%.
Additionally, the Trust mitigates interest rate and liquidity risk by staggering the maturity dates (see Notes8 and 9 for Aggregate Debt) of its long term debt and by limiting the use of floating rate debt.
Notes to Consol i da t ed F i nanci a l S t a t ementsRI
OCA
NRE
AL
ESTA
TEIN
VEST
MEN
TTR
UST
SECO
ND
QU
ART
ERRE
PORT
2008
20

Notes to Consol i da t ed F i nanci a l S t a t ements
As at June 30, 2008:
• The Trust’s Aggregate Debt has a 5.3 year weighted average term to maturity bearing interest at aweighted average contractual interest rate of 5.91% per annum;
• 1.3% of its Aggregate Debt is at floating interest rates as compared to 2.5% as at December 31, 2007;
• The Trust’s undrawn lines of credit are $254,000,000; and
• The Trust’s Debt to Aggregate Assets ratio is 54.5% and the Trust could, therefore, incur additionalindebtedness of approximately $813,000,000 and still not exceed the Debt to Aggregate Assets ratio limit of 60% (which additional borrowing calculation assumes that additional borrowings willbe used to add to RioCan’s asset base).
At June 30, 2008 the Trust has aggregate contractual debt principal maturities through toDecember 31, 2010 of $833,246,000 (26% of RioCan’s Aggregate Debt) with a weighted averagecontractual interest rate of 6.37%. Should such amounts be refinanced upon maturity at anaggregate interest rate differential of 100 basis points, the Trust’s operations would be impacted byapproximately $8,332,000 annually.
20. Contingencies and Commitments
(a) Guarantees
The Trust provides guarantees on behalf of third parties, including co-owners and partners. In addition, the Trust’sguarantees remain in place for certain debts assumed by purchasers in connection with property dispositions, andwill remain until such debts are extinguished or the lenders agree to release the Trust’s covenants. Recoursewould be available to the Trust under these guarantees in the event of a default by the borrowers, in which casethe Trust’s claim would be against the underlying real estate investments. At June 30, 2008 such guaranteesamount to approximately $534,000,000 and expire between 2008 and 2034. No liability in excess of the fair value of theguarantees has been recognized in these financial statements as the estimated fair value of the borrowers’ interestsin the real estate investments is greater than the mortgages payable for which the Trust provided guarantees.
(b) Contractual obligations on real estate investments
(i) In February 2008, the Trust completed the final closing of its acquisition of a 50% interest in a developmentproperty. At any time within three years after the final closing of this transaction, the vendor had the rightto sell the whole or part of its remaining 50% interest to the Trust at fair market value. In July 2008, thevendor released the Trust from this obligation.
(ii) The Trust has entered into an agreement to dispose of interests (ranging from 22.5% to 50%) in three realestate investments. These dispositions are being completed in stages as leasable area is occupied bytenants. The sale prices are determined by valuing such areas at predetermined multiples of net operatingincome, plus predetermined per square foot amounts for additional buildable density. At June 30, 2008 theestimated remaining selling prices under this agreement for the years ending December 31 are: 2008 -$15,800,000; and 2009 - $1,600,000.
(c) Litigation
The Trust is involved with litigation and claims which arise from time to time in the normal course of business.In the opinion of management, any liability that may arise from such contingencies will not have a significantadverse effect on its consolidated financial statements.
RIO
CAN
REA
LES
TATE
INVE
STM
ENT
TRU
STSE
CON
DQ
UA
RTER
REPO
RT20
08
21

Management ’s D i scuss i on and A nal ys i sRI
OCA
NRE
AL
ESTA
TEIN
VEST
MEN
TTR
UST
SECO
ND
QU
ART
ERRE
PORT
2008
22
The terms “RioCan”, “the Trust”, “we”, “us” and “our” in the following Management’s Discussion and Analysis(“MD&A”) refer to RioCan Real Estate Investment Trust and its consolidated financial position and results ofoperations for the three and six months ended June 30, 2008 and 2007. Our MD&A dated July 22, 2008 should beread in conjunction with our audited consolidated financial statements for the two years ended December 31, 2007and 2006, a copy of which can be obtained on SEDAR at www.sedar.com. Historical results and percentagerelationships contained in our interim and annual consolidated financial statements and MD&A, including trendswhich might appear, should not be taken as indicative of our future operations.
Advisory: Certain information included in this MD&A contains forward-looking statements within the meaning ofapplicable securities laws. These statements include, but are not limited to, statements made in “Vision andBusiness Strategy”, “Assets Profile”, “Capital Structure”, “Outlook”, and other statements concerning our 2008objectives, our strategies to achieve those objectives, as well as statements with respect to management’s beliefs,plans, estimates, and intentions, and similar statements concerning anticipated future events, results, circumstances,performance or expectations that are not historical facts. Forward-looking statements generally can be identified by the use of forward-looking terminology such as "outlook", "objective", "may", "will", "expect", "intend", "estimate","anticipate", "believe", "should", "plans", "continue", or similar expressions suggesting future outcomes or events.Such forward-looking statements reflect management’s current beliefs and are based on information currentlyavailable to management.
These statements are not guarantees of future performance and are based on our estimates and assumptions thatare subject to risks and uncertainties, including those described under Risks and Uncertainties in this MD&A, whichcould cause our actual results to differ materially from the forward-looking statements contained in this MD&A.Those risks and uncertainties include risks associated with real property ownership, financing and interest rates,environmental matters, construction, unitholder liability, and income taxes. Material factors or assumptions thatwere applied in drawing a conclusion or making an estimate set out in the forward-looking information include: anincreasing divergence in the general economy between eastern and western Canada; a less robust retailenvironment than we have seen for the last few years; interest costs to us remain relatively stable; acquisitioncapitalization rates increase and land costs for greenfield development decrease; a continuing and acceleratingtrend towards land use intensification in high growth markets; and equity and debt capital markets will continue toprovide access to capital to fund at acceptable costs our future growth program and refinance our debts as theymature. Although the forward-looking information contained in this MD&A is based upon what management believesare reasonable assumptions, there can be no assurance that actual results will be consistent with these forward-looking statements. Certain statements included in this MD&A may be considered “financial outlook” for purposesof applicable securities laws, and such financial outlook may not be appropriate for purposes other than this MD&A.
Bill C-52, the Budget Implementation Act, 2007 (“Bill C-52”) received Royal Assent on June 22, 2007. Bill C-52 is notexpected to apply to RioCan until 2011 as it provides for a transition period for publicly traded entities that existedprior to November 1, 2006. In addition, Bill C-52 will not apply to an entity that meets specific defined requirementsunder the legislation for the real estate investment trust exemption (“the REIT Exemption”). RioCan intends to takethe necessary steps to qualify for the REIT Exemption prior to 2011, and as a result, certain statements contained inthis MD&A may be modified.
All forward-looking statements in this MD&A are qualified by these cautionary statements. Except as required byapplicable law, RioCan undertakes no obligation to publicly update or revise any forward-looking statement,whether as a result of new information, future events or otherwise.
Overview and Highlights
We are an unincorporated “closed-end” trust governed by the laws of the Province of Ontario and constitutedpursuant to a Declaration of Trust (“Declaration”). We are publicly traded and listed on the Toronto Stock Exchangeunder the symbol REI.UN. We are Canada’s largest REIT as measured by the book value of our assets and total stockmarket capitalization.
Our net earnings for the second quarter of 2008 are $44.9 million (21 cents per unit) compared to a net loss of $106.1million (a loss of 51 cents per unit) for the same period of 2007. The difference between net earnings (loss) and fundsfrom operations (“FFO”) is amortization expense and future income taxes (see our FFO discussion below for a
RIO
CAN
REA
LES
TATE
INVE
STM
ENT
TRU
STSE
CON
DQ
UA
RTER
REPO
RT20
08

Management ’s D i scuss i on and A nal ys i s
reconciliation to net earnings). Our FFO for the second quarter of 2008 is $86.4 million (40 cents per unit) compared to$79.8 million (38 cents per unit) for the same period of 2007. This $6.6 million (2 cents per unit) increase in FFO isprimarily comprised of:
• An increase in property net operating income of $6.8 million (refer to our discussion in Net Operating Income);
• An increase in gains on properties held for resale of $3.3 million (refer to our discussion in Properties UnderDevelopment); offset by
• Increased interest expense of $3.1 million (refer to our discussion in Interest Expense).
Our net earnings for the six months ended June 30, 2008 are $75.2 million (35 cents per unit) compared to a net loss of $68.7 million (a loss of 33 cents per unit) for the same period of 2007. Our FFO for the first two quarters of 2008 is $154.1 million (72 cents per unit) compared to $151.1 million (73 cents per unit) for the same period of 2007. This $3 million increase is primarily comprised of:
• An increase in property net operating income (before certain adjustments including lease cancellation fees) of $15.1 million, offset by higher lease cancellation fees of $8 million during the same period of 2007 (refer to our discussion in Net Operating Income);
• An increase in gains on properties held for resale of $2.3 million (refer to our discussion in Properties UnderDevelopment); offset by
• An increase in interest expense of $5.4 million (refer to our discussion in Interest Expense); and
• An increase in general and administrative expense of $2.8 million arising from head office moving related costs (see our discussion in General and Administrative Expenses).
On a per unit basis there was a decrease in FFO of 1 cent per unit. For the six months ended June 30, 2008 ourweighted average units outstanding are 215 million units as compared to 206.8 million units for the comparativeperiod of 2007. This 8.2 million unit change is primarily a result of the 7.1 million units we issued in April 2008. Asdiscussed below, the net proceeds from this issue have not yet been fully invested, which has resulted in some nearterm dilution of our net earnings and FFO per unit.
Other operational and financial highlights discussed throughout this MD&A as at and for the six months ended June30 are as follows:
(thousands of square feet, except other data)
As at and for the six months ended June 30 2008 2007
Operational information
Number of properties:
Income producing 212 197
Under development 15 10
Portfolio occupancy 97.0% 97.7%
Net leaseable area ("NLA"):
Total portfolio 32,538 30,908
Completed greenfield development and land use intensification activities during the period 309 209
Acquired during the period 648 1,150
Greenfield development pipeline upon completion:
Total project NLA 10,240 7,594
RioCan's owned interest of project NLA 4,100 3,320
Percentage of portfolio rental revenue derived from:
Six Canadian high growth markets (i) 66.6% 64.6%
National and anchor tenants (annualized) 83.5% 82.6%
Largest tenant (annualized) 5.4% 5.7%
Number of employees (excluding seasonal) 670 670
(i) See our discussion in Vision and Business Strategy.
RIO
CAN
REA
LES
TATE
INVE
STM
ENT
TRU
STSE
CON
DQ
UA
RTER
REPO
RT20
08
23

(thousands of dollars, except other data)
As at June 30 2008 2007
Financial information
Total Assets $ 5,330,717 $ 4,942,570
Debt (mortgages and debentures payable) $ 3,200,783 $ 2,925,770
Debt to Aggregate Assets (i) 54.5% 54.6%
Debt to Total Capitalization (ii) 42.3% 37.2%
Unitholders' equity $ 1,795,828 $ 1,676,438
Units Outstanding 220,106 209,101
Closing Market Price $ 19.86 $ 23.65
Market Capitalization (iii) $ 4,371,305 $ 4,945,239
Total Capitalization (iv) $ 7,572,088 $ 7,871,009
Three months ended June 30, Six months ended June 30,2008 2007 2008 2007
Total revenue $ 194,385 $ 179,507 $ 377,752 $ 353,997
Net earnings (loss) (v) $ 44,926 $ (106,107) $ 75,210 $ (68,707)
Net earnings (loss) per unit - basic and diluted $ 0.21 $ (0.51) $ 0.35 $ (0.33)
FFO (vi) $ 86,399 $ 79,753 $ 154,065 $ 151,091
FFO per unit (vi) $ 0.40 $ 0.38 $ 0.72 $ 0.73
Distributions to unitholders $ 74,172 $ 68,851 $ 145,571 $ 136,476
Distributions to unitholders per unit $ 0.3375 $ 0.3300 $ 0.6750 $ 0.6600
Distributions per unit (annualized) $ 1.3500 $ 1.3200
Unit issue proceeds under distribution reinvestment plan $ 17,834 $ 17,427 $ 36,762 $ 34,007
Distribution reinvestment plan participation rate 24.0% 25.3% 25.3% 24.9%
(i) A non generally accepted accounting principle ("GAAP") measurement defined in our Declaration (see our discussion in Capital Structure).(ii) A non-GAAP measurement. Calculated by us as debt divided by total capitalization. Our method of calculating debt to total capitalization
may differ from other issuers’ methods and accordingly may not be comparable to such amounts reported by other issuers.(iii) A non-GAAP measurement. Calculated by us as closing market price multiplied by units outstanding. Our method of calculating market
capitalization may differ from other issuers’ methods and accordingly may not be comparable to such amounts reported by other issuers.(iv) A non-GAAP measurement. Calculated by us as debt plus market capitalization. Our method of calculating total capitalization may differ
from other issuers’ methods and accordingly may not be comparable to such amounts reported by other issuers.(v) Net earnings (loss) for the three and six months ended June 30, 2008 includes a future income tax expense of $5.7 million (2007 - $150 million).(vi) A non-GAAP measurement for which a reconciliation to net earnings can be found in our discussion under FFO.
Vision and Business Strategy
Our purpose is to deliver to our unitholders stable and reliable cash distributions that will increase over the longterm. We do so by following a strategy of owning, developing and operating retail real estate, as well as mixed usereal estate with a significant retail component.
Approximately 45% of the Canadian population resides, and 64% of the population growth has occurred in the lastfive years, in Calgary, Alberta; Edmonton, Alberta; Montreal, Quebec; Ottawa, Ontario; Toronto, Ontario; andVancouver, British Columbia based on Statistics Canada 2006 Census reports.
Management ’s D i scuss i on and A nal ys i sRI
OCA
NRE
AL
ESTA
TEIN
VEST
MEN
TTR
UST
SECO
ND
QU
ART
ERRE
PORT
2008
24

Management ’s D i scuss i on and A nal ys i s
These six high population growth markets (“high growth markets”) for RioCan’s purposes include the above citiesand surrounding areas. As growth in population dictates growth in retail sales, which in turn results in more demand for space and higher rents, increasingly our focus is to own properties mainly in those high growth markets having in excess of one million people. Shopping centres located in high growth markets also offer moreopportunities for extracting value, for example, by rezoning sites for even higher and better uses. RioCan also ownsproperties in strong secondary markets where our goal is to own the dominant unenclosed centre(s) in thosemarkets. Examples are Kingston, Ontario and Quebec City, Quebec. However, the above focus will not preclude ouracquisition of retail properties outside high population growth areas.
Our core investment strategy is to focus on stable, low risk, predominantly retail properties in the high growthmarkets to satisfy our purpose of creating stable and growing cash flows from our property portfolio.
The specific retail assets in which we currently invest are:
• New format retail centres
New format retail centres are large aggregations of dominant retailers grouped together at high traffic andeasily accessible locations. These unenclosed campus-style centres are generally anchored by supermarketsand junior department stores and may include entertainment (movie theatres, large-format bookstores andrestaurants) and fashion components.
• Neighbourhood convenience unenclosed centres
Neighbourhood convenience unenclosed centres are generally supermarket and/or junior department storeanchored shopping centres, typically comprising between 60,000 to 250,000 square feet of leasable area. Other convenience-oriented tenants generally include drug stores, restaurants and other service providers.
• Urban retail properties
Urban retail properties are high-quality, innovative, multi-level format retail centres located in major urbanmarkets. The centres are situated in high-density locations and may sometimes be part of a multi-use complex.
As discussed in Future Income Taxes below, unless further substantive technical changes are made to Bill C-52 priorto 2011, to qualify for the REIT Exemption RioCan, among other items, will essentially be required to ensure that 95%of our revenue is derived from rental revenue from long-lived income properties (those income properties consistentwith RioCan’s core investment strategy) and fee income from such properties in which we have an interest.Accordingly, our current strategy is to:
• Focus on growing our rental and fee income from long-lived properties (as opposed to the creation of feeincome streams through the creation of new funds with third party investors where such investments are notlong-term in nature). This growth from rental and fee income will be achieved through:
• Maintaining and further increasing the supply of greenfield development projects and land useintensification activities in high growth markets;
• Targeting the acquisition of properties that may not necessarily be of the same quality as RioCan’s existingincome property portfolio, but where we believe that we can obtain substantial rental growth from theenhancement of these properties;
• Selective acquisition of retail properties outside high population growth areas where national and anchortenant profiles are consistent with those in RioCan’s overall portfolio; and
• Acquisitions and developments with long term strategic partners that will generate predictable andrecurring fee income streams and higher returns on our capital invested.
• Continue leveraging our in-house expertise to earn fees and gains from properties held for resale through to theend of 2010, including from the completion of the (re)development of our current properties held for resaleportfolio and from our ongoing urban land use intensification program. As 2010 approaches, and on theassumption there have been no substantive technical Bill C-52 legislative changes, we will isolate those activitiesthat generate this type of income and review how best to restructure or discontinue such activities in a mannerthat will comply with the requirements of Bill C-52, while generating the maximum benefit to our unitholders.
RIO
CAN
REA
LES
TATE
INVE
STM
ENT
TRU
STSE
CON
DQ
UA
RTER
REPO
RT20
08
25

In summary our goal over the next few years is to continue generating both income from fees and gains onproperties held for resale, while focusing on achieving growth in our income from our long-lived income property base.
We expect these growth drivers to continue to consist of:
Organic growth in our existing property portfolio.
Our organic growth is expected to come from rental growth on renewals and releasing of existing space as tenantleases expire. Additionally, to the extent our properties are not fully occupied, we can generate growth from leasing such space and increasing our occupancy ratio.
Intensification programs consisting of extracting more value from the land component of our existing property portfolio.
The trend in the high growth markets towards densification of existing urban locations is driven by, among otherfactors, prohibitive costs of expanding infrastructure beyond urban boundaries, environmental concerns andmaximizing use of mass transit.
Land use intensification opportunities arise from the fact that retail centres are generally built with lot coverage ofapproximately 25% of the underlying land; therefore, particularly in urban markets, we can obtain additional density(retail or otherwise) on our existing property portfolio and, since we already own the underlying land, are able toachieve relatively high returns on new capital invested.
Additionally, as a normal part of our business we also expand and redevelop (components of) existing shoppingcentres to create and/or extract additional value. One of our goals is to add annually between 200,000 and 300,000square feet of retail space from this activity to our existing portfolio.
Our ongoing greenfield development program.
At June 30, 2008 greenfield development projects comprise approximately 10.2 million square feet, of which ourownership interest will be approximately 4.1 million square feet. Additionally, we have interests in 4.1 million squarefeet of conditional greenfield development projects in our development pipeline.
Opportunistic acquisition of income properties.
The tightening in the credit markets arising from current economic conditions (which impact access to both debtand equity markets) is creating an environment where a significant number of buyers who were previously activeacquirers may no longer be able to participate. This may create a market where there are more sellers than buyers.This imbalance should cause acquisition capitalization rates to increase (more significantly in secondary andtertiary markets) and land costs for greenfield development to decrease. This environment should create moreopportunities for us to acquire real estate.
The key measures by which management will evaluate its success in the achievement of its objectives are thegrowth and stability of cash flows from our property portfolio as measured by growth in: (i) FFO, with a separatemeasure that focuses on long-lived property rental revenue and fee income; and (ii) cash distributions to unitholders.
Outlook
The tightening in the credit markets arising from current economic conditions is creating an environment wherethere is less availability of capital (which impacts access to both debt and equity markets), tighter lending standardsand slower lease commitments from national tenants. Notwithstanding, we believe that the fundamentals in the retailenvironment continue to remain solid as we have experienced strong leasing activity. At June 30, 2008 ouroccupancy was 97.0% which increased from 96.6% at March 31, 2008.
RioCan’s capital management framework limits our maximum indebtedness to less than 60% of our Aggregate Assetson a book value basis. We believe that based on the fair market value of our portfolio, our leverage would besubstantially lower.
This debt policy has also resulted in approximately 20% of our properties being unencumbered by debt, providing uswith access to a pool of assets for obtaining additional secured debt. At the end of the second quarter our interestcoverage ratio remained consistent at 2.6 times. Further, our leverage level provides us with the ability to accessdebt markets even when these markets are tight and difficult, as they have been for almost the past year. For the
Management ’s D i scuss i on and A nal ys i sRI
OCA
NRE
AL
ESTA
TEIN
VEST
MEN
TTR
UST
SECO
ND
QU
ART
ERRE
PORT
2008
26

Management ’s D i scuss i on and A nal ys i s
current year, we had approximately $330 million of debt maturities. To date, we have refinanced or entered intocommitments for new financing aggregating approximately $392 million.
In April 2008 we issued 7.1 million units for gross proceeds of $150 million. At June 30, 2008 our Debt to AggregateAsset ratio is 54.5%, a reduction from 56.2% at March 31, 2008. On this basis we could therefore incur additionalindebtedness of approximately $813 million and still not exceed the 60% leverage limit. This provides us withadditional financial liquidity and flexibility, allowing us to continue our greenfield development program and seek outopportunistic acquisitions of income properties, as discussed above.
While having relatively low debt leverage exposure is important in current economic conditions, the quality of ourrental revenue available to service our debt and pay distributions to our unitholders is equally important. We reduceour exposure to rental revenue risk in our shopping centre portfolio through geographical diversification, staggeredlease maturities, diversification of revenue sources resulting from a large tenant base, avoiding dependence on anysingle tenant by ensuring no individual tenant contributes to a significant percentage of our gross revenue, andensuring a considerable portion of our revenue is earned from national and anchor tenants.
At June 30, 2008 over 83.5% of our annualized rental revenue is derived from national and anchor tenants, with ourlargest exposure to any single tenant comprising only 5.4% of our annualized rental revenue.
Additionally, as discussed above we made a strategic decision several years ago to focus on the six Canadian highgrowth markets. We are now at the point where over 2/3 of our revenue is from properties within these high growthmarkets and it is expected that over time, properties within these markets will have higher rental increases andhigher occupancy rates as well as providing ongoing opportunities for expansion and land use intensification.
It is through the implementation of our greenfield development and land use intensification programs and riskmitigation strategies, among other items, that we expect to continue to achieve growth.
2008 Objectives
We established our 2008 objectives at the end of 2007, as follows:
• Continue enhancing the quality of our real estate portfolio as measured by the stability, reliability and growth of the resulting cash flows;
• Achieve growth in our FFO per unit, with a separate measure that focuses on long-lived property rentalrevenue and fee income;
• Continue to identify opportunities for land use intensification activities in high growth markets; and
• Continue to maintain and further increase the supply of greenfield development projects in ourdevelopment pipeline.
In forming these objectives we have relied on, among other factors, the following assumptions:
• An increasing divergence in the general economy between eastern and western Canada;
• A less robust retail environment than we have seen for the last few years;
• Interest costs to us remain relatively stable;
• Acquisition capitalization rates increase and land costs for greenfield development decrease;
• Continuing and accelerating trend towards land use intensification in high growth markets; and
• Equity and debt capital markets will continue to provide access to capital to fund, at acceptable costs, ourfuture growth program and refinance our debts as they mature.
To further these objectives, in April 2008 we issued 7.1 million units on a bought-deal basis at $21.05 per unit for grossproceeds of approximately $150 million. These proceeds are expected to be/have been used, among other items, torepay indebtedness incurred under our operating credit facilities, to fund our acquisition and development programsand potential future property acquisitions and development activities, and the balance for general trust purposes.
As discussed above in Vision and Business Strategy, the current environment should create more opportunities forus to acquire real estate.
RIO
CAN
REA
LES
TATE
INVE
STM
ENT
TRU
STSE
CON
DQ
UA
RTER
REPO
RT20
08
27

Additional initiatives already commenced by RioCan to pursue these objectives, while adhering to our strategy ofowning properties in high growth markets, include: (i) new format retail development projects undertaken both withand without partners; (ii) continued focus on land use intensification at our existing properties; and (iii) opportunisticacquisition of an income property portfolio. Further details relating to these objectives are described throughout this MD&A.
The achievement of our objectives is partially dependent on successful mitigation of business risks, which isdiscussed below in Risks and Uncertainties. RioCan believes it has identified and mitigated such risks to the extentpractical and is committed to identifying and implementing the actions required to achieve its objectives.
Asset Profile
At June 30, 2008:
• We have ownership interests in a portfolio of 212 shopping centres comprising 32.5 million square feet with a portfolio occupancy rate of 97%.
• We have ownership interests in 15 greenfield development projects that will upon completion compriseapproximately 10.2 million square feet, of which our ownership interest will be approximately 4.1 million square feet.
Income Properties
The changes in our net carrying amount of income properties are as follows:
(thousands of dollars)
Three months ended June 30, Six months ended June 30,2008 2007 2008 2007
Balance, beginning of period $ 4,443,945 $ 4,265,689 $ 4,419,473 $ 4,041,151
Acquisitions 89,398 12,117 103,370 268,381
Completion of properties under development 40,112 23,315 109,562 45,917
Tenant installation costs 5,044 5,579 11,085 10,384
Transfers to properties under development (884) (13,774) (25,026) (40,144)
Other (i) 1,673 (62) (1,794) 1,113
Amortization expense (35,773) (35,860) (73,155) (69,798)
Balance, end of period $ 4,543,515 $ 4,257,004 $ 4,543,515 $ 4,257,004
(i) During the first quarter of 2008, RioCan exercised its option to acquire a 50% co-ownership interest in a substantially completed greenfielddevelopment project. The development project was funded by RioCan through a participating mortgage structure. Prior to the exercise of itsoption, RioCan was required under applicable accounting rules relating to variable interest entities to show 100% of the related assets andliabilities of the project on its balance sheet, as for accounting purposes we were identified as the primary beneficiary (see Note 1 (b) of theconsolidated financial statements for the two years ended December 31, 2007 and 2006). After we exercised our option, the applicableaccounting rules require the inclusion of only our 50% share of the related assets and liabilities. Accordingly, non-cash adjustments haveresulted in real estate investments decreasing by $21.9 million, mortgages receivable increasing by $5.9 million, mortgages payable decreasingby $17.8 million and working capital decreasing by $1.8 million.
Management ’s D i scuss i on and A nal ys i sRI
OCA
NRE
AL
ESTA
TEIN
VEST
MEN
TTR
UST
SECO
ND
QU
ART
ERRE
PORT
2008
28

Management ’s D i scuss i on and A nal ys i s
The changes in NLA of our income properties are as follows:
(square feet in thousands)
Three months ended June 30, Six months ended June 30,2008 2007 2008 2007
NLA, beginning of period 31,962 30,775 31,719 29,645
Acquisitions of income properties 575 61 648 1,150
Completed greenfield development and land use intensification 129 134 309 209
Other adjustments (128) (62) (138) (96)
NLA, end of period 32,538 30,908 32,538 30,908
The breakdown of our portfolio by property type is as follows:
A summary of our 2008 acquisition activity is as follows:
NLA (in sf) RioCan'sQuarter at RioCan's ownership
Property name and location acquired interest Major tenants interest
Portfolio acquisition:
720 Maloney Boulevard, Gatineau, QC Q2 141,939 Wal-Mart, Canadian Tire 50%and Super C
857 Cecile Boulevard, Hawkesbury, ON Q2 28,375 Price Chopper 50%
900 Aberdeen Avenue, Hawkesbury, ON Q2 8,516 Shoppers Drug Mart 50%
1160 Desserte Ouest, Montreal, QC Q2 60,049 Zellers 50%
1345 Huron Street, London, ON Q2 45,106 Shoppers Drug Mart 50%
Chain Lake Drive, Halifax, NS Q2 69,047 Wal-Mart 50%
Gates of Fergus, Fergus, ON Q2 53,478 Zellers 50%
King George Square, Belleville, ON Q2 35,965 A&P and Rogers Video 50%
Nortown Centre, Chatham, ON Q2 35,712 Food Basics, 50%PartSource and CIBC
Viewmount, Ottawa, ON Q2 65,458 Loeb, Best Buy and 50%Linens ‘N’ Things
RioCan Elgin Mills Crossing, Q2 31,016 Additional 12.5% 62.5%Richmond Hill, ON interest
574,661
Shoppers on Topsail, St. Johns, NF Q1 29,689 Shoppers Drug Mart 100%
Quartier DIX30, Autoroute 10 & 30, Q1 43,326 Final closing of 50%Brossard, QC forward purchase
73,015
647,676
RIO
CAN
REA
LES
TATE
INVE
STM
ENT
TRU
STSE
CON
DQ
UA
RTER
REPO
RT20
08
29
p8-1 p8-2
p11-1 p11-2
p11-3 p11-4
p36-1 p36-2
New Format Retail 52.1%
Grocery Anchored Centre 20.6%
Enclosed Shopping Centre 13.8%
Urban Retail 5.7%
Non-Grocery Anchored Centre 4.0%
Office 3.8%
Annualized rental revenue by property type at June 30, 2008
p8-1 p8-2
p11-1 p11-2
p11-3 p11-4
p36-1 p36-2
New Format Retail 45.3%
Grocery Anchored Centre 21.1%
Enclosed Shopping Centre 19.9%
Office 4.9%
Non-Grocery Anchored Centre 4.8%
Urban Retail 4.0%
NLA by property type at June 30, 2008

• In June 2008 we acquired on a 50/50 basis, through the creation of a second joint venture partnership (RioKim II)with Kimco Realty Corporation (“Kimco”), a ten property portfolio located in central and eastern Canadaaggregating approximately 1.1 million square feet of new format and strip retail centres. The transaction wascompleted at a capitalization rate of 7.7% with a portfolio purchase price of approximately $156 million, and$82.6 million of mortgage debt was assumed on the transaction with a weighted average term of 8.1 years and a weighted average interest rate of 6.17%.
• During the second quarter of 2008 we increased our interest in RioCan Elgin Mills Crossing by 12.5% to 62.5%from 50%. The purchase price was approximately $9.4 million at a capitalization rate of 6.25%. The transactionalso resulted in the assumption of $5.1 million of construction financing at a rate of bank prime plus 0.75%. Thissite is currently being developed into a 441,000 square foot new format retail centre as a joint venture withTrinity Development Group Inc. (“Trinity”) and Tamuz Investments. The site is anchored by Costco (land lease),who commenced operations in the fourth quarter of 2007 and by Home Depot, who owns its own store andoperates as part of the overall site. The centre has a strong mix of national tenants that include PetSmart,Staples/Business Depot, Michaels, Mark’s Work Wearhouse, Scotiabank and TD Canada Trust. The centre isexpected to be substantially complete in the third quarter of 2008.
• During the first quarter of 2008 we acquired a 29,700 square foot non-grocery anchored centre featuring aShoppers Drug Mart located in St. Johns, Newfoundland for $5.6 million at a capitalization rate of 7.62%.
• During the first quarter of 2008 we completed the acquisition from Devimco Group Inc. (“Devimco”) of the finalphase of our 50% interest in Quartier DIX30 located in Brossard, Quebec. This regional lifestyle centre iscomprised of approximately 2 million square feet of retail space. The site is anchored by a 180,000 square footWal-Mart and a 100,000 square foot Rona (both retailer owned). In addition, an 85,000 square foot Maxi(Loblaws) is expected to be constructed in 2008 (also retailer owned). Additional anchor tenants at the siteinclude a 91,000 square foot Canadian Tire, a 59,000 square foot Cineplex Odeon Cinemas and a 52,000 squarefoot Winners/HomeSense store. The remainder of the site is occupied by strong national tenants includingFuture Shop, Staples/Business Depot, Indigo, Sports Experts, TD Canada Trust and Pier 1 Imports.
This acquisition was closed in phases at an aggregate cost, including closing costs, of approximately $153million at a capitalization rate of 6.83%. We purchased the first phase of the property, consisting entirely of a59,000 square foot Cineplex theatre, in July 2006. Seventy-six additional tenancies totalling 405,000 square feetwere purchased in the second phase in November 2006. Sixty-three more tenancies totalling 566,000 squarefeet were acquired by us in the third phase in December 2007. The last thirty tenancies, totalling 116,000 squarefeet (of which 29,000 square feet remain in properties under development) were purchased in the final phasein February 2008.
In July 2008 we entered into a firm commitment to aquire a 142,000 square foot urban retail centre in Ottawa,Ontario. The centre is anchored by Canadian Tire. The purchase price is $40 million at a capitalization rate of 6.4%.
Management ’s D i scuss i on and A nal ys i sRI
OCA
NRE
AL
ESTA
TEIN
VEST
MEN
TTR
UST
SECO
ND
QU
ART
ERRE
PORT
2008
30

Management ’s D i scuss i on and A nal ys i s
During the six months ended June 30, 2008 we completed 309,000 square feet of (re)development, of whichapproximately 36,000 square feet pertains to additional NLA added at existing properties, and 273,000 square feetpertains to the completion of greenfield developments. A summary of our 2008 completed greenfield developmentand land use intensification activity includes:
NLA (in sf) RioCan'sQuarter at RioCan's ownership
Property location completed interest interest
RioCan Beacon Hill, Calgary, AB Q2 33,138 40%
RioCan Centre Burloak, Oakville, ON Q2 51,587 50%
RioCan Elgin Mills Crossing, Richmond Hill, ON Q2 33,805 62.5%
RioCan Meadows, Edmonton, AB Q2 1,250 50%
Land use intensification Q2 8,989 100%
128,769
RioCan Beacon Hill, Calgary, AB Q1 49,360 40%
RioCan Centre Burloak, Oakville, ON Q1 46,567 50%
RioCan Elgin Mills Crossing, Richmond Hill, ON Q1 28,592 50%
RioCan Meadows, Edmonton, AB Q1 9,361 50%
RioCan Centre Kingston II, Kingston, ON Q1 15,336 100%
RioCan Centre Milton, Milton, ON Q1 4,600 100%
Land use intensification Q1 26,561 60% to 100%
180,377
309,146
• RioCan Beacon Hill, Calgary, Alberta – Upon substantial completion in the third quarter of 2008, the site willcontain a total leasable area of 787,000 square feet of new format retail space. Existing anchor tenants includeWinners/HomeSense (51,000 square feet), Linens ‘N’ Things (28,000 square feet), Sport Chek (28,000 squarefeet), Michaels (24,000 square feet), Mark’s Work Wearhouse (20,000 square feet) and Golf Town (18,000 squarefeet). In addition, Home Depot (108,000 square feet) and Costco (153,000 square feet) own their own premisesand operate as part of the shopping centre. In 2008, an additional 244,440 square feet of retail is projected toopen; notable tenants include Canadian Tire (94,000 square feet), Shoppers Drug Mart (17,500 square feet),Future Shop (30,000 square feet) and The Brick (40,000 square feet). A 50% interest in this property was sold tothe CPP Investment Board (“CPPIB”) in September 2006 (which is being closed in phases) and a 10% interesthas been retained by Trinity, our development partner. We continue to own a 40% interest in the site.
• RioCan Centre Burloak, Oakville, Ontario – The development aggregates 552,000 square feet of new formatretail space. Anchored by a 98,000 square foot Home Depot (retailer owned), the site also includes a 45,500square foot Famous Players (Cineplex) Theatre, a 51,000 square foot Longo’s Supermarket and a 34,500 squarefoot Home Outfitters. We sold a 50% interest in the property in September 2006 to CPPIB which is being closedin phases. The centre is substantially complete.
• RioCan Elgin Mills Crossing, Richmond Hill, Ontario – As discussed under Income Properties above, during thesecond quarter of 2008, our ownership interest increased by 12.5% to 62.5% from 50%. The centre is expected tobe substantially complete in the third quarter of 2008.
RIO
CAN
REA
LES
TATE
INVE
STM
ENT
TRU
STSE
CON
DQ
UA
RTER
REPO
RT20
08
31

• RioCan Meadows, Edmonton, Alberta – Upon substantial completion, the site will contain a total leasable areaof 490,000 square feet. Existing anchor tenants include Winners (28,000 square feet), Staples/Business Depot(20,000 square feet), Mark’s Work Wearhouse (15,000 square feet) and PetSmart (18,000 square feet), Best Buy,Reitmans, Sleep Country, Swiss Chalet and Montana’s. In addition, a 98,500 square foot Home Depot (landlease) operates as part of the site. A 50% interest in this property was sold to the CPPIB in September 2006which is being closed in phases. The centre is expected to be substantially complete in the first quarter of 2009.
• RioCan Centre Kingston I & II, Kingston, Ontario – This new format retail centre comprises approximately752,000 square feet of gross leasable area. The first phase of the centre totals approximately 518,000 squarefeet and is anchored by a Home Depot (which owns its own premises) and also includes such retail tenants as Sears, Staples/Business Depot, Future Shop, Cineplex Odeon Cinemas, Sport Mart, Winners, HomeSense,Old Navy, Danier Leather, La Vie En Rose and Mexx. The second phase of the centre comprises approximately234,000 square feet and is tenanted by The Brick, Home Outfitters, Best Buy, TD Canada Trust, PetSmart, JYSK, Golf Town and East Side Mario’s, as well as a number of smaller national retailers. The centre issubstantially complete.
• RioCan Centre Milton, Milton, Ontario – This 31.55-acre site is currently being developed into a 291,000 squarefoot new format retail centre. The site is anchored by an 85,000 square foot Home Depot and a 35,000 squarefoot Price Chopper (Sobeys) who both own their own sites but will operate as part of the centre. Additionaltenants include a 31,000 square foot Cineplex Odeon Cinemas and a 40,000 square foot Premier Fitness. Thesite is expected to be substantially complete by the end of the third quarter of 2008.
As discussed under Vision and Business Strategy it is our focus to own properties mainly in high growth markets.The geographical diversification of our retail property portfolio on this basis is as follows:
Management ’s D i scuss i on and A nal ys i sRI
OCA
NRE
AL
ESTA
TEIN
VEST
MEN
TTR
UST
SECO
ND
QU
ART
ERRE
PORT
2008
32
p8-1 p8-2
p11-1 p11-2
p11-3 p11-4
p36-1 p36-2
p8-1 p8-2
p11-1 p11-2
p11-3 p11-4
p36-1 p36-2
Toronto, Ontario 34.2%
Montreal, Quebec 10.6%
Ottawa, Ontario 8.9%
Calgary, Alberta 6.2%
Vancouver, British Columbia 3.9%
Edmonton, Alberta 2.9%
All other markets 33.3%
Toronto, Ontario 27.9%
Montreal, Quebec 10.8%
Ottawa, Ontario 7.6%
Calgary, Alberta 5.5%
Vancouver, British Columbia 3.3%
Edmonton, Alberta 2.4%
All other markets 42.5%
Rental revenue for the six months ended June 30, 2008
NLA at June 30, 2008
p8-1 p8-2
p11-1 p11-2
p11-3 p11-4
p36-1 p36-2
NLA at June 30, 2007
p8-1 p8-2
p11-1 p11-2
p11-3 p11-4
p36-1 p36-2
Rental revenue for the six months ended June 30, 2007
Toronto, Ontario 33.0%
Montreal, Quebec 9.6%
Ottawa, Ontario 9.1%
Calgary, Alberta 6.1%
Vancouver, British Columbia 4.1%
Edmonton, Alberta 2.7%
All other markets 35.4%
Toronto, Ontario 28.3%
Montreal, Quebec 10.1%
Ottawa, Ontario 7.7%
Calgary, Alberta 5.5%
Vancouver, British Columbia 3.5%
Edmonton, Alberta 2.3%
All other markets 42.6%

Management ’s D i scuss i on and A nal ys i s
At June 30, 2008 our lease expiries for the portfolio by property type for the years ending December 31 are asfollows:
Lease expiries
(in thousands, except psf and percentage amounts) Portfolio NLA 2008 (i) 2009 2010 2011 2012
Square feet:New format retail 14,774 259 841 982 1,401 1,029 Grocery anchored centre 6,879 228 887 933 1,011 1,032 Enclosed shopping centre 6,460 247 530 791 793 434 Non-grocery anchored centre 1,546 47 112 112 102 125 Urban retail 1,296 122 100 65 78 124
Office 1,583 52 182 272 334 55
Total 32,538 955 2,652 3,155 3,719 2,799
Square feet expiring/portfolio NLA 2.9% 8.2% 9.7% 11.4% 8.6%
Average rent psf:New format retail $ 15.81 $ 19.02 $ 17.44 $ 18.52 $ 16.65 $ 17.27 Grocery anchored centre 13.61 17.15 13.98 13.47 13.98 13.54 Enclosed shopping centre 10.96 13.53 14.43 9.95 10.37 12.97 Non-grocery anchored centre 11.80 16.78 12.58 14.94 13.90 13.05 Urban retail 19.64 16.38 26.25 28.70 21.43 32.12
Office 10.75 12.81 10.28 8.69 12.16 12.27
Total weighted average psf $ 14.19 $ 16.37 $ 15.32 $ 14.11 $ 14.21 $ 15.60
(i) Tenant lease expiries for the six months ending December 31, 2008.
Our portfolio leasing activity during the three and six months ended June 30, 2008 is comprised of the following:
(in thousands, except psf amounts)Three months ended Three months ended Six months ended
June 30, 2008 March 31, 2008 June 30, 2008
Average net Average net Average netSquare feet rent psf Square feet rent psf Square feet rent psf
Renewals 535 $ 17.01 1,035 $ 10.94 1,570 $ 13.18 New leasing on existing portfolio (i) 397 17.22 310 15.13 707 16.31
(i) Prior quarter figures have been reclassified to the current quarter's presentation.
RIO
CAN
REA
LES
TATE
INVE
STM
ENT
TRU
STSE
CON
DQ
UA
RTER
REPO
RT20
08
33

During the three months ended June 30, 2008 our portfolio leasing activity by property type is as follows:
(in thousands, except psf amounts)
Renewals New leasing on existing portfolio
Average net Average netSquare feet rent psf Square feet rent psf
New format retail 151 $17.29 128 $17.76 Grocery anchored centre 143 17.11 54 25.99 Enclosed shopping centre 110 18.49 148 13.72 Non-grocery anchored centre 88 15.47 21 16.13 Urban retail 6 34.92 11 26.61 Office 37 11.81 35 13.99
Total 535 $17.01 397 $17.22
During the three months ended March 31, 2008 our portfolio leasing activity by property type is as follows:
(in thousands, except psf amounts)
Renewals New leasing on existing portfolio
Average net Average netSquare feet rent psf Square feet rent psf
New format retail 201 $19.59 140 $15.64 Grocery anchored centre 81 15.60 37 18.62 Enclosed shopping centre 597 7.71 87 11.83 Non-grocery anchored centre 24 13.40 7 20.28 Urban retail 116 7.65 1 22.00 Office 16 18.72 38 16.25
Total 1,035 $10.94 310 $15.13
Management ’s D i scuss i on and A nal ys i sRI
OCA
NRE
AL
ESTA
TEIN
VEST
MEN
TTR
UST
SECO
ND
QU
ART
ERRE
PORT
2008
34

Management ’s D i scuss i on and A nal ys i s
During the six months ended June 30, 2008 our portfolio leasing activity by property type is as follows:
(in thousands, except psf amounts)
Renewals New leasing on existing portfolio
Average net Average netSquare feet rent psf Square feet rent psf
New format retail 352 $18.60 268 $16.65 Grocery anchored centre 224 16.57 91 23.03 Enclosed shopping centre 707 9.39 235 13.02 Non-grocery anchored centre 112 17.44 28 17.20 Urban retail 122 8.95 12 26.16 Office 53 14.03 73 15.18
Total 1,570 $13.18 707 $16.31
During the second quarter we retained approximately 90% of our expiring leases at an average net rent increase of$1.78 per square foot. The components of our renewal activity for the three months ended June 30, 2008, whichincludes anchor tenants, by property type are as follows:
(in thousands, except per square foot amounts)
New Grocery Enclosed Non-groceryformat anchored shopping anchored Urban
Total retail centre centre centre retail Office
Renwals at market rental rates:
Square feet expired 364 28 134 103 56 6 37 Average net rent psf $ 18.32 $ 29.27 $ 17.48 $ 18.58 $ 16.91 $ 34.92 $ 11.81
Increase in average net rent psf $ 2.09 $ 5.30 $ 1.64 $ 1.96 $ 1.25 $ 8.66 $ 1.94
Fixed rental rate options in favour of our tenants:
Square feet expired 171 123 9 7 32 – – Average net rent psf $ 14.21 $ 14.57 $ 11.73 $ 17.07 $ 12.94 $ – $ –
Increase in average net rent psf $ 1.10 $ 1.19 $ 0.68 $ 0.54 $ 1.00 $ – $ –
Total:Square feet expired 535 151 143 110 88 6 37 Average net rent psf $ 17.01 $ 17.29 $ 17.11 $ 18.49 $ 15.47 $ 34.92 $ 11.81
Increase in average net rent psf $ 1.78 $ 1.95 $ 1.58 $ 1.88 $ 1.16 $ 8.66 $ 1.94
During the first quarter we retained approximately 77% of our expiring leases at an average net rent increase of$1.09 per square foot. The components of our renewal activity for the three months ended March 31, 2008, whichincludes anchor tenants, by property type are as follows:
RIO
CAN
REA
LES
TATE
INVE
STM
ENT
TRU
STSE
CON
DQ
UA
RTER
REPO
RT20
08
35

Management ’s D i scuss i on and A nal ys i s
(in thousands, except per square foot amounts)
New Grocery Enclosed Non-groceryformat anchored shopping anchored Urban
Total retail centre centre centre retail Office
Renwals at market rental rates:
Square feet expired 220 51 52 82 13 6 16 Average net rent psf $ 21.31 $ 27.73 $ 19.75 $ 20.03 $ 11.88 $ 25.35 $ 18.72
Increase in average net rent psf $ 3.69 $ 8.07 $ 2.70 $ 2.24 $ 1.23 $ 3.01 $ 2.73
Fixed rental rate options in favour of our tenants:
Square feet expired 815 150 29 515 11 110 – Average net rent psf $ 8.15 $ 16.85 $ 8.21 $ 5.76 $ 15.12 $ 6.72 $ –
Increase in average net rent psf $ 0.39 $ 1.27 $ 0.50 $ 0.21 $ 0.59 $ – $ –
Total:Square feet expired 1,035 201 81 597 24 116 16 Average net rent psf $ 10.94 $ 19.59 $ 15.60 $ 7.71 $ 13.40 $ 7.65 $ 18.72
Increase in average net rent psf $ 1.09 $ 2.98 $ 1.91 $ 0.49 $ 0.93 $ 0.15 $ 2.73
During the first six months of 2008 we retained approximately 80% of our expiring leases at an average net rentincrease of $1.33 per square foot. The components of our renewal activity for the first two quarters of 2008, whichincludes anchor tenants, by property type are as follows:
(in thousands, except per square foot amounts)
New Grocery Enclosed Non-groceryformat anchored shopping anchored Urban
Total retail centre centre centre retail Office
Renwals at market rental rates:
Square feet expired 584 79 186 185 69 12 53 Average net rent psf $ 19.91 $ 28.28 $ 18.11 $ 19.22 $ 19.90 $ 30.13 $ 14.03
Increase in average net rent psf $ 2.70 $ 7.08 $ 1.93 $ 2.08 $ 1.24 $ 5.83 $ 2.19
Fixed rental rate options in favour of our tenants:
Square feet expired 986 273 38 522 43 110 – Average net rent psf $ 9.20 $ 15.82 $ 9.05 $ 5.90 $ 13.50 $ 6.72 $ –
Increase in average net rent psf $ 0.52 $ 1.23 $ 0.54 $ 0.22 $ 0.89 $ – $ –
Total:Square feet expired 1,570 352 224 707 112 122 53 Average net rent psf $ 13.18 $ 18.60 $ 16.57 $ 9.39 $ 17.44 $ 8.95 $ 14.03
Increase in average net rent psf $ 1.33 $ 2.54 $ 1.70 $ 0.71 $ 1.11 $ 0.56 $ 2.19
RIO
CAN
REA
LES
TATE
INVE
STM
ENT
TRU
STSE
CON
DQ
UA
RTER
REPO
RT20
08
36

Management ’s D i scuss i on and A nal ys i s
Capital Expenditures on Income Properties
Capital spending for new property acquisitions, greenfield developments and the redevelopment of our existingproperties to create and/or extract additional value are expected to improve the overall earnings capacity of ourproperty portfolio. As a result, we do not expect such expenditures to be funded from cash flows from operatingactivities and do not consider such amounts as a key determinant in setting the amount we distribute to our unitholders.
Maintenance capital expenditures refer to capital expenditures that are necessary to maintain the existing earningscapacity of our property portfolio. Such expenditures are considered in determining the amount we distribute to ourunitholders, and primarily consist of:
• Tenant installation costs.
Our portfolio requires ongoing investments of capital for tenant installation costs related to new and renewaltenant leases. During the six months ended June 30, 2008 we incurred tenant installation costs of approximately$11 million, of which $2.2 million pertains to the office component lease up of the RioCan Yonge Eglinton Centre(“YEC”). Tenant installation costs consist of tenant improvements and other leasing costs, including certain costsassociated with our internal leasing professionals (primarily compensation costs).
Based on our income property portfolio at June 30, 2008 and our expectations for that portfolio, we estimate thatfor the next twelve months our annual investments of capital for tenant installation costs are between $20 millionand $22 million. Included in the annualized leasing costs are approximately $2.3 million relating to the officecomponent lease up of the YEC.
Investments of capital for tenant installation costs for our income properties are dependent upon many factors,including, but not limited to, our lease maturity profile, unforeseen tenant bankruptcies and the location of ourincome properties.
• Recoverable and non-recoverable maintenance capital expenditures.
We also invest capital on a continuous basis to physically maintain our income properties. Typical costs incurredare for roof replacement programs and the repaving of parking lots. Tenant leases generally provide for our abilityto recover a significant portion of such costs from tenants over time as property operating costs. Where suchamounts are not recoverable under tenant leases, we expense or capitalize these amounts to income properties,as appropriate.
As our portfolio is located in Canada, the majority of such activities occur when weather conditions arefavorable. As a result, these expenditures are not consistent throughout the year. The timing of suchexpenditures for our western Canada properties is further impacted by the availability of construction trades.
Expenditures for recoverable and non-recoverable maintenance capital for our income properties are as follows:
(thousands of dollars)
Three months ended June 30, Six months ended June 30,2008 2007 2008 2007
Maintenance capital expenditures:
Recoverable from tenants $ 1,465 $ 1,281 $ 2,154 $ 1,738
Non-recoverable 2,106 1,504 2,289 1,849
$ 3,571 $ 2,785 $ 4,443 $ 3,587
For the six months ended June 30, 2008, property operating costs include amortization of deferred maintenancecapital expenditures recoverable from tenants of $2 million ($1 million for the three months ended June 30, 2008)as compared to $1.6 million for the same period of 2007 ($900,000 for the three months ended June 30, 2007).
Based on our income property portfolio at June 30, 2008 and our expectations for that portfolio, we estimate thatfor the next twelve months our recoverable annual maintenance capital expenditures will be between $5 millionand $7 million, and our non-recoverable annual maintenance capital expenditures will be between $2 million and$4 million.
RIO
CAN
REA
LES
TATE
INVE
STM
ENT
TRU
STSE
CON
DQ
UA
RTER
REPO
RT20
08
37
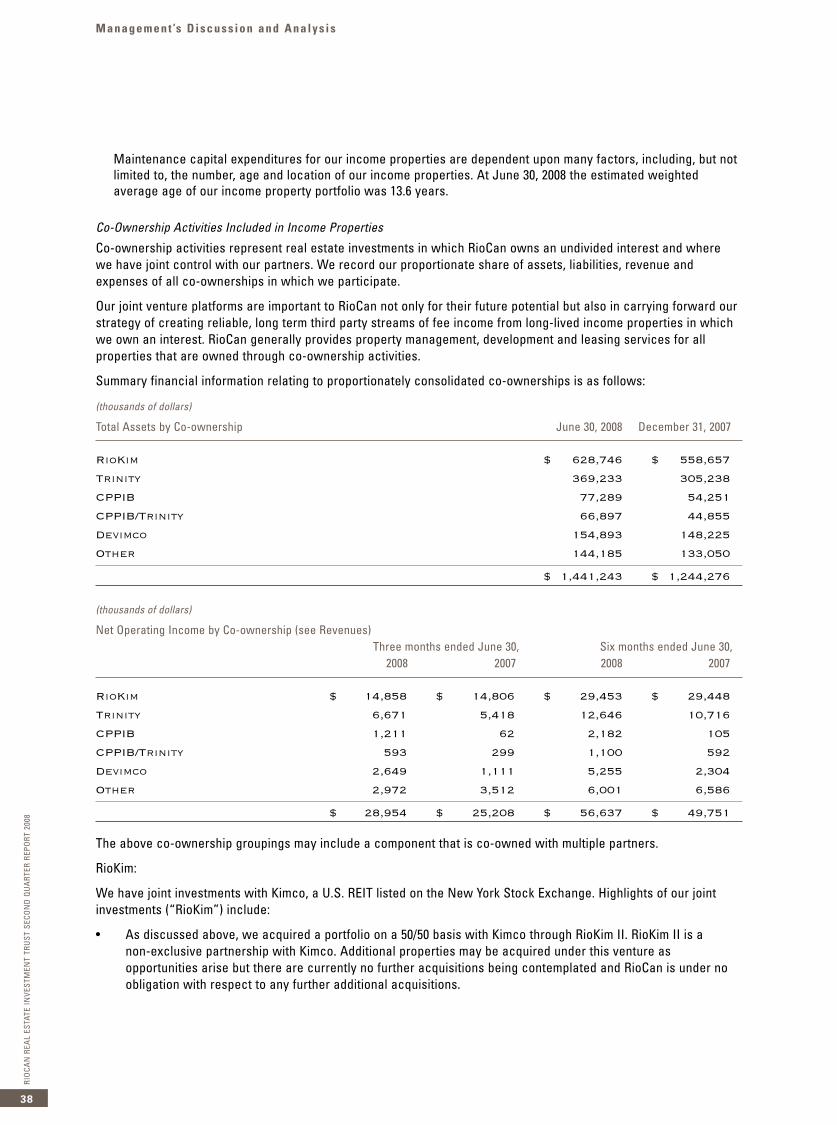
Maintenance capital expenditures for our income properties are dependent upon many factors, including, but notlimited to, the number, age and location of our income properties. At June 30, 2008 the estimated weightedaverage age of our income property portfolio was 13.6 years.
Co-Ownership Activities Included in Income Properties
Co-ownership activities represent real estate investments in which RioCan owns an undivided interest and wherewe have joint control with our partners. We record our proportionate share of assets, liabilities, revenue andexpenses of all co-ownerships in which we participate.
Our joint venture platforms are important to RioCan not only for their future potential but also in carrying forward ourstrategy of creating reliable, long term third party streams of fee income from long-lived income properties in whichwe own an interest. RioCan generally provides property management, development and leasing services for allproperties that are owned through co-ownership activities.
Summary financial information relating to proportionately consolidated co-ownerships is as follows:
(thousands of dollars)
Total Assets by Co-ownership June 30, 2008 December 31, 2007
RioKim $ 628,746 $ 558,657
Trinity 369,233 305,238
CPPIB 77,289 54,251
CPPIB/Trinity 66,897 44,855
Devimco 154,893 148,225
Other 144,185 133,050
$ 1,441,243 $ 1,244,276
(thousands of dollars)
Net Operating Income by Co-ownership (see Revenues)Three months ended June 30, Six months ended June 30,
2008 2007 2008 2007
RioKim $ 14,858 $ 14,806 $ 29,453 $ 29,448
Trinity 6,671 5,418 12,646 10,716
CPPIB 1,211 62 2,182 105
CPPIB/Trinity 593 299 1,100 592
Devimco 2,649 1,111 5,255 2,304
Other 2,972 3,512 6,001 6,586
$ 28,954 $ 25,208 $ 56,637 $ 49,751
The above co-ownership groupings may include a component that is co-owned with multiple partners.
RioKim:
We have joint investments with Kimco, a U.S. REIT listed on the New York Stock Exchange. Highlights of our jointinvestments (“RioKim”) include:
• As discussed above, we acquired a portfolio on a 50/50 basis with Kimco through RioKim II. RioKim II is a non-exclusive partnership with Kimco. Additional properties may be acquired under this venture asopportunities arise but there are currently no further acquisitions being contemplated and RioCan is under noobligation with respect to any further additional acquisitions.
Management ’s D i scuss i on and A nal ys i sRI
OCA
NRE
AL
ESTA
TEIN
VEST
MEN
TTR
UST
SECO
ND
QU
ART
ERRE
PORT
2008
38

Management ’s D i scuss i on and A nal ys i s
• At June 30, 2008 the aggregate joint investments in RioKim and RioKim II comprise interests in 45 propertiesaggregating approximately 9.2 million square feet (8.9 million square feet is owned on a 50/50 basis and 300,000square feet is owned on a 1/3 basis by each of RioCan, Kimco and Trinity). As a normal part of our business,RioCan provides guarantees on behalf of third parties, including certain partners and co-owners for their shareof mortgages payable. At June 30, 2008 RioCan, on behalf of Kimco, provided guarantees on approximately$261.5 million of mortgages payable for Kimco’s share of properties held through RioKim, for which we receiveguarantee fees (see Off Balance Sheet Liabilities and Guarantees).
Trinity:
Our joint investments with Trinity include interests in six completed income properties aggregating approximately 2.2 million square feet, and greenfield development projects which upon substantial completion will comprise 4.2 million square feet. Our co-ownership interests range from 17% to 75%. Our relationship with Trinity is strategicas a large component of our development pipeline was sourced through this partner. As part of the relationship, welend to Trinity a substantial portion of their costs, amounting to $141.6 million at June 30, 2008, which are reflectedin mortgages receivable. These mortgages bear contractual interest ranging from 6.75% to 8% per annum, and aretypically due upon substantial completion of the development. We also pay Trinity certain fees for constructionmanagement and leasing. Upon completion, we are the property manager and leasing manager for these assets. The completed income properties in this joint investment were acquired as part of our development program. AtJune 30, 2008 RioCan, on behalf of Trinity, provided guarantees on approximately $68.3 million of mortgages payablefor their share of properties held through the co-ownerships, for which we receive guarantee fees (see Off BalanceSheet Liabilities and Guarantees).
CPPIB:
We entered into an agreement during 2006 to dispose of interests (ranging from 22.5% to 50%) ultimately comprisingapproximately 510,000 square feet in three greenfield developments to CPPIB. These dispositions are beingcompleted in stages as leasable area is occupied by tenants. The sale prices are determined by valuing such areasat predetermined multiples of net operating income, plus predetermined per square foot amounts for additionalbuildable density. At June 30, 2008 the estimated remaining sale proceeds under this agreement for the years endingDecember 31 are: 2008 – $15.8 million (representing 43,000 square feet); and 2009 – $1.6 million (representing 3,000square feet). During the six months ended June 30, 2008, $38 million of disposition proceeds were recognized underthis agreement and the resulting gains have been included in gains on properties held for resale (see PropertiesHeld for Resale).
One of the above three greenfield developments is also co-owned with Trinity (see CPPIB/Trinity discussion below).At June 30, 2008 the joint CPPIB investments comprise interests in two properties, which upon substantial completionwill aggregate approximately 800,000 square feet.
CPPIB/Trinity:
In June 2008 RioCan and Trinity sold a 50% non-managing interest in two developments to CPPIB. The twodevelopments are Jacksonport located in Calgary, Alberta and St. Clair Avenue and Weston Road located in Toronto,Ontario. The total development cost of the two projects is expected to aggregate approximately $375 million. RioCanand Trinity each retained a 25% ownership interest in these two developments. RioCan recognized a $15.4 milliongain on properties held for resale during the second quarter as a result of this transaction.
Our joint investments with CPPIB/Trinity include interests in one greenfield development property which is expectedto be substantially completed in the third quarter of 2008 and will upon completion aggregate approximately 528,000square feet, and the two above mentioned development projects which upon completion will compriseapproximately 1.7 million square feet. RioCan’s co-ownership interests range from 25% to 40%.
RIO
CAN
REA
LES
TATE
INVE
STM
ENT
TRU
STSE
CON
DQ
UA
RTER
REPO
RT20
08
39

Devimco:
Our 50% joint investment with Devimco comprises approximately 1.1 million square feet. At June 30, 2008 RioCan, onbehalf of Devimco, provided a guarantee on approximately $6.8 million of a mortgage payable for their share of theproperty held through the co-ownership, for which we receive guarantee fees (see Off Balance Sheet Liabilities andGuarantees).
Devimco completed the sale of 20% interest in Quartier DIX30 to a Quebec based pension fund. As part of thistransaction, the option of Devimco requiring RioCan to purchase its 50% co-ownership interest has been terminated.
Other joint investments:
Other joint investments comprise interests in eight properties aggregating approximately 2.3 million square feet. Our ownership interests range from 20% to 50%, with our owned interest comprising 896,000 square feet. At June 30,2008 RioCan, on behalf of these co-owners, provided guarantees on approximately $36.1 million of mortgagespayable for such co-owners’ share of properties held through the co-ownerships, for which we receive guaranteefees (see Off Balance Sheet Liabilities and Guarantees).
Equity Investments in Income Properties
Equity investments comprise real estate investments where we exercise significant influence (but not control or jointcontrol) over the investment, and are accounted for using the equity method. This method adjusts the original cost ofour investment for RioCan’s share of net earnings, capital advances and distributions receivable or received. Equityaccounted for investments are $9.3 million at June 30, 2008 and $8.3 million at December 31, 2007.
We have a 15% equity interest ($6.6 million at June 30, 2008) in RioCan Retail Value L.P. (“RRVLP”). RRVLP wasformed in 2003 with a 60% participation by the Teachers Insurance and Annuity Association-College RetirementEquities Fund and a 25% participation by the Ontario Municipal Employees Retirement System. The business ofRRVLP is to acquire underperforming shopping centres in Canada that have the potential for significant value-added,redevelopment or repositioning opportunities and then to dispose of these assets over a number of years. RRVLPprovides RioCan with a vehicle that enables it to benefit as a minority investor in pursuing value-added opportunitiesand to earn asset management, property management, development and leasing fees in addition to incentivecompensation for out-performance.
By December 31, 2005 the partners had committed the full capital resources of RRVLP, which capital was invested in12 centres aggregating approximately 3.4 million square feet. Nine properties have been sold (which gains werereported as properties held for resale) as of June 30, 2008. The partners have agreed to monetize all remaininginvestments in RRVLP by November 2009.
Properties Under Development
We have a greenfield development program primarily focused on new format and urban retail centres. Theprovisions of our Declaration have the effect of limiting direct and indirect investments (net of related mortgagedebt) in non-income producing properties to no more than 15% of our Adjusted Unitholders’ Equity of the Trust(defined in the Declaration as unitholders’ equity plus accumulated amortization of income properties as recordedby us and calculated in accordance with GAAP). We undertake such developments on our own, or with establisheddevelopers on a co-ownership basis to whom we generally provide mezzanine financing. With some exceptions,from time to time, for land in the high growth markets, generally we will not acquire or fund significant expendituresfor undeveloped land unless it is zoned and an acceptable level of space has been pre-leased/pre-sold. Anadvantage of unenclosed, new format retail is that it lends itself to phased construction keyed to leasing levels,which avoids the creation of meaningful amounts of vacant space.
As a normal part of our business, we also expand and redevelop (components of) existing shopping centres tocreate and/or extract additional value (see Vision and Business Strategy).
The costs related to these (re)development activities are comprised of acquisition costs, third party and internal costsdirectly related to the development and initial leasing of the properties, including applicable salaries and other directcosts, property taxes, interest on both specific and general debt, and all incidental property revenue and expenses.
Management ’s D i scuss i on and A nal ys i sRI
OCA
NRE
AL
ESTA
TEIN
VEST
MEN
TTR
UST
SECO
ND
QU
ART
ERRE
PORT
2008
40

Management ’s D i scuss i on and A nal ys i s
The changes in our net carrying amount is as follows:
(thousands of dollars)
Three months ended June 30, Six months ended June 30,2008 2007 2008 2007
Properties under development:Balance, beginning of period $ 293,953 $ 276,944 $ 316,055 $ 228,912 Acquisitions 25,014 31,885 36,062 38,813 Development expenditures 37,920 33,886 73,549 71,222 Completion of properties (40,112) (23,315) (109,562) (45,917)
under developmentTransfers from income properties 884 13,774 25,026 40,144Dispositions and other (i) 496 _ (22,975) _
Properties under development,end of period 318,155 333,174 318,155 333,174
Properties held for resale:Balance, beginning of period 82,917 42,681 74,105 29,281 Acquisition and development 25,596 25,216 45,458 40,546
expendituresDispositions (48,954) (8,082) (60,004) (10,012)
Properties held for resale,end of period 59,559 59,815 59,559 59,815
Balance, end of period $ 377,714 $ 392,989 $ 377,714 $ 392,989
(i) Refer to footnote discussion in Income Properties.
At June 30, 2008 we have ownership interests in 15 greenfield development projects that will upon completioncomprise approximately 10.2 million square feet, of which our ownership interests will be approximately 4.1 millionsquare feet. The change in our owned interest in our greenfield development pipeline is as follows:
(thousands of square feet)
Three months ended June 30, Six months ended June 30,2008 2007 2008 2007
Properties under development:Balance, beginning of period 2,602 2,754 3,044 2,785 Acquisitions 759 296 1,156 296 Substantial completion of
greenfield development projects (227) – (994) –
Other 115 (64) 43 (95)
Properties under development,end of period 3,249 2,986 3,249 2,986
Properties held for resale (i):Balance, beginning of period 882 186 486 207 Acquisitions 250 148 646 148 Substantial completion of
greenfield development projects – – – (17)
Dispositions (449) – (449) – Other 168 – 168 (4)
Properties held for resale,end of period 851 334 851 334
Balance, end of period 4,100 3,320 4,100 3,320
(i) As discussed under Income Properties, Co-ownership Activities, we are disposing of 510,000 square feet of certain development properties toCPPIB on a forward sale basis. These square footage amounts relating to the forward sales have not been included in the above propertiesheld for resale square footage amounts.
RIO
CAN
REA
LES
TATE
INVE
STM
ENT
TRU
STSE
CON
DQ
UA
RTER
REPO
RT20
08
41
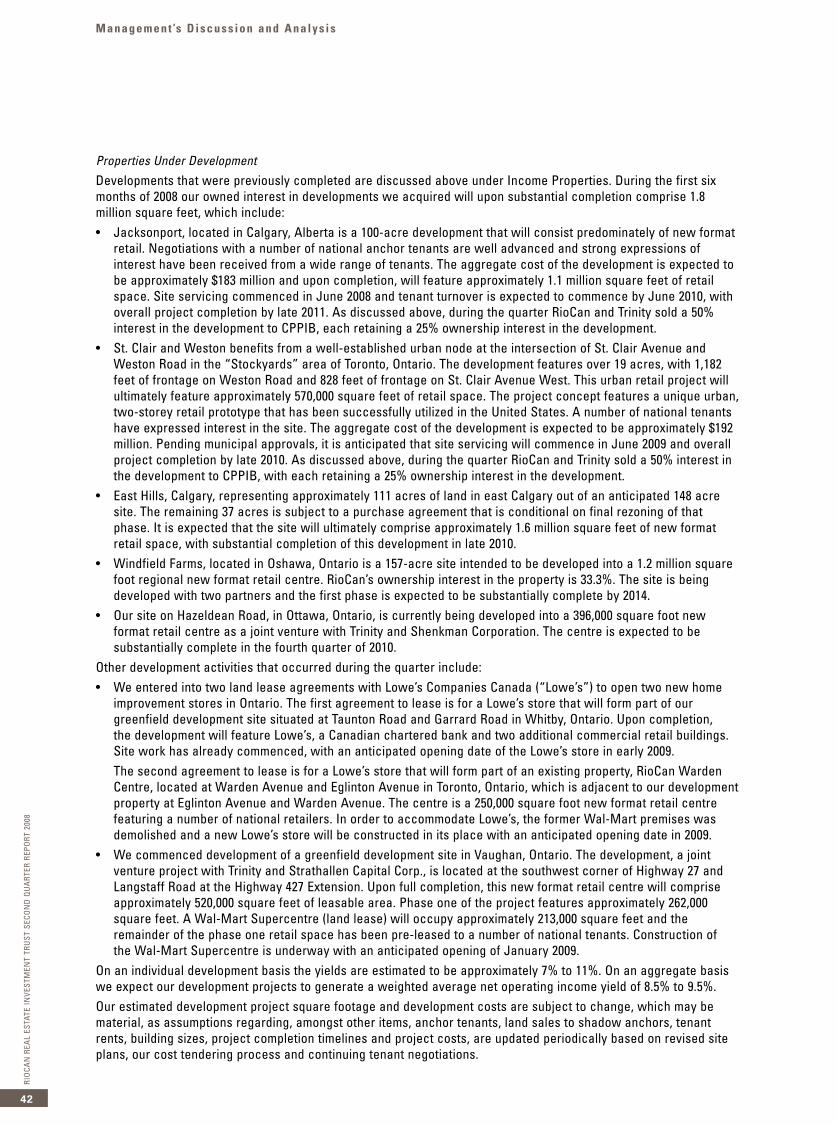
Properties Under Development
Developments that were previously completed are discussed above under Income Properties. During the first sixmonths of 2008 our owned interest in developments we acquired will upon substantial completion comprise 1.8million square feet, which include:• Jacksonport, located in Calgary, Alberta is a 100-acre development that will consist predominately of new format
retail. Negotiations with a number of national anchor tenants are well advanced and strong expressions ofinterest have been received from a wide range of tenants. The aggregate cost of the development is expected tobe approximately $183 million and upon completion, will feature approximately 1.1 million square feet of retailspace. Site servicing commenced in June 2008 and tenant turnover is expected to commence by June 2010, withoverall project completion by late 2011. As discussed above, during the quarter RioCan and Trinity sold a 50%interest in the development to CPPIB, each retaining a 25% ownership interest in the development.
• St. Clair and Weston benefits from a well-established urban node at the intersection of St. Clair Avenue andWeston Road in the “Stockyards” area of Toronto, Ontario. The development features over 19 acres, with 1,182feet of frontage on Weston Road and 828 feet of frontage on St. Clair Avenue West. This urban retail project willultimately feature approximately 570,000 square feet of retail space. The project concept features a unique urban,two-storey retail prototype that has been successfully utilized in the United States. A number of national tenantshave expressed interest in the site. The aggregate cost of the development is expected to be approximately $192million. Pending municipal approvals, it is anticipated that site servicing will commence in June 2009 and overallproject completion by late 2010. As discussed above, during the quarter RioCan and Trinity sold a 50% interest inthe development to CPPIB, with each retaining a 25% ownership interest in the development.
• East Hills, Calgary, representing approximately 111 acres of land in east Calgary out of an anticipated 148 acresite. The remaining 37 acres is subject to a purchase agreement that is conditional on final rezoning of thatphase. It is expected that the site will ultimately comprise approximately 1.6 million square feet of new formatretail space, with substantial completion of this development in late 2010.
• Windfield Farms, located in Oshawa, Ontario is a 157-acre site intended to be developed into a 1.2 million squarefoot regional new format retail centre. RioCan’s ownership interest in the property is 33.3%. The site is beingdeveloped with two partners and the first phase is expected to be substantially complete by 2014.
• Our site on Hazeldean Road, in Ottawa, Ontario, is currently being developed into a 396,000 square foot newformat retail centre as a joint venture with Trinity and Shenkman Corporation. The centre is expected to besubstantially complete in the fourth quarter of 2010.
Other development activities that occurred during the quarter include:• We entered into two land lease agreements with Lowe’s Companies Canada (“Lowe’s”) to open two new home
improvement stores in Ontario. The first agreement to lease is for a Lowe’s store that will form part of ourgreenfield development site situated at Taunton Road and Garrard Road in Whitby, Ontario. Upon completion, the development will feature Lowe’s, a Canadian chartered bank and two additional commercial retail buildings.Site work has already commenced, with an anticipated opening date of the Lowe’s store in early 2009.The second agreement to lease is for a Lowe’s store that will form part of an existing property, RioCan WardenCentre, located at Warden Avenue and Eglinton Avenue in Toronto, Ontario, which is adjacent to our developmentproperty at Eglinton Avenue and Warden Avenue. The centre is a 250,000 square foot new format retail centrefeaturing a number of national retailers. In order to accommodate Lowe’s, the former Wal-Mart premises wasdemolished and a new Lowe’s store will be constructed in its place with an anticipated opening date in 2009.
• We commenced development of a greenfield development site in Vaughan, Ontario. The development, a jointventure project with Trinity and Strathallen Capital Corp., is located at the southwest corner of Highway 27 andLangstaff Road at the Highway 427 Extension. Upon full completion, this new format retail centre will compriseapproximately 520,000 square feet of leasable area. Phase one of the project features approximately 262,000square feet. A Wal-Mart Supercentre (land lease) will occupy approximately 213,000 square feet and theremainder of the phase one retail space has been pre-leased to a number of national tenants. Construction of the Wal-Mart Supercentre is underway with an anticipated opening of January 2009.
On an individual development basis the yields are estimated to be approximately 7% to 11%. On an aggregate basiswe expect our development projects to generate a weighted average net operating income yield of 8.5% to 9.5%.Our estimated development project square footage and development costs are subject to change, which may bematerial, as assumptions regarding, amongst other items, anchor tenants, land sales to shadow anchors, tenantrents, building sizes, project completion timelines and project costs, are updated periodically based on revised siteplans, our cost tendering process and continuing tenant negotiations.
Management ’s D i scuss i on and A nal ys i sRI
OCA
NRE
AL
ESTA
TEIN
VEST
MEN
TTR
UST
SECO
ND
QU
ART
ERRE
PORT
2008
42

Management ’s D i scuss i on and A nal ys i s
RIO
CAN
REA
LES
TATE
INVE
STM
ENT
TRU
STSE
CON
DQ
UA
RTER
REPO
RT20
08
43
Highlights of our development pipeline at June 30, 2008 are as follows:
(thousands of square feet, except percentage amounts)
Estimated square feet upon completion of the development project
Total Retail RioCan’sestimated owned and Under Leasing Leasingdevelop- anchors partners’ Income develop- Total Total activity activity Anchors
As at june 30, 2008 ment (iii) interests producing ment RioCan partner (iv) % (v)
Riocan owned:Eglinton Avenue & Warden 163 – 163 – 163 163 – 135 83% ZellersAvenue, Toronto, ON Queen Street & Portland 93 – 93 – 93 93 – 77 83% Home DepotStreet, Toronto, ONTaunton Road & Garrard 147 – 147 – 147 147 – 147 100% Lowe'sRoad, Whitby, ON (i)Barrie Essa Road, 299 – 299 72 227 299 – 219 73% Loblaws, Lowe'sBarrie, ON (i)RioCan Centre Milton, 291 120 171 119 52 171 – 166 97% Home Depot*,Milton, ON Sobeys*, Cineplex RioCan Renfrew Centre, 210 74 136 45 91 136 – 53 39% Loblaws*, Renfrew, ON Staples
1,203 194 1,009 236 773 1,009 – 797 79%
Co-ownerships:Trinity
East Hills, Calgary, AB (i) 1,586 – 1,586 – 1,586 793 793 – –Fredericton, NB 337 95 242 – 242 151 91 80 33% Home Depot* Gravenhurst, ON 292 – 292 – 292 97 195 125 43% Sobeys,
Canadian Tire Hazeldean Road, Ottawa, ON 396 – 396 – 396 132 264 – –March Road, Ottawa, ON (i) 103 50 53 – 53 32 21 – – Sobeys* Paris, ON 174 – 174 – 174 109 65 – –Stouffville, ON 110 – 110 – 110 37 73 8 7%Strathallen, Vaughan, ON 520 – 520 – 520 163 358 239 46% Wal-Mart Clappison's Crossing, 327 – 327 100 227 164 164 107 33% RonaHamilton, ONHighway 401 & Thickson Road 205 – 205 99 106 51 154 99 48% Rona- Phase I, Whitby, ONRioCan Elgin Mills Crossing, 441 121 320 284 36 200 120 306 96% Home Depot*, Costco,Richmond Hill, ON Staples, Michaels
4,491 266 4,225 483 3,742 1,929 2,298 964 23%
CPPIBRioCan Meadows, 490 165 325 255 70 163 163 296 91% Loblaws*, Home Edmonton, AB (ii) Depot, Staples,
Winners, Best Buy
CPPIB/TrinityJacksonport, Calgary, AB 1,141 427 714 – 714 179 536 – –RioCan Beacon Hill, 787 259 528 467 61 211 317 528 100% Costco*, Home Depot*,Calgary, AB (ii) Canadian Tire,
Winners/HomeSense,Sport Chek, Michaels,Linens N Things,Future Shop,Shoppers Drug Mart
St. Clair Avenue and 570 – 570 – 570 143 428 – –Weston Road, Toronto, ON
2,498 686 1,812 467 1,345 533 1,281 528 29%
OtherSummerside Shopping 177 41 136 119 17 27 109 135 99% Loblaws*, RonaCentre, London, ON (i)Westney Road & Taunton 156 – 156 – 156 31 125 11 7%Road, Ajax, ON (i)Windfield Farms, 1,225 – 1,225 – 1,225 408 817 – –Oshawa, ON
1,558 41 1,517 119 1,398 466 1,051 146 10%
10,240 1,352 8,888 1,560 7,328 4,100 4,793 2,731 31%
(i) Included (or a portion thereof) in properties held for resale.
(ii) As discussed under Income Properties, Co-ownership Activities, 50% of this development is subject to a forward sale to CPPIB. As a result, only RioCan's (and Trinity’s, where applicable)interests are reported.
(iii) Retailer owned anchors include both completed and sale transactions under contract.
(iv) Leasing activity includes leasing that is conditional on receiving municipal approvals and meeting construction deadlines.
(v) Anchors that are retailer owned are designated with an asterisk (*).
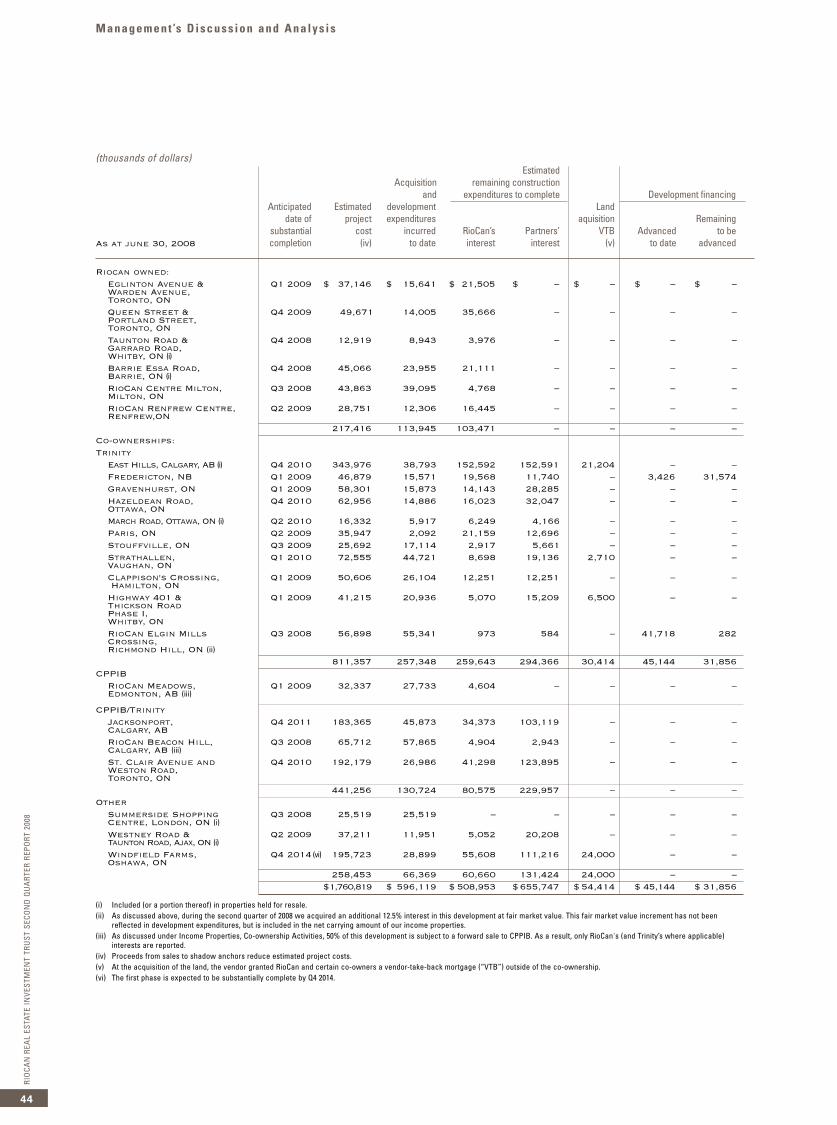
(thousands of dollars)Estimated
Acquisition remaining constructionand expenditures to complete Development financing
Anticipated Estimated development Landdate of project expenditures aquisition Remaining
substantial cost incurred RioCan’s Partners’ VTB Advanced to beAs at june 30, 2008 completion (iv) to date interest interest (v) to date advanced
Riocan owned:Eglinton Avenue & Q1 2009 $ 37,146 $ 15,641 $ 21,505 $ – $ – $ – $ –Warden Avenue, Toronto, ONQueen Street & Q4 2009 49,671 14,005 35,666 – – – – Portland Street, Toronto, ONTaunton Road & Q4 2008 12,919 8,943 3,976 – – – – Garrard Road,Whitby, ON (i)Barrie Essa Road, Q4 2008 45,066 23,955 21,111 – – – – Barrie, ON (i)RioCan Centre Milton, Q3 2008 43,863 39,095 4,768 – – – – Milton, ONRioCan Renfrew Centre, Q2 2009 28,751 12,306 16,445 – – – – Renfrew,ON
217,416 113,945 103,471 – – – –Co-ownerships:Trinity
East Hills, Calgary, AB (i) Q4 2010 343,976 38,793 152,592 152,591 21,204 – – Fredericton, NB Q1 2009 46,879 15,571 19,568 11,740 – 3,426 31,574 Gravenhurst, ON Q1 2009 58,301 15,873 14,143 28,285 – – – Hazeldean Road, Q4 2010 62,956 14,886 16,023 32,047 – – – Ottawa, ONMarch Road, Ottawa, ON (i) Q2 2010 16,332 5,917 6,249 4,166 – – – Paris, ON Q2 2009 35,947 2,092 21,159 12,696 – – – Stouffville, ON Q3 2009 25,692 17,114 2,917 5,661 – – – Strathallen, Q1 2010 72,555 44,721 8,698 19,136 2,710 – – Vaughan, ONClappison's Crossing, Q1 2009 50,606 26,104 12,251 12,251 – – – Hamilton, ON
Highway 401 & Q1 2009 41,215 20,936 5,070 15,209 6,500 – – Thickson Road Phase I, Whitby, ONRioCan Elgin Mills Q3 2008 56,898 55,341 973 584 – 41,718 282 Crossing, Richmond Hill, ON (ii)
811,357 257,348 259,643 294,366 30,414 45,144 31,856 CPPIB
RioCan Meadows, Q1 2009 32,337 27,733 4,604 – – – –Edmonton, AB (iii)
CPPIB/TrinityJacksonport, Q4 2011 183,365 45,873 34,373 103,119 – – –Calgary, ABRioCan Beacon Hill, Q3 2008 65,712 57,865 4,904 2,943 – – –Calgary, AB (iii)St. Clair Avenue and Q4 2010 192,179 26,986 41,298 123,895 – – –Weston Road, Toronto, ON
441,256 130,724 80,575 229,957 – – – Other
Summerside Shopping Q3 2008 25,519 25,519 – – – – – Centre, London, ON (i)Westney Road & Q2 2009 37,211 11,951 5,052 20,208 – – –Taunton Road, Ajax, ON (i)Windfield Farms, Q4 2014 (vi) 195,723 28,899 55,608 111,216 24,000 – –Oshawa, ON
258,453 66,369 60,660 131,424 24,000 – –$1,760,819 $ 596,119 $ 508,953 $655,747 $ 54,414 $ 45,144 $ 31,856
(i) Included (or a portion thereof) in properties held for resale.(ii) As discussed above, during the second quarter of 2008 we acquired an additional 12.5% interest in this development at fair market value. This fair market value increment has not been
reflected in development expenditures, but is included in the net carrying amount of our income properties.(iii) As discussed under Income Properties, Co-ownership Activities, 50% of this development is subject to a forward sale to CPPIB. As a result, only RioCan's (and Trinity’s where applicable)
interests are reported.(iv) Proceeds from sales to shadow anchors reduce estimated project costs.(v) At the acquisition of the land, the vendor granted RioCan and certain co-owners a vendor-take-back mortgage (“VTB”) outside of the co-ownership.(vi) The first phase is expected to be substantially complete by Q4 2014.
Management ’s D i scuss i on and A nal ys i sRI
OCA
NRE
AL
ESTA
TEIN
VEST
MEN
TTR
UST
SECO
ND
QU
ART
ERRE
PORT
2008
44

Management ’s D i scuss i on and A nal ys i s
RIO
CAN
REA
LES
TATE
INVE
STM
ENT
TRU
STSE
CON
DQ
UA
RTER
REPO
RT20
08
45
Properties Held for Resale
As discussed above (see Vision and Business Strategy), through to the end of 2010 we will continue our strategy ofleveraging our in-house real estate expertise by pursuing opportunities where value-added potential exists, but theresulting assets would not be core investments or will be owned on a joint basis with partners. Properties held forresale are properties acquired or developed for which we have no intention of their being used on a long term basisor plan to reduce our interest through the sale to a partner. Our plan is to dispose of all or part of such properties inthe ordinary course of business. We expect to earn a return on these assets through a combination of propertyoperating income earned during the relatively short holding period (which is included in net earnings) and salesproceeds. No amortization is recorded on properties held for resale.
Properties held for resale are comprised of:
• 851,000 square feet included in our greenfield development pipeline;
• 36,000 square feet built and available for sale;
• The remaining 46,000 square feet relating to our forward sales to CPPIB relating to RioCan Centre Burloak,RioCan Meadows and RioCan Beacon Hill; and
• Land use intensification activities.
The components of gains on properties held for resale are as follows:
(thousands of dollars)
Three months ended June 30, Six months ended June 30,2008 2007 2008 2007
Properties acquired or (re)developed by us for resale without partners and co-owners $ 402 $ 12,345 $ 1,543 $ 14,348
Properties acquired or (re)developed for resale with partners and co-owners 16,393 1,109 17,415 2,351
$ 16,795 $ 13,454 $ 18,958 $ 16,699
As discussed above under Income Properties, Co-ownership Activities, in the second quarter of 2008 we recorded a$15.4 million gain on the sale of interests in two development assets to CPPIB.
During the first two quarters of 2007 we recorded $11.4 million in gains relating to our land use intensificationactivities and $1.8 million relating to our share of gains from RRVLP.
Mortgages and Loans Receivable
Our Declaration contains provisions that have the effect of limiting the aggregate value of the investment by us inmortgages (other than mortgages taken back by us on the sale of our properties) up to a maximum of 30% of ourAdjusted Unitholders’ Equity. Additionally, as discussed above we are limited in the amount of capital we can investin non-income producing properties to no more than 15% of the Adjusted Unitholders’ Equity, which limitation appliesto both our greenfield developments and mortgages receivable to fund our co-owners’ share of such developments.

Management ’s D i scuss i on and A nal ys i sRI
OCA
NRE
AL
ESTA
TEIN
VEST
MEN
TTR
UST
SECO
ND
QU
ART
ERRE
PORT
2008
46
At June 30, 2008 mortgages and loans receivable bear interest at contractual rates ranging between 0% and 8% perannum with a weighted average quarter end rate of 6.09% per annum, and mature between 2008 and 2015. Futurerepayments are as follows:
(thousands of dollars)
Year ending December 31: 2008 (i) $ 121,216
2009 41,427
2010 9,792
2011 13,488
Thereafter 20,801
Contractual mortgages and loans receivable 206,724
Unamortized differential between contractual and market interest rates on mortgages and loans receivable (577)
$ 206,147
(i) The 2008 principal maturities include $75.5 million of mortgages and loans receivable that are due on demand. In July 2008 Retrocom Mid-MarketREIT ("Retrocom") repaid its $30 million secured debenture, and we received additional repayments of $7.7 million from partners.
The changes in the carrying amount of our mortgages and loans receivable are as follows:
(thousands of dollars)
Three months ended June 30, Six months ended June 30,2008 2007 2008 2007
Balance, beginning of period $ 195,726 $ 144,745 $ 211,662 $ 139,607
Principal advances 55,854 17,486 71,622 25,526
Mortgages and loans taken back on property dispositions 306 10,031 306 11,511
Principal repayments (46,844) (2,957) (83,783) (8,493)
Interest receivable 1,682 1,398 985 2,552
Other (i) – – 5,932 –
Contractual mortgages and loans receivable 206,724 170,703 206,724 170,703
Unamortized differential between contractual and market interest rates on mortgages and loans receivable (577) (1,750) (577) (1,750)
Balance, end of period $ 206,147 $ 168,953 $ 206,147 $ 168,953
(i) Refer to footnote discussion in Income Properties.
At June 30, 2008 mortgages and loans receivable from co-owners were $146.1 million compared to $120 million atDecember 31, 2007. In general, the net increase in mortgages and loans receivable relate to greenfield developmentactivities with our partners. Transactions with co-owners subsequent to the formation of a co-ownership areconsidered to be related party transactions under GAAP.
Mortgages and loans receivable advances and repayments relating to properties held for resale are included incash flows from operating activities (see Distributions to Unitholders below). All other mortgages and loansreceivable advances and repayments are included in cash flows used in investing activities.

Management ’s D i scuss i on and A nal ys i s
RIO
CAN
REA
LES
TATE
INVE
STM
ENT
TRU
STSE
CON
DQ
UA
RTER
REPO
RT20
08
47
Capital Structure
We define capital as the aggregate of unitholders’ equity and debt. Our capital management framework is designedto maintain a level of capital that: complies with investment and debt restrictions pursuant to our Declaration;complies with existing debt covenants; enables us to achieve target credit ratings; funds our business strategies;and builds long-term unitholder value. The key elements of our capital management framework are approved by ourunitholders as related to the Trust’s Declaration and by our Board of Trustees (“Board”) through their annual reviewof our strategic plan and budget, supplemented by periodic Board and Board committee meetings. Capital adequacyis monitored by us by assessing performance against the approved annual plan throughout the year, which isupdated accordingly, and by monitoring adherence to investment and debt restrictions contained in the Declarationand debt covenants (see Note 18 to our interim consolidated financial statements).
Our capital structure for the periods is:
(thousands of dollars, except percentage amounts)Increase
June 30, 2008 December 31, 2007 (decrease)
Capital:
Mortgages payable $ 2,326,348 $ 2,251,506 $ 74,842
Debentures payable 874,435 983,742 (109,307)
Unitholders' equity 1,795,828 1,677,732 118,096
Total capital $ 4,996,611 $ 4,912,980 $ 83,631
Debt to aggregate assets ratio (i) 54.5% 56.3% (1.8%)
(i) RioCan’s Declaration provides for maximum total debt levels up to 60% of Aggregate Assets (herein referred to as “Debt to Aggregate Assetsratio” with Aggregate Assets defined in the Declaration as total assets plus accumulated amortization of income properties as recorded by it,with some exceptions, and calculated in accordance with GAAP).
For the twelve month period ended June 30 2008 2007 Decrease
Interest coverage ratio (i) 2.6 2.7 (0.1)
Debt service coverage ratio (ii) 2.0 2.0 –
(i) Interest coverage is defined as GAAP net earnings for a rolling twelve month period, before net interest expense, income taxes and incomeproperty amortization (including provisions for impairment) divided by total interest expense.
(ii) We define debt service coverage as GAAP net earnings for a rolling twelve month period, before net interest expense, income taxes andincome property amortization (including provisions for impairment) divided by total interest expense and scheduled mortgage principalamortization.
RioCan’s Declaration provides for maximum total debt levels up to 60% of Aggregate Assets. At June 30, 2008 ourindebtedness was 54.5% of Aggregate Assets, and we could therefore incur additional indebtedness ofapproximately $813 million and still not exceed the 60% leverage limit. As a matter of policy, we would not likelyincur indebtedness significantly beyond 58% of Aggregate Assets. On this basis we could therefore incur additionalindebtedness of approximately $494 million.
The decrease in the Debt to Aggregate Assets ratio during the periods primarily arises from our April 2008 issue of7.1 million units on a bought-deal basis at $21.05 per unit for cash proceeds of approximately $150 million. Theseproceeds are expected to be/have been used, among other items, to repay indebtedness incurred under ouroperating credit facilities, to fund our acquisition and development programs and potential future propertyacquisitions and development activities, and the balance for general trust purposes.
The period over period decrease in the interest coverage ratio arises as a result of increased aggregateindebtedness during the periods which was partially used to fund the Trust’s ongoing development pipeline, which isnot yet income producing.

Management ’s D i scuss i on and A nal ys i sRI
OCA
NRE
AL
ESTA
TEIN
VEST
MEN
TTR
UST
SECO
ND
QU
ART
ERRE
PORT
2008
48
Debt
Standard & Poor’s Ratings Services (“S&P”) and Dominion Bond Rating Service Limited (“DBRS”) provide creditratings of debt securities for commercial entities. A credit rating generally provides an indication of the risk that theborrower will not fulfill its obligations in a timely manner with respect to both interest and principal commitments.Rating categories range from highest credit quality (generally AAA) to default in payment (generally D).
At both June 30, 2008 and December 31, 2007 S&P provided us with an entity credit rating of BBB and a credit ratingof BBB- relating to RioCan’s senior unsecured debentures payable (“debentures”). A credit rating of BBB by S&Pexhibits adequate protection parameters. However, adverse economic conditions or changing circumstances aremore likely to lead to a weakened capacity of the obligor to meet its financial commitment on the obligation.
At both June 30, 2008 and December 31, 2007 DBRS provided us with a credit rating of BBB (high) relating toRioCan’s debentures. A credit rating of BBB by DBRS is generally an indication of adequate credit quality, whereprotection of interest and principal is considered acceptable but the issuing entity is fairly susceptible to adversechanges in financial and economic conditions, or there may be other adverse conditions present which reduce thestrength of the entity and its rated securities.
A credit rating of BBB- or higher is an investment grade rating.
Revolving Lines of Credit
At June 30, 2008 we had the following revolving lines of credit in place with Canadian chartered banks:
• One revolving operating line of credit has a maximum loan amount of $310 million, against which $56.5 million ofletters of credit (“LC”) were drawn. This facility is secured by a charge against certain income properties. Shouldthe aggregate agreed values for lending purposes of such properties fall to a level which would not support aborrowing of $310 million (through reappraisal or sale of the property providing the security), RioCan has theoption to provide substitute income properties as additional security.
$110 million of this facility is due December 31, 2008. The remaining $200 million of this facility is due upon sixmonths notice by the lender if not in default, and bears interest at the bank’s prime rate or, at our option, thebanker’s acceptance rate plus 0.95% (with LC stamping fees of 0.875% per annum). Aside from the requirement tonot exceed the 60% leverage limit required by our Declaration, this facility is subject to customary terms andconditions which we believe would not limit the distributions we currently expect to distribute to our unitholdersin the foreseeable future.
During the second quarter we repaid $84.7 million of cash advances previously drawn against our operating line of credit.
• We have a 50% interest in a RioKim LC facility, which provides for a maximum amount of $7 million against which$5.5 million of LCs were drawn. The LC stamping fees on this facility are 1% per annum. This facility is subject torepayment not later than one year from the date of issuance of an LC.
Debentures Payable
At June 30, 2008 we had seven series of debentures outstanding totalling $880 million. At December 31, 2007 we hadeight series of debentures outstanding totalling $990 million.
Our debentures have covenants relating to our 60% leverage limit discussed above, maintenance of a $1 billionAdjusted Book Equity (defined as unitholders’ equity plus accumulated building amortization calculated inaccordance with GAAP), and maintenance of an interest coverage ratio of 1.65 times or better. Our Series Idebentures aggregating $100 million have additional covenants in that we have the right at any time to convert these debentures to mortgage debt (subject to the acceptability of the security given to the debentureholders). In such event, the covenants relating to our 60% leverage limit, minimum book equity and interest coverage ratiowould be eliminated for this debenture.
During the first six months of 2008 we repaid our $110 million Series E debentures at maturity. There were nodebenture transactions during the first six months of 2007.

Management ’s D i scuss i on and A nal ys i s
RIO
CAN
REA
LES
TATE
INVE
STM
ENT
TRU
STSE
CON
DQ
UA
RTER
REPO
RT20
08
49
At June 30, 2008 our debentures bear interest at contractual rates ranging between 4.7% and 5.953% per annum witha weighted average quarter end rate of 5.22% per annum, and mature between 2009 and 2026. Changes in thecarrying amount of our debentures payable resulted primarily from the following:
(thousands of dollars)
Three months ended June 30, Six months ended June 30,2008 2007 2008 2007
Balance, beginning of period $ 880,000 $ 870,000 $ 990,000 $ 870,000
Repayments – – (110,000) –
Contractual obligations 880,000 870,000 880,000 870,000
Unamortized debt financing costs (5,565) (6,090) (5,565) (6,090)
Balance, end of period $ 874,435 $ 863,910 $ 874,435 $ 863,910
Mortgages Payable
At June 30, 2008 we had mortgages payable of $2.33 billion as compared to $2.25 billion at December 31, 2007. Thevast majority of our mortgage indebtedness provides recourse to the assets of the Trust (as opposed to only havingrecourse to the specific property charged). We follow this policy as it generally results in lower interest costs andhigher loan-to-value ratios than would otherwise be obtained.
At June 30, 2008 the contractual interest rates on our mortgages payable ranged from 0% to 11.88% per annum witha quarter end weighted average interest rate of 6.17% per annum. Changes in the carrying amount of our mortgagespayable resulted primarily from the following:
(thousands of dollars)
Three months ended June 30, Six months ended June 30,2008 2007 2008 2007
Balance, beginning of period $ 2,311,988 $ 2,052,628 $ 2,242,002 $ 1,910,587
Borrowings:
New 143,173 81,545 205,903 232,442
Net advances on operating
line of credit – – 84,734 –
Assumed/granted on the acquisition of properties 54,412 – 83,634 65,028
Principal repayments:
Scheduled amortization (14,344) (13,033) (28,590) (25,543)
Operating line of credit (84,734) (84,734)
At maturity (90,194) (71,536) (164,803) (132,910)
Other (i) – – (17,845) –
Contractual obligations 2,320,301 2,049,604 2,320,301 2,049,604
Unamortized differential between contractual and market interest rates on liabilities assumed at the acquisition of properties 11,697 17,745 11,697 17,745
Unamortized debt financing costs (5,650) (5,489) (5,650) (5,489)
Balance, end of period $ 2,326,348 $ 2,061,860 $ 2,326,348 $ 2,061,860
(i) Refer to footnote discussion in Income Properties.
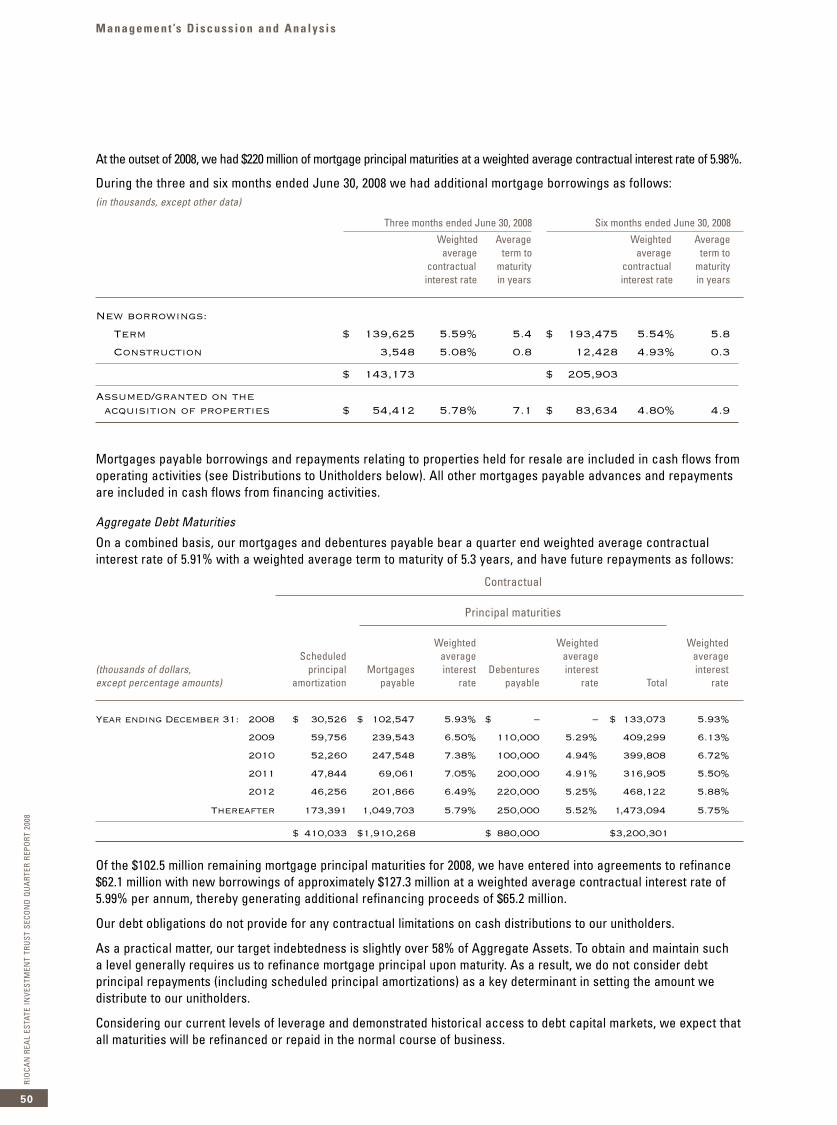
Management ’s D i scuss i on and A nal ys i sRI
OCA
NRE
AL
ESTA
TEIN
VEST
MEN
TTR
UST
SECO
ND
QU
ART
ERRE
PORT
2008
50
At the outset of 2008, we had $220 million of mortgage principal maturities at a weighted average contractual interest rate of 5.98%.
During the three and six months ended June 30, 2008 we had additional mortgage borrowings as follows:(in thousands, except other data)
Three months ended June 30, 2008 Six months ended June 30, 2008
Weighted Average Weighted Averageaverage term to average term to
contractual maturity contractual maturityinterest rate in years interest rate in years
New borrowings:Term $ 139,625 5.59% 5.4 $ 193,475 5.54% 5.8 Construction 3,548 5.08% 0.8 12,428 4.93% 0.3
$ 143,173 $ 205,903
Assumed/granted on the acquisition of properties $ 54,412 5.78% 7.1 $ 83,634 4.80% 4.9
Mortgages payable borrowings and repayments relating to properties held for resale are included in cash flows fromoperating activities (see Distributions to Unitholders below). All other mortgages payable advances and repaymentsare included in cash flows from financing activities.
Aggregate Debt Maturities
On a combined basis, our mortgages and debentures payable bear a quarter end weighted average contractualinterest rate of 5.91% with a weighted average term to maturity of 5.3 years, and have future repayments as follows:
Contractual
Principal maturities
Weighted Weighted WeightedScheduled average average average
(thousands of dollars, principal Mortgages interest Debentures interest interestexcept percentage amounts) amortization payable rate payable rate Total rate
Year ending December 31: 2008 $ 30,526 $ 102,547 5.93% $ – – $ 133,073 5.93%
2009 59,756 239,543 6.50% 110,000 5.29% 409,299 6.13%
2010 52,260 247,548 7.38% 100,000 4.94% 399,808 6.72%
2011 47,844 69,061 7.05% 200,000 4.91% 316,905 5.50%
2012 46,256 201,866 6.49% 220,000 5.25% 468,122 5.88%
Thereafter 173,391 1,049,703 5.79% 250,000 5.52% 1,473,094 5.75%
$ 410,033 $1,910,268 $ 880,000 $3,200,301
Of the $102.5 million remaining mortgage principal maturities for 2008, we have entered into agreements to refinance$62.1 million with new borrowings of approximately $127.3 million at a weighted average contractual interest rate of5.99% per annum, thereby generating additional refinancing proceeds of $65.2 million.
Our debt obligations do not provide for any contractual limitations on cash distributions to our unitholders.
As a practical matter, our target indebtedness is slightly over 58% of Aggregate Assets. To obtain and maintain such a level generally requires us to refinance mortgage principal upon maturity. As a result, we do not consider debtprincipal repayments (including scheduled principal amortizations) as a key determinant in setting the amount wedistribute to our unitholders.
Considering our current levels of leverage and demonstrated historical access to debt capital markets, we expect thatall maturities will be refinanced or repaid in the normal course of business.

Management ’s D i scuss i on and A nal ys i s
RIO
CAN
REA
LES
TATE
INVE
STM
ENT
TRU
STSE
CON
DQ
UA
RTER
REPO
RT20
08
51
Trust Units
As discussed above, in April 2008 we issued 7.1 million units on a bought-deal basis at $21.05 per unit for cashproceeds of approximately $150 million.
Unit issuances during the periods are as follows:
(number of units in thousands)
Three months ended June 30, Six months ended June 30,2008 2007 2008 2007
Units outstanding, beginning of period 211,966 208,043 210,883 199,647
Units issued:
Public offering 7,130 – 7,130 6,600
Exchangeable limited partnership ("LP") units (i) – – – 829
Distribution reinvestment and direct purchase plans 860 704 1,801 1,378
Unit option plan 150 354 292 647
Units outstanding, end of period 220,106 209,101 220,106 209,101
(i) In the first quarter of 2007 we acquired YEC, which consideration included the issuance to the vendors of exchangeable LP units forapproximately $21 million. We are the general partner of the LP. The LP units are entitled to distributions equivalent to distributions on RioCanunits, must be exchanged for RioCan units on a one-for-one basis, and are exchangeable at any time at the option of the holder. As requiredby GAAP, these exchangeable LP units have been accounted for as unitholders’ equity. To date, no LP units have been exchanged by thevendors for RioCan units.
All trust units outstanding have equal rights and privileges and entitle the holder thereof to one vote for each unit atall meetings of unitholders.
We provide long term incentives to certain employees by granting options through a unit option plan. Optionsgranted permit employees to acquire units at an exercise price equal to the closing price of such units under optionat the date prior to the day the option is granted. The objective of granting unit based compensation is to encourageplan members to acquire an ownership interest in us over time and acts as a financial incentive for such persons toact in the long term interests of RioCan and its unitholders. At June 30, 2008, 3.2 million units remain available forissuance under the unit option plan.
During the three months ended June 30, 2008 we granted 1 million unit options (1.6 million for the first six months of2008) under the unit option plan compared to 860,000 for the same period during 2007 (1.4 million for the first sixmonths of 2007). Additionally, we have a Restricted Equity Unit (“REU”) plan which provides for an allotment of REUsto each non-employee trustee. The value of the REUs allotted appreciate or depreciate with increases or decreasesin the market price of the Trust’s units.
Other Capital Commitments and Contingencies
In February 2008 we completed the final closing of our acquisition of a 50% interest in a completed developmentproperty. At any time within three years after the final closing of this transaction, the vendor had the right to sell thewhole or part of its remaining 50% interest (approximately 570,000 square feet) to us at fair market value. In July 2008 thevendor released us from this obligation (refer to our discussion above under Income Properties, Co-ownership Activities).
We are involved with litigation and claims which arise from time to time in the normal course of business. We are ofthe opinion that any liability that may arise from such contingencies will not have a significant adverse effect on ourinterim consolidated financial statements.
Additionally, our Declaration requires us to distribute to our unitholders in each year an amount not less than theTrust’s income for the year, as calculated in accordance with the Income Tax Act (Canada) (the “Act”) after allpermitted deductions under the Act have been taken. We rely upon forward looking cash flow information includingforecasts and budgets to establish the level of cash distributions to unitholders.

Management ’s D i scuss i on and A nal ys i sRI
OCA
NRE
AL
ESTA
TEIN
VEST
MEN
TTR
UST
SECO
ND
QU
ART
ERRE
PORT
2008
52
Future Income Taxes
Bill C-52 is not expected to apply to RioCan until 2011 as it provides for a transition period for publicly traded truststhat existed prior to November 1, 2006. In addition, Bill C-52 will not apply to an entity that meets specific definedrequirements under the legislation for the REIT Exemption. As discussed under Vision and Business Strategy, underthis legislation for RioCan to qualify for the REIT Exemption we will essentially be required to ensure that 95% of our revenue is derived from rental revenue from long-lived income properties and fee income from such propertiesin which we have an interest. RioCan intends to take the necessary steps to qualify for the REIT Exemption prior to 2011.
On July 14, 2008, the Department of Finance (Canada) released draft legislation to Bill C-52, which include amongother items, the removal of the foreign property limitation and addresses a number of highly technical issues whichassist in achieving the REIT Exemption (see Risks and Uncertainties below).
GAAP requires us to recognize future income taxes based on our structure at the balance sheet date, and does notpermit us to consider future changes to our structure that we will make to enable us to qualify for the REITExemption. The impact (including the reversal of future income taxes previously recorded by us) of any changesundertaken by us to qualify for the REIT Exemption will not be recognized in the financial statements until such timeas we so qualify.
Non-cash future income tax charges recorded by us arise from temporary differences between the estimatedaccounting and tax basis of our assets and liabilities expected to reverse after January 1, 2011, and relate primarily to our real estate investments, the largest component of which is the difference between net book value and undepreciated capital cost for tax purposes. These charges have no current impact on our cash flows or distributions.
A summary of our temporary differences between the accounting and tax basis of our assets and liabilities is as follows:
(thousands of dollars)
Components of Future Income Taxes on the Balance Sheets
June 30, 2008 December 31, 2007
Tax effected temporary differences between accounting and tax basis of:
Real estate investments $ 145,000 $ 139,000
Other 4,000 5,000
Future income taxes $ 149,000 $ 144,000

Management ’s D i scuss i on and A nal ys i s
RIO
CAN
REA
LES
TATE
INVE
STM
ENT
TRU
STSE
CON
DQ
UA
RTER
REPO
RT20
08
53
(thousands of dollars)
Three months ended June 30, Six months ended June 30,2008 2007 2008 2007
Statements of Earnings (Loss)
Current income taxes at Canadian statutory tax rate $ – $ – $ – $ –
Increase in future income taxes resulting from a change in tax status with enactment of Bill C-52 on June 22, 2007 – 150,000 – 150,000
Increase in future income taxes resulting from a change during the period in temporary differences expected to reverse after 2010 5,700 – 5,700 –
Future income tax expense $ 5,700 $ 150,000 $ 5,700 $ 150,000
Statements of Unitholders' Equity
Impact of future income taxes resulting from a change during the period in temporary differences from unit issue costs expected to reverse after 2010 $ (700) $ – $ (700) $ –
Off Balance Sheet Liabilities and Guarantees
At June 30, 2008 we have real estate investments accounted for using the equity method that could be viewed to giverise to off balance sheet debt of $12.3 million, which would increase our indebtedness to 54.6% of Aggregate Assets.
We provide guarantees on behalf of third parties, including co-owners and partners (for which we generally are paida fee) as, among other reasons, it generally results in lower interest costs and higher loan-to-value ratios thanwould otherwise be obtained. Also, our guarantees remain in place for certain debts assumed by purchasers inconnection with property dispositions and will remain until such debts are extinguished or lenders agree to releaseRioCan’s covenants. Recourse would be available to us under these guarantees in the event of a default by theborrowers, in which case our claim would be against the underlying real estate investments. At June 30, 2008 suchguarantees amount to approximately $533.8 million and expire between 2008 and 2034. We determined that theestimated fair value of the borrowers’ interests in the real estate investments is greater than the mortgages payablefor which we have provided guarantees, and therefore we have not provided for any losses on such guarantees inour consolidated financial statements.

Management ’s D i scuss i on and A nal ys i sRI
OCA
NRE
AL
ESTA
TEIN
VEST
MEN
TTR
UST
SECO
ND
QU
ART
ERRE
PORT
2008
54
At June 30, 2008 the parties on behalf of which we have outstanding guarantees are as follows:
(thousands of dollars)
Partners and co-owners
Kimco $ 261,488
Trinity 68,320
Devimco 6,750
Other 36,097
Assumption of mortgages by purchasers on property dispositions
Retrocom 64,141
RRVLP 11,261
Other 85,781
$ 533,838
Liquidity
Liquidity refers to our having and/or generating sufficient amounts of cash and equivalents to fund our ongoingoperational commitments, distributions to unitholders and planned growth in our business.
We retain a portion of our annual operating cash flows to help fund ongoing maintenance capital expenditures,tenant installation costs and long term unfunded contractual obligations, among other items.
Cash on hand, borrowings under our revolving credit facilities, and Canadian equity and debt capital markets alsoprovide the necessary liquidity to fund our ongoing and future capital expenditures and obligations. At June 30, 2008we have:
• $57.1 million of cash and short term investments;
• $254 million of undrawn bank lines of credit; and
• Indebtedness was 54.5% of Aggregate Assets, and we could therefore incur additional indebtedness ofapproximately $813 million and still not exceed the 60% leverage limit.
Unitholder distributions reinvested through the distribution reinvestment and direct purchase plans also contributecapital to fund our activities (see Distributions to Unitholders below).
Distributions to Unitholders
Distributions to our unitholders are as follows:
(thousands of dollars)
Three months ended June 30, Six months ended June 30,2008 2007 2008 2007
Distributions to unitholders $ 74,172 $ 68,851 $ 145,571 $ 136,476
Distributions reinvested through the distribution reinvestment and direct purchase plans (17,834) (17,427) (36,762) (34,007)
$ 56,338 $ 51,424 $ 108,809 $ 102,469
Distributions reinvested through the distribution reinvestment and direct purchase plans as a percentage of distributions to unitholders 24.0% 25.3% 25.3% 24.9%
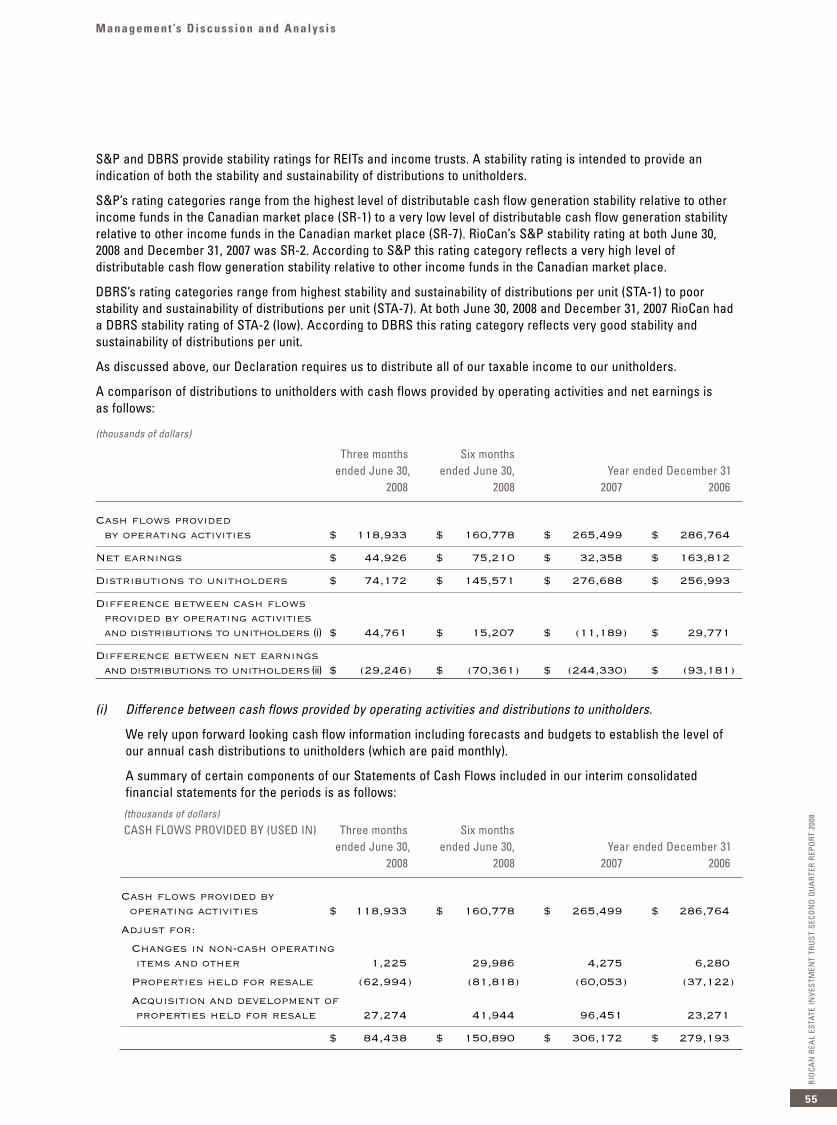
Management ’s D i scuss i on and A nal ys i s
RIO
CAN
REA
LES
TATE
INVE
STM
ENT
TRU
STSE
CON
DQ
UA
RTER
REPO
RT20
08
55
S&P and DBRS provide stability ratings for REITs and income trusts. A stability rating is intended to provide anindication of both the stability and sustainability of distributions to unitholders.
S&P’s rating categories range from the highest level of distributable cash flow generation stability relative to otherincome funds in the Canadian market place (SR-1) to a very low level of distributable cash flow generation stabilityrelative to other income funds in the Canadian market place (SR-7). RioCan’s S&P stability rating at both June 30,2008 and December 31, 2007 was SR-2. According to S&P this rating category reflects a very high level ofdistributable cash flow generation stability relative to other income funds in the Canadian market place.
DBRS’s rating categories range from highest stability and sustainability of distributions per unit (STA-1) to poorstability and sustainability of distributions per unit (STA-7). At both June 30, 2008 and December 31, 2007 RioCan hada DBRS stability rating of STA-2 (low). According to DBRS this rating category reflects very good stability andsustainability of distributions per unit.
As discussed above, our Declaration requires us to distribute all of our taxable income to our unitholders.
A comparison of distributions to unitholders with cash flows provided by operating activities and net earnings is as follows:
(thousands of dollars)
Three months Six monthsended June 30, ended June 30, Year ended December 31
2008 2008 2007 2006
Cash flows provided by operating activities $ 118,933 $ 160,778 $ 265,499 $ 286,764
Net earnings $ 44,926 $ 75,210 $ 32,358 $ 163,812
Distributions to unitholders $ 74,172 $ 145,571 $ 276,688 $ 256,993
Difference between cash flows provided by operating activities and distributions to unitholders (i) $ 44,761 $ 15,207 $ (11,189) $ 29,771
Difference between net earnings and distributions to unitholders (ii) $ (29,246) $ (70,361) $ (244,330) $ (93,181)
(i) Difference between cash flows provided by operating activities and distributions to unitholders.
We rely upon forward looking cash flow information including forecasts and budgets to establish the level ofour annual cash distributions to unitholders (which are paid monthly).
A summary of certain components of our Statements of Cash Flows included in our interim consolidatedfinancial statements for the periods is as follows:
(thousands of dollars)
CASH FLOWS PROVIDED BY (USED IN) Three months Six monthsended June 30, ended June 30, Year ended December 31
2008 2008 2007 2006
Cash flows provided by operating activities $ 118,933 $ 160,778 $ 265,499 $ 286,764
Adjust for:
Changes in non-cash operating items and other 1,225 29,986 4,275 6,280
Properties held for resale (62,994) (81,818) (60,053) (37,122)
Acquisition and development of properties held for resale 27,274 41,944 96,451 23,271
$ 84,438 $ 150,890 $ 306,172 $ 279,193

Management ’s D i scuss i on and A nal ys i sRI
OCA
NRE
AL
ESTA
TEIN
VEST
MEN
TTR
UST
SECO
ND
QU
ART
ERRE
PORT
2008
56
We do not use GAAP defined cash flows provided by operating activities to establish the level of unitholders’distributions because, among other items, it includes the following:
• Generally, the timing of the payment of property tax installments and operating costs do not coincide withcollections pursuant to tenant leases. We typically collect property taxes and operating cost recoveriesfrom our tenants in equal monthly installments (based on annual estimates of such costs), with anyshortfall being collected from our tenants after the end of the year. This usually results in fluctuations inthe timing of the related cash flows during the reporting periods.
• We also invest in maintenance capital expenditures on a continuous basis to physically maintain ourincome properties. Typical costs incurred are for roof replacement programs and the repaving of parkinglots. Tenant leases generally provide for our ability to substantially recover such costs from tenants overtime as property operating costs. As a result, the cash outflows for maintenance capital expendituresfluctuate during the reporting periods.
• Debenture interest and interest on certain mortgages payable are paid by us semi-annually. As a result,the cash outflows for interest paid fluctuate during the reporting periods.
• As previously discussed under Properties Held For Resale, where we own trading assets with partners wemay also earn out-performance incentive fees for exceeding agreed upon benchmarks. Out-performanceincentive fees in some cases may be earned and recorded but not payable until future reporting periods inaccordance with related agreements. Gains and related performance fees (being disposition-dependent)are not earned in consistent amounts in each and every reporting period. The result is that we generallyexperience fluctuations in our gains from properties held for resale and fees and other income.
• While we consider gains from properties held for resale, among other items, in establishing the level ofcash distributions to unitholders, for this purpose we consider the expenditures (net of third-partyfinancing) relating to these projects as capital in nature. Additionally, on occasion we may finance thepurchaser of certain properties held for resale with a vendor-take-back mortgage, with the result that notall the proceeds are received by us upon disposition of such properties until future reporting periods.
As indicated above, in determining the annual level of distributions to unitholders we look at forward lookingcash flow information including forecasts and budgets. Furthermore, we do not consider periodic cash flowfluctuations resulting from items such as the timing of property operating costs and tax installments,maintenance capital expenditures and semi-annual debenture and mortgages payable interest payments indetermining the level of distributions to unitholders. Additionally, as indicated above in establishing the level of cash distributions to unitholders, for this purpose we consider, among other items, the expenditures (net ofthird-party financing) relating to properties held for resale projects and scheduled amortization of mortgageprincipal as capital in nature. Therefore, our annual distributions to unitholders have been, and are expected tocontinue to be, funded by cash flows generated from our real estate investments and fee generating activities.
(ii) Difference between net earnings and distributions to unitholders.
We do not use net earnings in accordance with GAAP as the basis to establish the level of unitholders’distributions, as net earnings include, among other items, non-cash expenses for amortization (includingimpairment provisions) related to our income property portfolio and future income taxes. We believe, amongother items, that:
• It is appropriate for the Trust to ignore property related amortization primarily on the basis that the value ofour real estate investments generally does not diminish over time, and because consideration is given byus to maintenance capital expenditures for our property portfolio in establishing the level of our annualdistributions to unitholders.
• Subject to further review, we are currently not considering future income taxes as it is our intention to qualify for the REIT Exemption prior to 2011 (see Future Income Taxes above).

Management ’s D i scuss i on and A nal ys i s
RIO
CAN
REA
LES
TATE
INVE
STM
ENT
TRU
STSE
CON
DQ
UA
RTER
REPO
RT20
08
57
Results of Operations
The specific components of our net earnings for each respective period are as follows:
(thousands of dollars, except per unit amounts)Three months ended June 30, Increase Six months ended June 30,
2008 2007 (decrease) 2008 2007 Increase
Rental revenue $ 169,863 $ 158,309 7% $ 342,985 $ 323,265 6%Property operating costs 59,754 54,997 9% 124,388 111,774 11%
Net operating income 110,109 103,312 7% 218,597 211,491 3%Fees and other income 3,690 3,871 (5%) 7,335 6,672 10%Interest income 4,037 3,873 4% 8,474 7,361 15%Gains on properties held
for resale 16,795 13,454 25% 18,958 16,699 14%
134,631 124,510 253,364 242,223
Interest expense 41,575 38,501 8% 83,307 77,923 7% General and administrative
expense 6,657 6,256 6% 15,992 13,209 21%
FFO (i) 86,399 79,753 8% 154,065 151,091 2%Amortization expense 35,773 35,860 0% 73,155 69,798 5%Future income tax expense 5,700 150,000 5,700 150,000
Net earnings (loss) $ 44,926 $ (106,107) 142% $ 75,210 $ (68,707) 209%
Net earnings (loss) per unit - basic and diluted $ 0.21 $ (0.51) $ 0.35 $ (0.33)
FFO per unit (i) $ 0.40 $ 0.38 $ 0.72 $ 0.73
(i) Refer to our discussion below under FFO.
Net Operating Income
Net operating income (“NOI”) is a non-GAAP measure and is defined by us as rental revenue from incomeproperties less property operating costs. Our method of calculating NOI may differ from other issuers’ methods andaccordingly, may not be comparable to NOI reported by other issuers.
Rental revenue includes all amounts earned from tenants related to lease agreements, including property tax andoperating cost recoveries, to the extent recoverable under tenant leases. Amounts payable by tenants to terminatetheir lease prior to their contractual expiry date (“lease cancellation fees”) are included in rental revenue.
The geographical diversification of our retail property portfolio by province is as follows:
(i) The portfolio acquisition closed at the end of the second quarter of 2008 (refer to our discussion under Income Properties).
p8-1 p8-2
p11-1 p11-2
p11-3 p11-4
p36-1 p36-2
p36-3 p36-4
NLA at June 30, 2008
0.7% Newfoundland 0.5% Prince Edward Island 0.5% Manitoba 0.2% Nova Scotia
p8-1 p8-2
p11-1 p11-2
p11-3 p11-4
p36-1 p36-2
p36-3 p36-4
Rental revenue for the sixmonths ended June 30, 2008
Ontario 59.8%Quebec 19.0%Alberta 9.0%
British Columbia 5.5%New Brunswick 3.8%Saskatchewan 1.0%
0.5% Saskatchewan 0.5% Prince Edward Island 0.4% Newfoundland 0.0% Nova Scotia (i)
Ontario 62.2% Quebec 17.5%Alberta 10.2%
British Columbia 6.0%New Brunswick 2.2%
Manitoba 0.5%

Management ’s D i scuss i on and A nal ys i sRI
OCA
NRE
AL
ESTA
TEIN
VEST
MEN
TTR
UST
SECO
ND
QU
ART
ERRE
PORT
2008
58
No individual tenant comprised more than 5.4% of our portfolio’s annualized rental revenue (see Risks andUncertainties, Tenant Concentrations for a listing of our 10 largest tenants).
The occupancy rate of our portfolio over the last 8 quarters is as follows:
Our NOI for the periods is as follows:
(thousands of dollars)Three months ended June 30, Increase Six months ended June 30, Increase
2008 2007 (decrease) 2008 2007 (decrease)
Base rent $ 112,300 $ 105,354 7% $ 223,009 $ 207,904 7%Property taxes and operating
cost recoveries 57,203 52,172 10% 119,067 106,470 12%
169,503 157,526 8% 342,076 314,374 9%Lease cancellation fees 360 783 (54%) 909 8,891 (90%)
Rental Revenue 169,863 158,309 7% 342,985 323,265 6%
Recoverable property taxes and operating costs 57,808 53,045 9% 120,654 108,440 11%
Non-recoverable propertyoperating and site administration costs 1,946 1,952 0% 3,734 3,334 12%
Property operating costs 59,754 54,997 9% 124,388 111,774 11%
NOI $ 110,109 $ 103,312 7% $ 218,597 $ 211,491 3%
Noi as a percentage of rental revenue (excluding the impact of lease cancellation fees) 65% 65% 0% 64% $ 64% 0%
As discussed under Income Properties, at June 30, 2008 our NLA was 32.5 million square feet, an increase of 1.6 million square feet from 30.9 million square feet at June 30, 2007.
The amount of property taxes and operating costs we can recover from our tenants is impacted by property vacancyand fixed cost recovery tenancies.
Our property operating costs are generally higher during the winter months. During these periods, our NOI margintrends slightly downwards as such amounts are recoverable from our tenants at our cost and are impacted by fixedcost recovery tenancies.
100.0%
95.0%97.5% 97.7% 97.1% 97.7% 97.6% 97.6% 96.6% 97.0%
Q3 2006 Q4 2006 Q1 2007 Q2 2007 Q3 2007 Q4 2007 Q1 2008 Q2 2008
p36-3 p36-4
NLA at June 30, 2007
9.0% Alberta
5.8% British Columbia 4.0% New Brunswick 1.0% Saskatchewan
Prince Edward Island 0.6%Manitoba 0.6%
Newfoundland 0.6%
Ontario 60.2% Quebec 18.2%
p36-3 p36-4
Rental revenue for the sixmonths ended June 30, 2007
9.9% Alberta
6.4% British Columbia 2.5% New Brunswick
Saskatchewan 0.6%Manitoba 0.6%
Prince Edward Island 0.4%Newfoundland 0.3%
Ontario 61.8%Quebec 17.5%

Management ’s D i scuss i on and A nal ys i s
RIO
CAN
REA
LES
TATE
INVE
STM
ENT
TRU
STSE
CON
DQ
UA
RTER
REPO
RT20
08
59
Additionally, on acquisition of YEC in January 2007 the office component comprising 707,000 square feet had avacancy rate of 10.5%. At June 30, 2008 the office component vacancy rate of this centre is 3.7%.
Our NOI margin adjusting for the impact of the above two items would be 67% for both the three and six monthsended June 30, 2008 and 2007.
The change in NOI during the periods arises as follows:
(thousands of dollars)Three months ended June 30, Increase Six months ended June 30, Increase
2008 2007 (decrease) 2008 2007 (decrease)
Same properties $ 99,452 $ 97,996 1.5% $ 190,394 $ 189,086 0.7%2008 and 2007 acquisitions 2,462 – 100% 13,142 5,839 125.1%2008 and 2007 dispositions – 277 (100%) – 594 (100%)Greenfield development 5,527 2,175 154.1% 9,498 3,305 187.4%
NOI before adjustments 107,441 100,448 7.0% 213,034 198,824 7.1%Lease cancellation fees 360 783 (54.0%) 909 8,891 (89.8%)Straight-lining of rents 1,729 1,741 (0.7%) 3,441 3,217 7.0%Differential between
contractual and market rents 579 340 70.3% 1,213 559 117.0%
NOI $ 110,109 $ 103,312 6.6% $ 218,597 $ 211,491 3.4%
Same properties refer to those income properties that were owned by us throughout both periods.
Same property NOI increased during the second quarter by 1.5% as compared to the same period of 2007 primarilydue to land use intensification activities, step rents and lease renewals at favorable rates, offset by a reduction inoccupancy to 97.0% at June 30, 2008 compared to 97.6% for the comparable period of 2007. In the first quarter of2008 we had net vacancies of 320,000 square feet and during the second quarter we had net absorption of vacantspace of 127,000 square feet.
Same property NOI increased by 0.7% on a year-over-year basis primarily due to land use intensification activities,step rents and lease renewals at favorable rates, offset by a reduction in occupancy at 97% at June 30, 2008compared to 97.6% for the comparable period of 2007. In the first quarter of 2008 we had net vacancies of 320,000square feet and during the second quarter we had net absorbtion of vacant space of 127,000 square feet.
The change in NOI on a consecutive quarter-over-quarter basis is as follows:
(thousands of dollars)Three months Three months
ended ended IncreaseJune 30, 2008 March 31, 2008 (decrease)
Same properties $ 102,176 $ 101,483 0.7%
Acquisitions 194 62 212.9%
Greenfield development 5,071 4,048 25.3%
NOI before adjustments 107,441 105,593 1.8%
Lease cancellation fees 360 549 (34.4%)
Straight-lining of rents 1,729 1,712 1.0%
Differential between contractual and market rents 579 634 (8.7%)
NOI $ 110,109 $ 108,488 1.5%
Same property NOI increased during the second quarter by 0.7% as compared to the first quarter of 2008 primarilydue to the net absorption of 127,000 square feet of vacant space during the second quarter, increasing occupancy to97.0% at the end of the second quarter from 96.6% at March 31, 2008.

Management ’s D i scuss i on and A nal ys i sRI
OCA
NRE
AL
ESTA
TEIN
VEST
MEN
TTR
UST
SECO
ND
QU
ART
ERRE
PORT
2008
60
Other Revenue
Fees and Other Income
We hold certain of our interests in various real estate investments through co-ownerships and investmentsaccounted for by the equity method. Generally, we provide asset and property management services for theseinvestments for which we earn market based fees.
As discussed under Vision and Business Strategy, commencing in 2008 our focus will be on growing our rental andfee income from long-lived properties (as opposed to the creation of fee income streams through the creation ofnew funds with third party investors). As a result, future period disposition-dependent performance fees willgenerally be earned from the completion of existing activities through to the end of 2010, including the disposition of the three remaining properties in RRVLP.
The significant sources of fees and other income are as follows:
(thousands of dollars)Three months ended June 30, Increase Six months ended June 30, Increase
2008 2007 (decrease) 2008 2007 (decrease)
Property and asset management fees earned from co-ownershipsand partners $ 2,240 $ 2,128 5% $ 4,717 $ 3,904 21%
Property and asset management fees earned from third party activities 464 381 22% 962 738 30%
Disposition-dependent performance fees and other 986 1,362 (28%) 1,656 2,030 (18%)
$ 3,690 $ 3,871 (5%) $ 7,335 $ 6,672 10%
Subsequent to July 2008, we will no longer manage the seven properties we sold to Retrocom in 2005. Third partyproperty management fees will be impacted by between $1.7 million and $1.8 million annually. In conjunction withRetrocom’s $30 million debenture repayment in July 2008 (refer to our discussion in Mortgages Receivable) we werepaid a financing facilitation fee of $1.75 million.
The increase in property and asset management fees primarily arises from the completion of greenfielddevelopments owned with partners, and increased finance and other arrangement related fees during the periods.
Interest Income
The changes during the periods in interest earned primarily resulted from higher mortgage and loan receivablebalances during the periods, partially offset by lower cash and short term investment balances during the periods.
Other Expenses
Interest
The components of interest expense are as follows:
(thousands of dollars)Three months ended June 30, Increase Six months ended June 30,
2008 2007 (decrease) 2008 2007 Increase
Interest $ 45,751 $ 43,309 6% $ 92,287 $ 86,698 6%Capitalized to real estate
investments (4,176) (4,808) (13%) (8,980) (8,775) 2%
Net interest expense $ 41,575 $ 38,501 8% $ 83,307 $ 77,923 7%
Percentage capitalized to real estate investments 9% 11% 10% 10%
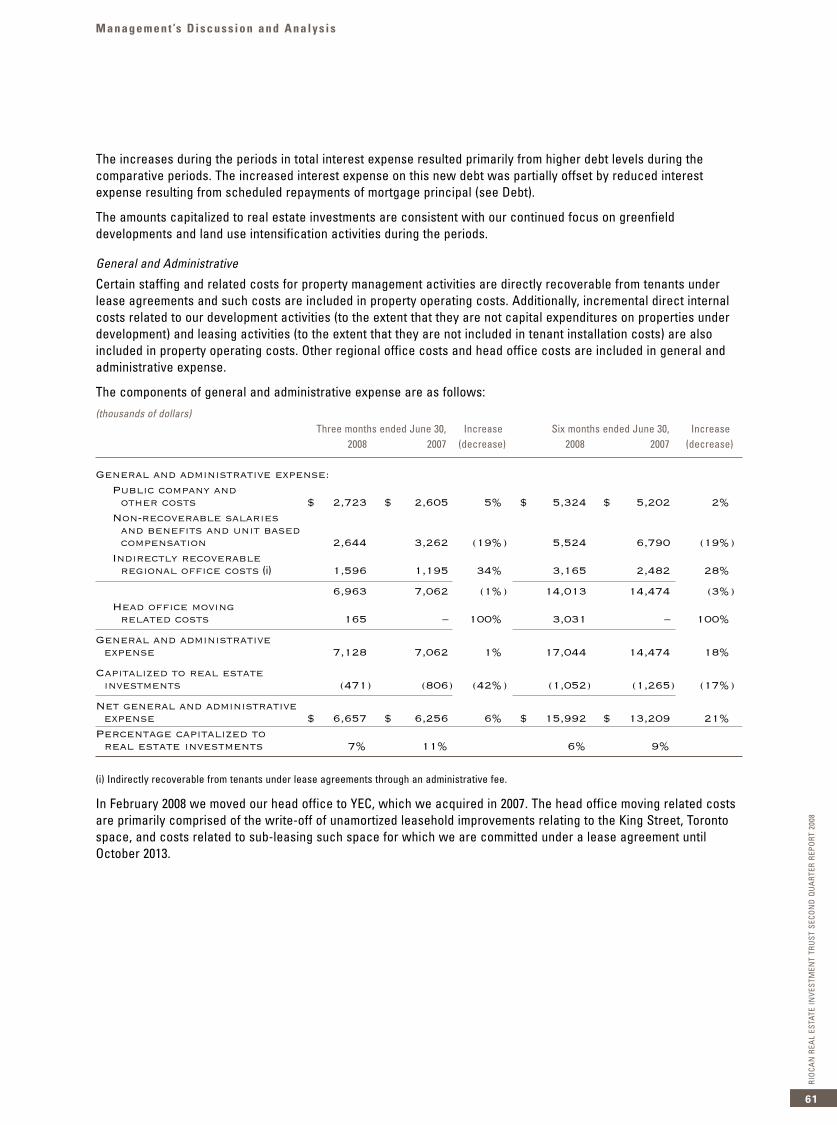
Management ’s D i scuss i on and A nal ys i s
RIO
CAN
REA
LES
TATE
INVE
STM
ENT
TRU
STSE
CON
DQ
UA
RTER
REPO
RT20
08
61
The increases during the periods in total interest expense resulted primarily from higher debt levels during thecomparative periods. The increased interest expense on this new debt was partially offset by reduced interestexpense resulting from scheduled repayments of mortgage principal (see Debt).
The amounts capitalized to real estate investments are consistent with our continued focus on greenfielddevelopments and land use intensification activities during the periods.
General and Administrative
Certain staffing and related costs for property management activities are directly recoverable from tenants underlease agreements and such costs are included in property operating costs. Additionally, incremental direct internalcosts related to our development activities (to the extent that they are not capital expenditures on properties underdevelopment) and leasing activities (to the extent that they are not included in tenant installation costs) are alsoincluded in property operating costs. Other regional office costs and head office costs are included in general andadministrative expense.
The components of general and administrative expense are as follows:
(thousands of dollars)Three months ended June 30, Increase Six months ended June 30, Increase
2008 2007 (decrease) 2008 2007 (decrease)
General and administrative expense:Public company and
other costs $ 2,723 $ 2,605 5% $ 5,324 $ 5,202 2%Non-recoverable salaries
and benefits and unit based compensation 2,644 3,262 (19%) 5,524 6,790 (19%)
Indirectly recoverable regional office costs (i) 1,596 1,195 34% 3,165 2,482 28%
6,963 7,062 (1%) 14,013 14,474 (3%)Head office moving
related costs 165 – 100% 3,031 – 100%
General and administrative expense 7,128 7,062 1% 17,044 14,474 18%
Capitalized to real estate investments (471) (806) (42%) (1,052) (1,265) (17%)
Net general and administrative expense $ 6,657 $ 6,256 6% $ 15,992 $ 13,209 21%
Percentage capitalized to real estate investments 7% 11% 6% 9%
(i) Indirectly recoverable from tenants under lease agreements through an administrative fee.
In February 2008 we moved our head office to YEC, which we acquired in 2007. The head office moving related costsare primarily comprised of the write-off of unamortized leasehold improvements relating to the King Street, Torontospace, and costs related to sub-leasing such space for which we are committed under a lease agreement untilOctober 2013.

Management ’s D i scuss i on and A nal ys i sRI
OCA
NRE
AL
ESTA
TEIN
VEST
MEN
TTR
UST
SECO
ND
QU
ART
ERRE
PORT
2008
62
Amortization
The components of amortization expense are as follows:
(thousands of dollars)Three months ended June 30, Increase Six months ended June 30, Increase
2008 2007 (decrease) 2008 2007 (decrease)
Building amortization $ 24,091 $ 22,958 5% $ 48,170 $ 45,675 5%Amortization of leasing costs 7,499 7,117 5% 9,326 7,635 22%Amortization of
intangible assets 4,183 5,785 (28%) 8,618 10,836 (20%)
Total amortization $ 35,773 $ 35,860 0% $ 66,114 $ 64,146 3%
The increase during the periods is consistent with the full period impact of net acquisitions and completed(re)developments of income properties during 2008 and 2007.
For acquisitions initiated after September 12, 2003, GAAP requires a component of the purchase price to beallocated to leasing costs and intangible assets. Additionally, we had a temporary increase in net vacancies of320,000 square feet during the first quarter of 2008 which resulted in the write off of approximately $900,000 inleasing costs.
Other Items
Gains on properties held for resale are discussed under Properties Under Development.
RioCan may have transactions in the normal course of business with entities whose directors or trustees are alsoour trustees and/or management. Any such transactions are in the normal course of operations and are measured atmarket based exchange amounts, and are not considered related party transactions for GAAP purposes.
Funds from Operations
FFO is a supplemental non-GAAP financial measure of operating performance widely used by the real estateindustry. The Real Property Association of Canada (“REALPAC”) defines FFO as: “Net income (computed inaccordance with GAAP), excluding gains (or impairment provisions and losses) from sales of depreciable real estateand extraordinary items, plus depreciation and amortization, plus future income taxes and after adjustments forequity-accounted entities and non-controlling interests. Adjustments for equity-accounted entities, joint venturesand non-controlling interests are calculated to reflect FFO on the same basis as the consolidated properties.”
We consider FFO a meaningful additional measure of operating performance as it primarily rejects the assumptionthat the value of real estate investments diminishes predictably over time and it adjusts for items included in GAAPnet earnings that may not necessarily be the best determinants of our operating performance (such as gains orlosses on the sale of, and provisions for impairment against, long-lived income properties).
FFO is a non-GAAP measure and should not be construed as an alternative to net earnings or cash flow provided byoperating activities determined in accordance with GAAP. Our method of calculating FFO is in accordance withREALPAC’s recommendations but may differ from other issuers’ methods and accordingly, may not be comparable toFFO reported by other issuers.

Management ’s D i scuss i on and A nal ys i s
RIO
CAN
REA
LES
TATE
INVE
STM
ENT
TRU
STSE
CON
DQ
UA
RTER
REPO
RT20
08
63
A reconciliation of GAAP net earnings to FFO is as follows:
(thousands of dollars, except per unit amounts)
Three months ended June 30, Six months ended June 30,2008 2007 2008 2007
Net earnings (loss) $ 44,926 $ (106,107) $ 75,210 $ (68,707)
Amortization 35,773 35,860 73,155 69,798
Future income taxes 5,700 150,000 5,700 150,000
FFO $ 86,399 $ 79,753 $ 154,065 $ 151,091
Per unitFFO per weighted average number
of units outstanding $ 0.40 $ 0.38 $ 0.72 $ 0.73
The explanations for the changes in FFO are the same factors as for GAAP net earnings, excluding the impact ofchanges in amortization expense and future income taxes.
Significant Accounting PoliciesOur unaudited interim consolidated financial statements for the three and six months ended June 30, 2008 and 2007were prepared in accordance with GAAP. The significant accounting policies used in the preparation of the interimconsolidated financial statements are consistent with those reported in our audited consolidated financial statementsfor the two years ended December 31, 2007 and 2006 except as identified below in Changes in Accounting Policies.The preparation of financial statements requires us to make estimates and judgments that affect the reportedamounts of assets and liabilities and disclosure of contingent assets and liabilities at the date of the financialstatements and the reported amounts of revenue and expenses during the reporting period. Actual results may differfrom those estimates under different assumptions and conditions.
Our MD&A for the two years ended December 31, 2007 and 2006 contains a discussion of our significant accountingpolicies most affected by estimates and judgments used in the preparation of our financial statements, being ouraccounting policies relating to income properties amortization, impairment of real estate investments, guarantees,future income taxes, and fair value. We have determined that at June 30, 2008 there is no change to our assessmentof our significant accounting policies most affected by estimates and judgments as detailed in our MD&A for the twoyears ended December 31, 2007 and 2006.
Changes in accounting policies
The Canadian Institute of Chartered Accountants (“CICA”) issued three new accounting standards that are effectivefor the Trust’s fiscal year commencing January 1, 2008: Section 1535, Capital Disclosures; Section 3862, FinancialInstruments – Disclosures; and Section 3863, Financial Instruments – Presentation. These standards, and the impacton our financial position and results of operations, are discussed in Note 1 (b) to our unaudited interim consolidatedfinancial statements.
Future Changes in Significant Accounting Policies We monitor the CICA recently issued accounting pronouncements to assess the applicability and impact, if any, ofthese pronouncements on our consolidated financial statements and note disclosures.
Goodwill and intangible assets
The CICA has issued a new accounting standard, Section 3064, Goodwill and Intangible Assets, which clarifies thatcosts can be capitalized only when they relate to an item that meets the definition of an asset, and as a result, thebasis of the deferral of maintenance capital expenditures recoverable from tenants may be impacted. We are in theprocess of evaluating the impact of this standard on our consolidated financial statements. Section 1000, FinancialStatement Concepts, was also amended to provide consistency with this new standard. The new and amendedstandards will be effective for the Trust’s 2009 fiscal year, and will be adopted on a retroactive basis withrestatement of the prior years.

Management ’s D i scuss i on and A nal ys i sRI
OCA
NRE
AL
ESTA
TEIN
VEST
MEN
TTR
UST
SECO
ND
QU
ART
ERRE
PORT
2008
64
International Financial Reporting Standards (“IFRS”)
The Canadian Accounting Standards Board (“AcSB”) confirmed that the adoption of IFRS would be effective for the interim and annual periods beginning on or after January 1, 2011 for Canadian publicly accountable profit-oriented enterprises. IFRS will replace Canada’s current GAAP for these enterprises. Comparative IFRS informationfor the previous fiscal year will also have to be reported. These new standards will be effective for us in the firstquarter of 2011.
We are currently in the process of evaluating the potential impact of IFRS to our consolidated financial statements.This will be an ongoing process as new standards and recommendations are issued by the International AccountingStandards Board and the AcSB. Our consolidated financial performance and financial position as disclosed in ourcurrent GAAP financial statements may be significantly different when presented in accordance with IFRS.
The Canadian Securities Administrators issued Staff Notice 52-321, Early Adoption of International FinancialReporting Standards, which provides issuers with the option to early adopt IFRS effective January 1, 2009. It is notour intention to early adopt these standards on January 1, 2009.
Risks and UncertaintiesThe achievement of our objectives is, in part, dependent on successful mitigation of business risks identifiedconsidering the assumptions set out above in our 2008 Objectives.
All real estate investments are subject to a degree of risk. They are affected by various factors including changes ingeneral economic and in local market conditions, equity capital and credit markets, the attractiveness of theproperties to tenants, competition from other available space and various other factors. In addition, fluctuations ininterest costs may affect us.
The value of our real estate and any improvements thereto may also depend on the credit and financial stability ofour tenants. Our financial position would be adversely affected if a significant number of tenants were to becomeunable to meet their obligations to us or if we were unable to lease a significant amount of available space in ourproperties on economically favourable lease terms.
Tenant Concentrations
The principal operating risk facing us is the potential for declining revenue if we cannot maintain the existing high occupancy levels of our properties should tenants experience financial difficulty and be unable to fulfill theirlease commitments.
We reduce our risks in our shopping centre portfolio through geographical diversification (see Asset Profile and NetOperating Income), staggered lease maturities (see Income Properties), diversification of revenue sources resultingfrom a large tenant base, avoiding dependence on any single tenant by ensuring no individual tenant contributes asignificant percentage of our gross revenue, ensuring a considerable portion of our revenue is earned from nationaland anchor tenants (see Overview and Highlights), and credit assessments are generally conducted for new tenants.The key components of our tenant concentration risk strategy are discussed below or under Asset Profile.
Our lease expiries over the next five years are:
(in thousands) Lease expiries
Portfolio NLA 2008 (i) 2009 2010 2011 2012
Square feet 32,538 955 2,652 3,155 3,719 2,799
Square feet expiring/portfolio NLA 3% 8% 10% 11% 9%
Minimum annualized rentals $15,636 $40,621 $44,517 $ 52,835 $43,666
(i) Tenant lease expiries for the six months ending December 31, 2008.
The above aggregate renewals over the next five years represent annual lease payments of approximately $197.3million based on current contractual rental rates. Should such tenancies be released upon maturity at an aggregaterental rate differential of 100 basis points, our operations would be impacted by approximately $2 million annually.

Management ’s D i scuss i on and A nal ys i s
RIO
CAN
REA
LES
TATE
INVE
STM
ENT
TRU
STSE
CON
DQ
UA
RTER
REPO
RT20
08
65
The analysis below excludes retailer owned anchors, the success of whom may impact certain income properties.At June 30, 2008 our 10 largest tenants and their NLA are as follows:
Annualized NLA Percentagerental revenue Number of (square feet of total
Ranking Tenant (%) locations in thousands) NLA
1. Metro/A&P/Dominion/Super C/Loeb/Food Basics 5.4% 52 1,984 6.2%
2. Famous Players/Cineplex/Galaxy Cinemas 5.4% 28 1,265 4.0%
3. Zellers/The Bay/Home Outfitters 3.7% 37 2,628 8.2%
4. Canadian Tire/PartSource/Mark's Work Wearhouse 3.6% 57 1,192 3.7%
5. Loblaws/No Frills/Fortinos/Zehrs/Maxi 3.4% 27 1,172 3.7%
6. Wal-Mart 3.4% 20 1,826 5.7%
7. Winners/HomeSense 3.2% 51 1,154 3.6%
8. Staples/Business Depot 2.5% 43 887 2.8%
9. Reitmans/Penningtons/Smart Set/Addition-Elle/ 2.0% 122 497 1.6%Thyme Maternity
10. Shoppers Drug Mart 1.7% 36 382 1.2%
34.3% 473 12,987 40.7%
We also mitigate our leasing risk by negotiating fixed term leases that will often be from five to ten years. In instanceswhere certain tenants are critical to the viability of a property, we endeavor to lease for even longer terms with pre-negotiated minimum rent escalations. In addition, in order to reduce our exposure to the risks relating to creditand financial stability of our tenants, our Declaration restricts the amount of space which can be leased to anyperson and that person’s affiliates (other than in respect of leases with or guaranteed by the Government of Canada,a province of Canada, a municipality in Canada or any agency thereof and certain corporations, the securities ofwhich meet stated investment criteria) to a maximum premises or space having an aggregate gross leasable area of 20% of the aggregate gross leasable area of all real property held by us.
Interest Rate and Other Debt and Equity Related Risks
At June 30, 2008 our total indebtedness had a 5.3 year weighted average term to maturity bearing a weightedaverage contractual interest rate of 5.91%.
Our operations are impacted by interest rates as interest expense represents a significant cost in the ownership of our real estate investments. At June 30, 2008 we had aggregate contractual debt (“mortgages and debenturespayable”) principal maturities through to December 31, 2010 of $833.2 million (26% of our aggregated debt) with a weighted average contractual interest rate of 6.37%. Should such amounts be refinanced upon maturity at an aggregate interest rate differential of 100 basis points, our operations would be impacted by approximately $8 million annually.
We seek to reduce our interest rate risk by staggering the maturities of our long term debt and limiting the use offloating rate debt so as to minimize exposure to interest rate fluctuations. At June 30, 2008, 1.3% of our aggregatedebt was at floating interest rates.
A further risk to our growth program and the refinancing of our debt upon its maturity is that of not having sufficientdebt and equity capital available to us. Given the relatively small size of the Canadian marketplace, there may come apoint in the future at which accessing domestic capital may become more difficult. We work to mitigate this potentialrisk by constantly seeking out new sources of capital and by staggering the maturities of our long term debt.
Also, certain significant expenditures involved in real property investments, such as property taxes, maintenancecosts and mortgage payments, represent obligations that must be met regardless of whether the property isproducing any income.

Management ’s D i scuss i on and A nal ys i sRI
OCA
NRE
AL
ESTA
TEIN
VEST
MEN
TTR
UST
SECO
ND
QU
ART
ERRE
PORT
2008
66
Liquidity Risk of Real Estate Investments
Real estate investments are relatively illiquid. This will tend to limit our ability to sell components of our portfoliopromptly in response to changing economic or investment conditions. If we were required to quickly liquidate ourassets, there is a risk that we would realize sale proceeds of less than the current book value of our real estateinvestments.
Unexpected Costs or Liabilities Related to the Acquisition of Real Estate Investments
Although we conduct what we believe to be a prudent and thorough level of investigation in connection with ouracquisition of properties, an unavoidable level of risk remains regarding any undisclosed or unknown liabilities of,or issues concerning, the acquired properties and we may not be indemnified for some or all of these liabilities.Following an acquisition, we may discover that we have acquired undisclosed liabilities, which may be material.
Construction Risk
Our construction commitments are subject to those risks usually attributable to construction projects, which include:(i) construction or other unforeseeable delays; (ii) cost overruns; and (iii) the failure of tenants to occupy and payrent in accordance with existing lease agreements, some of which are conditional. Such risks are minimized throughthe provisions of our Declaration, which have the effect of limiting direct and indirect investments (net of relatedmortgage debt) in non-income producing properties to no more than 15% of the adjusted book value of our unitholders’equity. Such developments may also be undertaken with established developers either on a co-ownership basis orby providing them with mezzanine financing. With some exceptions, from time to time, for land in the high growthmarkets, generally we will not acquire or fund significant expenditures for undeveloped land unless it is zoned andan acceptable level of space has been pre-leased/pre-sold. An advantage of unenclosed, new format retail is that itlends itself to phased construction keyed to leasing levels, which avoids the creation of meaningful amounts ofvacant space.
Environmental Risk
Environmental and ecological related policies have become increasingly important in recent years. Under variousfederal and provincial laws, we, as an owner or operator of real property, could become liable for the costs ofremoval or remediation of certain hazardous or toxic substances released on or in our properties or disposed of atother locations. The failure to remove or remediate such substances, if any, may adversely affect our ability to sellsuch real estate or to borrow using such real estate as collateral, and could potentially also result in claims againstus. We are not aware of any material non-compliance, liability or other claim in connection with any of ourproperties, nor are we aware of any environmental condition with respect to any properties that we believe wouldinvolve material expenditures by us.
It is our policy to obtain a Phase I environmental audit conducted by a qualified environmental consultant prior toacquiring any additional property. In addition, where appropriate, tenant leases generally specify that the tenant willconduct its business in accordance with environmental regulations and be responsible for any liabilities arising outof infractions to such regulations. It is our practice to regularly inspect tenant premises that may be subject toenvironmental risk. We maintain insurance to cover a sudden and/or accidental environmental mishap.
Unitholder Liability
Our Declaration provides that no unitholder or annuitant under a plan of which a unitholder acts as trustee or carrierwill be held to have any personal liability as such, and that no resort shall be had to the private property of anyunitholder or annuitant for satisfaction of any obligation or claim arising out of or in connection with any contract orobligation of RioCan. Only our assets are intended to be subject to levy or execution.
The following provinces have legislation relating to unitholder liability protection: British Columbia, Alberta,Saskatchewan, Manitoba, Ontario and Quebec. Certain of these statutes have not yet been judicially considered and it is possible that reliance on such statute by a unitholder could be successfully challenged on jurisdictional orother grounds.

Management ’s D i scuss i on and A nal ys i s
RIO
CAN
REA
LES
TATE
INVE
STM
ENT
TRU
STSE
CON
DQ
UA
RTER
REPO
RT20
08
67
Our Declaration further provides that, whenever possible, certain written instruments signed by us must contain aprovision to the effect that such obligation will not be binding upon unitholders personally or upon any annuitantunder a plan of which a unitholder acts as trustee or carrier. In conducting our affairs, we have acquired and mayacquire real property investments subject to existing contractual obligations, including obligations under mortgagesand leases that do not include such provisions. We will use our best efforts to ensure that provisions disclaimingpersonal liability are included in contractual obligations related to properties acquired, and leases entered into, inthe future.
Income Taxes
We currently qualify as a mutual fund trust for income tax purposes. We are required by our Declaration to annuallydistribute all of our taxable income to unitholders and are therefore generally not subject to tax on such amounts. Inorder to maintain our current mutual fund trust status, we are required to comply with specific restrictions regardingour activities and the investments held by us. If we were to cease to qualify as a mutual fund trust, theconsequences could be material and adverse.
On June 22, 2007, Bill C-52, which significantly modifies the federal income taxation of certain publicly-traded trusts(such as income trusts and REITs) and partnerships, was enacted into law. The legislative changes apply to apublicly-traded trust that is a specified investment flow-through trust (a “SIFT”) which existed before November 1,2006 (an “Existing Trust”) commencing with taxation years ending in or after 2011 provided that an Existing Trustdoes not exceed certain growth limitations (other than those Existing Trusts which qualify for the REIT Exemption).
Certain distributions attributable to a SIFT will not be deductible in computing the SIFT’s taxable income, and theSIFT will be subject to tax on such distributions at a rate that is substantially equivalent to the general tax rateapplicable to Canadian corporations. Distributions paid by a SIFT as returns of capital will not be subject to this tax.In accordance with the normal growth guidelines, released by the Minister of Finance on December 15, 2006, therewill be circumstances where an Existing Trust may lose its transitional relief where the Existing Trust undergoes“undue expansion”.
The new taxation regime will not apply to certain Existing Trusts that qualify for the REIT Exemption as defined in thelegislative changes and as amended by draft legislation released on July 14, 2008. Accordingly, unless the REITExemption is applicable to us, the legislative changes could, commencing in 2011, impact the level of cashdistributions which would otherwise be made by us. The legislative changes do not fully accommodate the currentbusiness structures used by many Canadian REITs and contain a number of technical tests that many CanadianREITs, including RioCan, will likely find difficult to satisfy. The Minister’s stated intention is to exempt REITs fromtaxation as SIFTs in recognition of “the unique history and role of collective real estate investment vehicles”.Accordingly, it is possible that changes to these technical tests will be made prior to 2011 in order to accommodatesome or all of the existing Canadian REITs, including RioCan. Alternatively, if the legislation is not further changed,existing Canadian REITs, including RioCan, may need to restructure their affairs in order to limit the application ofthe new tax on SIFTs.
On July 14, 2008, the Department of Finance (Canada) released draft legislation to clarify certain aspects of thelegislative changes (which, as discussed above, will be effective on January 1, 2011, subject to compliance with thenormal growth guidelines). One of the proposed amendments is intended to exempt from the new rules a subsidiarytrust or partnership that (i) is not listed or traded on a stock exchange or other public market, and (ii) is, generally,not held by any person or partnership other than a real estate investment trust, a taxable Canadian corporation, aSIFT trust, a SIFT partnership, or an excluded subsidiary entity (each as defined in the Income Tax Act). Noassurances can be given that the draft legislation will be implemented in its current form or at all.
In light of the foregoing, it is possible that the legislative changes as enacted, or proposed, will have an adverseeffect on us, commencing in 2011.

Management ’s D i scuss i on and A nal ys i sRI
OCA
NRE
AL
ESTA
TEIN
VEST
MEN
TTR
UST
SECO
ND
QU
ART
ERRE
PORT
2008
68
Selected Quarterly Consolidated Information
The following is a summary of certain key information:
(thousands of dollars, except per unit amounts)
2008 2007 2006
As at and for the quarter ended Q2 Q1 Q4 Q3 Q2 Q1 Q4 Q3
Total revenue $ 194,385 $ 183,367 $ 193,397 $ 172,493 $ 179,507 $ 174,490 $ 171,088 $ 160,726
Net earnings (loss) * 44,926 30,284 65,148 35,917 (106,107) 37,400 43,435 41,763
Net earnings (loss) per unit *
- basic and diluted 0.21 0.14 0.32 0.17 (0.51) 0.18 0.22 0.21
Total assets 5,330,717 5,169,211 5,250,056 5,122,095 4,942,570 4,940,651 4,607,963 4,535,896
Total mortgages anddebentures payable 3,200,783 3,193,454 3,235,248 3,125,173 2,925,770 2,929,440 2,780,587 2,710,884
Total distributions to unitholders 74,172 71,399 71,044 69,168 68,851 67,625 65,784 63,996
Total distributions to unitholders per unit 0.3375 0.3375 0.3375 0.3300 0.3300 0.3300 0.3300 0.3225
Net book value per unit ** 8.16 7.83 7.96 7.92 8.02 8.79 8.28 8.34
Market price per unit- high 22.25 22.42 25.94 26.06 26.95 27.34 26.78 24.60- low 19.50 18.10 20.42 21.75 22.80 23.69 22.75 21.30- close 19.86 20.70 21.82 24.85 23.65 24.84 25.15 24.01
* Refer to our annual and interim MD&As issued for the years ended December 31, 2007 and 2006, for the three months ended March 31,2007 and 2006, the six months ended June 30, 2007 and 2006, and the nine months ended September 30, 2007 and 2006 for a discussion and
analysis relating to those periods.During the three and six months ended June 30, 2008 we recorded non-cash charges for future income taxes to net earnings of $5.7 million.During the last three quarters of 2007 we recorded non-cash charges (recoveries) for future income taxes to earnings of $150 million, $7 million and ($13) million, respectively. These charges relate to our future income tax liabilities recorded as a result of Bill C-52, whichreceived Royal Assent on June 22, 2007. These non-cash charges relate to temporary differences between the accounting and tax basis ofour assets and liabilities, primarily relating to our real estate investments. These charges have no current impact on our cash flows ordistributions (see Future Income Taxes above).
** A non-GAAP measurement. Calculated by us as unitholders’ equity divided by units outstanding at the end of the period. Our method ofcalculating net book value per unit may differ from other issuers’ methods and accordingly may not be comparable to net book value perunit reported by other issuers.

Se n io r Ma n a g e m e n t , Bo a rd o f Tru s te e s a n d Un i th o ld e r In fo r ma t i o n
Senior Management
Edward Sonshine, Q.C.President and Chief Executive Officer
Frederic A. WaksExecutive Vice President and Chief Operating Officer
Raghunath DavloorSenior Vice President and Chief Financial Officer
Donald MacKinnonSenior Vice President, Real Estate Finance
Jordan RobinsSenior Vice President, Planning and Development
Jeff RossSenior Vice President, Leasing
John BallantyneVice President, Asset Management
Michael ConnollyVice President, Construction
Therese CornelissenVice President and Chief Accounting Officer
Jonathan GitlinVice President, Investments
John HoVice President, Property Accounting
Danny KissoonVice President, Operations
Suzanne MarineauVice President, Human Resources
Maria RicoVice President, Risk Management and Process Improvement
Kenneth SiegelVice President, Leasing
Board of Trustees
Paul Godfrey, C.M. 1,2,3,4
(Chairman of Board of Trustees)President and Chief Executive Officer,Toronto Blue Jays Baseball Club
Clare R. Copeland 1,2
Chair of Toronto Hydro Corporation
Raymond Gelgoot 4
Partner, Fogler, Rubinoff LLP
Frank W. King, O.C. 1,2
President, Metropolitan Investment Corporation
Dale H. Lastman 3
Co-Chair and Partner, Goodmans LLP
Ronald W. Osborne 1
Corporate Director
Sharon Sallows 3,4
Partner, Ryegate Capital Corporation
Edward Sonshine, Q.C.President and Chief Executive Officer,RioCan Real Estate Investment Trust1 member of the Audit Committee2 member of the Human Resources & Compensation Committee3 member of the Nominating & Governance Committee4 member of the Investment Committee
Unitholder Information
Head Office
RioCan Real Estate Investment TrustRioCan Yonge Eglinton Centre, 2300 Yonge Street, Suite 500P.O. Box 2386, Toronto, Ontario M4P 1E4Tel: 416-866-3033 or 1-800-465-2733Fax: 416-866-3020Website: www.riocan.comE-mail: [email protected]
Unitholder and Investor Contacts
Correna CraigDirector of Public and Investor RelationsTel: 416-864-6483E-mail: [email protected]
Nancy MedlockInvestor Relations AdministratorTel: 416-306-2406E-mail: [email protected]
Auditors
Ernst & Young LLP
Transfer Agent and Registrar
CIBC Mellon Trust CompanyP.O. Box 7010, Adelaide Street Postal Station, Toronto, Ontario M5C 2W9Answerline: 1-800-387-0825 or 416-643-5500Fax: 416-643-5501Website: www.cibcmellon.comE-mail: [email protected]
Unit Listing
The units are listed on the Toronto Stock Exchange under the symbol REI.UN.
Con
cept
et p
rodu
ctio
n :
Impr
imé
au C
anad
a
Con
cept
et p
rodu
ctio
n :
Impr
imé
au C
anad
a
RIO
CAN
REA
L ES
TATE
INVE
STM
ENT
TRU
ST S
ECO
ND
QU
ART
ER R
EPO
RT 2
008
69
The results for the second quarter of 2008 were quite satisfactory for RioCan, particularly having in mind the uncertaineconomic times in which we find ourselves. We are gratified to note that our occupancy rate has increased to 97% while theamount lost to tenant defaults during the period in question was negligible.
While the indicators noted above are positive, there is no doubt that we are currently in a time of economic pessimism,which has resulted in reduced capital availability to the real estate sector. This is a theme that I noted in my report to youlast quarter and one that continues to be played out.
RioCan’s response to this climate is based on having the strongest capital position that we can achieve consistent with ourdesires for growth. To that end, we successfully completed an equity offering in April 2008 and we are pleased that theoffering was not only taken up in full but that the overallotment was also purchased, with the result that RioCan increased itsequity capital base by about $150 million. At the same time, our refinancing program has continued successfully and at thispoint in the year, we are able to advise that virtually all mortgages maturing in 2008 have been refinanced or committed atoverall interest rates lower than the debt being repaid.
The net result is that our current leverage ratio is as low as it has been in many years while our cash position is extremelystrong. While this stance can be mildly dilutive in the short term, we are confident that this will be more than made up in thelonger term by our being one of the few real estate entities that is currently in a position to react quickly and aggressively onacquisition opportunities.
One of the first of these acquisition opportunities was completed at the end of June, namely the purchase of a 1.1 millionsquare foot portfolio of ten shopping centres at a purchase price of $156 million. This portfolio was acquired at a yieldconsiderably higher than what we would have expected to be the case in the recent past, and as a result, will be extremelyaccretive for us commencing in the third quarter of this year.
This transaction was also noteworthy in that it was the first transaction in over five years that we undertook in our jointventure with Kimco Realty Corporation (“Kimco”). We were pleased that we were able to come to terms with Kimco on a feeschedule that made sense to RioCan. From RioCan’s perspective, extending our capital resources through joint ventures ofthis type is a strategy that is sensible in a time when capital is becoming relatively more expensive. At the same time, by wayof the fee income stream created, the returns on funds invested is considerably enhanced.
This theme of capital preservation and enhancing returns through fees was a basic part of the other major transaction thattook place in this past quarter, namely our sale of a 50% non managing interest in two development projects to CPPInvestment Board (“CPPIB”). Our relationship with CPPIB commenced several years ago with the sale of a half interest inthree shopping centres that were in early development stage, and the expansion of this relationship through these newtransactions is certainly one that we welcome and that we believe will be beneficial for all.
Finally, we believe that the strategies put into place at RioCan over the last several years are commencing to bear fruit inthat they correctly anticipated some of the trends that are becoming apparent to all. Our urban focus as well as ourintensification strategy fit perfectly with the time of high fuel prices and people’s desire to live, work and shop in muchtighter geographical areas.
Accordingly and notwithstanding the economic clouds that seem to be very thick in the current environment, we are quietlyconfident that RioCan is on the right road to take advantage of the financial winds that are scattering others.
As always, we thank you, our unitholders, for your continued confidence in us.
Edward Sonshine, Q.C.President and Chief Executive Officer
July 22, 2008
Dear Fe l low Uni tho lder :
Edward Sonshine, Q.C.President and ChiefExecutive Officer,RioCan Real Estate Investment Trust
ROOTED IN THE MAJOR MARKETS

ROOTED IN THE MAJOR MARKETS
CANADA’S MAJOR MARKET REIT
RIOCAN REAL ESTATE INVESTMENT TRUST
SECOND QUARTER REPORT 2008
2RioCan Real Estate Investment TrustRioCan Yonge Eglinton Centre2300 Yonge Street, Suite 500 P.O. Box 2386, Toronto, Ontario M4P IE4T 416-866-3033 or 1-800-465-2733F 416-866-3020W www.riocan.com