[email protected] statistical methods rss 2002, 4 ...ripley/rss2002.pdfstatistical methods need...
TRANSCRIPT

Statistical Methods Need Software:
A View of Statistical Computing
Brian D. Ripley
RSS 2002, 4 September 2002
http://www.stats.ox.ac.uk/∼ripley

Scene-setting
Research statisticians proudly have a great idea, write it up, getting glowingreferees’ reports from a good journal, maybe even read a paper to theSociety, and then sit back and wait for the idea to conquer the world.
And wait and wait and wait. . . .
Eventually they hear that applied people are using1 someinferior methodfrom one of those upstart new communities like Data Mining or NeuralNetworks or Expert Systems.
All hearsay, of course!
1and making large consulting fees out of

Seriously . . .
• These days there is a lot more to improving the way statistics isactually used than publishing in Series B, or even writing a monographon the technicalities.
• Some statistical methodology is seriously undervalued as a result.
• The process of getting methods into the hands of the end users isundervalued by academia and the statistical community at large.
This talk is about the process of getting methods into the hands of those whowill profit from using them.
It is also part of a campaign to encourage our younger colleagues that it willbe worth their while to aim to do so.

A look backwards
Looking back is always dangerous!Let’s look back one generation (say 25 years).
Many research papers contained an example of the new methodology.
Most credited a research assistant or programmer with the numerical results.
I quite often tried to reproduce the results to compare with my own newly-developed methods.
More often than not I failed. Sometimes I wrote and asked for clarificationsof the result, perhaps sending my version which seemed to make more sense.
The answer usually was that the the RA had left, the grant had finished andthere was nothing could be done.

Not good enough!
If someone finds a problem with a proof in a paper, then the authors areexpected to publish a retraction. Equally, incorrect numerical results shouldbe corrected, and the authors should be held fully responsible for them.
Surely statisticians of all people should be setting an example in the handlingof data.
The need is for reproducibleresearch2. Just as the regulators demand forclinical trials of (potential) drugs.
One solution is to expect a reference implementation, some code whichis warranted to give the authors’ intended answers in a moderately-sizedproblem. It need not be efficient, but it should be available to anyone andeveryone.
2There is a Journal of Irreproducible Results, as well as the Annals of ImprobableResearch.

To whom do we want to deliver?
Statisticians are a tiny minority of the users of statistics.
We are a small proportion of those who can beneficially use techniquesdeveloped over the last generation. Some examples:
• Visualization techniques: automated density estimation, parallel coor-dinate plots, mosaicplots, MDS . . . .
• Mixed-effect models.
• Classification and regression trees.
• ‘Semi-parametric’ models, e.g. gams, gss, coxph.
Many potential users do not have access to leading-edge resources: KjetilHalvorsen teaches in Bolivia on 8Mb 386’s.
Rightly or wrongly, many end users will only be willing to pay smallamounts for statistical software.

Statistical Software
Let’s not kid ourselves: the most widely used piece of software for statisticsis Excel.
In the numerate sciences Matlab is Excel’s big brother, and quite often seenin methodology papers in statistics.
SPSS and SAS dominate certain communities, and Minitab is widely usedin teaching (but I suspect only in teaching).
Many niche products, e.g. GenStat, GLIM and Stata.
S-PLUS dominates the high-end, hence is widely seen in methodologypapers.
There are different amounts of choice available to users of Windows, Unix,Linux and MacOS.

Part of an Advertisement
‘I’m a LECTURER IN STATISTICS – responsible for ensuring thatgood statistical practise becomes the norm with new generations ofanalysts.
Which is why I chose Xxxxx.’
• This does seems an ambitious goal for one lecturer or one piece ofsoftware.
• Software is important, but teaching the right mix of methodology andhow to use it well is far more important.
• Package ‘Xxxxx’ describes itself as ‘a cutting-edge statistical softwarepackage’. One of the most difficult tasks in training the data analystsof the future is predicting what it will be important for them to know.Having software available biases that choice.

Standards – Real and Imaginary
Beware proprietary ‘standards’. People claim MS Office is ‘standard’.
• How do we know that different versions of Excel behave in the sameway?
• Do they behave the same way on Windows and MacOS?(It’s obvious Excel does not behave at all on Unix/Linux.)
• How do we even know how they are intended to behave?
• What about the ‘clones’ such as StarOffice / OpenOffice?
At least some things are now standard. Thanks to IEC60559 (also, in-correctly, known as IEEE754) we can reasonably assume that computerarithmetic will work to the same precision and more-or-less the same wayeverywhere.

Hopefully the following will never be emulated:
Whilst I was at Imperial College, UCL Computer Centre putout an announcement that a bug had been discovered in theirsystems’ floating point unit and
‘any important numerical work should be repeated on someother machine’.
But what about the implementation of arcsin or pnorm . . . ?
Statistical packages are found wanting in their equivalents of statisticaltables alarmingly frequently.
However, some of the reports are just ‘pilot error’.

Is My Statistical Software Reliable?
On June 5, 2002, the New York Times ran an article purportedly about this(http://www.nytimes.com/2002/06/05/science/05PART.html)
. . .
As part of a continuing effort to check for flaws, those scientists in recentweeks used a new method to look at their figures and obtained differentresults. They re-examined the original figures and found that the problemlay with how they used off-the-shelf statistical software to identify telltalepatterns that are somewhat akin to ripples from a particular rock tossed intoa wavy sea. Instead of adjusting the program to the circumstances that theywere studying, they used standard default settings for some calculations.That move apparently introduced a bias in the results, the team says in thepapers on the Web.
The chairman of the Johns Hopkins biostatistics department, Dr. ScottL. Zeger, said other researchers who used the software, S-Plus, shouldcheck for similar problems. It is widely used for research in fields likepharmacology, genetics, molecular biology and stock-market forecasting,as well as serving as a mainstay of other environmental studies.

A better summary, courtesy of Bert Gunter, a senior statistician at Merck:
Translation 1:Data analysis is a tricky business – a trickier business than eventricky data analysts sometimes think.
Translation 2:There’s no free lunch even when lunch is free.
To be blunt, this was a case of users (sort of) blaming their tools with only alittle cause (and the need to change this default is in a certain well-known3
book I co-author). But all credit to them for actually checking.
But what if the software really had been faulty?
3maybe even well-read

‘Open Source’ and ‘Free’ Software
These are emotive terms, coined by zealots.
Richard Stallman’s (RMS) Free Software Foundation is ‘free as in speech,not free as in beer’. The GNU project was set up to provide a ‘free’ Unixbut made slow progress. In the early 1990s Linus Torvalds came along withthe missing piece, a kernel, and Linux was born. However, well over halfa ‘Linux distribution’ is from GNU, and RMS and others (e.g. the Debiandistribution) refer to GNU-Linux.
There are other free licences (X, BSD, Apache, Artistic, . . . ), and the term‘Open Source’ was coined for the concept, with a precise definition (byBruce Perens).
These are ‘available to anyone and everyone’.
The freedom to know how things work may be equally important.

The R Project – Open Source Statistics
R is an Open Source statistics project. It may not be nirvana, and it maynot be suitable for everyone, but it is an conscious attempt to provide ahigh-quality environment for leading-edge statistics which is available toeveryone.
It is free even ‘as in beer’. You can download the source code (atwww.r-project.org) which compiles on almost all current Unix and Linuxsystems, as well as binary versions for the major Linux distributions (RedHat, SuSE, Debian, Mandrake), FreeBSD, MacOS X and 32-bit Windowsand classic Macintosh (which also runs on MacOS X). Kjetil can afford itand it runs on his teaching lab.
This makes it a good environment for a reference implementation.
The only barrier to understanding how it works, precisely, is skill.
R History
R is a system originally written by Ross Ihaka and Robert Gentleman (then)of the University of Auckland (so the naming is clear) in about 1994. To theuser it looks like a dialect of the S language.
Probably this started as a research project, but versions were used at Auck-land for elementary classes, on Macintoshes with 2Mb of memory.
By 1997 other people had become involved, and a core teamhad been setup with write access to the source code. There was a Windows version, andLinux users pushed development forward, there being no S-PLUS versionavailable for Linux at the time.
I became involved in 1998, and a member of the core team in Jan 1999.
The first non-beta version of R, 1.0.0, was released on 29 Feb 2000.
R Successes
• R is widely used in the third world by groups who could never afforda commercial statistical system, and can be run fairly well on legacyhardware.
• It has been used for election forecasting, brain imaging and severalmicroarray analysis systems are based on it.
• The core team have got to establish close working relationships withalmost exclusively email contact. (Nothing new for me: Bill Venablesand I co-wrote half a book before we ever met.)
• We get to appreciate a lot more the design issues in statistical software,and the forbearance of people doing technical support.
• It is easy (for those who have made the effort to learn the system) toadd new features whenever one’s projects (or one’s students’ projects)need it.
• If you find a bug, just fix it and carry on.

R Problems
Oh, is that the time?
Just one comment:
documenting statistical software and providing examples of how to use itmay be even more important than writing the software.
That is reasonably well covered for specialist statisticians but R is attractinga much wider audience.
Let’s do some real applied statistics for the rest of the session . . . .

Projects enabled by up-to-dateStatistical Software
• Characterizing Alzheimer’s Disease
• Classifying glass by classification trees
• Visualizing the classification problem
• Calibrating GAG in urine

Characterizing Alzheimer’s Disease
Joint work with Kevin Bradley, Radiologist at OPTIMA (Oxford Project toInvestigate Memory and Ageing).
Published in British Journal of Radiologylast month.

Structural MRI of Ageing and Dementia
Everyone’s brain shrinks with age (0.4% per year), and not uniformly.
Disease processes, for example Alzheimer’s Disease (AD), change both theoverall rate and the differences in rates in different parts of the brain.
•
••
•
•
•
•
•
•
•
•
•
•
•
•
•
•
•
•
•
•
••
•
•
••
•
•
••
•
Age
% v
entr
icle
55 60 65 70 75 80 85
12
34
56
78

Use serial structural MRI, probably of two measurements n months apart.
How large should n be?
How many patients are needed? (Parallel study by Fox et al, 2000, Archivesof Neurology.)
Study with 39 subjects, most imaged 3 or 4 times over up to 15 months.
Three groups, ‘normal’ (32), ‘possible’ (2) and ‘probable (5).
Given the ages, expect a substantial fraction of ‘normals’ to have pre-clinicalAD.

1.0
1.1
1.2
1.3Neg
0.0 1.0
Neg Neg
0.0 1.0
Neg Neg
0.0 1.0
Neg Neg
0.0 1.0
Neg
Neg Neg Neg Neg Neg Neg Neg
1.0
1.1
1.2
1.3Neg
1.0
1.1
1.2
1.3Neg Neg Neg Neg Neg Neg Neg Neg
Neg Neg Neg Neg•
Neg Neg•
Neg
1.0
1.1
1.2
1.3Neg
1.0
1.1
1.2
1.3Prob Prob
0.0 1.0
Prob Prob
0.0 1.0
Prob Poss Poss
0.0 1.0
scan interval (years)
vent
ricle
/bra
in v
olum
e

Statistical Analysis
Major source of variation is between subjects. Not many ‘abnormals’, andusually the diseased group is more variable than the normals.
Choose to use linear mixed-effects models (NLME of Pinheiro & Bates).
• The Trellis plot here really helps in visualizing the data.
• Longitudinal data like this are common, and here subject-specificrandom effects really help.
• There is no way I could have found the time to write software for this.
• Given the estimates of the variance components, we can answer thequestions of ‘how far apart?’ and ‘how many patients?’.

Classification Trees — CART
Classification trees is one area which illustrates the importance of software.
They have been (fairly) independently developed in machine learning, elec-trical engineering and statistics from the mid 70s to the end of the 80s.
Classification and Regression Treesby Breiman, Friedman, Olshen & Stone(1984) was a seminal account. Unusually for statisticians, they marketedtheir software, CART R©.
The other communities also marketed their software. Ross Quinlan evenwrote a book about his, C4.5: Programs for Machine Learning, containingthe source code but not allowingreaders to use it. The C code could bebought separately, for restricted4 use.
The net effect is that classification trees did not enter the mainstreamof statistical methodology. Neither CART nor C4.5 had a user-friendlyinterface.
4 ‘may not be used for commercial purposes or gain’
Classification Trees — in S
The advent of classification and regression trees in S in 1991 made thetechnique much more accessible.
Unfortunately the implementation was bug-ridden.
Eventually I decided to write my own implementation to try to find out whatthe correct answers were.
Terry Therneau had re-implemented CART (the book) during his Ph.D. andhis code formed the basis of rpart.

Classification Trees — Lessons
• Having the source code available makes it mucheasier to find out whatis actually done.
• Having independent open implementations increases confidence ineach.
• People keep on reporting discrepancies between the implementations.Almost inevitably these are not using comparable ‘tuning’ parameters,and people never appreciate how important these are.

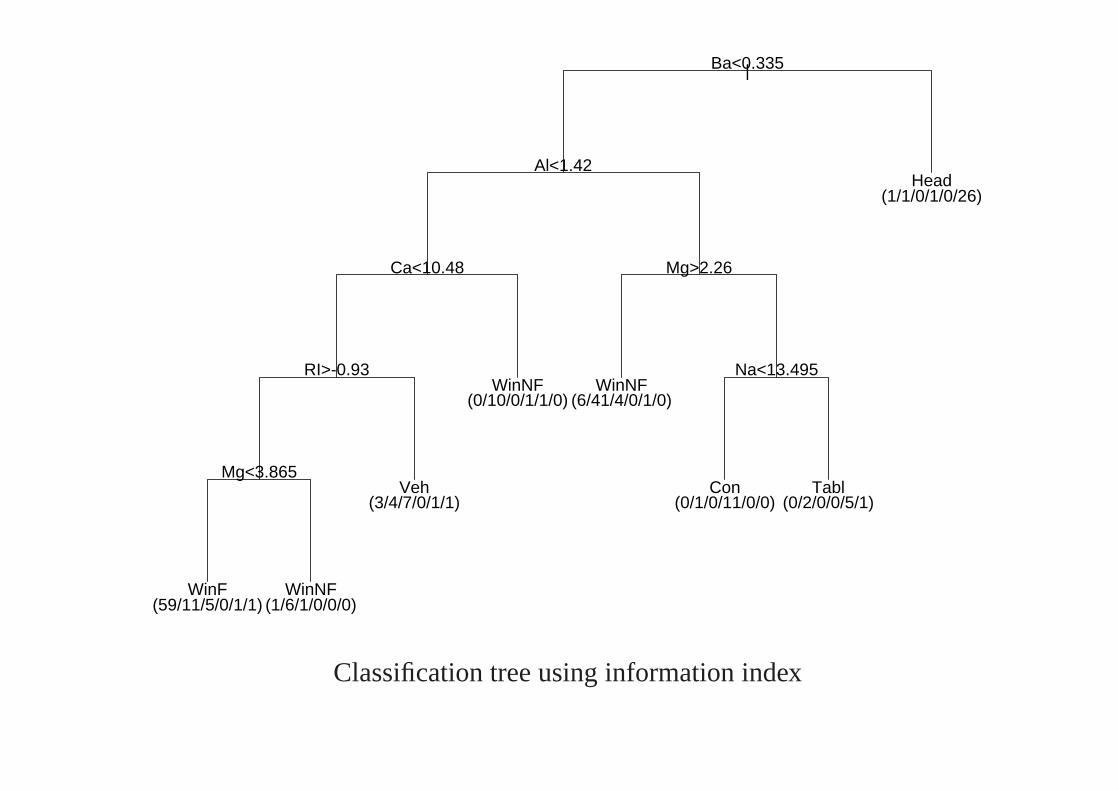
Classification Trees — Example
This dataset has 10 measurements on 214 fragments of glass from forensictesting, the measurements being of the refractive index and composition(percent weight of oxides of Na, Mg, Al, Si, K, Ca, Ba and Fe). Thefragments have been classified by six sources.
This data set is hard to visualize. We’ll try to show a video of non-metricmulti-dimensional scaling in 3D (which works much better than 2D).
Examples are from rpart.

WinF
WinNF
Veh
Con
Tabl
Head
-5 0 5 10 15
RI
12 14 16
Na
0 1 2 3 4
Mg
WinF
WinNF
Veh
Con
Tabl
Head
0.5 1.0 1.5 2.0 2.5 3.0 3.5
Al
70 71 72 73 74 75
Si
0 1 2 3 4 5 6
K
WinF
WinNF
Veh
Con
Tabl
Head
6 8 10 12 14 16
Ca
0.0 0.5 1.0 1.5 2.0 2.5 3.0
Ba
0.0 0.1 0.2 0.3 0.4 0.5
Fe
|Ba<0.335
Al<1.42
Ca<10.48
RI>-0.93
Mg<3.865
Mg>2.26
Na<13.495
WinF(59/11/5/0/1/1)
WinNF(1/6/1/0/0/0)
Veh(3/4/7/0/1/1)
WinNF(0/10/0/1/1/0)
WinNF(6/41/4/0/1/0)
Con(0/1/0/11/0/0)
Tabl(0/2/0/0/5/1)
Head(1/1/0/1/0/26)
Classification tree using information index

|Mg>=2.695
Al<1.42
RI>=-0.93
K>=0.29
Mg<3.75
Na<13.78
Al<1.38 Ba<0.2
WinF 41/7/0/0/0/1
WinNF0/10/0/0/0/0
WinF 20/2/6/0/0/0
Veh 3/4/7/0/0/0
WinNF6/40/4/0/0/2
WinNF0/7/0/0/0/1
Con 0/4/0/12/0/0
Tabl 0/2/0/0/9/1
Head 0/0/0/1/0/24
Classification tree using Gini index

Calibrating GAG in urine
Susan Prosser measured the concentration of the chemical GAG in the urineof 314 children aged 0—18 years. Her aim was to establish ‘normal’ levelsat different ages.

Scatterplot of GAG in urine
0 5 10 15
010
2030
4050
Age
GA
G

Clearly we want to fit a smooth curve. What? Polynomial? Exponential?
Choosing the degree of a polynomial by F-tests gives degree 6.

Degree-6 polynomial
0 5 10 15
010
2030
4050
Age
GA
G

Is this good enough?
Smoothing splines would be the numerical analyst’s way to fit a smoothcurve to such a scatterplot. The issue is ‘how smooth’ and in this example ithas been chosen automatically by GCV.
Code here owes a lot to Finbarr O’Sullivan, also Trevor Hastie and RobTibshirani.
> plot(GAGurine, pch=20)
> lines(smooth.spline(Age, GAG), lwd = 3, col="blue")
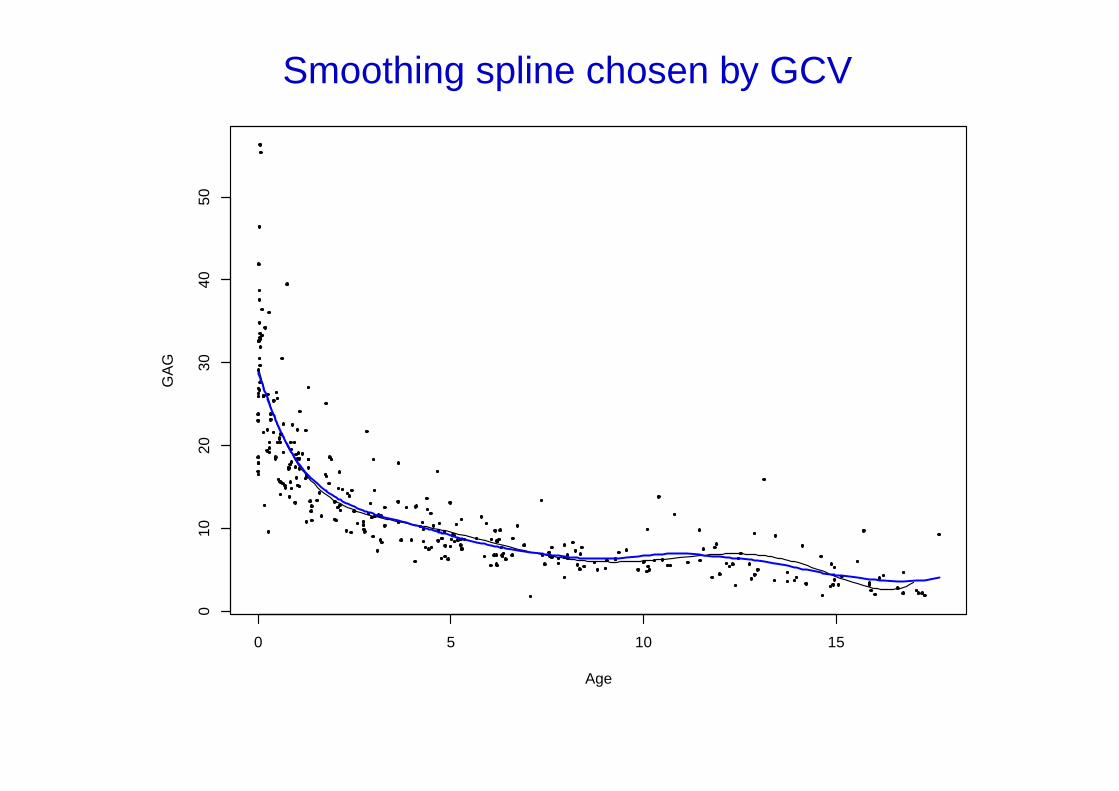
Smoothing spline chosen by GCV
0 5 10 15
010
2030
4050
Age
GA
G

An alternative would be local polynomials, using a kernel to define ‘local’and choosing the bandwidth automatically.
Code here is by Matt Wand.

Local polynomials
0 5 10 15
010
2030
4050
Age
GA
G
constlinearquadratic

Calibrating GAG in urine — Conclusions?
We have several reasonable fits (and there are many more methods we couldhave tried).
Most are simple enough to give to Excel users.
Automated methods of choosing how smooth work reasonably well, but thesubject matter should determine the final answer.
There’s a lot of computation (and theory and programming) supportingsimple exploration here.

Conclusions
• Better statistical computing allows analyses not dreamt of a decadeago.
• It’s not just more powerful computers.
• The results can be explained to non-statisticians.
• Finding ways to visualize datasets can be as important as ways toanalyse them.
• The software did not spring from thin air, any more than the methodsdid. Give credit where credit is due.