risk analysis process training - florida department of... tea… · risk analysis process training...
TRANSCRIPT
RISK ANALYSIS PROCESSTRAININGTRAINING
D i T i i EDesign Training ExpoDisney’s Coronado Springs Resort
Lake Buena Vista FLLake Buena Vista, FL
Presentation Format
Risk Analysis Process Overview
Presentation Format
Risk Analysis Process OverviewGreg Davis, PEState Estimates Engineer
Risk Analysis WorkshopKurt Lieblong, PE, CVSgState Project Review Administrator
Project Manager Roles Project Manager RolesRob Quigley, PEState Project Management Engineer
2
What is Risk?
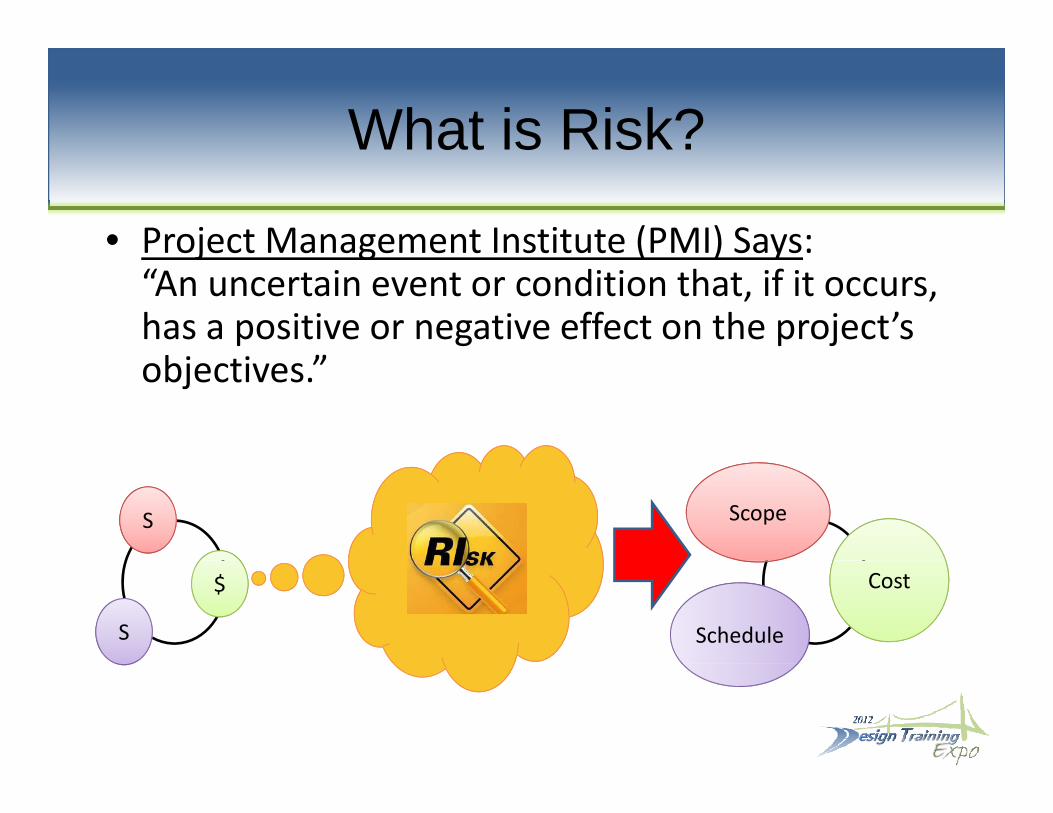
• Project Management Institute (PMI) Says: oject a age e t st tute ( ) Says:“An uncertain event or condition that, if it occurs, has a positive or negative effect on the project’s b ”objectives.”
S Scope
$
S Schedule
Cost
What is Risk Management?g
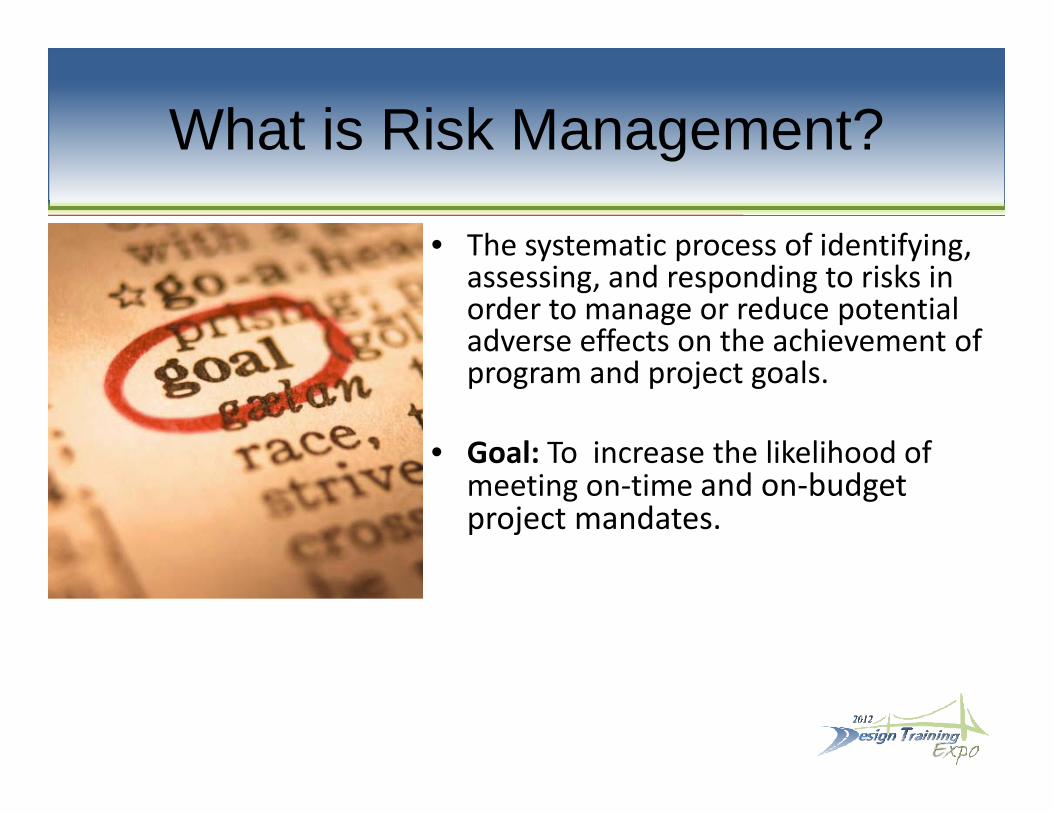
• The systematic process of identifying,The systematic process of identifying, assessing, and responding to risks in order to manage or reduce potential adverse effects on the achievement of program and project goals.
• Goal: To increase the likelihood ofGoal: To increase the likelihood of meeting on‐time and on‐budget project mandates.
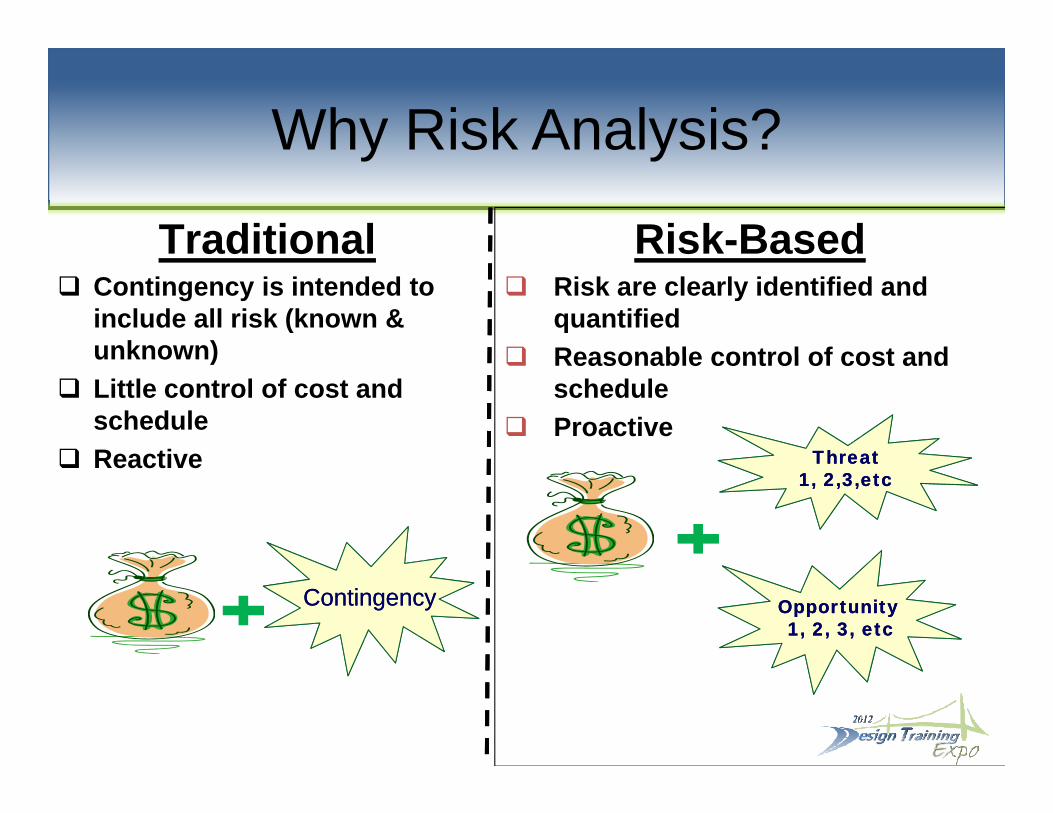
Why Risk Analysis?y y
Traditional Risk-BasedTraditional Contingency is intended to
include all risk (known & unknown)
Risk Based Risk are clearly identified and
quantified Reasonable control of cost andunknown)
Little control of cost and schedule
Reactive
Reasonable control of cost and schedule
ProactiveThreatThreatThreatThreat Reactive
1, 2,3,etc1, 2,3,etcThreatThreat
1, 2,3,etc1, 2,3,etc
OpportunityOpportunity1, 2, 3, etc1, 2, 3, etc
ContingencyContingency
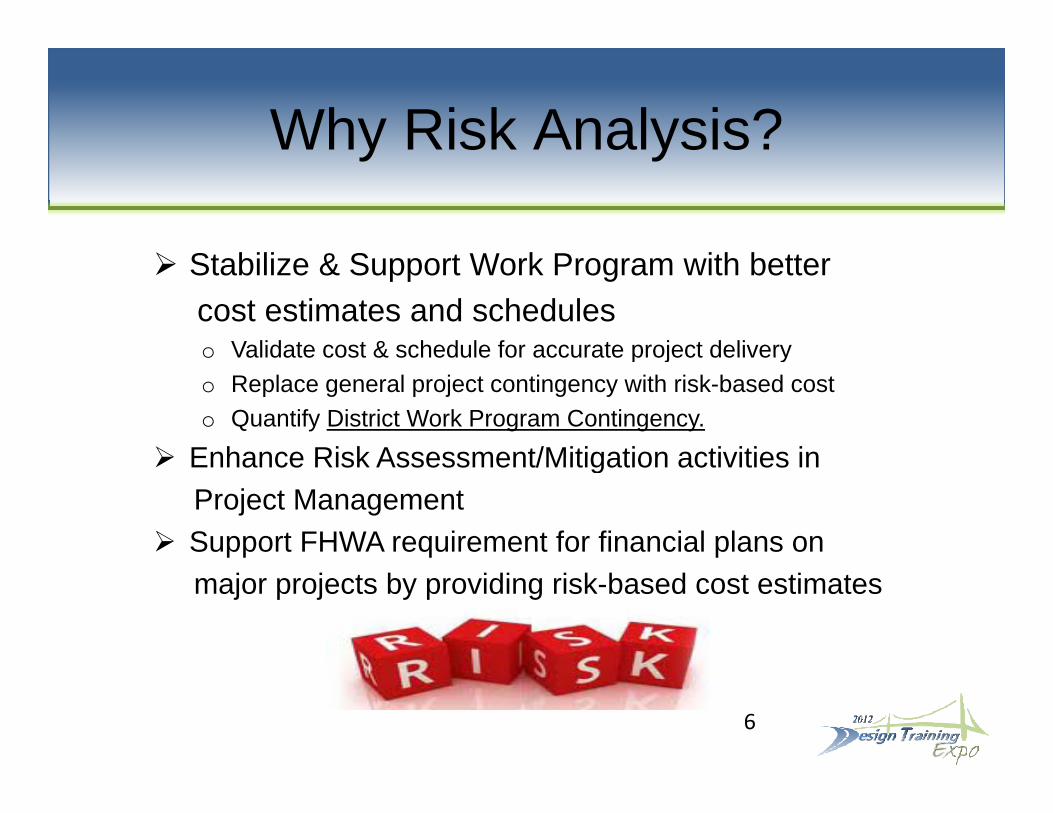
Why Risk Analysis?
St bili & S t W k P ith b tt
y y
Stabilize & Support Work Program with bettercost estimates and scheduleso Validate cost & schedule for accurate project deliveryo Validate cost & schedule for accurate project delivery o Replace general project contingency with risk-based costo Quantify District Work Program Contingency.
Enhance Risk Assessment/Mitigation activities in Enhance Risk Assessment/Mitigation activities inProject Management
Support FHWA requirement for financial plans onmajor projects by providing risk-based cost estimates
6
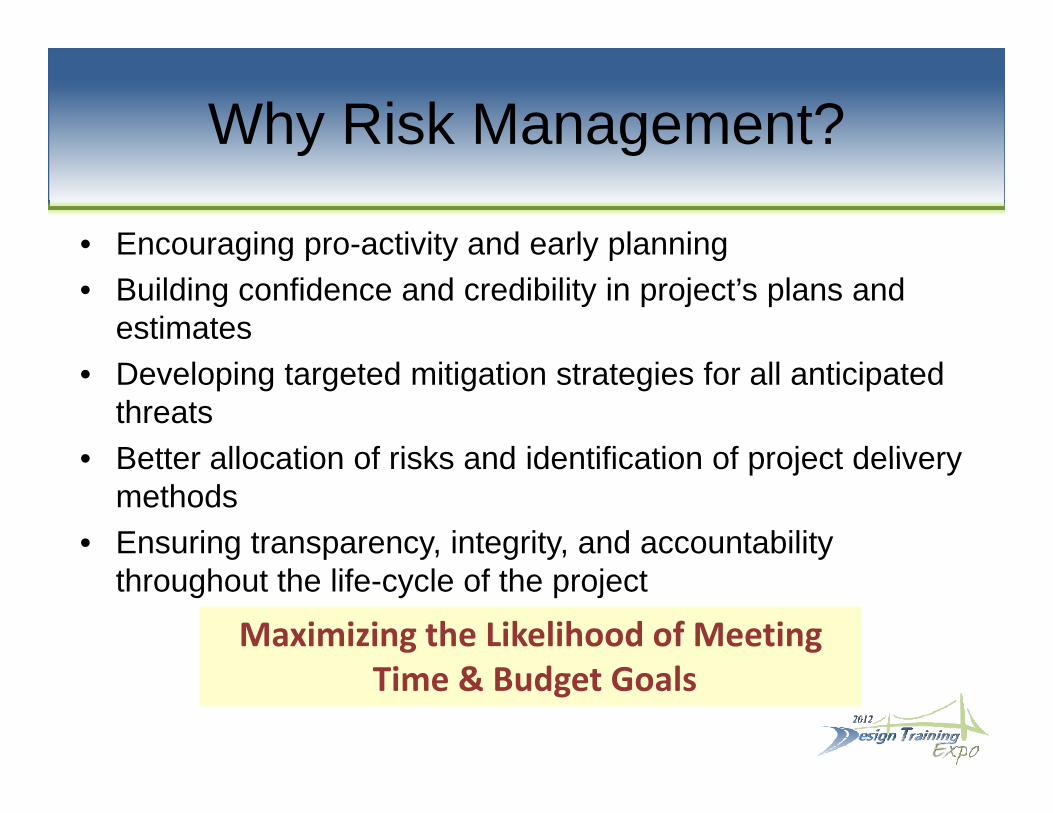
Why Risk Management?y g
• Encouraging pro-activity and early planningEncouraging pro activity and early planning • Building confidence and credibility in project’s plans and
estimates• Developing targeted mitigation strategies for all anticipated
threats• Better allocation of risks and identification of project delivery• Better allocation of risks and identification of project delivery
methods• Ensuring transparency, integrity, and accountability
throughout the life-cycle of the project
Maximizing the Likelihood of MeetingTime & Budget Goals
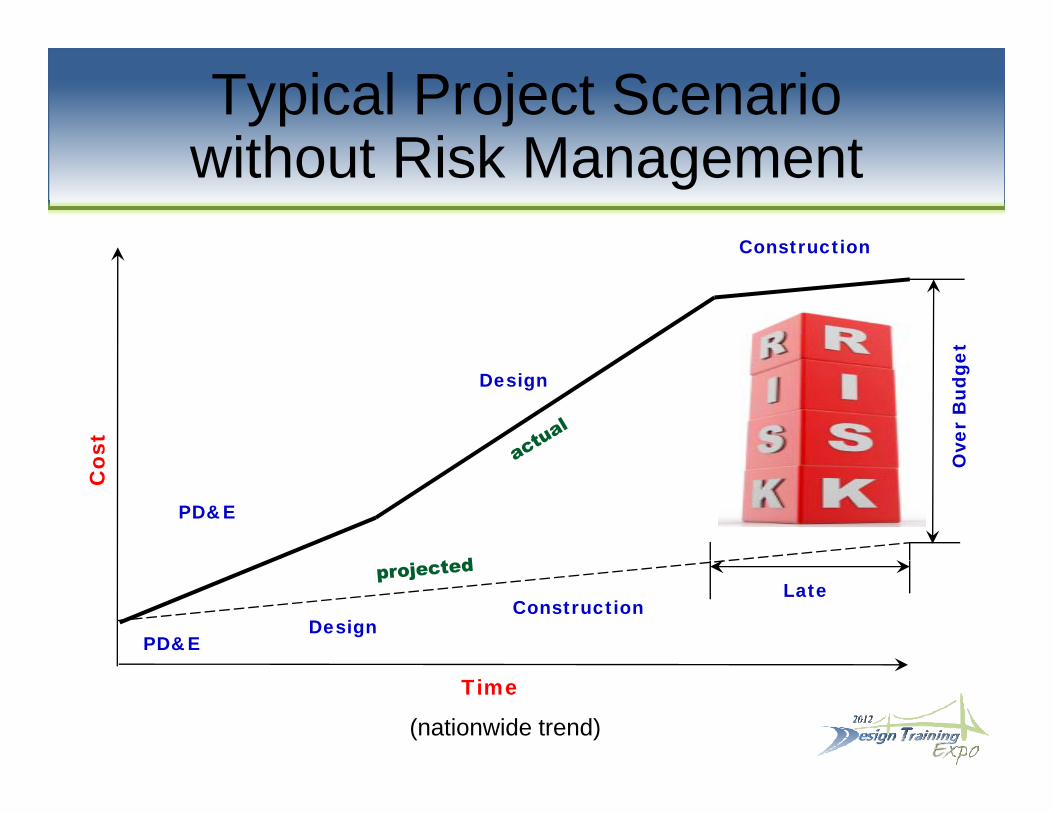
Typical Project Scenario without Risk Management
Construction
without Risk ManagementConstruction
et
Design
Ove
r B
udge
ost
PD&E
O
Co
Late
PD&EDesign
Construction
Time
(nationwide trend)
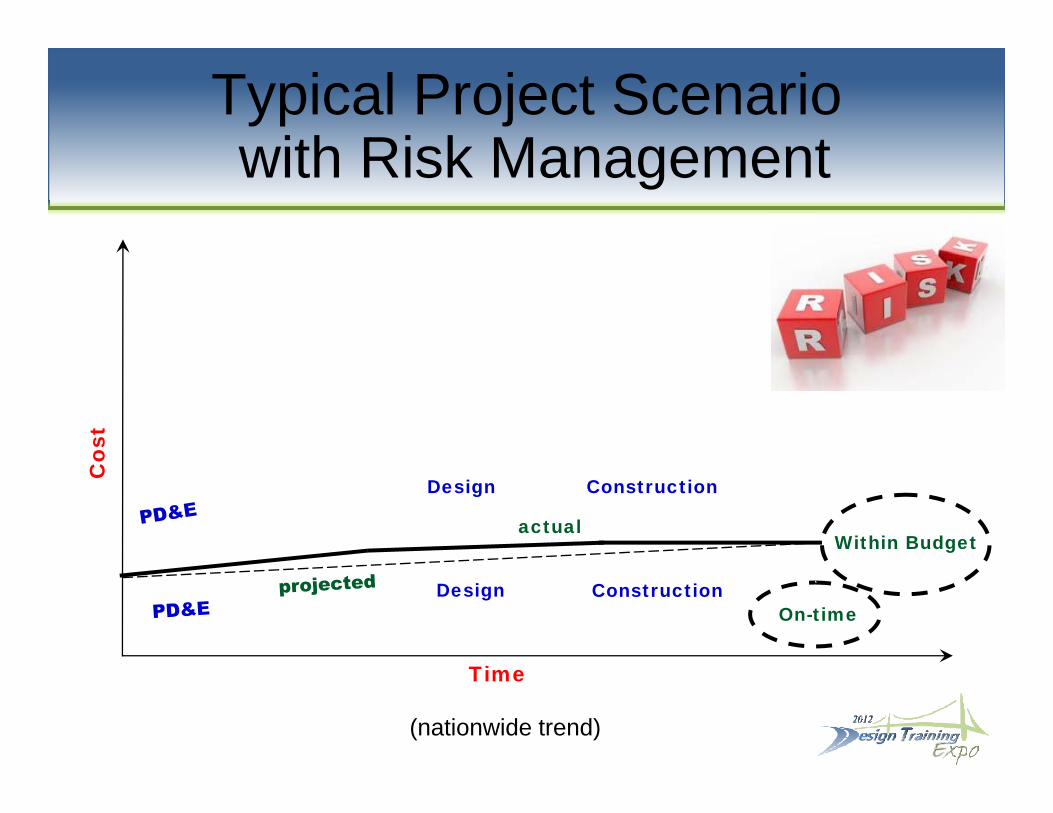
Typical Project Scenariowith Risk Managementwith Risk Management
ost
Co
Design Construction
actualWithin Budget
Design ConstructionOn-time
Time
(nationwide trend)
When to Use Ri k M tRisk Management
• Early planning and budgeting• Early planning and budgeting
• Evaluation of project delivery alternatives
• Financial Planning Support
• Establishing Risk Allocation between partiesEstablishing Risk Allocation between parties
• Preparation of project contract documents
• Throughout Project Delivery Lifecycle
Risk Management Objectivesg j
• “ to increase the probability and impact of positive• …to increase the probability and impact of positive events, and decrease the probability and impact of negative events in the project.”*
• Make better decisions
• Allocate risks to those who can best control them
• Increase agency credibility
• Foster good relationships with project stakeholdersFoster good relationships with project stakeholders
* Source: PMI
Risk ManagementO tOutcomes
Validation of Project Cost and Schedule Validation of Project Cost and Schedule
Managed Risk Response Plan Managed Risk Response Plano Identification of high cost and schedule risk drivers
Managed District Contingency Boxo Reduced Contingency as project evolves
Understand and Communicate Cash Flow Requirements and Financial PlansRequirements and Financial Plans
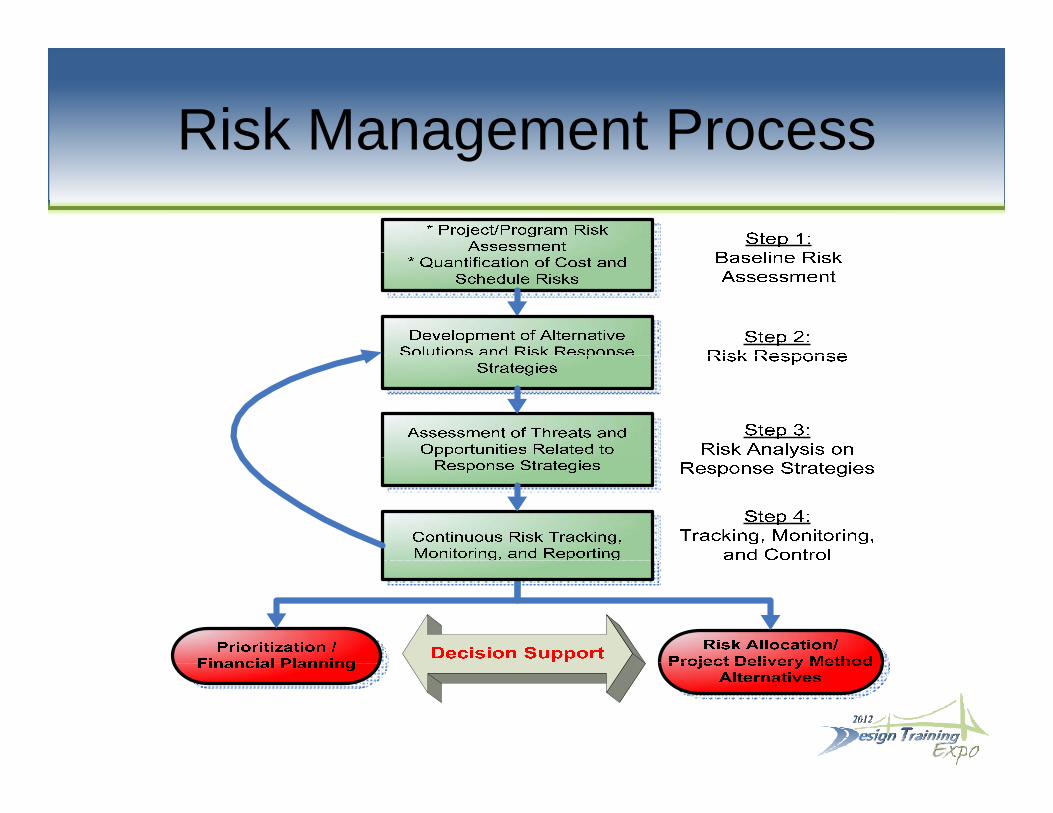
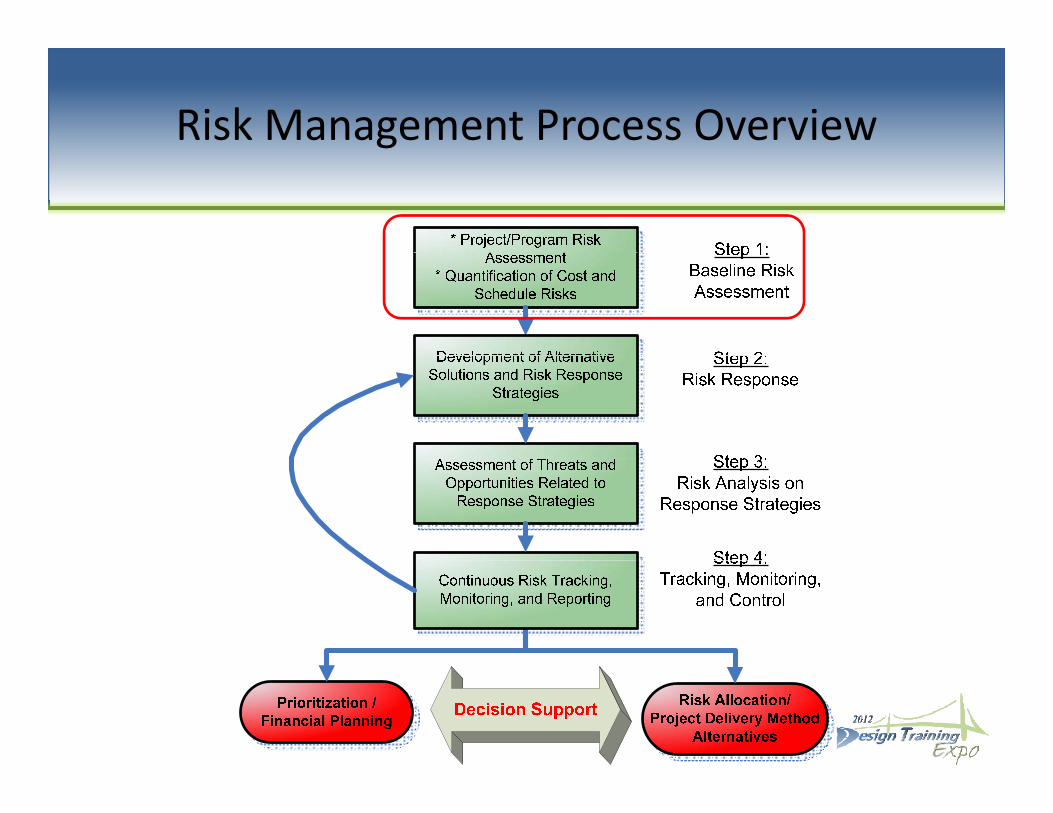
Risk Management Processg

Risk Management Processg
Identifyy
AssessPlan &OrganizeOrganize
AnalyzeMonitor
MitigateAllocate
& Control
Risk Management Processg
• Review purpose & need
Plan & Organize
• Review purpose & need
• Gather project information & data
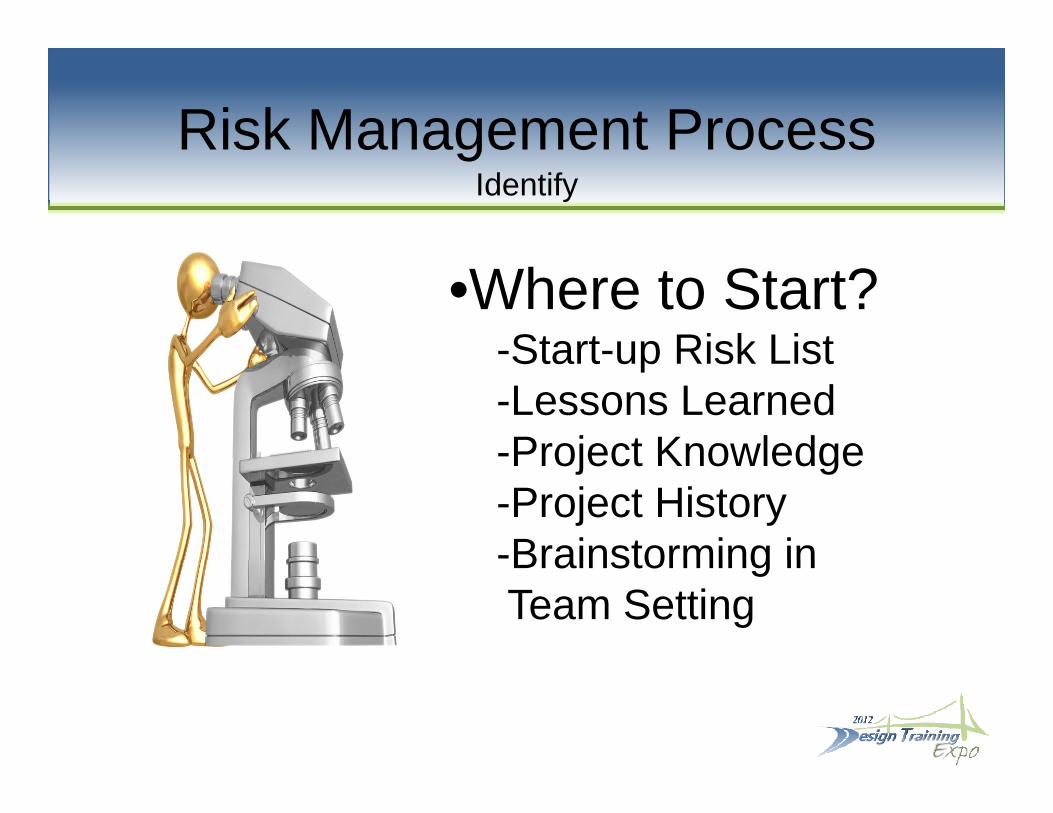
Risk Management ProcessgIdentify
•Where to Start?-Start-up Risk ListStart up Risk List-Lessons Learned -Project KnowledgeProject Knowledge-Project History-Brainstorming inBrainstorming inTeam Setting
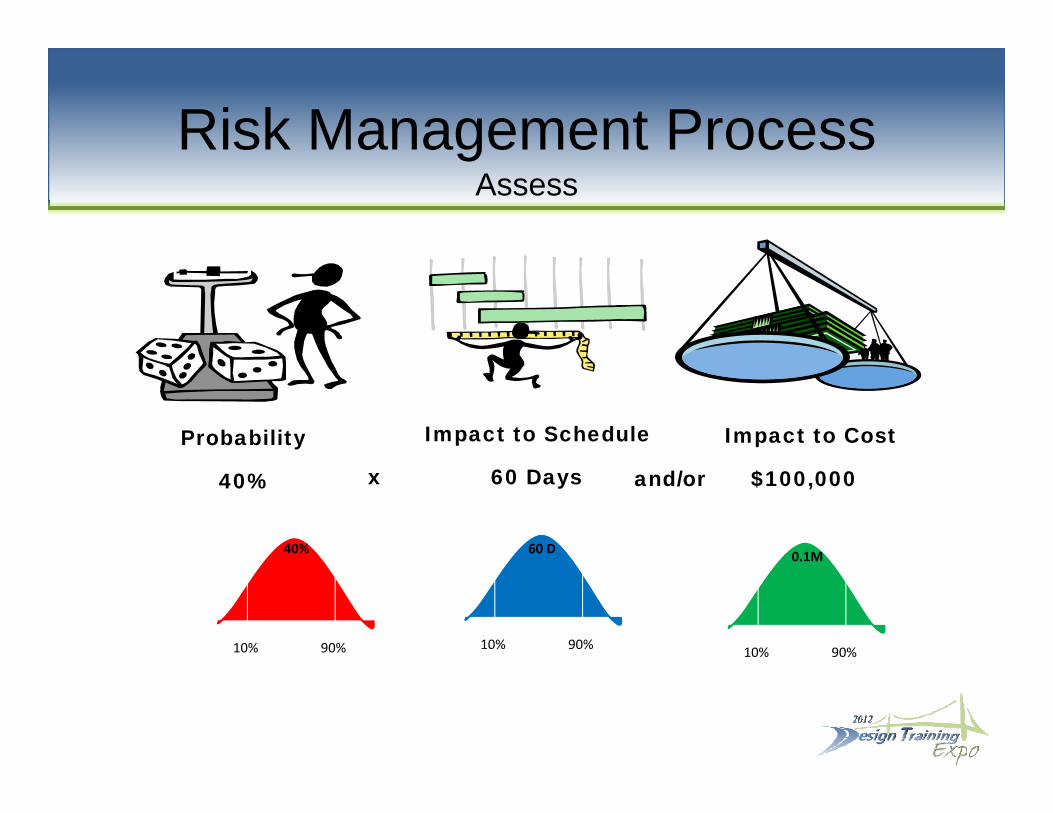
Risk Management ProcessgAssess
Probability Impact to Schedule Impact to Cost
40% 60 Daysx $100,000and/or
40% 60 D 0.1M
10% 90% 10% 90% 10% 90%
0.1M
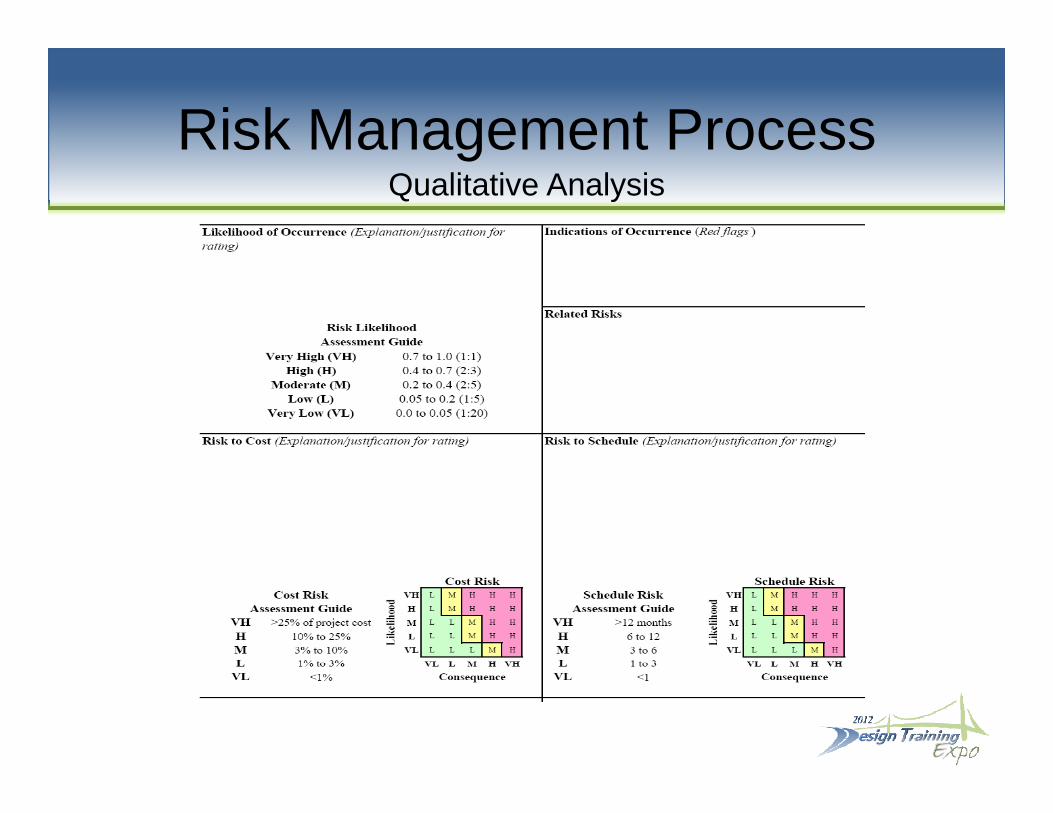
Risk Management ProcessgQualitative Analysis
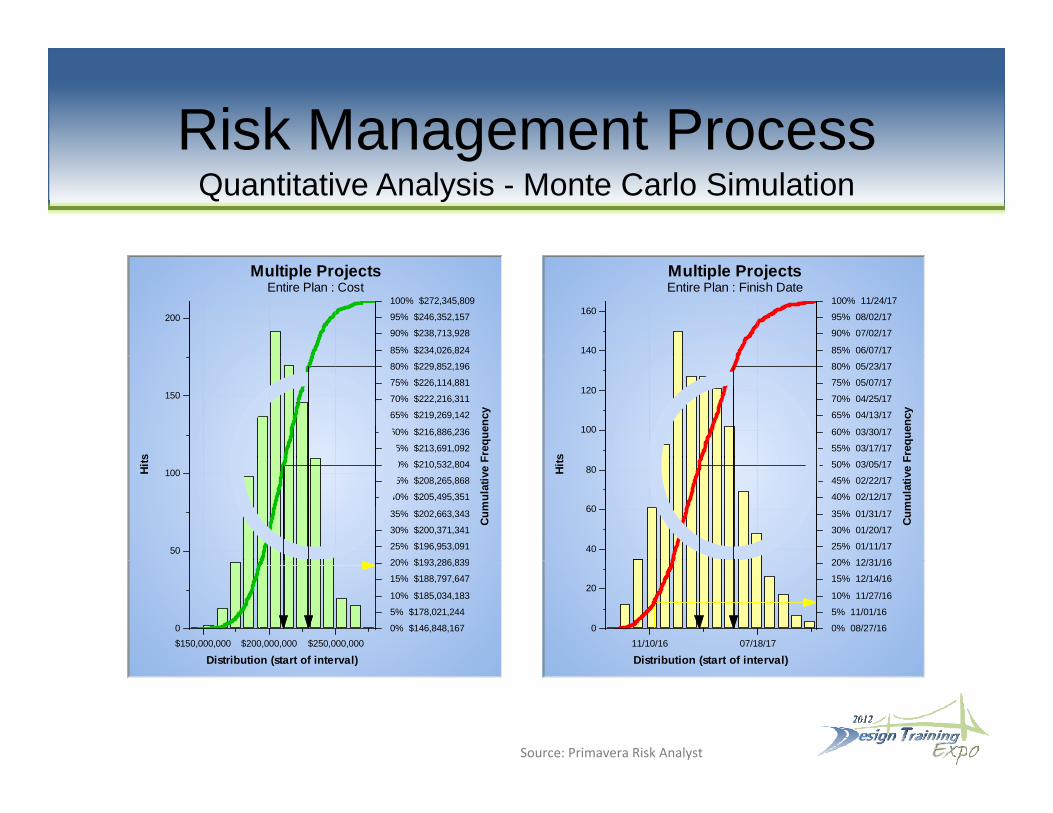
Risk Management ProcessgQuantitative Analysis - Monte Carlo Simulation
140
160
85% 06/07/17
90% 07/02/17
95% 08/02/17
100% 11/24/17
Multiple ProjectsEntire Plan : Finish Date
200
85% $234,026,824
90% $238,713,928
95% $246,352,157
100% $272,345,809
Multiple ProjectsEntire Plan : Cost
100
120
s
55% 03/17/17
60% 03/30/17
65% 04/13/17
70% 04/25/17
75% 05/07/17
80% 05/23/17
Freq
uenc
y
150
s
55% $213,691,092
60% $216,886,236
65% $219,269,142
70% $222,216,311
75% $226,114,881
80% $229,852,196
Freq
uenc
y
40
60
80Hits
20% 12/31/16
25% 01/11/17
30% 01/20/17
35% 01/31/17
40% 02/12/17
45% 02/22/17
50% 03/05/17
Cum
ulat
ive
F
50
100Hits
20% $193 286 839
25% $196,953,091
30% $200,371,341
35% $202,663,343
40% $205,495,351
45% $208,265,868
50% $210,532,804
Cum
ulat
ive
F
11/10/16 07/18/17
Distribution (start of interval)
0
20
0% 08/27/16
5% 11/01/16
10% 11/27/16
15% 12/14/16
20% 12/31/16
$150,000,000 $200,000,000 $250,000,000
Distribution (start of interval)
0 0% $146,848,167
5% $178,021,244
10% $185,034,183
15% $188,797,647
20% $193,286,839
Distribution (start of interval)Distribution (start of interval)
Source: Primavera Risk Analyst
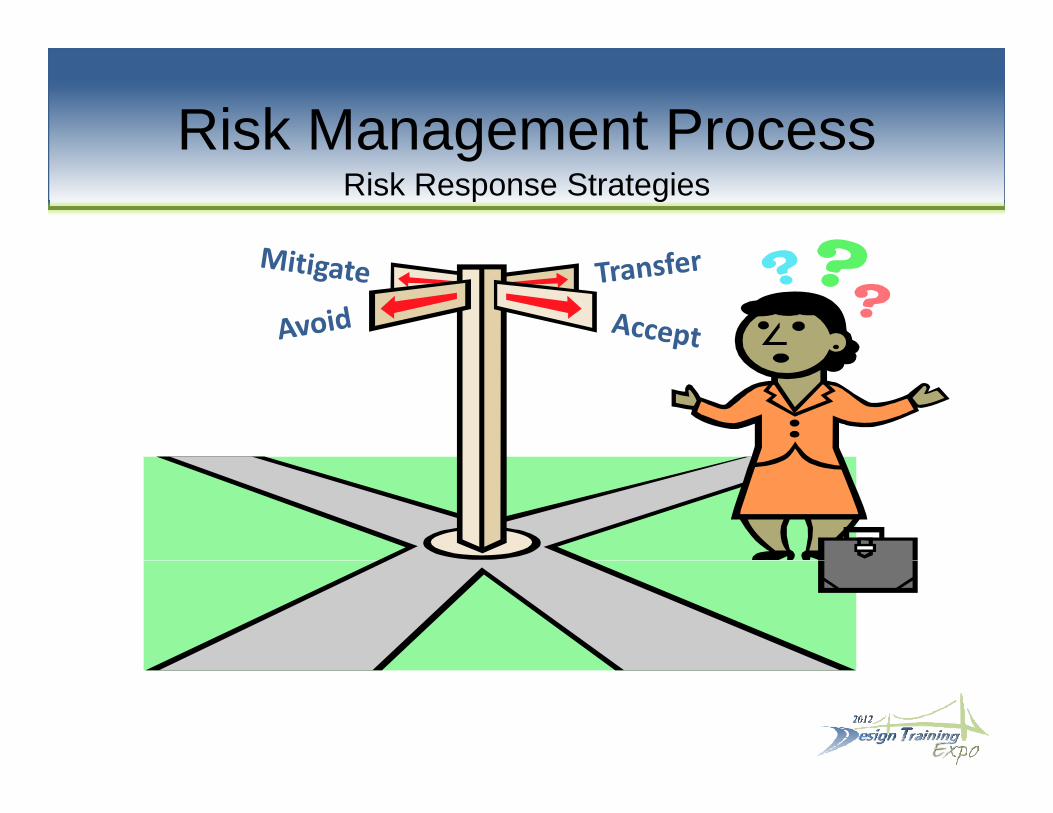
Risk Management ProcessgRisk Response Strategies
Risk Management ProcessgRisk Response Strategies
“Hope is not a Strategy”
Risk Management ProcessgAllocation
Assign Risk to those in best position to control it
Risk Management ProcessgMonitor & Control
The Big Pictureg
• Better Management of Program Contingencies• Better Management of Program Contingencies• Opportunity to Reallocate Funds• Enables Cash Flow Financial Management• Enables Cash-Flow Financial Management
Risk AnalysisRisk Analysis Workshop
Kurt LieblongKurt Lieblong
Risk Management Process Overview
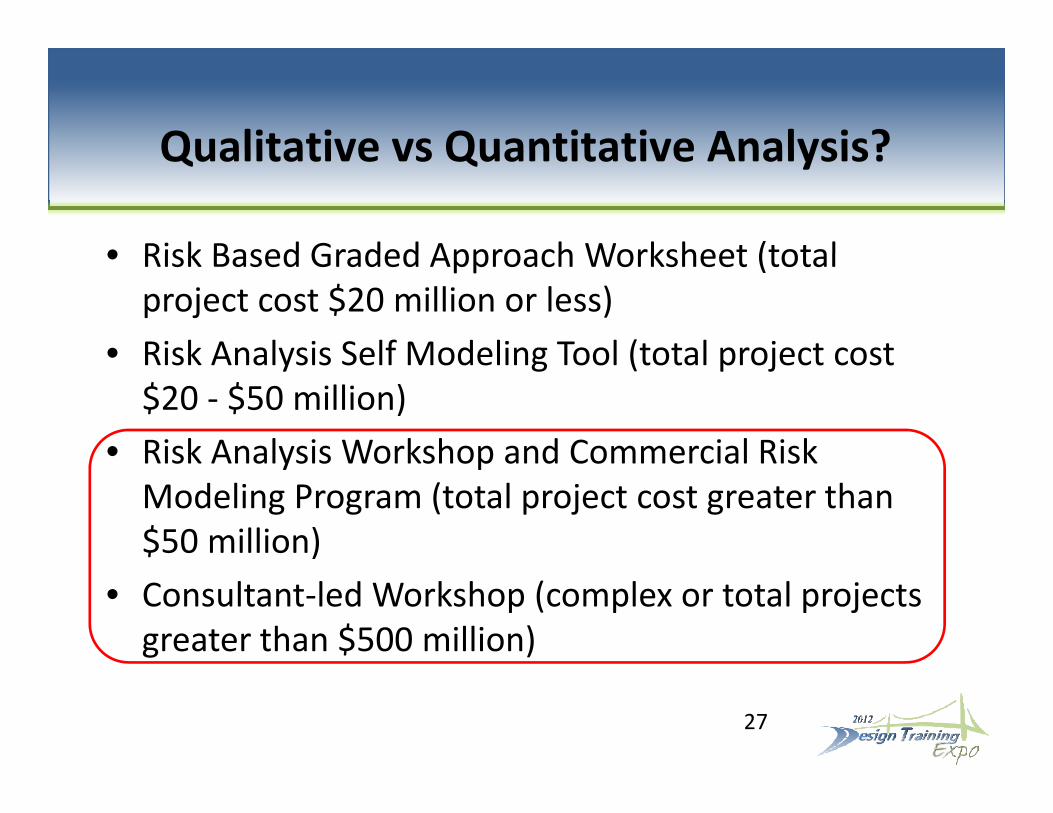
Qualitative vs Quantitative Analysis?
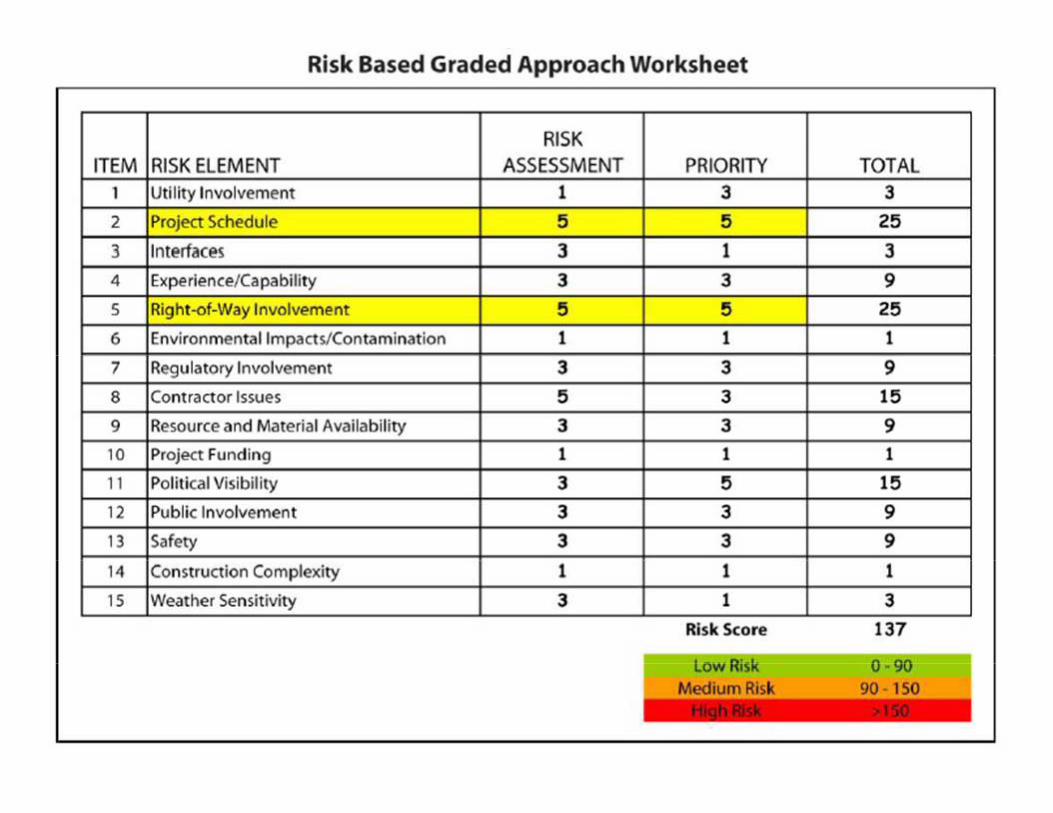
• Risk Based Graded Approach Worksheet (total
Qualitative vs Quantitative Analysis?
• Risk Based Graded Approach Worksheet (total project cost $20 million or less)
• Risk Analysis Self Modeling Tool (total project cost• Risk Analysis Self Modeling Tool (total project cost $20 ‐ $50 million)
• Risk Analysis Workshop and Commercial RiskRisk Analysis Workshop and Commercial Risk Modeling Program (total project cost greater than $50 million)
• Consultant‐led Workshop (complex or total projects greater than $500 million)
27
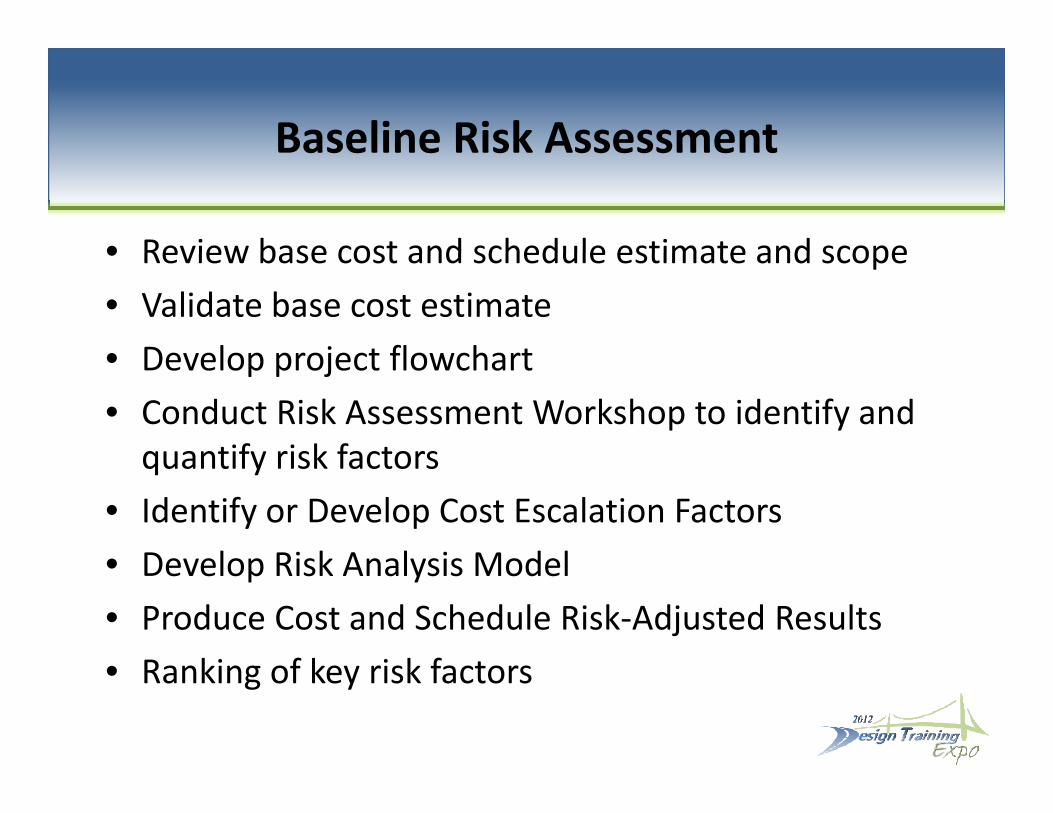
Baseline Risk AssessmentBaseline Risk Assessment
• Review base cost and schedule estimate and scope• Review base cost and schedule estimate and scope• Validate base cost estimate• Develop project flowchart• Develop project flowchart• Conduct Risk Assessment Workshop to identify and quantify risk factorsquantify risk factors
• Identify or Develop Cost Escalation Factors• Develop Risk Analysis Model• Develop Risk Analysis Model• Produce Cost and Schedule Risk‐Adjusted ResultsR ki f k i k f t• Ranking of key risk factors
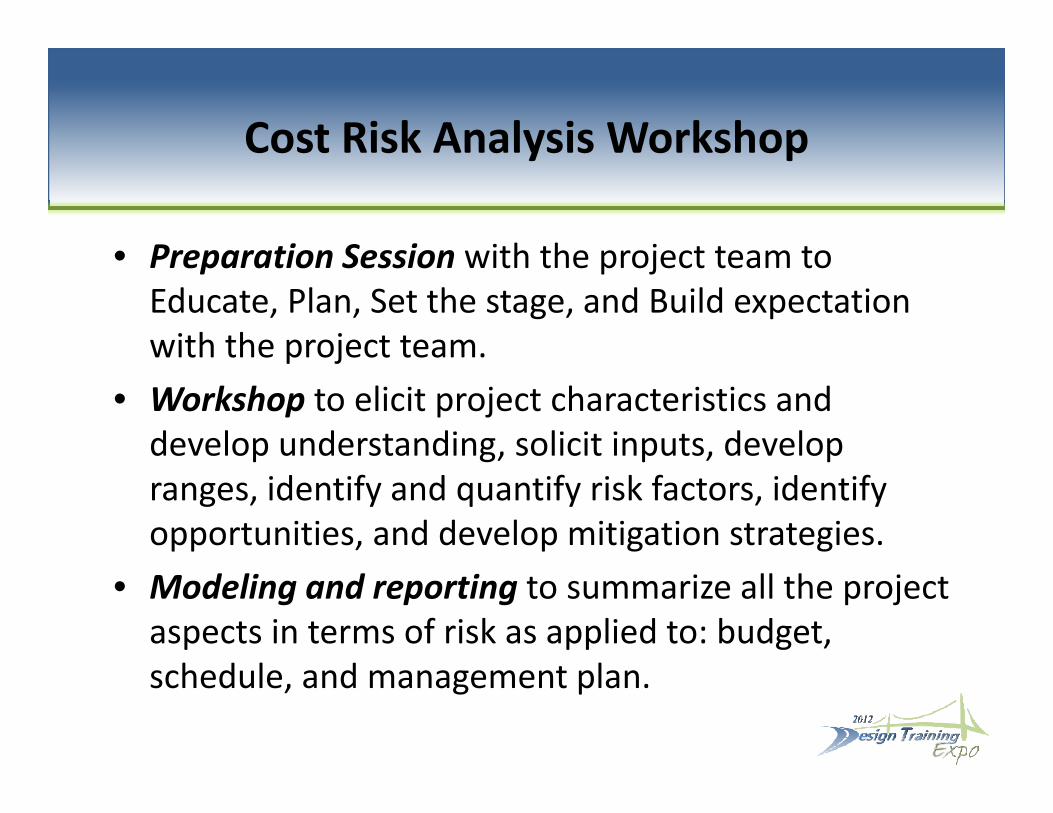
Cost Risk Analysis WorkshopCost Risk Analysis Workshop
• Preparation Session with the project team to• Preparation Session with the project team to Educate, Plan, Set the stage, and Build expectation with the project team.with the project team.
• Workshop to elicit project characteristics and develop understanding, solicit inputs, develop p g, p , pranges, identify and quantify risk factors, identify opportunities, and develop mitigation strategies.
• Modeling and reporting to summarize all the project aspects in terms of risk as applied to: budget, h d l d lschedule, and management plan.
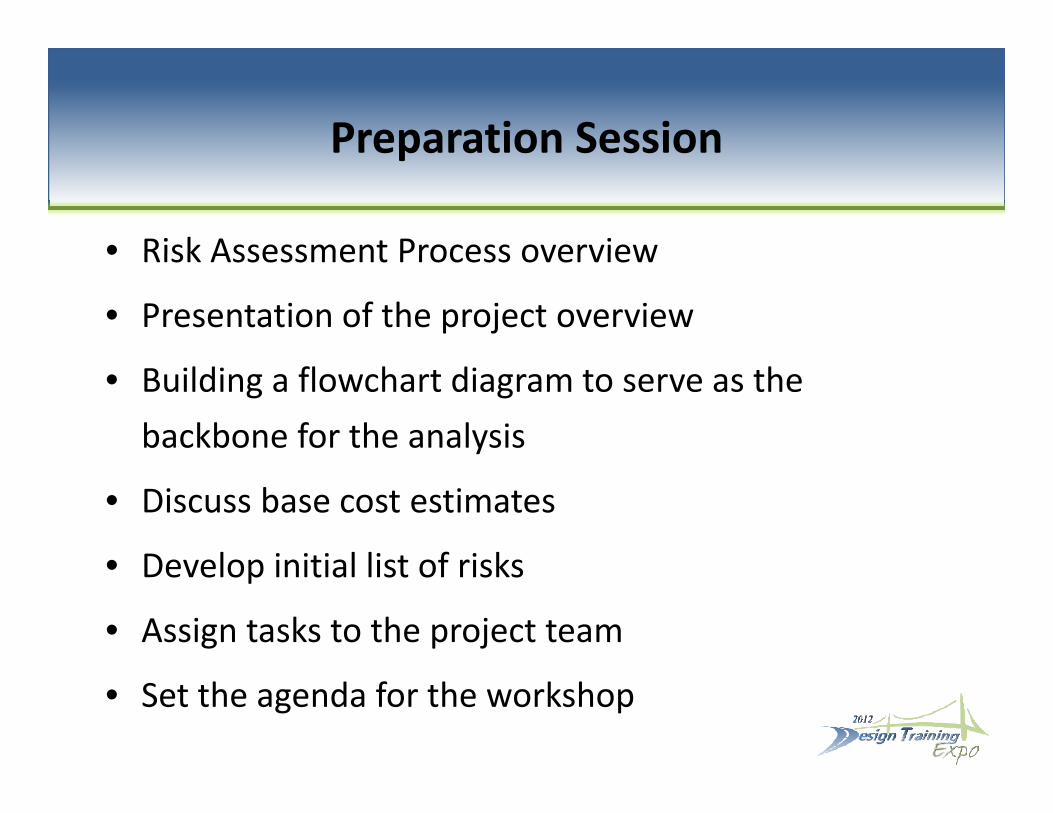
Preparation SessionPreparation Session
• Risk Assessment Process overview• Risk Assessment Process overview
• Presentation of the project overview
• Building a flowchart diagram to serve as the backbone for the analysis
• Discuss base cost estimates
• Develop initial list of risks• Develop initial list of risks
• Assign tasks to the project team
• Set the agenda for the workshop

Risk Analysis FlowchartRisk Analysis Flowchart
Activity B
Activity A
StartEnd
Activity C
Activity D$ }
For Each Task

Flowchart – An Illustration
2008 2009 2010 2011 2012 2013 2014 2015 2016
Jan-Mar Oct-DecApr-Jun Jul-Sep Jan-Mar Oct-DecApr-Jun Jul-Sep Jan-Mar Oct-DecApr-Jun Jul-Sep Jan-Mar Oct-DecApr-Jun Jul-Sep Jan-Mar Oct-DecApr-Jun Jul-Sep Jan-Mar Oct-DecApr-Jun Jul-Sep Jan-Mar Oct-DecApr-Jun Jul-Sep Jan-Mar Oct-DecApr-Jun Jul-Sep Jan-Mar Oct-DecApr-Jun Jul-Sep
1. Publish DEIS
10. Record of Decision
15. Begin Construction
men
t Per
iod
nths
16a. Construct Columbia River Structure35 months
17b. Hayden Island Interchange
10a.
Rev
iew
to
get R
ecor
d of
D
ecis
ion
4 m
onth
s16b. Construct Columbia River
Structure 7 months
17a. Hayden Island Interchange 16 months
FF
2. D
EIS
Com
m2
mon
cal A
genc
y A
dopt
ion
2 m
onth
s
11. PS&E River Crossing18 months
12. PS&E Transit18 months
13. R/W Highway18 months
14. R/W Transit18 months
32 months
18b. SR-14 Interchange 18 months
19b. Marine Drive
Interchange
18a. SR-14 Interchange28 months
19a. Marine Drive Interchange19 months
Project Complete
4. LPA
3. L
oc
5. Prepare and Publish FEIS12 months
6 months
20. Mill Plain Interchange40 months
21. Fourth Plain Interchange43 months
22. SR-500 Interchange46 months
23 Demo Existing Interstate
SS + 43 months
28. PS&E Hayden Island18 months
29. PS&E SR-1418 months
30. PS&E Marine Drive18 months
31. PS&E Mill Plain18 months
32. PS&E Fourth Plain18 months
7. FTA New Starts Submital
6. PE – 30% Design Highway12 months
8. PE – 30% Design Transit
8 months
23. Demo Existing Interstate Bridge
10 months
24. LRT South25 months
25. LRT North22 months
FS + 2 months
Columbia River Crossing Project
26. LRT Across the River14 months
33. PS&E SR-50018 months
FS + 2 months27. LRT Burn
6 months
8 months
9. Environmental Permitting28 months
Columbia River Crossing ProjectLight Rail Transit Mill District Alignment
--Not to Scale--
Decision Point
Environmental, Permitting, Review, and Agency Adoption
Highway Activities
Transit Activities
River Crossing

Principles of the Risk Assessment k h hWorkshop Approach
ll b h• Collaborative, team approach• Look at all project costs, including design, right‐of‐way, and construction
• Define threats and opportunities individually pp y(to the extent possible)
• Provide broad flexibility to representProvide broad flexibility to represent uncertainty and correlation
• Identify risk management strategies• Identify risk management strategies
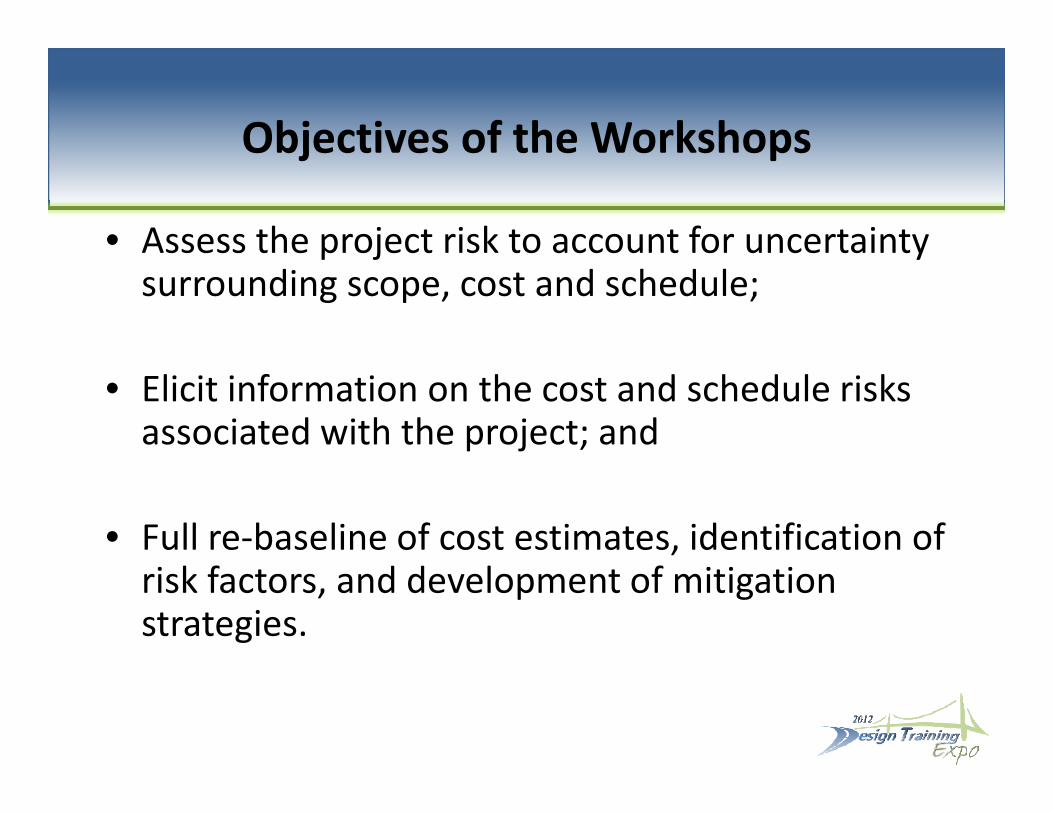
Objectives of the WorkshopsObjectives of the Workshops
• Assess the project risk to account for uncertainty ssess t e p oject s to accou t o u ce ta tysurrounding scope, cost and schedule;
• Elicit information on the cost and schedule risks associated with the project; and
• Full re‐baseline of cost estimates, identification of risk factors, and development of mitigation strategies.
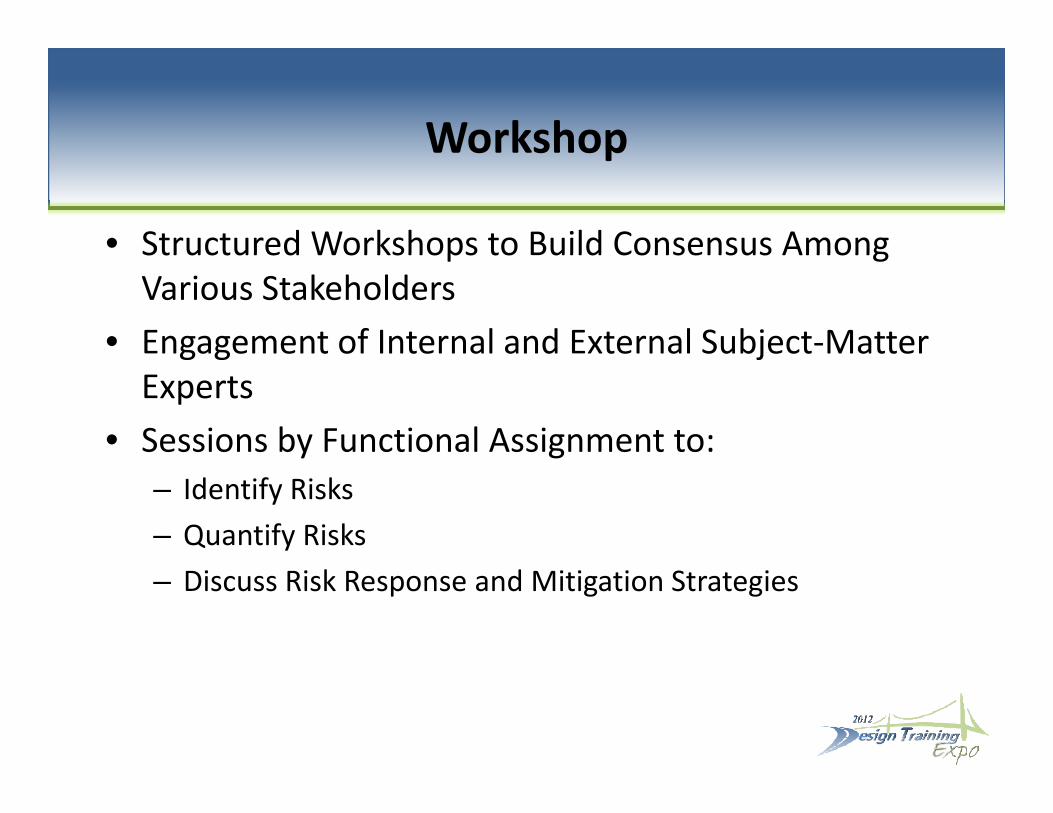
WorkshopWorkshop
• Structured Workshops to Build Consensus AmongStructured Workshops to Build Consensus Among Various Stakeholders
• Engagement of Internal and External Subject‐Matter g g jExperts
• Sessions by Functional Assignment to:y g– Identify Risks– Quantify Risks– Discuss Risk Response and Mitigation Strategies
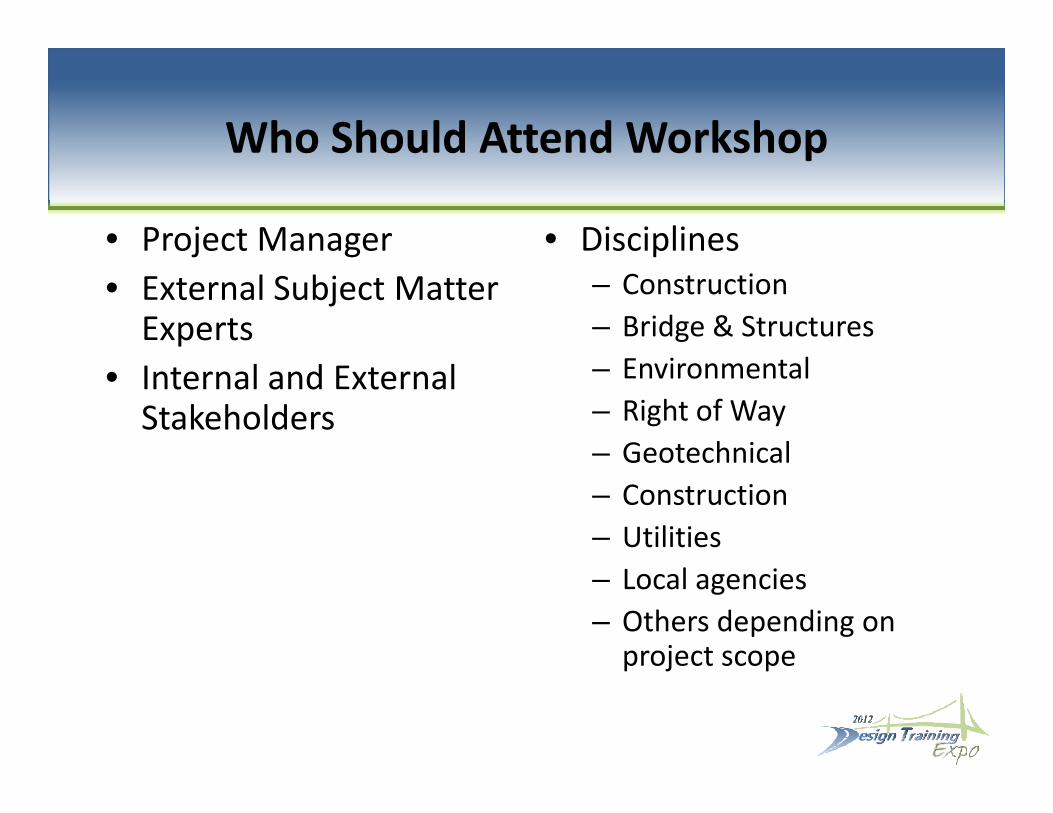
Who Should Attend WorkshopWho Should Attend Workshop
• Project Manager • Disciplines j g• External Subject Matter Experts
p– Construction– Bridge & Structures
• Internal and External Stakeholders
– Environmental– Right of Way– GeotechnicalGeotechnical– Construction– Utilities– Local agencies– Others depending on project scopeproject scope

Project Team RolesProject Team Roles
• Provide Project Information:j– Project location maps, overheads, etc.– Project cost estimate and backupD i d t ti h d l fl h t– Design and construction schedule or flow chart
– Develop comprehensive list of risks, typically using starter risk list
• Workshop Support:– Provide input on risk identifying, quantification and mitigatemitigate
– Provide information on project history and key decisions as these items come up in discussion
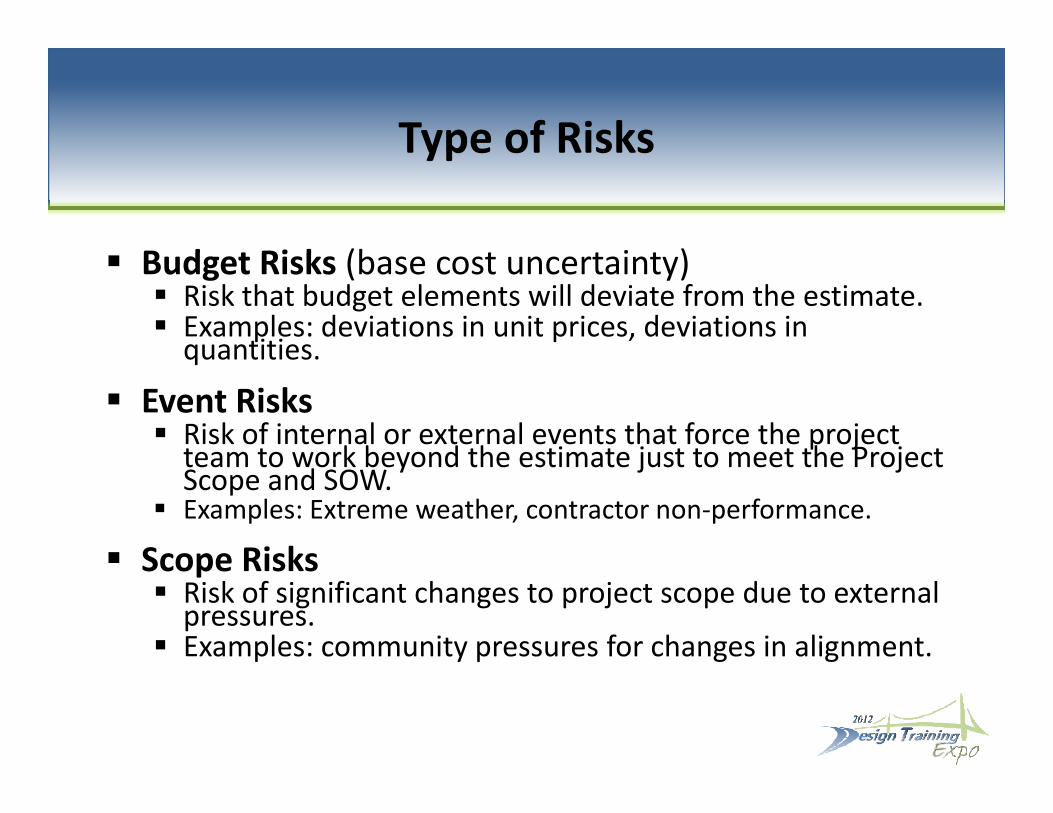
Type of RisksType of Risks
B d t Ri k (b t t i t ) Budget Risks (base cost uncertainty) Risk that budget elements will deviate from the estimate. Examples: deviations in unit prices, deviations in quantitiesquantities.
Event Risks Risk of internal or external events that force the project team to work beyond the estimate just to meet the Projectteam to work beyond the estimate just to meet the Project Scope and SOW.
Examples: Extreme weather, contractor non‐performance.
Scope Risks Scope Risks Risk of significant changes to project scope due to external pressures.
Examples: community pressures for changes in alignment.
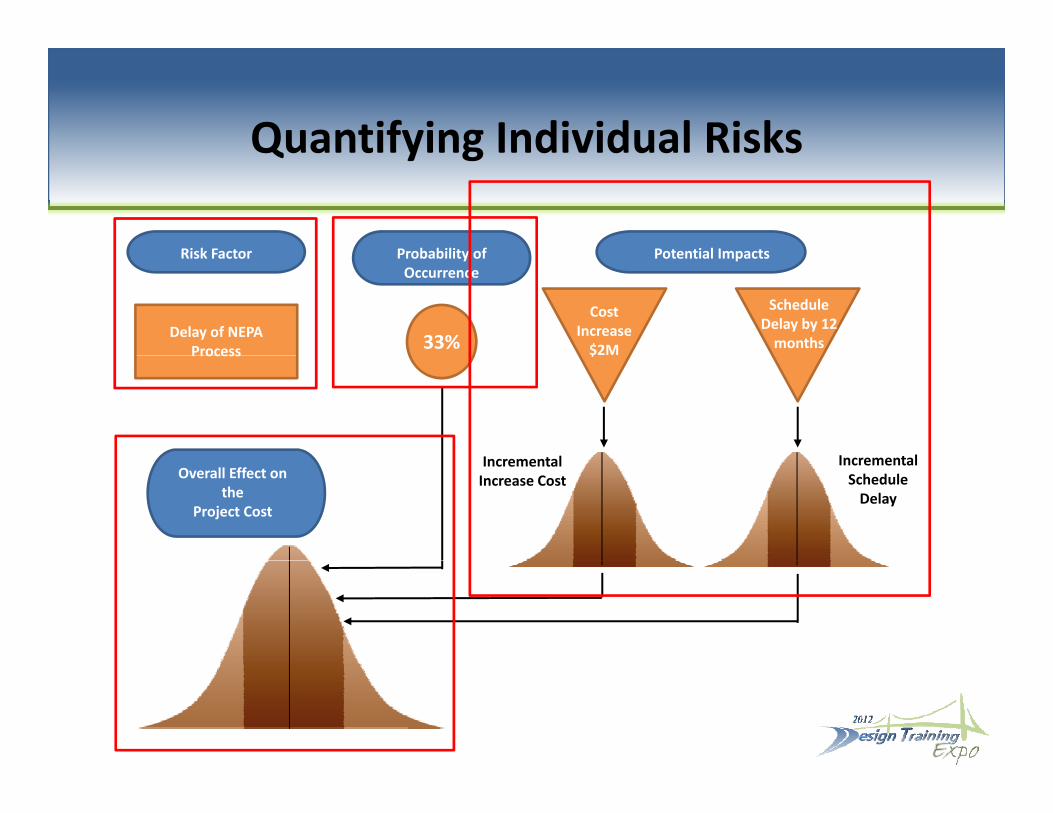
Quantifying Individual Risks
Risk Factor Probability of Potential Impacts
Quantifying Individual Risks
Risk Factor Probability of Occurrence
Potential Impacts
Delay of NEPAProcess 33%
CostIncrease$2M
ScheduleDelay by 12monthsProcess $
I t l IncrementalIncrementalIncrease Cost
IncrementalScheduleDelay
Overall Effect on the
Project Cost
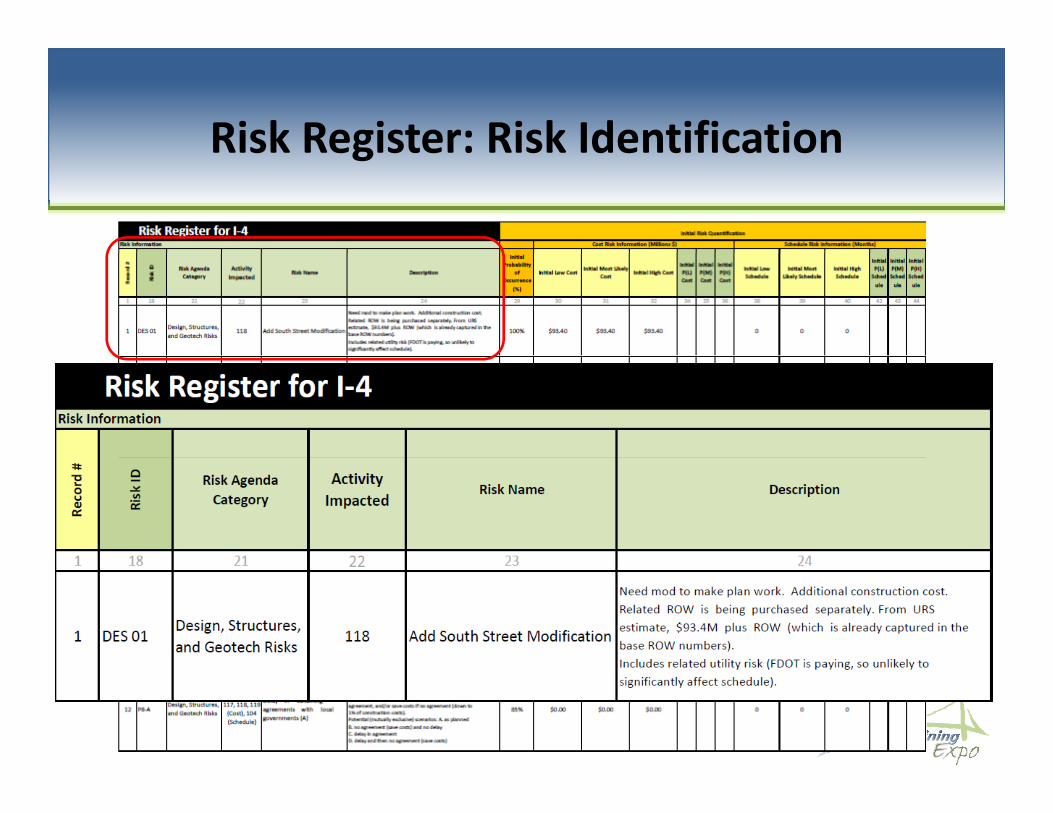
Risk Register: Risk IdentificationRisk Register: Risk Identification
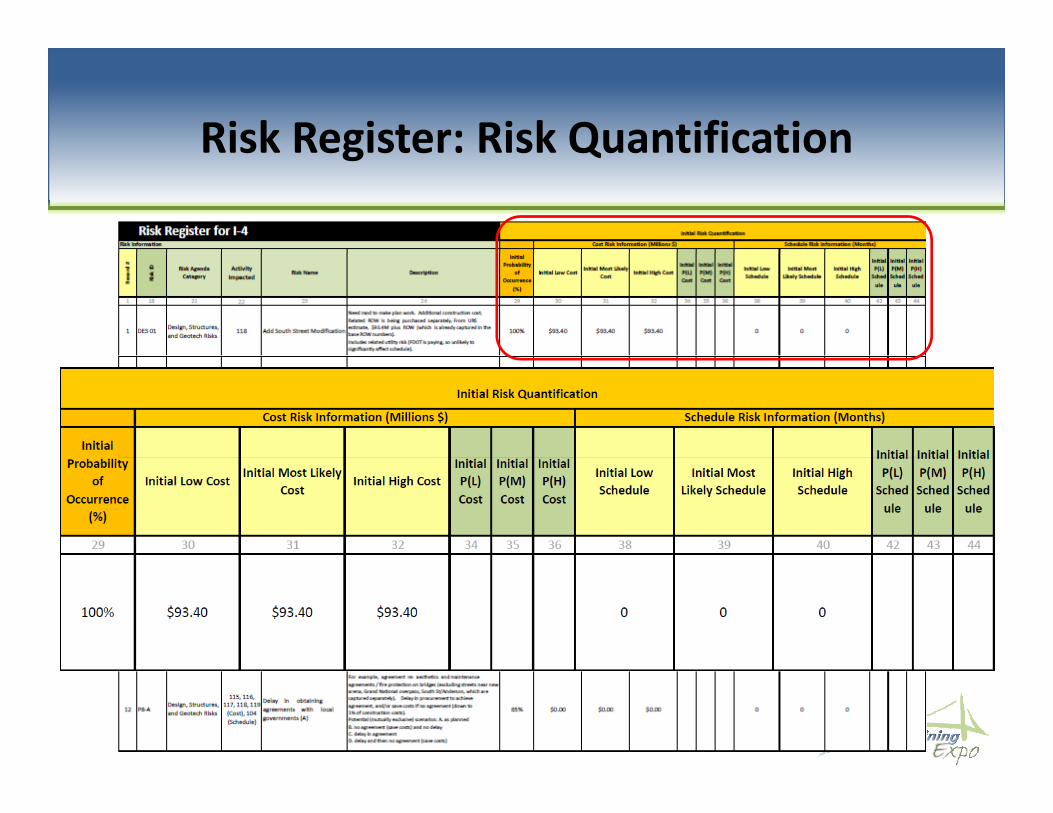
Risk Register: Risk QuantificationRisk Register: Risk Quantification

Modeling and PresentationModeling and Presentation
• Within or following the workshop preliminaryWithin or following the workshop, preliminary results are generated
• Results are presented to the project team forResults are presented to the project team for feedback and review
• Results are finalized and include risk based cost• Results are finalized and include risk based cost and schedule estimates, ranking of key drivers of risks and detailed information on each risk factorrisks and detailed information on each risk factor
• Results are used by the project team to develop a risk management planrisk management plan
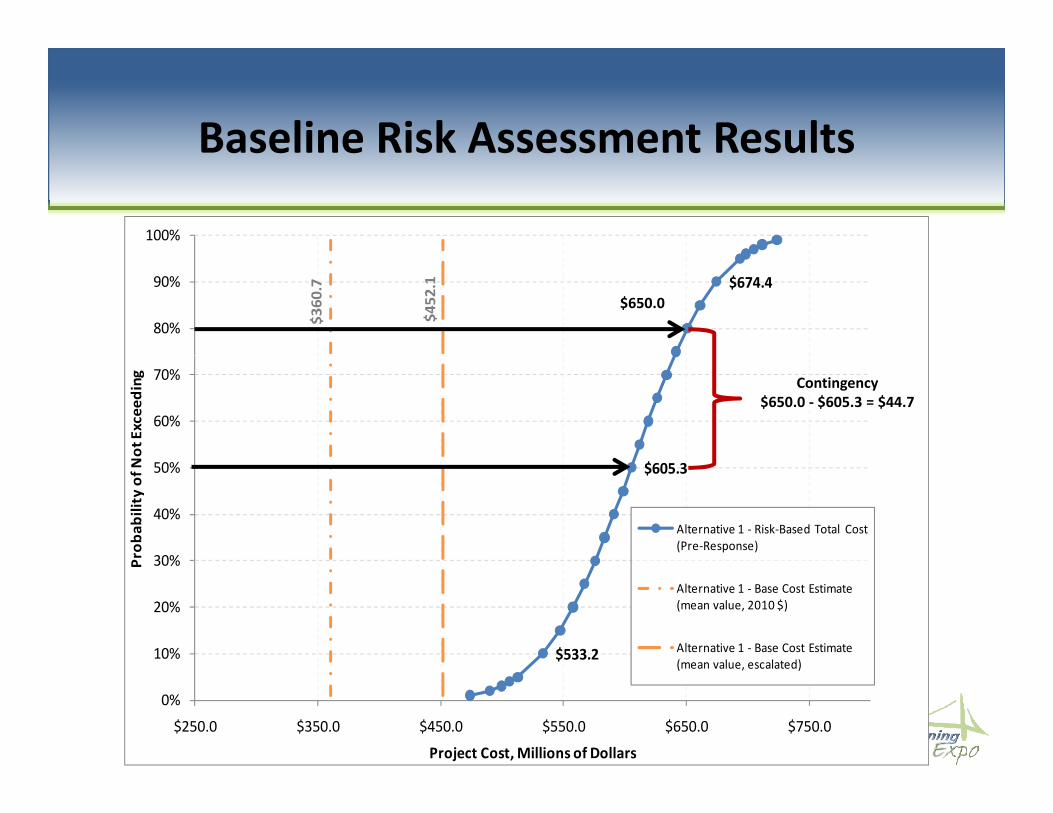
Baseline Risk Assessment ResultsBaseline Risk Assessment Results
100%
$674.4
$360.7
$452.1
80%
90%$650.0
60%
70%
ot Exceeding Contingency
$650.0 ‐ $605.3 = $44.7
$605.3
30%
40%
50%
Prob
ability of N
Alternative 1 ‐ Risk‐Based Total Cost (Pre‐Response)
$533.210%
20%
30%P
Alternative 1 ‐ Base Cost Estimate (mean value, 2010 $)
Alternative 1 ‐ Base Cost Estimate (mean value escalated)
0%
$250.0 $350.0 $450.0 $550.0 $650.0 $750.0
Project Cost, Millions of Dollars
(mean value, escalated)
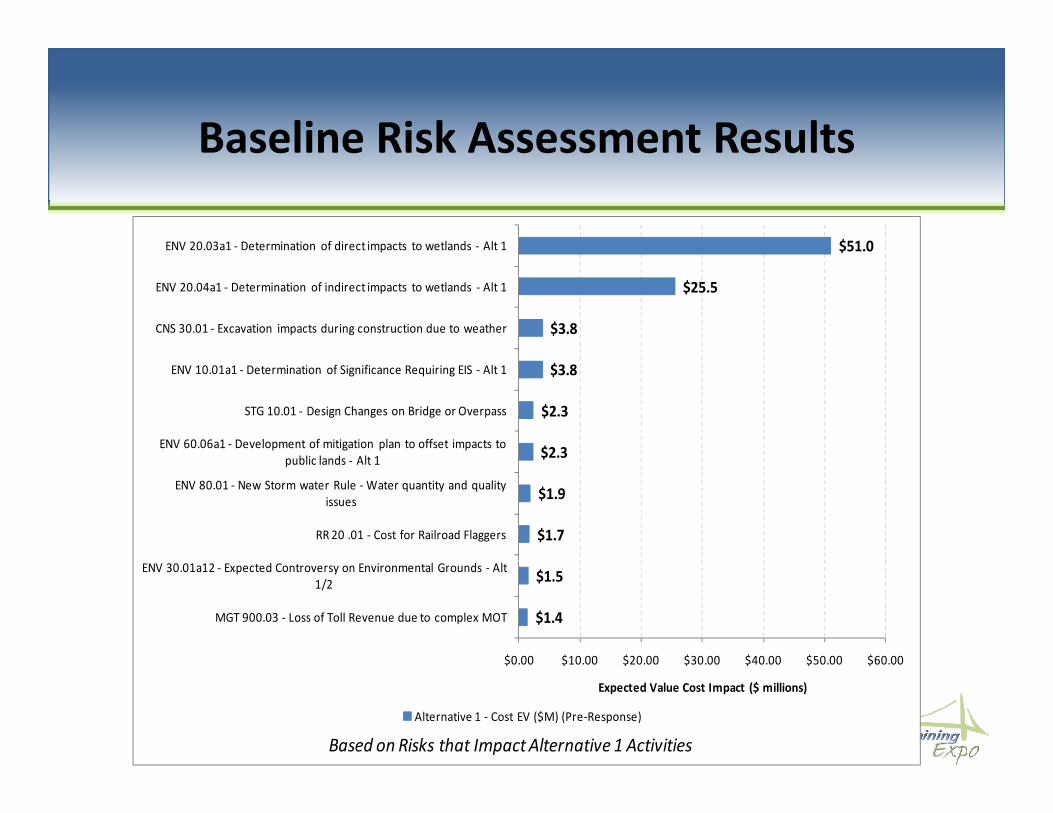
Baseline Risk Assessment ResultsBaseline Risk Assessment Results
$51.0ENV 20.03a1 ‐ Determination of direct impacts to wetlands ‐ Alt 1
$3.8
$25.5
$
CNS 30.01 ‐ Excavation impacts during construction due to weather
ENV 20.04a1 ‐ Determination of indirect impacts to wetlands ‐ Alt 1
$2.3
$2.3
$3.8
ENV 60.06a1 ‐ Development of mitigation plan to offset impacts to bli l d Alt 1
STG 10.01 ‐ Design Changes on Bridge or Overpass
ENV 10.01a1 ‐ Determination of Significance Requiring EIS ‐ Alt 1
$1.7
$1.9
$
RR 20 .01 ‐ Cost for Railroad Flaggers
ENV 80.01 ‐ New Storm water Rule ‐Water quantity and quality issues
public lands ‐ Alt 1
$1.4
$1.5
$0.00 $10.00 $20.00 $30.00 $40.00 $50.00 $60.00
MGT 900.03 ‐ Loss of Toll Revenue due to complex MOT
ENV 30.01a12 ‐ Expected Controversy on Environmental Grounds ‐ Alt 1/2
$0.00 $10.00 $20.00 $30.00 $40.00 $50.00 $60.00
Expected Value Cost Impact ($ millions)
Based on Risks that Impact Alternative 1 ActivitiesAlternative 1 ‐ Cost EV ($M) (Pre‐Response)
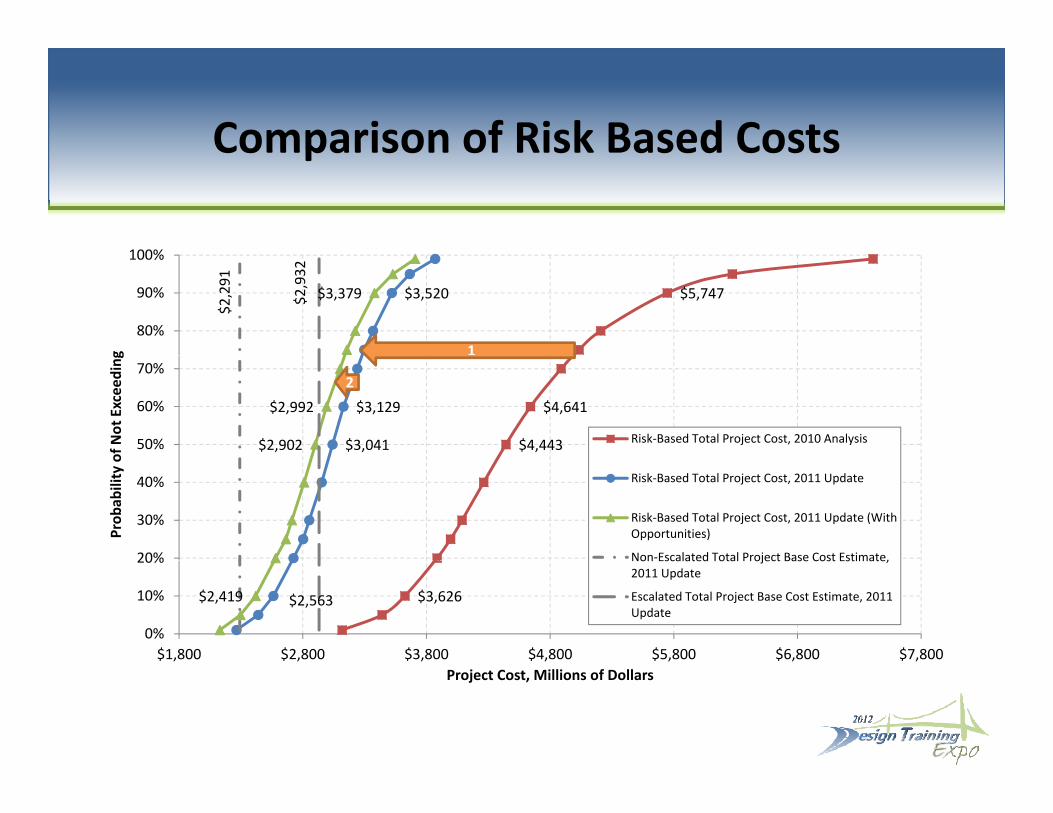
Comparison of Risk Based Costs
100%
Comparison of Risk Based Costs
$5,747$3,520$3,379
$2,291
$2,932
80%
90%
100%
g 1
$4,443
$4,641
$3,041
$3,129
$2,902
$2,992
50%
60%
70%
of Not Exceeding
Risk‐Based Total Project Cost, 2010 Analysis
2
20%
30%
40%
Prob
ability o
Risk‐Based Total Project Cost, 2011 Update
Risk‐Based Total Project Cost, 2011 Update (With Opportunities)
Non‐Escalated Total Project Base Cost Estimate,
$3,626$2,563$2,419
0%
10%
20%
$1,800 $2,800 $3,800 $4,800 $5,800 $6,800 $7,800
Non Escalated Total Project Base Cost Estimate, 2011 Update
Escalated Total Project Base Cost Estimate, 2011 Update
Project Cost, Millions of Dollars
Workshop DeliverablesWorkshop Deliverables
• Final report detailing the results of theFinal report detailing the results of the workshop
• Final Risk Register for Project Manager to use• Final Risk Register for Project Manager to use managing the identified risks
References
• Project Management Handbook Chapter 19
References
• Project Management Handbook Chapter 19http://www.dot.state.fl.us/projectmanagementoffice/PMHandbook/pmhandbookindex.shtm
• Washington State Department of Transportationhttp://www.wsdot.wa.gov/Projects/ProjectMgmt/RiskAssessment/
• FHWA Risk Assessmenthttp://international.fhwa.dot.gov/riskassess/index.cfmhttp://international.fhwa.dot.gov/riskassess/index.cfmhttp://www.fhwa.dot.gov/ipd/project_delivery/resources/risk_management/
Risk AnalysisProject Manager Roles
Rob QuigleyRob Quigley
ObjectivesObjectives
• Understand how the Risk Management Plan fits ginto the overall Project Management Plan
• Describe Project Manager’s Roles in Risk Analysis and Management for the life of project
Ri k R S i– Risk Response Strategies– Risk Tracking
• Integrate Risk Management into regular project delivery activities…consistently applied ondelivery activities…consistently applied on every project ‐ CPR
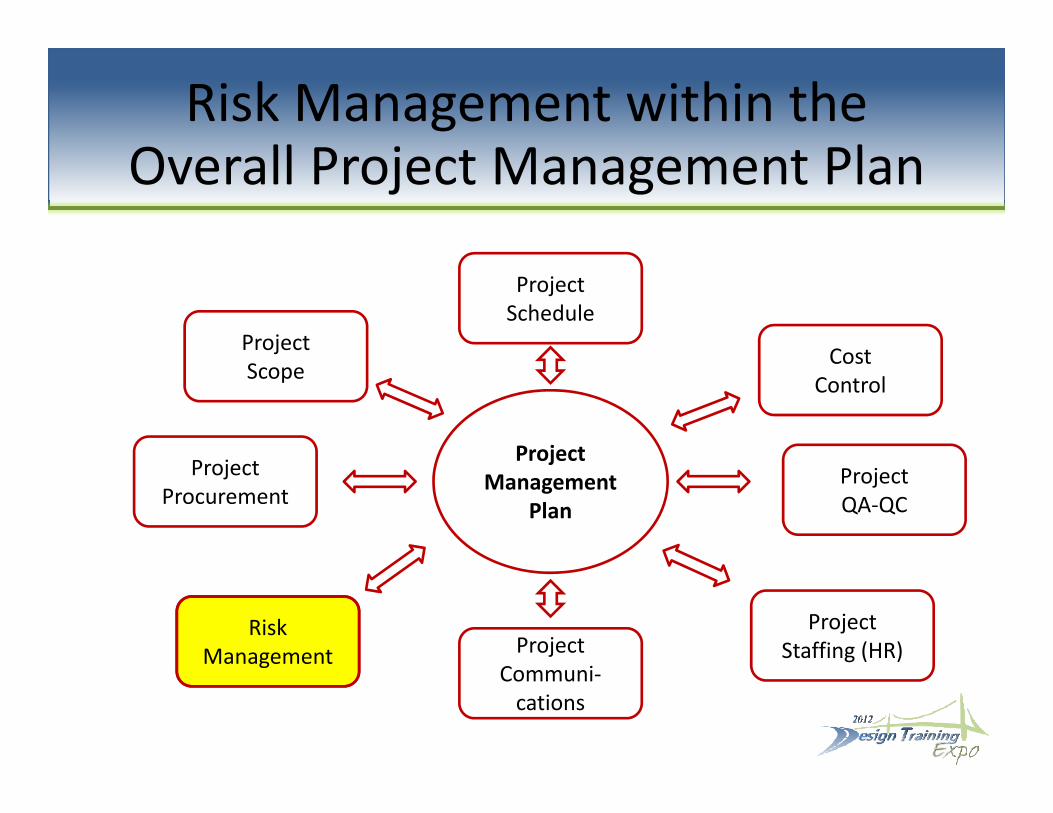
Risk Management within the O ll P j t M t PlOverall Project Management Plan
ProjectSchedule
CostProject
Project
CostControlScope
ProjectManagement
Plan
ProjectProcurement
ProjectQA‐QC
ProjectProject
Staffing (HR)Risk
ManagementCommuni‐cations
Management

Risk ManagementRisk Management
INPUTS TOOLS & TECHNIQUES OUTPUTS
1. Project Scope2. Cost Management
Plan3. Schedule
M t Pl
1. Planning Meetings2. Risk Workshop3. Risk Analysis
1. Risk Analysis Results2. Risk Management Plan
Management Plan4. Communications Plan5. Enterprise
Environmental Factors6. Organizational
Process Assets

Risk Management Plan – Detailed Fl DiFlow Diagram
Perform Risk Analysis
Pl
IdentifyRisks
PlanRisk
ResponsesProjectRisk
ManagementPlan
Allocate RisksMonitor &ControlRisksRisks
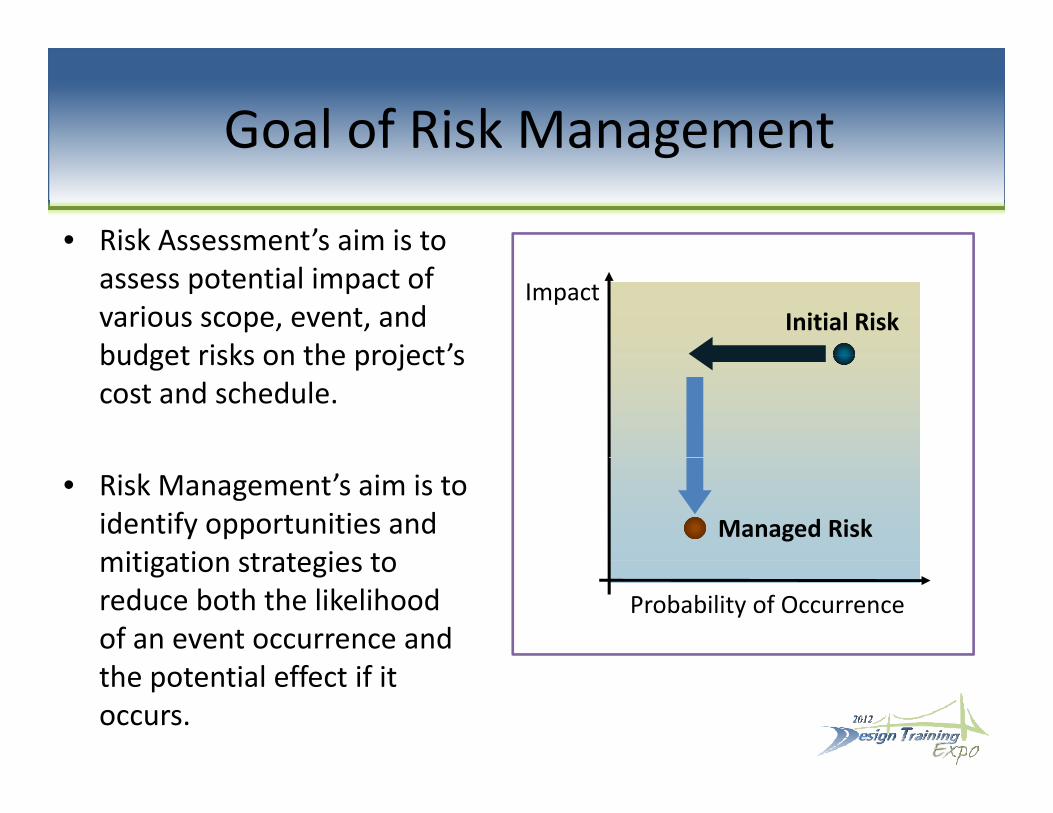
Goal of Risk Managementg
• Risk Assessment’s aim is to assess potential impact of various scope, event, and budget risks on the project’s
ImpactInitial Risk
budget risks on the project s cost and schedule.
• Risk Management’s aim is to identify opportunities and mitigation strategies to
Managed Riskmitigation strategies to reduce both the likelihood of an event occurrence and
Probability of Occurrence
the potential effect if it occurs.
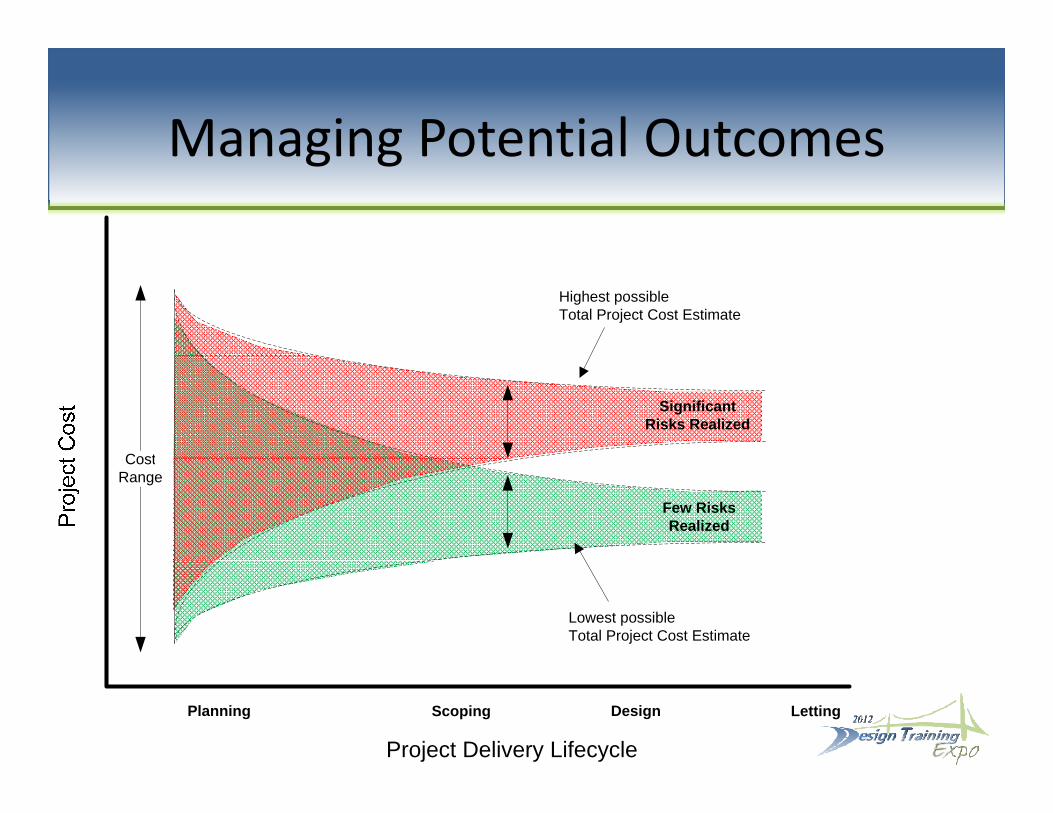
Managing Potential OutcomesManaging Potential Outcomes
Highest possibleTotal Project Cost Estimate
SignificantRisks Realized
Cost
Few RisksRealized
CostRange
Lowest possibleTotal Project Cost Estimate
Project Delivery Lifecycle
Planning Scoping Design Letting
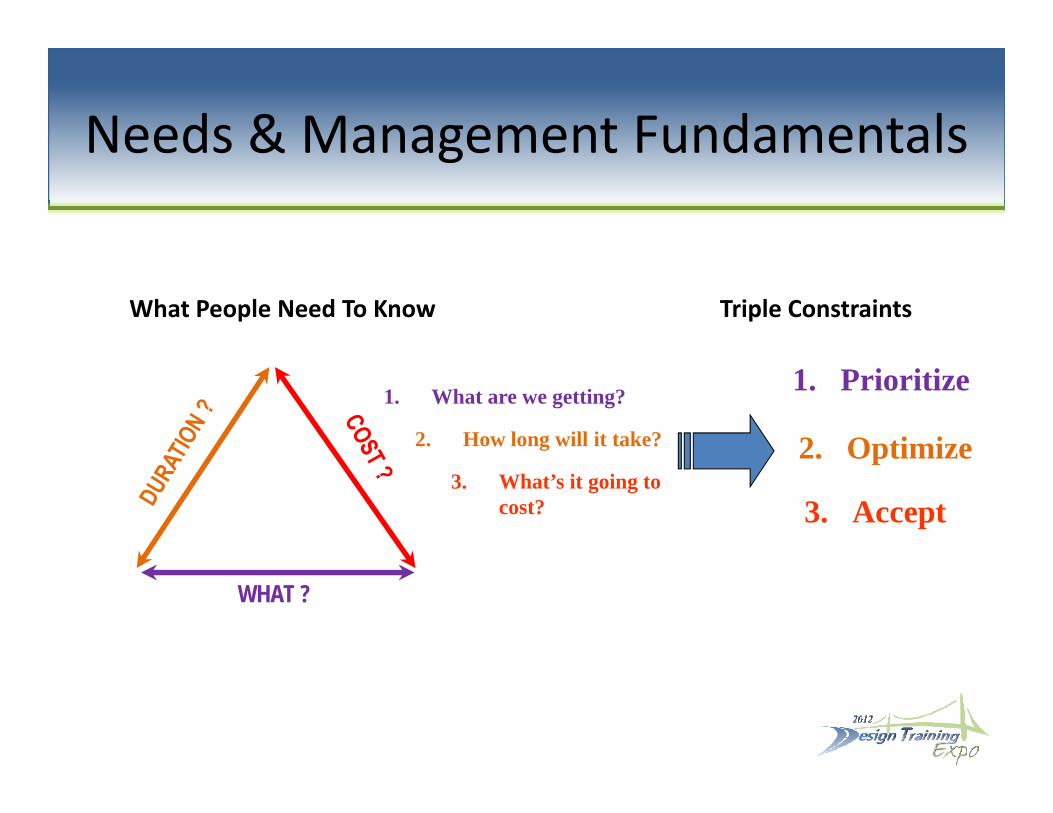
Needs & Management FundamentalsNeeds & Management Fundamentals
What People Need To Know Triple Constraints
1. What are we getting?
2. How long will it take?
1. Prioritize
2. Optimize3. What’s it going to
cost?
2. Optimize
3. Accept
WHAT ?
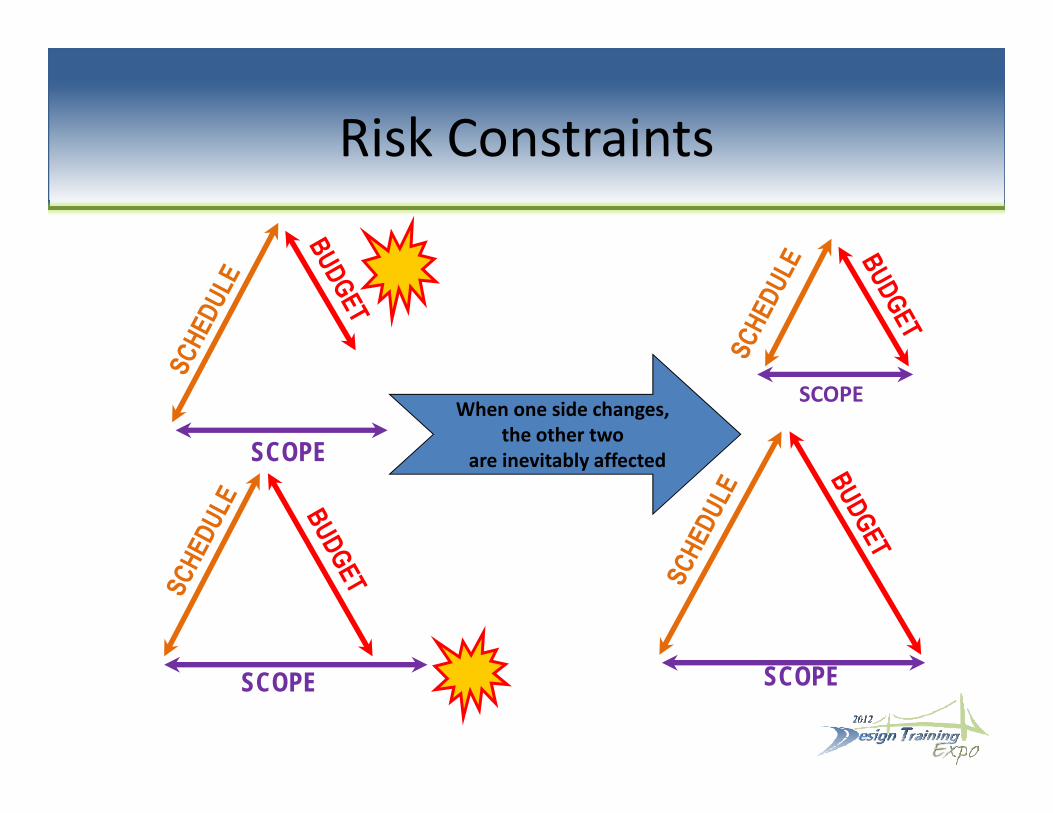
Risk ConstraintsRisk Constraints
SCOPEWhen one side changes,
the other two are inevitably affected
SCOPE
SCOPE are inevitably affected
SCOPE SCOPE
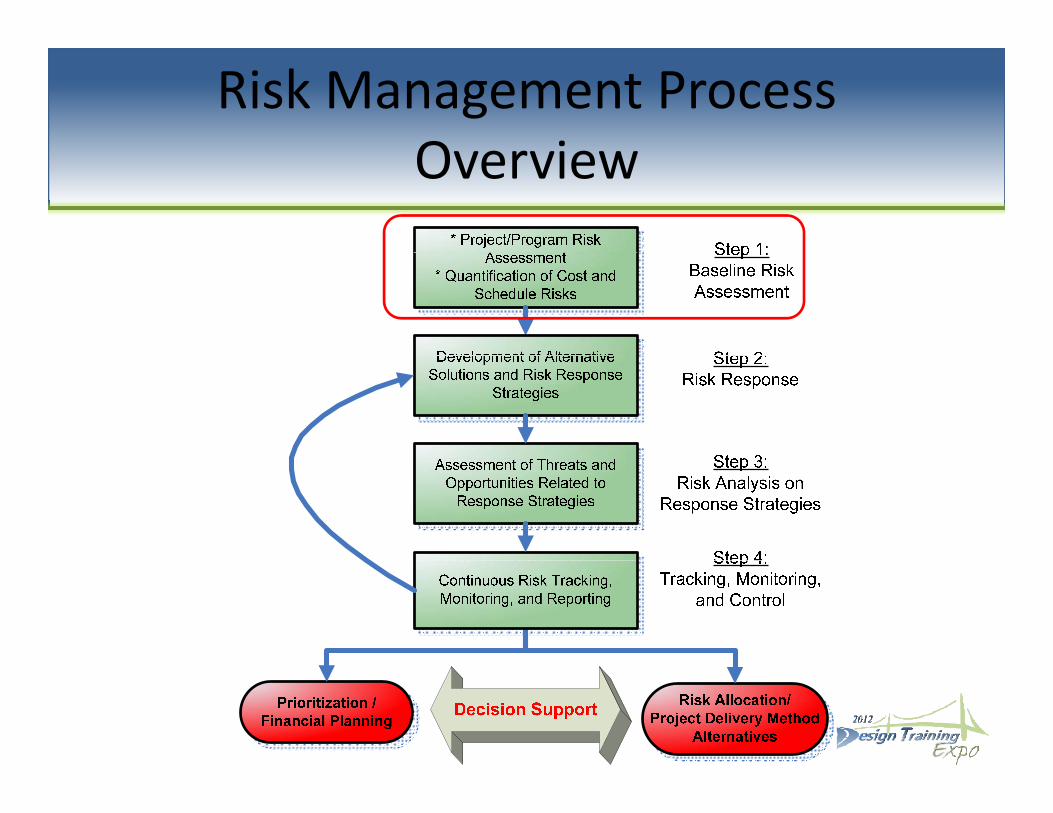
Risk Management Process O iOverview
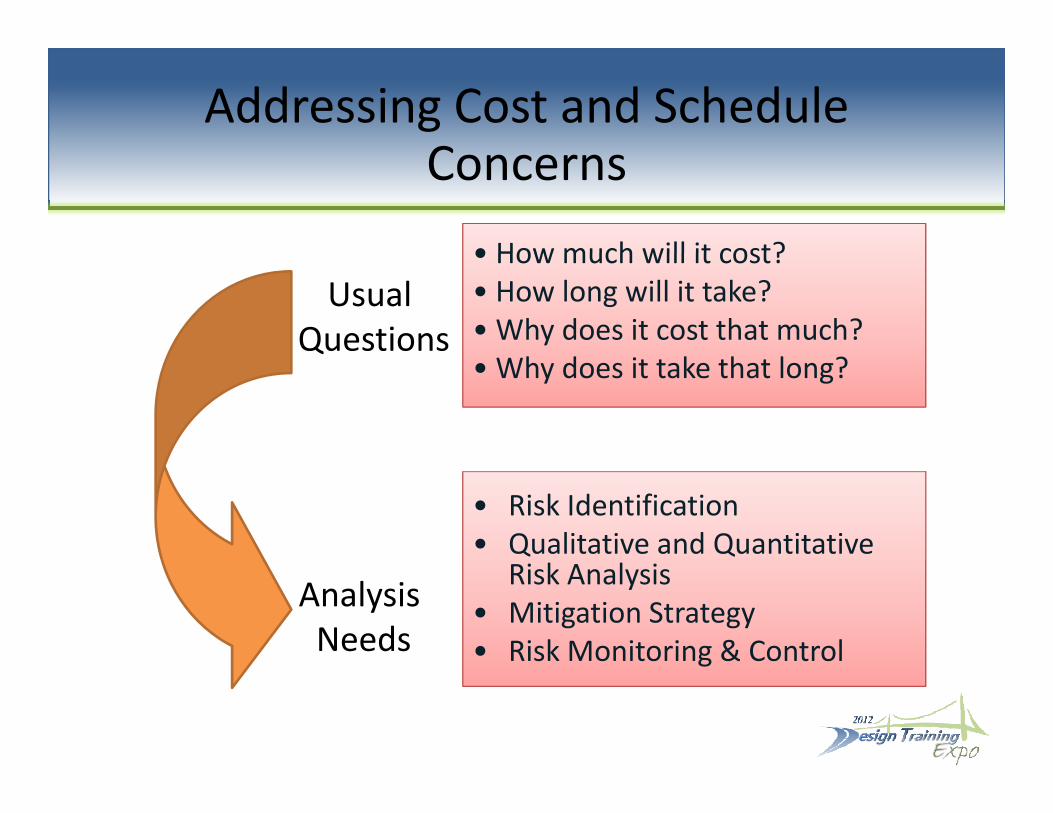
Addressing Cost and Schedule CConcerns
• How much will it cost?• How much will it cost?• How long will it take?• Why does it cost that much?
Usual Questions
• Why does it take that long?
• Risk Identification• Qualitative and Quantitative
Risk Analysis• Mitigation Strategy• Risk Monitoring & Control
Analysis Needs g
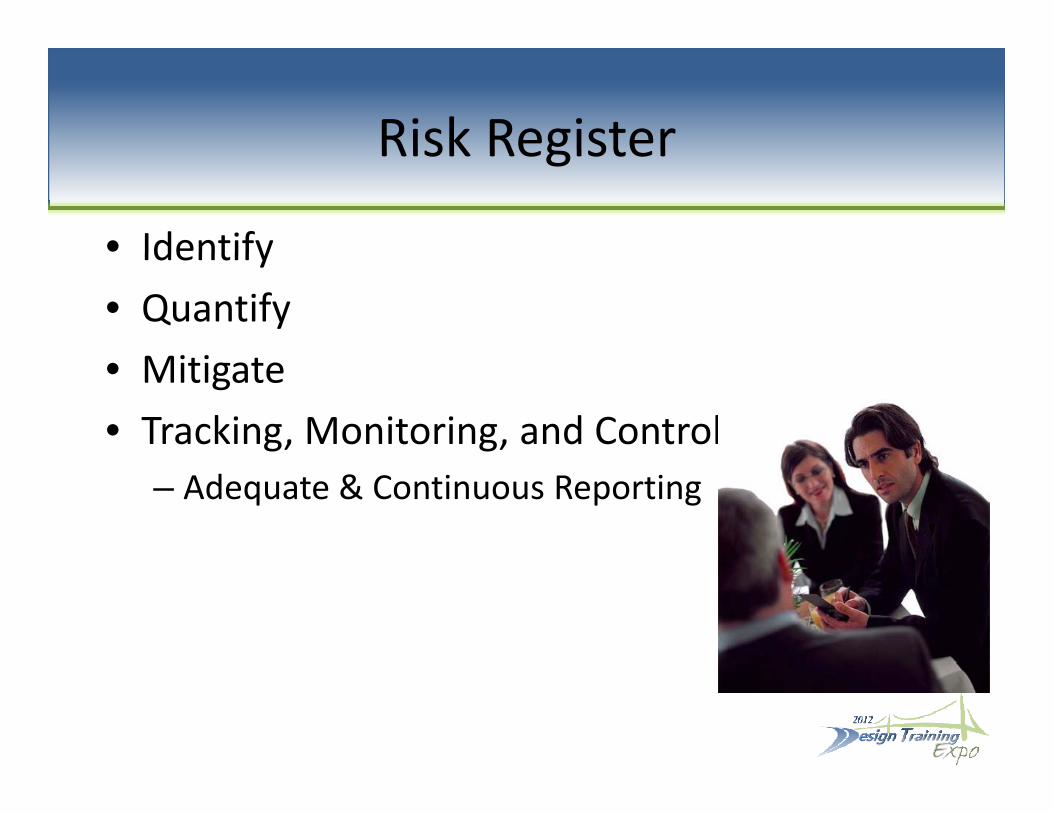
Risk RegisterRisk Register
• IdentifyIdentify• Quantify
i i• Mitigate• Tracking, Monitoring, and Control
– Adequate & Continuous Reporting
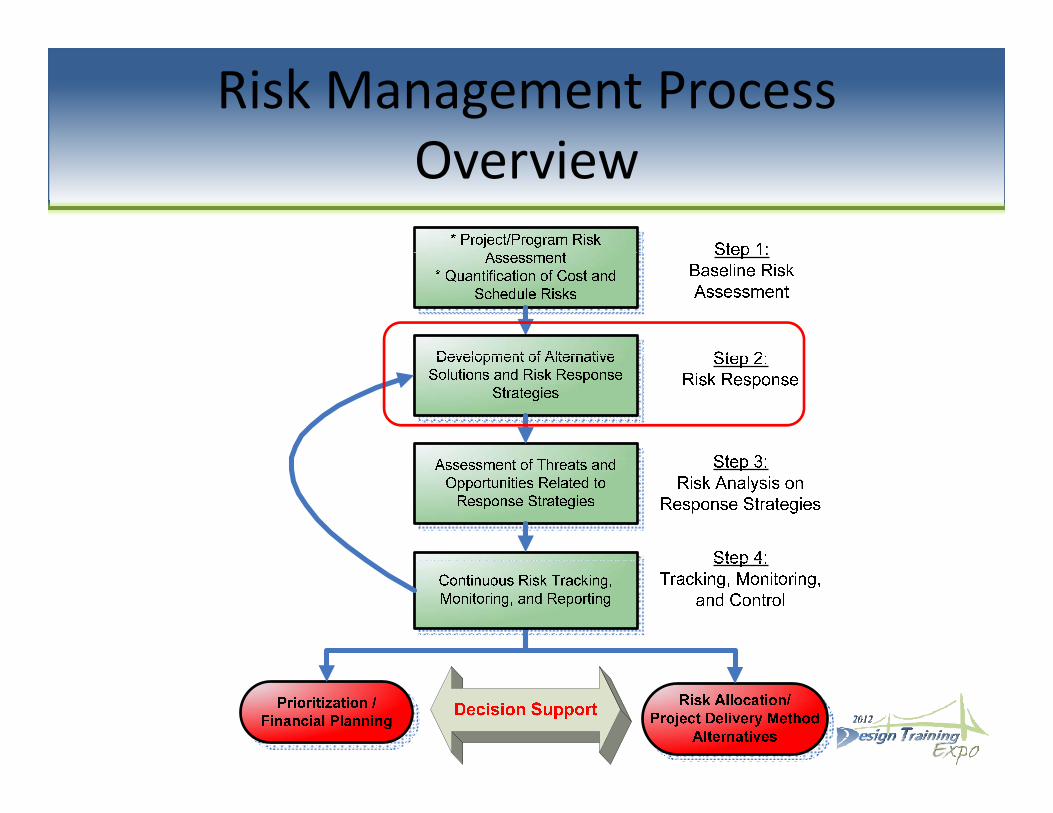
Risk Management Process O iOverview
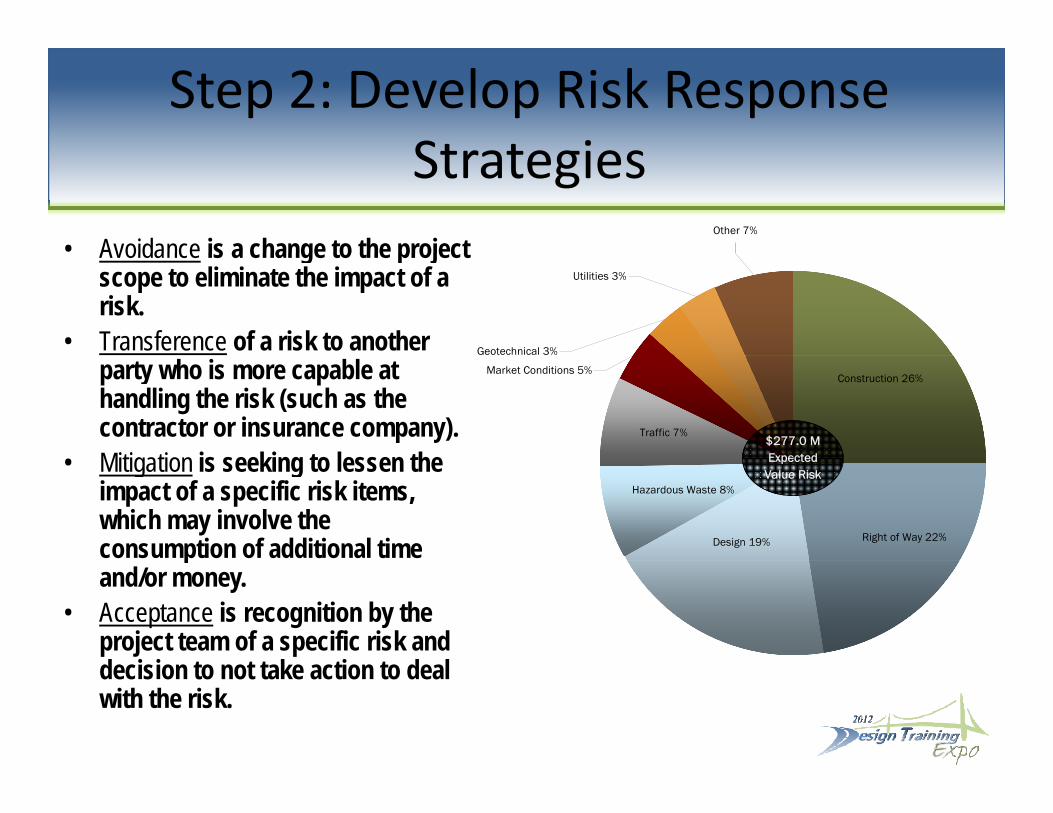
Step 2: Develop Risk Response Strategies
Other 7%
Strategies• Avoidance is a change to the project
Utilities 3%
Geotechnical 3%
Avoidance is a change to the project scope to eliminate the impact of a risk.
• Transference of a risk to another Construction 26%
Traffic 7%
Market Conditions 5%
$277.0 M Expected
party who is more capable at handling the risk (such as the contractor or insurance company). Mitigation is seeking to lessen the
Design 19% Right of Way 22%
Hazardous Waste 8%
Expected Value Risk• Mitigation is seeking to lessen the
impact of a specific risk items, which may involve the consumption of additional time pand/or money.
• Acceptance is recognition by the project team of a specific risk and d i i t t t k ti t d l decision to not take action to deal with the risk.
Risk Strategies ‐ AvoidRisk Strategies Avoid
• Some threats can be avoided entirely. This can be So e t eats ca be a o ded e t e y. s ca bedone by changing the way the project is performed or by de‐scoping the portion of the
h h k lproject that contains the risk element. • This will often have a cost. Completing the job d i i k f i t i lik l t tdone in a risk free environment is likely to cost more.
• Eliminating the risky scope might disappoint a• Eliminating the risky scope might disappoint a critical stakeholder or degrade the business reason for performing the project.p g p j
Risk Strategies ‐ TransferRisk Strategies Transfer
• This involves moving the responsibility for a risk g p yto another party usually by payment of a fee (outsourcing to a skilled expert or fixed price construction contracts) or a premiumconstruction contracts) or a premium (insurance).
• Transferring risk will almost always have an g yadded cost. Some risk, such as schedule risk, cannot be transferred. Even though the owner can contract (transfer) the schedulecan contract (transfer) the schedule responsibility to third parties, if they are late, the project is still late.
Risk Strategies ‐MitigateRisk Strategies Mitigate
• This involves taking positive actions to reduce s o es ta g pos t e act o s to educeeither the impact of a threat or the probability of it occurring.
• Mitigation usually requires positive action and has a cost. These actions should be reflected in
j t k k d t ll d likproject work packages and controlled like any other part of the project. They will affect your budget and schedule.budget and schedule.
• Mitigation can be a very effective strategy. It’s often better than a ‘do nothing’ approach.g pp
Risk Strategies ‐ AcceptRisk Strategies Accept
• After trying to avoid, transfer, or mitigate the y g , , gthreats to the project, residual risk may remain ‐threats that can’t be reduced further
In active acceptance the project cost is revised to take– In active acceptance, the project cost is revised to take the residual expected value of the remaining risk
– Passive acceptance involves acknowledging the risk d i f d th j t ith tand moving forward on the project without reserves,
which may make sense for risks with small expected values
f f– The third form of risk acceptance is called denial and professional risk management seeks to reduce the use of denial as a strategy
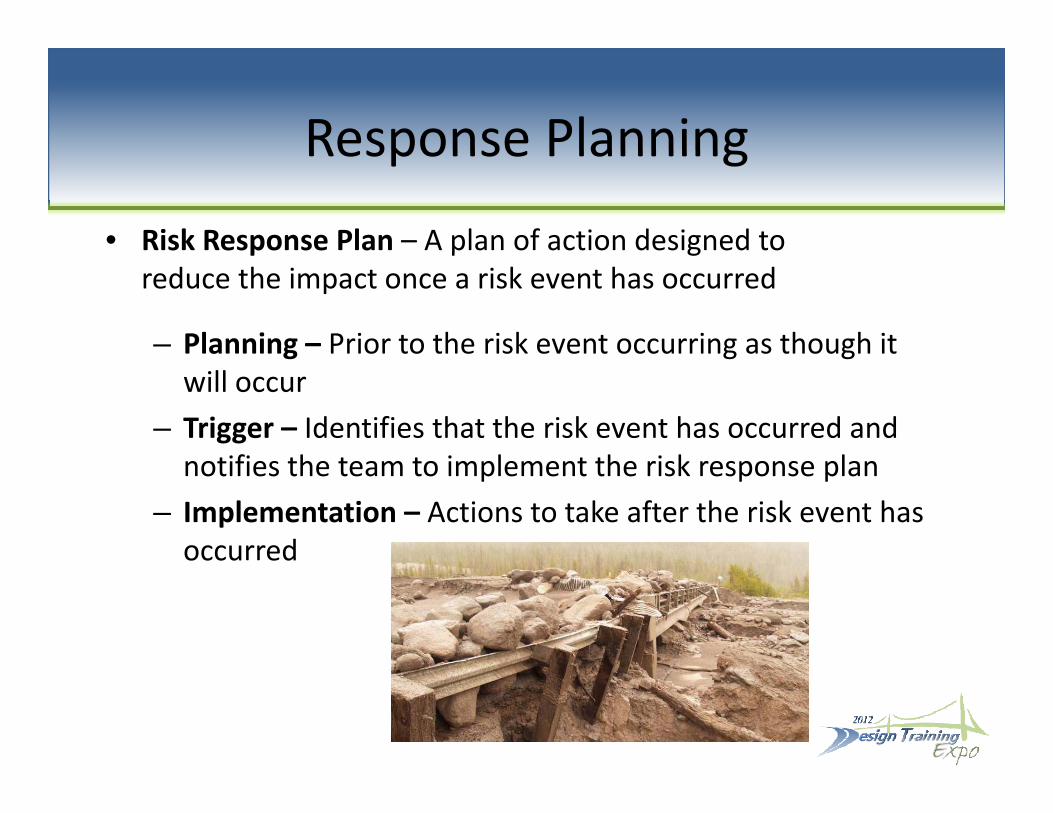
Response PlanningResponse Planning
• Risk Response Plan – A plan of action designed to p p greduce the impact once a risk event has occurred
– Planning – Prior to the risk event occurring as though it g g gwill occur
– Trigger – Identifies that the risk event has occurred and tifi th t t i l t th i k lnotifies the team to implement the risk response plan
– Implementation – Actions to take after the risk event has occurredoccu ed
Risk Management Process Overview

Step 3: Risk Analysis on Risk ResponseStep 3: Risk Analysis on Risk Response
$45 90$51.00ENV 20.03a1 ‐ Determination of direct impacts to wetlands ‐ Alt 1
$2.34
$3.80
$3.83
$22.95
$45.90
$2.34
$3.80
$3.83
$25.50
STG 10.01 ‐ Design Changes on Bridge or Overpass
ENV 10.01a1 ‐ Determination of Significance Requiring EIS ‐ Alt 1
CNS 30.01 ‐ Excavation impacts during construction due to weather
ENV 20.04a1 ‐ Determination of indirect impacts to wetlands ‐ Alt 1
p
100%
$0.90
$2.00
$1.88
$2.25
$1.50
$1.70
$1.88
$2.25
ENV 30.01a12 ‐ Expected Controversy on Environmental Grounds ‐ Alt 1/2
RR 20 .01 ‐ Cost for Railroad Flaggers
ENV 80.01 ‐ New Storm water Rule ‐Water quantity and quality issues
ENV 60.06a1 ‐ Development of mitigation plan to offset impacts to public lands ‐ Alt 1 $674$662
70%
80%
90%
eeding
$1.43$1.43
$0.00 $10.00 $20.00 $30.00 $40.00 $50.00 $60.00
MGT 900.03 ‐ Loss of Toll Revenue due to complex MOT
Expected Value Cost Impact ($ millions)
Alternative 1 ‐ Cost EV ($M) (Pre‐Response) Alternative 1 ‐ Cost EV ($M) Post‐Response)
$605$594
30%
40%
50%
60%Prob
ability of N
ot Exce
Alternative 1 ‐ Risk‐Based Total Cost
$533$522
0%
10%
20%
30%P (Pre‐Response)
Alternative 1 ‐ Risk‐Based Total Cost (Post‐Response)
$420.0 $470.0 $520.0 $570.0 $620.0 $670.0 $720.0 $770.0
Project Cost, Millions of Dollars
Risk Management Process O iOverview
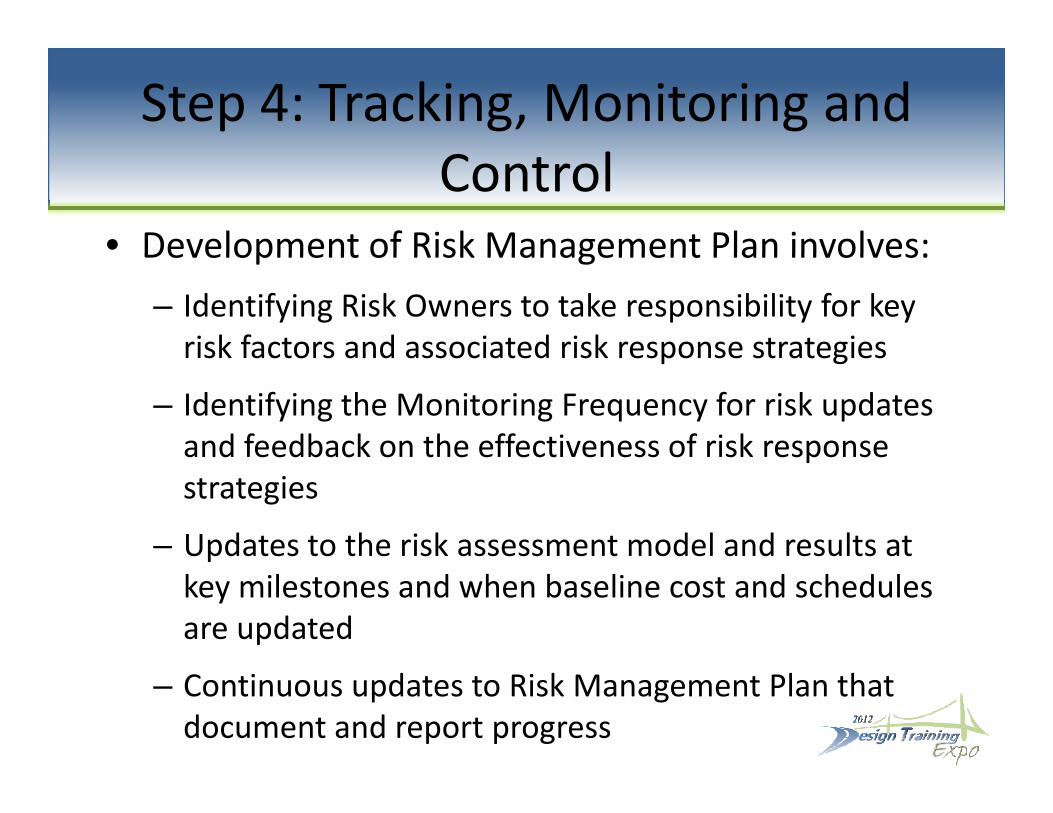
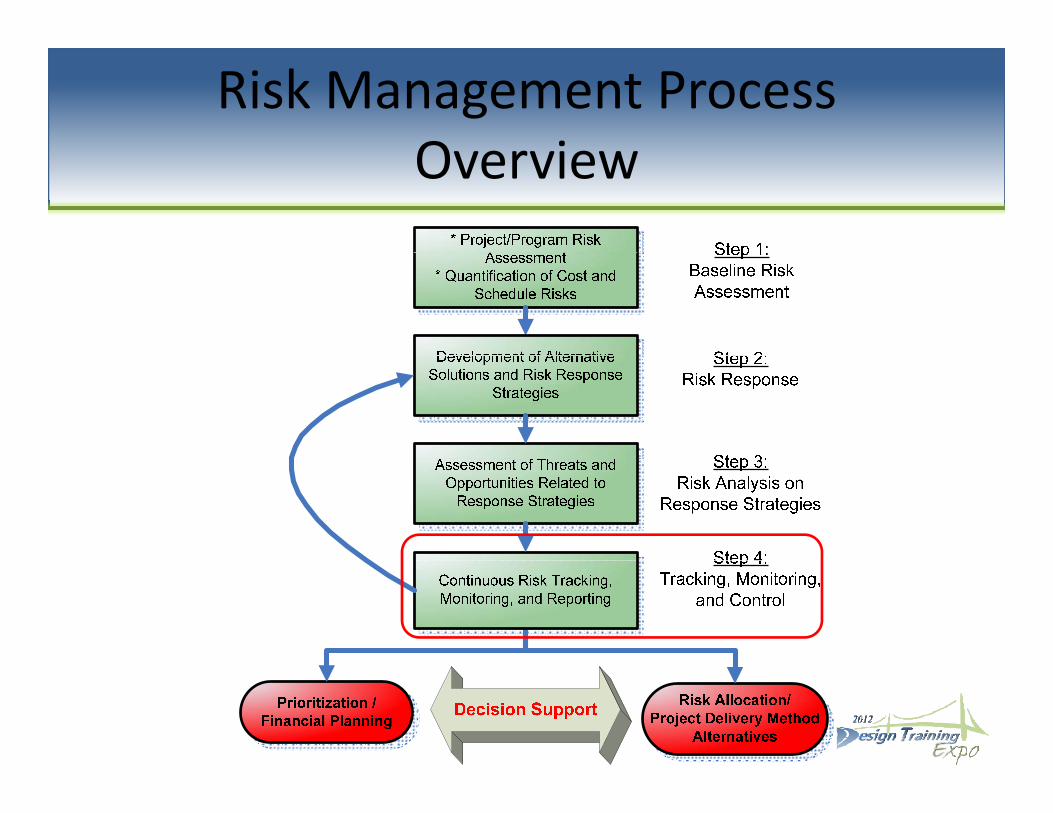
Step 4: Tracking, Monitoring and Control
• Development of Risk Management Plan involves:Development of Risk Management Plan involves:– Identifying Risk Owners to take responsibility for key risk factors and associated risk response strategiesrisk factors and associated risk response strategies
– Identifying the Monitoring Frequency for risk updates and feedback on the effectiveness of risk response pstrategies
– Updates to the risk assessment model and results at pkey milestones and when baseline cost and schedules are updated
– Continuous updates to Risk Management Plan that document and report progress
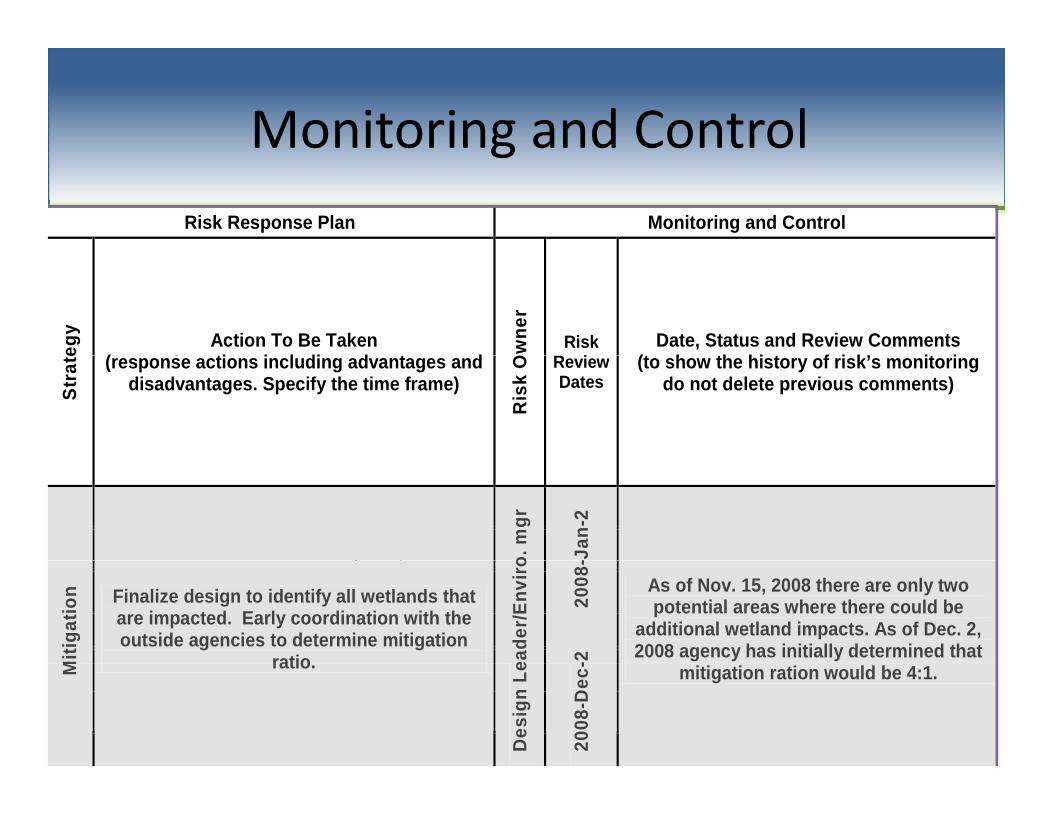
Monitoring and Controlg
• Identify the action to be taken Risk Response Plan Monitoring and Control
(Response Plan) and review frequency
• Identify the owner of the riskegy Action To Be Taken
( ti i l di d t d
wne
r
Risk R i
Date, Status and Review Comments (t h th hi t f i k’ it i
y– Who is responsible for
monitoring?– The Task Manager assigned to
Stra
te (response actions including advantages and disadvantages. Specify the time frame)
Ris
k O Review
Dates (to show the history of risk’s monitoring
do not delete previous comments)
The Task Manager, assigned to the risk, reports periodically to the Project Manager on the effectiveness of the plan, o.
mgr
-Jan
-2
p ,unintended consequences, and makes suggestions on mid‐course corrections to
Miti
gatio
n Finalize design to identify all wetlands that are impacted. Early coordination with the outside agencies to determine mitigation
ratio eade
r/Env
iro
-2
2
008-
As of Nov. 15, 2008 there are only two potential areas where there could be
additional wetland impacts. As of Dec. 2, 2008 agency has initially determined that
further mitigate the riskM ratio.
Des
ign
Le
2008
-Dec
- mitigation ration would be 4:1.

Risk Management Plan D t il d Fl DiDetailed Flow Diagram
Perform Risk Analysis
Pl
IdentifyRisks
PlanRisk
ResponsesProjectRisk
ManagementPlan
Allocate RisksMonitor &ControlRisksRisks
Risk Management
What’s the Ret rn?
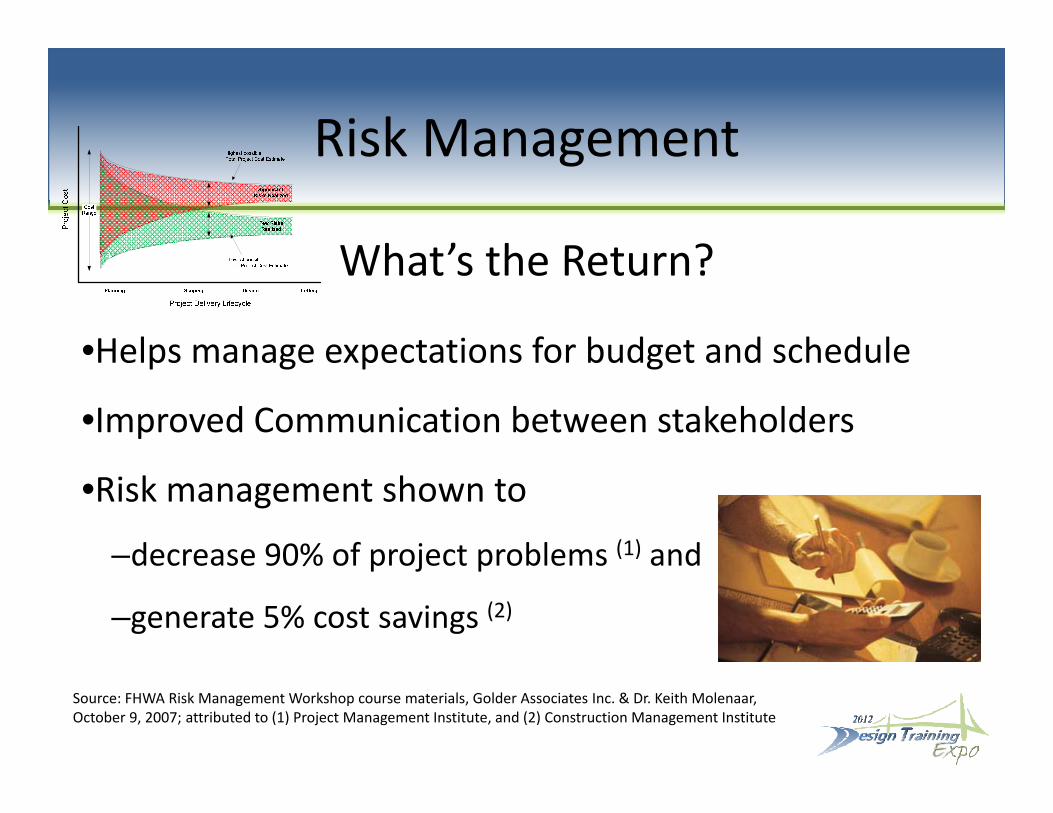
Risk Management
What’s the Return?
•Helps manage expectations for budget and scheduleHelps manage expectations for budget and schedule
•Improved Communication between stakeholders
•Risk management shown to
–decrease 90% of project problems (1) anddecrease 90% of project problems and
–generate 5% cost savings (2)
Source: FHWA Risk Management Workshop course materials, Golder Associates Inc. & Dr. Keith Molenaar, October 9, 2007; attributed to (1) Project Management Institute, and (2) Construction Management Institute
Summaryy
• Risk Analysis Process– Terms– Process– Big Picture
• Risk Analysis Workshop– Assessment– Workshops
• Project Manager Roles– Risk Management Plan– Risk response strategies– Assessment– Risk Tracking– Risk Tracking
Questions?Q
Risk Analysis Process OverviewGreg Davis, PEState Estimates [email protected] 414 4170850-414-4170
Risk Analysis WorkshopKurt Lieblong, PE, CVSState Project Review [email protected]
Project Manager ResponsibilitiesRob Quigley, PEState Project Management [email protected]