risk assessment study of fire following earthquake
TRANSCRIPT
NHESSD1, 1775–1798, 2013
Risk assessmentstudy of fire following
earthquake
J. Li et al.
Title Page
Abstract Introduction
Conclusions References
Tables Figures
J I
J I
Back Close
Full Screen / Esc
Printer-friendly Version
Interactive Discussion
Discussion
Paper
|D
iscussionP
aper|
Discussion
Paper
|D
iscussionP
aper|
Nat. Hazards Earth Syst. Sci. Discuss., 1, 1775–1798, 2013www.nat-hazards-earth-syst-sci-discuss.net/1/1775/2013/doi:10.5194/nhessd-1-1775-2013© Author(s) 2013. CC Attribution 3.0 License.
EGU Journal Logos (RGB)
Advances in Geosciences
Open A
ccess
Natural Hazards and Earth System
Sciences
Open A
ccess
Annales Geophysicae
Open A
ccess
Nonlinear Processes in Geophysics
Open A
ccess
Atmospheric Chemistry
and Physics
Open A
ccess
Atmospheric Chemistry
and Physics
Open A
ccess
Discussions
Atmospheric Measurement
Techniques
Open A
ccess
Atmospheric Measurement
Techniques
Open A
ccess
Discussions
Biogeosciences
Open A
ccess
Open A
ccessBiogeosciences
Discussions
Climate of the Past
Open A
ccess
Open A
ccess
Climate of the Past
Discussions
Earth System Dynamics
Open A
ccess
Open A
ccess
Earth System Dynamics
Discussions
GeoscientificInstrumentation
Methods andData Systems
Open A
ccess
GeoscientificInstrumentation
Methods andData Systems
Open A
ccess
Discussions
GeoscientificModel Development
Open A
ccess
Open A
ccess
GeoscientificModel Development
Discussions
Hydrology and Earth System
Sciences
Open A
ccess
Hydrology and Earth System
Sciences
Open A
ccess
Discussions
Ocean Science
Open A
ccess
Open A
ccess
Ocean ScienceDiscussions
Solid Earth
Open A
ccess
Open A
ccess
Solid EarthDiscussions
The Cryosphere
Open A
ccess
Open A
ccess
The CryosphereDiscussions
Natural Hazards and Earth System
Sciences
Open A
ccess
Discussions
This discussion paper is/has been under review for the journal Natural Hazards and EarthSystem Sciences (NHESS). Please refer to the corresponding final paper in NHESS if available.
Risk assessment study of fire followingearthquake: a case study ofpetrochemical enterprises in ChinaJ. Li1,2, Y. Wang1,2, H. Chen1,2, and L. Lin1,2
1Key Laboratory of Environmental Change and Natural Disaster of MOE, Beijing NormalUniversity, No.19, XinJieKouWai St., HaiDian District, 100875, Beijing, P. R. China2Academy of Disaster Reduction and Emergency Management, Beijing Normal University,No.19, XinJieKouWai St., HaiDian District, 100875, Beijing, P. R. China
Received: 13 January 2013 – Accepted: 19 March 2013 – Published: 29 April 2013
Correspondence to: Y. Wang ([email protected])
Published by Copernicus Publications on behalf of the European Geosciences Union.
1775

NHESSD1, 1775–1798, 2013
Risk assessmentstudy of fire following
earthquake
J. Li et al.
Title Page
Abstract Introduction
Conclusions References
Tables Figures
J I
J I
Back Close
Full Screen / Esc
Printer-friendly Version
Interactive Discussion
Discussion
Paper
|D
iscussionP
aper|
Discussion
Paper
|D
iscussionP
aper|
Abstract
After an earthquake, the fire risk of petrochemistry enterprises is higher than that ofother enterprises as it involves production processes with inflammable and explosivecharacteristics. Using Chinese petrochemical enterprises as the research object, thispaper uses a literature review and case summaries to study, amongst others, the clas-5
sification of petrochemical enterprises, the proportion of daily fires, and fire loss ratio.This paper builds a fire following earthquake risk assessment model of petrochemicalenterprises based on a previous earthquake fire hazard model, and the earthquakeloss prediction assessment method, calculates the expected loss of the fire followingearthquake in various counties and draws a risk map. Moreover, this research identifies10
high-risk areas, concentrating on the Beijing-Tianjin-Tangshan region, and Shandong,Jiangsu, and Zhejiang provinces. Differences in enterprise type produce different levelsand distribution of petrochemical enterprises earthquake fire risk. Furthermore, areasat high risk of post-earthquake fires and with low levels of seismic fortification requireextra attention to ensure appropriate mechanisms are in place.15
1 Introduction
Petrochemical enterprises produce products under complex process conditions andcan be described as having the following characteristics: airtight environments, high-temperatures, high-pressure, deep cooling and pipelining in most cases, and involveraw materials and products that are inflammable, explosive, toxic, and corrosive. Fur-20
ther, such processes are prone to catch fire in daily production because of a numberof factors including operation errors and equipment failure.
After a destructive earthquake strikes, fires are likely to occur in petrochemical en-terprises with the leakage of inflammable and explosive substances, ignited by frictionsparks or open flames as a result of earthquake damage to workshops, equipment,25
containers, and other structures. For example, during the Tangshan Earthquake in
1776

NHESSD1, 1775–1798, 2013
Risk assessmentstudy of fire following
earthquake
J. Li et al.
Title Page
Abstract Introduction
Conclusions References
Tables Figures
J I
J I
Back Close
Full Screen / Esc
Printer-friendly Version
Interactive Discussion
Discussion
Paper
|D
iscussionP
aper|
Discussion
Paper
|D
iscussionP
aper|
China in 1976, a fire occurred in a synthetic fat factory in Tianjin, which totally de-stroyed the workshop after the sudden explosion of the synthetic tower resulting froma rise in temperature and pressure due to a power failure after workshop frames col-lapsed. A fire also broke out in a chemical plant in Hangu because of the spontaneouscombustion of silicon dichloride following pipeline equipment damage with the collapse5
of buildings. Furthermore, a fire started in a factory in Hangu when a violent shakethrew glycerin into a strong oxidant potassium permanganate and caused a chemi-cal reaction (Business Community, 2008). During Japan’s 2011 earthquake, numerousfires started in refineries in cities such as Sendai and Chiba, leading to a significantinterruption of factory production (Sohu News, 2011a; Sohu News, 2011b). Therefore,10
post-earthquake fires (secondary fires) constitute the greatest threat and harm to petro-chemical enterprises (Hui and Jiang, 2002). In 1976, fires in petrochemical enterprisesaccounted for 24 % of the total post-earthquake fires in Tianjin as a result of the Tang-shan Earthquake in China (Business Community, 2008).
The total output value of the Chinese petrochemical industry makes up more than15
12 % of the gross industrial output value (China Petroleum & Chemical Industry As-sociation, 2009). However, in terms of site selection, petrochemical enterprises’ mainconcern is given to raw materials, product transport, and industrial basis, with little or noconsideration for earthquakes. For example, a great many petrochemical enterprises,such as the Jianfeng enterprise, Youxin chemical plant, Hongda chemical plant, and20
Huafeng phosphorus chemical plant, are located along the Longmenshan Mountainfault belt where the Wenchuan Earthquake occurred in 2008. Furthermore, the layoutof most petrochemical enterprises significantly increases post-earthquake fire hazards.
From the perspective of the post-earthquake fire causing mechanism of petrochem-ical enterprises, by summarizing the regular pattern of general fire occurrence in25
different types of enterprises, this paper can build a petrochemical enterprise post-earthquake fire risk assessment model based on the post-earthquake fire risk modelput forward by Zhao Zhendong (Yu et al., 2003; Zhao et al., 2003) and earthquakeloss prediction assessment methods. A macro analysis will follow, with comments on
1777

NHESSD1, 1775–1798, 2013
Risk assessmentstudy of fire following
earthquake
J. Li et al.
Title Page
Abstract Introduction
Conclusions References
Tables Figures
J I
J I
Back Close
Full Screen / Esc
Printer-friendly Version
Interactive Discussion
Discussion
Paper
|D
iscussionP
aper|
Discussion
Paper
|D
iscussionP
aper|
the post-earthquake fire risk of Chinese petrochemical enterprises, and thus this pa-per can provide a scientific basis for regional economic development and industrialplanning.
2 Previous research
Currently, the most common analysis model to determine the rate of post-earthquake5
fires is the empirical statistics regression model. Its aim is to find the expression be-tween the post-earthquake fire rate and post-earthquake fire factors using a regressionanalysis method based on statistics regarding historical earthquake damage.
Kawasumi (1961) and Mizuno (1978) performed the statistical regression analysiswith historical earthquake secondary fire data and obtained the relation between the10
outbreaks of fires and the damage of buildings, named Kawasumi’s model and Mizuno’smodel respectively. Kobayashi (1984) studied that the fire outbreak rate is in relationwith the seismic intensity. And he found in the case of earthquakes of less or equalto intensity 6, the fire outbreak rate of total fires may not exceed 2.0×10⁻⁴, and ofchemical fires may not exceed 0.5×10⁻⁴; But in the case of earthquakes of more or15
equal to intensity 7, the fire outbreak rate is difficult to be estimated due to lack ofdata. Scawthorn put forward a regression model (Scawthorn, 1986; Scawthorn, 1996;Scawthorn et al., 1981), looking for a relationship between post-earthquake fire ratesand earthquake intensity on the basis of collecting and analyzing data on 20th cen-tury post-earthquake fires in the United States. His results have been applied to the20
software package HAZUS developed by the Federal Emergency Management Agency(FEMA) to assess loss under the affect of multiple disasters, and to predict the numberof post-earthquake secondary fires in the United States.
In studying the fire after the Northridge earthquake in California, Trifunac andTodorovska (1997, 1998) found that fire ignition rate models correlated with site in-25
tensity, peak horizontal ground velocity, the number of red-tagged buildings, andbreaks in water pipes. Based on the Monte Carlo simulation and physics-based
1778

NHESSD1, 1775–1798, 2013
Risk assessmentstudy of fire following
earthquake
J. Li et al.
Title Page
Abstract Introduction
Conclusions References
Tables Figures
J I
J I
Back Close
Full Screen / Esc
Printer-friendly Version
Interactive Discussion
Discussion
Paper
|D
iscussionP
aper|
Discussion
Paper
|D
iscussionP
aper|
fire-spread/evacuation simulation, Nishino at el. (2012) considered a number of fac-tors (number and location of fire outbreaks, firefighting at the initial stages, weather,earthquake-related structural damage to buildings, initial evacuee locations, and theobstruction of roads) to simulate the burn-down risk and fire-fatality risk after an earth-quake. Zhao (2010) built an integrated software system for the dynamic simulation5
of fires following an earthquake based on GIS; fire ignition, fire-spread, and fire-suppression were also considered in this system.
Tanaka (2012) studied the characteristics and problems of fires following the GreatEast Japan earthquake in March 2011, and he classified post-earthquake fires intothree types: conventional types of fires unrelated to tsunami waves, conflagrations in10
coastal areas inundated by the tsunami, and the peculiarities of tsunami-related fires.Fire characteristics are different from fire types. Fire ignition rates should be docu-mented to determine the relative occurrence of gas, electrical, chemical and other typesof fires (Trifunac and Todorovska, 1997).
The DOW Fire & Explosion Index method and the ICI MOND method (Cai et al.,15
2009; Wang and Xu, 2009) have been adopted in petrochemical enterprise fire safetyassessment studies for the quantitative study of the degree and loss of chemical firerisk on the basis of previous accident statistics, material potential energy, and the situ-ation of current safety measures.
However, in view of there being relatively few studies on post-earthquake fires in20
petrochemical enterprises, Xu et al. (2002) presented methods to calculate the petro-chemical enterprise post-earthquake fire probability via research on the relationshipsamong the probability of petrochemical enterprise post-earthquake secondary fires,level of combustible hazard classification, and the level of equipment damage fromearthquakes. Chen (2010) researched the risk of industrial enterprise secondary acci-25
dents in a natural disaster, based on energy transfer and fire dynamics energy theories,combined with the Hazard and Operability Analysis (HAZOP) method.
1779

NHESSD1, 1775–1798, 2013
Risk assessmentstudy of fire following
earthquake
J. Li et al.
Title Page
Abstract Introduction
Conclusions References
Tables Figures
J I
J I
Back Close
Full Screen / Esc
Printer-friendly Version
Interactive Discussion
Discussion
Paper
|D
iscussionP
aper|
Discussion
Paper
|D
iscussionP
aper|
3 Mechanism and assessment models of petrochemical enterprise firefollowing earthquake
Figure 1 shows the post-earthquake fire causing mechanism of petrochemical enter-prises. The earthquake first damages workshops and equipment (this loss is calledearthquake direct loss) in petrochemical enterprises, then triggers the leakage of5
flammable, explosive, toxic, and corrosive objects, which result in fire once they meetwith an open flame or a spark caused by friction of some kind. Furthermore, the earth-quake can cause damage to fire-fighting facilities, pipelines, and roads, which reducesfire-fighting capacity. Thus, it accelerates the spread of fire and fire loss is greater (lossis referred to as fire loss). The sum of the above two losses is the total loss of the fire10
following earthquake.According to the above analysis, the calculation formula of post-earthquake fire total
loss EFL is shown as expression (1), where EL denotes the direct loss of the earth-quake and FL the fire loss.
EFL = EL+FL. (1)15
It is necessary to classify the earthquake fire loss according to the petrochemical enter-prise types that are susceptible to fire. The calculation formula of the direct earthquakeloss EL in a certain petrochemical enterprise is shown in expression (2).
(ELRi)k =
5∑j=1
P(Dj |Ri
)· lDj
·WK . (2)
In expression (2), Dj refers to the damage level and P (Dj |R i ) to the probability of20
the damage level Dj with the seismic ground motion parameter Ri . Furthermore, lDj
denotes the earthquake loss ratio of the damage level Dj , k is the petrochemical en-terprise type, and Wk the total fixed assets of k-type petrochemical enterprises.
1780

NHESSD1, 1775–1798, 2013
Risk assessmentstudy of fire following
earthquake
J. Li et al.
Title Page
Abstract Introduction
Conclusions References
Tables Figures
J I
J I
Back Close
Full Screen / Esc
Printer-friendly Version
Interactive Discussion
Discussion
Paper
|D
iscussionP
aper|
Discussion
Paper
|D
iscussionP
aper|
The calculation formula of a petrochemical enterprise’s fire loss FL is shown in ex-pression (3).
(FLRi)k =
1C
·5∑
j=1
P(Dj |Ri
)· P (F )k · lf ·W
′
k . (3)
In expression (3), 1/C stands for safety measure failure coefficients, P (F )k for the post-earthquake fire occurrence probability of k-type petrochemical enterprises, lf for the5
fire loss ratio, and W ′k for the value of k-type petrochemical enterprises before the fire
occurs.Where a fire occurs after an earthquake, Wk ’ stands for the surplus value after the
earthquake damage, as shown in expression (4).
W′
k =Wk −EL (4)10
In terms of the DOW Fire & Explosion Index assessment method, because processcontrol, physical isolation, and fire prevention measures can reduce fire loss, securitycompensation coefficient C is usually adopted to revise the index to ensure that thefinal loss assessment value better conforms to reality. An earthquake often reduces thelocal fire-fighting capacity, thus aggravating fire loss. In this case, the safety measure15
failure coefficient 1/C can be used to revise fire loss when fire-fighting capacity hasbeen reduced because of the earthquake.
Consulting the best safety measure compensation coefficient in the DOW Fire &Explosion Index assessment method, C is established: C = 0.489 and 1/C = 2.05.
1781

NHESSD1, 1775–1798, 2013
Risk assessmentstudy of fire following
earthquake
J. Li et al.
Title Page
Abstract Introduction
Conclusions References
Tables Figures
J I
J I
Back Close
Full Screen / Esc
Printer-friendly Version
Interactive Discussion
Discussion
Paper
|D
iscussionP
aper|
Discussion
Paper
|D
iscussionP
aper|
4 Macro risk assessment of China petrochemical enterprise firefollowing earthquake
4.1 Earthquake hazard probability P (Dj|Ri) and loss ratio lDj
The 2000 seismic ground motion zonation map (Peng et al., 2004) of China has sevenlevels:<0.05 g, 0.05 g, 0.10 g, 0.15 g, 0.20 g, 0.30 g and ≥0.40 g, according to the seis-5
mic peak ground acceleration (PGA) in each region and the 10 % of probability of ex-ceedance in the class (medium hard) site over 50 yr.
Earthquake loss assessment in China classifies the damage levels of buildings intofive levels: collapse, serious damage, medium damage, slight damage, and basicallyintact. Further, the assessment also provides (based on historical earthquake damage10
and experimental data) the probability P (Dj |R i ) and loss ratio lDjcorresponding to dif-
ferent damage levels (Earthquake loss prediction research team of China EarthquakeAdministration, 1990; Institute of Engineering Mechanics, 2005).
As industrial factory buildings are the main assets of petrochemical enterprises, thispaper takes the factory building loss ratio as the earthquake loss ratio lDj
of petrochem-15
ical enterprises. In expression (2), the lDjis the loss ratio of petrochemical enterprises
suffering from different degrees of seismic damage, and its range refers to the industrialfactory building damage loss ratio in post-earthquake field works–part 4: assessment ofdirect loss (GB/T 18208.4-2005) (Institute of Engineering Mechanics, 2005), as shownin Table 1.20
4.2 Petrochemistry enterprise classification k and asset value Wk
A post-earthquake fire is subject to uncertainty due to numerous factors including theexistence of combustibles, flammability of combustibles, and earthquake damage lev-els. Production equipment, technological processes, raw materials, and semi-finishedand final products vary among petrochemical enterprises, which result in different fire25
probabilities.
1782

NHESSD1, 1775–1798, 2013
Risk assessmentstudy of fire following
earthquake
J. Li et al.
Title Page
Abstract Introduction
Conclusions References
Tables Figures
J I
J I
Back Close
Full Screen / Esc
Printer-friendly Version
Interactive Discussion
Discussion
Paper
|D
iscussionP
aper|
Discussion
Paper
|D
iscussionP
aper|
In accord with the Industrial Classification For National Economic Activities (GB/T4754-2011) (National Bureau of Statistics of China, 2011), this paper divides petro-chemical enterprises into four types: PE1, oil, natural gas drilling, petroleum process-ing, coking and nuclear fuel processing enterprises; PE2, chemical raw materials andchemical product manufacturing enterprises; PE3, chemical fiber manufacturing enter-5
prises; PE4, rubber and plastic product manufacturing enterprises.Considering the complexity of the value components of petrochemical enterprises
and the availability of data, the fixed asset value is taken as its total value Wk .The fixed asset data Wk for the four types of petrochemical enterprises was sourced
from China’s 2008 economic census data 9, with the province as the basic statisti-10
cal unit. In view of the lack of related county or city data regarding the fixed assets ofpetrochemical enterprise, this paper assigns province-level values for fixed assets to allcities and counties according to the industry output value ratio of every city or county tothe whole province. Therefore, the distribution of the fixed assets of petrochemical en-terprises for counties or cities is obtained in this paper. Figure 2 shows the distribution15
of the fixed assets per unit area of petrochemical enterprises.
4.3 Fire hazard probability of different types of petrochemical enterprises
The fire occurrence probability P (F ) of petrochemical enterprise depends on the prob-ability P (C) of leakage and diffusion of flammable materials in factories, the probabilityP (S) of ignition, and the fire proportion Fk of the petrochemical enterprise, as shown in20
expression (5) below.
P (F )k = P (C) · P (S) · Fk (5)
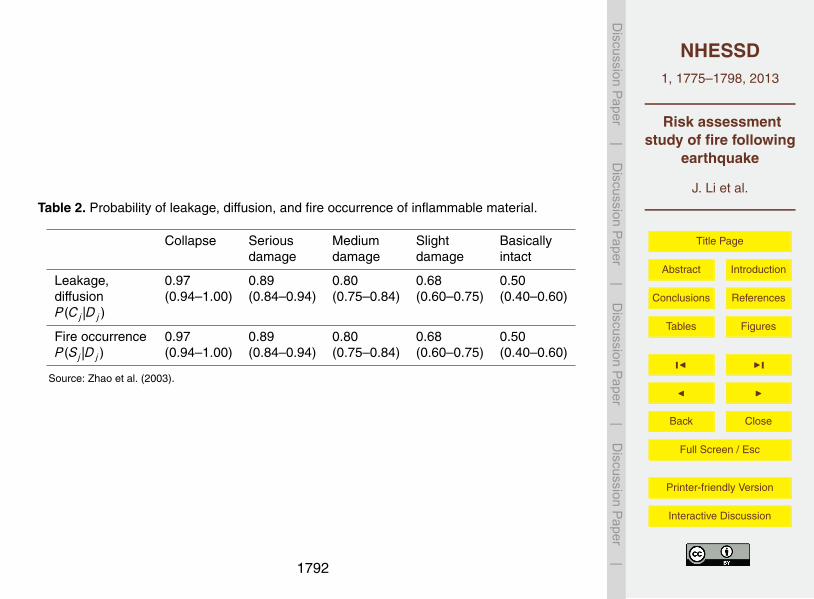
Table 2 shows the data (Yu et al., 2003; Zhao et al., 2003) from Zhao Zhendong et al. onthe basis of historical data, that is, the probability P (Cj |Dj ) of leakage and diffusion andthe probability P (Sj |Dj ) of petrochemical enterprise fire occurrence at different levels25
of earthquake damage.
1783

NHESSD1, 1775–1798, 2013
Risk assessmentstudy of fire following
earthquake
J. Li et al.
Title Page
Abstract Introduction
Conclusions References
Tables Figures
J I
J I
Back Close
Full Screen / Esc
Printer-friendly Version
Interactive Discussion
Discussion
Paper
|D
iscussionP
aper|
Discussion
Paper
|D
iscussionP
aper|
Fk is the daily fire occurrence proportion of petrochemical enterprises. Fire hazardprobability varies among petrochemical enterprises because the chemical substancesused in their production processes and the flammable materials in the factory build-ings have different characteristics and are stored in various quantities (Sinopec Group,2008; The Ministry of Public Security of PRC, 2006). Therefore, this paper uses Fk to5
adjust their fire hazard probability.On account of the lack of official statistics regarding fires in petrochemical en-
terprises, this paper calculates Fk by collecting data on 233 fires at petrochemicalenterprises in China from January 2005 to July 2011; the data were sourced fromChina’s most authoritative fire protection websites (China’s online fire protection web-10
site and the Huicong fire protection website) (China Fire Protection Website, 2005–2011; Huicong Fire Protection Website, 2005–2011). According to the China Fire Ser-vices, the incidence of petrochemical enterprise fires was 579, 429, 532, 382, and349 (Fire Department of the Ministry of Public Security of PRC, 2006–2010) for theyear 2005, 2006, 2007, 2008, and 2009, respectively. The 233 records are in accord15
with the minimum sample size demand of the sample survey.According to enterprise types, this paper divides the above fires into four categories:
PE1, PE2, PE3, and PE4, and calculates daily fire proportion for each category. Theresults are shown in Table 3; for PE2, the fire proportion of chemical raw materials andchemical product manufacturing enterprises is higher than for the other categories.20
4.4 Fire loss ratio lf of petrochemical enterprises
Considering the availability of data, this paper simplified the calculation of petrochemi-cal enterprise fire loss ratio lf by the average loss ratio, that is, the ratio of the averagefire loss value to the average fixed asset value of petrochemical enterprises, as shownin expression (5) below.25
lf =Lf
W(6)
1784

NHESSD1, 1775–1798, 2013
Risk assessmentstudy of fire following
earthquake
J. Li et al.
Title Page
Abstract Introduction
Conclusions References
Tables Figures
J I
J I
Back Close
Full Screen / Esc
Printer-friendly Version
Interactive Discussion
Discussion
Paper
|D
iscussionP
aper|
Discussion
Paper
|D
iscussionP
aper|
In this expression, lf refers to the petrochemical enterprise daily fire loss ratio, Lf tothe petrochemical enterprise daily fire average loss value, and W to the average fixedasset value of a single petrochemical enterprise.
According to the average fixed asset value of petrochemical enterprises (LeadingGroup Office of the Second China Economic Census of the State Council, 2010)and5
petrochemical enterprise fire economic loss data (Fire Department of the Ministry ofPublic Security of PRC, 2006–2010) in 2008, the petrochemical enterprise daily fireloss ratio lf = 0.001.
5 Fire following earthquke risk of petrochemical enterprises for China’scounties10
The seismic ground motion zonation map can help identify the level of seismic groundmotions Ri in each county and then obtain the P (Dj |R i ) and lj . With the above loss ratioand fixed asset value, and expressions (1), (2), (3), and (4), the post-earthquake fireexpected loss value of the four types of petrochemical enterprises in various countiescan be calculated, as shown in Fig. 3a, b, c, and d. Figure 3e shows a post-earthquake15
fire risk map of China’s petrochemical enterprises, showing the loss value of the fourtypes of petrochemical enterprises.
In each picture in Fig. 3, the colors, from dark to light show the post-earthquakefire risk from high to low. Figure 3e shows that the high-risk post-earthquake ar-eas are mainly distributed in central China, including the Beijing-Tianjin-Tangshan re-20
gion, Shandong, Jiangsu, Zhejiang provinces, and parts of Henan, Shanxi, Shaanxi,Sichuan, Yunnan, Xinjiang, and Guangdong provinces. Cause analysis shows, be-cause of the post-earthquake fire risk chain, that high-risk areas of petrochemicalenterprises are closely related to the distribution of seismic fault belts. For example,northern China, containing the north-south seismic belt, has historically experienced25
significant earthquakes and has a relatively high risk. In contrast, there is a close corre-lation between risk levels and output value of petrochemical enterprises. For example,
1785

NHESSD1, 1775–1798, 2013
Risk assessmentstudy of fire following
earthquake
J. Li et al.
Title Page
Abstract Introduction
Conclusions References
Tables Figures
J I
J I
Back Close
Full Screen / Esc
Printer-friendly Version
Interactive Discussion
Discussion
Paper
|D
iscussionP
aper|
Discussion
Paper
|D
iscussionP
aper|
the risk in Shandong and Jiangsu provinces is the highest because the petrochemicalindustry there is flourishing. In those two provinces, the total amount of fixed assets oflarge-scale (over 5 million RMB in annual sales) petrochemical enterprises accountedfor over 10 % of all petrochemical production in 2008, and ranked first and second inChina.5
From the perspective of the specific risk distribution of the four types of petrochemicalenterprises, as the fixed asset value of PE1 and PE2 enterprises are relatively high, sotoo are the corresponding risk levels, as shown in Fig. 3a and b. In contrast, the risklevels of PE3 and PE4 enterprises are relatively low, as shown in Fig. 3c and d. Thedistribution of high-risk areas for all types of petrochemical enterprises is basically the10
same as the distribution in Fig. 3e.The above expected loss is calculated in county unit, and if the expected loss in
county is added up to the province unit, the result is shown in Table 4, which is the topten expected loss of earthquake-fire for provinces. The high loss areas are mainly con-centrated in the Bohai Rim (Tianjin, Beijing, Shandong, Hebei, Liaoning), the Yangtze15
River Delta (Shanghai, Jiangsu) and Shanxi-Henan-Shaanxi Region. But there arelarge differences between provinces in four type enterprises, and the provinces shouldadopt different risk prevention measures according to their own development featuresof the petrochemical industry. For example, Shandong should pay attention to PE1 andPE2 earthquake-fire prevention, however, Shanghai and Jangsu only need focus on20
PE2.
6 Discussion
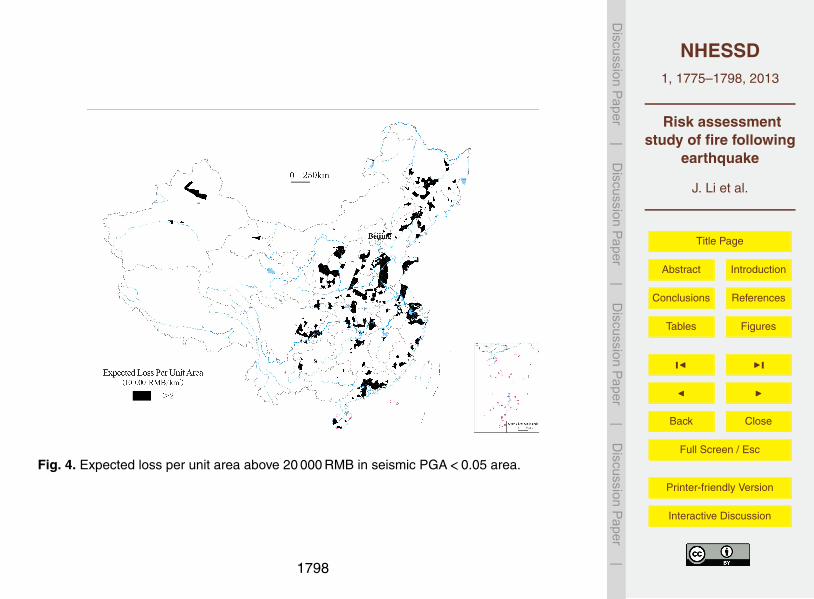
The seismic ground motion zonation map is used to determine the seismic fortificationof buildings in China. The seismic PGA=0.05 g is the minimum seismic fortificationlevel, and PGA<0.05 g is the non-seismic fortification area. Using GIS software layer25
calculation functions, areas of PGA<0.05 g can be extracted from the seismic groundmotion zonation map and areas with a local expected loss per unit above 20 000 RMB
1786

NHESSD1, 1775–1798, 2013
Risk assessmentstudy of fire following
earthquake
J. Li et al.
Title Page
Abstract Introduction
Conclusions References
Tables Figures
J I
J I
Back Close
Full Screen / Esc
Printer-friendly Version
Interactive Discussion
Discussion
Paper
|D
iscussionP
aper|
Discussion
Paper
|D
iscussionP
aper|
[see Fig. 3(e)]; the two areas can then be added together using GIS superposition toshow where the two meet, as shown in Fig. 4.
The black areas in Fig. 4 show regions with low-level seismic fortification and a highrisk of petrochemical enterprise post-earthquake fires; these areas are mainly dis-tributed in the southern Shandong Peninsula, southern Jiangsu Province, and along5
the coast of the Hangzhou Bay and the Pearl River Delta.In accordance with the post-earthquake fire risk assessment results, the post-
earthquake fire loss value per unit area is at a higher level in the above areas, wherefire risk is often ignored because of the lower levels of seismic fortification. Accord-ingly, the level of fire protection construction in petrochemical enterprises is especially10
important in these areas; on the one hand, an appropriate emergency disaster planshould be formulated, and on the other, seismic standards should be taken into con-sideration when petrochemical enterprises undertake the construction of fire protectionequipment and pipelines to ensure appropriate fire protection in an earthquake.
7 Conclusions15
The risk of fire is high for petrochemical enterprises, especially when buildings, chem-ical equipment, and fire-fighting capacity are damaged in an earthquake. This paper,based on the seismic ground motion zonation map, calculated the expected loss in apost-earthquake fire for four types of petrochemical enterprises in counties in China.The analysis focused on the probability of flammable material leakage and diffusion,20
ignition source, and fire proportion of petrochemical enterprises.Areas with a high risk of post-earthquake fires have a wide distribution in the Beijing-
Tianjin-Tangshan region; Shandong, Jiangsu, and Zhejiang provinces; and in a numberof counties in Henan, Shanxi, Shaanxi, Sichuan, Yunnan, Xinjiang and Guangdong.The risk of petrochemical enterprises requires extra attention and measures in some25
areas, especially where the level of seismic fortification is low.
1787

NHESSD1, 1775–1798, 2013
Risk assessmentstudy of fire following
earthquake
J. Li et al.
Title Page
Abstract Introduction
Conclusions References
Tables Figures
J I
J I
Back Close
Full Screen / Esc
Printer-friendly Version
Interactive Discussion
Discussion
Paper
|D
iscussionP
aper|
Discussion
Paper
|D
iscussionP
aper|
In view of the available data, the calculation of some of the parameters used inthis paper was conducted in a simplified way. Thus, further study is required to con-duct a more precise risk assessment, including a more detailed classification based onpetrochemical enterprise production processes, and the effect of varying earthquakeintensities on chemical equipment, fire probability, and diffusion probability for all types5
of petrochemical enterprises.
Acknowledgements. This research was primarily supported by the National Natural ScienceFunds (No. 41271544), the National Key Technology R & D Program of the Twelfth Five-Year ofChina (No. 2012BAK10B03), and the Fundamental Research Funds for the Central Universities(2009SD-20).10
References
Business Community: The reasons of the earthquake fire, http://china.toocle.com/cbna/item/2008-09-19/3796526.html (last access: 26 July 2012), 2008.
Cai, F., Tan, Z., Meng, H., and Cai, R.: Chemical Process Safety Engineering (Second Edition),Science Press, Beijing, China, 2009.15
Chen, X.: Study of assessment model on secondary accident risk triggered by natural disasters,M.S. thesis, Shenyang Aerospace University, Shenyang, China, 2010.
China Fire Protection Website: http://119.china.com.cn/ (last access: 26 July 2012), 2005–2011.
China Petroleum & Chemical Industry Association: Chinese chemical industry yearbook 2008,20
Second Volume, Chinese Chemical Industry Information Center, Beijing, China, 2009.Earthquake loss prediction research team of China Earthquake Administration: Earthquake
loss prediction research in China, Seismological Press, Beijing, China, 1990.Fire Department of the Ministry of Public Security of PRC: China fire services (2005–2009),
China Personnel Press, Beijing, China, 2006–2010.25
Hui, Z., Jiang, W.: Research on protection of earthquake fire for petrochemical enterprise,Petrochemical Safety Technology, 18, 36–39, 2002.
Huicong Fire Protection: http://www.fire.hc360.com/ (last access: 26 July 2012), 2005–2011.
1788

NHESSD1, 1775–1798, 2013
Risk assessmentstudy of fire following
earthquake
J. Li et al.
Title Page
Abstract Introduction
Conclusions References
Tables Figures
J I
J I
Back Close
Full Screen / Esc
Printer-friendly Version
Interactive Discussion
Discussion
Paper
|D
iscussionP
aper|
Discussion
Paper
|D
iscussionP
aper|
Institute of Engineering Mechanics China Earthquake Administration: Post-Earthquake FieldWorks–Part 4: Assessment of Direct Loss (GB/T 18208.4-2005), Seismological Press, Bei-jing, China, 2005.
Kawasumi, H.: Examination’ of Earthquake-Fire Damage in Tokyo Metropolis, Tokyo Fire De-partment, 1961.5
Kobayashi, M.: Urban post-earthquake fires in Japan, in: Proceedings of US-Japan Workshopon Urban Earthquake Hazards Reduction, Stanford Calif, July 29-August 1, 121–133, 1984.
Leading Group Office of the Second China Economic Census of the State Council: China eco-nomic census yearbook, Secondary Industry Volume, China, 2010.
Mizuno, H.: On Outbreak of Fires in Earthquakes, Dissertation, Kyoto Univ. Department of10
Architecture, 1978.National Bureau of Statistics of China: Industrial classification for national economic activities
(GB/T 4754-2011), China Zhijian Publishing House, Beijing, China, 2011.Nishio, T., Tanaka, T. and Hokugo, A.: An evaluation method for the urban post-earthquake fire
risk considering multiple scenarios of fire spread and evacuation, Fire Safety J., 54, 167-180,15
2012.Peng, Y., Lv, Y., and Zhang, X.: The comparison of the latest seismic ground motion zonations
between China and the USA, Prog. Geophys., 19, 40–44, 2004.Scawthorn, C., Yamada, Y., and Iemura, H.: A Model for urban post-earthquake fire hazard,
Disasters, 5, 125–132, 1981.20
Scawthorn, C.: Fire following earthquake, in: First Safety Science-Proceedings of the First In-ternational Symposium, 971–979, 1986.
Scawthorn, C.: Fires following the Northridge and Kobe earthquake, Thirteenth Meeting of TheUJNR Panel on Fire Research and Safety, New York, March 13–20, 337–345, 1996.
Sinopec Group: Fire prevention code of petro chemical enterprise design (GB 50160-2008),25
China Planning Press, Beijing, China, 2008.Sohu News: An explosion and fire at an oil refinery in Sendai, Japan, http://news.sohu.com/
20110311/n279779460.shtml (last access: 26 July 2012), 2011b.Sohu News: An explosion and fire at Chiba refinery in Japan, http://news.sohu.com/20110311/
n279776122.shtml (last access: 26 July 2012), 2011a.30
Tanaka, T.: Characteristics and problems of fires following the Great East Japan earthquake inMarch 2011, Fire Safety J., 54, 197–202, 2012.
1789

NHESSD1, 1775–1798, 2013
Risk assessmentstudy of fire following
earthquake
J. Li et al.
Title Page
Abstract Introduction
Conclusions References
Tables Figures
J I
J I
Back Close
Full Screen / Esc
Printer-friendly Version
Interactive Discussion
Discussion
Paper
|D
iscussionP
aper|
Discussion
Paper
|D
iscussionP
aper|
The Ministry of Public Security of PRC: Code of design on building fire protection and prevention(GB 50016-2006), China Planning Press, Beijing, China, 2006.
Trifunac, M. D. and Todorovska, M. I.: The Northridge, California, earthquake of 1994: densityof pipe breaks and surface strains, Soil Dynam. Earthquake Eng., 16, 193–207, 1997.
Trifunac, M. D. and Todorovska, M. I.: The Northridge, California, earthquake of 1994: fire igni-5
tion by strong shaking, Soil Dynam. Earthquake Eng., 17, 165–175, 1998.Wang, Q. and Xu, D.: Safety assessment operation, China Meteorological Press, Beijing, China,
2009.Xu, J., Lin, J., Cao, H. et al.: Risk evaluation and countermeasures of earthquake-induced fire
in petrochemical enterprises, J. Nat. Disasters, 11, 134–140, 2002.10
Yu, S., Zhao, Z. and Zhong, J.: Numerical simulation of secondary disasters of earthquakebased on GIS, J. Nat. Disasters, 12, 100–105, 2003.
Zhao, S.: GisFFE – an integrated software system for the dynamic simulation of fires followingan earthquake based on GIS, Fire Safety J., 45, 83–97, 2010.
Zhao, Z., Zhong, J., and Yu, S.: Probability model for hazard analysis of post-earthquake fire15
occurrence and spread among buildings, Earthquake Engineering and Engineering Vibrate,23, 183–187, 2003.
1790

NHESSD1, 1775–1798, 2013
Risk assessmentstudy of fire following
earthquake
J. Li et al.
Title Page
Abstract Introduction
Conclusions References
Tables Figures
J I
J I
Back Close
Full Screen / Esc
Printer-friendly Version
Interactive Discussion
Discussion
Paper
|D
iscussionP
aper|
Discussion
Paper
|D
iscussionP
aper|
Table 1. Industrial factory building damage loss ratio.
Collapse Serious damage Medium damage Slight damage Basically intact
81–100 % 46–80 % 17–45 % 5–16 % 0–4 %
Source: Post-earthquake field works–part 4: assessment of direct loss (GB/T 18208.4-2005)
1791
NHESSD1, 1775–1798, 2013
Risk assessmentstudy of fire following
earthquake
J. Li et al.
Title Page
Abstract Introduction
Conclusions References
Tables Figures
J I
J I
Back Close
Full Screen / Esc
Printer-friendly Version
Interactive Discussion
Discussion
Paper
|D
iscussionP
aper|
Discussion
Paper
|D
iscussionP
aper|
Table 2. Probability of leakage, diffusion, and fire occurrence of inflammable material.
Collapse Seriousdamage
Mediumdamage
Slightdamage
Basicallyintact
Leakage,diffusionP (Cj |Dj )
0.97(0.94–1.00)
0.89(0.84–0.94)
0.80(0.75–0.84)
0.68(0.60–0.75)
0.50(0.40–0.60)
Fire occurrenceP (Sj |Dj )
0.97(0.94–1.00)
0.89(0.84–0.94)
0.80(0.75–0.84)
0.68(0.60–0.75)
0.50(0.40–0.60)
Source: Zhao et al. (2003).
1792

NHESSD1, 1775–1798, 2013
Risk assessmentstudy of fire following
earthquake
J. Li et al.
Title Page
Abstract Introduction
Conclusions References
Tables Figures
J I
J I
Back Close
Full Screen / Esc
Printer-friendly Version
Interactive Discussion
Discussion
Paper
|D
iscussionP
aper|
Discussion
Paper
|D
iscussionP
aper|
Table 3. Daily fire proportion for petrochemical enterprises.
Enterprise type PE1 PE2 PE3 PE4Daily fire proportion 0.171 0.438 0.129 0.262
Source: Authors
1793

NHESSD1, 1775–1798, 2013
Risk assessmentstudy of fire following
earthquake
J. Li et al.
Title Page
Abstract Introduction
Conclusions References
Tables Figures
J I
J I
Back Close
Full Screen / Esc
Printer-friendly Version
Interactive Discussion
Discussion
Paper
|D
iscussionP
aper|
Discussion
Paper
|D
iscussionP
aper|
Table 4. The top ten expected loss of earthquake-fire for provinces.
Provincename
Expected loss (unit: ten thousand RMB)
PE1 PE2 PE3 PE4 Total
Tianjin 13 995.60 4107.67 57.05 2619.64 20 779.97Beijing 5786.72 2927.80 52.41 1006.52 9773.45Shanghai 739.14 2183.59 65.43 662.38 3650.54ShanDong 1055.01 1101.85 55.18 367.98 2580.01Hebei 1162.63 743.13 37.59 242.28 2185.62Jiangsu 182.90 1264.73 294.60 383.13 2125.36Henan 845.04 1003.48 76.15 198.14 2122.82Shanxi 1369.62 690.46 0.85 41.18 2102.12Shaanxi 1854.04 184.46 0.31 16.40 2055.22Liaoning 926.71 576.29 35.71 209.19 1747.89
Source: Authors
1794

NHESSD1, 1775–1798, 2013
Risk assessmentstudy of fire following
earthquake
J. Li et al.
Title Page
Abstract Introduction
Conclusions References
Tables Figures
J I
J I
Back Close
Full Screen / Esc
Printer-friendly Version
Interactive Discussion
Discussion
Paper
|D
iscussionP
aper|
Discussion
Paper
|D
iscussionP
aper|
19
1
2
Figure 1. Post-earthquake fire causing mechanism of the petrochemical enterprises. 3
4
Earthquake direct loss Fire loss
Fire
Aggravate
Earthquake
Reduction of fire-fighting capacity
Open flame or
spark by friction
Chemical reaction
Workshops damage
Equipment damage
……
Leakage of
flammable and
explosive objects
Total loss of the
fire following
earthquake
disaster chain
Petrochemical
enterprise
Source: Authors
Fig. 1. Post-earthquake fire causing mechanism of the petrochemical enterprises.
1795

NHESSD1, 1775–1798, 2013
Risk assessmentstudy of fire following
earthquake
J. Li et al.
Title Page
Abstract Introduction
Conclusions References
Tables Figures
J I
J I
Back Close
Full Screen / Esc
Printer-friendly Version
Interactive Discussion
Discussion
Paper
|D
iscussionP
aper|
Discussion
Paper
|D
iscussionP
aper|
Fig. 2. Fixed assets per unit area of petrochemical enterprises.
1796

NHESSD1, 1775–1798, 2013
Risk assessmentstudy of fire following
earthquake
J. Li et al.
Title Page
Abstract Introduction
Conclusions References
Tables Figures
J I
J I
Back Close
Full Screen / Esc
Printer-friendly Version
Interactive Discussion
Discussion
Paper
|D
iscussionP
aper|
Discussion
Paper
|D
iscussionP
aper|
Fig. 3. Earthquake-fire risk map of petrochemical enterprises.
1797
NHESSD1, 1775–1798, 2013
Risk assessmentstudy of fire following
earthquake
J. Li et al.
Title Page
Abstract Introduction
Conclusions References
Tables Figures
J I
J I
Back Close
Full Screen / Esc
Printer-friendly Version
Interactive Discussion
Discussion
Paper
|D
iscussionP
aper|
Discussion
Paper
|D
iscussionP
aper|
Fig. 4. Expected loss per unit area above 20 000 RMB in seismic PGA<0.05 area.
1798