risk management tools for eu agriculture with a...
TRANSCRIPT
EUROPEAN COMMISSIONAGRICULTURE DIRECTORATE-GENERAL
Directorate A. Economic analyses, forward studies, evaluation
:RUNLQJ�'RFXPHQW
�5LVN�0DQDJHPHQW�7RROVIRU�(8�$JULFXOWXUH
ZLWK�D�VSHFLDO�IRFXV�RQ�LQVXUDQFH
-DQXDU\�����

2
7$%/(�2)�&217(176
SUMMARY.........................................................................................................................4
1. INTRODUCTION .....................................................................................................11
2. RISK – DEFINITION, CATEGORIES AND RISK EXPOSURE IN THEEU..............................................................................................................................12
2.1. Risk and uncertainty ........................................................................................122.2. Categories of risk in agriculture.......................................................................122.3. Some facts about yield, price and output variability in EU agriculture ...........132.4. Sources of risk as perceived by farmers...........................................................15
3. RISK MANAGEMENT TOOLS FOR FARMERS ..................................................16
3.1. Diversification .................................................................................................163.2. Contracts and vertical integration ....................................................................173.3. Hedging in futures and options........................................................................193.4. Insurance – conditions and types .....................................................................23
3.4.1. Basic requirements for insurance.......................................................233.4.2. Types of insurance in agriculture.......................................................253.4.3. Re-insurance and insurance pools......................................................28
3.5. Mutual funds....................................................................................................30
4. AGRICULTURAL POLICY AND RISK MANAGEMENT....................................31
4.1. Justification for government intervention........................................................314.1.1. Market failure.....................................................................................314.1.2. Other reasons for government intervention .......................................32
4.2. Objectives of government action .....................................................................334.3. Policy instruments............................................................................................33
4.3.1. Fields of action...................................................................................334.3.2. Specific public tools...........................................................................34
5. EXAMPLES OF AGRICULTURAL INSURANCE AND SAFETY NETSYSTEMS .................................................................................................................40
5.1. Selected EU Member States ............................................................................405.2. Spain ................................................................................................................445.3. United States of America.................................................................................47
5.3.1. Crop Insurance and Disaster Aid - development until 1994..............475.3.2. Multiple Peril Crop Insurance (MPCI) ..............................................485.3.3. Revenue insurance .............................................................................505.3.4. Private-public partnership..................................................................525.3.5. Premia and premium subsidies ..........................................................535.3.6. Unit structure of insurance contracts .................................................545.3.7. Scope and costs of crop and revenue insurance policies ...................545.3.8. New developments.............................................................................56

3
5.4. Canada .............................................................................................................575.4.1. Crop Insurance Programme (CI)........................................................575.4.2. Net Income Stabilisation Account (NISA) ........................................595.4.3. Agricultural Income Disaster Assistance (AIDA) .............................61
5.5. Japan ................................................................................................................62
6. WTO ISSUES............................................................................................................64
7. LESSONS FROM EXISTING SYSTEMS OF AGRICULTURALINSURANCE.............................................................................................................66
7.1. Coverage and participation ..............................................................................667.2. Incentive structure and efficiency ....................................................................677.3. Programme design ...........................................................................................697.4. Complexity.......................................................................................................707.5. Limits of a comprehensive system of agricultural insurance...........................717.6. Equity and influence on production.................................................................71
8. POTENTIAL FIELDS OF ACTION FOR THE EU .................................................73
8.1. Trends in risk exposure in the EU ...................................................................738.2. Current response to risk exposure in the EU ...................................................738.3. New tasks for the EU in risk management?.....................................................74
8.3.1. Short term versus long term policy orientations ................................748.3.2. Price risk ............................................................................................748.3.3. Production risk...................................................................................758.3.4. Anti-cyclical income support and safety nets ....................................78
9. BIBLIOGRAPHY......................................................................................................80
ANNEX 1 ..........................................................................................................................85
ANNEX 2 ..........................................................................................................................93
ANNEX 3 ..........................................................................................................................96
ANNEX 4 ..........................................................................................................................98
ANNEX 5 ..........................................................................................................................99
ANNEX 6 ........................................................................................................................100

4
6XPPDU\
This report provides an overview of the different types of risk that agriculture faces andevidence of risk exposure in European agriculture. After looking at the tools available tomanage agricultural risk, it examines the reasons and objectives of governmentintervention and discusses the policy instruments Member States and other countries useto help their farmers in dealing with risk exposure. The lessons that can be learned fromexisting public involvement in agricultural risk management form the basis forreflections concerning the potential of applying risk management policies at the EU-level.
In Chapter 2, the risks faced by farmers are described. The risk types considered includeprice risks and production risks. Whereas the former are likely to increase due to furtherpotential trade liberalisation, the latter might increasingly be influenced by rising qualityrequirements, the growing movement of animals and plants as well as climate change.Both are, furthermore, subject to increasing specialisation in agriculture. An analysis ofEurostat and FADN data shows that risk exposure in the EU as measured by price, yieldand output variability varies widely across products and regions.
Chapter 3 gives an overview of risk management tools at the disposal of farmers. Severaltypes of risk management strategies are distinguished:
• On-farm strategies concern farm management and include selecting products with lowrisk exposure (e.g. products benefiting from public intervention), choosing productswith short production cycles, holding sufficient liquidity or diversifying productionprogrammes. Evidence suggests that European agriculture is not adopting the strategyof diversification. Between 1975 and 1997, the share of non-specialised farms fellfrom 32 per cent to 17 per cent.
• Risk-sharing strategies include concluding marketing and production contracts,vertical integration, hedging on futures markets, participation in mutual funds andinsurance.
• Diversification through increasing the share of income from sources outsideagriculture.
• Relying on public assistance (disaster aid).
Ideally, markets should provide a wide range of risk management tools. The mostimportant markets for risk coverage are futures markets and insurance markets:
• Futures markets help to reduce short term price risks and at the same time increaseprice transparency. In the EU, futures can be traded on five exchanges. Tradedvolumes are still relatively low. However, American trade volumes show the long runpotential. Up-take is slow because the use of futures requires considerable investmentin know-how and infrastructure and traders will only move to the European futuresmarket once they have reached a minimum liquidity. In addition, the development offutures markets in Europe has been hampered by CAP-induced price stability. Asprice-volatility on the European markets is likely to increase with possible further

5
trade liberalisation, the conditions for the development of futures markets and othermarket-based risk management tools are expected to improve.
• Production risks can be covered by insurance if the risks are as little correlated aspossible across insured individuals (independence of risks) and if farmers andinsurance companies have similar information concerning the effective risks involved(symmetry of information). The classical example of such an insurable risk is hail.Mutual funds are a special case of insurance. Mutual funds are owned by theparticipants and cover losses of members either through money already available inthe fund and/or through an additional collection among participants.
When markets for risk management tools are incomplete or missing, public interventioncan be justified. Chapter 4 explains the reasons for incomplete or missing markets.Reasons can be found both on the supply and the demand side. The main reasons on thedemand side are:
• Know-how to make use of certain risk-management tools (e.g. futures and optionsmarkets) can be acquired only at high start-up transaction costs and is, therefore, notalways available to farmers.
• Farmers perceive risks they face as being smaller than they actually are, resulting inlow demand for risk-management tools (“Cognitive failure”). Events of lowprobability, which are associated with high potential losses (catastrophes), are verylikely to be neglected in individual decision making.
• Even if farmers do not underestimate the risks they face, they might count on othersafety nets, including off-farm income and therefore might not use available riskmanagement tools.
On the supply side, the reasons vary from product to product:
• Insurance products might not be offered on the market because the conditions forinsurability (independence of risk, symmetry of information) are not sufficientlyfulfilled.
• Re-insurance is often necessary in order to cover big natural hazard risks. However,re-insurance can be very expensive, especially after catastrophes have happened,making an insurance product commercially inviable. Furthermore, agricultural re-insurance markets are limited, because of the special know-how involved and becausethe expected returns for covering the high set-up costs might not be attractive enough.
• The conditions for a successful establishment of futures and options markets�are notalways fulfilled. Not only do farmers need a certain amount of know-how, there is alsoa need for substantial price variability, sufficient traders and speculators and productswith standardised grades and quality.
Public policy can intervene at different levels: A field of action can be to set-up thenecessary legal framework for the creation of markets for risk coverage. Public policy canalso provide incentives for the development of such markets (e.g. by encouraging trainingin the use of risk management tools) or lower the costs of such tools (e.g. by providing

6
subsidies for insurance premia). Finally, governments can also provide risk coveragethemselves (e.g. by providing re-insurance).
Different systems of agricultural insurance in Member States and other countries helpingfarmers to cope with production risk exposure are described in Chapter 5. The overviewshows considerable differences in coverage, public sector involvement and up-take.
• Greece has a predominantly public system. The state, through its public insuranceorganisation, collects compulsory contributions, administers the programme andguarantees coverage of losses. By virtue of this, the role of the private sector is limited(system under reform).
• Spain and Portugal�have “public-private partnership”-systems, where the state plays akey role, providing both premium subsidies and re-insurance. The private insuranceindustry is integrated into the system; it takes care of programme administration andcontributes to covering a share of the risk.
• Italy, France, Austria and Germany�have systems of agricultural insurance, which arepredominantly private. The four countries differ considerably with respect to subsidiesfor insurance premia. While Germany is not providing any premia subsidies, Italygrants considerable amounts.
• In the US,�a comprehensive system of crop insurance is in place within which stateinvolvement takes four principal forms: (1) subsidising insurance premia; (2) coveringadministration expenses of the private insurance sector; (3) reimbursing acquisitioncosts of the private sector; and (4) providing reinsurance. Although two thirds of thecountry´s total planted acreage of field crops (except for hay) is insured (1998)substantial emergency aid has been paid since 1998�
• Canada has a crop insurance programme (CI), a subsidised savings programme forfarmers (NISA) and an anti-cyclical income safety net (AIDA) which securesindividual whole farm income at 70 percent of the historical three-year averageincome.
In the framework of the WTO Uruguay Round Agreement on Agriculture, insurancesubsidies and disaster aids are, under certain conditions, exempt from reductioncommitments (green-box). These conditions are explained in Chapter 6.
In Chapter 7, lessons from existing public-private systems of agricultural insurance aredrawn. The chapter draws heavily on the US experience.
• Coverage and participation:�Even for well-developed agricultural insurance systemsthe coverage in terms of products and participation rates remains limited. This is trueeven for products which are specifically designed to provide basic safety net coveragefor every farmer and which are provided at very low cost. In Spain, 30 per cent of thefarmers participate in the system resulting in 30 per cent of crop production and 10 percent of animal production covered. In the US, 20 per cent of farmers participate in thesystem, while two thirds of the country’s total eligible acreage is covered.
• Incentive structure and efficiency: Covering a wide range of perils at a level ofprotection which is interesting to the farmer seems to require considerable state

7
involvement (US, Spain). Questions arise as regards the efficiency of programmes,which are based on a public-private partnership.
• Programme design:�Publicly supported insurance programmes can be under (political)pressure to provide products which have not been sufficiently tested and which cantherefore undermine the soundness of the system.
• Complexity: Changing demands and necessary programme adjustments increasecomplexity and decrease transparency. This makes it easier for the variousstakeholders to engage in rent-seeking.
• Limits of comprehensiveness: Even insurance systems benefiting from considerablepublic support do not have universal take-up rates. Farmers´ needs vary widely and nosystem can be tailored to meeting everyone’s needs. Therefore, the (political) demandfor providing ad-hoc aids remains considerable.
• Equity and influence on production:� Since premia subsidies are normally set as apercentage of premia, farmers and regions facing the highest risk receive the highestsubsidies. Due to these subsidies, producers might not abandon production in high-riskareas, which can result in significant costs for society as a whole.
Chapter 8 summarises the availability of off-farm instruments to cope with risk exposurein the EU and discusses the potential of applying risk management policies at the EU-level.
In all Member-States, some private off-farm instruments to cope with risk exist. Someinstruments have reached maturity and are widely available (mainly hail insurance),whereas others are less developed (futures and options markets, mutual funds). Someinsurance systems are private, whereas others rely heavily on public involvement.Instruments which cover a combination of production and price risk (revenue risk) are intheir infant stages. The main public measure is disaster aid. Member States are also activein risk prevention (sanitary and phytosanitary measures)1.
&XUUHQW�RII�IDUP�UHVSRQVHV�WR�ULVN�H[SRVXUH�LQ�(8�0HPEHU�6WDWHV
5LVN5HVSRQVH Production Price
Private ,QVXUDQFH�(mainly hail) 0XWXDO�IXQGV )XWXUHV�DQG�RSWLRQV�PDUNHWVPublic 'LVDVWHU�DLG
6DQLWDU\�DQG�SK\WRVDQLWDU\�PHDVXUHV�&$3�
Public-private ,QVXUDQFH��PXOWL�SHULO��(mainly crops) �
Market support, direct payments and rural development measures (diversification) in theframework of the CAP have a major impact on farmers´ risk, even if their main goal maybe income stabilisation and not risk reduction. In particular, the price supportmechanisms play a role in reducing price risks for key products. EU measures explicitlytargeted at production risk include sanitary and phytosanitary measures as well asguidelines for Member States´ disaster aids and insurance subsidies.
1 Furthermore, income tax averaging systems are in force in some Member States.

8
The perspective of rising risk-exposure in Europe raises the question whether the EU hasa role to play in risk management, which goes beyond its current role. This question hasto be examined in the context of the fact that the core CAP instruments have an impacton farmers´ risk exposure, as mentioned before. It also has to be remembered that specificrisk management policies cannot replace income support policies. The goal of riskmanagement policies is not income support but only to reduce fluctuations of income orits components. Risk management instruments cannot reverse long-term income trends.
The case for introducing additional risk management instruments can be argued, if it canbe shown
• that markets for risk-reduction are missing or incomplete;
• that risk reduction is not sufficiently achieved by existing income stabilisationpolicies;
• that Community action provides value-added as compared to national or regionalinitiatives/action.
Price risk
Although market intervention remains important even after Agenda 2000, the lower pricefloor for beef and cereals increases the scope for private instruments to manage price risk,i.e. the use of futures and options for commodities with standardised grades. Althoughthe traded volumes are still low on EU futures markets, a dynamic development can beobserved, with an increasing range of products.
The EU has an active interest in well-functioning futures and options markets. Firstly, asprice support is being reduced, new instruments are needed to help farmers across Europeto cope with the increasing price volatility. Secondly, futures and options marketscontribute to market transparency, which favours the functioning of the internal market.The development of futures markets can already be promoted through education andtraining measures under Rural Development policies. In addition, an activeencouragement at the EU-level might be needed in order to prepare the ground for awider use of such instruments. Initiatives might include a special information programmeon futures and options markets for all European farmers.
Production risk
Traditionally, Member States have been at the forefront of helping producers to cope withproduction risk (disaster aid, sanitary and phytosanitary measures, public-private systemsof agricultural insurance, insurance subsidies). The Community´s role has been limited tosetting the overall framework (i.e. sanitary and phytosanitary measures), providing somefinancial support (e.g. disease control), and – most importantly – applying state aiddisciplines with a view to avoid market distortions.
EU guidelines on state aids give Member States a considerable margin of manoeuvre inresponding to the various needs of their farmers. As a result, existing agriculturalinsurance systems vary widely among Member States with respect to organisation,coverage, complexity and state involvement. The Spanish experience shows that acomprehensive system of agricultural insurance could be developed within the commonframework on state aids.

9
Three conclusions can be drawn from existing public-private systems of agriculturalinsurance:
• Firstly, initiatives have to be based on a “bottom-up approach” in order to besuccessful.�Insurance products have to be tailored to the needs of farmers which varyamong countries and regions.
• Secondly, a system has to be given time to develop. With growing experience, it canbecome more and more comprehensive (regarding both products and risks covered).
• Thirdly, strong and close public surveillance is needed in order to avoid growingcomplexity leading to unjustified rent-seeking and losing track of the original purposeof providing insurance.
Insurance solutions should be primarily developed at the Member States level. In additionto the need for a “bottom-up approach”, two further reasons support this conclusion:
• Insurance could increasingly replace national ad-hoc disaster aids. This would stabiliseexpenditure and reduce negative effects of disaster aids (e.g. delayed payments,discouraging private risk management and encouraging irresponsible managementdecisions).
• Member States are best placed to target public funds spent in the framework of suchsystems to certain groups of farmers, reflecting specific needs.
A cautious role regarding the EU´s involvement beyond its current involvement istherefore advocated.�The EU might have a role where production risks are to a largeextent systemic (probability of high losses in any given year), which prevents insuranceproducts being offered on the market or makes them very expensive and thereforecommercially inviable. A private solution for this problem could be for insurance and re-insurance companies across Europe to jointly cover such risks by creating insurance/re-insurance pools. The EU could accompany such a process by providing the appropriatelegal framework, where needed. The issue of risk-pooling across regions andcommodities is equally relevant for farmer-owned mutual funds.
The EU could also investigate further into the potential of insurance systems. Major tradepartners use such instruments and there might be a certain prospect for getting theseinstruments accepted as modestly trade distorting within a future WTO agreement onagriculture. In the long term, a more substantial involvement would be possible undertwo conditions: Firstly, an instrument would have to fit into the overall policy-mix of theCAP. Essentially, this would require that there is no overlapping with other instrumentsaddressing the problem of risk exposure in agriculture. Secondly, sufficient funds wouldhave to be made available.
Providing re-insurance (especially covering losses above a certain level) would addressthe most often cited obstacle for the development of insurance systems, i.e. potentiallycatastrophic losses. If such re-insurance were provided, more insurance companies wouldoffer insurance for the coverage of risks potentially resulting in catastrophic losses.

10
Re-insurance could be made contingent on risk pooling at EU level in order to limitaggregate loss potentially covered by the EU. A further condition could be that poolmembers have to offer insurance for all major products of European agriculture. Anyinvolvement would have to meet the requirements of efficiency and transparency andtake into account possible effects on production, price levels and income distribution.
Anti-cyclical income support
Anti-cyclical income support might be an attractive option in the long run. The verymeaning of such an approach is to provide income support in times of need, whilereducing support during periods of prosperity. This instrument has the potential torespond in a transparent way to the farmers´ needs by preventing severe disruptions in thefarm sector and to gain support from the broader public. It could help to overcome theproblems of ad-hoc disaster measures and it appears to be compatible with the WTOgreen box criteria.
As such solutions have features similar to those of socially motivated safety-nets,questions of compatibility with existing national social security systems�aiming to securea certain minimum standard of living arise. It would be necessary to explain carefullywhy farmers need an additional safety net.
An example of such a safety net is the Canadian AIDA programme. Payments are made ifindividual farm incomes fall below 70 percent of their historical three-year average. Theprovisions for calculating the trigger for payments ensure that newcomers, high-debt andlow-debt farmers, as well as high and low investment enterprises are treated equitably. Acap is placed on payments.
Under this system, tax declarations are used to determine the relevant income. Given thataid is targeted to cover 70 per cent of a moving average of past income histories, thesystem would not create adverse incentives. Farmers still have an incentive to go beyondthe 70 per cent trigger for aid, in order to avoid a continuous deterioration of theirreference income serving as the basis for calculating payments.
Model calculations applying the AIDA system to the EU show that in 1997, the familyfarm incomes of 20 per cent of the commercial farms were less than 70 per cent of theiraverage income during the previous three years. Compensation of income losses up to the70 per cent level would have cost about 3 500 million Euro for commercial farms in 1997(2 700 million ¼� LQ��������7KLV� ILJXUH�GRHV�QHLWKHU�SUHMXGJH� DQ\� DVVXPSWLRQ� DERXW� WKHglobal cost of such a scheme in the EU nor its potential allocation between EU andMember States´ budgets.
With respect to a possible application in the EU, it should be taken into account that thesystem is very demanding as regards information requirements (individual incomehistories) and administrative provisions. Also the differences between tax systemsapplied in the different Member States could pose problems with respect to identifyingincome. Furthermore, it must be taken into account that such a public safety net couldrepresent a disincentive for farmers to use private risk-management instruments.

11
��� ,1752'8&7,21
The agricultural sector is characterised by a strong exposure to risk. While this hasalways been the case, risk exposure is still likely to increase. 3ULFH�ULVN is likely to risebecause of agricultural trade liberalisation. 3URGXFWLRQ�ULVN is expected to increase dueto rising quality requirements for some products and stricter rules as regards the use ofinputs and medicines for animals (Meuwissen, Huirne and Hardaker 1999a). Growingmobility of people and movement of animals and animal products can result in anincreased spreading of animal diseases across national borders, thereby also increasingproduction risk (FAO 2000). The same phenomenon applies to plants. Climate changewill have an impact on production risk as well. It is very likely that the frequencies andintensities of summer heatwaves will increase throughout Europe, likely that intenseprecipitation events will increase in frequency, especially in winter, and that summerdrought risk will increase in central and southern Europe, and possible that galefrequencies will increase (Parry 2000). Furthermore, specialisation in Europeanagriculture is expected to continue, thus increasing both producers’ production DQG pricerisk.
This stock-taking report gives an overview of the different types of risk that agriculturefaces and evidence of risk exposure in European agriculture (Chapter 2). After looking atthe tools farmers have available to manage risk (Chapter 3), it examines the reasons andobjectives of government intervention and discusses the policy instruments MemberStates and other countries use to help their farmers dealing with risk exposure (Chapter 4and 5). Chapter 6 looks at how the different forms of government support are classifiedby the WTO. The lessons that can be learned from existing public involvement inagricultural risk management (Chapter 7) form the basis for defining potential fields ofaction for the EU (Chapter 8).

12
��� 5,6.�±�'(),1,7,21��&$7(*25,(6�$1'�5,6.�(;32685(�,1�7+(�(8
����� 5LVN�DQG�XQFHUWDLQW\
Decision-making takes place in an environment of imperfect knowledge of thefuture - XQFHUWDLQW\� - and is associated with ULVN which is normally defined as“uncertainty of outcomes” resulting in losses negatively affecting an individual’swelfare (Hardaker, Huirne and Anderson 1997; Meuwissen, Huirne and Hardaker1999a).
To take a risk is to expose oneself to a chance of injury or loss. For many decisions,risk is unimportant, since the scope of a possible loss is small and/or the probabilityof suffering that loss is judged to be low. However, in order to withstand adverseoutcome and to avoid jeopardising the existence of an enterprise as the base forincome generation, risk has to be managed effectively, within the capacity of theindividual, business or group (Hardaker, Huirne and Anderson 1997).
Risk in agriculture is not only of concern to the individual farmer. It is also ofimportance to society as a whole, as risk-averse behaviour of farmers can lead to anallocation of farm resources which is not efficient, resulting in a sub-optimal overallallocation of resources and consequently lower overall welfare. For example, risk-averse farmers might not adopt a new productivity-enhancing technology because ofpotential risks associated with it, which results in a lower increase in output thanpossible.
����� &DWHJRULHV�RI�ULVN�LQ�DJULFXOWXUH
Some risks have to be more explicitly taken into account than others. If potentiallosses are big, more attention has to be paid to the choice among the availablealternatives, as the differences between the various outcomes may be significant.
Some risks farmers have in common with other businesses, others are unique tofarming. The most important risks can be classified as follows (Hardaker, Huirneand Anderson 1997; USDA 1999):
• +XPDQ�RU�SHUVRQDO�ULVNV relate to death, illness or injury of the farm operatorand/or its labour force. These risks are common to all business operators andemployees. In the European Union, basic coverage for personal risk is normallyprovided by sector specific or general social security systems. Additionalcoverage is available on insurance markets.
• $VVHW� ULVNV are those associated with theft, fire and other loss or damage ofequipment, buildings and other agricultural assets used for production. Losses arenormally covered by insurance or, in case of catastrophic events, public disasteraid may contribute to reduce asset losses.

13
• 3URGXFWLRQ� RU� \LHOG� ULVNV� are often related to weather (excessive/insufficientrainfall, hail, extreme temperatures), but also include risks like plant and animaldiseases. Yield risk is measured by yield variability, the randomness relative tothe mean value in a yield series. Yield variability for a given FURS differsconsiderably from region to region depending on climate, soil type andproduction method. It can be measured at farm, regional or country level.Aggregate data can, to a considerable extent, mask variability at lower levels ofaggregation or at the individual farm level. “Yield” risk is smaller in the OLYHVWRFNVHFWRU for most producers, as weather has a smaller influence. The risks mainlystem from disease, mechanical failure in confinement operations and variabilityin weight gain.��
• 3ULFH�ULVN�is the risk of falling output and/or rising input prices after a productiondecision has been taken. Price risk is measured by price randomness. As opposedto yields, prices do not follow clear trends. Price volatility, of course, is for manyproducts mitigated by measures of price support. In open markets, prices aregenerally more highly correlated across different regions than yields.
• ,QVWLWXWLRQDO� ULVN is the risk associated with changes in the policy framework(agricultural DQG� other policies) which intervene with production and/ormarketing decisions and in the end negatively affect the financial result of a farm.Institutional risks also include contracting risk, e.g. the risk of breach of contract.
• )LQDQFLDO� ULVNV include rising cost of capital, exchange rate risk, insufficientliquidity and loss of equity.
The various risks are often interrelated. For example, the institutional risk of achange in price support has an influence on price risk. Likewise, imposingenvironmental restrictions has an impact on yield risk. Risks of all categories havean effect on the income situation of a farm household.
����� 6RPH�IDFWV�DERXW�\LHOG��SULFH�DQG�RXWSXW�YDULDELOLW\�LQ�(8�DJULFXOWXUH
Meuwissen, Huirne and Hardaker (1999a) examined \LHOG�YDULDELOLW\ for individualfarms in selected regions of Europe2 and found coefficients of variance3 between 5per cent for milk (in the Netherlands) and 30 per cent for potatoes (Baden-Würtemberg, Germany). However, the authors expect that yield risk will increase,for example as a result of stricter rules for the use of fertilisers and medicines.
2 Data from 1989 to 1995 were used.
3 CV = SD/x*100;with CV = coefficient of variance
SD = standard deviationx = mean
It has to be taken into account that CV (measuring variability) overestimates risk (defined asuncertainty of outcomes), as variability to a certain extent can be predicted and can therefore not beconsidered as risk.

14
Following a similar approach, the Farm Accountancy Data Network has been usedto up-date this analysis and to produce results for all EU regions with relevant dataavailable. Yield data of individual farms have been analysed for common wheat(including spelt), potatoes, sugar beet and milk. Only those FADN farms werechosen for the sample which had reported yield data over the whole 9 years period4
1989-1997. For the calculation of variability, the effects of productivity increaseswere not excluded. Table 2.1 shows which regions had the highest and lowestvariability over that period of time. Maps showing detailed results can be found inAnnex 1.
7DEOH�����+LJKHVW�DQG�ORZHVW�\LHOG�YDULDELOLW\�IRU�VHOHFWHG�SURGXFWV����������
Region with …Product «KLJKHVW�YDULDELOLW\ «ORZHVW�YDULDELOLW\Wheat and spelt $OHQWHMR�H�GR�$OJDUYH
������,OH�GH�)UDQFH�����
Potatoes &HQWUH������
9DOHQFLD�����
Sugar beet 3LHPRQWH������
1HWKHUODQGV�����
Milk 7RVFDQD������
6ZHGHQ�������3URYHQFH������
1 1995-1997In brackets: Yield variability in per cent6RXUFH��)$'1
3ULFH�YDULDELOLW\ is expected to rise on European markets in the context of CAP-reform and increasing trends towards agricultural trade liberalisation. Tradeliberalisation aims at increasing price transmission from world markets to domesticmarkets and therefore bringing domestic prices more under the influence offluctuating world market prices.
Meuwissen, Huirne and Hardaker (1999a) found that during the period 1986-96potato prices at the Amsterdam Exchange Market showed a strong variability (CVof 49.9 per cent). During that period price variability was less extreme for pig meat(16.8 per cent).
Eurostat price data at national level (1985-99) confirmed strong variability forpotatoes in particular in Austria, Germany, the Netherlands, Belgium and the U.K.,while price fluctuated less in Italy and Greece. Due to CAP price support, nationalvariability of soft wheat prices was very limited in all EU Member States. Takingapples, tomatoes and cauliflower as examples for fruit and vegetables, no clearregional distribution of price variability could be identified. As expected, pricevariability for cow milk was much lower than for pig meat and for eggs.5 Regionaldistribution of price variability for selected products is visualised by the maps inAnnex 1.
4 For the new German Länder, some Italian, Spanish and Portuguese regions a time period shorter than 9years had to be used. Data for Austria, Sweden and Finland only cover the period 1995-97.
5 Results for Finland are strongly biased through the accession effect.

15
Finally, some coefficients of variance have been calculated on FADN total outputdata for individual farms. Total output showed the lowest variation over years in theItalian Molise region (8.3 per cent) and the highest variation in certain Spanish andPortuguese regions.
Results for Austria, Sweden and Finland might underestimate output variabilitysince they are based only on 1995-97 data.
����� 6RXUFHV�RI�ULVN�DV�SHUFHLYHG�E\�IDUPHUV
Risk exposure REMHFWLYHO\ varies from farmer to farmer. Whether a strategy to copewith risk is adopted and what elements it encompasses, however, does not onlydepend on objectively determined risk exposure but also on how risks areVXEMHFWLYHO\ perceived�by the individual farmer. Risk perception of course can varyfrom farmer to farmer depending for instance on the farmer’s own experience andon the degree of risk-aversion.
In a survey on risk perception in the Dutch livestock sector, carried out in 1997,price risk was identified as the major source of risk, followed by personal andinstitutional risk. Financial risks were perceived as the least important (Meuwissen,Huirne and Hardaker 1999a).
For the U.S., a survey carried out in 1996 showed that risk perception differeddepending on the production programme. Wheat, corn and soybean producers, forexample, were most concerned about yield and price risks, whereas livestockfarmers perceived institutional risks as particularly high (USDA 1999).
When assessing the possibility of success of new risk-management tools (e.g. acommercial insurance product), it is important to keep in mind that objectivelydetermined risk exposure and risk perception can differ considerably. While aninstrument is bound to be successful on REMHFWLYH grounds, a good take-up rate is notautomatically guaranteed, as the SHUFHLYHG risk might be low (problem of ³FRJQLWLYHIDLOXUH´, section 4.1.1).

16
��� 5,6.�0$1$*(0(17�722/6�)25�)$50(56
Two types of risk management strategies are normally distinguished: (1) strategiesconcerning on-farm measures and (2) risk-sharing with others (Meuwissen, Huirne andHardaker 1999a).
In a first step, risks have to be quantified and the effectiveness of different measures hasto be assessed. The adoption of a strategy basically requires the evaluation of the trade-off between the costs of reducing risk exposure and expected returns (USDA 1999). Theadopted strategy will differ according to the relationship between the various risks faced,the costs of the various instruments, the farmer’s income and wealth (his capacity to bearrisk) as well as his risk perception (Meuwissen 2000).
2Q�IDUP�VWUDWHJLHV concern farm management and include selecting products with lowrisk exposure (e.g. products benefiting from public intervention), choosing products withshort production cycles, diversifying production programmes or holding sufficientliquidity.
5LVN�VKDULQJ� VWUDWHJLHV include marketing contracts, production contracts, verticalintegration, hedging on futures markets, participation in mutual funds and insurance.
Other strategies include relying on public assistance (disaster or emergency aid) orincreasing the share of income from sources outside agriculture.
����� 'LYHUVLILFDWLRQ
The idea behind diversification is that returns from various enterprises or activitiesare not perfectly positively correlated. A favourable result in one enterprise mayhelp to cope with a loss in another enterprise. Diversification thus reduces overallrisk. However, there may be a trade-off with cost increasing effects linked to thisstrategy, i.e. higher cost for additional equipment and costs in terms of foregoneeconomies of scale which would alternatively be achievable with higher degrees ofspecialisation. Lack of managerial expertise and market outlets as well as climate,soil quality or the availability of water may limit the opportunities for diversificationof farm activities.
Evidence suggests that in European agriculture the trend has not gone in thedirection of diversification: Between 1975 and 1997, the share of specialised farms6
in total farms increased from 68 per cent to 83 per cent (Table 3.1).
6 Holdings earning a main source of income (more than two-thirds of their total revenue) from a singletype of production.

17
7DEOH���� 6WUXFWXUDO�GHYHORSPHQW�RI�(8���IDUPV�E\�IDUP�W\SH�����������
���� ���� ����)DUP�7\SH
1XPEHULQ�����
LQ���RIWRWDO
QXPEHULQ�����
LQ���RIWRWDO
1XPEHULQ�����
LQ���RIWRWDO
6SHFLDOLVHG- field crops- horticulture- permanent crops- grazing livestock- pig and poultry
�����1 049
1251 0981 584
86
��182
19271
�����1 104
1241 3091 310
63
��233
27271
�����956100
1 2071 074
52
��232
30261
1RQ�VSHFLDOLVHG- mixed cropping- mixed livestock- crops – livestock
�����619464808
��118
14
���414165412
��838
���31496
292
��827
7RWDO ����� ��� ����� ��� ����� ���6RXUFH��(XURVWDW
Diversification includes off-farm strategies as well. Taking-up off-farm employmentwhich reduces dependency form agricultural income, can be considered such astrategy, although off-farm employment may have other reasons as well, forinstance, the fact that agricultural income is too small to support a whole family.
In the EU, the share of farmers having a gainful activity outside agriculture isconsiderable. It reached 29 % in the year 1997 with some differences amongMember States. The available statistics show the highest proportion of part-timefarmers with off-farm income sources in Sweden (54 %), Finland (49 %), Germany(45 %), and Austria (39 %), whereas Belgium and Luxembourg (17 %) can be foundat the lower end. The Mediterranean countries are in the middle field with Spain (28%), Greece (27 %), Portugal (33 %), and Italy (24 %).
����� &RQWUDFWV�DQG�YHUWLFDO�LQWHJUDWLRQ
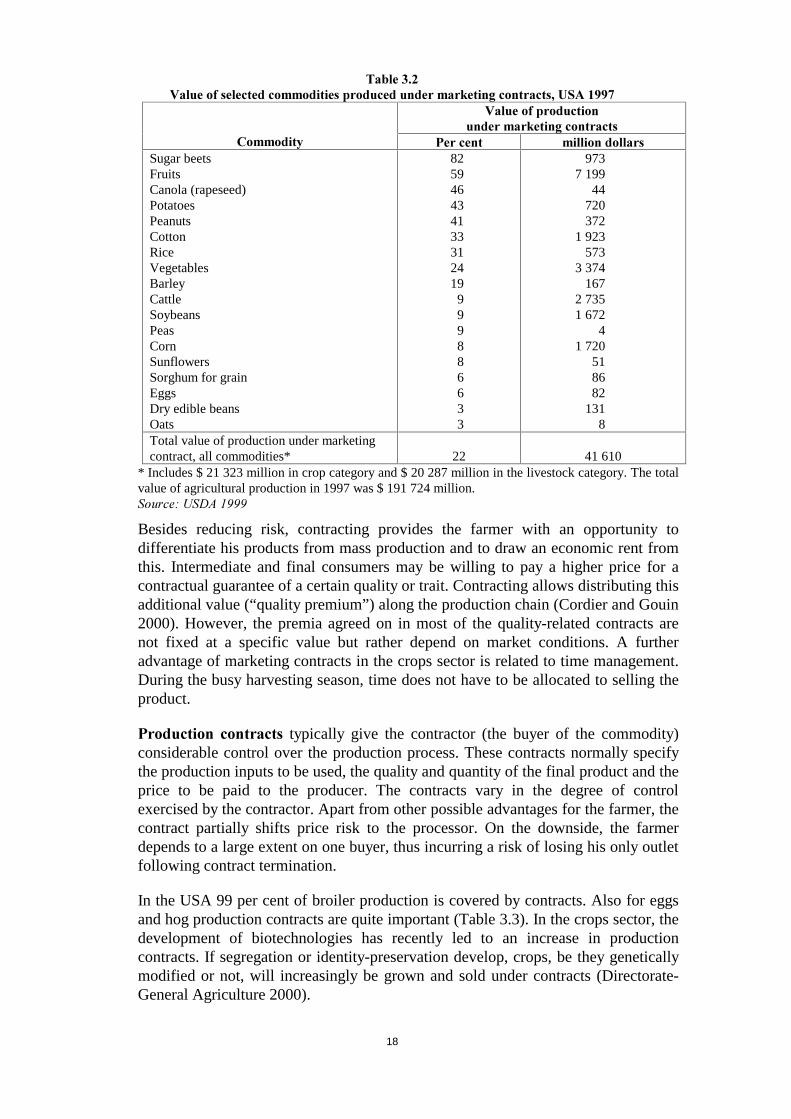
In a PDUNHWLQJ�FRQWUDFW, a farmer agrees to sell a commodity at a certain price to abuyer before the commodity is ready to be marketed. The farmer retains fullresponsibility for all production management decisions. The contracts can take manyforms. They can be based on a fixed price, or alternatively depend on thedevelopment of the commodity’s futures price. The latter type of contract does noteliminate price risk completely. Price risk is zero only in those cases, where theexact price to be paid to the producer upon delivery is fixed. The (opportunity) costsborn by the farmer result from forgoing the opportunity of achieving a higher priceon the open market. For the U.S. some 1997 data about the importance of marketingcontracts are available (Table 3.2).
18
7DEOH����9DOXH�RI�VHOHFWHG�FRPPRGLWLHV�SURGXFHG�XQGHU�PDUNHWLQJ�FRQWUDFWV��86$�����
9DOXH�RI�SURGXFWLRQXQGHU�PDUNHWLQJ�FRQWUDFWV
&RPPRGLW\ 3HU�FHQW PLOOLRQ�GROODUVSugar beetsFruitsCanola (rapeseed)PotatoesPeanutsCottonRiceVegetablesBarleyCattleSoybeansPeasCornSunflowersSorghum for grainEggsDry edible beansOats
825946434133312419
999886633
9737 199
44720372
1 923573
3 374167
2 7351 672
41 720
518682
1318
Total value of production under marketingcontract, all commodities* 22 41 610
* Includes $ 21 323 million in crop category and $ 20 287 million in the livestock category. The totalvalue of agricultural production in 1997 was $ 191 724 million.6RXUFH��86'$�����
Besides reducing risk, contracting provides the farmer with an opportunity todifferentiate his products from mass production and to draw an economic rent fromthis. Intermediate and final consumers may be willing to pay a higher price for acontractual guarantee of a certain quality or trait. Contracting allows distributing thisadditional value (“quality premium”) along the production chain (Cordier and Gouin2000). However, the premia agreed on in most of the quality-related contracts arenot fixed at a specific value but rather depend on market conditions. A furtheradvantage of marketing contracts in the crops sector is related to time management.During the busy harvesting season, time does not have to be allocated to selling theproduct.
3URGXFWLRQ� FRQWUDFWV typically give the contractor (the buyer of the commodity)considerable control over the production process. These contracts normally specifythe production inputs to be used, the quality and quantity of the final product and theprice to be paid to the producer. The contracts vary in the degree of controlexercised by the contractor. Apart from other possible advantages for the farmer, thecontract partially shifts price risk to the processor. On the downside, the farmerdepends to a large extent on one buyer, thus incurring a risk of losing his only outletfollowing contract termination.
In the USA 99 per cent of broiler production is covered by contracts. Also for eggsand hog production contracts are quite important (Table 3.3). In the crops sector, thedevelopment of biotechnologies has recently led to an increase in productioncontracts. If segregation or identity-preservation develop, crops, be they geneticallymodified or not, will increasingly be grown and sold under contracts (Directorate-General Agriculture 2000).

19
7DEOH����9DOXH�RI�VHOHFWHG�FRPPRGLWLHV�SURGXFHG�XQGHU�SURGXFWLRQ�FRQWUDFWV�
86$�����
9DOXH�RI�SURGXFWLRQXQGHU�SURGXFWLRQ�FRQWUDFWV
&RPPRGLW\ 3HU�FHQW 0LOOLRQ�GROODUVBroilersEggsHogsCattleVegetables
99373314
8
6 664773
3 0974 2301 145
Total value of production under productioncontracts,all commodities*
10 18 215
* Includes $ 1 627 million in crop category and $ 16 588 million in the livestock category. The total value of agriculturalproduction in 1997 was $ 191 724 million6RXUFH��86'$�����
A YHUWLFDOO\�LQWHJUDWHG firm retains ownership control of a commodity across twoor more levels of activity. There are many complex reasons to vertically integrate,risk reduction is only one of them. Vertical integration helps to reduce risksassociated with a variation in quantity and quality of inputs (in the case of backwardintegration) or outputs (in the case of forward integration). Vertical integration ismore common in the livestock sector, with integration backward into inputs (feedmanufacturing) or in the fresh vegetables sector with forward integration intosorting, assembling and packaging.
����� +HGJLQJ�LQ�IXWXUHV�DQG�RSWLRQV
On spot or cash markets, prices are set for goods that are immediately available.Production and marketing contracts as well as futures markets add the timedimension to these markets. They allow users to hedge their price risk by locking inthe price of a commodity they wish to purchase or sell at a future date. )XWXUHVPDUNHW� FRQWUDFWV differ in three important issues from production and marketingcontracts: Firstly, they are standardised in terms of contract terms and thus they canbe more easily traded. Secondly, they are traded in organised exchanges under rulesand regulations. Thirdly, while production and marketing contracts usually involvephysical delivery of goods at maturity, in futures markets this is the exception(Larson HW�DO� 1998).
Trading in futures enables shifting risk from a firm that desires less risk (the hedger)to someone who is willing to accept the risk in exchange for a profit. A hedger canbe a farmer, a trader or a processor, who wants to “lock in” a price for a commodityhe is going to sell or buy on the spot market at a later stage. Futures contracts help toprotect against price risk, as futures and cash prices converge against the end of thedelivery period, resulting in losses and gains in the two markets offsetting eachother.

20
A farmer would usually use the instrument as follows: At the beginning of thegrowing or feeding period, he sells a futures contract, thus entering an obligation tosell after the end of the production cycle a certain quantity of a commodity at acertain price. The futures position (“short futures position”) is held until the productis ready for sale. Before the end of the delivery period of the futures contract, thefarmer typically buys an off-setting futures position (“long futures position”). Thecommodity itself is then traded through its usual marketing channels. Losses (gains)in the expected value of the output due to price changes tend to be offset by gains(losses) in the value of the futures position. Thus, the farmer is able to “lock-in” acertain price for his commodity.
An RSWLRQ� gives the holder the right (without incurring the obligation) to take afutures position at a specified price (called the “strike” price) at a specific time. Asopposed to futures, options giving the right to sell a futures contract do not constrainpotential profits resulting from increasing prices. Such options give security againstthe implications of decreasing prices. The costs of achieving this security arematerialised in the price to be paid for the option.
Hedging largely eliminates price risk, but leads to what is called EDVLV�ULVN. Basis isthe technical term for the difference between the price of a commodity on the spotmarket and the price of the corresponding futures contract. The variability of thisdifference introduces a new category of risk associated with futures markets. Thebasis reflects differences in price across space (transportation costs, exchange rates),time (storage costs), and quality (difference between actual quality and standardquality specified in the futures contract).
The effectiveness of hedging on futures markets may also be reduced by yieldvariability. Uncertainty about effective yields makes it not advisable to sell a futurescontract for the total expected output, because of the potential obligation to buyadditional quantities in order to fulfil a mature contract. Generally the effectivenessof hedging to reduce risk diminishes as yield variability increases.
The effectiveness of hedging furthermore depends on the correlation between yieldand price for a given commodity. If there is a strong negative correlation betweenyield and price (a “natural hedge”, with yield and price fluctuations offsetting eachother), hedging becomes - because of the cost associated with it - inefficient. Withincreasing trade liberalisation negative correlation will decrease.
Futures contracts were traded as early as 1730 in Japan (Osaka rice futures). In1848, trading of grain futures was started at the Chicago Board of Trade (CBOT).Meat and livestock futures contracts were introduced at the Chicago MercantileExchange in 1957 (Sarris 1997; Larson HW�DO� 1998).
On the US grain markets, the largest groups of hedgers are the grain merchants andprocessing firms (Sarris 1997). A survey in Montana suggests that in the early 1990sless than 15 per cent of the crop producers in that area used futures, and about 19 percent used options (Sakong et al. 1993). In the mid-1990s the direct use of futures byUS farmers still remained modest compared to other risk management tools. Lessthan 30 per cent of the farmers in the Corn Belt and in the South-East productionregions used them, in the Southern Plains less than 15 per cent (Harwood 2000).

21
Based on the model of the Chicago Board of Trade (CBOT), futures contracts foragricultural commodities developed in other countries around the world. In the EUthe main markets are:
• the French 0$7,) (Marché A Terme d´Instruments Financiers) (futures andoptions for rape-seed, futures for milling wheat, corn and rape-seed meal)
• the British /,))( (London International Financial Futures and OptionsExchange) (futures and options for cocoa, coffee, white sugar, wheat, barley,potatoes)
• the Dutch $PVWHUGDP� ([FKDQJHV� IXWXUHV� SURGXFWV (futures and options forpotatoes, futures for hogs and piglets)
• the German :DUHQWHUPLQE|UVH�+DQQRYHU (futures in potatoes, hogs, wheat, rape-seed, rape-seed meal and rape-seed oil)
• the Spanish )XWXURV� GH� &LWULFRV� \� 0HUFDGHULDV� GH� 9DOHQFLD (Citrus Fruit andCommodity Futures Market).
Furthermore, there is a project for setting up a futures market for olive oil in Spainin the course of 2001.
There are huge differences in trade volumes between the North American and theEuropean exchanges (table 3.4). The American data show the potential of theEuropean exchanges. However, this potential should not be overestimated in theshort run. The use of futures requires considerable investment in know-how andinfrastructure and traders will only move to the European futures market once theyhave reached a minimum liquidity.
The main obstacle for the establishment of futures markets (including markets forderived products) in Europe has been the CAP-induced relative price stability formajor commodities (resulting in little interest from both the farmers´ as well as thespeculators´ side) (Cordier 1998). As price-volatility on the European market hasrisen in the wake of the 1992 CAP-reform and is further expected to rise with theimplementation of Agenda 2000 and further trade liberalisation, the conditions forthe development of futures markets and other market-based risk management toolsare improving. Consequently, several new products have been introduced to themarket over the last few years. MATIF´s corn futures, rape-seed meal futures andrape-seed options, for example, were all introduced in 1999.
Whereas futures and options have significant advantages and potentially have animportant role to play in the future, they also have a number of limitations. Theyonly deal with short to medium-term risks of market downturns (as other riskmanagement tools like insurance) and their use requires considerable investment inknow-how and infrastructure.

22
7DEOH����9ROXPH�WUDGHG�RQ�VHOHFWHG�H[FKDQJHV�UHODWLYH�WR�SURGXFWLRQ�LQ�WKH
UHVSHFWLYH�FRXQWU\����������LQ���
&RPPRGLW\ ([FKDQJH &RXQWU\ ���� ���� ���� ���� ���� ���� ���� ���� ���� ����
Wheat CBOT USA 527 795 709 630 780 1135 1182 1019 1115 1427
Wheat KCBT USA 208 357 272 281 324 357 402 390 394 504
Wheat LIFFE UK 23 45 49 63 71 72 86 64 67
Wheat MATIF France 2.0 5.2 5.8
Wheat WTB Germany 2.0
Wheat SFE Australia 1.1 1.3 1.6 1.4
Barley LIFFE UK 20 17 10
Corn CBOT USA 720 726 546 904 574 1021 1063 922 809 833
Rape-seed WCE Canada 427 386 431 354 323 334 530 434 408 372
Rape-seed MATIF France 95 105 109 139 156
Rape-seed WTB Germany 1
Soybeans CBOT USA 2674 2269 2054 3115 2137 2440 2990 2704 2268 2361
Potatoes AEX Netherlands 40 28 28 50 81 56 23 24 35 21
Potatoes LIFFE UK 7.2 7.7 4.5
Potatoes WTB Germany 1.2 0.8
Hogs AEX Netherlands 26 36 30 26 25 19 31 42 27 25
Hogs WTB Germany 1.1 3.5
6RXUFH��'LUHFWRUDWH�*HQHUDO�(FRQRPLF�DQG�)LQDQFLDO�$IIDLUV��(XURSHDQ�&RPPLVVLRQ�������
The following box lists several conditions that have been identified as being pivotalfor a successful establishment of futures and options markets:

23
Conditions for the successful establishment of futures and options markets
• Substantial commodity price variability
Without price variability market participants would have no incentive to use themarket for hedging and the market would not attract any speculators, as potentialprofits would be small.
• Large number of potential traders and speculators (to ensure liquidity of the market). Ifthe trade volume is too small, there is a danger that few transactions can influence theprice significantly.
• Products with standardised grades and quality
Futures relate to standardised commodities (size, grade, place of delivery, date ofmaturity). Products with a large number of grades and quality variations are thereforenot entirely suitable for successful futures contracts (e.g. rice, as opposed to soybeans,wheat, corn)
• Limited government intervention in pricing and trade
Transactions in commodity markets must be unhindered by physical or legal barriersand government controls.
• The existence of a regulatory body to safeguard the integrity of the markets andpreventfraud and manipulation
• Good transportation and telecommunications systems
• A well-functioning financial system
• An effective legal environment
• Political and macro-economic stability.
6RXUFH��6DUULV�����
����� ,QVXUDQFH�±�FRQGLWLRQV�DQG�W\SHV
The idea behind insurance is that of risk pooling. Risk pooling involves combiningthe risks faced by a large number of individuals who contribute through premia to acommon fund which is used to cover the losses incurred by any individual in thepool.
������� %DVLF�UHTXLUHPHQWV�IRU�LQVXUDQFH
In order for a risk to be insurable, two basic requirements have to be met:Managing the adverse effects of “asymmetric information” and overcomingthe implications of “systemic risks”. These two concepts are explained in thefollowing box.

24
$V\PPHWULF�LQIRUPDWLRQ
Asymmetric information relates to the problem that the buyer of insurance and theinsurance company may not have the same information as regards the probabilityof losses occurring. Asymmetric information has two dimensions:
Adverse selection occurs if those more at risk buy more insurance than others,without the insurance company being aware of this. A common tool insurancecompanies use to minimise adverse selection is to ask the insured to disclose anyfactors that may lead to above normal risk. Based on that information premia canbe differentiated for different classes of risk.
Moral hazard: In the case of insurance, moral hazard refers to an individual´schange in behaviour after having taken out an insurance policy. The change inbehaviour results in an increase in the potential magnitude and/or probability of aloss. Tools insurance companies generally use to minimise moral hazard include:
• Deductibles or co-payments (the insured has to bear part of the loss: a fixedamount or a percentage of the total loss);
• No-claim bonuses (premium discounts when over a certain period of time noclaims are made);
• Checks to verify whether the insured takes the precautionary measures agreedupon to prevent losses;
• Indemnification based on an objective index which cannot be influenced bythe insured.
6\VWHPLF�ULVN
As opposed to risks like fire and burglary, systemic risks are dependent risks: a lotof people suffer a loss at the same time. Systemic risks result in many peoplemaking a claim at the same time with the effect that the premia paid into a poolare not sufficient to cover the loss incurred, which may threaten the solvency ofthe insurance pool. An example for systemic risks is price risk. All producerssuffer from price downturns at the same time. Measures insurance companies cantake to deal with systemic risks include re-insurance, geographic spreading andthe use of capital markets.
Risks are insurable, if the following basic conditions are fulfilled (Skees1997, Skees and Barnett 1999):
• Symmetric information: The insurer and the insured have (nearly) thesame information as regards the probability distribution of the risk (theprobability of a bad outcome). This is normally not the case, the mainproblems being moral hazard and adverse selection. Therefore, insurancesolutions are only viable and can be offered at reasonable cost, if theseproblems can be adequately dealt with (see box).
• Independent risks: Risks should be (nearly) independent across insuredindividuals. If risks are systemic (dependent), special measures have to betaken in order to make insurance solutions viable (see box above).
• Large number of exposure units: The law of large numbers allows anaccurate prediction of average future losses and the calculation of thepremium.

25
• Calculable chance of loss: In order to fix the premium rates, the insurancecompany must be able to estimate both average frequency and averageseverity of loss. For low-probability risks with potentially catastrophicoutcomes it is difficult to fix a rate.
• Actual losses occurring must be determinable and measurable.
• In the perception of the potential buyer of a policy, potential losses mustbe significant, otherwise he will bear the risk himself. At the same time,premia must be economically affordable.
������� 7\SHV�RI�LQVXUDQFH�LQ�DJULFXOWXUH
Many agricultural risks are considered to be LQ�EHWZHHQ� ULVNV which areneither perfectly independent nor perfectly correlated (systemic), forexample yield and price risk. Insurance solutions for agriculture also have toinclude provisions to deal with problems of asymmetric information (moralhazard and adverse selection).
In the light of these considerations, the feasibility of various types ofinsurance products are discussed (the following is mainly based onMeuwissen, Huirne and Hardaker, 1999a).
<LHOG�LQVXUDQFH is mainly feasible for crops. Livestock products in generalcause yield measurement problems, due to the fact that output is produced ata very fast (e.g. milk) or a very slow pace (e.g. “production” of feeder calves)and because there are no clear, objective “harvesting” times (which increasesthe scope for moral hazard). However, not all crops have objectiveharvesting times, either. For such crops, for example horticultural crops inglasshouses, insurance is more difficult (Meuwissen, Huirne and Hardaker1999a).
Yields are normally insured for named (known) perils, such as hail, whichallows the calculation of the probability distribution of a loss occurring,based on historic data. Insurance can be based on individual yields or areayields. In the first case, indemnities are paid, if the individual loss fallsbelow a pre-determined trigger yield, whereas in the latter case a farmerwould only receive a payment, if the area yield falls below a trigger yield.When the yield insured is area-based, problems of moral hazard and adverseselection are less important. However, an area-based solution is onlyattractive, if yields are well correlated, otherwise the degree of risk reductionfor an individual farmer might not be sufficient to make participationattractive. If individual yields are insured, solutions have to be found to copewith problems of asymmetric information (deductibles, checking ofbehaviour etc.).
The availability of yield insurance can lead to a shift of resources to thoseproducts, for which yield insurance is available an consequently an increasein production levels and pressure on market prices.

26
:K\�KDYH�SULYDWH�FRPSDQLHV�VXFFHVVIXOO\�RIIHUHG�KDLO�LQVXUDQFH�EXW�QRW�PXOWL�SHULO�FURS�LQVXUDQFH"
1. With hail damage, the source of the damage can be clearly identified as “anact of God” as opposed to an “act of bad management” (Skees 1999).Therefore, insuring hail doesn´t pose any significant problems of adverseselection. The insurer and the insured have (nearly) the same information asregards the probability distribution of the risk (the probability of a badoutcome).
2. The losses from hail better meet the condition that losses among insuredclients should be as independent as possible in a statistical sense. Therefore,hail is not a fully systemic risk, which makes it insurable as opposed to riskswhich are highly correlated across many producers.
&DWDVWURSKLF�ORVVHV as a result of natural disasters or epidemic diseases posespecial problems for insurance. Natural disaster risk within a certain regionis a highly correlated risk between the farmers of that region, with a lowprobability of very high losses. There are several reasons why it is difficult todevelop insurance products to cover such risks (Skees 1997):
• Systemic nature of the risk. If re-insurance or state guarantees are notavailable, the nature of the risks makes it necessary for an insurancecompany to charge high premia (which may make the productunaffordable for many farmers) and to build up substantial capitalreserves.
• Insufficient relevant historical data available to calculate a soundpremium due to the infrequency of such events.
• Crowding out by Government providing ad-hoc disaster payments whichstifles the development of insurance products.
As natural disasters, epidemic diseases have a systemic character and dataconcerning the outbreaks are rare. In the case of animal diseases and asopposed to natural disasters, farmers can influence the chance of an outbreakof a disease by taking appropriate precautionary measures. Furthermore, stateinvolvement is important with respect to both legislation and covering directlosses resulting from outbreaks of animal diseases (value of destroyedanimals).
As governments normally cover direct losses, losses which need to becovered are those resulting from business interruption (empty buildings),supply and delivery problems (because of movement restrictions) andrepopulation (Meuwissen, Huirne and Hardaker, 1999a; Meuwissen 2000).
Whether such private insurance products against epidemic diseases can bedeveloped depends on - as in the case of natural disasters - whether sufficientdata is available for calculating premia and whether sufficient re-insurancecapacity or state guarantees are available.

27
3ULFH�LQVXUDQFH is feasible only for those products, for which objective pricedata are available. To avoid moral hazard and adverse selection problems,loss assessment should be based on a price that cannot be influenced by thefarmer (futures price, spot market price). The major obstacle for priceinsurance is the high correlation of prices which is associated with asystemic risk. Generally, systemic risks can be dealt with on options andfutures markets. Thus, whether price insurance is offered or not would alsodepend on whether such futures and options markets are available or not aswell as on the availability of sufficient re-insurance capacity (see below forre-insurance).
If losses resulting from a loss of quality are excluded from coverage, thenprice insurance provides less protection for the farmer. However, includingloss of quality may involve significant moral hazard problems, as qualitydepends to a certain extent on management decisions (Meuwissen, Huirneand Hardaker 1999).
5HYHQXH�LQVXUDQFH is a combination of price and yield insurance. It has thepotential advantage of being cheaper than either price or yield insurance, asthe risk of a bad outcome is smaller (low yields may be offset by high pricesand vice versa).
Revenue insurance can be set up on a commodity-per-commodity basis orfor a portfolio of commodities. The latter could again be cheaper for thefarmer, because low revenues from one enterprise are likely to be partlyoffset by higher revenues from another (if the revenues are not positivelycorrelated).
However, such insurance would only be feasible if there is knowledge aboutthe correlation between the different commodities. In order to offer a revenueinsurance, an insurance company must be able to determine the jointprobability distribution of price and yield risks and find solutions toovercome moral hazard and adverse selection problems. In addition, accessto objective price DQG yield measures is needed.
,QFRPH�LQVXUDQFH is potentially more attractive to farmers than other formsof insurance (e.g. yield, price), because it deals with losses affecting farmer´swelfare more directly (Meuwissen 2000). It could be based for instance onnet farm income of family workers (farm revenue - including subsidies -minus variable costs, taxes, depreciation, rent, interest and compensation ofemployees).
Insurance of individual income risks poses considerable problems of moralhazard and adverse selection. Potential losses do not only occur by accidentbut depend to a large extent on how well a farmer manages his business.Furthermore, a farmer can easily manipulate certain elements influencing hisincome (e.g. compensation of employees, operating costs, inventories).These two factors make it difficult for an insurance company to calculate theprobability distribution of a bad outcome and to fix a sound premiumaccordingly.

28
������� 5H�LQVXUDQFH�DQG�LQVXUDQFH�SRROV
5H�LQVXUDQFH is insurance purchased by primary insurers to pass-on the partof the risk that is beyond their underwriting capacity7. Re-insurance isimportant for insurance companies which cover correlated risks and are thusrunning the risk of having to cover big losses. Without re-insurance, premiawould have to be set at a very high level to build up enough reserves in orderto cover potentially high losses.
Two basic models for re-insurance dominate:
• Proportional re-insurance (Quota share arrangements): Insurer and re-insurer share premia and risk. The re-insurer assumes an agreed-upon,fixed percentage of all the insurance policies written by a direct insurer.The quota determines how premia and losses are distributed betweendirect insurer and re-insurer.
• Non-proportional re-insurance:
a) Excess of loss: re-insurer covers up to a certain amount any part of aloss resulting from a single catastrophic event that exceeds an agreeddeductible.
b) Stop-loss: re-insurer covers up to a certain amount any part of a totalannual loss that exceeds an agreed deductible.
In order to be financially viable, a re-insurance company has to diversify therisk it takes by creating a large and varied insurance pool (diversification ofrisk-bearing activities). Typically, a re-insurer would cover a wide range ofdifferent risks in locations all over the world in order to reduce the variabilityin losses from its portfolio.
The availability of re-insurance capacities is generally limited. There isevidence that re-insurers tend to have “short memories”, resulting in the factthat after a catastrophe either premia rise substantially or companies pull outof agreements (Skees and Barnett 1999).
7 Underwriting capacity can be defined as the possibility to cover losses beyond the premia income in agiven year.

29
In the US there are QHZ�SURGXFWV developing which could be an alternativeto re-insurance, most notably catastrophic bonds and catastrophic insuranceoptions. Catastrophic bonds provide capital contingent on the occurrence ofa disaster. Buyers of such bonds receive a high rate of return if there are nocatastrophes but lose some or all of their investment in the occurrence of acatastrophe. With catastrophic insurance options, an insurance company canshare risk with market speculators. A futures crop insurance contract basedon USDA estimates of state crop yields for major crop producing states hasso far been unsuccessful, probably because the competition from the federalgovernment which provides subsidised re-insurance, is too strong. Ingeneral, capital market based substitutes for re-insurance are still in theirinfant stages. Today, CAT bonds and CAT insurance options account for lessthan 5 per cent of US re-insurance capacity (Skees and Barnett 1999).
In addition to re-insurance, the creation of LQVXUDQFH�SRROV can be a solutionfor insurers to pass on/spread risk. A pool is set up by insurers to jointlyprovide insurance for certain risks. Risks are covered which an individualcompany alone could not cover. The risks normally covered by such poolsinclude:
• New, unknown risks
• Catastrophic risks
• Infrequent risks - the prediction of the total loss to be expected for acertain period is not possible (law of large numbers does not apply)
• Risks which can only be covered by applying special know-how.
Advantages of an insurance pool include the following:
• Together, the members can provide maximum capacity. Risks can bespread more widely. The more risks can be spread, the less re-insurance isneeded and the cheaper re-insurance therefore is
• The pool can provide optimum safety (screening of applicants, solidarityclause, mutual coverage of risks)
• Combination of know-how
• Fast exchange of information
• Economies of scale.
Two categories of pools exist:
• Co-insurance pools: insurers put together their individual capacities
• Co-reinsurance pools: a group of insurers (normally also including re-insurers) acts as re-insurer which covers a share of the members’ risks.

30
The capacity a company contributes to the pool determines its share inreceipts and indemnities as well as its share in profits and losses.
Risks covered by existing pools include nuclear, civil aviation andenvironmental risks. In the Spanish system of agricultural insurance the co-insurance pool AGROSEGURO plays an important role (section 5.2).
����� 0XWXDO�IXQGV
Mutual insurance schemes are a special case of insurance. Mutual funds are RZQHGE\�WKH�SDUWLFLSDQWV. In the case of a member incurring a loss, the loss will be fullyor partially compensated through the collected money already available in the fundand an additional collection among participants. Premia also have to coveradministrative costs and potentially re-insurance.
If mutuals are organised regionally, the advantage of a fund is that farmers knoweach other and there is a possibility for social control, reducing problems of moralhazard and adverse selection. The disadvantage of regionally organised mutuals isthe fact that there is a danger that many or even all farmers incur losses at the sametime. This could mean for a farmer that he incurs losses and has to contribute to thefund to cover other farmers’ losses at the same time. Solutions for this problem arere-insurance or the teaming up with mutuals in other regions which would cover ashare of the loss.
In the Netherlands, for example, mutual insurance schemes have been developed forcontagious disease outbreaks both in crops (horticulture and potatoes) and livestock(poultry). The Commission has recently proposed the setting up of similar funds inMember States intended to stabilise revenue in the pig sector. These regulatoryfunds would be financed by producers and would enable them to stabilise revenuethrough a system of levies to be collected during periods when their economicsituation is satisfactory. In exchange, payments would be made during periods of adifficult market situation (European Commission 2000).

31
��� $*5,&8/785$/�32/,&<�$1'�5,6.�0$1$*(0(17
����� -XVWLILFDWLRQ�IRU�JRYHUQPHQW�LQWHUYHQWLRQ
������� 0DUNHW�IDLOXUH
A missing market for risk coverage – in addition to other reasons such as theexistence of monopolies, externalities and the “public good” character ofcertain products - can explain why markets may fail in their role to providean efficient allocation of resources (Parkin, Powell and Matthews 2000).
Several risk management tools are offered on the market, even without anygovernment intervention (futures and options, certain insurance products).So far, however, these developments remain quite limited. Several reasonshave been identified why markets for risk-management products may not beavailable or be incomplete. As a result, the market for risk coverage clears atless than socially optimal quantities of risk sharing (Skees and Barnett 1999).Reasons can be found both on the supply DQG�the demand side:
On the GHPDQG�VLGH, three main reasons may result in incomplete or missingmarkets:
• Know-how to make use of certain risk-management tools (e.g. use offutures markets) can be acquired only at high start-up transaction costsand is, therefore, not always available to farmers.
• Farmers perceive the risks they face as being smaller than they actuallyare. This phenomenon is called “cognitive failure” and can result frominsufficient information or misjudgement. Events of low probabilitywhich are associated with high potential losses (catastrophes), are verylikely to be neglected in individual decision making.
• Even if farmers do not underestimate the risks they face, they might counton other safety nets, including off-farm income or government supportprogrammes (disaster aid) in case of significant losses and as aconsequence might not use the risk management tool available.
For the last two reasons, the “willingness to pay” and the demand for risk-management products is reduced. Insufficient “ability to pay” of certaingroups of farmers can also cause insufficient demand for risk-coverage.
On the VXSSO\�VLGH, the reasons vary from product to product:
• ,QVXUDQFH� SURGXFWV might not be offered on the market because theconditions for insurability, such as independence of risk and symmetry ofinformation, are not sufficiently fulfilled (section 3.4). Each violation ofthese conditions increases the marginal cost of insurance and reducesmarket supply (Skees and Barnett 1999).

32
Agricultural risks are often natural hazard risks which means that they arenot independent risks. Only if risks are independent and an insurancecompany can cover a large number of exposure units, it can accuratelypredict the average future losses. Normally natural hazard risks arecorrelated up to a certain degree, meaning that many exposure units(farms) incur losses at the same time, making losses for the insurancecompany highly variable. The higher the variance around expected losscost, the greater the need for including a reserve load in the premium. Aparticular challenge is the insurance of catastrophic risks, which areinfrequent but of high consequence – making it necessary to addcatastrophic loads to the premium. These factors lead to premium ratesthat are much higher than those for largely independent risks.
• Because of potentially big losses incurred in covering agricultural naturalhazard risks, an insurance company will normally try to obtain UH�LQVXUDQFH, which involves additional transaction costs. US evidenceshows that re-insurance can be very expensive, especially aftercatastrophes have happened (Skees and Barnett 1999). Furthermore,agricultural re-insurance markets tend to have limited capacity.Agricultural risks are only re-insured if they fit into the portfolio of re-insurance companies and if the expected profit is high enough. If thecoverage of agricultural risks yields lower returns than other sectors, lesscapacity is attributed to the agricultural sector. The capacity of theindustry is also limited by virtue of the fact that for the highly specialisedre-insurance market entry barriers are quite high.
• For a successful establishment of IXWXUHV�DQG�RSWLRQV�PDUNHWV�severalconditions have to be fulfilled (section 3.3). Farmers need to adopt thenecessary know-how. In addition, it has to be recalled that future marketscan emerge only under the condition of substantial price variability, asufficient number of traders and speculators and products withstandardised grades of well-defined quality.
������� 2WKHU�UHDVRQV�IRU�JRYHUQPHQW�LQWHUYHQWLRQ
Apart from market failure, there are two other possible reasons forgovernment intervention in markets for risk-management products(Meuwissen, Huirne and Hardaker 1999a):
(a) By setting the legal framework for farm operations the governmentinfluences to a considerable extent farmers’ risk exposure, for exampleby creating the legal framework for animal disease control andveterinary measures. To create an incentive for the government to setup an effective risk-minimising framework, it can be argued it shouldbe financially co-responsible for potential losses.
(b) Concerning re-insurance, government intervention has also beenjustified by economic reasons. The government might be able toprovide re-insurance cheaper than the private sector as it is able to raisemore and cheaper capital than the private sector to cover potentiallyhigh losses.

33
����� 2EMHFWLYHV�RI�JRYHUQPHQW�DFWLRQ
The overall objective of government involvement in agricultural risk managementcan be to help UHGXFH farmers´ risk exposure (through diversification, sanitary andphytosanitary measures, price safety net) or help them FRYHU losses resulting fromrisk exposure. Governments can either help to prevent/cover big losses or contributein general to preventing/covering losses, whatever their size.
����� 3ROLF\�LQVWUXPHQWV
������� )LHOGV�RI�DFWLRQ
There are basically four potential fields of action for governments.
Firstly, the setting-up of the necessary OHJDO� IUDPHZRUN for risk reduction(e.g. sanitary and phytosanitary legislation) or the establishment of marketsfor risk management tools. For example, competition policy should take intoaccount that risk pooling between insurance companies (which may result toa certain extent in reduced competition) might be necessary to covercatastrophic risks (section 3.4).
Secondly, governments could help to create the necessary conditions fordeveloping markets providing risk-management tools (PDUNHW�IDFLOLWDWLRQ).For example, they could provide information and training on risk and risk-management tools to farmers.
Thirdly, policy could consider ORZHULQJ�WKH�FRVWV of risk-management tools.As regards insurance, subsidies could be justified if an insurance product -because of the systemic nature of the risk it covers or problems ofasymmetric information - would be otherwise unaffordable for the farmers.Possibilities include subsidies for insurance and re-insurance premia.Subsidies could also be justified on a temporary basis to encourage thedevelopment of market solutions.
Fourthly, governments can also SURYLGH�ULVN�FRYHUDJH�WKHPVHOYHV, e.g. byproviding disaster aid payments, public insurance and re-insurance8, or aspecific safety net. Such approaches could be justified, if private markets forrisk coverage for market failure reasons (as elaborated in section 4.1.1)cannot sufficiently develop to provide the necessary protection for allcategories of farmers (missing or incomplete markets)
It should be noted that both the third and the fourth option can easily turninto income enhancement, if applied with a certain intensity of publicfunding. However, changing the purpose of policies from insurance toincome objectives might come under fire, once awareness is rising as regardsthe potentially serious market and competition distorting effects of suchmeasures.
8 priced at expected or lower than expected cost. The rationale for providing re-insurance (stop-loss orquota share, see section 3.4.3) would be lacking private re-insurance capacity. If it is offered at lowerthan expected cost, it includes a subsidy element.
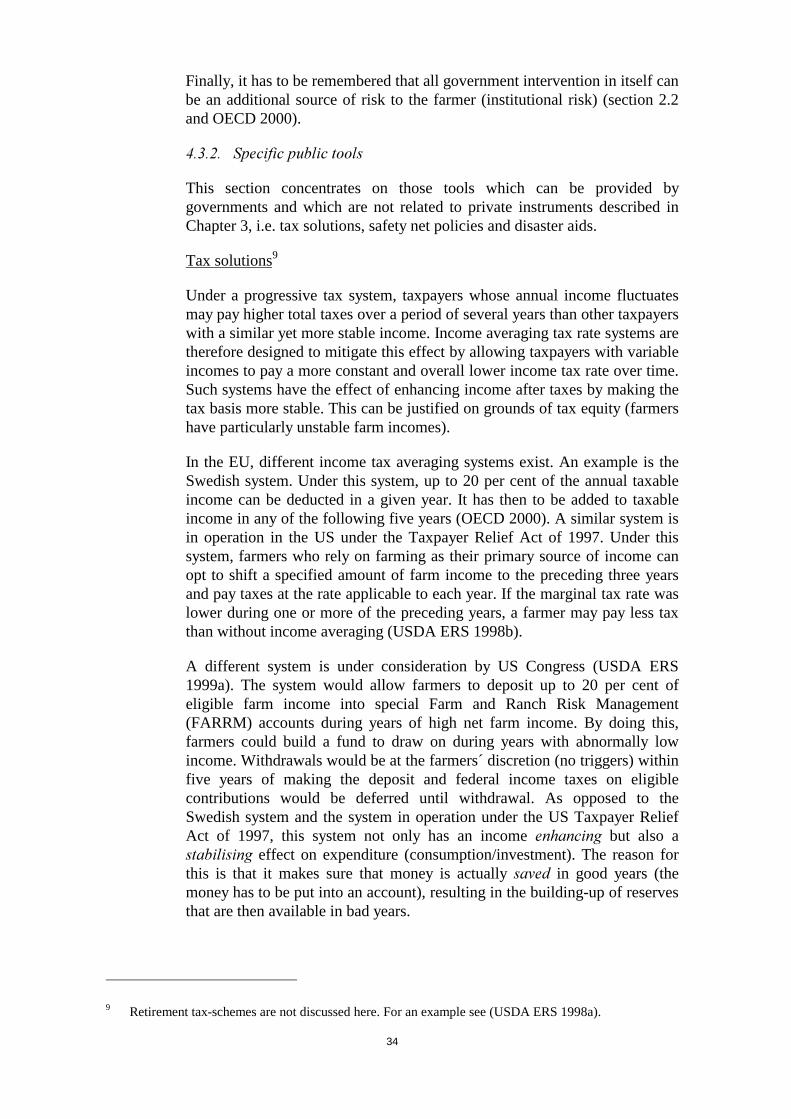
34
Finally, it has to be remembered that all government intervention in itself canbe an additional source of risk to the farmer (institutional risk) (section 2.2and OECD 2000).
������� 6SHFLILF�SXEOLF�WRROV
This section concentrates on those tools which can be provided bygovernments and which are not related to private instruments described inChapter 3, i.e. tax solutions, safety net policies and disaster aids.
Tax solutions9
Under a progressive tax system, taxpayers whose annual income fluctuatesmay pay higher total taxes over a period of several years than other taxpayerswith a similar yet more stable income. Income averaging tax rate systems aretherefore designed to mitigate this effect by allowing taxpayers with variableincomes to pay a more constant and overall lower income tax rate over time.Such systems have the effect of enhancing income after taxes by making thetax basis more stable. This can be justified on grounds of tax equity (farmershave particularly unstable farm incomes).
In the EU, different income tax averaging systems exist. An example is theSwedish system. Under this system, up to 20 per cent of the annual taxableincome can be deducted in a given year. It has then to be added to taxableincome in any of the following five years (OECD 2000). A similar system isin operation in the US under the Taxpayer Relief Act of 1997. Under thissystem, farmers who rely on farming as their primary source of income canopt to shift a specified amount of farm income to the preceding three yearsand pay taxes at the rate applicable to each year. If the marginal tax rate waslower during one or more of the preceding years, a farmer may pay less taxthan without income averaging (USDA ERS 1998b).
A different system is under consideration by US Congress (USDA ERS1999a). The system would allow farmers to deposit up to 20 per cent ofeligible farm income into special Farm and Ranch Risk Management(FARRM) accounts during years of high net farm income. By doing this,farmers could build a fund to draw on during years with abnormally lowincome. Withdrawals would be at the farmers´ discretion (no triggers) withinfive years of making the deposit and federal income taxes on eligiblecontributions would be deferred until withdrawal. As opposed to theSwedish system and the system in operation under the US Taxpayer ReliefAct of 1997, this system not only has an income HQKDQFLQJ� but also aVWDELOLVLQJ�effect on expenditure (consumption/investment). The reason forthis is that it makes sure that money is actually VDYHG� in good years (themoney has to be put into an account), resulting in the building-up of reservesthat are then available in bad years.
9 Retirement tax-schemes are not discussed here. For an example see (USDA ERS 1998a).

35
3XEOLF�6DIHW\�1HW�3ROLFLHV
A safety net LQ� JHQHUDO is an instrument which has a role to play inexceptional circumstances, when income or a component of income fallsbelow a given reference level. Safety nets exist or are imaginable at differentlevels: household income (including off-farm revenue), farm income(revenue – costs), farm revenue, product revenue, yield and price.
Safety nets can be private as well as public instruments. An overview ofexisting and proposed private and public safety nets is given in table 4.1.Insurance discussed in section 3.4 is a private safety net.
7DEOH���� 6DIHW\�QHW�DSSURDFKHV�LQ�DJULFXOWXUH
([DPSOHV�IRU�LQVWUXPHQWV�H[LVWLQJ�LQVWUXPHQWV�DQG�SURSRVDOV�IRU�QHZ
LQVWUXPHQWV�6DIHW\�QHW�IRU�« 3ULYDWH 3XEOLFHousehold income(on and off-farm)
ERS USDA simulation(Ag. Outlook, Jan/Feb 2000)
Farm income Canadian AIDA programmeFarm revenue(all sources of revenue)
US CISS proposal
Product revenue(price times yield)
(Low level) revenueinsurance
US SIPP proposal
Product yield (Low level) yieldinsurance, mutualfunds
(Low level) public yield insurance
Product price EU intervention, US marketingloans and loan deficiencypayments
At the household-level, public safety nets exist under the heading of socialpolicy for all households. We are not aware of any existing safety netsspecifically targeted at the agricultural sector (going beyond more generalsocial policy measures in force for example in France and Germany).However, the USDA Economic Research Service has in a recent studyaddressed the issue of a household safety net specifically targeted at theagricultural sector (USDA ERS 2000b). It should be noted, however, thatsafety nets in the field of social security systems differ significantly fromcommodity-related safety nets. Social security policies are decoupled fromthe context of producing a particular commodity and, therefore, do notdistort commodity prices. This holds even under the condition of aconsiderable public funding.
Addressing farm income (revenue – cost), Canada´s AIDA programmeprovides coverage if the farm income falls below 70 per cent of a three yearsaverage (section 5.4.3)
Farm revenue safety nets and revenue safety nets for individual crops areunder discussion in the US, for example the Commodity Income SupplementSupport (CISS) and the Supplemental Income Payments for Producers(SIPP) (section 5.3.8).
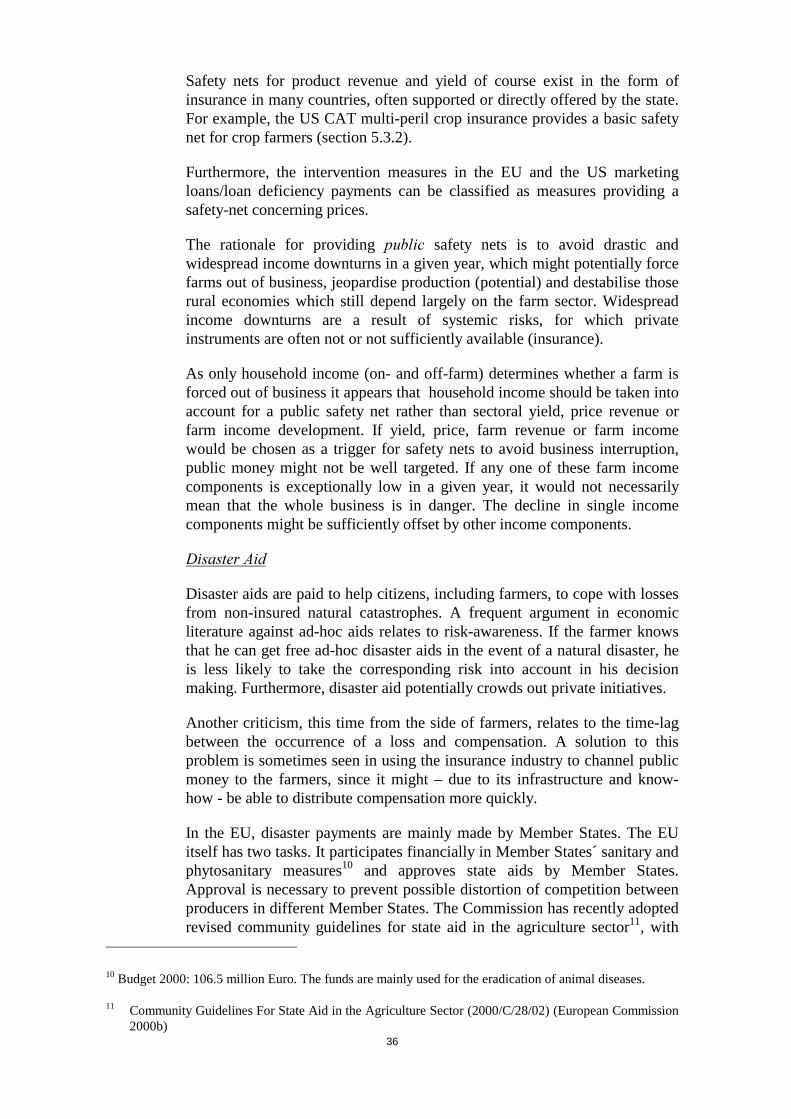
36
Safety nets for product revenue and yield of course exist in the form ofinsurance in many countries, often supported or directly offered by the state.For example, the US CAT multi-peril crop insurance provides a basic safetynet for crop farmers (section 5.3.2).
Furthermore, the intervention measures in the EU and the US marketingloans/loan deficiency payments can be classified as measures providing asafety-net concerning prices.
The rationale for providing SXEOLF� safety nets is to avoid drastic andwidespread income downturns in a given year, which might potentially forcefarms out of business, jeopardise production (potential) and destabilise thoserural economies which still depend largely on the farm sector. Widespreadincome downturns are a result of systemic risks, for which privateinstruments are often not or not sufficiently available (insurance).
As only household income (on- and off-farm) determines whether a farm isforced out of business it appears that household income should be taken intoaccount for a public safety net rather than sectoral yield, price revenue orfarm income development. If yield, price, farm revenue or farm incomewould be chosen as a trigger for safety nets to avoid business interruption,public money might not be well targeted. If any one of these farm incomecomponents is exceptionally low in a given year, it would not necessarilymean that the whole business is in danger. The decline in single incomecomponents might be sufficiently offset by other income components.
'LVDVWHU�$LG
Disaster aids are paid to help citizens, including farmers, to cope with lossesfrom non-insured natural catastrophes. A frequent argument in economicliterature against ad-hoc aids relates to risk-awareness. If the farmer knowsthat he can get free ad-hoc disaster aids in the event of a natural disaster, heis less likely to take the corresponding risk into account in his decisionmaking. Furthermore, disaster aid potentially crowds out private initiatives.
Another criticism, this time from the side of farmers, relates to the time-lagbetween the occurrence of a loss and compensation. A solution to thisproblem is sometimes seen in using the insurance industry to channel publicmoney to the farmers, since it might – due to its infrastructure and know-how - be able to distribute compensation more quickly.
In the EU, disaster payments are mainly made by Member States. The EUitself has two tasks. It participates financially in Member States´ sanitary andphytosanitary measures10 and approves state aids by Member States.Approval is necessary to prevent possible distortion of competition betweenproducers in different Member States. The Commission has recently adoptedrevised community guidelines for state aid in the agriculture sector11, with
10 Budget 2000: 106.5 million Euro. The funds are mainly used for the eradication of animal diseases.
11 Community Guidelines For State Aid in the Agriculture Sector (2000/C/28/02) (European Commission2000b)

37
the purpose to clarify current practice of dealing with state aids in theagricultural sector. Current practice is inter alia described with respect tocompensating farmers for damage to production and means of agriculturalproduction as caused by natural disasters, adverse weather conditions oroutbreaks of animal or plant disease. It also includes information on currentpractice as regards aids matching parts of the premia for insurance coveringsuch events.
The document lists the events which can be classified as naturaldisasters/exceptional occurrences (earthquakes, avalanches, landslides,floods etc.) and adverse weather conditions (frost, hail, ice, rain, droughtetc.). The Commission permits aid up to 100 per cent to compensate formaterial damage resulting from natural disasters/exceptional occurrences.Outbreaks of animal or plant diseases are not normally considered as naturaldisasters/exceptional occurrences. Losses resulting from adverse weatherconditions may be compensated up to 100 per cent, if the level of damagereaches 20 per cent of normal production in less-favoured areas and 30 percent in other areas. Aid for combating animal and plant diseases may only beaccepted as part of appropriate programmes for disease prevention, control,or eradication. Aids may be granted for up to 100 per cent of such measures,if Community legislation doesn´t specify that such costs have to be borne byproducers. Compensation of losses incurred may be granted up to the normalvalue of crops destroyed or animals slaughtered and may include reasonablecompensation of loss of profit.
The Commission allows aids of up to 80 per cent of the cost of insurancepremia to cover losses caused by natural disasters/exceptional occurrences(as defined above) or significant adverse weather conditions (beyond thethresholds mentioned above). Where insurance also covers other losses(including animal or plant diseases), the aid rate allowed is reduced to 50 percent.

38
7DEOH����6WDWH�DLGV�WR�DJULFXOWXUDO�VHFWRU�QHZO\�DSSURYHG�E\�WKH�(8
EHWZHHQ�PLG������DQG�PLG�����
0LOOLRQ�(852Bad weather / Natural disasters 305.2Plant health and prevention 7.7Animal health and prevention 88.9Dioxin 900.8Subsidies for insurance premia 0.57RWDO �������6RXUFH��2IILFLDO�-RXUQDO
A review of state aids newly approved by the Commission over the last twoyears (August 1998 – July 2000) in the fields of natural catastrophes and theprevention and/or the compensation of diseases shows a sum of 1 303million Euro (excluding forestry payments and payments where the sharegoing to agriculture is not specified12) (Table 4.2). However, the actualpayments by Member States differ from the approved sum for the followingreasons:
• Payments were also made under schemes approved before the period inquestion.
• Payments approved in this time period may concern a different timeperiod.
• Payments made may be lower than the approved sum.
• Some payments in the field of prevention were approved as paymentswhich Member States can make every year without a set limit in time.
The approvals have been particularly high in the context of the dioxin crisis.Apart from that, most money was approved to compensate for bad weatherand natural disasters. Hardly any new subsidies for insurance premia wereapproved in this period.
Table 4.3 presents some figures provided by Munich Re and ÖsterreichischeHagelversicherung (1999) about public expenditure in selected MemberStates and the US for disaster aids and insurance subsidies (1988-97).Among the Member States selected, Italy spent the biggest amount of moneyto compensate producers for crop losses in the form of disaster aid. Aconsiderable amount of disaster aid was paid by France, while Spain paidclose to four times more money for insurance subsidies than for disaster aid.
12 276,5 million Euro were paid to compensate for natural disasters where the share going to agriculturewas not specified.

39
7DEOH����*RYHUQPHQW�H[SHQGLWXUH�IRU�GLVDVWHU�DLG�DQG�LQVXUDQFH�VXEVLGLHV�
�����±�������VHOHFWHG�FRXQWULHV
*RYHUQPHQW�H[SHQGLWXUH��������&RXQWU\ ,QVXUDQFH�VXEVLGLHV
PLR��(852'LVDVWHU�DLGPLR��(852
7RWDO�PLR��(852
Italy 1 110 2 740 3 850Spain 1 153 314 1 467Austria 90 18 108France * 595 595Germany 0 315** 315USA 8 165 8 921 17 086* Does not correspond to the information that France in fact does provide to a limited
extent subsidies for hail-insurance (for fruit and certain vegetables)** Federal government: 269, Länder: 466RXUFH��0XQLFK�5H�DQG�Österreichische�+DJHOYHUVLFKHUXQJ�����

40
��� (;$03/(6�2)�$*5,&8/785$/�,1685$1&(�$1'�6$)(7<�1(7�6<67(06
����� 6HOHFWHG�(8�0HPEHU�6WDWHV
EU Member States have developed different systems to cope with risk exposure inthe farming sector. For illustrative purposes, we look at seven Member States.
The various systems can be classified according to the state involvement:
*UHHFH has a predominantly public system. The state, through its public insuranceorganisation, collects contributions, administers the programme and guaranteescoverage of losses. By virtue of this, the role of the private sector is limited – it onlycovers products not covered by the public system or provides top-up coverage(system under reform).
6SDLQ� (see following section)� and 3RUWXJDO� have “public-private partnership”systems, where the state has a key role, providing both premium subsidies and re-insurance. The private insurance industry is integrated into the system, administeringthe whole programme and covering a share of the risk.
,WDO\� )UDQFH��$XVWULD�and *HUPDQ\�have systems of agricultural insurance whichare predominantly private. The four countries, however, differ considerably asregards subsidies for insurance premia. While Germany is not providing anypremium subsidies, Italy grants considerable amounts of premium subsidies to thefarming sector (table 4.3 in section 4.3.2). The Italian system is under reform.
For a synopsis see table 5.1. The Spanish system will be described in more detail,since it is of a particular nature as regards its high level of government involvement.
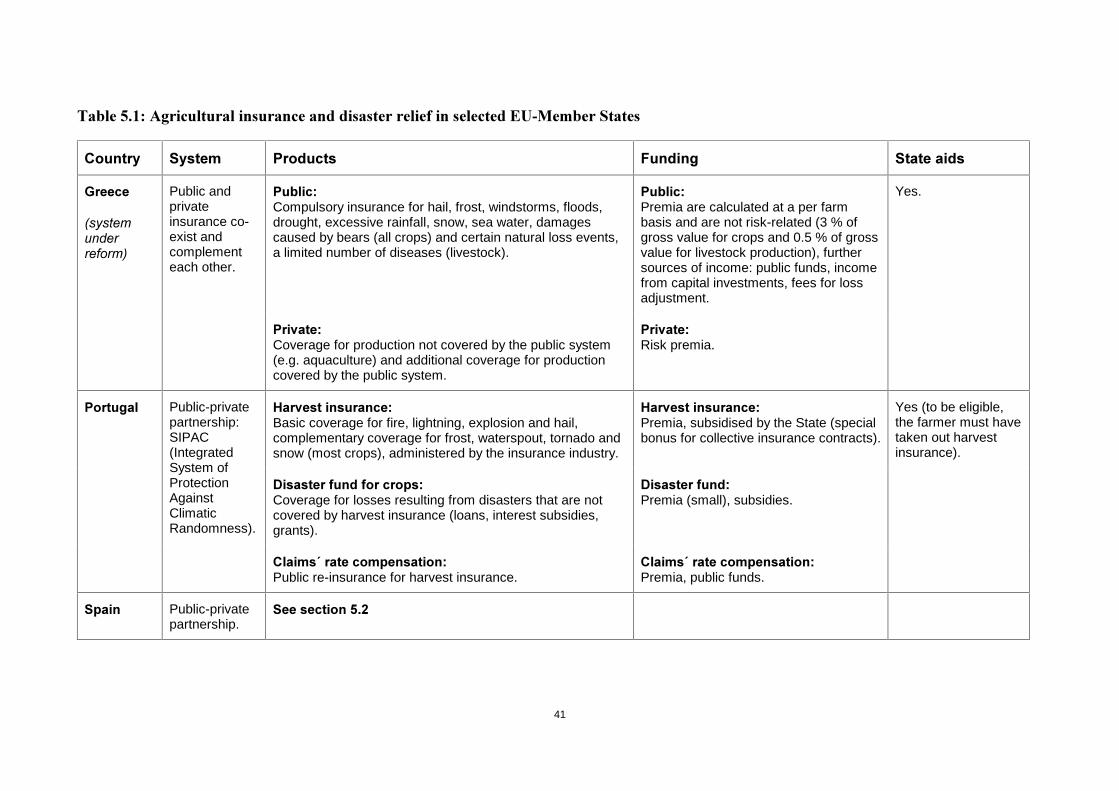
41
7DEOH������$JULFXOWXUDO�LQVXUDQFH�DQG�GLVDVWHU�UHOLHI�LQ�VHOHFWHG�(8�0HPEHU�6WDWHV
&RXQWU\ 6\VWHP 3URGXFWV )XQGLQJ 6WDWH�DLGV
*UHHFH
�V\VWHPXQGHUUHIRUP�
Public andprivateinsurance co-exist andcomplementeach other.
3XEOLF�Compulsory insurance for hail, frost, windstorms, floods,drought, excessive rainfall, snow, sea water, damagescaused by bears (all crops) and certain natural loss events,a limited number of diseases (livestock).
3XEOLF�Premia are calculated at a per farmbasis and are not risk-related (3 % ofgross value for crops and 0.5 % of grossvalue for livestock production), furthersources of income: public funds, incomefrom capital investments, fees for lossadjustment.
Yes.
3ULYDWH�Coverage for production not covered by the public system(e.g. aquaculture) and additional coverage for productioncovered by the public system.
3ULYDWH�Risk premia.
3RUWXJDO +DUYHVW�LQVXUDQFH�Basic coverage for fire, lightning, explosion and hail,complementary coverage for frost, waterspout, tornado andsnow (most crops), administered by the insurance industry.
+DUYHVW�LQVXUDQFH�Premia, subsidised by the State (specialbonus for collective insurance contracts).
Yes (to be eligible,the farmer must havetaken out harvestinsurance).
Public-privatepartnership:SIPAC(IntegratedSystem ofProtectionAgainstClimaticRandomness).
'LVDVWHU�IXQG�IRU�FURSV�Coverage for losses resulting from disasters that are notcovered by harvest insurance (loans, interest subsidies,grants).
'LVDVWHU�IXQG�Premia (small), subsidies.
&ODLPV��UDWH�FRPSHQVDWLRQ�Public re-insurance for harvest insurance.
&ODLPV��UDWH�FRPSHQVDWLRQ�Premia, public funds.
6SDLQ Public-privatepartnership.
6HH�VHFWLRQ����
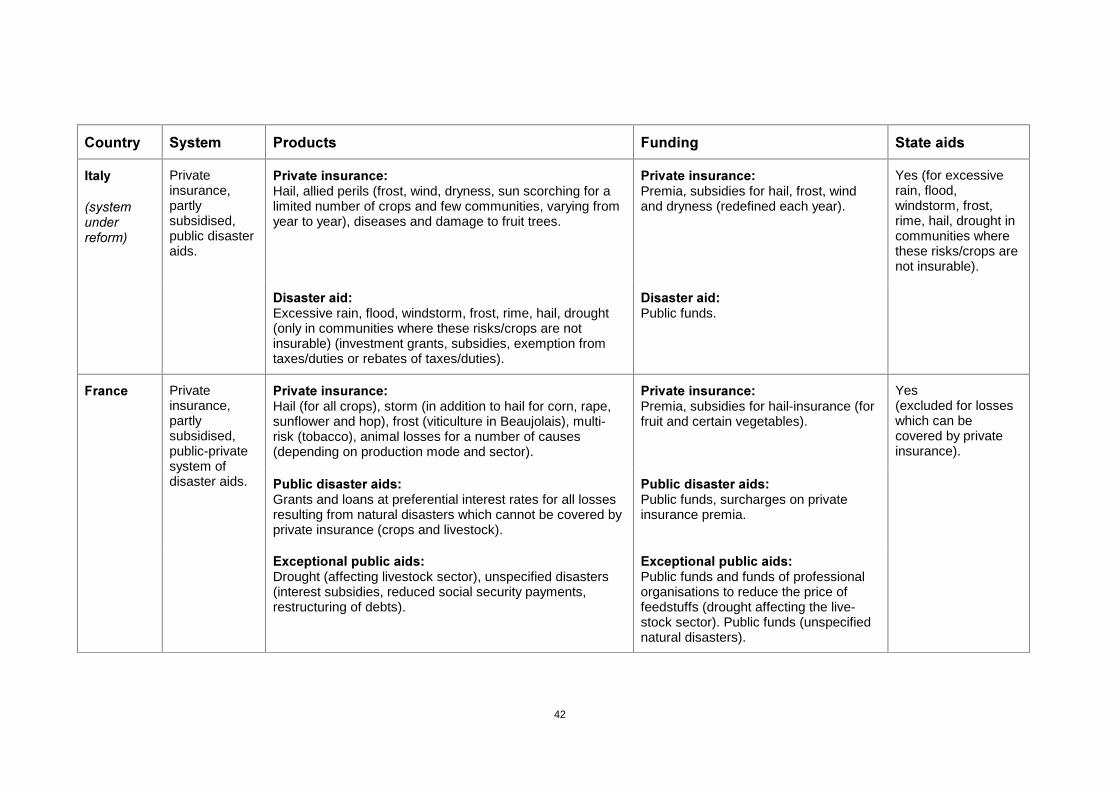
42
&RXQWU\ 6\VWHP 3URGXFWV )XQGLQJ 6WDWH�DLGV
,WDO\
�V\VWHPXQGHUUHIRUP�
Privateinsurance,partlysubsidised,public disasteraids.
3ULYDWH�LQVXUDQFH�Hail, allied perils (frost, wind, dryness, sun scorching for alimited number of crops and few communities, varying fromyear to year), diseases and damage to fruit trees.
3ULYDWH�LQVXUDQFH�Premia, subsidies for hail, frost, windand dryness (redefined each year).
Yes (for excessiverain, flood,windstorm, frost,rime, hail, drought incommunities wherethese risks/crops arenot insurable).
'LVDVWHU�DLG�Excessive rain, flood, windstorm, frost, rime, hail, drought(only in communities where these risks/crops are notinsurable) (investment grants, subsidies, exemption fromtaxes/duties or rebates of taxes/duties).
'LVDVWHU�DLG�Public funds.
)UDQFH 3ULYDWH�LQVXUDQFH�Hail (for all crops), storm (in addition to hail for corn, rape,sunflower and hop), frost (viticulture in Beaujolais), multi-risk (tobacco), animal losses for a number of causes(depending on production mode and sector).
3ULYDWH�LQVXUDQFH�Premia, subsidies for hail-insurance (forfruit and certain vegetables).
Yes(excluded for losseswhich can becovered by privateinsurance).
Privateinsurance,partlysubsidised,public-privatesystem ofdisaster aids. 3XEOLF�GLVDVWHU�DLGV�
Grants and loans at preferential interest rates for all lossesresulting from natural disasters which cannot be covered byprivate insurance (crops and livestock).
3XEOLF�GLVDVWHU�DLGV�Public funds, surcharges on privateinsurance premia.
([FHSWLRQDO�SXEOLF�DLGV�Drought (affecting livestock sector), unspecified disasters(interest subsidies, reduced social security payments,restructuring of debts).
([FHSWLRQDO�SXEOLF�DLGV�Public funds and funds of professionalorganisations to reduce the price offeedstuffs (drought affecting the live-stock sector). Public funds (unspecifiednatural disasters).

43
)UDQFH(continued)
7D[�EUHDNV�LQ�FDVH�RI�QDWXUDO�GLVDVWHUV 7D[�EUHDNV�LQ�FDVH�RI�QDWXUDOGLVDVWHUV: Public funds.
3RVVLELOLW\�WR�VPRRWK�WD[�EXUGHQ�RYHU�WKH�\HDUV� In caseof disasters in general (available for the whole economy).
3RVVLELOLW\�WR�VPRRWK�WD[�EXUGHQ�RYHUWKH�\HDUV� Public funds.
6WRS�ORVV�UH�LQVXUDQFH� For insurance covering losses ofbuildings and contents (not only agriculture).
6WRS�ORVV�UH�LQVXUDQFH:State guarantee.
$XVWULD Privateinsurance,partlysubsidised,public disasteraids.
3ULYDWH�LQVXUDQFH�Hail (all-inclusive coverage for the whole acreage of a farmincluding grassland, OR coverage for individual crops), inaddition damage by snails (all crops), damage by crows(corn, Ölkürbis), stagnant water (all crops excluding sugar-beet and grapes), drought, frost, flooding, storm (corn),pests and outgrowth (cereals), flooding, frost (grassland),combination of frost and hail (viticulture). Hail, storm andsnow (horticulture).
3ULYDWH�LQVXUDQFH�Premia, premia subsidies for hail andfrost.
Yes(but not for hail andfrost, as insurance issubsidised).
*HUPDQ\ Privateinsurance,public disasteraids.
3ULYDWH�LQVXUDQFH�Hail, frost (viticulture), quality-related insurance: sugarcontent (sugar-beet), content in starch (potatoes), specificdiseases (potatoes), storm, frost, rainfall (only for big farmsin Eastern Germany). Business interruption (fire). Epidemicdiseases, accidents (animals): Value of destroyed animals,coverage of consequential losses (business interruption).
3ULYDWH�LQVXUDQFH�Premia.
Yes.
'LVDVWHU�DLG�Special programmes adopted at federal level by speciallegislation, in addition: disaster relief programmes at theLänder level. Epidemic animal diseases: coverage for valueof destroyed animals.
'LVDVWHU�DLG�Public funds.

44
����� 6SDLQ
Spain has a rich experience in agricultural insurance. Different systems with avarying degree of involvement of the state were tested between the 1920s and the1970s. Overall success, however, remained limited and participation ratesdisappointing. The current system is built on that experience. It was set up in 1978and continues to evolve (Burgaz 2000, Agroseguro 1999, Stoppa 2000, Forteza delRey Morales 1999).
The Spanish system does not distinguish between risks in agriculture that can beinsured by the private sector and risks where - because of market failure - the statehas to step in. $OO�insurable�agricultural�risks are covered by the private sector andDOO types of policies are subsidised by the state. Three different types of policies areon offer:
• Policies which cover only one type of risk (exceptional);
• Policies which cover multiple risks;
• Policies which provide coverage for all risks beyond the farmer’s control(“all-risk”).
Most policies are of the type “multiple risk”. Traditionally multiple-risk policies goeven beyond climatic risks and also cover risks like fire. As of 2000, a new type ofpolicy is on offer for various crops which covers multiple climatic risks (seguros derendimientos).
Policies can be taken out by individual farmers or by groups of farmers (co-operatives, professional organisations etc.). In 1999, farmers could choose between58 different types of policies. All crops can be covered (at least for the mostimportant risks). Of the 58 types, three cover animal products and five cover marinecultures. The wide range of policies on offer is considered to be one of the mainreasons for the programme’s success in terms of high overall participation rates. Inthe year 2000, about 30 per cent of Spanish producers participated in the system andabout 30 per cent of crop and 10 per cent of animal production were covered. Graph5.1 presents the coverage ratios for important products for the year 1999.

45
*UDSK����3HUFHQWDJH�RI�WRWDO�SURGXFWLRQ�YDOXH�FRYHUHG�E\�LQVXUDQFH��6SDLQ�����
0 10 20 30 40 50 60 70 80 90 100
Bananas
Tobacco
Fruit (excl. bananas)
Rice
Winter wheat (all-risk)
Sunflower
Winter wheat (hail, fire, flooding)
Wine grape
Citric fruits
Cotton
Spring wheat
Vegetables
Pulses (hail, fire, flooding)
Pulses (all-risk)
Cattle (young animals)
Almazara Olive
Sheep
&RYHUDJH�LQ��
(between 32 and 82 %)
6RXUFH��$JURVHJXUR�����
The system is based on an intricate partnership between the private and the publicsector. The customers of the system are farmers who can take out agriculturalinsurance individually or obtain coverage through co-operatives and professionalorganisations. Participation in the system is voluntary. Besides the customers, thekey-players of the system are:
• (1(6$ (Entidad Estatal de Seguros Agrarios), an organism attached to theMinistry of Agriculture, Fisheries and Food. Its president is the under-secretary ofthe Ministry and its director is appointed by the Minister of Agriculture. In itstwo main bodies all stakeholders of the system are represented. The tasks includethe elaboration of annual plans for agricultural insurance, in which the technicalframework for the system is laid down (level of subsidies, insurable yields,minimum cultivation standards, deadlines for subscribing to insurance policiesetc.), the subsidisation of the insurance premia (together with the regions, i.e.Comunidades autonomas) and the control of implementation of the insuranceplans. Furthermore, ENESA is acting as arbiter in all cases of disputes.
• $*526(*852 (Agrupación Española de Entidades Aseguradoras de losSeguros Agrarios Combinados), a pool of sixty private insurance companieswhich participate in a system of co-insurance. According to this system, thecompanies share the total risk underwritten in a given year by all members inproportion to their participation in the equity of AGROSEGURO.AGROSEGURO, on behalf of its members, assumes the day-to-day running ofthe programme, i.e. fixing and collecting premia, assessing losses, payingcompensations, controlling farmers etc.
• &&6 (Consorcio de Compensación de Seguros), a public enterprise with ownresources, operating as a re-insurer (under the control of the Ministry ofEconomy). Re-insurance by CCS is obligatory.

46
For a graphic presentation of the system see Graph 5.2 (based on Stoppa 2000).
*UDSK���� $JULFXOWXUDO�LQVXUDQFH�V\VWHP�LQ�6SDLQ
Ministry of Agriculture,Fisheries and Food
ENESACoordination of the programme
Generalcommission
Coordinationcommission with
the regions
Producers
Insurers
Agroseguro
Ministry ofEconomics
Ministry ofAgriculture
AGROSEGURO
Management ofthe programme P
roducers
Annual plan
Premia subsidies
Insurance companies
Commercialisationof policies
Ministry of Economy
Consorcio deCompensacion de Seguros
(CCS)
Reinsurance
ControlDamage assessment
Compensation oflosses
Appointspresident anddirector
In operative terms and for any given year, ENESA takes the lead in publishing theannual plan. On the basis of the framework set out in the plan, AGROSEGUROfixes the detailed conditions for all insurance products, in particular the regionallydifferentiated premium rates which vary according to risk exposure and also includeadministrative and re-insurance costs. Once the conditions for the various productsare set, they are then commercialised through the networks of the insurancecompanies which are members of the pool of AGROSEGURO. Obligatory re-insurance is provided by CCS, additional private re-insurance is provided by privatecompanies for viable lines for coverage going beyond the level provided by CCS.
The re-insurance CCS provides is non-proportional to the premium to be paid for re-insurance.
In 1999 total receipts by AGROSEGURO amounted to 307 million Euro, of whichfarmers paid 155.8 million Euro and the state 151.2 million Euro. In the same year,administrative costs of AGROSEGURO amounted to 11.7 million Euro. Subsidiesfrom the state and the regions are paid out by ENESA and channelled throughAGROSEGURO to the insurance companies. Public subsidies amount to up to41 per cent of the premium (45 per cent in the case of the new multiple climatic riskpolicies).
Graph 5.3 shows how the state´s involvement has developed financially between1980 and 1999.
The actuarial situation of the system was difficult at the beginning and is currentlysuffering set-backs with a loss-ratio (claims/premia) of 132 per cent in 1999. For thewhole period of 1980 – 1999 taken together it was 113 per cent. Losses are covered
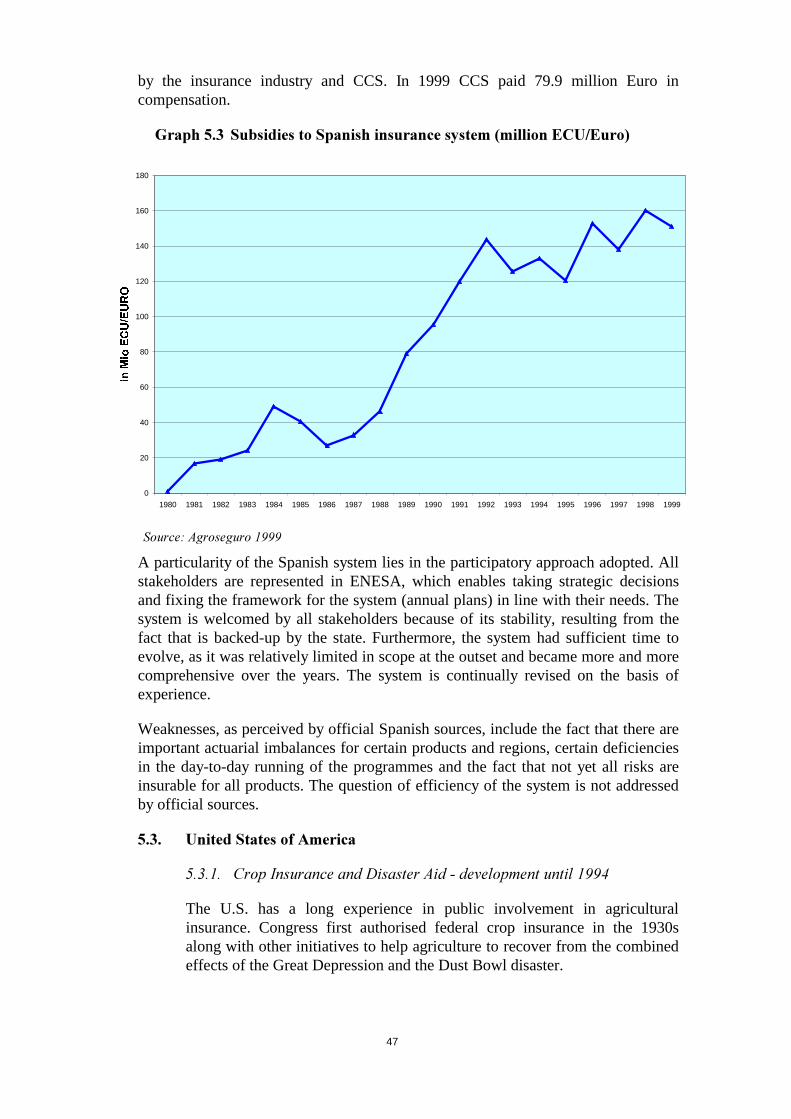
47
by the insurance industry and CCS. In 1999 CCS paid 79.9 million Euro incompensation.
*UDSK���� 6XEVLGLHV�WR�6SDQLVK�LQVXUDQFH�V\VWHP��PLOOLRQ�(&8�(XUR�
0
20
40
60
80
100
120
140
160
180
1980 1981 1982 1983 1984 1985 1986 1987 1988 1989 1990 1991 1992 1993 1994 1995 1996 1997 1998 1999
LQ�0LR�(&8�(852��
6RXUFH��$JURVHJXUR�����
A particularity of the Spanish system lies in the participatory approach adopted. Allstakeholders are represented in ENESA, which enables taking strategic decisionsand fixing the framework for the system (annual plans) in line with their needs. Thesystem is welcomed by all stakeholders because of its stability, resulting from thefact that is backed-up by the state. Furthermore, the system had sufficient time toevolve, as it was relatively limited in scope at the outset and became more and morecomprehensive over the years. The system is continually revised on the basis ofexperience.
Weaknesses, as perceived by official Spanish sources, include the fact that there areimportant actuarial imbalances for certain products and regions, certain deficienciesin the day-to-day running of the programmes and the fact that not yet all risks areinsurable for all products. The question of efficiency of the system is not addressedby official sources.
����� 8QLWHG�6WDWHV�RI�$PHULFD
������� &URS�,QVXUDQFH�DQG�'LVDVWHU�$LG���GHYHORSPHQW�XQWLO�����
The U.S. has a long experience in public involvement in agriculturalinsurance. Congress first authorised federal crop insurance in the 1930salong with other initiatives to help agriculture to recover from the combinedeffects of the Great Depression and the Dust Bowl disaster.

48
Public involvement in crop insurance remained limited until the adoption ofthe Federal Crop Insurance Act of 1980 which introduced co-operation withprivate insurance companies and expanded the crop specific and regionalcoverage. This expansion of coverage intended to replace ad hoc disasterrelief offered under several farm bills created in the 1960s and 1970s.Subsidies for crop insurance premia were introduced in order to encourageparticipation.
However, the U.S. government continued to provide ad hoc disasterassistance for catastrophic crop losses. In 11 of the 15 years from 1980-1994,Congress approved ad-hoc disaster programmes due to adverse weatherconditions that destroyed or reduced production of a variety of agriculturalcommodities. The availability of “free” disaster assistance reduced theattractiveness of buying insurance policies. This was seen as the majorreason why the crop insurance programme didn’t achieve a sufficient level ofparticipation.
������� 0XOWLSOH�3HULO�&URS�,QVXUDQFH��03&,�
In 1994, USDA proposed again legislative reforms to replace ad-hoc disasterassistance in favour of an enhanced crop insurance programme. The FederalCrop Insurance Reform Act of 1994 merged crop insurance with disasterpayments and created the Multiple-Peril Crop Insurance policy (MPCI).
MPCI provides protection against most naturally occurring perils, includingdrought, excessive moisture, floods, hail, high winds, and other catastrophes.It is currently available for all major field crops (e.g. corn, wheat, andsoybeans) and some fruit, vegetable, and nut crops. Altogether, cropinsurance is available for more than 70 crops, though in some locationscoverage is not available for all these crops, since climate and other factorslimit production areas. There are different forms of MPCI – delivered byprivate insurance companies - and farmers can select the most suitableamong a wide variety of coverage levels under the program.
MPCI coverage is based on yield data of individual farms, the ActualProduction History (APH). The producer’s APH yield is calculated as a 4- to10-year simple average of the producer’s actual yield on the insured parcel ofland. If a producer does not have actual yields, the series (up to 4 years) isfilled in with a “transition yield” based normally on county yields.
The three different forms of MPCI are Catastrophic Risk Protection (CAT),Buy-up Coverage and Group Risk Plan (GRP). A Non-insured AssistanceProgram (NAP) provides protection for crops which are excluded from thesestandard programmes.
&DWDVWURSKLF� 5LVN� 3URWHFWLRQ� �&$7�� Under that policy, farmers mayobtain a minimum level of insurance coverage. To ensure the widestparticipation, CAT coverage in 1995 was made conditional to be eligible forany price support or production adjustment programme. In 1996, Congressrepealed the mandatory participation requirement. However, farmers whoaccepted benefits from other programmes were required to purchase crop

49
insurance or otherwise waive their eligibility for any disaster benefits thatmight be made available for the crop year.
CAT covers 50% of the approved APH yield at 55% of the expected marketprice. The price reference level is the expected price during harvest time asannounced by the Federal Crop Insurance Corporation (FCIC). Thus, with atotal loss, the farmer would get 27.5% of his expected gross revenuereimbursed by the CAT programme.
The premium for CAT coverage is paid completely by the government.Farmers only had to pay an administrative fee of $ 50 for each crop and eachcounty where they wished to insure crops. In 1999, the fee was increased to $60. The maximum fee per producer is $ 600 for all counties in which aproducer is active and for all crops he wants to insure. Limited-resourcefarmers, having less than $ 20´000 in income from all sources in the previoustwo years, may be exempt from this contribution to administration cost.
%X\�XS�&RYHUDJH� Under the MPCI policies, farmer can select higher yieldand price coverage levels than is possible under CAT option. With buy-up,the farmer may increase the yield level insured at 5 per cent intervals up to85%13 of his APH. Furthermore, the price level insured may be up to 100 %instead of 55 % being the CAT level generally applied.
Farmers pay a processing fee and a premium in order to receive buy-upcoverage. The premium payment is based on the yield risk associated withthe policy. Farmers in areas with greater annual yield fluctuations pay ahigher premium than farms in areas where yields are more uniform. A part ofthe premium is subsidised by government (see Annex 3 for rate-settingmethodology).
Another form of MPCI which has been offered on a limited basis as from1993, is the *URXS�5LVN�3ODQ��*53�. The coverage of this option is basedon the average county yield rather than the individual farm yield. A producercan purchase a guarantee based on the county yield, and if the county yieldfalls below the insured level, then the producer will receive a paymentregardless of the individual farm yield. This option is most effective inprotecting individual yield risk when individual and county-level yields arestrongly correlated.
A 1RQ�LQVXUHG� $VVLVWDQFH� 3URJUDP� �1$3� is designed to provideprotection of yield losses for producers of crops which are excluded from thestandard programmes (e.g. citrus fruits, pears, peppers, plums and flax).NAP offers coverage similar to CAT coverage, but requires a 35 per centloss in a certain area (which includes at least 5 producers of eligible crops) totrigger payments at the farm level. The relevant area can be defined as acounty, several contiguous counties, an area encompassing at least 320´000
13 The maximum level was increased in 1999 from 75% of expected yield to 85% for some crops in someareas.

50
acres (ca. 130´000 ha), or a parcel accounting for a crop value of at least $ 80million annually.
NAP coverage is offered free of charge to the producer. However, farmersare required to sign up (reporting their acreage and past yields) before thebeginning of the season to be eligible for NAP protection.
������� 5HYHQXH�LQVXUDQFH
In addition to the yield-based programmes, U.S. farmers are currently offeredseveral revenue insurance programmes. Revenue protection is provided byadding a price variability component to yield protection, which refers to theActual Production History (APH). The price component of revenueinsurance policies is based on intra-year futures prices. Indemnities are paidwhen the producer’s actual combination of harvested yield and harvest-timeprice falls below the guarantee level. Each product requires that producerspay a premium for coverage which is subsidised by the Federal Governmentin a manner similar to multi-peril crop insurance. The Federal Governmentalso reinsures private companies against a portion of the losses associatedwith each of the products, and provides reimbursement for deliveryexpenses.
The ,QFRPH�3URWHFWLRQ� �,3� instrument was first time offered in 1996 byFederal Crop Insurance Corporation FCIC. This insurance programme offersa revenue guarantee based on the farmer’s expected yield and the cropsharvest-time price. It protects against declines in actual revenue fromexpected revenue for a particular crop. It is available for barley, corn, cottongrain sorghum, soybeans and wheat but only in a limited number of counties.
The Actual Production History (APH) yields are used as a yield componentwhen revenue guarantee is calculated for IP. Price setting is accomplished byusing the average of the futures market closing prices for the insured cropprior to the policy’s sales closing date and during harvest. Indemnities arepaid if the actual harvest-time revenue (actual yield multiplied by theharvest-time price) is below the revenue guarantee. Coverage is offered fromCAT level (50% yield, 100% price, administration fee) up to 75% of theapproved APH yield, and up to 85% in selected counties.
&URS� 5HYHQXH� &RYHUDJH� �&5&� insurance was introduced in 1996 by aprivate insurance company. Producers may select a coverage level between50 to 75 per cent. 85 per cent coverage level is available for selected cropsand counties. CRC insurance is specified by product and is available foralmost 90 per cent of the corn, wheat, cotton, soybean, and grain sorghumarea in the USA.
The most interesting element of CRC is that revenue coverage may increaseduring the growing season if harvest prices are higher than the base pricetaken at the time of signing the contract. The spring market price of theChicago Board of Trade (CBOT) is used for most crops to establish theinitial policy revenue guarantee. The harvest market price is used to establish

51
the crop value to count against the revenue guarantee, and to re-compute therevenue guarantee when it is higher than the spring market price.
5HYHQXH�$VVXUDQFH��5$� insurance was first time offered in 1997 as a pilotproject by a private company. In 2000, RA is available for selected crops inIdaho, Illinois, Indiana, Iowa, Minnesota, North Dakota and South Dakota.For a RA policy, revenue guarantee is calculated by multiplying theapproved APH yield for the insured unit with the projected harvest price andthe coverage level selected by the farmer. The coverage level ranges from65-75 per cent. RA policyholders must insure all the acreage of the insuredcrop in a county. Indemnity payments are due when the actual productionmultiplied by the harvest-time price is less than the revenue guarantee.
7DEOH����6XPPDU\�RI�WKH�0DLQ�&URS�DQG�5HYHQXH�,QVXUDQFH�2SWLRQV
DYDLODEOH�WR�8�6��IDUPHUV
0XOWL�3HULO�&URS�,QVXUDQFH 5HYHQXH�,QVXUDQFH
&$7�FRYHUDJH
%X\�XSFRYHUDJH
*URXS�5LVN3ODQ
,QFRPH3URWHFWLRQ
&URS�5HYHQXH&RYHUDJH
5HYHQXH$VVXUDQFH
,QVXUHGULVN
Individualproduction risk
Individualproduction risk
Countyproduction risk
Individualrevenue risk
Individual revenuerisk
Individualrevenue risk
<LHOGFRYHUDJH
50%of APH yield
50 to 75(85)%of APH yield
70 to 90%of county yield
50 to 75% ofAPH yield*price
50 to 75% of APHyield * price
65 to 75% ofAPH yield * price
3ULFHFRYHUDJH
55%of RMA price1
60 to 100%of RMA price1
90 to 150%of RMA price1
Planting futuresprice
Higher of plantingor harvest futures
price
Planting futuresprice
,QGHPQLW\EDVHG�RQ
Actual yield Actual yield County yieldActual yield andharvest futures
price
Actual yield andharvest futures
price
Actual yield andharvest time
price
&URSV Over 70 crops Over 70 crops Over 70 crops Selected cropsCorn, soybeans,grain sorghum,
cotton, wheat, rice
Selected crops
5HJLRQV All states All states Most states Some statesand counties
Most states Selected statesand counties
3URGXFHUVXEVLG\
100%subsidised,
administrativefee $60
41.7% of thepremium at
65% coveragelevel
Like buy-upcoverage
Same as in MPCI policy for buy-up coverage
1) RMA price = expected price during harvest time as announced by the FCIC.
6RXUFH��50$�±������5HYHQXH�&URS�,QVXUDQFH�3ODQV�
$GMXVWHG�*URVV�5HYHQXH��$*5� insurance is tested as a pilot program inspecified counties in five states (Florida, Maine, Massachusetts, Michigan,and New Hampshire) in 1999. It is intended for producers of crops for whichindividual crop insurance programs are not presently available. In AGR theinsurance coverage is based on income from agricultural commodities asreported on the grower’s Federal income tax return. The program covers
52
income from all crops and some livestock income. The coverage of AGR is50 or 60 per cent of the farm revenue.
*URXS�5LVN�,QFRPH�3URWHFWLRQ��*5,3� program ads a revenue componentto the Group Risk Plan (GRP) area-yield insurance. GRIP is a pilot programintroduced in 1999. It is available for corn and soybeans in selected countiesin Iowa, Illinois, and Indiana where GRP is offered. In GRIP the revenuecoverage is based on county-level revenue, calculated as the product of thecounty yield and the harvest-time futures market price. Indemnities are paidif the actual county revenue falls below the county revenue guarantee.
������� 3ULYDWH�SXEOLF�SDUWQHUVKLS
The Federal Crop Insurance Corporation (FCIC) was created in 1938 to carryout Federal crop insurance. It is a wholly owned government corporationwhich today is administered by the Risk Management Agency (RMA). TheRMA was set-up in 1996 to administer the agricultural insuranceprogrammes and other non-insurance-related risk management and educationprogrammes that help support U.S. agriculture. The RMA regulates andpromotes insurance programme coverage, sets standard terms – includingpremium rates – of insurance contracts, ensures contract compliance, andprovides premium and operating subsidies. Crop insurance policies aredelivered – sold, serviced, and underwritten – by private insurancecompanies.
Insurance companies may develop new insurance products which have to besubmitted to the FCIC for approval. In addition, insurance companies offerprivate coverage without government support that supplements the cropinsurance programmes. Furthermore, companies that qualify to deliver cropinsurance must annually submit plans of operation for approval by FCIC.Through a plan of operation an insurance company provides the FCIC withinformation on the ability of the company to pay potential underwritinglosses and on the allocation of the company’s crop insurance business to thevarious risks sharing categories for the purpose of re-insurance. In additionto re-insurance, the companies are paid a subsidy by FCIC for administrative,operating, and loss adjustment costs. The levels of administrative andoperating subsidy and the terms of re-insurance are specified in the StandardReinsurance Agreement (SRA), which applies to all companies deliveringFCIC-reinsured policies. More details of the content of this agreement areprovided in Annex 2 of this report.
Private companies share the risk with FCIC by designating their cropinsurance policies to risk-sharing categories, called reinsurance funds.Companies retain or cede to FCIC portions of premia and associated liability(potential indemnities). FCIC assumes all the underwriting risk on the cededbusiness and various shares of the underwriting risk on the retained business,determined by the particular category and level of losses. Companies canfurther reduce their underwriting risk on retained business through privatereinsurance markets.
53
In 1999, 17 insurance companies delivered crop insurance policies. Thecompanies’ insurance portfolios vary in size and scope. Companies competefor crop insurance business through insurance agents who sell and servicethe policies. Most of the nation’s 15,000 crop insurance agents areindependent agents who may sell insurance for more than one company.Others are captive agents, selling for only one company. Insurancecompanies usually pay an agent a sales commission proportional to thepremium of the policy sold. Loss adjusters for claims are employees orcontractors of the insurance companies.
������� 3UHPLD�DQG�SUHPLXP�VXEVLGLHV
The government determines insurance premia through FCIC/RMA. Thecalculation of premium rates for each of the crops is based on loss historiesof up to 20 years. The basic rule for the premium calculation requires thatover the years the premia should be sufficient to pay the claims on thepolicies. In practice, USDA is at present required to achieve a loss ratio of1.075, which means that for every premium dollar, the claims paid would beexpected to average no more than 1.075 dollar. Annex 3 of this reportprovides a more detailed description of the premium rate-settingmethodology.
In addition, the federal government subsidises premia, in order to reduce theinsurance costs of farmers. The subsidy varies by level of coverage and typeof product. Insurance premium discounts of a total amount of $ 400 millionincluded in the 1999 emergency assistance package further reduced the pricefor buy-up insurance coverage. Sparked by premium discounts and by anincrease in the maximum allowable yield or revenue guarantee from 75% to85%, participation in crop insurance increased in 1999, particularly for thebuy-up coverage levels.
In June 2000 President Clinton signed the Agricultural Risk Protection Actof 2000. The objectives of this reform are: (1) to make buy-up coveragemore affordable to farmers by increasing premium subsidies; (2) to addressthe impact of multiple-year losses on the reduction of insurance referencelevel; (3) to broaden the coverage to new crops and regions, and (4) toimprove the provisions against fraud (Glickman 2000). The act makesavailable $ 8´200 million for insurance for the next five years.
The increase in subsidies for the programmes based on the ActualProduction History is shown in table 5.3. At a 100% price coverage level,premium subsidies now range from 38% for 85% yield coverage to 67% for50% yield coverage.

54
7DEOH����$JULFXOWXUDO�5LVN�3URWHFWLRQ�$FW������
&KDQJHV�LQ�SUHPLXP�VXEVLGLHV�IRU�GLIIHUHQW�FRYHUDJH�OHYHOV
&RYHUDJH�OHYHO±�<LHOG����±�3ULFH����
50100
55100
60100
65100
70100
75100
80100
85100
3UHYLRXVVXEVLG\
55% 46% 38% 42% 32% 24% 17% 13%
1HZ�VXEVLG\ 67% 64% 64% 59% 59% 55% 48% 38%
* applied to major crops under APH coverage. Rates of subsidy may differ for price coverage levels lessthan 100%
** applies to all plans of insurance (except group risk-based policies) and all price levels within a certainyield coverage level.
6RXUFH��50$���������KWWS���ZZZ�UPD�XVGD�JRY�QHZV�SU�������������KWPO�
������� 8QLW�VWUXFWXUH�RI�LQVXUDQFH�FRQWUDFWV
Under a crop-insurance contract, the insured farmer agrees to insure alleligible acreage of a crop planted in a particular county. This choice is madecounty by county and crop by crop. In order to reduce the potential foradverse selection against the insurance provider all eligible acreage must beinsured. However, farmers have a possibility to divide eligible acreage todifferent insurance units. Each parcel of land that is insured independently ofother parcels is called a ‘unit’ and one farming operation may have severalinsurance units. This means that farmer may receive an indemnity payment,e.g. because of hail, on one unit, while other units on the same farm producea record crop.
The unit structure of a farm is a very important part of an insurance contract,because it determines the guarantee, premium, and amount of any possibleloss payment for the unit’s crop acreage. Often farmers like to divide theirland into as many units as possible to maximise the risk managementprotection offered by insurance policies, although this may result in higherpremium costs with a more differentiated unit structure.
������� 6FRSH�DQG�FRVWV�RI�FURS�DQG�UHYHQXH�LQVXUDQFH�SROLFLHV
Participation in the crop insurance programmes increased significantlyfollowing enactment of the 1994 Act. For example, in 1999, 196 millionacres of farmland was insured under the programmes. This is about twice theacreage insured in 1994 and represents today about two-third of the country’stotal planted acreage of field crops.
The liability (value of insurance in force) in 1999 is about $ 30.9 billion, thelargest amount since the inception of the programme, and is expected to risefurther in 2000 (Table 5.4).

55
The total premium which includes subsidies and the premium paid byfarmers was $ 2.3 billion in 1999. In recent years, indemnities (thecompensation received by farmers for qualifying losses paid under insuranceprogrammes) have varied between $ 0.6 billion and $ 2.4 billion.
7DEOH����6FRSH�RI�FURS�LQVXUDQFH�SURJUDPPH�LQ�86$�LQ����������
���� ���� ���� ���� ���� ���� ����
Area insured Mio acres(Mio ha)
100(40)
221(89)
205(83)
182(74)
181(73)
196(79)
203(82)
Liability Mio $ 13 598 23 728 26 878 25 446 27 919 30 864 33 793
Total premium Mio $ 949 1 543 1 839 1 774 1 874 2 305 2 493
- of which subsidy
Mio $($ / ha)
255(6.4)
889(10.0)
982(11.8)
902(12.2)
946(13.0)
953(12.1)
932(11.4)
Indemnity Mio $ 601 1 568 1 493 991 1 675 2 416 706
* data until October 20006RXUFH��6XPPDU\�RI�EXVLQHVV�UHSRUW��50$��KWWS���ZZZ�UPD�XVGD�JRY�GDWD��QDWLRQDO�
The total costs consist of delivery expenses, administration costs andindemnities. The total programme cost for crop insurance policies has rangedbetween $ 1´600 million and $ 2´400 million during the last five years and isexpected to increase in 2000 up to almost $ 2´600 million (table 5.5). Thenet government costs (total costs less premium paid by producers) haveranged from $ 1´100 million and 1´700 million during the period 1995 to1999 and are expected to stay at that high level in 2000.
7DEOH����8�6��)HGHUDO�*RYHUQPHQW�H[SHQGLWXUH�RQ�FURS�LQVXUDQFH
�LQ�PLOOLRQ�GROODUV�
&URS�\HDU
���� ���� ���� ���� ������� �������
Delivery expenses 392 487 450 429 401 426
Indemnities 3) 1 463 1 834 1 072 1 394 1 980 2 084
Administration andoperation of RMA
75 68 67 63 64 71
7RWDO�SURJUDPPH�FRVWV 1 930 2 389 1 589 1 884 2 449 2 585
Less producer premium n.a. n.a. - 842 - 928 - 905 - 954
Underwriting gain n.a. n.a. 340 412 127 134
Producer premium net 4) - 573 - 641 - 502 - 516 - 778 - 820
1HW�*RYHUQPHQW�FRVWV 1 357 1 748 1 087 1 368 1 671 1 765
1) current estimate2) 2000 Budget3) Indemnities differ between tables 5.6 and 5.7 because of different accounting periods.4) Net of underwriting gain retained by companies6RXUFH��%XGJHW�VXPPDULHV�IRU������������KWWS���ZZZ�XVGD�JRY�DJHQF\�RESD�+RPH�3DJH�RESD�KWPO�

56
������� 1HZ�GHYHORSPHQWV
At present, RMA is under a mandate for crop and revenue insuranceprogramme VLPSOLILFDWLRQ. It is stated that the present policies are complex,require massive amounts of data and are costly to administer. During autumn1999 Senate Agricultural Committee has been discussing on possibilities toreform the present crop and revenue insurance policy. There seem to be twobasic lines for the reform. The first is to make technical changes to thecurrent insurance programme and to call for more money for the programme.The second is to integrate risk management into the broader context ofagricultural policy. Under this approach, direct payments could be made tofarmers who use at least two different risk management practices. Despitethe diverging views on the ways to reform, there is a consensus that reform isneeded as the present system is lacking attractiveness and participation forsome producers and in some regions (see also section 7.1).
To date, government was involved only in crop and revenue insurancepolicies but not in OLYHVWRFN�LQVXUDQFH. Several types of insurance coveringlivestock are widely available in the United States through the private sector.However, these products are not subsidised by the Federal Government.Annex 4 provides a short description of insurance options for livestockfarmers.
The 2000 Agricultural Risk Protection Act also establishes a pilot insuranceprogramme for livestock and includes a mandate for USDA to providecompetitive grants to educate producers in under-served areas about the fullrange of risk management activities – the aim being to increase participationin these regions.
In the current debate, one of the weaknesses of the 1996 Farm Bill isperceived as its failure to act in a counter-cyclical manner. Cash transitionpayments are (by design) paid to farmers even when market income is highand the size of the payments does not increase when market income is low.Therefore, political support is growing in the US for payments whichincrease, when market income goes down and which decrease, when it goesup.
The 2001 budget proposal of the Clinton administration is a step into thisdirection. Amongst other initiatives, the administration proposed aprogramme, under which supplemental government payments would beprovided to eligible producers if projected gross income for certain crops(wheat, feed grains, rice, upland cotton and oilseeds) falls below 92 percentof the preceding 5-year average. In the proposal, gross income included grossmarket revenues for the crop plus government payments (USDA 2000a).
For early 2001 the US Commission on 21st Century Agriculture is expectedto publish a report on how to establish a farm LQFRPH� VDIHW\� QHW for USagriculture. The underlying idea is to convert the AMTA (AgricultureMarketing Transition Act) into counter-cyclical payments which would varydepending on the level of farm prices and/or income. The objective is tomitigate the (political) need for massive annual emergency payments.

57
One such proposal, called SIPP (Supplemental Income Payments forProducers), was introduced as a bill in Congress. SIPP would makepayments to producers of a crop when the per-acre national gross revenue forthat crop falls below a set percentage of the 5-year average of that crop’s peracre national gross revenue. The cost of such a policy at a 95 percentpayment trigger level would have averaged $ 1.06 billion per year had it beenin place from 1977 to 1998.
As the programme would depend on national triggers, it would be free ofmoral hazard and adverse selection problems. The problem of such a systemis that farmers of a particular region suffering yield losses may not receive apayment because revenue at the national level has not dropped sufficiently.To solve this problem, payments could be based on regional yields. Anotherpotential problem is the influence such a programme would potentially haveon planting decisions. If - before planting - the price for a crop fallssignificantly below the 5-year average, the probability increases that farmersreceive compensation. In such a case, the programme would significantlyinfluence the planting decision. Basing the guarantee on a futures marketprice could solve this problem.
Such a system based on national/regional triggers would cover the part of thefarmers´ risk exposure which is systemic in nature. With such a system inplace, traditional crop insurance could deal with the part of the risk which isnon-systemic (Hart and Babock 1999).
An alternative to the crop-specific revenue safety net under discussion is aninstrument known as Commodity Income Supplement Support (CISS),which is an idea for a safety net based on the DJJUHJDWH�revenue of a numberof programme crops.
����� &DQDGD
Canada has three different programmes that create a basic coverage for yield andincome risks in farming. These are the Crop Insurance Programme (CI), the NetIncome Stabilisation Account (NISA), and the Agricultural Income DisasterAssistance (AIDA). The common objective is to provide income stabilisation and asafety net system against crop and revenue risks to farmers. In addition, province-specific programmes are used to complement these programmes in addressing morespecific provincial and regional concerns.
������� &URS�,QVXUDQFH�3URJUDPPH��&,�
In Canada, the history of crop insurance dates back to 1939 when theCanadian Government introduced the Prairie Farm Assistance Act. This actprovided permanent crop loss disaster assistance for grain producers in thePrairies and the Peace River area. In 1959, the &URS� ,QVXUDQFH�$FW waspassed to provide more adequate protection to farmers in all provinces. Cropinsurance has been a key federal support programme since 1959 and hasvaried little over the years. Basic features are involvement of both levels ofgovernment (federal and provincial) and producers, shared programme costs,

58
voluntary participation, provincial administration, and the objective ofactuarial soundness in the long run.
Crop insurance provides production risk protection to producers by coveringcrop losses caused by natural hazards like drought, flood, hail, frost,excessive moisture, uncontrollable diseases and insects. There is also aprovision for crop damage incurred by protected migratory waterfowl.
In crop insurance, crop loss protection is available to farmers in the form of ayield guarantee. It is based on a producer’s individual previous productionhistory. If production falls below that hypothetical yield, the producer will beeligible for an indemnity. Generally, the maximum coverage available is 80per cent while up to 90 per cent coverage is available for low risk crops.Farmers are free to choose different coverage levels. The price at whichlosses are compensated is adjusted each year to reflect expected marketreturns for a representative grade of each crop.
Although federal legislation establishes the national framework, a lot offlexibility exists for provinces to modify the programme to meet the needs oftheir producers. Provincial plans are developed through consultations withall three parties (producers, federal and provincial governments) on acommon basis. Crop insurance is available in all provinces for a wide varietyof crops but coverage is not universal, nor are participation rates necessarilyhigh in spite of the fact that the costs of the programme are subsidised bygovernment. Two of the key conditions for the federal financial contributionsare that (1) premium rates must be set in an actuarially sound manner andprovincial schemes must be self-sustaining, and (2) the method used toestablish probable crop yields must reflect true yield histories.
7DEOH���� 6FRSH�RI�FURS�LQVXUDQFH�SURJUDPPH�LQ�&DQDGD�LQ����������
&URS�\HDUV������� ������� ������� ������� ������� ������� �������
Producers 1000 141,5 130,0 118,3 111,7 101,5 99,8 100,8Area insured Mio acres 54,1 46,5 40,7 39,7 40,8 43,8 49,2Coverage Million $ 4 534 4 302 3 888 4 071 4 992 5 212 5 446Premia Million $ 497 505 452 479 533 552 584Indemnities Million $ 784 464 269 286 247 293 284
6RXUFH��$JULFXOWXUH�DQG�$JUL�)RRG�&DQDGD�±�3HUIRUPDQFH�5HSRUWV��KWWS���ZZZ�DJU�FD�USS�GSUH�KWPO�
During the crop year 1998-99, over 100 000 farmers and almost 50 millionacres were insured through the programme (table 5.6). This means that about50 % of all eligible producers and 55 % of all crop and forage acres inCanada were insured. The total value of insurance in force was Canadian$ 5.4 billion in 1998-1999. In recent years, the total indemnities paid havebeen about 50-60 per cent of the total premia paid by farmers andgovernments together, but in 1992-1993 indemnities were much higher thanpremia.

59
Federal contributions to the Crop Insurance Program are provided under theauthority of the Farm Income Protection Act (FIPA). Currently, Agricultureand Agri-Food Canada (AAFC) allocates approximately $ 200 million peryear to crop insurance from its total safety net envelope of $ 600 million. Atpresent, the federal government and provinces each pay 25 % of total premiaand 50 % of administration costs. In recent years, the federal government’sexpenditures for crop insurance have increased. In the last fiscal year federalexpenditures were $ 226.9 million (table 5.7). The federal part of thepremium costs was $ 181.3 million and of the administrative costs $ 45.6million. Because of the cost share nature of the crop insurance programme,provincial governments are spending collectively about an equal sum ofmoney on the programme as the federal government.
7DEOH���� )HGHUDO�FRVWV�RI�FURS�LQVXUDQFH�LQ�&DQDGD�LQ������������LQ�PLOOLRQ���
)LVFDO�\HDU
Federal contribution to ������� ������� ������� �������
Premia 123,6 149,8 167,8 181,3
Administrative cost 45,4 36,1 38,3 45,6
7RWDO�)HGHUDO�FRVWV ����� ����� ����� �����
6RXUFH��$JULFXOWXUH�DQG�$JUL�)RRG�&DQDGD�±�3HUIRUPDQFH�5HSRUWV
In addition to premium subsidies and contributing financially toadministrative cost, Federal government may enter into a reinsuranceagreement with provinces according to the Farm Income Protection Act. Atpresent, four provinces have reinsurance agreements with the federalgovernment: Alberta, Saskatchewan, Manitoba and New Brunswick. BritishColumbia and Ontario buy reinsurance from the private sector and thefederal government shares in the costs.
������� 1HW�,QFRPH�6WDELOLVDWLRQ�$FFRXQW��1,6$�
1HW� ,QFRPH� 6WDELOLVDWLRQ� $FFRXQW� �1,6$� is a voluntary programmedeveloped jointly between producers and the government of Canada andparticipating provinces. It was introduced in 1991 as a part of the FarmIncome Security Act. The programme is designed to help producers toachieve long-term farm income stability on an individual basis. Producersare provided with the opportunity to deposit money annually into their NISAaccount which is supplemented by matching government contributions. Inlower income years, producers can make withdrawals from the funds theyhave set-aside.

60
NISA is available in all ten provinces. Anyone who files a farm income taxstatement can participate in the programme. Corporations, co-operatives orcommunal organisations which file an income tax return reporting farmingbusiness income/loss and meet specified eligibility criteria may alsoparticipate. To be eligible to participate in NISA, producers must open aNISA account at a participating financial institution of their choice.
In practice, NISA subsidises and assists farmers in building savings for lowrevenue years. This is done through savings accounts where farmerscontribute and receive a dollar-for-dollar match from the government. Atpresent, farmers are allowed to contribute up to 3 per cent of Eligible NetSales (ENS) and they receive matching contributions from governments (2 %from the federal government and 1 % from the provincial government).Eligible net sales are calculated by subtracting purchases of qualifyingcommodities from the gross sales of qualifying commodities. A qualifyingcommodity is any primary agricultural commodity with the exception ofsupply managed commodities (dairy, poultry and eggs). Producers also havethe option of depositing an additional 20 per cent of their eligible net salesbut the government does not match these additional contributions. However,both the basic contributions and the additional ones earn a 3 per cent interestbonus above regular interest rates offered by the financial institutions.
A withdrawal from the account is allowed on the basis of the StabilisationTrigger or the Minimum Income Trigger. The Stabilisation Trigger entitles awithdrawal when farm’s current year Gross Margin falls below the GrossMargin average from previous years (up to five). The Gross Margin iscalculated by taking the net sales of all agricultural commodities, plusincome from contract work and machine rental, minus eligible expenses. TheMinimum Income Trigger entitles a withdrawal when net income from allsources falls below the minimum income threshold of $10´000 plus afarmer’s current year maximum matchable deposits. A farmer can closeher/his account at any time by submitting a written notification to NISA. Inthis case, the farmer can choose to have the entire account balance paid outeither in a lump sum or in annual instalments over a period of up to fiveyears.
At the end of the stabilisation year 1997, the net assets in the NISA accountswere $ 2.8 billion (table 5.8). The change in net assets varies between yearsbut until 1997 the net assets increased steadily every year. Federalgovernment contributions to the NISA programme were 264 million in 1997.In the same year, provincial governments were contributing 117 milliondollars and farmers’ deposits were 363 million dollars.

61
7DEOH����&KDQJHV�LQ�QHW�DVVHWV�RI�1,6$�SURJUDPPH�LQ������������LQ�PLOOLRQ���
6WDELOLVDWLRQ�\HDUV���WR��� ���� ���� ���� ���� ����
Participant deposits 533 173 295 405 341 363 Federal contributions 565 81 205 322 239 264 Provincial contributions 204 76 111 143 105 117 Regular interest 35 32 52 57 75 112
,QFUHDVH�LQ�QHW�DVVHWV ���� ��� ��� ��� ��� ��� Participant withdrawals 875 102 137 189 250 481 Administrative costs 18 5 5 8 8 8
'HFUHDVH�LQ�QHW�DVVHWV ��� ��� ��� ��� ��� ���Change in net assets 443 256 521 731 501 368
1HW�DVVHWV�HQG�RI�WKH\HDU
��� ��� ���� ���� ���� ����
6RXUFH��$JULFXOWXUH�DQG�$JUL�)RRG�&DQDGD�±�3HUIRUPDQFH�5HSRUWV
7DEOH���� 1HW�,QFRPH�6WDELOLVDWLRQ�$FFRXQWV�LQ�1RYHPEHU�����
3URYLQFH1XPEHU�RISDUWLFLSDQWV
7RWDO�YDOXH�RIIXQGV����LQ�PLOOLRQV
$YHUDJH�DFFRXQWLQ��
Alberta 25757 514.0 19955British Columbia 2856 53.3 18667Manitoba 19184 374.4 19515New Brunswick 343 13.3 38655Newfoundland 80 1.1 13478Nova Scotia 1073 15.0 14013Ontario 28762 585.6 20361Prince Edward Island 809 33.4 41299Quebec 1066 31.5 29595Saskatchewan 55951 1101.7 19690Whole country 135881 2723.3 20042
6RXUFH��1DWLRQDO�&URS�&RQGLWLRQV�5HSRUW��KWWS���ZZZ�DJU�FD�SROLF\�FURS�KRPHBH�KWPO�
In November 1999, the number of participating farmers was over 135´000,approximately 60 % of all eligible producers (table 5.9). The average balanceof accounts per farmer was about 20´000 dollars. The total balance in theautumn 1999 was slightly lower than 1997 ($ 2.7 billion).
������� $JULFXOWXUDO�,QFRPH�'LVDVWHU�$VVLVWDQFH��$,'$�
The $JULFXOWXUDO� ,QFRPH� 'LVDVWHU� $VVLVWDQFH� �$,'$� Programme is anational programme designed to provide assistance to producers facingdramatic income declines as a result of factors beyond their control and forwhich existing programmes cannot provide assurance of continuing the farmbusiness. It is a federal-provincial initiative introduced for the 1998 taxationyear. It is funded 60 per cent by the federal government and 40 per cent byprovincial governments. The federal government, through Agriculture andAgri-Food Canada, originally allocated $ 900 million for the delivery ofAIDA. In January 2000, the total federal allocations were $ 1.07 billion.
62
The AIDA programme is open to individuals, farming corporations, co-operatives and trusts filing a farm income tax return and providingsupplementary information. Producers will not be required to pay anyadministration fees for the federal share of the programme. Individualprovinces may have administrative fees for their share of the programme.
The AIDA programme takes a “whole-farm” approach. All commodities arecovered. This coverage is based on gross margins. Gross margin representsthe income available to the farmer after paying for the cash operating cost onthe farm; adjustments are made to ensure that beginning farmers, high-debtand low-debt farmers, and those with high and low investment levels aretreated equitably.
Maximum coverage does not exceed 70 per cent of gross margins averagedover the three previous years. When the gross margin in the claim year isnegative, the negative portion is not covered. The federal share is based on acap to individuals that does not exceed $175´000. Payments to corporationsor co-operatives reflect the number of shareholders or members, to amaximum of five. Caps for the provincial share are determined by theprovincial programme and may affect the total received by the applicant.
The federal portion of the programme is identical in every province, althoughto avoid duplicate delivery systems and to keep administrative costs to aminimum, AIDA is delivered through existing administrative processeswherever possible. Producers are not required to complete two applicationforms. AIDA eligibility and payment for the federal share is uniformlyapplied in all eligible provinces.
Farmers are entitled for AIDA payments whether or not they are eligible forNISA, crop insurance and other provincial programmes. However, anyAIDA payments will be reduced by an amount that is equivalent to the “basegovernment matching contributions” available through NISA whether or nota farmer is participating in NISA.
����� -DSDQ
As Japan lies in the monsoon zone, its agricultural production frequently suffersfrom heavy losses caused by typhoons, floods or low temperatures. However, thereare no private insurance companies offering agricultural insurance, but aFRPSUHKHQVLYH�SXEOLF�V\VWHP is in place (Yoshii 1999). The system consists of sixprogrammes and covers almost all crops and livestock, except for vegetables,flowers and fowls:
• Rice, wheat and barley insurance
• Sericultural insurance
• Livestock insurance
• Fruit and fruit-tree insurance
• Field Crop insurance
• Greenhouse insurance

63
The rice, wheat, barley, sericultural and livestock programmes are offered nation-wide. Participation is compulsory for rice, wheat, barley and sericulturalprogrammes because of the importance of the respective sectors for Japaneseagriculture. Compulsory participation prevents adverse selection and helps tostabilise the programmes as risks can be spread more widely.
Livestock insurance covers animal losses as well as expenses for treating diseasesand injuries (Kagoshima 1999).
The scheme has a three-level structure. Agricultural insurance is organised byAgricultural Mutual Relief Associations at the municipal level. As natural disastersoften cause extensive damage over a wide area, the risks cannot be sufficientlyspread within a municipality. Therefore, the Associations are re-insured byFederations at the prefectural level which in turn are re-insured by the centralgovernment. Furthermore, the central government partly subsidises farmers premiaand a part of the insurers´ administrative expenses.
In 1996, government expenditures amounted to JPY 153´100 million (¼� �����million), the main item being the subsidy of JPY 90´400 million provided topolicyholders (¼�����PLOOLRQ���7KH�VXEVLG\�UDWH� IRU� WKH�SUHPLXP�LV����SHU�FHQW� IRUmost of the programmes.
The programmes not always seem to correspond to farmers’ needs. Small, part-timefarmers depend more on their off-farm than on their on-farm income and thus have asignificant capacity to cope with income risk themselves. This seems to be the mostimportant reason, why they are reluctant to pay premia under the compulsoryprogrammes. On the other hand, some large-scale farmers feel that the premia theyhave to pay don’t fully correspond to their risk exposure and that small farmersbenefit more from the system. Another point of criticism is that insurance is onlyhelpful in the case when damages exceed a certain level. Japanese authorities alsoconsider improving further the administration of the programmes.
5LFH� )DUP� ,QFRPH� 6WDELOLVDWLRQ� SURJUDPPH� This programme was introducedwithin a set of new policies in the rice sector. If the price for rice declines in a givenyear compared to the average price achieved over the preceding three-year period,the farmers receive 80 per cent of the price difference as compensation. Thecompensation is paid out of a stabilisation fund which is financed by farmers (25 %)and the government (75%). Only those farmers who fully comply with certain set-aside requirements can participate in this scheme (The Food Agency, MAFF Japan).

64
��� :72�,668(6
In the framework of the Uruguay Round Agreement on Agriculture (URAA)domestic support has to be reduced in six equal annual instalments starting from1995. For developed country members, reduction amounts to 20 per cent ascompared to the base period 1986-88. Reduction commitments are defined in termsof a reduction of a “Total Aggregate Measurement of Support” (Total AMS) whichincludes all product-specific support and non-product specific support in one singlefigure. Two categories of support (green and blue box) are exempt from thereduction commitments.
To be classified under the green box, support measures have to fulfil certainconditions as specified in the Annex 2 of the Agreement. A number of conditionsrelate to all green box measures (no price support, no or at most minimal trade-distorting effects, no effects on production) (Point 1 of Annex 2). Additionalconditions relate to specific types of support. Among others, specific conditionsrelate to (1) income insurance and income safety nets and (2) disaster aids (seeannex 5 of this report).
(1) Subsidies for insurance and government participation in income safety-nets(point 7, heading “Government financial participation in income insurance andincome safety-net programmes”)
Government financial participation in insurance is classified as green boxcompatible if:
• the insurance relates to LQFRPH� shortfall� based on a reference period. Thepayments may QRW�relate to the type or volume of production (including livestockunits) or the prices (domestic or international) applying to such production or tothe factors of production employed and
• the income loss is more than 30 per cent and the amount of payments compensatefor less than 70 per cent of the producer´s income loss.
The same conditions apply for government participation in income safety-nets.
(2) Disaster aids (point 8, under the heading “Payments made (either directly or byway of government financial participation in crop insurance schemes) for relief fromnatural disasters”)
Government payments for relief from natural disaster (made available either directlyor by way of governmental financial participation in crop insurance schemes) havebasically to fulfil the same conditions. There are, however, a number of differences.Payments can only be triggered by a production loss resulting from a disaster whichis specifically recognised as such by the government. Payments can relate besidesincome also to losses of livestock, land or other production factors and cancompensate up to 100 per cent of the total cost of replacing losses. Where producersreceive payments under income insurance/safety-net programmes DQG�payments forrelief for natural disaster,�the total of such payments must be less than 100 per centof the producer’s total loss.

65
With a view to the ongoing WTO round and in the light of the wide-spread use ofinsurance systems by trade partners, there might be attempts to widen the scope ofthe green box provisions in order to encompass a wider range of insurance andsafety net measures. This could be concluded for example from the negotiationposition of the US, which underlines the importance of minimally trade distortingsupport which “could include, among others, income safety-net and riskmanagement tools….” (US 2000).
66
��� /(66216�)520�(;,67,1*�6<67(06�2)�$*5,&8/785$/�,1685$1&(
From the experience of existing systems of agricultural insurance several lessonscan be drawn. Most of the material available is based on the US experience,including several reports by the United States General Accounting Office (GAO)and the Office of the Inspector General of USDA (OIG). These reports focus moreon yield than on revenue insurance as the latter products are still in an experimentalstatus (Skees 2000).
����� &RYHUDJH�DQG�SDUWLFLSDWLRQ
(YHQ� IRU� ZHOO�GHYHORSHG� DQG� ZHOO�HVWDEOLVKHG� DJULFXOWXUDO� LQVXUDQFH� V\VWHPV� WKHFRYHUDJH�LQ�WHUPV�RI�SURGXFWV�DQG�SDUWLFLSDWLRQ�UDWHV�UHPDLQV�OLPLWHG��7KLV� LV� WUXHHYHQ� IRU� SURGXFWV� ZKLFK� DUH� VSHFLILFDOO\� GHVLJQHG� WR� SURYLGH� EDVLF� VDIHW\� QHWFRYHUDJH�IRU�HYHU\�IDUPHU�DQG�ZKLFK�DUH�SURYLGHG�DW�YHU\�ORZ�FRVW�
In the US, SURGXFW�FRYHUDJH by federal crop insurance has increased significantlyover the last years (75 crops in 1999 compared to 59 crops in 1994; GAO 1999a).However, important speciality crops (e.g. citrus fruits, pears, peppers, plums, flax)are still excluded and may just rely on basic coverage through the non-insuredAssistance Programme NAP. Moreover, the livestock industry is not (yet) coveredby the standard insurance programmes, although it represents the most importantsector of American agriculture in terms of value of production. In Spain, all cropscan be covered (at least for the most important risks). However, as in the US,coverage for animal production remains less developed.
As to the level of SDUWLFLSDWLRQ� in the US two thirds of the country’s total eligibleacreage of field crops is insured under the programme in 1999 (Harwood HW� DO�2000). However, only 400´000 farmers out of 2 million farmers nation-wideparticipate in the programme (20 %) (GAO 1999c). In Spain, the participation rateis 31 percent.
Relatively low participation rates in the US are the more surprising as farmers onaverage benefit substantially from the insurance programmes. Since 1995, the USaggregate indemnity/producer-paid premium ratio has averaged nearly 1.77,implying $1 of premium has bought $1.77 of expected indemnity benefit on average,plus additional benefit from risk reduction which is not included in the figures(Schnepf and Heifner 2000).
There are several reasons which may explain less-than-universal participation:
• Other safety nets exist (like off-farm income) or other instruments to managerisk are considered more useful (i.e. providing a better level of coverage) orcheaper for a given level of risk-reduction. The US CAT programme is anexample of a programme which is considered not to be useful by certainfarmers.
The “linkage” provision in the 1994 Reform Act required that farmersparticipating in the annual commodity programmes (e.g. commodity loans

67
and deficiency payments) also had to acquire at least the CAT level ofinsurance coverage.
When the linkage requirement was eliminated by US Congress in 1996, thenumber of CAT policies fell sharply (in 1998 it was down 66 per cent over1995) (OIG 1999c). According to OIG (1999c) producers decided not toparticipate in the CAT programme because the protection provided was notsufficient, despite the fact that premia are 100 per cent subsidised andproducers only have to pay an administrative fee. Indeed, CAT will not payindemnities until a producer has lost over half of his crop, and guarantees theloss at only slightly more than half of the market price. This means that aproducer who has lost everything will recover only about a quarter of thevalue of the total crop.
• The risk environment and probably also the risk perception vary significantlyfrom farmer to farmer and therefore risk-management strategies have to betailored to individual needs. Even with the subsidies available, farmers maycome to the conclusion that the premia they would have to pay for a specificinsurance product do not reflect their specific risk-exposure. They mayperceive the premium rates overstating their individual risk of loss.
• Information deficits: Farmers may lack the necessary information on theprogrammes available or misunderstand the way the numerous programsavailable are operating.
• Following their experience, US farmers may also rely on their expectationthat potential losses will be covered by public ad hoc disaster assistancepayments.
����� ,QFHQWLYH�VWUXFWXUH�DQG�HIILFLHQF\
)RU� D� V\VWHP� RI� DJULFXOWXUDO� LQVXUDQFH� WR� EH� FRPSUHKHQVLYH�� L�H�� WR� FRYHU� D�ZLGHUDQJH� RI� SHULOV� DW� D� OHYHO� RI� SURWHFWLRQ� ZKLFK� LV� LQWHUHVWLQJ� WR� WKH� IDUPHU�� VWDWHLQYROYHPHQW� VHHPV� QHFHVVDU\�� VLQFH� SULYDWH� LQVXUDQFH� FRPSDQLHV� DORQH�ZRXOG� QRWKDYH�VXIILFLHQW�LQFHQWLYHV�WR�GHOLYHU�LW��+RZHYHU��VHULRXV�TXHVWLRQV�DULVH�DV�UHJDUGVWKH�HIILFLHQF\��RI�SURJUDPPHV��ZKLFK�DUH�EDVHG�RQ�D�SXEOLF�SULYDWH�SDUWQHUVKLS�
The lack of efficiency is a main point of criticism in particular for the USprogrammes. The OIG reports focus on the efficiency of the CAT programmeincluding buy-up policies. Two main arguments can be summarised:
• Success of the programme vs. underwriting gains of the LQVXUDQFH industry
The OIG’s view is that the CAT programme has failed in providing theintended safety net (particularly to the small farmer), while it has producedsignificant underwriting profits for the insurance industry. According to theOIG (1999a), the insurance companies involved in CAT were able to benefitfrom significant windfall profits. From 1995 to 1998, companies gained about$ 305 million in CAT underwriting which represents a return of about 19 percent on gross imputed premia of about $1.6 billion. Also for buy-up policies,

68
the insurance companies gained about 14 per cent on gross premia of about $5.4 billion (OIG 1999b).
• Indemnities paid out to producers vs. total delivery costs
With the CAT programme between 1995 and 1998 more money went to theinsurance companies than to producers helping them to recover from insuredlosses. The insurance companies involved received about $ 506 million forthe delivery of CAT insurance (administrative expenses, loss adjustment,excess lost adjustment expenses and underwriting gains) while the farmersonly received indemnities for about $ 250 million. In other words, delivering$1 to producers suffering from crop losses costs more than $ 2 within theCAT programme (OIG 1999c).
However, the USDA has argued that such remarkable underwriting gains aredue to specific conditions. Growing conditions have been generallyfavourable in the period taken into account and at the same time the averagefigures mask wide variation among areas, companies and years (Harwood2000). Large potential underwriting gains are seen to be a necessary conditionfor the companies to provide insurance products, since the SRWHQWLDO�ORVVHV forthe insurance companies are large as well. The USDA maintains that this isthe case under the SRA in effect (Harwood 2000).
The efficiency question is linked to the question of incentives. According to the OIGthe companies do not have an adequate incentive to manage the crop insuranceprogramme in an actuarially sound manner, because the public reinsurance leavesonly PLQLPDO� ULVNV to the private companies (OIG 1999a). Because they incurminimal risk, insurance companies involved have little reason:
• to effectively monitor risky policyholders
• to deny claims of questionable losses14
• to improve their own practices and performance15.
As a profit oriented actor in a market economy, the insurance industry legitimatelyseeks to maximise profits. Thus in a private public partnership concerning thecomplex and sometimes intransparent system of agricultural insurance, thegovernment has to closely monitor private gains. The framework and incentives forthe private industry have to be adjusted regularly if the private sector appears to beovercompensated in relation to the services it provides (use of existinginfrastructure, know-how etc.). An appropriate incentive structure is also necessary
14 Individual claims are verified by so called loss adjustors. They are either employees or privatecontractors, and, as such, are impelled to favourably adjust claims to retain customers for the reinsuredcompanies, which in turn provide them with employment. OIG suggests that there is a need for aseparation of duties between the loss adjuster and the reinsured companies (OIG 1999b).
15 For example, OIG has found quality control reviews to be superficial and not providing independentverification of claims (OIG 1999a).

69
to make sure that the private sector effectively contributes to keep the losses for theJRYHUQPHQW as low as possible.
Constant evaluation of programme performance is not only necessary to avoid over-compensation but also to make sure that the goals of the programme can beachieved. For example, if a programme intends to offer support to all producers (nomatter what their characteristics are as regards economic situation, size etc.), theprivate sector has to be given the right incentives to make sure that it serves allproducers equally well.
For the US, the OIG has identified a specific problem concerning incentives.Administrative fees to compensate insurance companies for their services are paid asa percentage of premia collected16. This is criticised because the workload and costassociated with administering an insurance policy do not increase proportionallywith the premium. In fact, the larger the premium of an individual policy, the greaterthe differential between reimbursement and the actual costs the insurance companiesincur to administer this policy17. Reimbursement proportional to premium volumemotivates insurance companies to promote insurance types that have a largerpremium or prefer larger producers. This results in a bias against small producers,which undermines the effectiveness of the crop insurance programme as a safety netfor DOO� SURGXFHUV�� “Getting the incentives right”, thus, is a constant concern in aprivate-public partnerships.
Delivery through public institutions could be an alternative which deserves carefulevaluation. The OIG, for instance, has raised the question whether it would not becheaper to deliver and administer the Federal crop insurance programme through theexisting field office structure of the Farm Service Agency (2500 field officesthroughout the country, 15´000 employees for delivering numerous programmesincluding the Agricultural Marketing transition Act, price support, conservation,emergency assistance, and loan programmes) (OIG 1999a and OIG 1999b). It isestimated that the additional costs incurred could be lower than the $ 759 millionreceived by private insurance companies for delivering the 1998 programme.
����� 3URJUDPPH�GHVLJQ
$� SXEOLFO\� VXSSRUWHG� LQVXUDQFH� SURJUDPPH� FDQ� EH� XQGHU� �SROLWLFDO�� SUHVVXUH� WRSURYLGH� SURGXFWV�ZKLFK� KDYH� QRW� EHHQ� VXIILFLHQWO\� WHVWHG� DQG�ZKLFK� FDQ� WKHUHIRUHXQGHUPLQH�WKH�VRXQGQHVV�RI�WKH�V\VWHP�
16 In 1999 companies were reimbursed for their sales and service expenses at 11 per cent of totalpremium for CAT coverage, and 24.5 per cent of total premium at buy-up levels for APH insurance.The buy-up reimbursement is higher than for CAT because of the higher probability of claims and theassociated added paperwork and loss adjustment (Harwood et al. 2000).
17 A closer link between the number of policies sold and the reimbursement is therefore advocated.Although the number of policies sold decreased 23 per cent from 1996 to 1998, reinsured companies´administrative reimbursements decreased only about 10 per cent (OIG 1999b).

70
The US Risk Management Agency has been accused of insufficient research beforeimplementing crop insurance policies. This systemic flaw has resulted inunreasonably high reference yield figures in certain programmes, such as cotton andcorn, but it has also resulted in poorly written policies for some speciality crops.Moreover, the lack of historical data made it impossible to measure the actuarialappropriateness of insurance products. CRC (Crop Revenue Coverage) for examplewas initially established as a pilot programme for 1996 in two States, and wasexpanded the following year, still without actuarial history. Despite this, it coveredmost of the corn, cotton, rice, grain sorghum, soybeans, and wheat produced in theU.S. (OIG 1999b).
����� &RPSOH[LW\
:KLOH�D�JRYHUQPHQW�SURJUDPPH�PLJKW�EH�UHODWLYHO\�VLPSOH�DW� WKH�RXWVHW��FKDQJLQJGHPDQGV�DQG�WKH�QHHG�WR�UHVSRQG�WR�SURJUDPPH�GHILFLHQFLHV�DUH�OLNHO\�WR�LQFUHDVHLWV� FRPSOH[LW\� DQG� GHFUHDVH� WUDQVSDUHQF\� RYHU� WLPH�� 7KH� 86� V\VWHP� RI� FURSLQVXUDQFH� WRGD\� LV� VR� FRPSOH[� WKDW� RQO\� IHZ�SHRSOH� XQGHUVWDQG� LW� IXOO\�� 7KH�PRUHFRPSOH[� D� V\VWHP� JHWV�� WKH� HDVLHU� LW� LV� IRU� WKH� YDULRXV� VWDNHKROGHUV� �� ZKR� DUHJHQHUDOO\�QRW�FRQFHUQHG�ZLWK�WKH�RYHUDOO�HIILFLHQF\�RI�WKH�V\VWHP���WR�HQJDJH�LQ�UHQW�VHHNLQJ��6NHHV�������
The complexity of a programme increases with its scope and participation rates. Inthe US, the number of different premium rates in effect has exploded. Thecomplexity does not only result in high delivery and control costs but also makes itdifficult to consider reforms (Skees 1999b).
The complexity of the crop and revenue insurance policies is very likely to createmoral hazard problems. For example, the possibility to divide eligible acreage todifferent insurance units allows U.S. producers to isolate a ‘disaster’ on a very smallunit of land, even though overall production was normal. The optional unit policymight encourage a producer to dishonestly shift production from one unit to anotherto create a qualifying loss and to create a false production history on some units forfuture claims of losses. In principal, it is the loss adjusters’ duty to control thatclaims are valid but control of false claims is very difficult.
As often observed with government programmes, shortcoming and failures result inrefining existing instruments or adding new instruments. The introduction of a“Yield Floor Option” programme in 1999 for barley and spring wheat in Minnesotaand North and South Dakota is an example for this in the field of crop insurance.The programme was introduced as a pilot programme to help farmers overcome theproblem that their insurance guarantee was low because of low reference yields as aresult of the poor weather and plant diseases in the years before. With the “YieldFloor Option” they are now allowed to use yields which are calculated in a waywhich is normally used for farmers who are unable to provide records of farm-levelactual production history (Dismukes 2000).
71
When complexity of programmes coincide with participatory approaches, there is aneven higher risk that group interests drive the system towards a mechanism thedominating function of which is to shift public money to agriculture and theinsurance companies. As a result, the degree of government involvement might gofar beyond the justifiable level of intervention. Channelling income to farmers couldwell be a desirable outcome. However, particular attention has to be paid tounwanted side-effects such as distorting competition among farmers in differentcountries and attracting resources to inefficient production in high-risk areas orhigh-risk production programmes (section 7.6).
����� /LPLWV�RI�D�FRPSUHKHQVLYH�V\VWHP�RI�DJULFXOWXUDO�LQVXUDQFH
(YHQ�LI�DQ�LQVXUDQFH�V\VWHP�EHQHILWV�IURP�FRQVLGHUDEOH�SXEOLF�VXSSRUW�LW�FDQQRW�EHH[SHFWHG�WKDW� WKH�WDNH�XS�UDWH�ZLOO�EH�XQLYHUVDO��7KH�UHDVRQ�LV� WKDW� IDUPHUV��QHHGVYDU\�ZLGHO\� DQG� D� V\VWHP� FDQ� QHYHU� EH� WDLORUHG� WR� WKH� QHHGV� RI� HYHU\RQH�� ,W� ZLOOWKHUHIRUH� QHYHU� SURYLGH� D� VDIHW\� QHW� IRU� WKH� ZKROH� IDUPLQJ� FRPPXQLW\� DQG� WKHWHPSWDWLRQ�WR�SURYLGH�DG�KRF�DLGV�UHPDLQV�FRQVLGHUDEOH�
In the US, a combination of low crop prices, regional weather disasters, and theimpact of multiple-year losses caused financial problems to farmers in 1998. As aresult, Congress and the Administration agreed on providing help through a $ 6billion emergency farm aid package. In 1999, even more money, $8.7 billion, wasallocated to ad hoc relief. Although the subsidies to insurance programmes wereincreased in parallel, it seems that the crop insurance programme has not become theprimary source of federal assistance for farmers suffering a crop loss.
The main reason for farmers to complain about insufficiencies of the insurancesystem seems to be its failure in providing a sufficient safety net in the event ofnatural disaster and/or abrupt revenue reduction. Basic CAT coverage is low, andnot all farmers have bought higher levels of coverage (two-third of the farmers whohave crop insurance). In addition, current insurance products do not protect farmersagainst low prices that carry over annually because they are based on expectedmarket prices established at the beginning of the growing season18. On the otherhand farmers who experience several years of adverse weather conditions may beunable to obtain acceptable insurance coverage because the coverage level availableis normally linked to, and limited by, their actual production history (Leach 1999).
Of course, ad-hoc aids, at the same time as making up for deficiencies of theinsurance programme, undermine the system as they probably prevent a substantialnumber of farmers from participating.
����� (TXLW\�DQG�LQIOXHQFH�RQ�SURGXFWLRQ
,Q� D� VXEVLGLVHG� V\VWHP� RI� DJULFXOWXUDO� LQVXUDQFH�� VXEVLGLHV� DUH� QRUPDOO\� VHW� DV� DSHUFHQWDJH�RI�WKH�XQVXEVLGLVHG�SUHPLD��WKHUHIRUH�WKRVH�IDUPHUV�DQG�UHJLRQV�IDFLQJ
18 Learning from Canadian experience, most US revenue insurance products use an intra-year, futures-based price in establishing the guarantee, rather than a long-term average price (Skees 1999b).Similarly, in yield insurance, the indemnity price is based on the FCIC´s estimate (made prior toplanting and sales closing) of the market price at harvest. Therefore, the US crop insurance systemdoes not solve the problem of falling prices over several years.
72
WKH� KLJKHVW� ULVN� UHFHLYH� WKH� KLJKHVW� VXEVLGLHV�� ,Q� WKDW� VHQVH�� VXFK� D� V\VWHP� UDLVHVTXHVWLRQV�DV�UHJDUGV�VRFLDO�DQG�UHJLRQDO�HTXLW\�
:KLOH�LW�LV�JHQHUDOO\�DFNQRZOHGJHG�WKDW�WKH�VXEVLGLHV�KDYH�DQ�HIIHFW�RQ�SURGXFWLRQDQG� SULFHV�� WKH� VL]H� RI� WKH� HIIHFW� LV� DQ� LVVXH� RI� GHEDWH�� 6XEVLGLHV� DUH� OLNHO\� WRLQWURGXFH� ULJLGLWLHV� WR� WKH� V\VWHP�� %HFDXVH� RI� WKH� VXEVLGLHV� SURGXFHUV� ZLOO� QRWDEDQGRQ� SURGXFWLRQ� LQ� KLJK�ULVN� DUHDV� ZKLFK� FDQ� UHVXOW� LQ� VLJQLILFDQW� FRVWV� IRUVRFLHW\�DV�D�ZKROH�
The contentious issue is whether insurance subsidies have a significant influence onproduction and prices. In the US, some authors argue that crop insurance subsidiessignificantly boost production19, others say that the value of the subsidies have so farhad no effect on cropping decisions as they are too small in comparison with cropreturns as to be of any significant influence20. Even the latter authors, however,expect that with rising subsidies the distorting effects will become greater.
The fact that producers in high-risk areas can take these risks at relatively low costsmakes it likely that production is locked-in in these areas with the respective costsaccruing partly to society as a whole (in the form of disaster assistance etc.).
19 Keeton, Skees and Long estimate that cropland use of the top six crops in the US may be as much as 15per cent greater than it would be without crop insurance subsidies (Skees 2000).
20 Taking the example of corn and soybeans, the USDA suggests that during 1990 – 1999 the net benefitswere relatively small in comparison to expected crop returns (less than 1 per cent) and concludes thatthe subsidies are not likely to have significantly influenced cropping decisions.
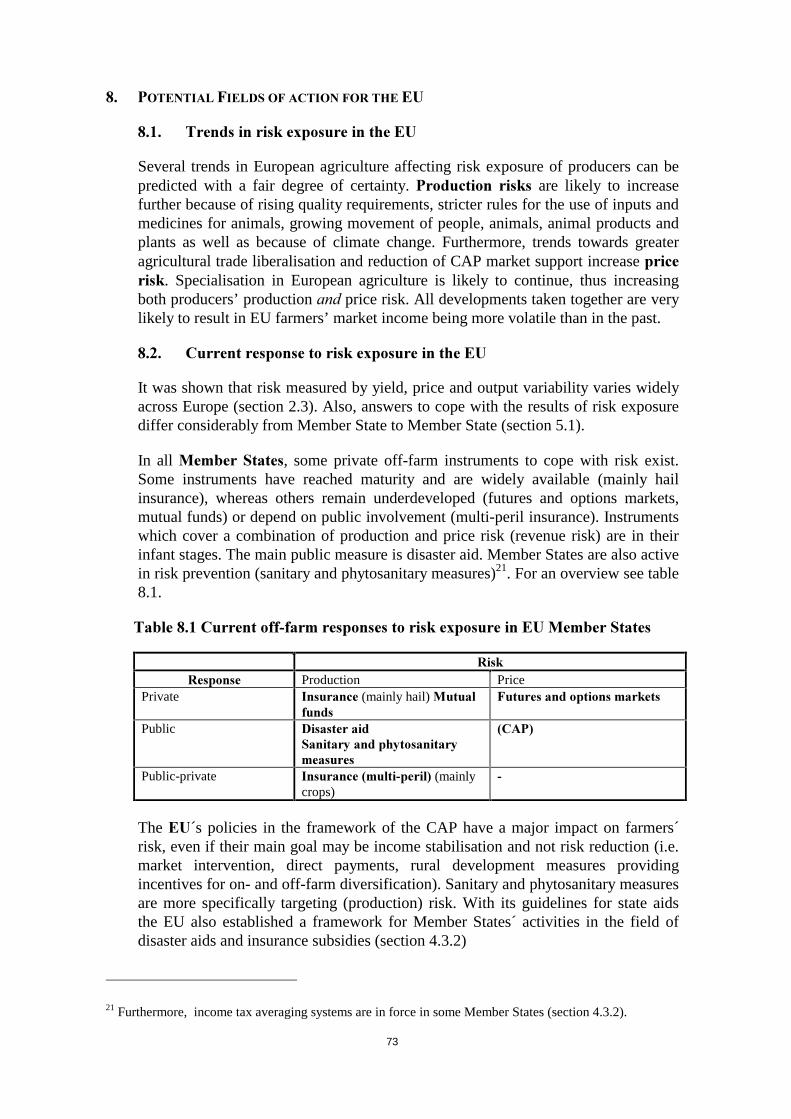
73
��� 327(17,$/�),(/'6�2)�$&7,21�)25�7+(�(8
����� 7UHQGV�LQ�ULVN�H[SRVXUH�LQ�WKH�(8
Several trends in European agriculture affecting risk exposure of producers can bepredicted with a fair degree of certainty. 3URGXFWLRQ� ULVNV are likely to increasefurther because of rising quality requirements, stricter rules for the use of inputs andmedicines for animals, growing movement of people, animals, animal products andplants as well as because of climate change. Furthermore, trends towards greateragricultural trade liberalisation and reduction of CAP market support increase SULFHULVN. Specialisation in European agriculture is likely to continue, thus increasingboth producers’ production DQG price risk. All developments taken together are verylikely to result in EU farmers’ market income being more volatile than in the past.
����� &XUUHQW�UHVSRQVH�WR�ULVN�H[SRVXUH�LQ�WKH�(8
It was shown that risk measured by yield, price and output variability varies widelyacross Europe (section 2.3). Also, answers to cope with the results of risk exposurediffer considerably from Member State to Member State (section 5.1).
In all 0HPEHU�6WDWHV, some private off-farm instruments to cope with risk exist.Some instruments have reached maturity and are widely available (mainly hailinsurance), whereas others remain underdeveloped (futures and options markets,mutual funds) or depend on public involvement (multi-peril insurance). Instrumentswhich cover a combination of production and price risk (revenue risk) are in theirinfant stages. The main public measure is disaster aid. Member States are also activein risk prevention (sanitary and phytosanitary measures)21. For an overview see table8.1.
7DEOH�����&XUUHQW�RII�IDUP�UHVSRQVHV�WR�ULVN�H[SRVXUH�LQ�(8�0HPEHU�6WDWHV
5LVN5HVSRQVH Production Price
Private ,QVXUDQFH�(mainly hail) 0XWXDOIXQGV
)XWXUHV�DQG�RSWLRQV�PDUNHWV
Public 'LVDVWHU�DLG6DQLWDU\�DQG�SK\WRVDQLWDU\PHDVXUHV
�&$3�
Public-private ,QVXUDQFH��PXOWL�SHULO��(mainlycrops)
�
The (8´s policies in the framework of the CAP have a major impact on farmers´risk, even if their main goal may be income stabilisation and not risk reduction (i.e.market intervention, direct payments, rural development measures providingincentives for on- and off-farm diversification). Sanitary and phytosanitary measuresare more specifically targeting (production) risk. With its guidelines for state aidsthe EU also established a framework for Member States´ activities in the field ofdisaster aids and insurance subsidies (section 4.3.2)
21 Furthermore, income tax averaging systems are in force in some Member States (section 4.3.2).

74
����� 1HZ�WDVNV�IRU�WKH�(8�LQ�ULVN�PDQDJHPHQW"
The perspective of rising risk-exposure in Europe raises the question whether theEU has a role to play in risk management, which goes beyond its current role. Thisquestion has to be examined in the context of the fact that the core CAP instrumentshave an impact on farmers´ risk exposure. It also has to be remembered that specificrisk management policies cannot replace income support policies.�7KH�JRDO�RI�ULVNPDQDJHPHQW� SROLFLHV� LV� QRW� LQFRPH� VXSSRUW but only to reduce fluctuations ofincome or its components.�5LVN�PDQDJHPHQW� LQVWUXPHQWV� FDQQRW� UHYHUVH� ORQJ�WHUP�LQFRPH�WUHQGV�
On the basis of general considerations regarding policy orientations, the case fornew EU measures is examined. Tools in the field of price and production risk arediscussed, before we look at the possible introduction of a new income safety net.
������� 6KRUW�WHUP�YHUVXV�ORQJ�WHUP�SROLF\�RULHQWDWLRQV
When discussing new policy instruments, the context of the existing set ofpolicies for the agricultural sector needs to be taken into account. In the shortrun, the existing set of policies is given, new instruments, therefore, wouldhave to complement existing ones. As regards price risks, the current CAPwith its price support mechanisms plays an important role in reducing suchrisks for key products. In the medium and long term, however, the set ofCAP-instruments could be re-oriented by taking on board new policyoptions. In the long term, the budgetary margin of manoeuvre, in terms ofallocation of funds between different instruments, rises as well.
The case for additional risk management instruments can be argued, if it canbe shown
• that markets for risk-reduction are missing or incomplete;
• that the risk reduction goal is not sufficiently addressed by existingpolicies such as those to achieve income stability and
• that Community action provides value-added compared to national orregional initiatives/action.
������� 3ULFH�ULVN
Although intervention prices for cereals and beef were lowered for thesecond time with Agenda 2000, the instrument remains important in limitingfarmers´ risk exposure for these products. The lower price floor togetherwith trade liberalisation increases the potential for private instruments tomanage price risk, i.e. futures and options markets for commodities withstandardised grades. The traded volumes in Europe are today still muchlower than in the US. Nevertheless, the sector has been quite dynamic overthe recent years, with a range of new products being offered on the market.There are active futures markets emerging in several Member States.

75
0DUNHW�IDFLOLWDWLRQ
As ODFNLQJ� NQRZ�KRZ regarding the use of futures and options in thefarming sector is a major obstacle (section 4.1), education and training is anobvious field for the public sector to help develop such markets.
There are two reasons why the EU should take an active interest in well-functioning futures and options markets. Firstly, price policy is a coreinstrument of the CAP. As price support is being reduced, it would seemappropriate that the Community would help farmers across Europe to copewith the increasing price volatility. Secondly, futures and options marketscontribute to increasing market transparency, which is in the interest of awell functioning internal market and therefore in the overall EU interest.
One strategy could be to support education and training initiatives whichwould enable farmers to use futures and options markets to cope with within-year downturns in commodity prices. Whereas such training programmes canalready be co-financed under the rural development framework, the initiativelies with the Member States. An active encouragement at the EU-level mightbe needed in order to prepare the ground for a wider use of futures markets.Such initiatives might include a VSHFLDO� LQIRUPDWLRQ� SURJUDPPH� for allEuropean farmers. An information programme could cover� issues likeobjectives of using futures and options, existing futures and options markets,product coverage, organisations providing training etc. Such an initiativecould be envisaged LQ� WKH� VKRUW� WHUP, as it would EH� IXOO\� LQ� OLQH� ZLWKH[LVWLQJ�SROLFLHV.
������� 3URGXFWLRQ�ULVN
Traditionally, Member States have been at the forefront of helping producersto cope with production risk (disaster aid, sanitary and phytosanitarymeasures, public-private systems of agricultural insurance, insurancesubsidies). The Community´s role, on the other hand, has been limited. Apartfrom setting the framework in the field of prevention (sanitary andphytosanitary measures) and participating financially in some measures ofdisease control, its main role has been to set common rules regardingMember States´ aids to avoid market distortions (section 4.3.2).
In the framework of the EU´s guidelines on state aids, 0HPEHU�6WDWHV�KDYHD� FRQVLGHUDEOH�PDUJLQ� RI�PDQRHXYUH to respond to the varying needs oftheir farmers. For example, existing systems of agricultural insurance inMember States vary widely as regards organisation, coverage, complexityand state involvement. The Spanish experience shows that a comprehensivesystem of agricultural insurance could be developed within the commonframework on state aids.
The US experience demonstrates that substantial public involvement ininsurance including the subsidisation of premia is not without problems(chapter 7). Where public involvement to develop insurance solutions isnecessary because of the specific characteristics of certain risks, three lessonsfrom existing systems have to be taken into account:

76
• Firstly, experience shows that initiatives have to be based on a “ERWWRP�XS�DSSURDFK´� in order to be successful.� Insurance products have to betailored to the needs of farmers which vary from country to country andregion to region.
• Secondly, a system has to be given WLPH� WR� GHYHORS. With growingexperience, it can become more and more comprehensive (regarding bothproducts and risks covered).
• Thirdly, VWURQJ�DQG�FORVH�SXEOLF�VXUYHLOODQFH is needed in order to avoidgrowing complexity leading to unjustified rent-seeking and losing track ofthe original purpose of providing insurance.
Insurance solutions should be primarily developed at the 0HPEHU� 6WDWHVlevel. In addition to the above mentioned need for a “bottom-up approach”,two further reasons support this conclusion:
• Some Member States have traditionally been involved in systems ofagricultural insurance. In the future, such an approach could increasinglyreplace national ad-hoc disaster aids. This would result in more stableexpenditure and negative effects of disaster aids could be partlyeliminated (compensation payments are made a long time after the event,discouragement of private instruments, farmers don´t sufficiently takedisaster risk considerations into account in their management decisions).Even if insurance is subsidised, it can help to provide an incentive tointegrate risk-considerations into farm management decisions.
• Member States are best placed to target public funds spent in theframework of such systems at certain groups of farmers, according toperceived specific needs.
$� FDXWLRXV� UROH� UHJDUGLQJ� WKH� (8�V� LQYROYHPHQW� EH\RQG� LWV� FXUUHQWLQYROYHPHQW�LV�DGYRFDWHG��The EU might have a role in the light of the factthat one of the main reasons of missing or incomplete markets for thecoverage of production risks is the partly systemic character of such riskswith a probability of high losses in any given year (section 4.1.1). The partlysystemic character can prevent the development of viable products, aspotential losses are too big for commercial companies/mutual funds andprivate re-insurance is often not sufficiently available or too expensive.
/HJDO�IUDPHZRUN�±�PDUNHW�IDFLOLWDWLRQ
The EU could help address this problem in two ways:
• Apart from the solution of classical re-insurance, insurers can reduce theirrisk exposure by creating insurance/re-insurance pools to share their riskswith other insurance companies which have a different portfolio oroperate in different regions (section 3.4.3). The EU could accompanysuch a process by providing the appropriate legal framework in the fieldof competition policy, where needed.

77
• Like insurance companies, farmer-owned mutual funds face the problemof big losses in any given year because of the partly systemic nature ofmost agricultural risks. Potentially big losses reduce the attractiveness ofsuch funds, as contributions must be high22, or, if money to pay for lossesis gathered a posteriori, farmers are confronted with large surcharges inany given year. As in the case of classical insurance, one solution is toshare the risk with other mutuals/insurers which cover different risk or areactive in different European regions. An initiative at the Community levelcould be to examine whether there are possibilities to promote the idea ofsuch FR�RSHUDWLRQ�DFURVV�(XURSH�
These initiatives would encourage solutions both in the crops DQG the animalsector.
/RZHULQJ�RI�FRVWV�±�SURYLVLRQ�RI�ULVN�FRYHUDJH
The EU could also investigate further into the potential of insurance systems,possibly through pilot approaches. Major trade partners use such instrumentsand there might be a certain prospect for getting these instruments acceptedas modestly trade distorting within a future WTO agreement on agriculture.For example, subsidies for insurance premia could be co-financed under therural development programmes.
In the ORQJ� WHUP, a more substantial involvement would be possible undertwo conditions. Firstly, an instrument would have to fit into the overallpolicy-mix of the CAP. Essentially, this would require that there is QRRYHUODSSLQJ ZLWK� RWKHU� LQVWUXPHQWV addressing the problem of riskexposure in agriculture. Secondly, sufficient funds would have to be madeavailable. This will be particularly difficult, LI�QR�DGGLWLRQDO�(8�IXQGV aremade available for agriculture, thus making it necessary to use funds whichare currently used for other agricultural policy instruments.
Providing re-insurance (especially covering losses above a certain level)would address the issue which is most often cited as being the obstacle forthe development of insurance systems (especially also in the animal sector),i.e. potentially catastrophic losses. Providing such capacity, the developmentof private insurance could be facilitated. In providing re-insurance great carewould have to be taken to make sure that private re-insurance is not crowdedout.
Re-insurance could be made contingent on the setting-up of a European poolof agricultural insurance, which would spread risk between the partners andthus limit aggregate potential losses which would be covered by the EU. Afurther condition could be that the members of the pool offer insurance forall major products of European Agriculture.
22 Even with high contributions, in the short-term a fund cannot build up sufficient reserves in order to copewith a disaster striking in the first few years after the setting-up of the fund.

78
Every involvement would have to be critically analysed on the basis oflessons from existing systems of agricultural insurance (chapter 7),especially as regards efficiency, transparency and possible production, priceand distribution effects.
������� $QWL�F\FOLFDO�LQFRPH�VXSSRUW�DQG�VDIHW\�QHWV
Anti-cyclical income support provides support in times of need, whilereducing support during periods of prosperity.
Such an instrument would not only UHVSRQG� WR� IDUPHUV�� QHHGV, it wouldalso have a good prospect of gaining VXSSRUW�IURP�WKH�EURDGHU�SXEOLF. It istransparent, could help to overcome the problems of ad-hoc disastermeasures and would respond to rising risk-exposure, preventing severedisruptions in the farming sector and those rural economies that still relyheavily on the farm sector. And, finally, the instrument under certainconditions appears to be compatible with the :72�JUHHQ�ER[�FULWHULD.
Strengthening the social dimension could contribute to ease publicacceptance of the CAP. However, in all Member States general socialsecurity systems are available also to farmers. Therefore, establishingspecific agricultural social systems at the EU level might provoke the generalTXHVWLRQ�RI�FRPSDWLELOLW\�ZLWK�QDWLRQDO�VRFLDO�VHFXULW\ V\VWHPV�aiming tosecure a certain minimum standard of living. It would be necessary toexplain carefully why farmers need an additional safety net.
In Canada, an income safety-net system is in place (section 5.4.3). Paymentsare made if individual farm income falls below 70 per cent of the historicalthree-year average income. Coverage is based on gross margins. Grossmargins represent the income available to the farmer after paying for thecash operating costs of the farm; adjustments are made to ensure thatbeginning farmers, high-debt and low-debt farmers, and those with high andlow investment levels are treated equitably. A cap is placed on payments.
Under this system, tax declarations are used to determine the relevantincome, thus reducing moral hazard to overstate income. There is no needfor the farmer to justify the reason for low income. Given that aid is targetedto cover 70 per cent of a PRYLQJ� DYHUDJH RI� SDVW� LQFRPH� KLVWRULHV, thesystem would QRW�FUHDWH�DGYHUVH�LQFHQWLYHV. Farmers still have an incentiveto going beyond the 70 per cent trigger for aid, in order to avoid a continuousdeterioration of their reference income serving as the basis for aidcalculation.
With respect to applying as similar system of anti-cyclical income aid in theEU it should be noted that such an approach requires a comprehensiverecording of income, following standardised methods. Therefore such asystem is YHU\� GHPDQGLQJ� DV� UHJDUGV� WKH� QHFHVVDU\� DGPLQLVWUDWLYHSURYLVLRQV. This would become even more complicated, should thereference income refer to household incomes (including off-farm revenues)rather than only farm income.

79
The provisions of the AIDA system have been applied to data of the FarmAccountancy Data Network (FADN) in order to provide some ideas on thenumber of EU farms that would be eligible under such a system and toillustrate the potential financial impact. As FADN data is used, thecalculations are only based on the results of FRPPHUFLDO� farms. Of course,payments would vary significantly from year to year. In 1997 the family farmincome of about 660´000 commercial farms (20 %) was less than 70 per centof their average income during the previous three years (1996: 630´000farms, 19 %) (EU1223). Compensation of income losses up to the referencelevel would have cost about 3 500 million Euro for commercial farms in1997 (2 700 million ¼�LQ��������$QQH[�����7KLV�ILJXUH�GRHV�QHLWKHU�SUHMXGJHany assumption about the global cost of such a scheme in the EU nor itspotential allocation between EU and Member States´ budgets.
The main difficulty to apply a similar approach to EU agriculture would bethe differences between national tax regimes. Furthermore, the percentage ofbookkeeping farms is limited, thus income taxes are based on estimates formany farms and small farms are often exempt from taxes on their farmincome. It also has to be taken into account that a public safety net competesat least partly with private risk-management instruments and that such a netwould be a disincentive for farmers to take (disaster) risk considerations intoaccount if it were provided free of charge.
23 Germany: ex-BRD

80
��� %,%/,2*5$3+<
Agroseguro (1999), ,QIRUPH�$QXDO, Madrid.
Boyer, P. (1999), /D� 6LWXDFLRQ� $FWXDO� GH� 3URWHFFLRQ� GH� 5LHVJRV� GH� OD� 3URGXFFLRQ$JUDULD�HQ�)UDQFLD, Seminario Internacional, Los Sistemas de Protección de Riesgos enla Agricultura del Siglo XXI, Madrid.
Buckwell, A. HW� DO� (1997), 7RZDUGV� D� &RPPRQ� $JULFXOWXUDO� DQG� 5XUDO� 3ROLF\� IRU(XURSH, European Economy, Reports and Studies, No 5/1997, Luxembourg.
Burgaz, F. J. (2000), *HVWLRQ�GH�ULVTXHV�HQ�PDWLHUH�GH�UHYHQX� Presentation at the OECDWorkshop on Income Risk Management, Paris.
Cordier, J. and Gouin, S. (2000), *HVWLRQ� WHUULWRULDOH� GX� ULVTXH� GH� FRQWUDFWXDOLVDWLRQ,Paper presented at the Colloque SFER/AIEA2 “L’agroalimentaire entre local et global”,Paris, 15 and 16 Juin 2000.
Cordier, J. (1998), /HV�PDUFKpV� GpULYpV� GH� SURGXLWV� DJULFROHV��Cahiers d´Economie etSociologie Rurales, Vol. 41, pp. 5-38.
Directorate-General Agriculture, Commission of the European Communities (2000),(FRQRPLF� LPSDFWV� RI� JHQHWLFDOO\� PRGLILHG� FURSV� RQ� WKH� DJUL�IRRG� VHFWRU, workingdocument, Brussels.
Directorate-General Economic and Financial Affairs, Commission of the EuropeanCommunities (2000), 7KH� 8VH� RI� )XWXUHV� LQ� $JULFXOWXUDO� 5LVN� 0DQDJHPHQW� Doc.ECFIN/651/00-EN, Brussels.
Dismukes, R. and Glauber, J. (2000), &URS��5HYHQXH� ,QVXUDQFH��3UHPLXP�'LVFRXQWV$WWUDFWLYH� WR� 3URGXFHUV, in: Agricultural Outlook, United States Department ofAgriculture, Economic Research Service, March 2000, Washington D.C.
Dismukes, R. (1999), 5HFHQW� 'HYHORSPHQWV� LQ� &URS� <LHOG� � 5HYHQXH� ,QVXUDQFH, in:Agricultural Outlook, United States Department of Agriculture, Economic ResearchService, May 1999, Washington D.C.
Economic and Social Committee (1992), ,QIRUPDWLRQ� 5HSRUW� RI� WKH� 6HFWLRQ� IRU$JULFXOWXUH�DQG�)LVKHULHV�RQ�WKH�&RPPRQ�6\VWHP�RI�$JULFXOWXUDO�,QVXUDQFH, Rapporteur:Mr Margalef Masia, Brussels (CES 454/91).
European Commission (1999a), $JULFXOWXUH��HQYLURQPHQW��UXUDO�GHYHORSPHQW��)DFWV�DQG)LJXUHV� Luxembourg.
European Commission (1999b), 7KH�DJULFXOWXUDO�VLWXDWLRQ�LQ�WKH�(XURSHDQ�8QLRQ������UHSRUW� Brussels and Luxembourg.
European Commission (2000), 3URSRVDO�IRU�D�&RXQFLO�5HJXODWLRQ�DPHQGLQJ�5HJXODWLRQ�((&��1R���������RQ� WKH�FRPPRQ�RUJDQLVDWLRQ�RI� WKH�PDUNHW� LQ�SLJPHDW��&20����������ILQDO� Brussels.

81
European Commission (2000b���&RPPXQLW\�*XLGHOLQHV�)RU�6WDWH�$LG�LQ�WKH�$JULFXOWXUH6HFWRU (2000/C/28/02).
FAO (2000), :LWKRXW�HIIHFWLYH�YHWHULQDU\�VHUYLFHV�DQLPDO�GLVHDVHV�FRXOG�VSUHDG�JOREDOO\�3UHVV�5HOHDVH������� Rome.
Forteza del Rey Morales, V. (1999���(O�VLVWHPD�GH�VHJXURV�DJUDULRV�FRPELQDGRV�HVSDxRO�VLWXDFLyQ�DFWXDO��Seminario Internacional, Los Sistemas de Protección de Riesgos en laAgricultura del Siglo XXI, Madrid.
GAO (General Accounting Office) (1999a), &URS� ,QVXUDQFH��$GGLWLRQDO�$FWLRQV�&RXOG)XUWKHU�,PSURYH�3URJUDP�V�)LQDQFLDO�6RXQGQHVV��Statement/Record, 03/17/99, GAO/T-RCED-99-123, Washington D.C.
GAO (General Accounting Office) (1999b), &URS� ,QVXUDQFH�� )XUWKHU� $FWLRQV� &RXOG6WUHQJWKHQ� 3URJUDP�V� )LQDQFLDO� 6RXQGQHVV�� Testimony, 04/21/99, GAO/T-RCED-99-161, Washington D.C.
GAO (General Accounting Office) (1999c), &URS� ,QVXUDQFH�� 86'$� 1HHGV� D� %HWWHU(VWLPDWH� RI� ,PSURSHU� 3D\PHQWV� 7R� 6WUHQJWKHQ� &RQWUROV� 2YHU� &ODLPV�� Letter Report09/22/1999, GAO/RCED-99-266, Washington D.C.
Georgiadis, N. (1999), 7KH� 0DQDJHPHQW� RI� $JULFXOWXUDO� 5LVNV� LQ� *UHHFH, SeminarioInternacional, Los Sistemas de Protección de Riesgos en la Agricultura del Siglo XXI,Madrid.
Glickman, D. (2000), 7HVWLPRQ\� EHIRUH� WKH� +RXVH� &RPPLWWHH� RQ� $JULFXOWXUH�� JLYHQ6HSWHPEHU�����2000 (http//www.rma.usda.gov/news/testimony/2000/house_0972.html).
Hardaker, J. B., Huirne, R. B. M. and Anderson, J. R. (1997), &RSLQJ� ZLWK� 5LVN� LQ$JULFXOWXUH, CAB International, Wallingford.
Hart, C. E. and Babcock B���&RXQWHU�&\FOLFDO�$JULFXOWXUDO�3URJDP�3D\PHQWV��,V�,W�7LPHWR�/RRN�DW�5HYHQXH", Briefing paper 99-BP 28.
Harwood, J. (2000), )XWXUHV� 0DUNHWV� DQG� 5LVN� 0DQDJHPHQW�� $� 8�6�� 3HUVSHFWLYH,Presentation at the OECD Workshop on Income Risk Management, Paris.
Harwood, J., Dismukes, R., Vandeveer, M., Heifner, R. (2000),�)URP�5LVN�3RROLQJ�7R6DIHW\� 1HWV�� &URS� $QG� 5HYHQXH� ,QVXUDQFH� ,Q� 7KH� 8QLWHG� 6WDWHV� Paper presented atOECD Workshop on Income Risk Management, Paris.
Kagoshima, K. (1999), /LYHVWRFN� ,QVXUDQFH� LQ� -DSDQ, in: Asian ProductivityOrganization, Development and operation of agricultural insurance schemes in Asia, pp.140-155, Tokyo.
Larson, D. F., Varangis, P. and Yabuki, N. (1998),� &RPPRGLW\� 5LVN�0DQDJHPHQW� DQG'HYHORSPHQW, Paper prepared for the Roundtable Discussion on New Approaches toCommodity Price Risk Management in Developing Countries, World Bank PolicyResearch Working Paper No 1963, Washington, D.C.

82
Leach, M. B. (1999), 8�6�� 5LVN�0DQDJHPHQW� 3URJUDP�� ,QFOXGLQJ�&URS� ,QVXUDQFH� DQG2WKHU� 5LVN�0DQDJHPHQW� 6WUDWHJLHV� IRU� 6WUHQJWKHQLQJ� WKH� )DUP� 6DIHO\� 1HW, SeminarioInternacional, Los Sistemas de Protección de Riesgos en la Agricultura del Siglo XXI,Madrid.
Meuwissen M. P. M., Huirne B. M., Hardaker J. B. (1999��� ,QFRPH� LQVXUDQFH� IRULQGLYLGXDO� IDUPHUV��)HDVLELOLW\� IRU�(XURSHDQ�DJULFXOWXUH� Organized session papers, IXEuropean Congress of Agricultural Economists, “European Agriculture facing the 21stcentury in a global context”, pp. 428 – 444, Warsaw.
Meuwissen M. P. M., Huirne B. M., Hardaker J. B. (1999a), ,QFRPH� LQVXUDQFH� LQ(XURSHDQ�DJULFXOWXUH, European Economy No 2, Luxembourg.
Meuwissen M. P. M. (2000), ,QVXUDQFH� DV� D� ULVN� PDQDJHPHQW� WRRO� IRU� (XURSHDQDJULFXOWXUH, Wageningen.
Middelschulte, E. (1999), (O� 6HJXUR� GH� 3URGXFFLRQ� 9HJHWDO� HQ� $OHPDQLD, SeminarioInternacional, Los Sistemas de Protección de Riesgos en la Agricultura del Siglo XXI,Madrid.
Munich Re and Österreichische Hagelversicherung (1999), *RYHUQPHQW� PHDVXUHV� IRUFURS� ORVVHV� LQ� UHODWLRQ� WR� DJULFXOWXUDO� YDOXH� DGGHG� �(8� DV� FRPSDUHG� WR� 86$�, AIAGPresentation, Maastricht 1999.
OECD (2000), $SSURDFKHV�WR�LQFRPH�ULVN�PDQDJHPHQW�LQ�2(&'�&RXQWULHV� Paris.
OIG (United States Department of Agriculture, Office of Inspector General) (1999a),5HSRUW�7R�7KH�6HFUHWDU\�2Q�)HGHUDO�&URS�,QVXUDQFH�5HIRUP, No. 05801-2-At (Revisedas of April 19, 1999),�Washington D.C.
OIG (United States Department of Agriculture, Office of Inspector General) (1999b),&RPPHQWV� RQ� WKH� 5HVSRQVH� RI� WKH� $GPLQLVWUDWRU� RI� WKH� 50$� WR� WKH� 5HSRUW� 7R� 7KH6HFUHWDU\�2Q�)HGHUDO�&URS�,QVXUDQFH�5HIRUP��No. 05801-2-At, Washington D.C.
OIG (United States Department of Agriculture, Office of Inspector General) (1999c),5LVN� 0DQDJHPHQW� $JHQF\� 6HUYLFLQJ� RI� &$7� 3ROLFLHV��Audit Report No. 05099-6-KC,Washington D.C.
Parkin, M., Powell, M. and Matthews, K. (2000), (FRQRPLFV (4th Edition), Addison-Wesley, Harlow.
Parry, M. L. (Ed.), (2000), $VVHVVPHQW�RI�3RWHQWLDO�(IIHFWV�DQG�$GDSWDWLRQV�IRU�&OLPDWH&KDQJH� LQ�(XURSH�� 7KH� (XURSH� $&$&,$�3URMHFW�� 6XPPDU\� DQG�&RQFOXVLRQV� JacksonEnvironment Institute, University of East Anglia, Norwich.
Pennucci, G. (1999), (VSHULHQ]D�LWDOLDQD�QHOOD�GLIHVD�GHL�UHGGLWL�DJULFROL�GDOOH�FDODPLWD�±SURVSHWWLYH�IXWXUH, Seminario Internacional, Los Sistemas de Protección de Riesgos en laAgricultura del Siglo XXI, Madrid.
Sampaio, J. (1999), (O� 6HJXUR� $JUDULR� HQ� 3RUWXJDO, Seminario Internacional, LosSistemas de Protección de Riesgos en la Agricultura del Siglo XXI, Madrid.

83
Sarris, A. H. (1998), 3ULFH�DQG�,QFRPH�9DULDELOLW\��Paper presented at�OECD Workshopon Emerging Trade Issues in Agriculture, Paris.
Sarris, A. H. (1997), 3ULFH� 9DULDELOLW\� LQ� &HUHDO� 0DUNHWV� DQG� 5LVN� 0DQDJHPHQW6WUDWHJLHV�IRU�0DUNHW�3DUWLFLSDQWV, Report presented to OECD Group on Cereals, AnimalFeeds and Sugar of the Working Party on Agricultural Policies and Markets, Paris(AGR/CA/APM/CFS(97)8).
Schnepf, R. and Heifner, R. (2000), &URS��5HYHQXH�,QVXUDQFH��%DUJDLQ�5DWHV�EXW�6WLOO�D+DUG�6HOO, in Agricultural Outlook, United States Department of Agriculture, EconomicResearch Service, February 2000, Washington D.C.
Skees J. R. (1997), $JULFXOWXUDO� LQVXUDQFH� LQ� D� WUDQVLWLRQ� HFRQRP\, Proceedings ofSeminar on agricultural finance and credit infrastructure in transition economies, OECD,Paris.
Skees J. R. and Barnett B. J. (1999), &RQFHSWXDO�DQG�SUDFWLFDO�FRQVLGHUDWLRQV�IRU�VKDULQJFDWDVWURSKLF�V\VWHPLF�ULVNV, Review of Agricultural Economics.
Skees, J. R. (1999b), 3ROLF\�LPSOLFDWLRQV�RI�LQFRPH�LQVXUDQFH��/HVVRQV�OHDUQHG�IURP�WKH86�DQG�&DQDGD, in: European Agriculture Facing the 21st Century in a Global Context,IX European Congress of Agricultural Economists, Warsaw, 1999.
Skees, J. R. (1999c), $JULFXOWXUDO�5LVN�0DQDJHPHQW�RU�,QFRPH�(QKDQFHPHQW, RegulationVol 22, No.1, pp. 35- 43; (http://www.cifarrm.com/publications.html).
Skees, J. R. (2000), $JULFXOWXUDO�,QVXUDQFH�3URJUDPV��&KDOOHQJHV�DQG�/HVVRQV�/HDUQHG�Paper presented at OECD Workshop on Income Risk Management, Paris.
Stoppa, A. (2000), $JULFROWXUD� H� VLVWHPL� DVVLFXUDWLYL�� LO� FDVR� GHOOD� 6SDJQD� in:L’Informatore Agrario n. 21, 2000, Verona, Italy.
The Food Agency, Ministry of Agriculture Forestry and Fisheries of Japan (no date), $Q2XWOLQH�RI�-DSDQ¶V�1HZ�5LFH�3ROLF\, Tokyo.
US (2000), 3URSRVDO�IRU�FRPSUHKHQVLYH�ORQJ�WHUP�DJULFXOWXUDO�WUDGH�UHIRUP��VXEPLVVLRQIURP�WKH�8QLWHG�6WDWHV, http://www.fas.usda.gov/itp/wto/WTO-062300.html
USDA (2000a), News Release, Fact Sheet ”7KH�&OLQWRQ�$GPLQLVWUDWLRQ�V�3URSRVDO�)RU,PSURYLQJ�7KH�)DUP�6DIHW\�1HW´� February 2, 2000.
USDA, Economic Research Service (2000b), $� 6DIHW\� 1HW� IRU� )DUP� +RXVHKROGV"�Agricultural Outlook, January-February 2000, Washington, D.C.
USDA, Economic Research Service, (1999), 0DQDJLQJ� 5LVN� LQ� )DUPLQJ�� &RQFHSWV�5HVHDUFK�DQG�$QDO\VLV� Washington, D.C.
USDA, Economic Research Service (1999a), 7D[�'HIHUUHG� 6DYLQJV� $FFRXQWV� )RU)DUPHUV�� $� 3RWHQWLDO� 5LVN� 0DQDJHPHQW� 7RRO, Agricultural Outlook/May 1999,Washington, D.C.

84
USDA, Economic Research Service (1998a),� 7KH� ����� 7D[� /DZ�� 1HZ� ,QFHQWLYHV� IRU)DUPHUV� 7R� ,QYHVW� IRU� 5HWLUHPHQW, Agricultural Outlook/December 1998, Washington,D.C.
USDA, Economic Research Service (1998b), 7KH� 7D[SD\HU� 5HOLHI� $FW� RI� �����3URYLVLRQV�IRU�)DUPHUV�DQG�UXUDO�&RPPXQLWLHV� Agricultural Economic Report Number764, Washington, D.C.
Weinberger, K. (1999), (O� 6LVWHPD� GH� 6HJXUR� GH� FRVHFKDV� HQ� $XVWULD, SeminarioInternacional, Los Sistemas de Protección de Riesgos en la Agricultura del Siglo XXI,Madrid, additional information at: www.hagel.at
Wilkens, E. (1999), hEHUOHJXQJHQ� I�U� HLQH� XPIDVVHQGH�$EVLFKHUXQJ�JHJHQ�6FKlGHQ� LQGHU� 3IODQ]HQ�� XQG� 7LHUSURGXNWLRQ, MKS-Forum Milchwirtschaft, Internationaler Kon-gress, Hannover.
WTO (2000), Committee on Agriculture��*UHHQ�%R[�0HDVXUHV��%DFNJURXQG�3DSHU�E\�WKH6HFUHWDULDW��*�$*�1*�6����Geneva.
Yoshii, K. (1999), $JULFXOWXUDO� ,QVXUDQFH� 6\VWHP� LQ� -DSDQ, in: Asian ProductivityOrganization, Development and operation of agricultural insurance schemes in Asia, pp.122-139, Tokyo.