rivm commi ed to health and sustainability · no trend information was available for the ge...
TRANSCRIPT

RIVMCommitted to health and sustainability
Disease burden of food-related pathogens in the Netherlands, 2012
RIVM Letter report 2014-0069M. Bouwknegt et al.


Disease burden of food-related pathogens in the Netherlands, 2012
RIVM Letter report 2014-0069 M. Bouwknegt et al.

RIVM Letter report 2014-0069
Page 2 of 44
Colofon
© RIVM 2013 Parts of this publication may be reproduced, provided acknowledgement is given to the 'National Institute for Public Health and the Environment', along with the title and year of publication.
This is a publication of: National Institute for Public Health and the Environment P.O. Box 1│3720 BA Bilthoven The Netherlands www.rivm.nl/en
Martijn Bouwknegt, CIb, RIVM Marie-Josée J. Mangen, Julius Centrum, UMCU Ingrid H.M. Friesema, CIb, RIVM Wilfrid van Pelt, CIb, RIVM Arie H. Havelaar, CIb, RIVM Contact: Arie Havelaar RIVM/CIb/LZO [email protected]
This investigation has been performed by order and for the account of Ministry of Public Health, welfare and Sports, within the framework of Programme 5

RIVM Letter report 2014-0069
Page 3 of 44
Abstract
Disease burden of food-related pathogens in the Netherlands, 2012 The Ministry of VWS has requested RIVM to present an annual update on the number of illnesses caused by 14 enteric pathogens. These pathogens can be transmitted by food, the environment, animals and humans. The number of persons who are ill and who die from the infections is expressed in DALYs (Disability Adjusted Life Years), a measure of the disease burden in the population. Furthermore, the cost-of-illness (COI) related to the 14 food-related pathogens were estimated and expressed in euros. The total disease burden caused by the 14 pathogens increased marginally from 13,900 DALY in 2011 to 14,000 DALY in 2012. The share of foodborne transmission in this burden increased from 6,230 to 6,550 DALY. The COI remained stable compared to 2011 at 412 million euro. The share of foodborne transmission was 175 million euro–an increase of 4% compared to 2011. The increase in disease burden was a result of the outbreak by Salmonella Thompson in smoked salmon. This outbreak (with an estimated 24,000 cases) resulted in a burden of 550 DALYs and a COI of 11 million euro. Note that this estimate does not take into account the economic damage to the firm and retailers nor the costs of NVWA and RIVM in controlling the outbreak. Without this outbreak, the burden estimates would be lower than in 2011 due to a decrease in the incidence of disease by Campylobacter spp., Listeria monocytogenes, Toxoplasma gondii and rotavirus. Furthermore, an increasing trend in norovirus incidence was observed in the period 2001-2012. No explanation for the trend is available. This research results in more insight in the true incidence of foodborne diseases and the associated disease burden. Keywords: food-related disease, disease burden, DALY, trend

RIVM Letter report 2014-0069
Page 4 of 44

RIVM Letter report 2014-0069
Page 5 of 44
Publiekssamenvatting
Ziektelast van via voedsel overdraagbare ziekteverwekkers in Nederland in 2012 Het RIVM onderzoekt jaarlijks hoeveel mensen ziek worden van 14 ziekteverwekkers die via voedsel in het menselijk lichaam terechtkomen (darmpathogenen). Deze ziektelast wordt uitgedrukt in DALY’s (Disability Adjusted Life Year), een internationaal gehanteerde maat voor het aantal gezonde levensjaren die verloren gaan aan ziekte of overlijden. Het aantal DALY’s als gevolg van de 14 ziekteverwekkers steeg van 6.230 in 2011 tot 6.550 DALY’s in 2012. Daarnaast wordt geschat welke ziektegerelateerde kosten hieraan verbonden zijn (cost of illness). Deze omvatten directe zorgkosten, maar ook niet-medische kosten, zoals reiskosten, en indirecte kosten, bijvoorbeeld als gevolg van werkverzuim. De gerelateerde kosten van de 14 ziekteverwekkers die mensen via voedsel opliepen bedroegen in 2012 175 miljoen euro. Dat is een toename van 4 procent ten opzichte van het jaar ervoor. De stijging van de voedselgerelateerde ziektelast is een gevolg van de uitbraak van Salmonella Thompson via gerookte zalm in 2012. Deze uitbraak veroorzaakte naar schatting 24.000 zieken en 11 miljoen euro aan ziektegerelateerde kosten. Zonder deze uitbraak zouden de voedselgerelateerde ziektelast en de kosten lager zijn dan in 2011. Naar verhouding zijn er namelijk minder mensen ziek geworden van een infectie met Campylobacter spp., Listeria monocytogenes, Toxoplasma gondii en het rotavirus. Wel is het aantal mensen dat ziek werd van een bepaald type E. coli-bacterie (STEC O157) gestegen ten opzichte van 2011. Daarnaast nam tussen 2001 en 2012 het aantal mensen dat ziek werd van het norovirus toe; alleen in 2011 daalde dat aantal ten opzichte van het voorgaande jaar. Een verklaring voor deze trend is niet voorhanden. De onderzochte ziekteverwekkers kunnen niet alleen via voedsel aan de mens worden overgedragen (circa 40 procent), maar ook via het milieu (bijvoorbeeld via oppervlaktewater), dieren, en van mens op mens. De totale ziektelast van alle ‘routes’ steeg ook, van 13.900 DALY in 2011 naar 14.000 DALY in 2012. De totale kosten bleven nagenoeg gelijk op 412 miljoen euro. VWS is opdrachtgever van dit onderzoek. De resultaten bieden handvaten om meer zicht te krijgen op het daadwerkelijke aantal voedselinfecties dat mensen jaarlijks oplopen en de bijbehorende ziektelast. Trefwoorden: Voedsel-gerelateerde ziekte, ziektelast, DALY, trend

RIVM Letter report 2014-0069
Page 6 of 44

RIVM Letter report 2014-0069
Page 7 of 44
Contents
1 Introduction ─ 9
2 Methods ─ 11 2.1 Trend information ─ 11 2.2 Model corrections ─ 11 2.3 Disease burden ─ 11 2.4 Cost of illness ─ 12 2.5 Salmonella Thompson outbreak due to smoked salmon ─ 12
3 Results ─ 13 3.1 Trend information ─ 13 3.2 Disease incidence ─ 13 3.3 Disease burden by pathogen ─ 14 3.4 Cost of illness by pathogen ─ 14 3.5 Attribution ─ 14
4 Discussion ─ 17
Acknowledgement ─ 19
References ─ 21

RIVM Letter report 2014-0069
Page 8 of 44

RIVM Letter report 2014-0069
Page 9 of 44
1 Introduction
Since 2008, RIVM regularly publishes estimates of the incidence, burden and costs of food-related disease on its web pages in the “Nationaal Kompas Volksgezondheid”1. The epidemiological estimates of the disease burden are expressed in Disability Adjusted Life Years. The methodology for these estimates is described in detail in a peer-reviewed paper [1]. Data in that paper referred to the year 2009, and an update based on data for the years 2010 and 2011 have been presented [2, 3]. In this report, trend information from surveillance and demographic information was used to update the information to the year 2012. The economical estimates of the disease burden, the cost-of-illness (COI) expressed in euros, were finalized for all 14 food-related pathogens for the year 2011 [4]. The models were added to the existing disease burden model. The estimates for 2011 are updated to 2012 and the results integrated in this report. The COI for all 14 food-related pathogens will be part of the annual updates from 2012 onwards.
1 http://www.nationaalkompas.nl/gezondheidsdeterminanten/omgeving/milieu/voedselveiligheid/microbiologisch/

RIVM Letter report 2014-0069
Page 10 of 44

RIVM Letter report 2014-0069
Page 11 of 44
2 Methods
2.1 Trend information
Data on the size and age distribution of the Dutch population, as well as mortality risks and the number of live births and stillbirths were obtained from Statistics Netherlands2. Trend information on the incidence of gastro-enteritis (GE) by pathogen in the general population and consulting the general practitioner was obtained from the following sources (partly also presented in [5]): Thermophilic Campylobacter spp.: laboratory surveillance Shiga-toxin producing Escherichia coli O157 (STEC O157): active surveillance Non-typhoidal Salmonella spp.: laboratory surveillance Norovirus: hospitalisation for viral gastro-enteritis (ICD code 86) Rotavirus: laboratory surveillance Hepatitis A, and perinatal and acquired listeriosis: mandatory notification and
active surveillance Cryptosporidium spp.: a stable incidence since 2003 was assumed, based on
laboratory surveillance data from 2001 to 2007 Giardia spp.: a continuing decrease with the rate of -1.03% per year
observed between 2001 and 2007 was assumed No trend information was available for the GE toxin-producing bacteria
(Bacillus cereus, Clostridium perfringens and Staphylococcus aureus), hepatitis-E and toxoplasmosis.
Trends in hospitalizations for gastro-enteritis as primary cause (ICD codes 20-93; 558.9) were obtained from the National Medical Register up until 2010. From 2011 onwards these data were obtained from Dutch Hospital Data (DHD). Data for 2006-2010 were extracted from the DHD database to ascertain that the change in data source did not affect the estimated number of hospitalizations. Estimates were indeed similar (data not shown). Age-specific excess mortality risks from campylobacteriosis and salmonellosis were assumed constant. Fatalities due to listeriosis and STEC O157 were obtained from active surveillance. Age-specific case fatality ratios for norovirus and rotavirus, originally obtained from German surveillance data, and for protozoan pathogens, originally obtained from the international literature, were assumed constant.
2.2 Model corrections
No model corrections were made in 2012.
2.3 Disease burden
Disease burden calculations were not changed compared to previous years; hence all differences in the results for 2012 compared to 2011 will reflect the impact of trends in the underlying information on demographics and pathogen incidence. 2 http://statline.cbs.nl/statweb/, accessed August 5 2013

RIVM Letter report 2014-0069
Page 12 of 44
2.4 Cost of illness
The baseline year for the COI estimates was 2011. The cost-of-illness estimates were updated to 2012 by multiplying all prices with the consumer price index for 2012 provided by Statistics Netherlands3.
2.5 Salmonella Thompson outbreak due to smoked salmon
The large Salmonella Thompson outbreak in the Netherlands caused by the consumption of smoked salmon [6] required a specific approach for the attribution part, because all DALYs and COI of this outbreak are attributable to the ‘fish & shellfish’ category of the ‘food’ pathway. To this end the disease burden model was run twice: once with a trend estimate based on the total number of reported salmonellosis cases and once with a trend estimate based on the reported salmonellosis cases minus all reported cases caused by S. Thompson. The difference in DALY and COI between the two was considered to be related to the outbreak. All attribution results for salmonellosis were based on the second model run, with the burden due to the outbreak subsequently added to the ‘fish & shellfish’ category.
3 http://statline.cbs.nl/StatWeb/publication/?DM=SLNL&PA=71311NED&D1=0&D2=0&D3=64,77,90,103,116,129,142,155,168,181,194,219,232&HDR=T&STB=G1,G2&VW=T

RIVM Letter report 2014-0069
Page 13 of 44
3 Results
3.1 Trend information
The number of inhabitants in the Netherlands slightly increased with 80,000 inhabitants in 2012 (Table 1). There was a decrease in all age classes except these ages 12-17 and 65+. The number of live births decreased by approximately 4,000 to 176,000 in 2012 (Table 2). A decrease was observed in in age classes (of mothers) except the age-class 45+, showing a slight increase. The number of stillbirths (24 weeks or more gestational age) in 2012 was 564, lower than the 620 cases reported for 2011. The number of hospitalizations for gastroenteritis remained fairly stable at 22,400. Trend information for specific pathogens is presented in Table 3. A summary of trends (in comparison with 2011) is discussed below: The incidence of campylobacteriosis (laboratory confirmed cases)
decreased by 5% from 51.3 to 48.8 cases per 100,000 inhabitants. The incidence of salmonellosis (laboratory confirmed cases) increased by
70% from 12.2 to 20.7 per 100,000 inhabitants; this increases is due to the Salmonella outbreak related to smoked salmon in 2012 [6].
The incidence of gastroenteritis by rotavirus (laboratory confirmed cases) decreased further by 15% from 23.7 to 20.1 cases per 100,000 inhabitants; there is no significant trend since 2007.
The incidence of hospitalizations for viral gastroenteritis (a proxy for the incidence of gastroenteritis by norovirus) increased from 19.4 to 19.7 cases per 100,000 inhabitants; there is an increasing trend (p<0.001) since 2001 with an average increase of 0.9 cases per 100,000 inhabitants per year.
The incidence of acquired listeriosis (active surveillance) decreased from 79 cases in 2011 to 71 cases in 2012. There were 8 fatalities, considerably more than the 4 fatalities in 2011, but still less than the exceptionally high number of 13 fatal cases in 2010. The statistical life expectancy of fatal cases was 13.7 years; in the DALY model half of this life expectancy is used for calculating years of life lost to correct for comorbidity. Including new data from 2012, the probability of developing meningitis as a consequence of acquired listeriosis was updated to 25% (95% confidence interval 21-29%).
The incidence of perinatal listeriosis (active surveillance) was 6 cases with no fatalities. The number of perinatal cases and mortality were similar to previous years.
The incidence of diseases caused by STEC O157 (active surveillance) was 85 with 31 hospitalizations (of 77 cases for which this information is known). The number of STEC cases, including the number of hospitalized cases, was higher than in previous years. There were no fatal cases recorded.
The incidence of hepatitis A (notified cases) remained similar to 2011 with 121 cases and 28 hospitalizations; the incidence was lowest among those recorded in the years 2006-2012. The number of hospitalized cases was similar to previous years.
3.2 Disease incidence
The incidence of gastroenteritis by pathogen, of disease by non-gastrointestinal pathogens and of sequelae by pathogen in 2012 is presented in Tables 4-6, and Figure 1. There were increases in the incidence of salmonellosis, E. coli O157 and norovirus in the general population while the incidence of campylobacteriosis, listeriosis, giardiasis, rotavirus and HAV decreased in comparison to 2011. The estimated incidence of the remaining pathogens was

RIVM Letter report 2014-0069
Page 14 of 44
unchanged, mostly because no trend information was available. The increase in salmonellosis was mainly due to the outbreak of S. Thompson, leading to an estimated 24,000 cases. The number of deaths attributed to the outbreak was 4 [7]. The estimated total number of cases by the 14 pathogens decreased from 1,750,000 in 2011 to 1,725,000 in 2012 and was at the lowest level since 2009. The total number of deaths was for 2012 was 218 (219 in 2011). In comparison with 2011, there were considerably less sequelae due to campylobacteriosis, whereas sequelae due to salmonellosis increased considerably (Table 6).
3.3 Disease burden by pathogen
The burden by pathogen is presented in Table 7 and Figure 2. The total burden of the 14 pathogens increased marginally from 13,900 in 2011 to 14,000 DALY in 2012. The largest burden at population level was caused by Toxoplasma gondii and Campylobacter (both ~3,500 DALY), followed by Salmonella and norovirus (both ~1,800). In general, estimates for 2012 were lower than or equal to the estimates for 2011, except for salmonellosis, norovirus and acquired listeriosis. The largest relative difference with 2011 was observed for perinatal listeriosis and rotavirus, with about 65% and 12%, respectively, decrease in burden. Due to the higher number of fatal acquired listeriosis cases compared to 2011, its burden increased considerably (from 47 to 72 DALY), resulting in a corresponding increase in the burden per 1,000 cases. Perinatal listeriosis was the disease outcome with the highest individual burden among all pathogens (9.2 DALY per case), followed by perinatal toxoplasmosis (6.3 DALY per case).
3.4 Cost of illness by pathogen
The total COI did not change in 2012 compared to 2011 and was estimated at 460 M€ (discounted at 4%: 412 M€) (Table 8). The three pathogens causing the largest discounted COI are norovirus (110 M€), Campylobacter spp. (73 M€) and rotavirus (65 M€). The lowest contribution to the COI was by hepatitis E-virus (0.2 M€). The average cost per case were largest for perinatal Listeria (0.8 M€), followed by congenital Toxoplasma gondii infections (0.1 M€). The trends in COI compared to 2011 followed the trends in DALYs, with a pronounced increase of 12 M€ in COI for Salmonella and of 3 M€ for norovirus, and an equal or slightly decreased COI for the other pathogens.
3.5 Attribution
The attribution results for DALYs and COI are presented in Tables 9 and 10. The foodborne disease burden increased by 5% from 6,250 to 6,550 DALY. The increase is attributable to the Salmonella outbreak related to smoked salmon, which caused an estimated additional foodborne burden of ~500 DALY. All non-food routes decreased by 3-4% in DALYs compared to 2011. Among food pathways, all estimated DALYs decreased compared to 2011 with 2-4%, except for the category ‘fish & shellfish’. The latter increased by 224% from 400 to 900 DALYs (attributable to the Salmonella outbreak). The highest burden was attributed to pork (20%) followed by poultry (17%), beef & mutton (15%) and fish & shellfish (15%). Foods from animal origin caused 41% of all food-related cases, but 61% of the burden due to food, indicating that the pathogens associated with these foods tend to cause more severe infections than pathogens associated with other foods. The total food-related COI increased by 4% from 168 M€ to 175 M€. The COI for the other pathways decreased by 3-5%. Fish & shellfish were the only food group that increased in estimated COI (by 73%), for all other food groups the

RIVM Letter report 2014-0069
Page 15 of 44
COI decreased with 1-4%. The increase in the fish & shellfish category was related to the outbreak of Salmonella Thompson in smoked salmon, which was estimated to have increased the COI with 11 M€. The largest contribution to the food-related COI was made by beef, chicken, fish & shellfish and other foods (all 13-14%). Products of animal origin accounted for nearly 50% of the total food-related COI.

RIVM Letter report 2014-0069
Page 16 of 44

RIVM Letter report 2014-0069
Page 17 of 44
4 Discussion
The disease burden of 14 enteric pathogens increased marginally by 100 DALY from 13,900 DALY in 2011 to 14,000 DALY in 2012. The share of foodborne transmission in this burden increased from 6,230 to 6,550 DALY. The increase was a result of the outbreak related to Salmonella Thompson on smoked salmon [6], the burden of which was estimated to be 500 DALY, due to an increased incidence of 24,000 cases. The excess number of reported deaths due to the outbreak was 4 [7]. The estimated COI mounted to 11 M€. Note that this latter estimate does not take into account the economic damage to the firm and retailers nor the costs of NVWA and RIVM in controlling the outbreak. When excluding all confirmed and reported S. Thompson cases resulted in an estimated foodborne disease burden of ~6000 DALYs, lower than the estimate for 2011. This decrease is related to the decrease in DALYs for most pathogens, except norovirus and acquired listeriosis. The incidence of campylobacteriosis decreased in 2012 compared to 2011, after a continuously increasing trend from 2003 onwards, leading to a trend break. This increase and subsequent decrease are possibly associated with the use of proton-pump-inhibitors [8, 9]. It was estimated in the referred study that about 27% of the reported campylobacteriosis cases in 2011 was attributable to PPI-use. The use of PPI decreased in 2012, possibly due to changes in the refund policies of healthcare insurance companies and thus coinciding with a decrease in campylobacteriosis incidence. The incidence, DALY and COI estimates for norovirus increased further in 2012 compared to 2011. For norovirus, no direct trend information is available, and therefore this estimate is based on trends in hospitalisation for viral gastroenteritis, which includes also rotaviruses. Hence the trend in norovirus incidence may be overestimated in the current updates. The approach for estimating the incidence of STEC O157 is based on a simplification of a complex microsimulation model [10, 11]. This simplification was required for implementation of the STEC model in the full burden model. This simplification at present misses the link between reported STEC cases and incidence, GP visits and hospitalization at population level. The development of sequelae is therefore also not related to the incidence at population level. This approach causes the increased incidence in reported STEC O157 cases (about 30% increase for hospitalized and non-hospitalized cases in 2012 compared to 2011) to not be reflected in the burden and COI estimates. The burden related to STEC O157 might therefore be underestimated in the current and previous years. The extent to which cannot be indicated without further model developments and direct HUS surveillance. This work is planned for the coming years. From August 2012 onwards, an increase in Cryptosporidium infections was observed in several EU countries, including the Netherlands, without a clear cause [12]. In total, 524 faecal samples were found positive for Cryptosporidium by eight medical microbiology laboratories (covering about 20% of the Dutch population) in the Netherlands in a 12-week period in 2012. For 2010 and 2011, this number was on average 105. About 85% of the strains belonged to C. hominis, the remainder to C. parvum (based on 90 samples) [12]. This increase

RIVM Letter report 2014-0069
Page 18 of 44
in Cryptosporidium was not taken into account in the current disease burden estimates, as a constant incidence of cryptosporidiosis in the Netherlands is assumed for the model (based on laboratory surveillance data from 2001-2007). A rough estimate suggests that the disease burden for Cryptosporidium might have increased two-fold, because a five-fold increase in cases was observed in 12 of 52 weeks (thus: 524/104×12/52=1.2, suggesting the additional disease burden mounts to 1.2 times the original). The data from the eight medical microbiological laboratories (available from at least 2010) might be useful for the annual trend update for Cryptosporidium and will be further examined for the next update. Other important aspects for realization in interpreting results include the absence of trend information for bacterial toxins and toxoplasmosis while trends for Cryptosporidium spp. and Giardia spp. are extrapolated from trends until 2007, when systematic surveillance was discontinued. Furthermore, attribution data used in this report are based on an expert elicitation study, conducted in 2006 [13]. No time-trends in the expert estimates are available. As a consequence, the changes in incidence and burden as presented in this report need to be interpreted with the appropriate care.

RIVM Letter report 2014-0069
Page 19 of 44
Acknowledgement
The authors thank Margaret Wilson (Risk Science International, Ottawa, Canada) for support in developing the stochastic simulation model.

RIVM Letter report 2014-0069
Page 20 of 44

RIVM Letter report 2014-0069
Page 21 of 44
References
1. Havelaar AH, Haagsma JA, Mangen MJJ, Kemmeren JM, Verhoef LP, Vijgen SM, et al. Disease burden of foodborne pathogens in the Netherlands, 2009. Int J Food Microbiol. 2012;156(3):231-8.
2. Havelaar AH, Friesema IHM, Van Pelt W. Disease burden of food related pathogens in the Netherlands, 2010. Bilthoven, the Netherlands: National Institute for Public Health and the Environment, 2012 Contract No.: 330331004/2012.
3. Bouwknegt M, Friesema IHM, Van Pelt W, Havelaar AH. Disease burden of food related pathogens in the Netherlands, 2011. Bilthoven, the Netherlands: National Institute for Public Health and the Environment, 2013 Contract No.: 330331006/2013.
4. Mangen MJJ, Bouwknegt M, Friesema IHM, Kortbeek LM, Van Pelt W, Havelaar AH. Disease burden and cost-of-illness of food-related pathogens in the Netherlands. Bilthoven: National Institute for Public Health and the Environment, 2013 330331007 Contract No.: 330331007/2013.
5. Graveland H, Roest HJ, Stenvers O, Valkenburgh S, Friesema I, Van der Giessen J, et al. State of zoonotic diseases 2012 Bilthoven: National Institute for Public Health and the Environment, 2013 Contract No.: 092330002.
6. Friesema IH, de Jong AE, Fitz James IA, Heck ME, van den Kerkhof JH, Notermans DW, et al. Outbreak of Salmonella Thompson in the Netherlands since July 2012. Euro surveillance : bulletin Europeen sur les maladies transmissibles = European communicable disease bulletin. 2012;17(43):20303.
7. OVV. [Salmonella in gerookte zalm] In Dutch. Den Haag, the Netherlands: Onderzoeksraad voor de Veiligheid, 2013.
8. Bouwknegt M, Van Pelt W, Kubbinga M, Weda M, Havelaar AH. Recent increase in campylobacteriosis incidence in the Netherlands associated with proton-pump inhibitor use. Submitted to Eurosurveillance. 2013.
9. Bouwknegt M, Van Pelt W, Kubbinga M, Weda M, Havelaar AH. Recent increase in campylobacteriosis incidence in the Netherlands potentially related to proton-pump inhibitor use. Lancet. 2013;381:S22.
10. Havelaar AH, Van Duynhoven YT, Nauta MJ, Bouwknegt M, Heuvelink AE, De Wit GA, et al. Disease burden in The Netherlands due to infections with Shiga toxin-producing Escherichia coli O157. Epidemiology and infection. 2004;132(3):467-84.
11. Tariq L, Haagsma J, Havelaar A. Cost of illness and disease burden in The Netherlands due to infections with Shiga toxin-producing Escherichia coli O157. Journal of food protection. 2011;74(4):545-52.
12. Fournet N, Deege MP, Urbanus AT, Nichols G, Rosner BM, Chalmers RM, et al. Simultaneous increase of Cryptosporidium infections in the Netherlands, the United Kingdom and Germany in late summer season, 2012. Euro surveillance : bulletin Europeen sur les maladies transmissibles = European communicable disease bulletin. 2013;18(2).
13. Havelaar AH, Galindo AV, Kurowicka D, Cooke RM. Attribution of foodborne pathogens using structured expert elicitation. Foodborne pathogens and disease. 2008;5(5):649-59.

RIVM Letter report 2014-0069
Page 22 of 44
Table 1. Population in the Netherlands by age group, 2009-12 Age group 2012 2011 2010 2009
0 179,653 184,007 184,586 184,408
1-4 739,083 739,099 740,295 747,148
5-11 1,378,914 1,394,007 1,405,533 1,405,232
12-17 1,189,120 1,184,970 1,184,064 1,191,453
18-64 10,527,210 10,558,770 10,522,183 10,485,731
65+ 2,716,368 2,594,946 2,538,328 2,471,815
Total 16,730,348 16,655,799 16,574,989 16,485,787
Table 2. Live births by age of mothers in the Netherlands, 2009-12 Age of mother 2012 2011 2010 2009
-19 1,592 1,717 1,884 1,953
20-24 15,206 15,782 16,417 16,499
25-29 50,371 50,295 51,570 51,459
30-34 67,489 69,174 69,420 68,828
35-39 33,725 35,340 37,213 38,637
40-44 7,212 7,393 7,565 7,252
45+ 364 359 328 287
Total 175,959 180,060 184,397 184,915

RIVM Letter report 2014-0069
Page 23 of 44
Table 3. Trends in incidence of food-related pathogens, 1999-2012 Year Ca* Sa RV NV aLm aLm
fatal pLm pLm
fatal O157 O157
hosp HAV HAV
hosp
(a) (a) (a) (a) (b) (b) (b) (b) (b) (b) (b) (b)
1999 38.7 21.1 19.2 14.2 36
2000 42.1 20.3 15.7 12.8 43
2001 44.3 20.4 17.5 11.2 41
2002 40.8 15.4 16.5 11.8 49
2003 33.3 20.7 17.5 12.6 57
2004 40.0 15.6 15.4 13.2 37
2005 43.8 12.9 21.4 15.6 85 15 6 53
2006 40.0 16.0 25.5 17.3 59 17 5 1 40 258 39
2007 40.7 11.9 20.1 14.5 60 12 6 1 83 168 27
2008 39.2 15.7 27.1 18.1 51 6 1 1 45 183 35
2009 44.1 11.6 30.9 17.7 76 4 3 1 57 21 176 29
2010 50.2 13.8 35.2 22.2 73 13 4 1 52 21 262 52
2011 51.3 12.2 23.7 19.4 79 4 9 1 65 18† 125 25
2012 48.8 20.7 20.2 19.7 71 8 6 0 85 31‡ 121 28
Data sources: see text * Ca: Campylobacter spp.; Sa: Salmonella spp.; RV: rotavirus; NV: norovirus; aLm: acquired listeriosis; pLm: perinatal listeriosis; O157: STEC O157; HAV: hepatitis A-virus; hosp: hospitalized. † known for 57 of 65 cases
‡ known for 77 of 85 cases (a) per 100,000 inhabitants
(b) reported cases

RIVM Letter report 2014-0069
Page 24 of 44
Table 4. Incidence of gastroenteritis by pathogen in the Netherlands, 2012 (population 16.7 million) Pathogen General
population (x 1,000)
GP visit (x 1,000)
Hospitalised (x 1,000)
Fatal cases
All causes 4,813† 3,998-5,704‡
222 73-515
22.4 NA#
Bacteria – infectious Campylobacter spp. 101
15-277 24
12-45 1.1
0.4-2.2 34
21-51 STEC O157 2.1
0.23-8.7 0.3
0.01-0.9 0.03
- 1
0-3 Salmonella spp. 61
4.7-187 9.4
5.0-16 1.1
0.5-2.2
34 30-39
Bacteria – toxin producing Bacillus cereus 50
17-119 7.0
1.7-20 0.2
0.07-0.5 0
Clostridium perfringens
170 56-374
31 7.3-80
0.3 0.1-0.6
5 0-19
Staphylococcus aureus 293 129-552
41 12-97
1.5 0.7-2.8
7 0-29
Viruses Norovirus 703
482-1009 17
9.7-27 1.9
1.0-3.3 68
30-125 Rotavirus 258
127-461 16
10-24 5.8
4.3-7.7 40
14-88 Protozoa Cryptosporidium spp. 28
8.8-70 1.7
0.8-3.0 0.6
0.2-1.2 2
0-7 Giardia spp. 57
29-109 5.0
2.6-9.0 0.5
0.04-1.4 2
0-6 † mean ‡ 2.5-97.5 percentile # not available

RIVM Letter report 2014-0069
Page 25 of 44
Table 5. Incidence of non-gastrointestinal pathogens in the Netherlands, 2012
Pathogen Incidence Fatal cases Listeria monocytogenes Perinatal 6* 0 Acquired 71 8 Hepatitis A virus 590†
322-1,031‡ 2
1-3 Hepatitis E virus 53
23-94 1
0-1 Toxoplasma gondii Congenital 356
183-626 13
7-21 Acquired^ 426
198-722 0
* No uncertainty because Listeria cases were acquired through active surveillance † mean ‡ 2.5-97.5 percentile ^ Chorioretinitis only

RIVM Letter report 2014-0069
Page 26 of 44
Table 6. Incidence of sequelae by pathogen in the Netherlands, 2012
† mean ‡ 2.5-97.5 percentile * No uncertainty because cases were acquired through active surveillance NA: Not applicable (fatal cases reported in Table 2)
Pathogen and sequelae Incidence Fatal cases
Campylobacter spp. Guillain-Barré Syndrome 76† (0-142)‡ 1 (0-5) Reactive arthritis 1,839 (777-3,688) 0 Irritable Bowel Syndrome 8,830 (2,579-22,555) 0 Inflammatory Bowel Disease 23 (16-31) 0 STEC O157 Hameolytic Uraemic Syndrome 22 (15-30) 2 (1-5) End-Stage Renal Disease 3 (1-4) 1 (1-1) Salmonella spp. Reactive arthritis 771 (275-1,588) 0 Irritable Bowel Syndrome 5,220 (787-15,997) 0 Inflammatory Bowel Disease 8 (6-11) 0 Listeria monocytogenes (perinatal) Meningitis 6* NA Neurological sequelae of
meningitis 3 (1-4) 0
Listeria monocytogenes (acquired) Meningitis 18 (15-21) NA Neurological sequelae of
meningitis 3 (1-4) 0
Toxoplasma gondii (congenital) Chorioretinitis 1st year of life 48 (24-85) NA Chorioretinitis later years of life 58 (30-101) NA Intracranial calcifications 37 (19-68) NA Hydrocephalus 7 (3-14) NA Central Nervous System Abnormalities
10 (2-28) NA
Toxoplasma gondii (acquired) Chorioretinitis 426 (198-722) 0

RIVM Letter report 2014-0069
Page 27 of 44
Table 7. Overall disease burden, disease burden per 100,000 inhabitants and mean disease burden per case of illness in the Netherlands, 2012
Pathogen DALY per year
DALY per 100,000
DALY per 1,000 cases
Discount rate 0% 1.5% 0% 1.5% 0% 1.5% Bacteria – infectious Campylobacter spp. 3,472 3,099 20.6 18.4 40 35 STEC O157 139 108 0.8 0.7 157 124 Salmonella spp. 1,796 1,604 10.7 9.6 38 33 Listeria monocytogenes (perinatal) 55 32 0.3 0.2 9,167 5,451 Listeria monocytogenes (acquired) 72 67 0.4 0.4 999 957 Listeria monocytogenes (total) 127 99 0.7 0.6 1,635 1,307
Bacteria – toxin producing Bacillus cereus 113 113 0.7 0.7 2.3 2.3 Clostridium perfringens 538 531 3.2 3.2 3.2 3.1 Staphylococcus aureus 767 760 4.6 4.5 2.6 2.6
Viruses Norovirus 1,793 1,587 10.7 9.5 2.6 2.3 Rotavirus 1,416 1,272 8.4 7.6 5.7 5.2 Hepatitis A virus 96 82 0.6 0.5 167 145 Hepatitis E virus 23 18 0.1 0.1 460 380
Protozoa Cryptosporidium spp. 72 71 0.4 0.4 3.1 3.0 Giardia spp. 113 112 0.7 0.7 2.2 2.1 Toxoplasma gondii (congenital) 2,151 1,262 12.9 7.6 6,338 3,720 Toxoplasma gondii (acquired) 1,345 1,021 8.1 6.1 3,173 2,405 Toxoplasma gondii (total) 3,496 2,283 21.0 13.7 4,560 2,971

RIVM Letter report 2014-0069
Page 28 of 44
Table 8. Estimated total costs of illness (COI), COI per 100,000 inhabitants and mean COI per case of illness in the Netherlands, 2012
Pathogen COI per year (M€)
COI per 100,000 (k€)
COI per 1,000 cases (k€)
Discount rate 0% 4% 0% 4% 0% 4% Bacteria – infectious Campylobacter spp. 78 73 467 435 774 722 STEC O157 10 5.2 60 30 4,818 2,541 Salmonella spp. 36 34 212 199 569 530 Listeria monocytogenes (perinatal) 5.3 1.8 32 11 882,954 306,311 Listeria monocytogenes (acquired) 2.1 2.0 13 12 29,631 27,716 Listeria monocytogenes (total) 7.4 3.8 44 23 95,808 49,284
Bacteria – toxin producing Bacillus cereus 9.3 9.3 55 55 185 185 Clostridium perfringens 26 26 153 153 150 150 Staphylococcus aureus 54 54 319 319 182 182
Viruses Norovirus 108 108 633 633 152 152 Rotavirus 65 65 381 381 251 251 Hepatitis A virus 0.8 0.8 5 5 1,416 1,416 Hepatitis E virus 0.2 0.2 1.3 1.3 4,182 4,182
Protozoa Cryptosporidium spp. 8.1 8.1 47 47 290 290 Giardia spp. 10 10 62 62 179 179 Toxoplasma gondii (congenital) 52 17 304 99 142,894 46,519 Toxoplasma gondii (acquired) 2.8 2.8 16 16 6,567 6,559 Toxoplasma gondii (total) 55 20 320 115 67,502 24,408 TOTAL 462 412 2,760 2,459

RIVM Letter report 2014-0069
Page 29 of 44
Table 9. Attribution of the incidence, fatalities and disease burden to the major transmission pathways in the Netherlands, 2012
† mean; ‡ 2.5-97.5 percentile; * due to 14 pathogens included in this study
Transmission pathway Food Environment Human Animal Travel Total*
Incidence (x 1,000) 703† 206 590 86 138 1,724 327-1,347‡ 115-365 370-926 42-168 73-253 927-3,060 Fatal cases 75 35 69 17 23 218 43-140 19-62 29-130 10-27 13-39 110-400 DALY per year
not discounted 6,543 2,778 2,323 1,088 1,229 13,961 3,541-12,007 1,619-4,715 1,217-4,187 581-2,088 645-2,446 7,643-2,5362 discounted at 1.5% 5,496 2,177 2,064 947 1,055 11,739
2,829-10,512 1,225-3,841 1,097-3,725 478-1,869 517-2,074 6,180-22,057 Cost of illness
undiscounted (M€) 202 74 114 32 40 462discounted at 4% (M€) 175 60 113 29 36 412

RIVM Letter report 2014-0069
Page 30 of 44
Table 10. Attribution of the incidence, fatalities and disease burden of foodborne disease to food groups in the Netherlands, 2012
† mean; ‡ 2.5-97.5 percentile; * due to 14 pathogens included in this study
Food group Beef/ mutton
Pork Poultry Eggs Dairy Fish/ shellfish
Fruit/ veg.
Beverages Cereals Other foods
Human/ animal
Total*
Incidence 107 45 61 22 55 80 40 16 41 122 113 703 (x 1000) 41-223 18-93 22-136 6-53 24-108 53-126 18-77 8-31 18-79 54-236 65-187 327-1,347
Fatal cases 8.8 9.0 12 5.4 5.8 6.6 5.5 1.8 3.1 5.1 11 75 4.6-19 5.8-15 8.1-19 4.2-7.3 3.7-10 3.6-12 3.1-10 1.1-3.4 1.7-6.1 2.1-13 5.3-22 43-140 DALY per year
undiscounted 934 1,280 1,089 249 427 899 368 94 181 454 568 6,543 462-1,793 763-2,104 578-2,103 87-623 209-824 707-1,229 190-690 39-205 72-397 176-1,008 293-1,053 3,541-12,007
discounted 747 914 954 221 367 829 303 86 167 421 487 5,496 336-1,523 513-1,575 474-1,923 62-583 167-749 671-1,148 147-595 35-194 63-376 153-956 241-925 2,829-10,512
Cost of illness undiscounted 28.3 26.0 27.4 7.0 15.6 24.9 11.6 3.8 8.8 24.3 24.0 202 discounted 22.6 15.9 25.0 6.6 13.8 22.8 10.0 3.6 8.5 23.5 22.3 175

RIVM Letter report 2014-0069
Page 31 of 44
Figure 1. Comparison of incidence of food-related pathogens in 2009 through 2012
10 100 1000 10000 100000 1000000
Campylobacter spp.
STEC O157
Salmonella spp.
L. monocytogenes
B. cereus toxin
C. perfringens toxin
S. aureus toxin
Norovirus
Rotavirus
Hepatitis A virus
Hepatitis E virus
Cryptosporidium spp.
Giardia spp.
T. gondii
Estimated total number of cases per year
2009
2010
2011
2012

RIVM Letter report 2014-0069
Page 32 of 44
Figure 2. Comparison of disease burden of food-related pathogens in 2009 through 2012
0 1000 2000 3000 4000
Campylobacter spp.
STEC O157
Salmonella spp.
L. monocytogenes
B. cereus toxin
C. perfringens toxin
S. aureus toxin
Norovirus
Rotavirus
Hepatitis A virus
Hepatitis E virus
Cryptosporidium spp.
Giardia spp.
T. gondii
Estimated total DALYs per year
2009
2010
2011
2012

RIVM Letter report 2014-0069
Page 33 of 44
Annex. Detailed results Summary of results
Pathogen Incidence (per
year)Deaths
(per year)
Disease burden (DALY)
Undiscounted
Costs ( M€ per year)
Undiscounted DiscountedCampylobacter spp. 100,777 34 3,472 78 73STEC O157 2,112 4 139 10 5L. monocytogenes 77 5 127 7 4Salmonella spp. 60,707 34 1,796 35 32B. cereus toxine 50,393 0 113 9 9C. perfringens toxine 169,838 5 538 26 26S. aureus toxine 292,588 7 767 53 53Hepatitis-A virus 590 2 96 1 1Hepatitis-E virus 53 1 23 0 0Norovirus 703,416 68 1,793 107 107Rotavirus 257,554 40 1,416 65 65C. parvum 27,941 2 72 8 8G. lamblia 57,163 2 113 10 10T. gondii 782 12 3,496 53 19Totaal 1,723,991 215 13,961 462 412

RIVM Letter report 2014-0069
Page 34 of 44
Attribution to main pathways, all pathogens
Attribution of incidence by pathogen to main pathways
Main pathway Food Environment Human Animal Travel TotalIncidence (per year) 703,303 206,070 590,422 86,370 137,826 1,723,991Deaths (per year) 75 35 69 17 23 218Disease burden (DALY) 6,543 2,778 2,323 1,088 1,229 13,961Disease burden (DALY, discounted) 5,496 2,177 2,064 947 1,055 11,739Cost of illness (M€, undiscounted) 202 74 114 32 40 462Cost of illness (M€, discounted at 4%) 175 60 113 29 36 412
Pathogen Food Environment Human Animal Travel TotalCampylobacter 42,326 20,760 6,349 19,249 12,093 100,777STEC O157 854 363 215 433 247 2,112L. monocytogenes 54 5 4 4 10 77Salmonella 44,179 4,686 3,378 3,342 5,122 60,707B. cereus toxine 45,001 554 605 554 3,679 50,393C. perfringens toxine 153,533 3,736 3,567 3,567 5,435 169,838S. aureus toxine 255,137 10,533 9,363 6,437 11,118 292,588Hepatitis-A virus 67 66 107 0 350 590Hepatitis-E virus 7 13 4 6 23 53Norovirus 117,471 99,885 389,692 35,171 61,197 703,416Rotavirus 33,482 43,784 149,639 7,727 22,922 257,554C. parvum 3,325 7,740 7,656 3,744 5,476 27,941G. lamblia 7,431 13,662 19,836 6,116 10,118 57,163T. gondii 436 283 7 20 36 782Total 703,303 206,070 590,422 86,370 137,826 1,723,991

RIVM Letter report 2014-0069
Page 35 of 44
Attribution of deaths by pathogen to main pathways
Pathogen Food Environment Human Animal Travel TotaalCampylobacter 14.3 7.0 2.1 6.5 4.1 34.1STEC O157 1.6 0.7 0.4 0.8 0.5 4.0L. monocytogenes 5.5 0.5 0.4 0.4 1.1 8.0Salmonella 18.7 4.4 3.2 3.1 4.8 34.2B. cereus toxine 0.0 0.0 0.0 0.0 0.0 0.0C. perfringens toxine 4.2 0.1 0.1 0.1 0.1 4.6S. aureus toxine 6.3 0.3 0.2 0.2 0.3 7.3Hepatitis-A virus 0.2 0.2 0.3 0.0 1.1 1.9Hepatitis-E virus 0.1 0.2 0.0 0.1 0.3 0.6Norovirus 11.4 9.7 37.8 3.4 5.9 68.2Rotavirus 5.2 6.8 23.2 1.2 3.6 39.9C. parvum 0.2 0.5 0.5 0.2 0.3 1.7G. lamblia 0.2 0.4 0.5 0.2 0.3 1.6T. gondii 7.0 4.5 0.1 0.3 0.6 12.5Total 74.9 35.2 69.0 16.5 22.9 218.5

RIVM Letter report 2014-0069
Page 36 of 44
Attribution of disease burden (DALY per year, undiscounted) to main pathways
Pathogen Food Environment Human Animal Travel TotalCampylobacter 1,458 715 219 663 417 3,472STEC O157 57 24 14 28 16 139L. monocytogenes 88 8 7 7 17 127Salmonella 1,215 165 119 117 180 1,796B. cereus toxine 102 1 1 1 8 113C. perfringens toxine 487 12 11 11 17 538S. aureus toxine 668 28 25 17 29 767Hepatitis-A virus 9 11 18 0 58 96Hepatitis-E virus 2 6 2 3 10 23Norovirus 300 254 993 90 156 1,793Rotavirus 184 241 823 42 126 1,416C. parvum 8 20 20 10 14 72G. lamblia 14 27 40 12 20 113T. gondii 1,951 1,266 31 87 161 3,496Total 6,543 2,778 2,323 1,088 1,229 13,961

RIVM Letter report 2014-0069
Page 37 of 44
Attribution of cost-of-illness (k€ per year, undiscounted) to main pathways
Pathogen Food Environment Human Animal Travel TotalCampylobacter 32,780 16,078 4,917 14,907 9,366 78,048STEC O157 4,111 1,750 1,038 2,086 1,191 10,176L. monocytogenes 5,105 494 391 398 989 7,377Salmonella 23,737 3,071 2,214 2,190 3,356 34,567B. cereus toxine 8,345 103 112 103 682 9,345C. perfringens toxine 23,101 562 537 537 818 25,555S. aureus toxine 46,407 1,916 1,703 1,171 2,022 53,219Hepatitis-A virus 95 93 152 0 495 836Hepatitis-E virus 31 55 17 24 95 222Norovirus 17,858 15,185 59,242 5,347 9,303 106,935Rotavirus 8,418 11,009 37,623 1,943 5,763 64,756C. parvum 964 2,244 2,220 1,086 1,588 8,102G. lamblia 1,333 2,450 3,557 1,097 1,814 10,251T. gondii 29,455 19,109 475 1,320 2,428 52,787Total 201,741 74,118 114,198 32,207 39,912 462,176

RIVM Letter report 2014-0069
Page 38 of 44
Attribution of cost-of-illness (k€ per year, discounted at 4%) to main pathways Pathogen Food Environment Human Animal Travel TotalCampylobacter 30,552 14,985 4,583 13,894 8,729 72,742STEC O157 2,091 890 528 1,061 606 5,176L. monocytogenes 2,626 254 201 205 509 3,795Salmonella 22,117 2,846 2,052 2,030 3,111 32,155B. cereus toxine 8,345 103 112 103 682 9,345C. perfringens toxine 23,101 562 537 537 818 25,555S. aureus toxine 46,407 1,916 1,703 1,171 2,022 53,219Hepatitis-A virus 95 93 152 0 495 836Hepatitis-E virus 31 55 17 24 95 222Norovirus 17,858 15,185 59,242 5,347 9,303 106,935Rotavirus 8,418 11,009 37,623 1,943 5,763 64,756C. parvum 964 2,244 2,220 1,086 1,588 8,102G. lamblia 1,333 2,450 3,557 1,097 1,814 10,251T. gondii 10,651 6,910 172 477 878 19,087Total 174,590 59,501 112,698 28,973 36,414 412,176

RIVM Letter report 2014-0069
Page 39 of 44
Attribution to food groups, all pathogens
Food groupBeef &
Lamb Pork Poultry Eggs DairyFish &
shellfish Produce Beverages GrainsOther foods
Humans &
animals TotalIncidence (per year) 106,568 45,494 61,050 22,388 55,376 80,281 39,871 16,017 41,207 121,685 113,366 703,302Deaths (per year) 8.8 9.0 12 5.4 5.8 6.6 5.5 1.8 3.1 5.1 11 75Disease burden (DALY) 934 1,280 1,089 249 427 899 368 94 181 454 568 6,543Disease burden (DALY, discounted) 747 914 954 221 367 829 303 86 167 421 487 5,496Cost of illness (M€, undiscounted) 28.3 26.0 27.4 7.0 15.6 24.9 11.6 3.8 8.8 24.3 24.0 202Cost of illness (M€, discounted at 4%) 22.6 15.9 25.0 6.6 13.8 22.8 10.0 3.6 8.5 23.5 22.3 175

RIVM Letter report 2014-0069
Page 40 of 44
Attribution of incidence by pathogen to food groups
PathogenBeef &
Lamb Pork Poultry Eggs DairyFish &
shellfish Produce Beverages GrainsOther foods
Humans &
animals TotalCampylobacter 1,735 2,159 22,814 1,312 3,767 2,963 2,243 720 974 1,397 2,243 42,326STEC O157 376 55 26 18 63 25 61 31 25 30 144 854L. monocytogenes 6 5 4 2 13 9 4 1 3 3 3 53Salmonella 2,494 2,831 2,930 4,395 1,307 25,194 1,247 614 851 1,188 1,128 44,179B. cereus toxine 3,240 1,575 720 1,620 2,610 900 900 765 7,605 23,986 1,080 45,001C. perfringens toxine 73,388 12,897 10,901 4,299 6,295 9,980 10,594 3,838 3,992 11,822 5,527 153,533S. aureus toxine 19,135 20,666 19,901 8,420 37,505 14,798 5,103 4,592 19,135 75,521 30,361 255,137Hepatitis-A virus 0 0 0 0 0 8 9 3 3 2 42 67Hepatitis-E virus 0 5 0 0 0 0 1 0 0 0 1 7Norovirus 3,759 3,642 3,407 2,232 2,349 18,208 8,575 3,642 6,108 5,874 59,675 117,471Rotavirus 0 937 0 0 569 6,496 7,969 1,473 2,511 1,507 12,020 33,482C. parvum 871 146 96 90 306 725 688 100 0 100 203 3,325G. lamblia 1,464 357 230 0 572 959 2,452 238 0 245 914 7,431T. gondii 100 219 21 0 20 16 25 0 0 10 25 436Total 106,568 45,494 61,050 22,388 55,376 80,281 39,871 16,017 41,207 121,685 113,366 703,302

RIVM Letter report 2014-0069
Page 41 of 44
Attribution of deaths by pathogen to food groups
PathogenBeef &
Lamb Pork Poultry Eggs DairyFish &
shellfish Produce Beverages GrainsOther foods
Humans &
animals TotalCampylobacter 0.6 0.7 7.7 0.4 1.3 1.0 0.8 0.2 0.3 0.5 0.8 14.3STEC O157 0.7 0.1 0.1 0.0 0.1 0.0 0.1 0.1 0.0 0.1 0.3 1.6L. monocytogenes 0.6 0.5 0.4 0.2 1.4 1.0 0.4 0.1 0.3 0.3 0.3 5.5Salmonella 2.4 2.7 2.8 4.1 1.2 0.8 1.2 0.6 0.8 1.1 1.1 18.7B. cereus toxine 0.0 0.0 0.0 0.0 0.0 0.0 0.0 0.0 0.0 0.0 0.0 0.0C. perfringens toxine 2.0 0.3 0.3 0.1 0.2 0.3 0.3 0.1 0.1 0.3 0.1 4.2S. aureus toxine 0.5 0.5 0.5 0.2 0.9 0.4 0.1 0.1 0.5 1.9 0.8 6.3Hepatitis-A virus 0.0 0.0 0.0 0.0 0.0 0.0 0.0 0.0 0.0 0.0 0.1 0.2Hepatitis-E virus 0.0 0.1 0.0 0.0 0.0 0.0 0.0 0.0 0.0 0.0 0.0 0.1Norovirus 0.4 0.4 0.3 0.2 0.2 1.8 0.8 0.4 0.6 0.6 5.8 11.4Rotavirus 0.0 0.1 0.0 0.0 0.1 1.0 1.2 0.2 0.4 0.2 1.9 5.2C. parvum 0.1 0.0 0.0 0.0 0.0 0.0 0.0 0.0 0.0 0.0 0.0 0.2G. lamblia 0.0 0.0 0.0 0.0 0.0 0.0 0.1 0.0 0.0 0.0 0.0 0.2T. gondii 1.6 3.5 0.3 0.0 0.3 0.3 0.4 0.0 0.0 0.2 0.4 7.0Total 8.8 9.0 12.4 5.4 5.8 6.6 5.5 1.8 3.1 5.1 11.5 74.9
RIVM Letter report 2014-0069
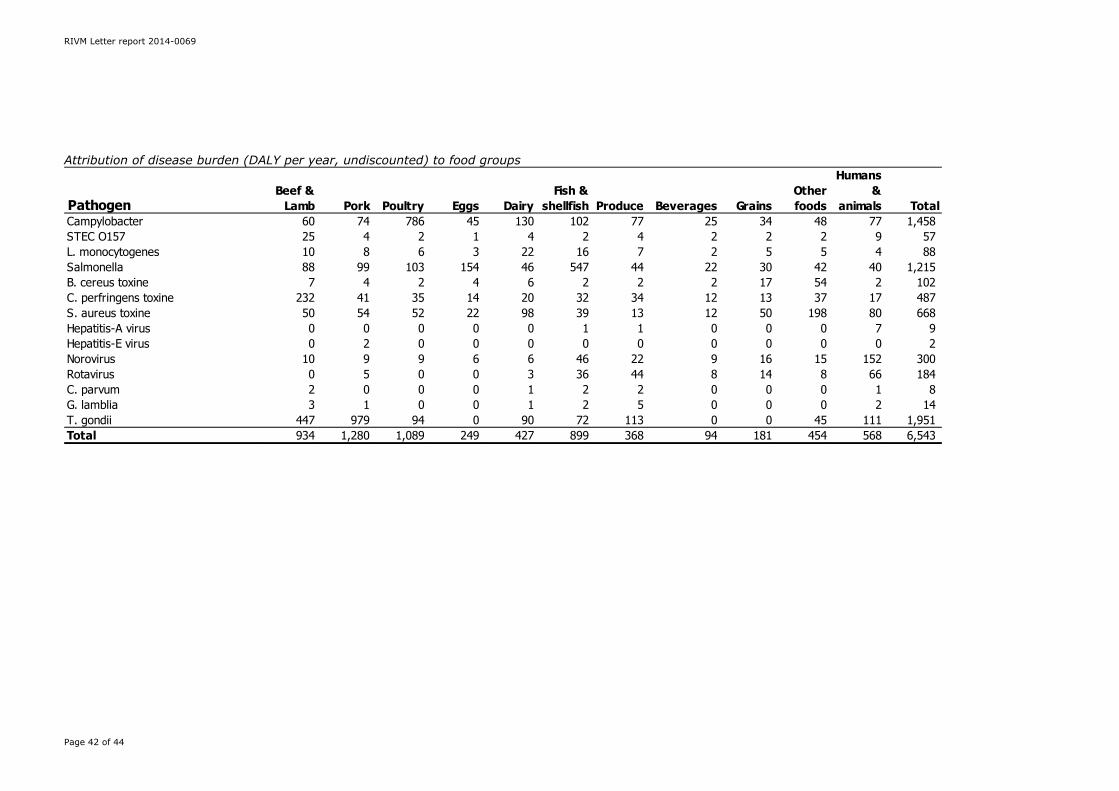
Page 42 of 44
Attribution of disease burden (DALY per year, undiscounted) to food groups
PathogenBeef &
Lamb Pork Poultry Eggs DairyFish &
shellfish Produce Beverages GrainsOther foods
Humans &
animals TotalCampylobacter 60 74 786 45 130 102 77 25 34 48 77 1,458STEC O157 25 4 2 1 4 2 4 2 2 2 9 57L. monocytogenes 10 8 6 3 22 16 7 2 5 5 4 88Salmonella 88 99 103 154 46 547 44 22 30 42 40 1,215B. cereus toxine 7 4 2 4 6 2 2 2 17 54 2 102C. perfringens toxine 232 41 35 14 20 32 34 12 13 37 17 487S. aureus toxine 50 54 52 22 98 39 13 12 50 198 80 668Hepatitis-A virus 0 0 0 0 0 1 1 0 0 0 7 9Hepatitis-E virus 0 2 0 0 0 0 0 0 0 0 0 2Norovirus 10 9 9 6 6 46 22 9 16 15 152 300Rotavirus 0 5 0 0 3 36 44 8 14 8 66 184C. parvum 2 0 0 0 1 2 2 0 0 0 1 8G. lamblia 3 1 0 0 1 2 5 0 0 0 2 14T. gondii 447 979 94 0 90 72 113 0 0 45 111 1,951Total 934 1,280 1,089 249 427 899 368 94 181 454 568 6,543

RIVM Letter report 2014-0069
Page 43 of 44
Attribution of cost-of-illness (k€ per year, undiscounted) to food groups
PathogenBeef & Lamb Pork Poultry Eggs Dairy
Fish & shellfish Produce Beverages Grains
Other foods
Humans &
animals TotalCampylobacter 1,344 1,672 17,669 1,016 2,917 2,295 1,737 557 754 1,082 1,737 32,780STEC O157 1,813 263 127 86 304 119 292 148 119 144 695 4,111L. monocytogenes 572 475 337 194 1,261 909 388 133 301 286 250 5,105Salmonella 1,635 1,855 1,920 2,880 856 11,296 817 402 558 778 739 23,737B. cereus toxine 601 292 134 300 484 167 167 142 1,410 4,448 200 8,345C. perfringens toxine 11,042 1,941 1,640 647 947 1,502 1,594 578 601 1,779 832 23,101S. aureus toxine 3,481 3,759 3,620 1,531 6,822 2,692 928 835 3,481 13,736 5,522 46,407Hepatitis-A virus 0 0 0 0 0 12 12 4.2 4.2 3.0 60 95Hepatitis-E virus 0 23 0 0 0 1 2 1 0 0 3 31Norovirus 571 554 518 339 357 2,768 1,304 554 929 893 9,072 17,858Rotavirus 0 236 0 0 143 1,633 2,004 370 631 379 3,022 8,418C. parvum 253 42 28 26 89 210 200 29 0 29 59 964G. lamblia 263 64 41 0 103 172 440 43 0 44 164 1,333T. gondii 6,745 14,786 1,414 0 1,355 1,090 1,708 0 0 677 1,679 29,455Total 28,319 25,961 27,447 7,020 15,638 24,865 11,593 3,796 8,788 24,278 24,035 201,741

RIVM Letter report 2014-0069
Page 44 of 44
Attribution of cost-of-illness (k€ per year, discounted at 4%) to food groups
PathogenBeef &
Lamb Pork Poultry Eggs DairyFish &
shellfish Produce Beverages GrainsOther foods
Humans &
animals TotalCampylobacter 1,253 1,558 16,467 947 2,719 2,139 1,619 519 703 1,008 1,619 30,552STEC O157 922 134 65 44 155 61 148 75 61 73 353 2,091L. monocytogenes 294 244 173 100 649 467 200 68 155 147 129 2,626Salmonella 1,515 1,719 1,779 2,669 794 10,587 757 373 517 721 685 22,117B. cereus toxine 601 292 134 300 484 167 167 142 1,410 4,448 200 8,345C. perfringens toxine 11,042 1,941 1,640 647 947 1,502 1,594 578 601 1,779 832 23,101S. aureus toxine 3,481 3,759 3,620 1,531 6,822 2,692 928 835 3,481 13,736 5,522 46,407Hepatitis-A virus 0 0 0 0 0 12 12 4.2 4.2 3.0 60 95Hepatitis-E virus 0 23 0 0 0 1.5 2.3 1.1 0.0 0.0 3.2 31Norovirus 571 554 518 339 357 2,768 1,304 554 929 893 9,072 17,858Rotavirus 0 236 0 0 143 1,633 2,004 370 631 379 3,022 8,418C. parvum 253 42 28 26 89 210 200 29 0 29 59 964G. lamblia 263 64 41 0 103 172 440 43 0 44 164 1,333T. gondii 2,439 5,347 511 0 490 394 618 0 0 245 607 10,651Total 22,634 15,912 24,977 6,604 13,751 22,804 9,992 3,591 8,491 23,506 22,328 174,590


RIVMCommitted to health and sustainability
Disease burden of food-related pathogens in the Netherlands, 2012
RIVM Letter report 2014-0069/2014M. Bouwknegt et al.