rmf – the latest and greatest - share · rmf – the latest and greatest peter muench ... (wlmgl)...
TRANSCRIPT

1
RMF – The Latest and Greatest
Peter Muench ([email protected])
IBM Corporation
Monday, August 6, 2012
Session 11608

2
2
The following are trademarks of the International Business Machines Corporation in the United States, other countries, or both.
The following are trademarks or registered trademarks of other companies.
* All other products may be trademarks or registered trademarks of their respective companies.
Notes:
Performance is in Internal Throughput Rate (ITR) ratio based on measurements and projections using standard IBM benchmarks in a controlled environment. The actual throughput that any user will experience will vary depending upon considerations such as the amount of multiprogramming in the user's job stream, the I/O configuration, the storage configuration, and the workload processed. Therefore, no assurance can be given that an individual user will achieve throughput improvements equivalent to the performance ratios stated here.
IBM hardware products are manufactured from new parts, or new and serviceable used parts. Regardless, our warranty terms apply.
All customer examples cited or described in this presentation are presented as illustrations of the manner in which some customers have used IBM products and the results they may have achieved. Actual environmental costs and performance characteristics will vary depending on individual customer configurations and conditions.
This publication was produced in the United States. IBM may not offer the products, services or features discussed in this document in other countries, and the information may be subject to change without notice. Consult your local IBM business contact for information on the product or services available in your area.
All statements regarding IBM's future direction and intent are subject to change or withdrawal without notice, and represent goals and objectives only.
Information about non-IBM products is obtained from the manufacturers of those products or their published announcements. IBM has not tested those products and cannot confirm the performance, compatibility, or any other claims related to non-IBM products. Questions on the capabilities of non-IBM products should be addressed to the suppliers of those products.
Prices subject to change without notice. Contact your IBM representative or Business Partner for the most current pricing in your geography.
Adobe, the Adobe logo, PostScript, and the PostScript logo are either registered trademarks or trademarks of Adobe Systems Incorporated in the United States, and/or other countries.
Cell Broadband Engine is a trademark of Sony Computer Entertainment, Inc. in the United States, other countries, or both and is used under license therefrom.
Java and all Java-based trademarks are trademarks of Sun Microsystems, Inc. in the United States, other countries, or both.
Microsoft, Windows, Windows NT, and the Windows logo are trademarks of Microsoft Corporation in the United States, other countries, or both.
Intel, Intel logo, Intel Inside, Intel Inside logo, Intel Centrino, Intel Centrino logo, Celeron, Intel Xeon, Intel SpeedStep, Itanium, and Pentium are trademarks or registered trademarks of Intel
Corporation or its subsidiaries in the United States and other countries.
UNIX is a registered trademark of The Open Group in the United States and other countries.
Linux is a registered trademark of Linus Torvalds in the United States, other countries, or both.
ITIL is a registered trademark, and a registered community trademark of the Office of Government Commerce, and is registered in the U.S. Patent and Trademark Office.
IT Infrastructure Library is a registered trademark of the Central Computer and Telecommunications Agency, which is now part of the Office of Government Commerce.
For a complete list of IBM Trademarks, see www.ibm.com/legal/copytrade.shtml:
*, AS/400®, e business(logo)®, DBE, ESCO, eServer, FICON, IBM®, IBM (logo)®, iSeries®, MVS, OS/390®, pSeries®, RS/6000®, S/30, VM/ESA®, VSE/ESA, WebSphere®, xSeries®, z/OS®, zSeries®, z/VM®, System i, System i5, System p, System p5, System x, System z, System z9®, BladeCenter®
Not all common law marks used by IBM are listed on this page. Failure of a mark to appear does not mean that IBM does not use the mark nor does it mean that the product is not
actively marketed or is not significant within its relevant market.
Those trademarks followed by ® are registered trademarks of IBM in the United States; all others are trademarks or common law marks of IBM in the United States.
Trademarks

3
3
RMF Product Overview
RMF Distributed Data Server (GPMSERVE) & RMF XP (GPM4CIM)
RMF Sysplex Data Server and APIs
RMF Postprocessor
Historical Reporting,
Analysis and Planning
RMF Monitor II and III
Real-Time Reporting,
Problem Determination
RMF
Data Gatherer RMFMonitor I
RMFMonitor II
background
RMF
Monitor III
SMF
RMF Performance Data PortalRMF Spreadsheet Reporter z/OSMF Resource Monitoring
AIX & Linux
CIM Provider
CIM Client APIs
VSAM
• z/OS Resource Measurement Facility (RMF) is an optional priced feature of z/OS. It supports installations in performance analysis, capacity planning, and problem determination. For these disciplines, different kinds of data collectors are needed:
• Monitor I long term data collector for all types of resources and workloads. The SMF data collected by Monitor I is mostly used for capacity planning and performance analysis
• Monitor II snap shot data collector for address space states and resource usage. A subset of Monitor II data is also displayed by the IBM SDSF product
• Monitor III short-term data collector for problem determination, workflow delay monitoring and goal attainment supervision.
This data is also used by the RMF PM Java Client and the RMF Monitor III Data Portal
• Data collected by all three gatherers can be saved persistently for later reporting (SMF records or Monitor III VSAM datasets)
• While Monitor II and Monitor III are realtime reporters, the RMF Postprocessor is the historical reporting function for Monitor I data
• One of the key components for the sysplex wide access of Monitor III data is the RMF Distributed Data Server (DDS). With
RMF for z/OS 1.12, DDS supports HTTP requests to retrieve RMF Postprocessor data from a selection of RMF Postprocessor reports. Since the requested data are returned as XML document, a web browser can act as Data Portal to RMF Postprocessor data.
• With z/OS 1.12 there’s another exploiter of the RMF DDS data: The z/OSMF Resource Monitoring plugin of the z/OSManagement Facility.
• RMF for z/OS 1.13 enhances the DDS layer with a new component:
• RMF XP is the new solution for Cross Platform Performance Monitoring
• Provides a seamless performance monitoring for all operating systems running on the IBM zEnterprise Bladecenter Extension.

4
4
■ RMF WLM Reporting Enhancements► Enhanced monitoring for transactional workloads with Velocity Goals
■ RMF Storage Reporting Enhancements► Appropriate reporting of 64-Bit Storage
■ Postprocessor XML Formatted Reports► State-of-the-art UI for SMF Type 7x Data► Standardized Report Format for API Access► Remote Reporting via Spreadsheet Reporter
■ HTTP API to access Historical data► Enable RMF Distributed Data Server to request historical
RMF Postprocessor data via HTTP
■ Reporting of system serialization delays► Detect serialization-related performance issues► System suspend lock, GRS enqueue and latch contention information
■ In-Ready Work Unit Queue Distribution► Identify latent Demand► Dispatchable Unit Granularity
■ z/OSMF Resource Monitoring► Plugin of z/OS Management Facility
► Cross-sysplex performance monitoring from a single point of control
■ RMF XP► New solution for Cross Platform Performance Monitoring ► Seamless monitoring for all zBX related platforms
z/OS V1.12
z/OS V1.11
z/OS V1.13
z/OS V1.13
z/OS V1.13
RMF Enhancements
z/OS V1.12
z/OS V1.12
z/OS V1.13
In accordance with the availability of new z/OS releases and new hardware functionality, the capabilities of RMF are
enhanced consecutively
• Starting with z/OS V1.13, WLM reporting is enhanced to provide response time distributions also for workloads with an execution velocity goal
• RMF for z/OS 1.13 exploits the new response time distribution data
• Layout and contents of RMF Postprocessor Paging activity report are changed to provide an appropriate reporting of the 64-Bit storage world on today‘s systems
• As an alternative to the standard text format, Postprocessor reports can now be generated in XML format. The new format
provides:
• Browser based, state-of-the-art display of SMF Type 7x data
• Standardized format for access to performance data via XML parsing
• The RMF Distributed Data Server (DDS) is extended by the capability to grant instant and easy access to RMF long-term historical data by using HTTP and XML.
• With the increasing workload on z/OS systems, resource contention can become more and more a factor that impacts the overall performance.
• RMF for z/OS 1,13 collects and reports System suspend lock, GRS enqueue and latch contention data
• The in-ready queue distribution is now reported on work unit granularity
• z/OS Resource Monitoring is a new plugin of the z/OS Management Facility. The Web browser based user interface allows a cross-sysplex performance monitoring from a single point of control:
• Enterprise-wide health check of all z/OS sysplexes.
• Performance monitoring with graphically display of RMF Monitor III metrics as well as Linux metrics by means of customizable views.
• RMF XP is the new solution for Cross Platform Performance Monitoring
• Provides a seamless performance monitoring for all operating systems running on the IBM zEnterprise Bladecenter Extension.

5
5
RMF WLM Reporting Enhancements
• Currently WLM reporting does not provide a response time distribution (ended
transactions) for workloads with velocity goals
• But it is desirable to have a response time distribution for all transactional
workloads, even if they have a velocity goal
• More data to analyze workload behavior and to detect problems
• Better support for migration of goal definitions to response time goals
• With z/OS V1.13 the WLM IWMRCOLL interface provides response time
distribution data for service class periods with an execution velocity goal
• RMF for z/OS 1.13 exploits the new IWMRCOLL data:
• RMF Monitor I data gatherer collects the new response time information in
SMF 72 subtype 3 record
• RMF Postprocessor Workload Activity report (WLMGL) displays
• Response time distribution for response time and execution velocity goals
• One merged distribution for workloads with response time goals per sysplex
• One distribution for workloads with execution velocity goals per system in sysplex
• Today, WLM reports response time distributions for workloads with a response time goal in the IWMWRCAA answer area of IWMRCOLL interface
• Starting with z/OS V1.13, WLM reporting is enhanced to provide response time distributions also for workloads with an execution velocity goal
• RMF for z/OS 1.13 exploits the new response time distribution data for transactions with an execution velocity goal:
• RMF Monitor I collects the new interface data in the SMF 72.3 records. The Service/Report Class Period Data section of the SMF 72.3 record is extended with new fields.
• RMF Postprocessor (PP) Workload Activity report (WLMGL) now reports response time distributions for response
time and execution velocity goals:
• The response time distribution for service/report class periods with a response time goal is a
sysplex-wide view with the combined SMF72.3 data from all systems in the sysplex
• For service/report class periods with excecution velocity goals, there is one response time distribution per
system in the sysplex.
• The RMF PP WLMGL report option is enhanced with the new suboption RTD|NORTD that can be used to
display/suppress the response time distribution section in the workload activity report:
• The suboption can be specified together with suboptions SCPER and RCPER
• It is ignored if specified together with other suboptions than SCPER and RCPER
• Default: RTD
• Example: SYSRPTS(WLMGL(SCPER(VEL90I1,VEL90I3),NORTD)) -> Creates RMF PP WLMGL report for service classes VEL90I1 and VEL90I3 without
response time distribution section
• The new response time distribution for service/report class periods with execution velocity goal helps the customer to obtain better analysis data and to migrate their goal definitions to a meaningful response time goal.

6
6
RMF WLM Reporting Enhancements …
1501401009080 130120110 400 >4002007060≤≤≤≤50Response time
distribution map
05302510 1320 0 0120153Response time
distribution buckets
Response time distribution
buckets
►Response Time Goal
Example : Goal = 80% within 2 secTRX1
RT = 2.1 sec (105% of goal)
813403010 151830 1 0112155
► Execution Velocity Goal
Example : Velocity = 90%
Average Response Time = 3.1 sec
TRX2
RT = 2.7 sec (87% of avg RT)
21
31
• For each service/report class period, WLM maintains 14 response time distribution buckets with the number of transactions thatcompleted within a particular time.
• Workloads with response time goals:
• Distribution is built around response time goal as defined in WLM service definition
• The response time goal for the service class period is split into 14 response time buckets where:
• bucket 1 covers the gap from 0 to half the goal
• buckets 2 to 11 cover the gap between half the goal to 1.5 times the goal evenly divided
• bucket 12 covers two times the goal
• bucket 13 covers four times the goal
• bucket 14 covers the gap from four times the goal to infinity
• Workloads with execution velocity goal
• Distribution is built around average response time as measured by WLM
• The average of all response times (midpoint) for the service/report class period is split into 14 response time bucketswhere:
• bucket 1 covers the gap from 0 to half the midpoint
• buckets 2 to 11 cover the gap between half to 1.5 times the midpoint evenly divided
• bucket 12 covers two times the midpoint
• bucket 13 covers four times the midpoint
• bucket 14 covers the gap from four times the midpoint to infinity

7
7
RMF WLM Reporting Enhancements …
W O R K L O A D A C T I V I T Y
z/OS V1R13 SYSPLEX TESTPLEX DATE 10/26/2010 INTERVAL 30.00.212 MODE = GOAL
RPT VERSION V1R13 RMF TIME 10.28.11
REPORT BY: POLICY=TEST12 WORKLOAD=TEST1 SERVICE CLASS=TSOCLASS RESOURCE GROUP=*NONE PERIOD=1 IMPORTANCE=2
CRITICAL =NONE
GOAL: RESPONSE TIME 000.00.02.000 FOR 90%
RESPONSE TIME EX PERF
SYSTEM ACTUAL% VEL% INDX
*ALL 100 85.7 0.5
TST1 99.4 100 0.5
TST2 100 80.0 0.5
----------RESPONSE TIME DISTRIBUTION----------
----TIME---- --NUMBER OF TRANSACTIONS-- -------PERCENT------- 0 10 20 30 40 50 60 70 80 90 100
HH.MM.SS.TTT CUM TOTAL IN BUCKET CUM TOTAL IN BUCKET !....!....!....!....!....!....!....!....!....!....!
< 00.00.01.000 497 497 100 100 >>>>>>>>>>>>>>>>>>>>>>>>>>>>>>>>>>>>>>>>>>>>>>>>>>>
<= 00.00.01.200 497 0 100 0.0 >
<= 00.00.01.400 497 0 100 0.0 >
<= 00.00.01.600 497 0 100 0.0 >
<= 00.00.01.800 497 0 100 0.0 >
<= 00.00.02.000 497 0 100 0.0 >
<= 00.00.02.200 498 1 100 0.2 >
<= 00.00.02.400 498 0 100 0.0 >
<= 00.00.02.600 498 0 100 0.0 >
<= 00.00.02.800 498 0 100 0.0 >
<= 00.00.03.000 498 0 100 0.0 >
<= 00.00.04.000 499 1 100 0.2 >
<= 00.00.08.000 499 0 100 0.0 >
> 00.00.08.000 499 0 100 0.0 >
Service / Report Class with Response Time Goal
Sysplex wide
Service / Report Class with Response Time Goal:
• The response time distribution in the RMF PP WLMGL report is a sysplex-wide view created by merging the SMF 72.3 datafrom all systems in a sysplex.

8
8
RMF WLM Reporting Enhancements …
W O R K L O A D A C T I V I T Y
z/OS V1R13 SYSPLEX TESTPLEX DATE 10/26/2010 INTERVAL 30.00.212 MODE = GOAL
RPT VERSION V1R13 RMF TIME 10.28.11
REPORT BY: POLICY=VICOM2 WORKLOAD=VICOM SERVICE CLASS=VEL90I2 RESOURCE GROUP=*NONE PERIOD=1 IMPORTANCE=2
CRITICAL =NONE
GOAL: EXECUTION VELOCITY 90.0% VELOCITY MIGRATION: I/O MGMT 96.0% INIT MGMT 44.9%
RESPONSE TIME EX PERF
SYSTEM VEL% INDX
*ALL --N/A-- 96.0 0.9
TST1 95.3 0.9
TST2 96.7 0.9
----------RESPONSE TIME DISTRIBUTIONS----------
SYSTEM: TST1 -----INTERVAL: 15.49.248 -----MRT CHANGES: 1 --- SYSTEM: TST2 -----INTERVAL: 17.01.121 -----MRT CHANGES: 1 ---
----TIME---- -NUMBER OF TRANSACTIONS- ------PERCENT------ ----TIME---- -NUMBER OF TRANSACTIONS- ------PERCENT------
HH.MM.SS.TTT CUM TOTAL IN BUCKET CUM TOTAL IN BUCKET HH.MM.SS.TTT CUM TOTAL IN BUCKET CUM TOTAL IN BUCKET
< 00.00.05.308 9 9 5.9 5.9 < 00.00.03.871 0 0 0.0 0.0
<= 00.00.06.370 45 36 29.4 23.5 <= 00.00.04.645 0 0 0.0 0.0
<= 00.00.07.431 72 27 47.1 17.6 <= 00.00.05.419 8 8 4.4 4.4
<= 00.00.08.493 83 11 54.2 7.2 <= 00.00.06.193 48 40 26.2 21.9
<= 00.00.09.555 90 7 58.8 4.6 <= 00.00.06.967 70 22 38.3 12.0
<= 00.00.10.617 117 27 76.5 17.6 <= 00.00.07.742 87 17 47.5 9.3
<= 00.00.11.678 153 36 100 23.5 <= 00.00.08.516 101 14 55.2 7.7
<= 00.00.12.740 153 0 100 0.0 <= 00.00.09.290 113 12 61.7 6.6
<= 00.00.13.802 153 0 100 0.0 <= 00.00.10.064 119 6 65.0 3.3
<= 00.00.14.863 153 0 100 0.0 <= 00.00.10.838 160 41 87.4 22.4
<= 00.00.15.925 153 0 100 0.0 <= 00.00.11.613 183 23 100 12.6
<= 00.00.21.234 153 0 100 0.0 <= 00.00.15.484 183 0 100 0.0
<= 00.00.42.468 153 0 100 0.0 <= 00.00.30.968 183 0 100 0.0
> 00.00.42.468 153 0 100 0.0 > 00.00.30.968 183 0 100 0.0
Service / Report Class with Execution Velocity Goal
MeasurementInterval
Number of midpoint changes
Service / Report Class with Execution Velocity Goal:
• The RMF PP WLMGL report displays one response time distribution per system.
• Response time distribution is build around the average response time measured by WLM.
• Average repsonse time is calculated from the response time of ended transactions on the system.

9
9
RMF Storage Reporting Enhancements
2 GB
16 EB
231
264
249
0
512 TB
High User Private
High Common
High Shared
Below 2GB
Low User Private
Memory
Objects
Memory
Objects
Memory
Objects
Rationale
► Structure and metrics in RMF PP Paging Activity report
no longer appropriate to present today‘s system memory
in a 64-Bit world:
�Expanded Storage section removed but layout not
adapted
�Metrics for Physical swapping to auxiliary storage and
expanded storage obsolete
� Increased number of metrics for high virtual storage:
� Memory Objects in high virtual common, shared or
private storage
� Large Pages (1MB) for high private and commonstorage
RMF Postprocessor Paging Activity reportrestructured and enhanced
• Several reasons to restructure the RMF Postprocessor Paging Activity
• Section with expanded storage data was removed from the report, but layout not adapted.
• Beginning with z/OS 1.8, physical swapping of address spaces to AUX is no longer done so that the physical swap metrics are obsolete
• Current report layout does not allow a proper reporting of an increasing number of metrics for high virtual memory.

10
10
RMF Storage Reporting Enhancements …
►RMF Enhancements for RMF Monitor I Paging Activity Report
�Following report sections restructured:
� Central Storage Paging Rates
� Central Storage Movement and Request Rates
� Frame and Slot Counts
�New Metrics:
� LFAREA size
� Central storage frames allocated for high virtual common
and shared memory
�Swap Placement Activity section removed from report
�New overview condition LSWAPTOT for the total logical swap rate.
Rate calculated from the accumulated logical swap counts for all swap
reasons.
�New Memory Objects and Frames section to display statistics for high
virtual memory objects and frames
�Report now available in XML format
• RMF Postprocessor Paging Activity report restructured and enhanced:
• Report sections restructured:
�Central Storage Paging Rates
�Central Storage Movement and Request Rates
�Frame and Slot Counts
• New metrics for 64-Bit storage:
�Size of large frame area (LFAREA)
�Central storage frames for memory objects in high virtual common and shared storage.
• The Swap Placement Activity section is no longer provided.
• Related overview conditions are not supported when data for z/OS V1R13 or later is processed.
• As replacement of logical swap statistics. RMF provides the new overview condition LSWAPTOT to report the accumulated number of all logical swaps.
• New Memory Objects and Frames section with statistics about high virtual memory objects and frames.
• Paging Activity report now available in XML format.

11
11
P A G I N G A C T I V I T Y
FRAME AND SLOT COUNTS
------------------------------------------------------------------------------------------------
CENTRAL STORAGE LOCAL PAGE DATA SET SLOT COUNTS
---------------------------- ------------------------------------------------
MIN MAX AVG MIN MAX AVG
(61 SAMPLES)
AVAILABLE 739,126 739,776 739,434 AVAILABLE SLOTS 593,999 593,999 593,999
SQA 11,467 11,495 11,479 VIO SLOTS 0 0 0
LPA 4,941 4,941 4,941
CSA 6,598 6,615 6,604 NON-VIO SLOTS 0 0 0
LSQA 26,407 26,449 26,414
REGIONS+SWA 257,100 257,722 257,424 BAD SLOTS 0 0 0
TOTAL FRAMES 1048836 1048836 1048836 TOTAL SLOTS 593,999 593,999 593,999
FIXED FRAMES SHARED FRAMES AND SLOTS
---------------------------- ------------------------------------------------
NUCLEUS 2,543 2,543 2,543 CENTRAL STORAGE 4,640 4,661 4,646
SQA 10,595 10,623 10,607
LPA 80 80 80 FIXED TOTAL 30 30 30
CSA 1,081 1,081 1,081 FIXED BELOW 16 M 0 0 0
LSQA 8,846 8,848 8,846 AUXILIARY SLOTS 0 0 0
REGIONS+SWA 33,769 33,888 33,845 TOTAL 5,658 5,679 5,664
BELOW 16 MEG 42 42 42
BETWEEN 16M-2G 22,526 22,648 22,591 MEMORY OBJECTS AND FRAMES
TOTAL FRAMES 56,938 57,060 57,003 ------------------------------------------------
OBJECTS COMMON 35 35 35
SHARED 10 10 10
LARGE 5 5 5
FRAMES COMMON 2000 4000 3000
COMMON FIXED 1000 2000 1500
SHARED 1000 2000 1500
1 MB 10 20 15
RMF Storage Reporting Enhancements …
P A G I N G A C T I V I T Y
FRAME AND SLOT COUNTS
------------------------------------------------------------------------------------------------
CENTRAL STORAGE LOCAL PAGE DATA SET SLOT COUNTS
---------------------------- ------------------------------------------------
MIN MAX AVG MIN MAX AVG
(61 SAMPLES)
AVAILABLE 739,126 739,776 739,434 AVAILABLE SLOTS 593,999 593,999 593,999
SQA 11,467 11,495 11,479 VIO SLOTS 0 0 0
LPA 4,941 4,941 4,941
CSA 6,598 6,615 6,604 NON-VIO SLOTS 0 0 0
LSQA 26,407 26,449 26,414
REGIONS+SWA 257,100 257,722 257,424 BAD SLOTS 0 0 0
TOTAL FRAMES 1048836 1048836 1048836 TOTAL SLOTS 593,999 593,999 593,999
FIXED FRAMES SHARED FRAMES AND SLOTS
---------------------------- ------------------------------------------------
NUCLEUS 2,543 2,543 2,543 CENTRAL STORAGE 4,640 4,661 4,646
SQA 10,595 10,623 10,607
LPA 80 80 80 FIXED TOTAL 30 30 30
CSA 1,081 1,081 1,081 FIXED BELOW 16 M 0 0 0
LSQA 8,846 8,848 8,846 AUXILIARY SLOTS 0 0 0
REGIONS+SWA 33,769 33,888 33,845 TOTAL 5,658 5,679 5,664
BELOW 16 MEG 42 42 42
BETWEEN 16M-2G 22,526 22,648 22,591 MEMORY OBJECTS AND FRAMES
TOTAL FRAMES 56,938 57,060 57,003 ------------------------------------------------
OBJECTS COMMON 35 35 35
SHARED 10 10 10
LARGE 5 5 5
FRAMES COMMON 2000 4000 3000
COMMON FIXED 1000 2000 1500
SHARED 1000 2000 1500
1 MB 10 20 15
P A G I N G A C T I V I T Y
FRAME AND SLOT COUNTS
-------------------------------------------------------------------------------------------------------------------------------
(181 SAMPLES)
CENTRAL STORAGE FRAMES TOTAL AVAILABLE SQA LPA CSA LSQA REGIONS+SWA HV SHARED HV COMMON
---------------------- --------- --------- --------- --------- --------- --------- ----------- --------- ---------
MIN 7,864,316 2,751,600 20,217 6,429 16,601 104,493 4,776,978 77,276 18,387
MAX 7,864,316 2,840,625 20,636 6,438 16,636 105,735 4,865,152 77,276 18,389
AVG 7,864,316 2,784,680 20,465 6,434 16,620 105,347 4,832,283 77,276 18,388
FIXED FRAMES TOTAL NUCLEUS SQA LPA CSA LSQA REGIONS+SWA <16 MB 16MB-2GB
---------------------- --------- --------- --------- --------- --------- --------- ----------- --------- ---------
MIN 319,129 2,821 18,735 81 15,952 28,812 252,349 56 27,791
MAX 324,274 2,821 19,154 81 15,952 29,482 257,151 71 28,857
AVG 320,866 2,821 18,982 81 15,952 29,314 253,715 56 28,313
SHARED FRAMES TOTAL SLOTS CENTRAL STORAGE FIXED TOT FIXED BEL AUX DASD
---------------------- ----------- -------------------- --------- --------- ---------
MIN 81,456 72,227 51 0 0
MAX 81,476 72,247 51 0 0
AVG 81,460 72,231 51 0 0
LOCAL PAGE DATA SET SLOTS TOTAL AVAILABLE BAD NON-VIO VIO
------------------------- --------- --------- --------- --------- ---------
MIN 5,399,997 5,399,619 0 20 0
MAX 5,399,997 5,399,977 0 378 0
AVG 5,399,997 5,399,654 0 343 0
Frames allocated for high virtual shared
and common memory
New
Section headers and MIN/MAX/AVG columns now
displayed as rows
• Layout of the Postprocessor Paging Activity report is changed to display the section headers and MIN/MAX/AVG columnsas rows.
• The screenshot shows the new layout of the FRAME AND SLOT COUNTS section.
• CENTRAL STORAGE FRAMES statistics are enhanced with new metrics ‚HV SHARED‘ and ‚HV COMMON‘:
• HV SHARED: MIN, MAX and AVG number of frames allocated for high virtual shared memory
• HV COMMON: MIN, MAX and AVG number of frames allocated for high virtual common memory

12
12
RMF Storage Reporting Enhancements …
P A G I N G A C T I V I T Y
OPT = IEAOPTCB LFAREA SIZE = 734003200 MEMORY OBJECTS AND FRAMES
-------------------------------------------------------------------------------------------------------------------------------
MEMORY OBJECTS COMMON SHARED 1 MB
-------------- --------- ---------- ---------
MIN 56 8 1
MAX 56 8 1
AVG 56 8 1
FRAMES COMMON COMM FIXED SHARED 1 MB
-------------- --------- ---------- --------- ---------
MIN 18,387 14,079 77,276 5
MAX 18,389 14,079 77,276 5
AVG 18,388 14,079 77,276 5
System wide number of common, shared and 1 MB memory
objects
New
Size of Large Frame Area as specified in IEASYSxx
parmlib member
► Statistics about Memory Objects and Frames moved from FRAMES AND SLOT COUNTS section tonew MEMORY OBJECTS AND FRAMES section
Central storage used by common, shared and 1 MB memory objects
• All usage statistics for Memory Objects and Frames are moved from FRAME AND SLOT COUNTS section to new MEMORY OBJECTS AND FRAMES section:
• MEMORY OBJECTS:
• Number of high virtual COMMON memory objects,
• Number of high virtual SHARED memory objects and
• Number of LARGE memory objects (memory object backed by 1 Megabyte Page Frames )
• FRAMES:
• Number of high virtual COMMON memory 4K frames that are backed in central storage,
• Number of high virtual COMMON memory 4K frames that are FIXED in central storage,
• Number of high virtual SHARED memory 4K frames that are backed in central storage
• Number of 1 MB frames that are backed in central storage
• The size of the large frame area (as defined by LFAREA parm in IEASYSxx parmlib member) is displayed in the section header.

13
13
Rationale:
►RMF Postprocessor reports are limited to a page width of 132 characters
►No state-of-the-art display capability of Postprocessor reports
►No easy access to RMF Postprocessor data for application programs
�cumbersome to parse the text output
�each report has its own layout
RMF Postprocessor reports can now be generated in XML Format
< xml / >
XML
Postprocessor XML Formatted Reports
In the past, users of the RMF Postprocessor had to struggle with a couple of shortcomings:
• The standard text output was limited to to a width of 132 characters. Therefore some reports appeared somehow squeezed. This applies in particular to Overview Reports with a high number of OVW conditions
• The basic text format didn‘t exploit todays presentation capabilties like resizing windows, scrolling back and forth etc.
• Depending on the report type, the report layouts were quite different. Hence, API programs need to supply specific logic in
order to extract metrics out of the reports
Starting with z/OS V1R11 RMF, the Postprocessor is able to generate a subset of the reports alternatively in XML format

14
14
z/OS 1.12
z/OS 1.12
Postprocessor XML Formatted Reports
z/OS 1.13
• The following single-system reports are available in XML format
(both Interval and Duration reports)CPU Activity report (including Partition Data, LPAR Cluster and Group Capacity reports)
CRYPTO Activity report
FICON Director Activity reportOMVS Kernel Activity report
ESS Disk Systems Activity report
DEVICE Activity report
PAGING Activity report
Serialization Delay report (SDELAY)
• With z/OS 1.12, the first sysplex report is available in XML format
Workload Activity report (WLMGL)
• Overview reports are also available in XML format
• Summary and Exception reports are not available in XML format
• Interval reports based on data collected during a Monitor II background session
are not available in XML format
• It is RMF‘s objective to introduce the XML format for the majority of Postprocessor reports over the next releases.
• With the first stage in RMF for z/OS 1.11, those reports have been selected where no similar Monitor III reportis available – since Monitor III reports are already XML enabled by means of the Data Portal. These are the following Postprocessor single-system reports:
• CPU Activity report
• CRYPTO Activity report
• FICON Director Activity report
• OMVS Kernel Activity report,
• ESS Disk Systems Activity report
• In addition, Postprocessor Overview reports belong also to the first stage since multiple Overview conditions have caused nastyline-feeds in the old text format
• RMF for z/OS 1.12 extends the list of Postprocessor XML reports with another single-system report and the frist sysplex report:
• Device Activity report (single-system report)
• Workload Activity report (sysplex report)
• With RMF for z/OS 1.13 the next two Postprocessor single-system reports are XML enabled:
• Paging Activity report
• Serialization Delay report (SDELAY)
• The SDELAY report is the first report that is only available in XML format

15
15
There is no dynamic allocation of this ddname, you have to define it explicitly if you want to get all overview reports
in XML format into one data set or output class.
If you define this ddname, no PPORPnnn files are created.
One ddname for one data set to contain all
overview reports for
each system included in
the input data.
Combined Overview report in
XML format
XPOVWRPT
There is no dynamic allocation of this ddname, you have
to define it explicitly if you want to get all reports in XML
format into one data set or output class.
If you define this ddname, no MFRnnnnn files are created.
If you define this ddname and PPRPTS, no XML output in
file XPRPTS is created.
One ddname for one
data set to contain all
single system reports for
each interval during the
session.
Combined
single-systemreport in XML
format
XPRPTS
There is no dynamic allocation of this ddname, you have
to define it explicitly if you want to get all reports in XML format into one data set or output class.
If you define this ddname, no MFRnnnnn files are created.
If you define this ddname and PPXSRPTS, no XML output
in file XPXSRPTS is created.
One ddname for one
data set to contain all sysplex reports for each
interval included in the
input data.
Combined
sysplex-widereport in XML
format
XPXSRPTS
NotesAllocationsContentsddname
► The generation of Postprocessor reports in XML format is controlled by the new ddnames XPRPTS, XPXSRPTS and XPOVWRPT
► If the XML output is routed to permanent data sets rather than to SYSOUT, define the data set with RECFM=VB and LRECL between 256 and 8192. Specify an appropriate BLKSIZE.
Postprocessor XML Formatted Reports
z/OS 1.12
• The request for XML output from the RMF Postprocessor is triggered by means of the existence of a DD card for XPRPTS (for single-system reports) and/or XPOVWRPT (for Overview reports) in the JCL for the Postprocessor job.
• If one of these DD statements are defined in the JCL, then XML output will be generated.
• The following rules apply if requests for text and XML are given simultaneously:
• If the user specifies a DD card for cumulative text output, i.e. PPRPTS, as well as XPRPTS, then only text output will be
generated into PPRPTS and no XML is produced.
• If single-system reports are requested on the REPORTS control statement which are not XML enabled yet and the DD card XPRPTS is defined, no output is generated for them.
• Beginning with RMF for z/OS 1.12 the new ddname XPXSRPTS was introduced to support XML formated Postprocessorsysplex report.
• For the XPXSRPTS ddname similar rules apply as for XPRTS, that is:
• If the user specifies the PPXSRPTS ddname for cumulative text output together with XPXSRPTS, no XML output is generated.
• If sysplex reports other than the WLMGL report are specified in the SYSRPTS control statement, no output is generated.
16
16
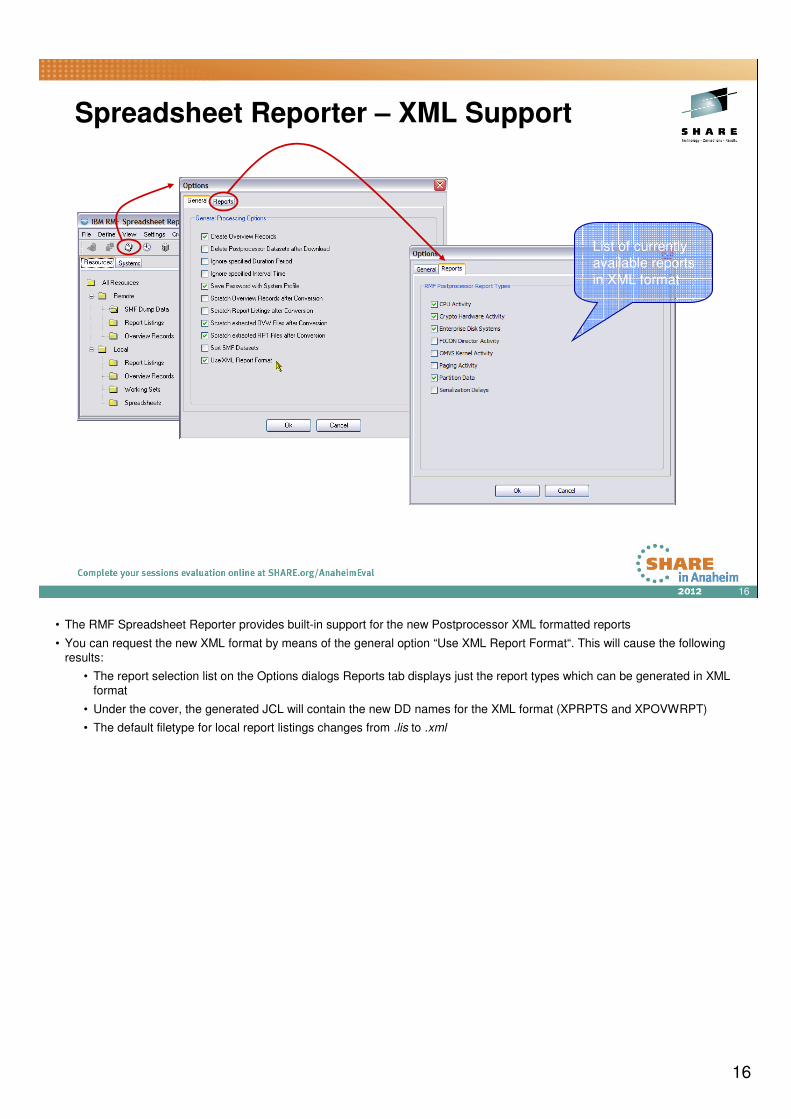
Spreadsheet Reporter – XML Support
List of currently available reports
in XML format
• The RMF Spreadsheet Reporter provides built-in support for the new Postprocessor XML formatted reports
• You can request the new XML format by means of the general option “Use XML Report Format“. This will cause the followingresults:
• The report selection list on the Options dialogs Reports tab displays just the report types which can be generated in XML format
• Under the cover, the generated JCL will contain the new DD names for the XML format (XPRPTS and XPOVWRPT)
• The default filetype for local report listings changes from .lis to .xml

17
17
Spreadsheet Reporter – XML Support
• The new XML formatted reports can be instantly displayed within the Spreadheet Reporter environment
• Once a listing is associated with the filtype xml the View action opens a browser window with the formatted report
• Report headers are displayed as name/value pairs while the report body is arranged in tabular format
• Internally the XML is visualized by means of the following stylesheets which are located in the Spreadsheet Reporters Listing
directory:
• ddsml-pp.xsl
• ddsml.css

18
18
1. Download member ERBXMLTK as binary file erbxmltk.msi
2. Install MSI Package
XML Support – Postprocessor XML Toolkit
►New Postprocessor XML Toolkit shipped with RMF for z/OS 1.13
► Simplifies display of RMF Postprocessor XML reports in a web browser
SYS1.SERBPWSV
Default Installation
Directory
Sample PP XML report
� XSL stylesheet files� Java script file
� Bitmap files
Toolkit Installation:
• RMF for z/OS 1.13 includes the new Postprocessor XML Toolkit which assists you in browsingPostprocessor XML reports with your internet browser. The reports are formatted by use of RMF XSL stylesheets.
• Toolkit installation:
• The Postprocessor XML Toolkit is part of the RMF product. The application files and installation utility of the Postprocessor XML Toolkit are provided in member ERBXMLTK of the host distribution library SERBPWSV. Download this member as binary file erbxmltk.msi.
• Install the MSI package using the Windows Installer, either by double-clicking on the MSI package file or by
issuing the command:msiexec /package erbxmltk.msi [/qn]
The Windows Installer guides you through the installation.
• Specify the directory where to install the Postprocessor XML Toolkit. The default, for example for Windows XP, is:C:\Documents and Settings\_userid_\Application Data\RMF\RMF Postprocessor XML Toolkit
• The Postprocessor XML Toolkit is installed into program group IBM RMF Performance Management.
• The installation process extracts all files necessary to format and display the XML reports (e.g. XSL stylesheet, JAVA script and Bitmap files) to the toolkit directory.
• Furthermore, in the toolkit directory, you find hints and tips on how to exploit the produced reports in XML output format.

19
19
1. Download Postprocessor XML report into Toolkit directory
2. Open XML report with web browser
XML Support – Postprocessor XML Toolkit …
BPMU.SDELAY.LISTING
Download in ASCII format
Toolkit Usage:
• Toolkit usage:
• To view an XML Postprocessor report:
1. Run RMF Postprocessor JOB and direct the XML output (DDNAMES: XPRPTS, XPOVWRPT or XPXSRPTS) to a data set.
2. Download the XML output data set into the Postprocessor XML Toolkit directory on your workstation with file
extension .xml.Ensure to download the data set containing the XML output of the Postprocessor reports in ASCII format to the
Postprocessor XML Toolkit directory.
3. Open the XML Postprocessor reports within the Postprocessor XML Toolkit with your internet browser
• XML formatting details:
• The stylesheet files that are required to format the report are available in a subdirectory of the Postprocessor XML Toolkit
• The created Postprocessor reports in XML output format contain a link to the stylesheet in this subdirectory
• When you open the XML Postprocessor reports within the Postprocessor XML Toolkit with your internet browser, the RMF stylesheet transforms the report into an HTML document.
• Check the example subdirectory of the Postprocessor XML Toolkit. There you find more information on how to exploitRMF Postprocessor XML reports. You also find an example for an RMF Postprocessor realtime reporting setup withsysplex wide scope.

20
20
HTTP API to access Historical data
► Application programs can use Distributed Data Server (DDS)HTTP API to retrieve RMF Postprocessor XML reports
► All RMF Postprocessor XML formatted reports supported ►Web browser can be used as Postprocessor Data Portal
• In most installations, the access to historical data is needed for in depth performance analysis. This allows to keep track whether a critical situation has been persistent or not.
• The existing HTTP API of the RMF Distributed Data Server (DDS) already provides a sysplex-wide access of the data collected by RMF Monitor III. With RMF for z/OS 1.12 this API is extended by the capability to grant instant and easy access to RMF long-term historical data as reported by the RMF Postprocessor.
• Application programs can exploit the extended DDS HTTP API by sending standard URL requests for historical RMF Postprocessor data to the DDS.
• Since DDS returns the requested data as XML document, a web browser can act as an RMF Postprocessor Data Portal to access historical RMF data which is generated by the RMF Postprocessor in XML format.

21
21
Submit PP JOB
HTTP API to access Historical data …
HTTP Request
XML ResponsePP JOB Output
< xml / >
XML
RMF
SMF
Buffer
RMF
SMF
Buffer
RMF
SMF
Buffer
SYS2
SYS3SYS1
SMF Records
Client
Application
RMF Distributed Data Server
//STEP1 EXEC PGM=GPMDDSRV
...
//GPMPPJCL DD DSN=SYS1.SERBPWSV(GPMPPJCL)
...
GPMDDSPP
RMF Postprocessor JOB
//RMFPP EXEC PGM=ERBRMFPP
//MFPMSGDS DD SYSOUT=*
//XPRPTS DD SYSOUT=*
//XPXSRPTS DD SYSOUT=*
//XPOVWRPT DD SYSOUT=*
//SYSOUT DD SYSOUT=*
//SYSIN DD *
DATE(07022010,07022010)
REPORTS(CPU)
SYSOUT(H)
//GPMDDSPP JOB MSGCLASS=H,CLASS=A,
// MSGLEVEL=(1,1)
/*JOBPARM SYSAFF=*
//RMFPP EXEC PGM=ERBRMFPP
//MFPMSGDS DD SYSOUT=*
//XPRPTS DD SYSOUT=*
//XPXSRPTS DD SYSOUT=*
//XPOVWRPT DD SYSOUT=*
//SYSOUT DD SYSOUT=*
//SYSIN DD *
JCL Template: SYS1.SERBPWSV(GPMPPJCL)
• To get access to RMF Postprocessor data provided by the DDS, the GPMSERVE started task is extended with an additional DD card://GPMPPJCL DD DISP=SHR,DSN=SYS1.SERBPWSV(GPMPPJCL)
• This DD statement points to a JCL template which contains all JCL statements necessary to start a Postprocessor job from the RMF Distributed Data Server. The JCL template is stored in SYS1.SERBPWSV(GPMPPJCL).
• You must adapt or replace the GPMPPJCL member to suit your installation, ensuring that the DDS is able to run RMF Postprocessor jobs. If you do not want to request Postprocessor data with the DDS, you can omit the GPMPPJCL ddname.
• The dataset or the member specified in the GPMPPJCL DD card can be replaced with private ones containing the JCL template for running RMF Postprocessor from the DDS.
• The JCL template that is used by DDS to start the Postprocessor JOB does not contain any Postprocessor control statements. These will be dynamically created by DDS depending on the HTTP request parameters.
• For a detailed description of the DDS HTTP API please refer to the z/OS RMF Programmer's Guide.
• Notes:
• The Postprocessor API functionality is only available with JES2 installed.
• The DD card specifications for the XML output datasets must not be changed. To be able to retrieve the Postprocessor output, DDS needs these SYSOUT data sets to reside on spool.

22
22
AS2AS1
Reporting of system serialization delays
AS2
Resource
Resource
System A System B
AS3
Resource
Serialization techniques:
► SETLOCK service for system locks: � Serializes system resources within an address space (local lock) or
a single MVS system (global lock)
► GRS services:
• ENQ service� Serializes resources with scope JOB STEP, SYSTEM or SYSTEMS (multi system)
• Latch service � High speed serialization service
� Serializes resources within a single address space or across several address spaces in a single MVS system
GRS
x
2
1
Latch Sets
waitsholds
waits
holds
waits
holds
And what aboutserialization
delays ?
• There are various techniques to serialize access to resources. These techniques serialize the resources between work unitsrunning in the same address space, in different address spaces on the same system and in address spaces on multiple systems. Here is a quick overview of serialization techniques:
• SETLOCK service for system locks
• Two categories:
• Global locks -- protect serially reusable resources related to more than one address space (CPU and CMS locks)
• Local locks -- protect the resources assigned to a particular address space. When the local lock is held for an address space, the owner of the lock has the right to manipulate the queues and control blocks associated with thataddress space. (CML and LOCAL locks)
• Lock types:
• CPU (processor lock) -- serializes on the processor level, providing system-recognized disablement.
• CMS (general cross memory services lock) -- serializes on more than one address space where this serialization is not provided by one or more of the other global locks.
• CML (cross memory local lock) -- serializes resources in an address space other than the home address space.
• Local storage lock (LOCAL) -- serializes functions and storage used by the local supervisor within an address space. There is one lock for each address space.
• GRS provides two sets of system serialization services:
• GRS ENQ service allows to serialize an abstract resource within the scope of a JOB STEP, SYSTEM or multi-system complex (GRS Complex). The GRS complex is usually equal to the sysplex but it does not have to be.
• The GRS latch services provide a high speed serialization service for authorized callers. Latch services know nothing of the intended scope. Scoping is completely controlled by the user. It uses user provided storage to manage a lock/latch table that is indexed by a user defined lock/latch number. GRS latch is also widely used. Very big users are USS, Logger, RRS, MVS, etc… Compared to GRS ENQ,the GRS latch services have a significant shorter instruction path so that it’s a fast technique to serialize resources within a single address space or across several address spaces in a single MVS system with a minimal overhead.
• With the increased number of systems and workload, resource contention can become more and more a factor that impacts the overalll performance. However, it may be difficult to detect and debug performance problems due to resource contention sincesystem dumps or traditional performance reports may not be adequate tools to identify the address space that is causing a contention.

23
23
Reporting of system serialization delays …
New Serialization Delay Report helps the customer to analyze performance problems due to resource contention situations
• RMF for z/OS 1.13 collects and displays system-wide contentioninformation and contention information on address space level
• Reported in new RMF Postprocessor (PP) Serialization Delay Report
• Data about following lock types collected and reported:
o System Suspend lock types:o CMS
o CMSEQDQ
o CMSLatch
o CMSSMF
o LOCAL
o CML Lock Owner and
o CML Lock Requestor
o GRS lock types:o GRS Latch locks
o GRS Enqueue Step
o GRS Enqueue System and
o GRS Enqueue Systems locks
• Beginning with z/OS 1.13, RMF collects the following serialization delay data:
• System suspend lock contention information
• GRS enqueue and latch performance statistics
• The data is reported in the new RMF PP Serialization Delay report (SDELAY) as a system-wide summary and on addressspace level.

24
24
Reporting of system serialization delays …
• Contention data collected by RMF Monitor III and stored in
new SMF 72 subtype 5 record• Data gathering controlled by setting in SMF Parmlib member SMFPRMxx
Use TYPE/NOTYPE in Parmlib member to enable/disable data collection
• New RMF Postprocessor (PP) Serialization Delay Report:
• New suboption SDELAY | NOSDELAY for Postprocessor REPORTS option
• Only available in XML format
• XML report can be created and displayed• via RMF Spreadsheet Reporter
• via RMF Data Portal for z/OS
• via RMF PP Job & Postprocessor XML Toolkit
SMF Records
from SMF Buffer
SMF Records
from any source
• The serialization delay data is collected by RMF Monitor III and stored in the new SMF 72 subtype 5.
• There is no RMF data gathering option. Data gathering is controlled by the SMF 72-5 setting in the active SMF parmlib memberERBSMFxx. Use TYPE/NOTYPE in the SMFPRMxx parmlib member to enable/disable the data gathering.
• Specify suboption SDELAY in the RMF Postprocessor REPORTS control statement to create the new PostprocessorSerialization Delay report.
• The Serialization Delay report is the first Postprocessor report that is only available in XML format.
• XML report can be created and displayed
• via RMF Data Portal (SMF data from SMF buffer only)
• via Spreadsheet Reporter (any SMF source)
• There is another option to display the SDELAY report in a web browser:
• Download the XML output created by the RMF Postprocssor JOB to the toolkit directory provided with the RMF Postprocessor XML Toolkit
• Open the report in the toolkit directory with your web browser.
25
25
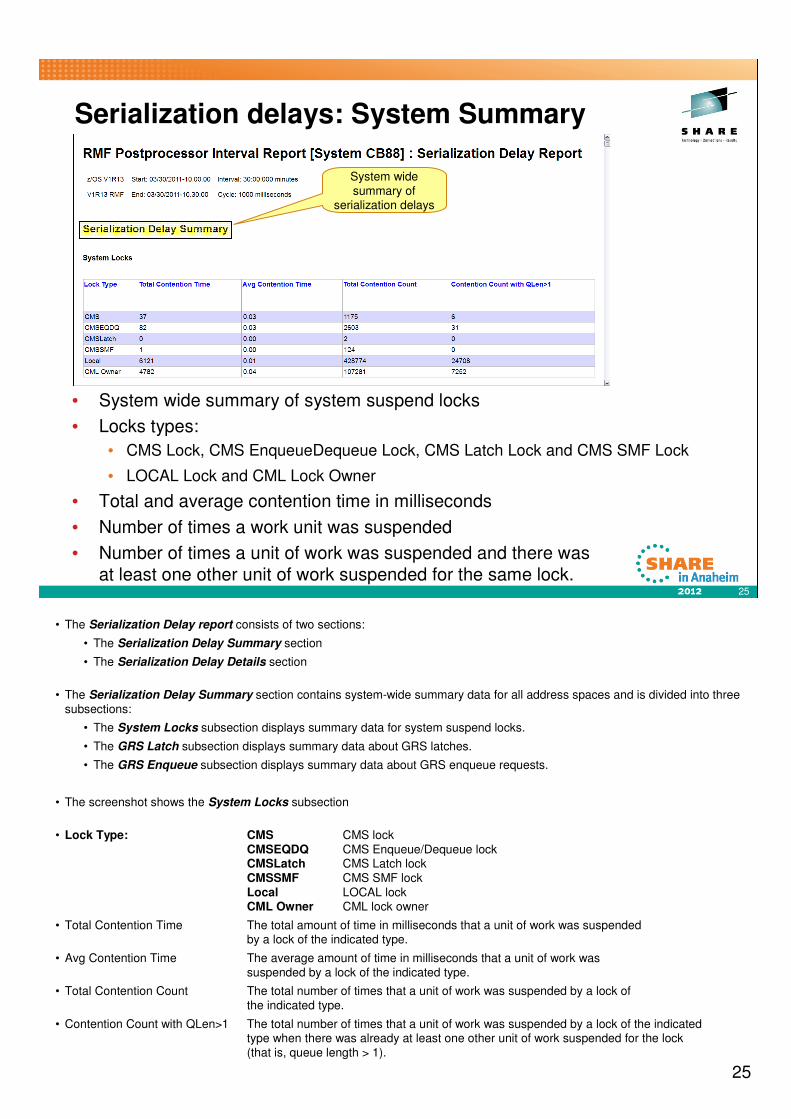
Serialization delays: System Summary
• System wide summary of system suspend locks
• Locks types:
• CMS Lock, CMS EnqueueDequeue Lock, CMS Latch Lock and CMS SMF Lock
• LOCAL Lock and CML Lock Owner
• Total and average contention time in milliseconds
• Number of times a work unit was suspended
• Number of times a unit of work was suspended and there was
at least one other unit of work suspended for the same lock.
System wide summary of
serialization delays
• The Serialization Delay report consists of two sections:
• The Serialization Delay Summary section
• The Serialization Delay Details section
• The Serialization Delay Summary section contains system-wide summary data for all address spaces and is divided into three
subsections:
• The System Locks subsection displays summary data for system suspend locks.
• The GRS Latch subsection displays summary data about GRS latches.
• The GRS Enqueue subsection displays summary data about GRS enqueue requests.
• The screenshot shows the System Locks subsection
• Lock Type: CMS CMS lock
CMSEQDQ CMS Enqueue/Dequeue lockCMSLatch CMS Latch lockCMSSMF CMS SMF lockLocal LOCAL lockCML Owner CML lock owner
• Total Contention Time The total amount of time in milliseconds that a unit of work was suspendedby a lock of the indicated type.
• Avg Contention Time The average amount of time in milliseconds that a unit of work wassuspended by a lock of the indicated type.
• Total Contention Count The total number of times that a unit of work was suspended by a lock ofthe indicated type.
• Contention Count with QLen>1 The total number of times that a unit of work was suspended by a lock of the indicatedtype when there was already at least one other unit of work suspended for the lock (that is, queue length > 1).

26
26
Serialization delays: System Summary …
• Sort capability. Just click on a column header of your choice and the report is
sorted according to the values of the selected column
• The color of this column turns to yellow to indicate the currently active sort
criteria
• By default, the sort order is descending. A second click on the column header
switches to ascending sort order
To sort a column, simply click on the
column header.
• The XSL stylesheet and JAVA script files provided within the RMF Spreadsheet reporter or RMF Postprocessor XML Toolkit allows to format and display the Serialization Delay report with a web browser.
• Each column of the report can be used as sort criteria to sort the report section:
• Just click on a column header of your choice and the report is sorted according to the values of the selected column
• The color of this column turns to yellow to indicate the currently active sort criteria
• By default, the sort order is descending. A second click on the column header switches to ascending sort order
27
27
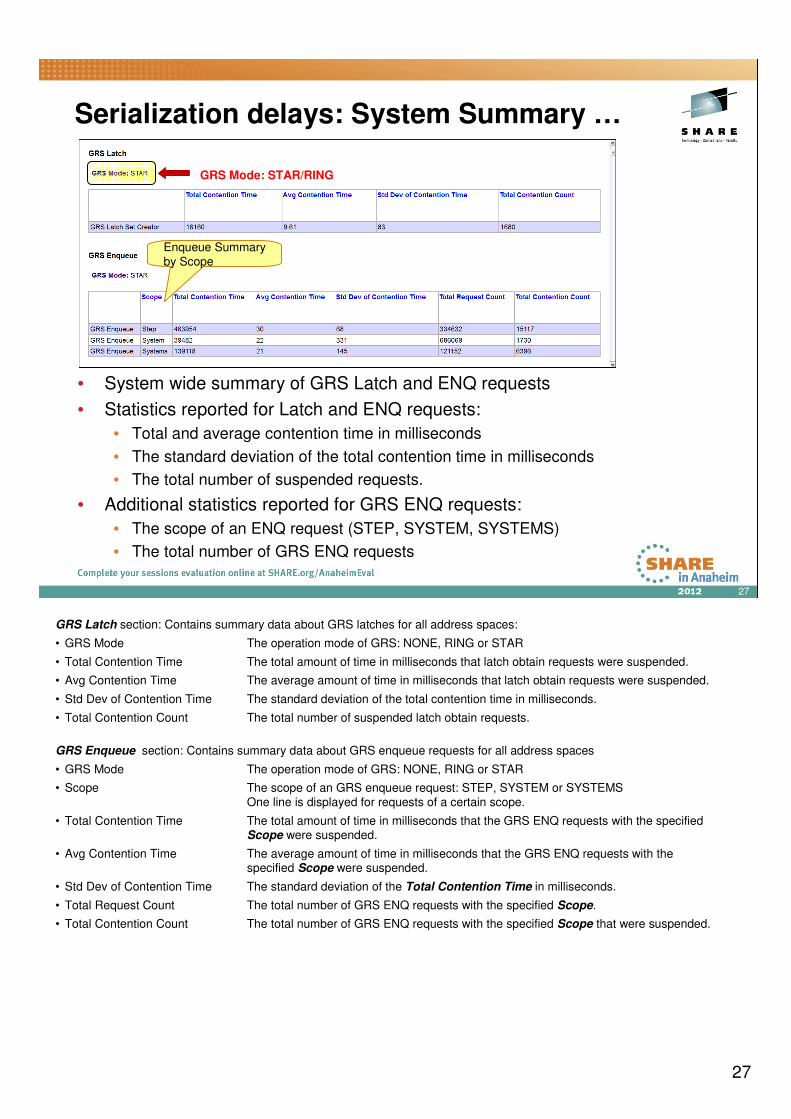
Serialization delays: System Summary …
GRS Mode: STAR/RING
• System wide summary of GRS Latch and ENQ requests
• Statistics reported for Latch and ENQ requests:
• Total and average contention time in milliseconds
• The standard deviation of the total contention time in milliseconds
• The total number of suspended requests.
• Additional statistics reported for GRS ENQ requests:
• The scope of an ENQ request (STEP, SYSTEM, SYSTEMS)
• The total number of GRS ENQ requests
Enqueue Summaryby Scope
GRS Latch section: Contains summary data about GRS latches for all address spaces:
• GRS Mode The operation mode of GRS: NONE, RING or STAR
• Total Contention Time The total amount of time in milliseconds that latch obtain requests were suspended.
• Avg Contention Time The average amount of time in milliseconds that latch obtain requests were suspended.
• Std Dev of Contention Time The standard deviation of the total contention time in milliseconds.
• Total Contention Count The total number of suspended latch obtain requests.
GRS Enqueue section: Contains summary data about GRS enqueue requests for all address spaces
• GRS Mode The operation mode of GRS: NONE, RING or STAR
• Scope The scope of an GRS enqueue request: STEP, SYSTEM or SYSTEMSOne line is displayed for requests of a certain scope.
• Total Contention Time The total amount of time in milliseconds that the GRS ENQ requests with the specifiedScope were suspended.
• Avg Contention Time The average amount of time in milliseconds that the GRS ENQ requests with thespecified Scope were suspended.
• Std Dev of Contention Time The standard deviation of the Total Contention Time in milliseconds.
• Total Request Count The total number of GRS ENQ requests with the specified Scope.
• Total Contention Count The total number of GRS ENQ requests with the specified Scope that were suspended.

28
28
Serialization delays: CMS Lock Details
• Serialization details on address space level for CMS lock types:• CMS Lock
• CMS EnqueueDequeue Lock
• CMS Latch Lock
• CMS SMF Lock
• Contention data for work unit(s) running in the reported address space:
• Total and average contention time in milliseconds
• Number of times a work unit was suspended
• Number of times a unit of work was suspended and there was at least one other unit of work suspended for the same lock.
Details of serialization delays for up to 20
address spaces
• The Serialization Delay Details section provides the following information in four subsections:
• The CMS Lock Details subsection contains detail data about CMS/CMSEQDQ/CMSLatch/CMSSMF locks per addressspace.
• The CML and LOCAL Lock Details subsection contains detail data about CML and LOCAL locks per address space.
• The GRS Latch Details subsection contains detail data about GRS latches.
• The GRS Enqueue Details subsection contains detail data about GRS enqueue requests.
Note: For each lock type, a maximum of the top twenty address spaces with the longest contention times are reported.
CMS Lock Details section: Detail data about CMS/CMSEQDQ/CMSLatch/CMSSMF locks per address space
• Address Space ID The hexadecimal address space identifier (ASID) of the job for which lock data was collected.
• Jobname The name of the job.
• Service Class Name The name of the service class that the job has been running in.
• Service Class Period The service class period that the job has been running in.
• Total Contention Time The total amount of time in milliseconds that a unit of work of the indicated addressspace was suspended on the respective lock type.
• Avg Contention Time The average amount of time in milliseconds that a unit of work of the indicated addressspace was suspended on the respective lock type.
• Total Contention Count The number of times that a unit of work of the indicated address space was suspendedon the respective lock type.
• Contention Count with QLen>1 The number of times that a unit of work of the indicated address space was suspended
on the respective lock type when there was already at least one other unit of worksuspended for the lock.

29
29
• Serialization details on address space level for local locks
• Contention data for LOCAL lock requests and two views of CML lock requests:
Job Name AS2Job Name Job Name AS2
Local lock requested by workunit running in same AS
Local lock requested by work unitrunning in another AS
Local Lock CML Lock Owner CML Lock Requestor
Local lock from anotherAS requested
CML lock
request CML lock
request
LOCAL lock
request
Serialization delays: CML and Local Lock Details
CML and LOCAL Lock Details section: Delays on address space level for local locks
CML Lock Owner :
• Total Contention Time The total amount of time in milliseconds that a unit of work from another address space was suspended when requesting the local lock of the indicated address space.
• Avg Contention Time The average amount of time in milliseconds that a unit of work from another address spacewas suspended when requesting the local lock of the indicated address space.
• Total Contention Count The number of times that a unit of work from another address space was suspended when
requesting the local lock of the indicated address space.
• Contention Count with QLen>1 The number of times that a unit of work from another address space was suspended whenrequesting the local lock of the indicated address space and there was already at least one other unit of work waiting for this lock.
Local Lock:
• Total Contention Time The total amount of time in milliseconds that a unit of work of the indicated address space
was suspended on a local lock.
• Avg Contention Time The average amount of time in milliseconds that a unit of work of the indicated addressspace was suspended on a local lock.
• Total Contention Count The number of times that a unit of work of the indicated address space was suspended on a local lock.
• Contention Count with QLen>1 The number of times that a unit of work of the indicated address space was suspended on a local lock when there was already at least one other unit of work suspended.
CML Lock Requestor:
• Total Contention Time The total amount of time in milliseconds that a unit of work of the indicated address spacewas suspended when requesting the local lock of another address space.
• Avg Contention Time The average amount of time in milliseconds that a unit of work of the indicated address space was suspended when requesting the local lock of another address space.
• Total Contention Count The number of times that a unit of work from this address space was suspended when requestingthe local lock of another address space.
• Contention Count with QLen>1 The number of times that a unit of work from this address space was suspended when requestingthe local lock of another address space and there was already at least one other unit of work
waiting for that lock.

30
30
Serialization delays: GRS Latch Details
• Serialization details on address space level for GRS Latch obtain requests
• Two views of GRS Latch obtain requests:
• Latch Set Creator statistics:Latch obtain requests against latch sets created by this address space
• Latch Requestor statistics:Latch obtain requests issued from this address space
• Reported statistics:• Total and average contention time in milliseconds• Standard deviation of the total contention time.• Number of times a latch obtain request was suspended
x
2
1
Latch Sets
GRS Latch Details section: Detail data about GRS latches on address space level
Latch Set Creator: Statistics for latch obtain requests against latch sets created by this address space
Latch Set Requestor: Statistics for latch obtain requests issued from this address space:
• Total Contention Time The amount of contention time in milliseconds that was caused by latch obtain requests.
• Avg Contention Time The average amount of contention time in milliseconds that was caused by latch obtainrequests.
• Std Dev of Contention Time The standard deviation of the total contention time.
• Total Contention Count The number of times a latch obtain request was suspended.

31
31
Serialization delays: GRS Enqueue Details
• Serialization details on address space level for GRS ENQ requests
• Grouped by GRS ENQ request scope: Step, System and Systems
• Total and average contention time in milliseconds
• Standard deviation of the total contention time.
• Total number of GRS ENQ requests
• Number of times a GRS ENQ request was suspended
GRS
GRS Enqueue Details section: Detail data about GRS enqueue requestson on address space level
Grouped by enqueue scopes: STEP, SYSTEM and SYSTEMS
• Total Contention Time The total amount of contention time in milliseconds that was caused by GRS ENQ requests of the indicated scope for this address space.
• Avg Contention Time The average amount of contention time in milliseconds that was caused by GRS ENQ
requests of the indicated scope for this address space.
• Std Dev of Contention Time The standard deviation of the total contention time in milliseconds for GRS ENQ requestsof the indicated scope for this address space.
• Request Count The total number of GRS ENQ requests of the indicated scope for this address space.
• Contention Count The total number of GRS ENQ requests of the indicated scope that were suspendedfor this address space.

32
32
Work Unit Queue Distribution
• Problem• RMF reporting for CPU contention was based on address spaces level
• Did not consider multiple work units (WEBs) within one address space
• Performance analysts need statistics about the CPU contention on WEB
granularity
• Solution• The RMF CPU Activity reporting is enhanced
• Benefit• The enhanced CPU Activity reporting helps the customer to obtain information
about the In-Ready distribution based on WEBs and the number of work units per CPU type
• In the past, RMF has reported the number of address spaces waiting for or using a CPU (see In-ready statistics within the System Address Space Analysis of the Postprocessor CPU Activity report). However, with more than one task per address space, this does not really reflect the demand for CPU. Performance analysts need to know how many work units (WEBs) are running or waiting for a CPU.
• For this reason the CPU Activity report has been extended and new Overview Conditions have been implemented.

33
33
Work Unit Queue Distribution: Monitor I CPU Report
SYSTEM ADDRESS SPACE AND WORK UNIT ANALYSIS
---------NUMBER OF ADDRESS SPACES--------- -----------------------DISTRIBUTION OF IN-READY WORK UNIT QUEUE-------------
QUEUE TYPES MIN MAX AVG NUMBER OF 0 10 20 30 40 50 60 70 80 90 100
WORK UNITS (%) |....|....|....|....|....|....|....|....|....|....|
IN 550 1,008 594.8
IN READY 4 438 22.7 <= N 55.5 >>>>>>>>>>>>>>>>>>>>>>>>>>>>
OUT READY 0 1 0.0 = N + 1 4.4 >>>
OUT WAIT 0 0 0.0 = N + 2 4.0 >>>
LOGICAL OUT RDY 0 628 10.3 = N + 3 3.7 >>
LOGICAL OUT WAIT 178 634 589.4 <= N + 5 7.1 >>>>
<= N + 10 14.7 >>>>>>>>
ADDRESS SPACE TYPES <= N + 15 8.0 >>>>>
<= N + 20 1.9 >
BATCH 281 284 282.0 <= N + 30 0.2 >
STC 708 763 736.4 <= N + 40 0.0
TSO 97 98 97.9 <= N + 60 0.0
ASCH 0 1 0.0 <= N + 80 0.0
OMVS 43 97 68.0 <= N + 100 0.0
<= N + 120 0.0
---------NUMBER OF WORK UNITS------------- <= N + 150 0.0
CPU TYPES MIN MAX AVG > N + 150 0.0
CP 444 888 555.5 N = NUMBER OF PROCESSORS ONLINE UNPARKED (22.4 ON AVG)
AAP 22 33 28.8
IIP 0 0 0.0
16 Buckets representing the work unit count with regard to the number of online processors
Work unit count on CPU type level
The SYSTEM ADDRESS SPACE section of the Monitor I CPU Activity Report has been changed as follows:
• The In-Ready Queue Distribution is now based on the real number of dispatchable work units
• We display 16 buckets of ascending queue lengths with regard to the number of actual online processors when the sample was taken
• This allows to detect latent demand for the processor resource and to distinguish uncritical spikes from severe shortages
• The number of work units within the buckets includes standard CPs as well as specialty engines
• The new NUMBER OF WORK UNITS statistics allow to determine the CPU demand on processor type level
• The MIN, MAX and AVG queue lenghts are shown for CPs, AAPs and IIPs

34
34
Work Unit Queue Distribution: Spreadsheet Reporter
• The new OneWebCont sheet in the System Overview Spreadsheet of the RMF Spreadsheet Reporter allows to analyze cpucontention on work unit granularity.

35
35
IBM z/OS Management Facility
Browser
HTTP(s)
z/OS Management
Facilityapplication
• z/OS Management Facility is a Web 2.0 application on z/OS
• Manages z/OS from z/OS
• Browser communicates with z/OSMF via secure connection, anywhere,
anytime
z/OS
z/OS application, browser access
• IBM z/OS Management Facility (z/OSMF), a new zero priced product, will simplify, optimize and modernize the z/OS system programmer experience starting in V1R11 with problem data management and TCP/IP Policy based configuration. With z/OS V1R12 the Workload Management and the Resource Monitoring Application have been added
• z/OSMF will deliver solutions in a task oriented, Web browser based user interface with integrated user assistance. And z/OSMF will make the day to day operations and administration of the mainframe z/OS systems easier to manage for both new and experienced system programmers. The focus is to help improve system programmer productivity, and make the functions
easier to understand and use• This chart explains the structure for z/OSMF and how it fits into the z/OS environment.
• z/OSMF is on the right hand side and it manages z/OS from z/OS itself. It is not an external application, nor does it have an external client. z/OSMF is an application on z/OS with direct access to z/OS data and information, and it has a browser
interface from the workstation. z/OSMF contains the GUIs and the application code. Everything is installed on the z/OS server and there are no client side install requirements.
• In the middle of the screen is a workstation with a browser and it communicates with z/OSMF via HTTP(s). z/OSMF is a Web 2.0 based solution. It incorporates a browser interface that communicates with the z/OS system. The browser can be anywhere... in the data center ... or around the world. You just need a secure connection.
• And on the left is a screen capture of the z/OSMF welcome page once you log into z/OSMF.

36
36
IBM z/OS Management Facility …Applications / R13 plugins
� Configuration– Configuration Assistant for z/OS Communication Server (R11) – Simplified
configuration and setup of TCP/IP policy-based networking functions
� Links to resources - provides common launch point for non-z/OSMF resources
� Performance– Capacity Provisioning (R13) - simplified monitoring of CP status for domains
– Resource Monitoring (R12) – dynamic real time metrics for system performance– System Status (R12) – single view of sysplex and Linux® performance– Workload Management (R12) – creation, editing, and activation of WLM policies
� Problem Determination– Incident Log (R11) – Simplified capture, packaging, and sending of SVC dump diagnostic
data. (also avail with z/OS R10)
– Software– Deployment (R13) - Clone z/OS images and deploy software more easily and
consistently, using a new z/OSMF software deployment task.
� z/OSMF Administration Authorization services, add users, define roles, add links.
• Once you’ve logged in , this screen shows you the full scope of what z/OSMF provides in this first release. And really the first user that logs in as a z/OSMF administrator. So when z/OSMF is first set up, always the first ID is that of an administrator – that is a requirement for setup. And the reason for this it allows the first person to get in and to add and enable others.
� z/OSMF offers the following system management tasks:
� Configuration category: Simplified configuration and setup of TCP/IP policy-based networking functions
� Links category:
� This is like ‘My favorites’ - Provides common launch point for accessing resources beyond the IBM z/OS Management Facility.
• Some links are pre-defined in the product.
• The administrators can define additional links to share commonly used resources for their installation.
• With z/OSMF R12 you can add ‘links’ and launch points to anywhere in the left hand navbar – and not just the “Links” category. You can customize /OSMF.
• Performance category
• Capacity Provisioning (R13) – simplified monitoring o z/OS Capacity Provisioning status (monitoring only, not management) – as a reminder z/OS Capacity Provisioning is part of the base of z/OS and can automate System z On/Off Capacity on Demand.
• The z/OSMF Resource Monitoring plugin allows cross-sysplex performance monitoring from a single point of control. From the z/OSMF task tree, you can select the following subtasks:
• The System Status task provides an enterprise-wide health check of all z/OS sysplexes.
• For further analysis, the Resource Monitoring task can graphically display RMF Monitor III metrics as well as Linux metrics by means of customizable views.
• Workload Manager Policy Editor -- Facilitate the creation and editing of WLM service definitions, installation of WLM service definitions, and activation of WLM service policies
• Under the Problem Determination category on the navigation bar, you will find the Incident Log task.
� This will help all system programmers with problem data management tasks, providing experienced teams with procedural advantages through an incident log summary and detail views of z/OS dump incidents. The Incident Log provides a consolidated list of SVC Dump related problems, along with details and diagnostic data captured with each incident. It also facilitates sending the data for further diagnostics.
� Task is updated to include support for adding comments, the ability to attach user-defined data, and use of encrypted parallel FTP for sending data to IBM.
• Software category
• Deployment (R13) - Clone z/OS images and deploy software more easily and consistently, using a new z/OSMF software deployment task.
• z/OSMF Administration category
• Provides Authorization services for the administrator
• Allows Dynamic addition of links to non-z/OSMF resources
37
37
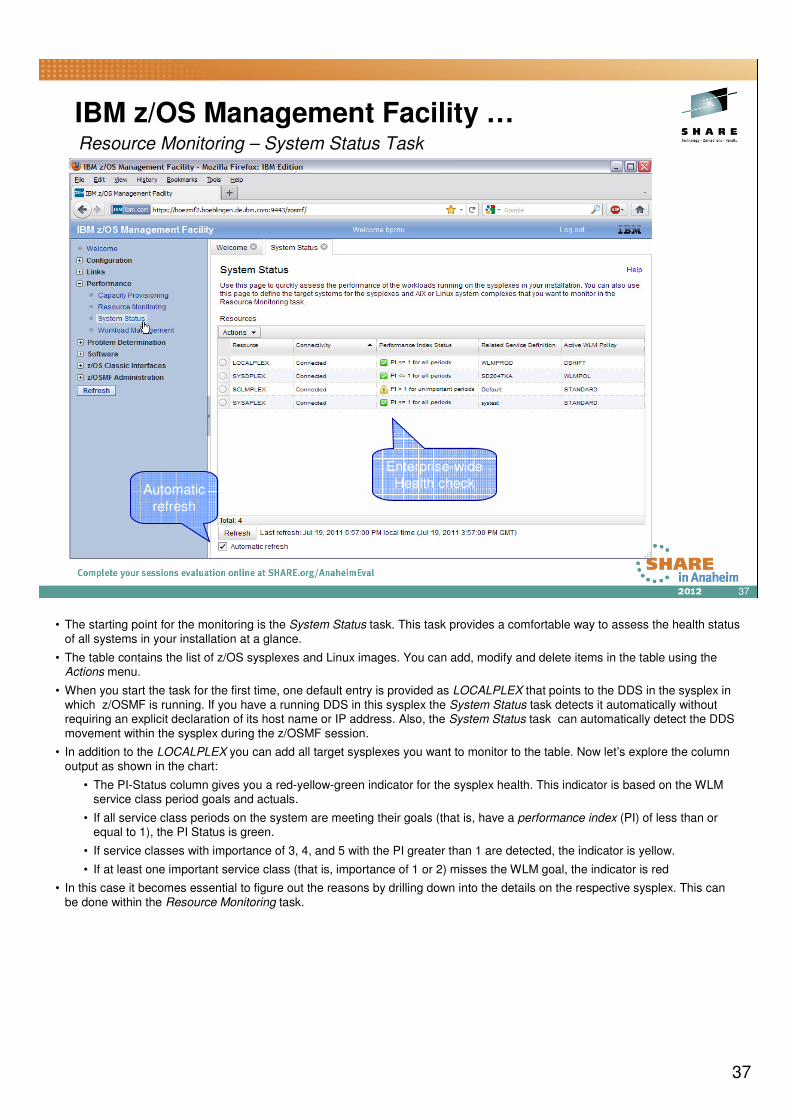
IBM z/OS Management Facility …Resource Monitoring – System Status Task
Enterprise-wide
Health check Automatic
refresh
• The starting point for the monitoring is the System Status task. This task provides a comfortable way to assess the health status of all systems in your installation at a glance.
• The table contains the list of z/OS sysplexes and Linux images. You can add, modify and delete items in the table using the Actions menu.
• When you start the task for the first time, one default entry is provided as LOCALPLEX that points to the DDS in the sysplex in which z/OSMF is running. If you have a running DDS in this sysplex the System Status task detects it automatically without requiring an explicit declaration of its host name or IP address. Also, the System Status task can automatically detect the DDS movement within the sysplex during the z/OSMF session.
• In addition to the LOCALPLEX you can add all target sysplexes you want to monitor to the table. Now let’s explore the column
output as shown in the chart:
• The PI-Status column gives you a red-yellow-green indicator for the sysplex health. This indicator is based on the WLM service class period goals and actuals.
• If all service class periods on the system are meeting their goals (that is, have a performance index (PI) of less than or equal to 1), the PI Status is green.
• If service classes with importance of 3, 4, and 5 with the PI greater than 1 are detected, the indicator is yellow.
• If at least one important service class (that is, importance of 1 or 2) misses the WLM goal, the indicator is red
• In this case it becomes essential to figure out the reasons by drilling down into the details on the respective sysplex. This can be done within the Resource Monitoring task.

38
38
Resource Monitoring – Monitoring Dasboards
Metric Group
Metric
Interval Control
IBM z/OS Management Facility …
• The Resource Monitoring task allows you to monitor the performance of the z/OS sysplexes, AIX system complexes(System p), Linux system complexes (System z and System x) in your environment. The performance data is displayed in so called Monitoring Dashboards.
• A Monitoring Dashboard is a customizable view containing different performance metrics that you can group and arrange flexibly.
• You can create and save your own dashboards or open and modify the predefined dashboards that are with the task in z/OSMF.
• When you start a Monitoring Dashboard it begins retrieving the online data from the DDS periodically.
• By default, the most current snapshot is displayed
• It's possible to browse through the data collected since the start of the current session.
• A dashboard contains multiple metric groups; their size and column count are adjustable. You add one or multiple metrics to each group.
• Now let's create a new Monitoring Dashboard. Suppose, you want to inspect the common storage usage and identify jobs with the highest storage consumption.
• To do this, you can create a new dashboard using the drop down menu on the Dashboards tab. You can now add a metric you want to monitor to the dashboard by using the "Add Metric" dialog.
• The first thing you need to select in this dialog is a resource you're interested in. The resources are presented in a tree structure.
• Starting with the sysplex as top level resource, you can drill down into the contained resources, for example, the MVS images or coupling facilities.
• Once you select a resource (for example, storage on a system), you can select a performance metric that you want to monitor.
• The metrics of the selected resource are also presented in a tree. For a better navigation, you can use the quick-filter feature.
• Resource Monitoring provides sophisticated filtering capabilities:
• Suppose you select the metric % CSA utilization by job, which will list all the jobs active on the system and their CSA consumption in %.
• Because the number of jobs in the system can be pretty high, you can specify filters and work scopes: that is, display only jobs that match a certain name pattern, belong to a specific WLM service class, or meet a threshold value.

39
39
Manage your Workloads and Performance with
z/OSMF
Session 11613
Monday: 4:30 PM
IBM z/OS Management Facility …

40
40
RMF XP – What is it ?
• RMF XP is the solution for
Cross Platform Performance Monitoring
• RMF XP supports the Operating Systems running on
• x Blades
• p Blades
�Available with z/OS V1R13 RMF and z/OS V1R12 RMF (APAR OA36030)
• RMF XP is the new solution to monitor the performance of heterogeneous environments. RMF XP supports the operatingsystems running on the IBM zEnterprise Bladecenter Extension:
• AIX on System p
• Linux on System x
• In addition, Linux on System z is supported as well
41
41
RMF XP – Basic Idea
• The Common Information Model (aka CIM) instrumentation is available for almost all operating systems of this planet
• RMF has the infrastructure already in place to
• combine performance data from multiple systems to a Sysplex wide view
• display performance data by means of state-of-the-art graphical frontends
Isn‘t it a good idea to bring those well-proven things together ?
�We thought it is and we created the RMF XP

42
42
RMF Generic CIM Client
RMF Distributed Data Server
GPM4CIM
RMF Generic CIM Client
RMF Distributed Data Server
z/OS USS
GPM4CIM
RMF Distributed Data Server
RMF Sysplex Data Server
RMF Monitor III
z/OSMFResource Monitoring
RMF Monitor III
RMF Monitor III
GPMSERVE
RMF XP – Component Overview
• What are the components of the new RMF XP function?
• The RMF Distributed Data Server (aka DDS) consists of two main functional entities:
• The comunication layer to the client
• The interface layer to the data collection backend
• For RMF XP, the existing DDS communication layer remains unchanged
• In contrast to the z/OS data collection which exploits the RMF Sysplex Data Server API‘s, RMF XP uses the standard CIM API‘s to collect the performance data from the remote Linux and AIX systems

43
43
*,LNXRMF2,XLINUX_IMAGE
RMF XP – Linux Topology
RMF Generic CIM Client
RMF Distributed Data Server
REPOSD
GATHERDGATHERD
*,LNXRMF4,XLINUX_IMAGE
REPOSD
GATHERD
*,LNXRMF5, XLINUX_IMAGE
REPOSD
GATHERD
z/OSMF
Resource Monitoring
*,LNX1PLEX,XLINUX_SYSTEM_COMPLEX
*,LNXRMF3, XLINUX_IMAGE
*,LNXRMF1,XLINUX_IMAGE
GATHERD
z/OS USS
• The topology for the Linux data collection slightly differs from the AIX topology:
• On each individual enpoint, a performance data collector is needed in terms of a component called GATHERD
• The collector stores his data to a central repository which is managed by the REPOSD component.
• RMF XP can interact with this component by means of a CIM provider interface.
• Result: just one connection to a CIM server is needed to retrieve performance data from multiple Linux images

44
44
RMF XP – AIX Topology
RMF Generic CIM Client
RMF Distributed Data Server
z/OSMF
Resource Monitoring
*,AIX1PLEX,AIX_SYSTEM_COMPLEX
*,P6RMF2,AIX_IMAGE
GATHERD
*,P6RMF3,AIX_IMAGE
GATHERD
*,P6RMF1,AIX_IMAGE
GATHERD
z/OS USS
• In contrast to Linux, the concept of a repository node does not exist for the AIX operating system
• Hence, RMF XP builds up a seperate connection to each individual endpoint

45
45
RMF XP - Invocation
• Started Task: SYS1.PROCLIB(GPM4CIM)
• Runs in USS Environment via BPXBATCH
• Multiple instances can run in parallel: one STC per platform
• S GPM4CIM.GPM4A,OS=A
• S GPM4CIM.GPM4X,OS=X
• S GPM4CIM.GPM4Z,OS=Z
//GPM4CIM PROC OS=X //STEP1 EXEC PGM=BPXBATCH,TIME=NOLIMIT,REGION=0M, // PARM='PGM /usr/lpp/gpm/bin/gpm4cim cfg=/etc/gpm/gpm4&OS..cfg'//STDENV DD PATH='/etc/gpm/gpm4cim.env' //STDOUT DD PATH='/var/gpm/logs/gpm4cim&OS..out', // PATHOPTS=(OWRONLY,OCREAT,OTRUNC), // PATHMODE=(SIRUSR,SIWUSR,SIRGRP) //STDERR DD PATH='/var/gpm/logs/gpm4cim&OS..trc', // PATHOPTS=(OWRONLY,OCREAT,OTRUNC), // PATHMODE=(SIRUSR,SIWUSR,SIRGRP) //SYSPRINT DD SYSOUT=* //SYSOUT DD SYSOUT=* // PEND
• To start RMF XP, use the new proclib member GPM4CIM
• The gpm4cim executable runs in the Unix System Services environment and receives control from the BPXBATCH utility
• One GPM4CIM instance is needed per platform type
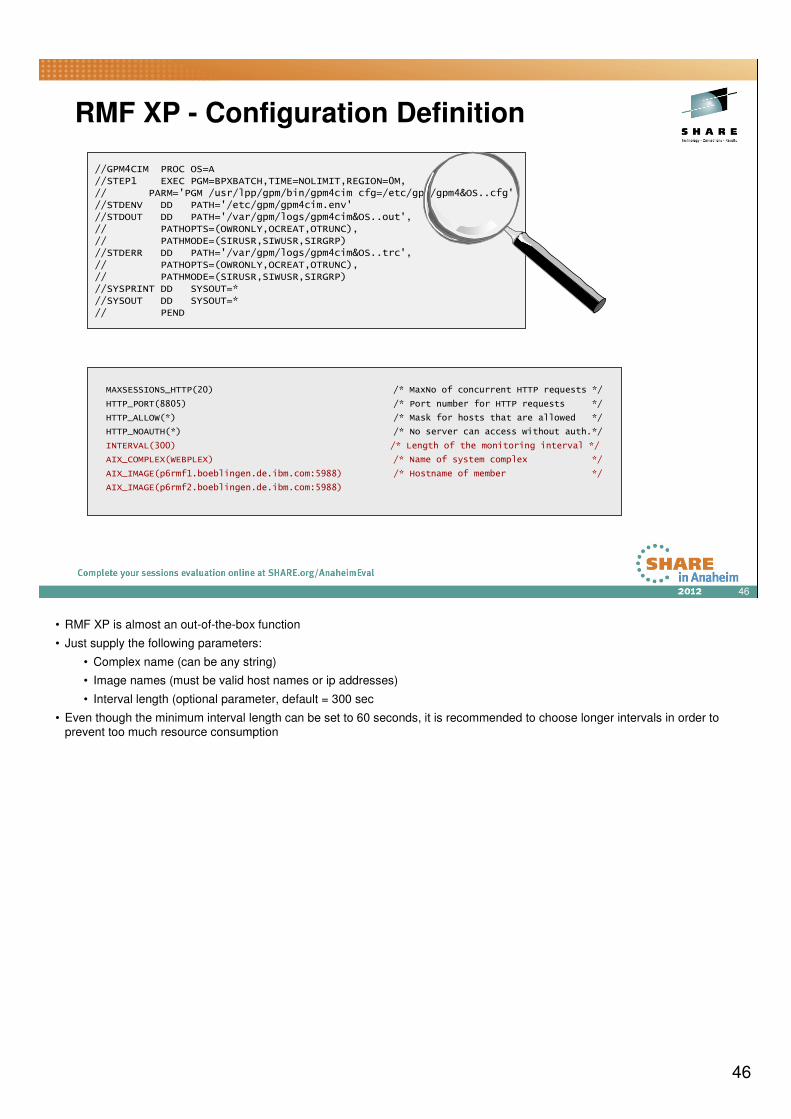
46
46
RMF XP - Configuration Definition
MAXSESSIONS_HTTP(20) /* MaxNo of concurrent HTTP requests */
HTTP_PORT(8805) /* Port number for HTTP requests */
HTTP_ALLOW(*) /* Mask for hosts that are allowed */
HTTP_NOAUTH(*) /* No server can access without auth.*/
INTERVAL(300) /* Length of the monitoring interval */
AIX_COMPLEX(WEBPLEX) /* Name of system complex */
AIX_IMAGE(p6rmf1.boeblingen.de.ibm.com:5988) /* Hostname of member */
AIX_IMAGE(p6rmf2.boeblingen.de.ibm.com:5988)
//GPM4CIM PROC OS=A //STEP1 EXEC PGM=BPXBATCH,TIME=NOLIMIT,REGION=0M, // PARM='PGM /usr/lpp/gpm/bin/gpm4cim cfg=/etc/gpm/gpm4&OS..cfg'//STDENV DD PATH='/etc/gpm/gpm4cim.env' //STDOUT DD PATH='/var/gpm/logs/gpm4cim&OS..out', // PATHOPTS=(OWRONLY,OCREAT,OTRUNC), // PATHMODE=(SIRUSR,SIWUSR,SIRGRP) //STDERR DD PATH='/var/gpm/logs/gpm4cim&OS..trc', // PATHOPTS=(OWRONLY,OCREAT,OTRUNC), // PATHMODE=(SIRUSR,SIWUSR,SIRGRP) //SYSPRINT DD SYSOUT=* //SYSOUT DD SYSOUT=* // PEND
• RMF XP is almost an out-of-the-box function
• Just supply the following parameters:
• Complex name (can be any string)
• Image names (must be valid host names or ip addresses)
• Interval length (optional parameter, default = 300 sec
• Even though the minimum interval length can be set to 60 seconds, it is recommended to choose longer intervals in order to prevent too much resource consumption

47
47
RMF XP – Interval Synchronization
GPM4CIM
*,AIX1PLEX,AIX_SYSTEM_COMPLEX
*,P6RMF1,AIX_IMAGE
ControlSampleTtimes()
z/OS USS
*,P6RMF2,AIX_IMAGE
ControlSampleTtimes()
*,P6RMF3,AIX_IMAGE
ControlSampleTtimes()
• For the AIX operating system the remote CIM API allows to
• Start the data collection at a certain point in time
• Set a common collection interval for all monitored endpoints
• RMF XP synchronizes the interval
• On a one minute boundary if the interval is < 5 minutes
• On a five minute boundary if the interval is > 5 minutes
• For the Linux operating system it is the responsibility of the system administratior to
• Start the data collection on the monitored enpoints synchronously
• Set the data collection interval on all endpoints accordingly to the RMF XP interrval length

48
48
RMF XP – Platform specific Resource Models
• If we could follow the pure nature of CIM, resources and metrics are common in a computing environment, regardless of theoperating system.
• However, the reality looks a bit different. We have to deal with lots of platform specific extensions of the resource model.
• That‘s why we decided to supply one GPM4CIM instance per operating system type.

49
49
*,P6RMF1,AIX_IMAGE *,P6RMF2,AIX_IMAGE
RMF XP – Security
GPM4CIM
z/OSMFResource Monitoring
*,WEBPLEX,AIX_SYSTEM_COMPLEX
z/OS USS
RACF
Authenticationvia Passticket
Server to Server
Communication with Encryption
• Encryption for the communication between GPM4CIM and the endpoints can be configured via AT-TLS on the z/OS outboundside
• For the communication between the client and GPM4CIM authentication can be configured via userid and password orpasstickets

50
50
RMF XP - zIIP Exploitation
Up to 70%
CPU utilization
can beoffloaded to
zIIPs !
• Talking to lots of images and collect lots of performance metrics is not for free. It can become costly!
• However, RMF XP can exploit zIIP specialty engines for the CIM based data collection
• In our test environment, we have observed that approximately 70% of the CPU consumption can be offloaded to zIIP engines

51
51
RMF XP – Resource Tree

52
52
RMF XP – Metrics

53
53
RMF XP – Metric Values

54
54
System Scope
System Complex Scope
RMF XP – Metric Scope

55
55
RMF XP – z/OSMF Integration
Health Check:
� Processor� Memory� Filesystem
• The new RMF XP capabilities are completely applicable in the z/OSMF Resource Monitoring plugin
• Hence, you are able to monitor seamlessly all the systems within your enterprise, independent of the operating systemtype
• In a short time frame you can take advantage of the various capabilities of z/OSMF Resource Monitoring:
• One workstation as single point of control
• Dashboards with state-of-the-art graphical views
• Maximum flexibility with user defined dashboards
• Powerful data reduction and filtering

56
56
• Seamless performance monitoring solution for z/OS and distributed platforms
• z/OS as management platform for distributed environments
• Easy to setup, almost no customization needed
• Two graphical frontends
• Instant access via web browser
• z/OSMF with advanced capabilities
• Available with z/OS V1R13 RMF and z/OS V1R12 RMF (APAR OA36030)
RMF XP - Summary
• Alltogether, RMF XP provides a seamless, cross-plattform performance monitoring solution
• The new function strengthens the z/OS platform as monitoring platform to control distributed environments
• RMF XP works out-of-the box, in a couple of minutes everything is up-and-running
• The end-user has the choice between two graphical, state-of-the-art workstation frontends
• Approximately 70% of the CPU consumption can be offloaded to zIIP engines. This helps to reduce costs significantly.

57
57
RMF XP - Hot Topics
Now available on the web! http://publibfp.dhe.ibm.com/epubs/pdf/eoz2n1d0.pdf

58
58
Information and Tools
RMF homepage: www.ibm.com/systems/z/os/zos/features/rmf/n Product information, newsletters, presentations, ...
n Downloads
� Spreadsheet Reporter� RMF PM Java Edition
� Postprocessor XML Toolkit
RMF email address: [email protected]
Documentation and news:n RMF Performance Management Guide, SC33-7992
n RMF Report Analysis, SC33-7991
n RMF User‘s Guide, SC33-7990
n Latest version of PDF files can be downloaded from:
www.ibm.com/systems/z/os/zos/bkserv/r13pdf/#rmf

59
59
RMF Redbook !!!

60
60
Appendix: Function Reference
z/OS 1.12 zOSMFIBM z/OS Management Facility:
Resource Monitoring Plugin
z/OS 1.13 RMF
z/OS 1.12 RMF (APAR OA36030)RMF XP
z/OS 1.12 RMFIn-Ready Work Unit Queue Distribution
z/OS 1.12 RMFHTTP API to access Historical data
z/OS 1.13 RMFReporting of system serialization delays
z/OS 1.11 RMFPostprocessor XML Formatted Reports
z/OS 1.13 RMFRMF Storage Reporting Enhancements
z/OS 1.13 RMFRMF WLM Reporting Enhancements
AvailabilityFunction