roadshow canada ackermann 19 - 20 feb.ppt ... · results in summaryresults in summary fourth...
TRANSCRIPT

Deutsche BankDr. Josef AckermannChairman of the Management Board
Montreal and Toronto 19 – 20 February 2009y

Results in summaryResults in summary
Fourth quarter 2008: Net loss of EUR 4.8 bn
Tier I capital ratio of 10 1% consistent with target
Full year 2008: Net loss of EUR 3.9 bn
Tier I capital ratio of 10.1%, consistent with target
Leverage ratio* of 28 ahead of targetLeverage ratio of 28, ahead of target
Reduction of legacy exposure in key areasg y p y
Asset and exposure reduction in key areasSignificant reduction in trading assets
Investor Relations 02/09 · 2* Per target definition

AgendaAgenda
1 FY 2008 and 4Q performanceQ p
2 Capital, balance sheet and funding
3 Prospects for core businesses in 2009
Investor Relations 02/09 · 3

2008 in context of Deutsche Bank’s management agenda2008 in context of Deutsche Bank s management agendaIn EUR bn
Net revenues Net income Tier I capitalMark-downsNet revenues
Net revenues Net income Tier I capital
26.5 25.628.5
30.72.3
3.5
6.1 6.5
22 7 21 923.5
28.3
21 6
31.1
7.0
21.3 21.9
0.41.4
2.522.7 21.9
18.721.6
13.5
‘02 ‘03 ‘04 ‘05 ‘06 ‘07 ‘08 ‘02 ‘03 ‘04 ‘05 ‘06 ‘07 ‘08(3.9)
‘02 ‘03 ‘04 ‘05 ‘06 ‘07 ‘08
Investor Relations 02/09 · 4Note: 2002-2005 based on U.S. GAAP, 2006 onwards based on IFRS

Segment results: Fourth quarterSegment results: Fourth quarterIn EUR m
CB&S GTB AWM PBC CI C&A Group
R (3 774) 751 588 1 410 28 112 (885)Revenues (3,774) 751 588 1,410 28 112 (885)
Provision for credit losses (358) (3) (13) (216) (1) (0) (591)
Noninterest expenses (1,657) (457) (1,451) (1,143) (26) (11) (4,746)
Income (loss) beforeIncome (loss) before income taxes (5,773) 291 (860) 51 1 68 (6,222)
Cost / income ratio (in %) n.m. 61 n.m. 81 92 10 n.m.Cost / income ratio (in %) n.m. 61 n.m. 81 92 10 n.m.
Pre-tax RoE (in %) (121) 103 (63) 6 n.m. n.m. (74)
Investor Relations 02/09 · 5Note: Businesses including minority interest, Group excluding minority interest

Drivers of fourth-quarter performance in summaryDrivers of fourth-quarter performance in summary
BusinessIBIT*,
in EUR bn Key driversBusiness
CB&S
Global Markets: Business model exposed to exceptionally turbulent marketsCorporate Finance: Leveraged finance write backs(5.8)
in EUR bn Key drivers
Corporate Finance: Leveraged finance write-backs counterbalance declines in Advisory, ECM
Record revenues driven by Trade Finance, Cash ManagementGTB
Record revenues driven by Trade Finance, Cash ManagementSustained cost discipline0.3
Si ifi t t i i t d th ti l it iAWM
Significant asset impairments and other exceptional items in Asset ManagementFalls in equity markets impact portfolio and fund management
(0.9)
PBC Lower client activity in investment productsImpact of severance charges0.1
Investor Relations 02/09 · 6* Income (loss) before income taxes

CB&S: Losses in specific trading businessesCB&S: Losses in specific trading businesses4Q20074Q2008
CB&S Total
Revenues, in EUR bn
2.3
CB&S Total4Q2007: EUR 3.8 bn
4Q2008: EUR (3.8) bnCDO Subprime (0.1)RMBS (0.2)
Leveraged Financewrite-backs (net): 0.8
0.5 0.30.9
0.1 0.10.6
0.00.6
0.90.2 0.3
0 00.7
CRE (0.2)
0 0
(0.4)(1.1)
(0.5) (0.3)
0.0
(1.7)( )
(3 4)(3.4)Mark-
downs*Sales &
FX / Money
market /
EquityDerivatives
EquityCash /Prime
Equity Prop Trading
Credit Trading
(incl. Prop)
AdvisoryOrigination Monoline reserves
Other
Investor Relations 02/09 · 7
* Excl. monoline reservesNote: Figures may not add up due to rounding differences
TradingRates Services

Unprecedented conditions in the quarter
Basis risk Correlation
Unprecedented conditions in the quarter
Basis riskCDS bond-basis funding spread, in bps
225300
EURJPY-Nikkei correlation, in %
Correlation
70
.90
(75)0
75150
30
.50
.70
(75)
Volatility Liquidity
1Q 2Q 3Q 4Q 2Q 3Q 4Q.30
1Q
EuroStoxx volatility100
3M Euribor – 3M Eonia swap rate, in bps
150
200
0
50
1Q 2Q 3Q 4Q0
50
100
1Q 2Q 3Q 4Q
Investor Relations 02/09 · 8
1Q 2Q 3Q 4Q
Source: Bloomberg, DB analysis
1Q 2Q 3Q 4Q

These conditions impacted Global Markets’ business modelThese conditions impacted Global Markets business model …
Business model positioning Impact
Investment into flow products and technology Reaped benefits of “Flight to quality”
Business model positioning Impact
Risk transformation and distribution model Limited “toxic asset” writedowns
Broad product and geographical footprint
Market dislocations affect specific
High growth, diversified revenue streams
Prop trading: Relative value strategies
Scale: Market leadership in key areas
Market dislocations affect specific positions / relationships between assets
Volatility exposes illiquidity of large Scale: Market leadership in key areas
Complexity: Customised, structured products
notional positions
Exposure to volatility and correlation risk
Investor Relations 02/09 · 9

leading to losses in key trading businesses… leading to losses in key trading businesses
Business 4Q challengesRevenues DB positioning
4Q2008, in EUR bn
Business 4Q challenges
Breakdown / inversion of Bond-CDS basisCredit Trading
Prop
Revenues
(1.0)
DB positioning
Extreme illiquidityCorrelation to HF strategiesConvertible dislocations
Prop
Global Credit
( )
Relative value strategies Specific positions
Increased sovereign riskShort-selling restrictions
Global Credit Trading (2.4)
Customised client solutions Global Equity Derivatives
Sustained high correlationExtreme volatility
(1.7) (institutional and retail)Structures required complex risk retention
Equity Prop Trading (0.4) Relative value strategies
Specific positions
Severe market movesBreakdown / inversion of relationships between assets
Investor Relations 02/09 · 10
relationships between assets

However flow businesses performed wellHowever, flow businesses performed well
Foreign Exchange Money Markets(1)
Revenue development, 2006-2008
Foreign Exchange Money Markets
x2.3 x3.6
Rates(2)
2006 2007 2008 2006 2007 2008
+12% FX / MM / Rates 2007:~30% of Global Markets
revenues
Investor Relations 02/09 · 11
2006 2007 2008(1) Excluding prop(2) Core Rates Trading excluding municipals and prop

GTB: Another successful quarter and yearGTB: Another successful quarter and yearIncome before income taxes, in EUR m
2004 – 20082008 quarterly development
1,106291283 >4x
2004 2008 2008 quarterly development
705
945281283
433
705250
254
1Q 2Q 3Q 4Q 2004 2005 2006 2007 2008
Investor Relations 02/09 · 12Note: 2004-2005 based on U.S. GAAP and on structure as of 2006, 2006 onwards based on IFRS and on latest structure

AWM: Market conditions impacted full year 2008 resultsAWM: Market conditions impacted full year 2008 results
Net new moneyIncome before income taxes Net new moneyIncome before income taxes
646
In EUR m In EUR bnBefore specific items
27(30)%
Reported
646
267 207
15% 27
1310ARP/S
In EUR bnSpecific items
settlementEUR (0.1) bn
(732)
DWS Scudder impairment (0.3)Infrastructure impairment (0.3)Infrastructure investment (0.2)European money mkt fund injections (0.2) S d it l l / i i t (0 2)
(22)(732)
Asset Management Private Wealth Management Asset Management Private Wealth Management
Seed capital losses / impairments (0.2)
2007 2008 2007 2008 2007 2008 2007 2008
Investor Relations 02/09 · 13
Asset Management Private Wealth Management Asset Management Private Wealth Management

PBC: Lower investment product revenues and rise in provisionsPBC: Lower investment product revenues and rise in provisionsIncome before income taxes, in EUR m
328304
2624Q vs. 3Q2008:
Operating items:Operating items:Lower revenues from investment products and deposits & payments (175)Higher provision for credit losses (47)
51 Specific items:Severance related to efficiency measures* (90)Gains from financial investments 97
1Q 2Q 3Q 4Q
2008
Gains from financial investments 97
Investor Relations 02/09 · 14* Includes EUR 11 m severance impact from Infrastructure

AgendaAgenda
1 FY 2008 and 4Q performanceQ p
2 Capital, balance sheet and funding
3 Prospects for core businesses in 2009
Investor Relations 02/09 · 15

Capital ratios and RWA developmentCapital ratios and RWA development
10.110.3
9 39 2
10.1Target:
10%8.7 8.4
8.8 8.69.39.2
7.5
~10%
7.27.0 7.1
6.9 6.8 6.9 7.0
285
308 311329
303 305319
308
285
31 Mar 30 Jun 30 Sep 31 Mar31 Dec
2007
30 Jun
2008
30 Sep 31 Dec
Investor Relations 02/09 · 16
Core Tier I ratio, in %Tier I ratio, in % RWA, in EUR bnNote: 2007 based on Basel I, from 2008 onwards based on Basel II; Core Tier I ratio = BIS Tier I capital less Hybrid Tier I Capital divided by RWAs

Development of Tier I capital in fourth quarter 2008Development of Tier I capital in fourth quarter 2008In EUR bn
32.81.2 31.1
(4.8)
1.00.9
1.2
( )
30 Sep2008
Net income
Release of dividend accrual
Contingent capital
conversion
Othermeasures /
effects
31 Dec2008
Investor Relations 02/09 · 17

IFRS balance sheet: Development by category
2 202
IFRS balance sheet: Development by categoryIn EUR bn
Positive market values from derivatives
Reverse repos /securities borrowed
Trading securities1,624
2,062
2,202Other trading assetssecurities borrowed
1,383 Loans des. at FVOther financial assets des. at FV through P&L
1,383 1,624 Financial assetsat FV through P&L
727 1,224
253347
269
210 4478
7552
253
Securities borrowed / reverse reposCash and deposits with banks
Loans, net208 124
6942
205
12 9 1920
8686104210
Other*
30 September 2008 31 December 2008
Brokerage & securities related receivables
Investor Relations 02/09 · 18
p
* Incl. financial assets AfS, equity method investments, property and equipment, goodwill and other intangible assets, income tax assets and other Note: Figures may not add up due to rounding differences

Derivative market values driven by certain factorsDerivative market values driven by certain factorsIn EUR bn
Key driversQuarter-on-quarter development
Netting under U.S. GAAP ‘proforma’U.S. GAAP ‘proforma’
Increase driven by sharp falls in USD and EUR interest Rates Volatile FX, Credit and Equity markets had a similar but smaller impact
1,22468%
but smaller impactDerivatives in 4Q2008 pro-forma U.S. GAAP:─ Increase much smaller due to netting
7271 097
30 Sep 2008
31 Dec 2008
Composition of derivative market values
620
1,097 2008 2008
Interest rate 259 644Credit derivatives 226 295Currency 119 182
107 12830 Sep 2008 31 Dec 2008
yEquity 85 69Other 38 35
Total 727 1,224
Investor Relations 02/09 · 19
30 Sep 2008 31 Dec 2008 ,
Note: Figures may not add up due to rounding differences

Development of total assets: IFRS and U S GAAP ‘pro-forma’Development of total assets: IFRS and U.S. GAAP pro-formaTotal assets, in EUR bn
30 Sep 2008 31 Dec 2008
2 062
30 Sep 2008 31 Dec 2008
2,2022,062
(22)%
(23)(101)(620)
1,318
1 030( ) 1,030(1,097)(69)(7)
IFRSRepo netting
Derivatives netting(1)
Pending settlements/
cash collateral netting(1)
U.S. GAAP ‘pro-forma’
U.S. GAAP‘pro-forma’
incl. add.netting(2)
Derivatives netting(1)
Pending settlements/
cash collateral netting(1)
Repo netting
IFRS
Investor Relations 02/09 · 20
(1) 30 Sep 2008 and 31 Dec 2008 figures reflect revision of application of U.S. GAAP netting rules(2) U.S. GAAP ‘pro-forma’ disclosed in 3Q2008: EUR 1,361 bnNote: Figures may not add up due to rounding differences

U S GAAP ‘pro-forma’ assets: Analysis of ‘managed reductions’
1 318
U.S. GAAP pro-forma assets: Analysis of managed reductionsIn EUR bn
‘Managed reductions‘319
107
1,318
1,030
Positive marketvalues from derivatives
319
69
347128
,
205
Trading securities
Reverse repos /
Financial assets at FV through P&L
Other trading assets132
253
129
18511742
1920
Loans, net
Reverse repos / securities borrowed
Other des. at FVLoans des. at FV 67
253269
108 4478 7552Securities borrowed / reverse repos
Cash and deposits with banks
,
Brokerage & securities rel receivables 8533
86 8635108 44
Other*
Brokerage & securities rel. receivables
30 September 2008 31 December 2008
852
Investor Relations 02/09 · 21
* Incl. financial assets AfS, equity method investments, property and equipment, goodwill and other intangible assets, income tax assets and other Note: Figures may not add up due to rounding differences

Total assets: Analysis of major categoriesTotal assets: Analysis of major categoriesIn EUR bn, as of 31 Dec 2008
2,202Netting impact
Positive marketvalues from derivatives
Derivatives post-netting 1(1,097)
128
1,0301,224
g p
Non-derivative trading assets
Trading securities
Reverse repos / securitiesOther trading assets 2247
205
4242
205
trading assets
Reverse repos /L t
Reverse repos / securities borrowed designated at FVO
Other designated at FVLoans designated at FV
(7)
269
12411742
Reverse repos / securities borrowed161
Reverse repos /iti b d
Cash and deposits with banks
Loans, net 34269
44
2694
securities borrowed
Other*
IFRS U S GAAP ‘ f ’
4444Brokerage & securities rel. receivables (69)
Investor Relations 02/09 · 22
* Incl. financial assets AfS, equity method investments, property and equipment, goodwill and other intangible assets, income tax assets and other Note: Figures may not add up due to rounding differences
IFRS U.S. GAAP ‘pro-forma’

U.S. GAAP ‘pro-forma’ derivatives risk – >50% of uncollateralised risk1 U.S. GAAP pro forma derivatives risk >50% of uncollateralised risk mitigated – remainder primarily with investment grade counterparts
1
Derivatives Portfolio – Credit Risk Overview Credit risk mitigants – EUR 67 bn includes:In EUR bn, as of 31 Dec 2008
Derivatives Portfolio Credit Risk Overview
128 Non-cash collateral not netted for balance sheet purposesExchange counterparties
Credit risk mitigants EUR 67 bn includes:
(10)(7)
(16)
Exchange counterparties Gov’t entities, A-rated or betterDB in preferred senior position / exposure hedged
Remaining credit risk by rating – EUR 61 bn
61
(34)
(10)
Ratings TotalAAA 9
Remaining credit risk by rating – EUR 61 bn
( )
EUR 67 bn (>50%)Credit risk mitigants
Investment grade 85%AA 22
A 12BBB 9BB 4
Sovereign& State
sponsored
Credit risk mitigants
Uncolla-teralised
Other credit risk
Non-cash
collateral
Exchange counter-
parts
Remaining creditrisk
Non-investment grade 15%
BB 4B 3CCC & below 2Grand total 61
Investor Relations 02/09 · 23
sponsored entities
risk mitigants
collateral parts risk

Non-derivative trading assets – risk reduction across all asset classes2 Non derivative trading assets risk reduction across all asset classes2
Non-derivative trading assets as at 31 Dec 2008 >50% reduction in non-derivative trading assetsIn EUR bn
247 Assets 31 Mar 08 31 Dec 08 % change
Government paper
Non derivative trading assets as at 31 Dec 2008 >50% reduction in non derivative trading assets
(60)
Government paper & agencies 154 60
Financials & corporates* 172 94
(61)%
(45)%
(94)
corporates
Equities 110 44 (60)%
18(31)
(44)
(94)Traded loans 90 31
Other 6 18
(66)%
(31) Other 6 18
DB Group total 532 247
Non-derivative
trading assets
Govern-ment
paper & agencies
Financials& cor-
porates*
Equities Traded loans
Other
(54)%
Investor Relations 02/09 · 24*Includes MBS, ABS, SPV & Project Finance
g
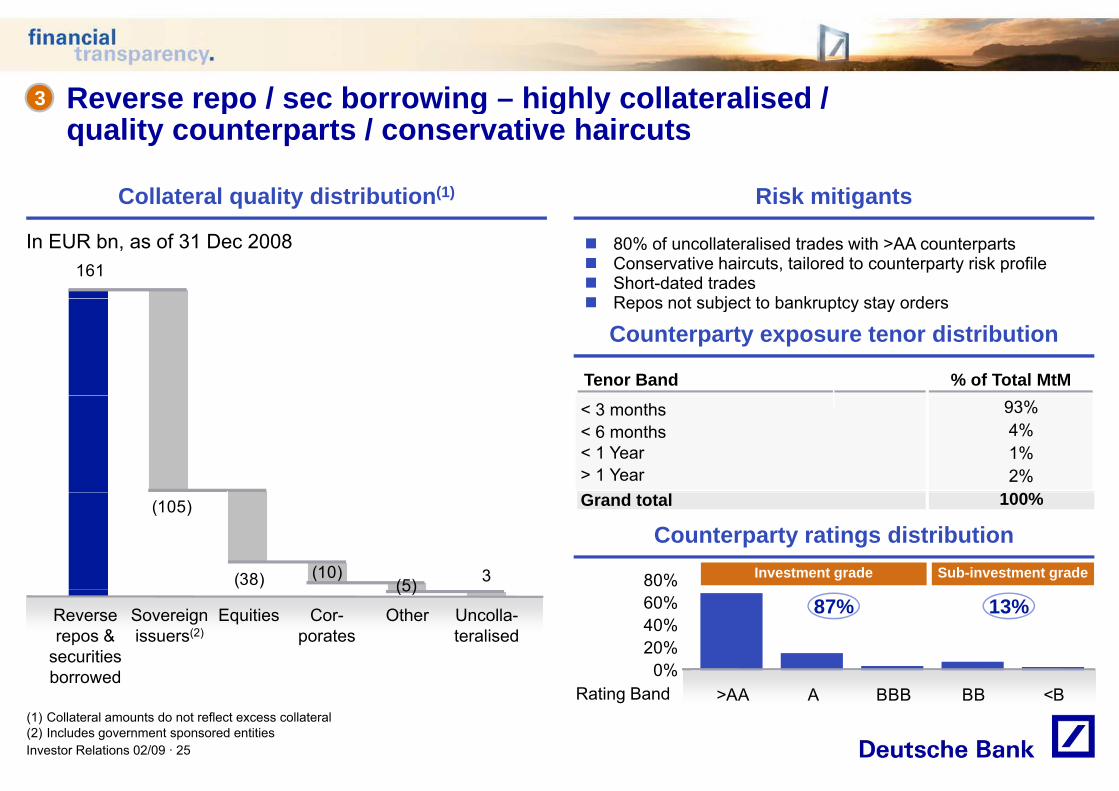
Reverse repo / sec borrowing – highly collateralised /3 Reverse repo / sec borrowing highly collateralised / quality counterparts / conservative haircuts
3
Collateral quality distribution(1) Risk mitigantsCollateral quality distribution Risk mitigants
16180% of uncollateralised trades with >AA counterpartsConservative haircuts, tailored to counterparty risk profile Short-dated tradesR t bj t t b k t t d
In EUR bn, as of 31 Dec 2008
Counterparty exposure tenor distribution
Tenor Band % of Total MtM
Repos not subject to bankruptcy stay orders
< 3 months< 6 months< 1 Year> 1 Year
93%4%1%2%
%
Counterparty ratings distribution
80% Investment grade Sub-investment grade3(10)(38)
(105) Grand total
(5)
100%
0%20%40%60% 87% 13%Sovereign
issuers(2)Equities Cor-
poratesReverse repos &
securities borrowed
Uncolla-teralised
Other
(5)
Investor Relations 02/09 · 25
>AA A BBB BB <BRating Band(1) Collateral amounts do not reflect excess collateral(2) Includes government sponsored entities

Composition of loan book demonstrates focus on diversification4 Composition of loan book demonstrates focus on diversification & risk mitigation
4
In EUR bn, as of 31 Dec 2008
269 Low loan to value
Substantially hedged
Highly
(16)(19)
(37)
(61)
Highly diversifiedShort term /on demand
Fully collateralisedLiquid collateral Substantial
collateral ~50% Gov’t g’teed
Substantially collateralised by Gov’t securitiesAdditional hedging mitigants
Strong underlying asset
9(8)(14)(15)(28)
(7)(12)(15)(16)
Substantial collateral / hedging
High margin business Partially
hedgedMostlysenior secured
Diversified assetpools
quality
Predominantly mortgage securedDiversified by asset type and location
9(8)(14)
PBC mort-gages
Inv grade / German mid-cap
GTB PWM PBCsmall
corporates
Asset finance
(DB sponsored
CF Leveraged
Finance
Corporate Invest-ments
Total loanbook
PBC consumer
finance
Financing of
pipeline assets
Gov’t collat-
eralised / structured
Colla-teralised / hedged
structured
Other CIB
CF Commer-
cialReal
(14)(14)
pconduits)
Moderate risk bucketLower risk bucket
62%
transactions transactions
Higher risk bucket
Estate
Investor Relations 02/09 · 2686%

Provision for credit losses Si l t tProvision for credit lossesIn EUR m
Single counterpartyrelationshipIAS 39 impact
591 257
1,076
329236
185 612
5
98 81 105 114 13523672
2007 2008
Full year
20082007
1Q 2Q 3Q 4Q 1Q 2Q 3Q 4Q
Thereof: CIB2007 2008 20082007
(20) (42) (19) 190 (11) (9) 66 361 109 408
117 124 124 136 125 145 169 229 501 668
Investor Relations 02/09 · 27Note: Divisional figures do not add up due to omission of Corporate Investments
Thereof: PCAM

Assets and Liabilities: Funding analysis
2 202 2 202
Assets and Liabilities: Funding analysisLiquidity management view by product, as of 31 Dec 2008, in EUR bn
1,264 1,210
2,202 2,202
Derivatives & Settlement Balances(1)
Derivatives & Settlement Balances(1)
162
16868
133Reverse Repo & Other Secured
Repo & Other Secured
Trading Liabilities(2)
L t Li biliti162
75156
256Trading Assets(2)
Cash & Short-Term deposits with Banks
Short-term Liabilities
Long-term Liabilities
288 292102%
coverageratio
Loans(3)
depos ts t a s
Non-Bank Deposits(4)
180152
Assets Liabilities & Equity
Other Equity & Other
(1) Volumes relate to market values from derivatives brokerage and securities related payables/receivables (mostly non-cash) - for better illustration size of box is scaled down
Investor Relations 02/09 · 28
(1) Volumes relate to market values from derivatives, brokerage and securities related payables/receivables (mostly non-cash) - for better illustration, size of box is scaled down (2) Excluding positive and negative market values from derivatives which are shown under derivatives (3) Loans, net of allowance for loan losses incl. loans designated at fair value through P&L (FVO) of EUR 19 bn but excluding loans held in trading of EUR 31 bn which are shown under trading assets (4) Deposit to Loan Ratio defined as total non-bank deposits divided by loans, net of allowance for loan losses (incl. FVO loans, excl. loans held in trading) Note: Figures may not add up due to rounding differences

Unsecured funding by sourceUnsecured funding by sourceIn EUR bn
511 498
7330%
15%
Cash and liquidity reserves exceed
short term153 30% short-term wholesale funding
358426
+ 68
Short-term wholesale fundingCapital markets
30 June 2007 31 December 2008
Investor Relations 02/09 · 29Note: Figures may not add up due to rounding differences
Retail deposits Fiduciary, clearing & other deposits

Deutsche Bank’s funding positionDeutsche Bank s funding position
Modest additional capital market funding CDS spreads support funding cost advantage
New issuance, in EUR bn 5-year senior CDS, in bps 1 July 20072 February 2009
54381
45
167 171
263295 306
1670
106127
163 167 171
35 351819
Plan2009
20082007
14 13 1135 35
10 1218198
BNP JPM CSBoA UBS GS Citi MSBarc
Investor Relations 02/09 · 30Source: Bloomberg
2009

AgendaAgenda
1 FY 2008 and 4Q performanceQ p
2 Capital, balance sheet and funding
3 Prospects for core businesses in 2009
Investor Relations 02/09 · 31

Summary of near-term strategic initiativesSummary of near-term strategic initiatives
CB&S Recalibration of the investment banking business model
GTB Continued growth initiatives
AWMAM: Reengineering business model to current market levels
AWMPWM: Efficiency program / selective growth opportunities
G ffPBC
Growth and efficiency programPostbank co-operation
Investor Relations 02/09 · 32

Global Markets: Historical revenue compositionGlobal Markets: Historical revenue composition
Revenue breakdown Examples
Illustrative
Credit Prop trading Equity Prop trading
Revenue breakdown Examples
Highly illiquiditi15% Equity Prop trading
Equity derivatives
Money markets derivativesFX d i ti
positions
60%~60%~15%
~20%
~20% ~15%
FX derivativesCredit securitisationCommodities tradingEquity prime finance
Medium / high liquidity~55%
~60%~60%
Equity prime finance
FX and money markets spot and forward tradingE t b d t di
Most liquidflo
~30% ~20% ~20% ~25%
European govt. bond tradingCash equities
flow
2004 2005 2006 2007 2008
Investor Relations 02/09 · 33

We have moved swiftly to recalibrate this modelWe have moved swiftly to recalibrate this model
Notional capital
Significant reduction in proprietary risk Continued management of legacy exposures
U S RMBS exposuresEPT* HedgesNotional capital U.S. RMBS exposures
(50)%(90)%
EPTSABA*
HedgesNet exposure
Aug 07 Jan 08 Jun 08 Sep 08 Dec 08 Dec 07 Mar 08 Jun 08 Sep 08 Dec 08Aug 07 Jan 08 Jun 08 Sep 08 Dec 08
Aggressive de-leveraging Reduced costs
Gl b l M k t b l h t (U S GAAP f ) Gl b l M k t h d t
Dec 07 Mar 08 Jun 08 Sep 08 Dec 08
Global Markets balance sheet (U.S. GAAP pro-forma)
(33)%
Global Markets headcount
(39)%
Investor Relations 02/09 · 34
Mar 08 Jun 08 Sep 08 Dec 08 Peak 2007 2009EEnd 2008* SABA: Designated credit prop desk; EPT: Equity proprietary trading

Resulting in a shift in the Global Markets business modelResulting in a shift in the Global Markets business model
Shift in business model (revenue mix) Key actions
~5%
Shift in business model (revenue mix) Key actions
De-riskScale-back / eliminate illiquid prop activitySharply reduced retention of structured un-
Highly illiquiditi
Illustrative
~55%
~15%5% Sharply reduced retention of structured un-
hedgeable riskSignificant curtailment of non-collateralised counterparty risk
positions
~55%
~60%
Attack market share Continue to accelerate market growth in products where we lack dominant positionsDrive growth initiatives in commodities, cash
Medium / High liquidity
~40%25%
gequities and prime brokerage
Capitalise on strengthsCapitalise on pre-existing dominant flow business f hi i FX M M k t d t
Most liquidflo~25% franchises in FX, Money Markets and rates
Continue to apply technology to exploit wider margins and benefit from competitor consolidation
flow
2004-2007 average
2009plan
Investor Relations 02/09 · 35
a e age p a

Corporate Finance: Recalibrating our platformCorporate Finance: Recalibrating our platform
Commercial Real EstateReengineer Leveraged Finance
Reposition
Sectors: Financial Institutions, Natural ResourcesCountries: Selected Europe, China, BrazilProducts: M&A and ‘rescue’ advisoryMaintain commitment to German mid-cap
Invest
p
Align sales forces and client universe within Global BankingR li
g gSelective efficiency measures
Realign
Investor Relations 02/09 · 36

Global Transaction Banking: Continued growth agendaGlobal Transaction Banking: Continued growth agenda
Expansion into new markets
Increase penetration of existing client base in core markets Leverage ‘flight to quality’ opportunitiesMonitor opportunities to expand by bolt-on acquisitionMonitor opportunities to expand by bolt on acquisition
Target profitable lower mid-cap corporate client groupsAttract new clients
Leverage existing technologies and introduce integrated systems to offer clients robust global / cross-regional solutionsProvide state of the art risk mitigation support to clients
Develop d t
Develop flexible offerings in high growth products ( d FX 4 C h* h l l t d itt bilproduct
offering(e.g. cards, FX 4 Cash*, wholesale custody, remittances, mobile payments)
Investor Relations 02/09 · 37* Platform for low-value FX payments

AWM will reposition its platforms to a changed environmentAWM will reposition its platforms to a changed environment
Reengineer platform to restore operating leverage at current market levels:
Asset
Reengineer platform to restore operating leverage at current market levels:Reposition exposure to European money-market fund businessRight-size RREEF / infrastructure D i h d f d l tfAsset
ManagementDownsize hedge fund platformCentralize shared services globallyCost reduction in mid / back office (marketing / real estate technology operations)(marketing / real estate, technology, operations)
Efficiency program / performance improvement initiative
Private Wealth Management
y p g p pCapture new advisory / product opportunitiesStrengthen Discretionary Portfolio Management / Wealth Advisory ManagementgCounter-cyclical hiringMonitor opportunities for selective bolt-on acquisitions
Investor Relations 02/09 · 38

PBC: Respond to shifts in revenue mix and leverage benefits ofPBC: Respond to shifts in revenue mix, and leverage benefits of ‘flight to quality’
Shift in revenue mix Substantial capture of new clients and depositsShift in revenue mix Substantial capture of new clients and deposits
5.85.8
Net revenues, in EUR bn Total clients, in mGermany
x Deposits(2), in EUR bn
Investment products 0.813 8 14.6
64
83
(15)%
+19
Consumer & Mortgage finance
13.8
2%
Deposits &Payments
Business d t
9.710.12%
8%
2007 2008
productsOther(1)
31 Dec Net new 31 Dec
8%
Investor Relations 02/09 · 39
2007 total clients 2008(1) Including non-recurring items (2) Excl. sight deposits

PBC: Implementation of ‘Growth and Efficiency’ programPBC: Implementation of Growth and Efficiency program
Advisory banking: Position for recovery inAdvisory banking: Position for recovery in investment products via selective investmentsConsumer banking: Position for margin compression via cost-efficiency
Business model
PBCAdvisory Banking
ConsumerBanking
Leverage customer capture of prior year(s)
Middle-office consolidation
Efficiency measures
Middle-office consolidationIntegration of credit operationsBack-office efficiency
Efficiencyprogram
Product and distribution synergiesJoint purchasing / infrastructure synergiesE t d t t i t fPostbank Expected run-rate pre-tax impact of EUR ~120-140 m within 3-4 years:– Cost / revenue: ~ 60%/40%– Deutsche Bank / Postbank: ~ 50%/50%
Postbankco-operation Further details at a
joint press conferencein March 2009
Investor Relations 02/09 · 40
Deutsche Bank / Postbank: 50%/50%

Business initiatives will be complemented by Group initiativesBusiness initiatives will be complemented by Group initiatives
Complexity reduction
Realign infrastructure complexity to recalibrated front-office requirementsReap full infrastructure savings from front-office simplification
OffshoringImprove efficiency of outsourced functionsAdditional outsourcing / smartsourcing initiativesRealise onshore benefits
Other efficiency
Commoditisation of standardised businesses
Realise onshore benefits
efficiency initiatives Increasing consistency of processes across businesses
Further develop longer-term performance systemsCompensation model
p g p yOption of ‘clawback’ in subsequent yearsIncrease focus on Group performance
Investor Relations 02/09 · 41

Summary: Looking forward in 2009Summary: Looking forward in 2009
Capital ratios remain solid
Reduced exposure to legacy positionsReduced exposure to legacy positions
Trading assets in key areas have been significantly reducedg y g y
Strong liquidity and funding base
Cost-efficiency measures underway
Repositioning businesses to the current environment
Investor Relations 02/09 · 42

Additional informationAdditional information

FY2008 IAS 39 reclassificationsFY2008 IAS 39 reclassificationsIn EUR bn
FY2008 total impact from reclassificationsAssets reclassified
in 3Q2008Assets reclassified
in 4Q2008 Total
Net Revenues 2.3 1.2 3.6(1)
Provision for credit losses (0.2) (0.1) (0.3)
Noninterest expenses - - -
Income before income taxes 2.2 1.1 3.3
RWA(2) 2.0 1.2 3.2
Balance Sheet(3) 24.9 11.0 35.9
Investor Relations 02/09 · 44
(1) Includes revenues of EUR 5 m in PBC (2) Additional capital demand(3) Balance sheet represents carrying value of transferred assets at reclassification date

Value of Level 3 assets(1) unchangedValue of Level 3 assets( ) unchanged
Asset classes Comments
6 688 89
23
Criteria for level 3 categorization unchangedIn EUR bn
41
146 6 Key changes in composition year over year:
– Transfer from Level 2 to level 3– Market volatility drives rises in derivative
volumes
18
50volumes
– IAS 39 reclassifications– Maturing and sold assets
20 17
31 D 31 D
Financial Assets(3)Financial assets AfS / Other
31 Dec 2007
31 Dec 2008
Trading securitiesPositive market values(2)
Other trading assets
Investor Relations 02/09 · 45
(1) IFRS netting convention applied (2) From derivative financial instruments (3) Designated at fair value through profit or lossNote: Total includes PCAM; figures may not add up due to rounding differences; indicative numbers only
Trading securitiesPositive market values( )

Trading exposures in key areas 31 Dec 2007Trading exposures in key areasIn EUR bn
U S RMBSCDO Subprime
31 Dec 2008
2 99.7
U.S. RMBSCDO Subprime
(70)% (59)% (50)% (65)%
Net Net
2.9
0.9 1.20.5
GrossGross
4.83.6 1.3
Net NetGrossGrossLeveraged FinanceCRE
(73)% (83)% (98)% (98)%
4.6
15.4
2.6
17.2
0 9
36.2
0 5
34.9
(1),(2) (1)
Gross Net Gross NetCDO / RMBS: Exposure represents our potential loss in the event of a 100% default of securities and related hedges / derivatives assuming zero recovery; net represents net of hedges and other protection purchased, RMBS also includes other trading related net positions CRE / LevFin: Exposure represents carrying value and includes impact of synthetic sales securitizations and other strategies; for unfunded commitments carrying value
0.9 0.5
Investor Relations 02/09 · 46
CRE / LevFin: Exposure represents carrying value and includes impact of synthetic sales, securitizations and other strategies; for unfunded commitments carrying value represents notional value of commitments; for 31 Dec 2008 exposure represents loans and loan commitments held at fair value pre 1 Jan 2008; 31 Dec 2007 incl. loans held of EUR 1.3 bn; net represents less life-to-date gross mark-downs, excluding fees and hedges on remaining exposure (1) After reclassification of exposures under IAS 39 per 31 Dec 2008 for CRE: EUR 6.9 bn and LevFin: EUR 8.5 bn (2) Net of risk reduction

Leveraged Finance exposure: Current statusLeveraged Finance exposure: Current statusComposition of current loans and loan commitments
In EUR bn30 Sep 2008 total loans and loan commitments 24.1
FX 0.2 Sales (1.0)
FundedIn EUR bn
(1.0)
10.9( )
Restructured 0.1 New Commitments 0.1 Cancelled (12.2) (1.0)
31 Dec 2008 total loans and loan commitments 11.3
Gross mark-downs (0.4)31 Dec 2008 'carrying value' 10 9
(1)
0 5
31 Dec 2008 'carrying value' 10.9
Development of mark-downs(0.9)(8.5) 0.5
In EUR m 4Q2008 3Q2008
Mark-downs (net of fees) 757 (467) ‘Carrying value’
Newdeals
Loans & loan commitments
(3)
Legacyloans
IAS 39 reclass
(2)
(1) Related to traded loans and loan commitments held at fair value on our books as at 31 Dec 2008
Investor Relations 02/09 · 47
2008 at FV(3)held(1) Related to traded loans and loan commitments held at fair value on our books as at 31 Dec 2008(2) Representing EUR 7.6 bn carrying value and life-to-date mark-downs of EUR 0.9 bn on a total commitment basis(3) Includes loans and loan commitments held at fair value pre 1 Jan 2008Note: Figures may not add up due to rounding differences

Commercial Real Estate: Current statusCommercial Real Estate: Current statusComposition of traded whole loans and loan commitments(1)
In EUR bn
30 Sep 2008 traded loans at fair value 12.4 FX (0.5)Sales (1.8)
2.6
In EUR bn(2) Total IAS 39 reclass
in 2008: EUR 6.9 bn
Sales (1.8)Transfer to loans held (per IAS 39) (5.6)Other 0.1
31 Dec 2008 traded loans at fair value 4.6
0.5 Other Europe
(2)
Risk reduction (1.4)Gross mark-downs (0.6)
31 Dec 2008 traded loans at fair value 2.6 (4)
1.2100%
Funded
Germany(3)
In EUR m 4Q2008 3Q2008
Net mark downs excl hedges 58 (30)0.9 North
America
Development of mark-downs
Net mark-downs excl. hedges 58 (30)Net mark-downs incl. specific hedges (213) (163)
America
Traded loans at fair value(4)
(1) Traded whole loans and loan commitments represent our gross exposure to loans and loan securities held on a fair value basis; our CRE business also takes positions in
Investor Relations 02/09 · 48
(1) Traded whole loans and loan commitments represent our gross exposure to loans and loan securities held on a fair value basis; our CRE business also takes positions in assets held for securitization and commercial mortgage-backed securities (2) Carrying value of loans held on a fair value basis (3) Reduction of risk from synthetic sales, securitizations and other strategies (4) Carrying value of loans held on a fair value basis less risk reduction and gross mark-downs Note: Figures may not add up due to rounding differences

Monoline exposure related to U S residential mortgagesMonoline exposure related to U.S. residential mortgages
Exposures in EUR bn BreakdownExposures, in EUR bn Breakdown
By Notional Fair Value before credit provision
Subprime Super Senior
Alt-ASubprimeOther
FV afterFV prior to By Notional Fair Value before credit provision
AA Rated 1.6 (0.0) 1.6
Monoline rating Credit provision*
FV after credit
provision*
FV prior to credit
provision*
Key commentary
Non Investment Grade 1.4 (1.3) 0.2
Total 3.1 (1.3) 1.7
Assets– Significant portions of the underlying Alt-A assets
are AAA rated with high levels of subordination.– Low impairments to date on underlying assets Counterparties– Over 90% of net exposure (after provisions) to
investment grade monolines– Disclosure excludes bought protection (hedges)
Investor Relations 02/09 · 49* Credit valuation adjustment

Other monoline exposureOther monoline exposure
Exposures in EUR bn BreakdownExposures, in EUR bn BreakdownCorporate single name / CDO
Trust Preferred and other CLOs
CMBS
OtherStudent LoansFV prior to Credit FV after
By Notional Fair Value before credit provision
AA Rated 2.0 (0.0) 1.9
Monoline rating credit provision*
Credit provision* credit
provision*
Key commentary
Other Investment Grade 1.5 (0.2) 1.3
Non Investment Grade 1.8 (0.6) 1.2
Assets:– Significant portions of the assets protected have high
subordination levels and are referenced to high quality underlying assets
– Approximately 50% of Corporate CDO portfolio rolls off within 12 th
Total 5.2 (0.9) 4.4
12 months– Low impairments to date on underlying assetsCounterparties:– Over 70% of net exposure (after provisions) to investment
grade monolinesExposures to monolines in restructuring / run off mode are
Investor Relations 02/09 · 50
– Exposures to monolines in restructuring / run-off mode are provisioned as necessary
– Disclosures exclude bought protection (hedges)* Credit valuation adjustment

Invested assets(1) report
Net new money31 D 31 M 30 J 30 S 31 D
Invested assets( ) reportIn EUR bn
4Q2008 FY2008
Asset and Wealth Management 749 698 700 700 628 (23) (13)
Net new money 31 Dec 2007
31 Mar 2008
30 Jun 2008
30 Sep 2008
31 Dec 2008
Asset and Wealth Management 749 698 700 700 628 (23) (13) Asset Management 555 516 515 510 463 (15) (22)
Institutional 158 150 155 156 159 9 10 Retail 234 214 211 193 152 (21) (30)Retail 234 214 211 193 152 (21) (30) Alternatives 58 52 52 58 50 (2) 1 Insurance 105 99 98 103 102 (1) (3)
Private Wealth Management 194 182 184 191 164 (8) 10 g ( )Private & Business Clients 203 198 198 193 189 6 15
Securities 129 120 119 111 96 (5) (4) Deposits excl. sight deposits 64 68 70 73 83 11 19 Insurance(2) 10 10 10 10 10 (0) (0)
PCAM 952 896 898 894 816 (17) 3
Investor Relations 02/09 · 51
(1) Assets held by Deutsche Bank on behalf of customers for investment purposes and / or managed by Deutsche Bank on a discretionary or advisory basis or deposited with Deutsche Bank (2) Life insurance surrender value

Regional net new money – AM and PWMRegional net new money AM and PWMIn EUR bn
Asset Management 5 27 2 1 (11) (15) (22)G 1 20 2 (3) (7) (22) (29)
4Q2008 FY20081Q2008FY20074Q2007 3Q20082Q2008
Germany 1 20 2 (3) (7) (22) (29)UK 1 7 1 1 3 (1) 4Rest of Europe 1 (7) (0) (1) 0 (1) (2)Americas 1 3 0 4 (6) 9 7
1 (1) (0) (1) (1) (3)Asia / Pacific 1 4 (1) (0) (1) (1) (3)
Private Wealth Management 3 13 5 6 6 (8) 10Germany 0 4 1 0 1 1 3UK 0 0 0 0 (0) 0 1UK 0 0 0 0 (0) 0 1Europe / Latin America / Middle 1 4 0 4 4 (5) 3USA 1 2 2 (0) 0 (1) 1Asia / Pacific 0 2 2 2 1 (4) 2
Asset and Wealth Management 8 40 7 8 (5) (23) (13)
Investor Relations 02/09 · 52Note: Figures may not add up due to rounding differences

Balance sheet leverage ratio (target definition)Balance sheet leverage ratio (target definition)In EUR bn
31 Dec 2008
30 Sep 2008
Total assets (IFRS) 2,202 2,062 Adjust derivatives according to U.S. GAAP netting rules (1,097) (620)Adjust pending settlements according to U.S. GAAP netting rules (69) (101)Adjust repos according to U.S. GAAP netting rules (7) (23)
Total assets adj sted ("pro forma U S GAAP") 1 030 1 318Total assets adjusted ("pro-forma U.S. GAAP") 1,030 1,318
Total equity (IFRS) 31.9 37.8 Adjust pro-forma FV gains (losses) on all own debt (post-tax)* 4.4 3.7
Total equity adjusted 36.3 41.5
Leverage ratio based on total equity According to IFRS 69 55 According to target definition 28 32
Investor Relations 02/09 · 53
* Estimate assuming that all own debt was designated at fair valueNote: 30 Sep 2008 and 31 Dec 2008 figures reflect revision of application of U.S. GAAP netting rules

Cautionary statementsCautionary statements
Unless otherwise indicated, the financial information provided herein has been prepared under International FinancialReporting Standards (IFRS) It is preliminary and unaudited and may be subject to adjustments based on theReporting Standards (IFRS). It is preliminary and unaudited and may be subject to adjustments based on thepreparation of the full set of financial statements for 2008.
This presentation also contains forward-looking statements. Forward-looking statements are statements that are nothistorical facts; they include statements about our beliefs and expectations and the assumptions underlying them. These; y p p y gstatements are based on plans, estimates and projections as they are currently available to the management ofDeutsche Bank. Forward-looking statements therefore speak only as of the date they are made, and we undertake noobligation to update publicly any of them in light of new information or future events.
By their very nature, forward-looking statements involve risks and uncertainties. A number of important factors couldtherefore cause actual results to differ materially from those contained in any forward-looking statement. Such factorsinclude the conditions in the financial markets in Germany, in Europe, in the United States and elsewhere from which wederive a substantial portion of our revenues and in which we hold a substantial portion of our assets the development ofderive a substantial portion of our revenues and in which we hold a substantial portion of our assets, the development ofasset prices and market volatility, potential defaults of borrowers or trading counterparties, the reliability of our riskmanagement policies, procedures and methods, and other risks referenced in our filings with the U.S. Securities andExchange Commission. Such factors are described in detail in our Form 20-F and Form 6-K filed with the SEC on 26March 2008 and 30 October 2008, respectively, under the heading “Risk Factors.” Copies of this document are readilyavailable upon request or can be downloaded from www.deutsche-bank.com/ir.
This presentation contains non-IFRS financial measures. For a reconciliation to directly comparable figures reported
Investor Relations 02/09 · 54
under IFRS refer to the 4Q2008 Financial Data Supplement, which is accompanying this presentation and available onour Investor Relations website at www.deutsche-bank.com/ir.