roadshow presentation september 2016.pdf
TRANSCRIPT
Heijmans – Business Update
September 2016, based on 2016 interim results

A4 Delft- Schiedam
2
Contents
• Company profile 4 - 8• Strategy 9 - 15• Highlights 2016 Interim results 16 - 21• Developments per sector 22 - 39• Outlook 40 - 41• Financial statements 42 - 45• Annexes 46 - 60
Ø Resumes Executive Board 47Ø Financial Covenants 49Ø Procedures Property development 51 - 54Ø Risk Management 55Ø Percentage of completion method 57Ø Project images in this handout 59
3

4Highway Tilburg - Den Bosch (anno 1928)
Company profile
Founded in 1923 by Jan Heijmans

5
Company profile
Heijmans History• Since 1923 active in road building• Strong growth following second world war• During sixties, diversification towards residential building• During eighties, diversification towards property development• Listing at the Amsterdam Stock Exchange in 1993• Strong revenue growth by acquisitions• 2008: Reset strategy• 2009: Financial restructuring• 2010: Strategy focusing on profitability, sustainability and quality• 2012: Strategic review with BCG• 2014: Improve and Renew – new criteria and ambitions

6
Company profile
6
Residential Non-residential InfrastructureProperty development Building Road buildingResidential building Technical Services Civils Engineering
Eemskwartier Groningen Luggage hall Eindhoven Airport N23 Westfrisiaweg, Province of North Holland
Meysters’ Buiten, Utrecht Technical University, Eindhoven Water sewage plant RWZI, Utrecht
7
Company profile
Heijmans at a glance• With almost 6,500 employees and approx. € 2 billion in annual revenues, Heijmans is active in
property development, residential building, non-residential and infrastructure;• Focus on selective markets, active in the Netherlands, Belgium and Germany;• Create added value by offering the client an integrated approach with focus on quality;• Ambition to achieve leading position on quality, sustainability and profitability, resulting in:
Ø The best choice for clients;Ø Innovation and focus on sustainability;Ø Above-average long-term yield for shareholders;Ø Being attractive and inspiring to employees;
• Building the spatial contours of tomorrow, where development and realization take intoaccount people and the environment, both in projects for clients and in the company's ownecological footprint.

8
Company profileKey figuresx 1 € million H1 2016 H1 2015 2015
Revenues 946 922 1.979
Underlying operating result1 -7 -11 -5
Operating result -15 -16 -29Result after tax -12 -15 -27
Earnings per share ( in €) -0,57 -0,76 -1,32
Order book 2.375 2.190 2.094
Net debt 77 108 10
Number of FTE 6.409 6.816 6.582
1 underlying operating result i s the operating result corrected for operating result joint ventures, write down onproperty assets, restructuring costs and other extraordinary i tems.

9
Strategy – Restructuring provides potential
Since 2009, Heijmans has implemented a transformational strategic restructuring:• Focus on core activities in the Netherlands and Belgium• Disposal of non-core foreign operations• Reduction in strategic land bank positions• Margin over volume ~ added value• Streamline organisation with centralisation of activities• Improve contract-, risk- and project management through “Improve the core” program
Jul-2009€ 100 miorights issue
Nov-2009disposalHeitkamp Railand NSE
2010disposal ofnon-coreBelgiumactivities
2011restructuringOevermann
Oct-2009reverse 10-1stock split
Dec-20091.300 FTEreduction
Dec-2010Disposal ofLeadbitterUK Dec-2011
restructuringPrefab
Jun-2012disposal ofPrefab activities
2012restructuringNon-residential
Dec-2011terminate €40 miostake inMeerstad
Dec-2012Start IntegralWorking capitalManagement‘Fit for cash’
Aug-2013‘Sub-10’share issue
Dec-2013AcquisitionBrinck Group
Dec-2012250 FTEreductionResidential
Apr-2012disposal ofTelecom activitiesBurgers Ergon
Jun-2013PPP partnership3i (equity inv.)
Dec-2014350 FTEreductionsNon-res.,Oevermann,Civil.
May-2015Sub-10 shareissue torepurchaseCumPrefs
Feb-2016ExtensionCreditFacility
July-2016Strategy Infra NLredefined

A27 / A1 PPPUtrecht - Eemnes
10

11
Strategy – Ambition
Strategy “To be the best construction company in the Netherlands”• 2012 BCG review: Heijmans can become the best Dutch construction company• Overall midterm EBIT goal of 3-4% is realistic• Strategic direction based on “To improve and to renew”
To improve: “Improve the core” program focussing on operational excellence:• Procurement• Tender management• Project management (continuous improvement of quality & process)• Commerce
To renew: Innovation as driver for competitive advantage, resulting in our “Renewal ambition”:• In 2020 our products will generate energy, instead of using energy• In 2020 our buildings, engineering structures and roads will be recyclable to the maximum extent• In 2020 our properties and solutions will contribute to improved spatial quality

National MilitaryMuseum (PPP)Soesterberg
12

13
Strategy – Competitive strengths
Residential• Development of urban and rural areas in both small and large-scale projects• Combining creativity and customer focus with strength on realization• Increasing focus on renovations and transformations• Improving processes including procurement, 3D BIM (widely applied within Heijmans), standardization of concepts
(industrialized proces) and innovative solutions (e.g. Heijmans One).
Non-Residential• Niche position with focus on healthcare, higher education, high-tech clean, datacenters, government• Combining building with technical solutions/services in integrated projects during the whole lifecycle of buildings• Centralised business model
Infrastructure• Top player in our market with proposition including asset management, traffic management and technical services• Strong capabilities and track record in larger and integrated projects• Added value driven (clear view on lean asset base and asphalt production)
Heijmans’ multidisciplinary integrated approach is a major differentiator in the market

Composite bridge
Infrastructure for Electric cars
Infra technology & mobility
Kousrelining (renovation of waterpipes)
14

15
Strategy – Innovation
Invest in smart technological concepts / sustainable solutions:• Create competitive advantage towards clients;• Improve future margin potential because of increased added value;• Appointment of Chief Technology Officer / focus on marketability;• Cooperation with Spark (network for creativity and knowledge).
Examples of innovations already sold / ready for market launch• The ‘Heijmans One’ portable house > first 58 houses sold;• Hydrofit ‘kousrelining’ with DSM;• Energy generating noise barrier (‘Solar noise barrier’);• BikeScout: warning system to improve safety of cyclists;• ‘Smart living concept’: standardised ‘home control’ in all family homes.
Examples of innovations in pilot phase• ‘Self healing’ asphalt concept;• 3D printed canalhouse and steel bridge;• Smart Highway.

Timmerhuis,Rotterdam
16

H1 2016 H2 2015 H1 2015 2015 FY
Total revenues 946 1.057 922 1.979Total revenues Infra NL 329 384 306 690Revenues loss making infra projects 30 40 45 85As % of Infra NL revenues 9% 10% 15% 12%Number of loss making infra projects 5 6 8 8
Underlying operating result -7 6 -11 -5Result of problem projects -15 -25 -10 -35
Underlying operating result excl loss making projects 8 31 -1 30
H1 2016 – highlights“Heijmans first half results: improved results in most sectors,completion loss-making projects Infra still strongly affects results”
• H1 revenues increased to € 946 mln (2015: € 922 mln);• Homes sold H1: 1,069 (2015: 746). Higher sales to investors for rental segment;• Underlying operating result improves, but still negative;• Improved results for Property Development / Residential Building, Non-Residential,
Belgium and Germany;• Infra: underlying improvement seen, results negatively impacted with € 15 mln by loss-
making projects Infra;
• Net result after taxes H1: -/- € 12 mln (2015: -/- € 15 mln); 17

Plein van Leiden
18

H1 2016 –highlights“Heijmans first half results: improved results in most sectors,completion loss-making projects Infra still strongly affects results”
• Order book increased due to contract wins for (a.o.) New Amsterdam Court House, Hartvan Zuid and RWZI Utrecht;
• Solvency ratio 25%;• Net debt at € 77 mln (H1 2015: € 108 mln).• New strategy plan Infra NL 2016-2019: ‘Focus, Discipline & Excellence’;• Innovation: first successes with sales of Heijmans ONE (58 sold) and BikeScout;• With GO! Programme continuous focus on safety: Continuing IF (Injury Frequency) rate at
3.3, decline compared to 2015, slight increased compared to Q1;• Refinancing completed, € 256 mln syndicated loan committed until mid 2018.
19

Smart Materials: ‘3D print’
20
Smart Energy: ‘Bright house’
Smart Space: ‘Heijmans One’ portable houseSmart Highway

Implementation new ERP Platform
• Successful deployed to +/- 3.900 employees (incl Infra, Group Departments, Residential);• To go: Non-Residential (Q4 2016) and Property Development (2017);• Proven project approach and timelines for completion that are proactive and realistic
(Initiated in 2011, Blueprint Q4 2012, start roll-out 2013). Now close to completion;• Generic processes based upon SAP Best Practices* (no to limited customization);• Invested TD: € 12 mln, limited to no impact on running IT costs (phase-out old systems);• Disciplined top-down roll-out with dedicated change management;• 2016 and beyond: to exploit and leverage contribution to “real” business value (enhance
performance, a more uniform organization, more efficient operation's, firm wideinformation for improved decision making, integrating CRM, Go / No Go decisions).
* Using industry-standard or industry-customized SAP processes & add-on tools only
Key changes:Integrated systemcentralized data managementData entry at source (orders,hours)Three way match, digital invoicing AP1 project structure, also for integrated projects
Objectives1. Strengthen Control2. Integrate Procurement3. Improve efficiency in back office processes
21

Hart van Zuid PPPRotterdam
22

DEVELOPMENTS PER SECTOR
PROPERTY DEVELOPMENT
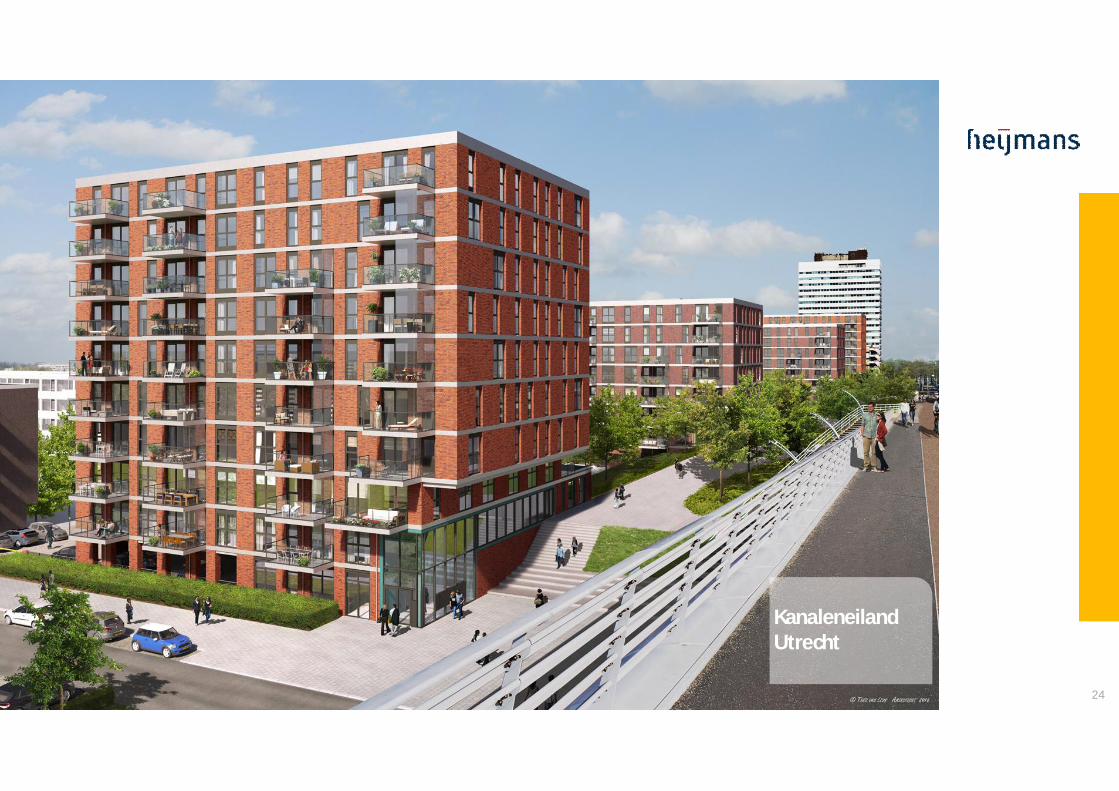
• Strong increase in revenues (34%) with small growth in operating margin;• Homes sold to 1,069 (2014: 746), especially within investors segment;• Average house price to private segment to € 249k (2015: € 229k);• Strong cash flow, capital invested is decreasing;• Very low inventory of houses unsold;• Challenge to match supply with strong demand, procurement prices are increasing
and potential delays due to capacity issues;• Interesting new projects, a.o. in Rotterdam (Hart van Zuid, Nieuw Kralingen,
Katendrecht) and Utrecht (Kanaleneiland).
x € 1 million H1 2016 H1 2015 2015Revenues 170 126 278Underlying operating result 6 4 9Underlying operating margin 3,5% 3,2% 3,2%Order book 275 280 284
23
Herbestemming GrootlabAmsterdamse Hogeschoolvoor de Kunsten
KanaleneilandUtrecht
24

Dutch Real estate market
25
Fundamentals have improved considerably since 2014 after 7 years of declining market:• In 2007, appr 80K houses were built, a figure that more than halved in 2013/2014• The Netherlands: appr. 17 mln inhabitants with 7,5 mln households;• CBS: # households to increase to 8,5 mln in 2045; on average with 50K annually until 2025;• Specific growth areas: Innercity development / transformation (mainly Randstad) and
affordable houses for 1-person households and starters;• Decreased housing prices, historically low interest rates, increased consumer confidence
and government policies (incl aanpak scheefwonen, capping tax deductibility interest) haveresulted in a strong demand from private buyers and investors;
• Several factors however still require strict risk management procedures:• Affordability of new houses for starters and young families, especially in cities;• Monetary policy uncertain, potential impact on interest rates;• Consumer confidence is still vulnerable;• Rental system still protective;• Challenge to meet high demand as capacity in whole supply chain
has decreased considerably during crisis years:» Government: delays in permit procedures and higher building aesthetics requirements;» Construction companies: prices going up due to increased demand for people and materials.
30%
10%
60%
Social housingPrivate rentalPrivate ownership
NB. Heijmans expectsdistribution to movetowards 60/20/20

Transformation GrootlabAmsterdam School of Arts
26

DEVELOPMENTS PER SECTOR
RESIDENTIAL
• Delay in start up of new projects has resulted in declining growth rate;• Revenues divided over the Netherlands (€ 152 mln) and Belgium(€ 56 mln);• High number of houses sold not yet in order book;• Upward price pressure of subcontractors;• Focus on growth with standardised products (Huismerk, Wenswonen);• Cooperation with CBRE Global Investors in Grauwaart district (Leidsche Rijn Utrecht);• First Heijmans ONE houses placed for Wonen Limburg, several follow up orders;• Transformation former Parool tower / Trouw building completed for Student Hotel;• Realisation of Wiener & Co (Amsterdam), Plein van Leiden, and Elisabeth Center
Antwerp on schedule.
x € 1 million H1 2016 H1 2015 2015Revenues 208 204 387Underlying operating result 2 3 6Underlying operating margin 1,0% 1,5% 1,6%Order book 386 392 421
27

Onderhoud en beheerministeries Veiligheid enJustitie, Binnenlandse Zaken enKoninkrijksrelaties
Lounge 2Schiphol Amsterdam
28

DEVELOPMENTS PER SECTOR
NON RESIDENTIAL
• Revenues lower as expected, selective acquisition approach maintained;• Positive trend of Services (installations) continues, now almost 50% of revenues;• Result slightly better than last year;• Strong order intake, especially New Amsterdam Court House and Hart van Zuid (both
PPP), order book shifting to long term contracts with maintenance obligations;• Lounge 2 Schiphol, DSM laboratory and Amsterdam High School completed;• Timmerhuis, National Military Museum and Ministries of Safety and Justice / Internal
Affairs in maintenance phase;• PPP Project RIVM / CBG delayed;• Restructuring completed, targeted headcount reduction (200 fte) and indirect costs
met.
x € 1 million H1 2016 H1 2015 2015Revenues 162 220 421Underlying operating result 0 -2 0Underlying operating margin 0,0% -0,9% 0,0%Order book 825 549 517
29

A12Veenendaal – Ede - GrijsoordA9 Gaasperdammerweg
Amsterdam
30

DEVELOPMENTS PER SECTOR
INFRA NETHERLANDS
• Approximately € 700 mln turnover, divided over:Ø Regional projects & Asset management ~40%Ø Specialties ~20%Ø Big Projects (Integral, Roads, Civils) ~40%
• Revenues increased, underlying performance improved due to good developmentwithin Regional projects and Asset management, but € 15 mln in additional lossesrecorded in several Big Projects;
• Number of loss-making projects decreased to 5, of which 2 with high risk profile;• Energiefabriek Tilburg in testing phase, but difficult progress: -/- € 8 mln in H1;• New orders rewarded for RWZI Utrecht and A27/A1;• A12 Veenendaal-Ede-Grijsoord PPP completed, A9 Gaasperdammerweg PPP on track.
x € 1 million H1 2016 H1 2015 2015Revenues 329 306 690Underlying operating result -15 -15 -26Underlying operating margin -4,6% -4,9% -3,8%Order book 787 879 834
31

A12Veenendaal – Ede - Grijsoord
32
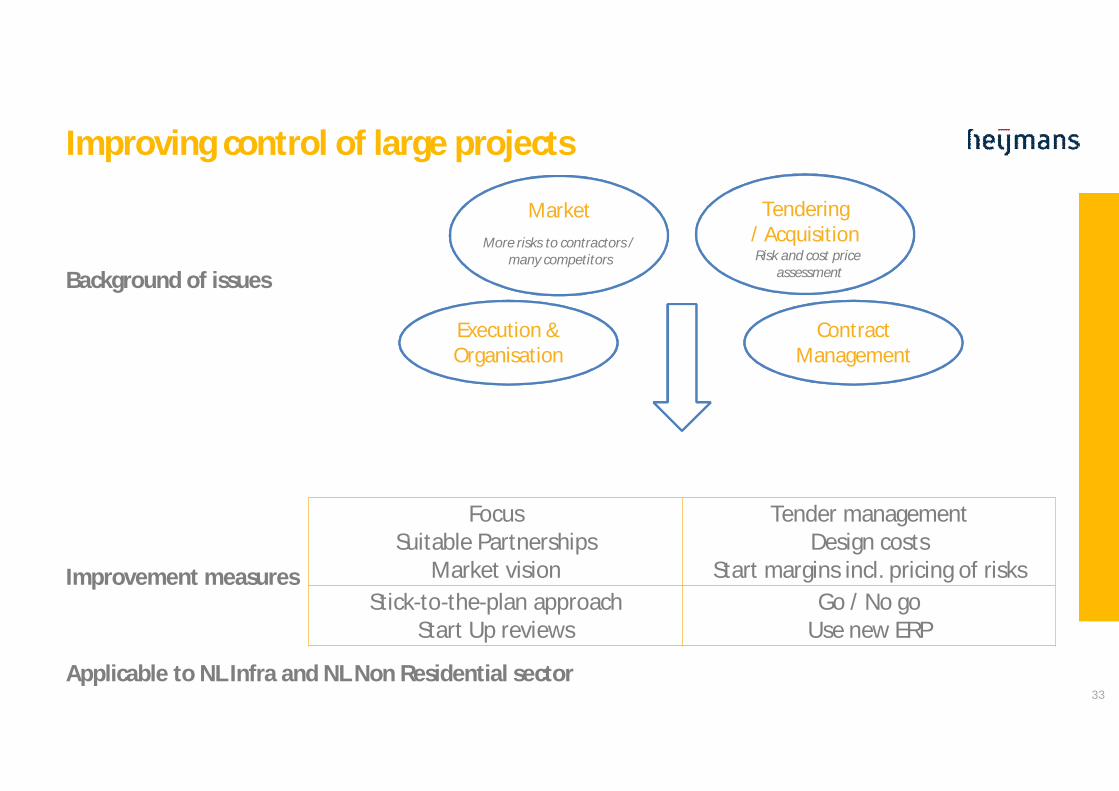
Improving control of large projects
Background of issues
Improvement measures
Applicable to NL Infra and NL Non Residential sector
ContractManagement
Execution &Organisation
Market Tendering/ Acquisition
FocusSuitable Partnerships
Market vision
Tender managementDesign costs
Start margins incl. pricing of risksStick-to-the-plan approach
Start Up reviewsGo / No go
Use new ERP
33
Risk and cost priceassessment
More risks to contractors /many competitors

Wilhelminakanaal,Tilburg
34

Strategy plan Infra Netherlands 2016 - 2019
• New board member appointed early 2016 with specific focus on Infra• Strategy Dutch infrastructure redefined mid 2016• Plan consists of 5 key elements for 2016 -2019:
1) Intensively managing and completing of current loss making projects2) Improving risk control
Measures, tools, systems, processes, rules, escalation proceduresStructural improvement should lead to more robust earnings profile
3) Tightened commercial / strategic focusFocus on core competences > stricter selection of projects and clients
4) Changing leadership culture and implementing effective organisation5) Realisation cost reduction
35
Overall goal: stable EBIT Margin of 2,5% - 3% in 2018

Elisabeth CenterAntwerpen (B)
36
DEVELOPMENTS PER SECTOR
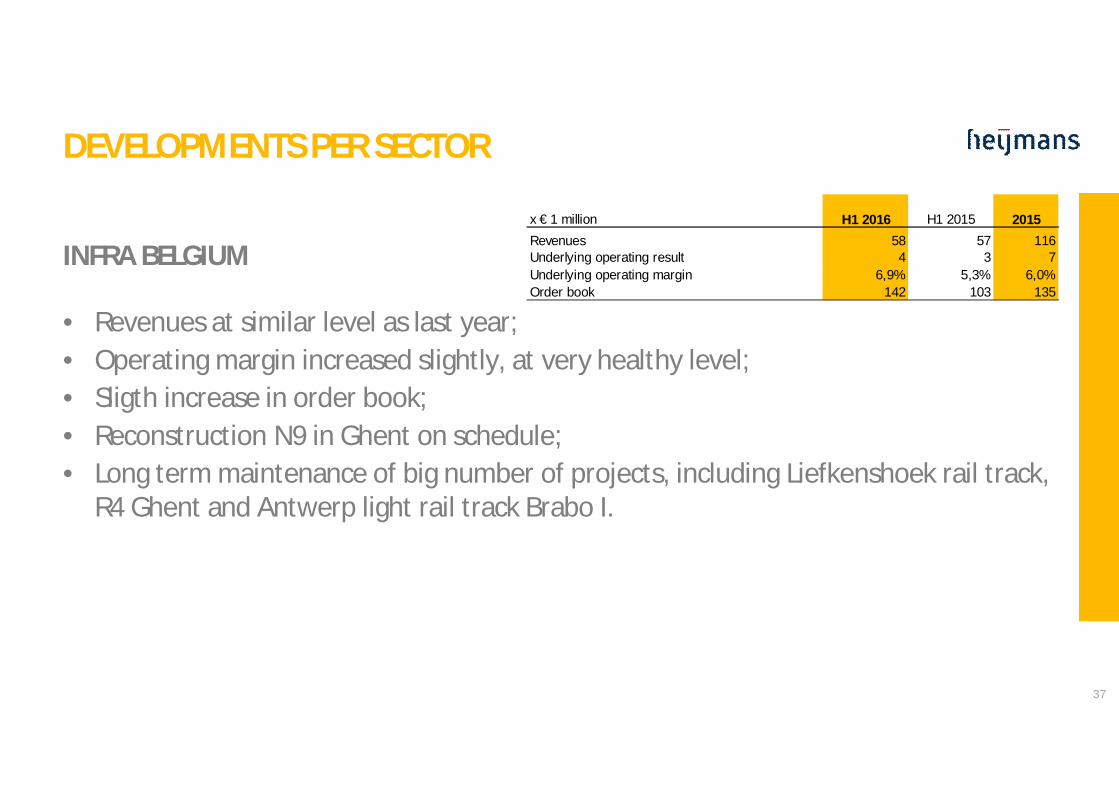
INFRA BELGIUM
• Revenues at similar level as last year;• Operating margin increased slightly, at very healthy level;• Sligth increase in order book;• Reconstruction N9 in Ghent on schedule;• Long term maintenance of big number of projects, including Liefkenshoek rail track,
R4 Ghent and Antwerp light rail track Brabo I.
x € 1 million H1 2016 H1 2015 2015Revenues 58 57 116Underlying operating result 4 3 7Underlying operating margin 6,9% 5,3% 6,0%Order book 142 103 135
37

OevermannErpho-BogenMünster (D)
38

DEVELOPMENTS PER SECTOR
INFRA GERMANY
• German infrastructure market is improving;• Revenues in line with last year;• Operating result has grown, especially due to better performance of Franki;• Effects of completed Oevermann restructuring noticeable;• Order book increased to € 178 mln;• Shopping center Mercaden Dorsten completed by Oevermann;• Franki has commenced with A7 tunnel Hamburg-Stellingen.
x € 1 million H1 2016 H1 2015 2015Revenues 126 126 319Underlying operating result 3 1 7Underlying operating margin 2,4% 0,8% 2,2%Order book 178 238 155
39

Wijnhavenkwartier,Den Haag
40
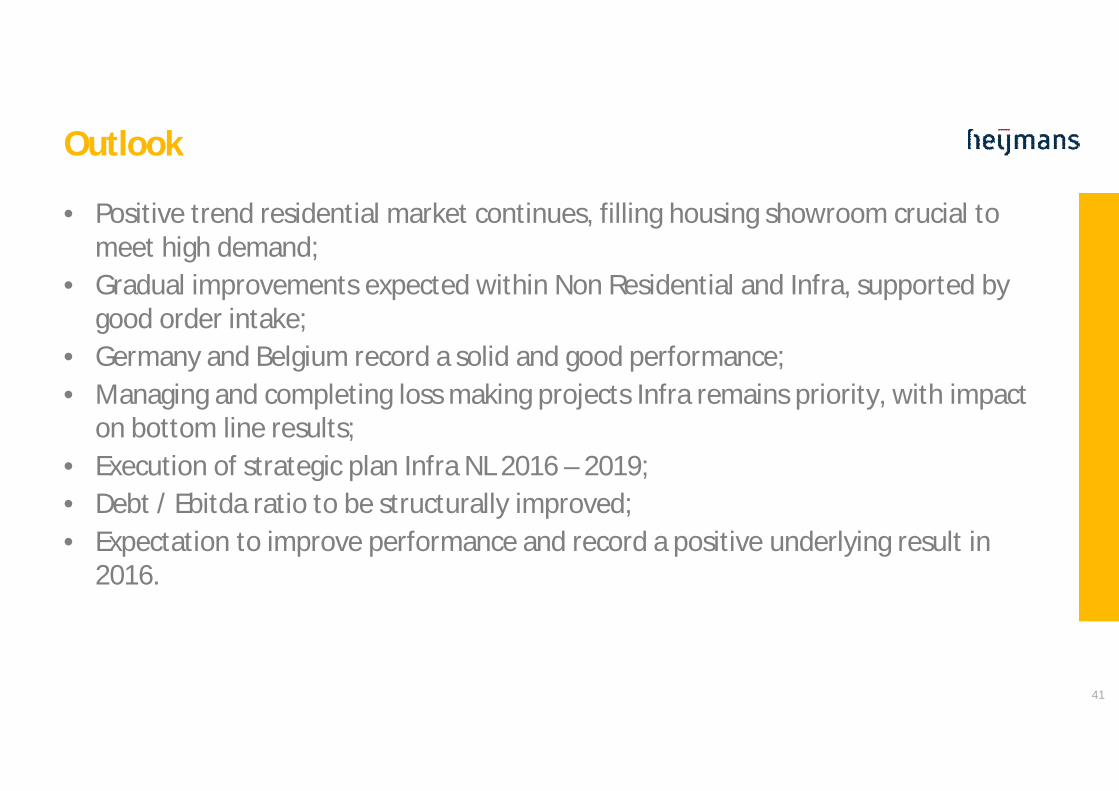
Outlook
• Positive trend residential market continues, filling housing showroom crucial tomeet high demand;
• Gradual improvements expected within Non Residential and Infra, supported bygood order intake;
• Germany and Belgium record a solid and good performance;• Managing and completing loss making projects Infra remains priority, with impact
on bottom line results;• Execution of strategic plan Infra NL 2016 – 2019;• Debt / Ebitda ratio to be structurally improved;• Expectation to improve performance and record a positive underlying result in
2016.
41
42
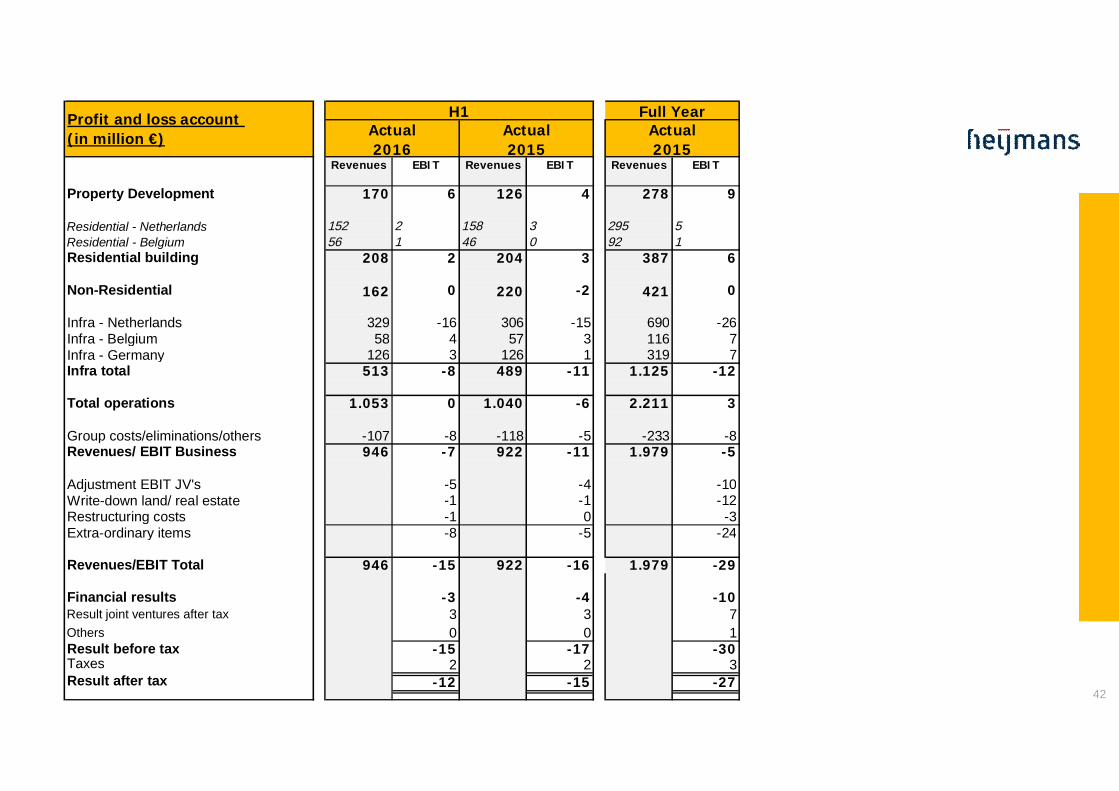
Revenues EBIT Revenues EBIT Revenues EBIT
Property Development 170 6 126 4 278 9
Residential - Netherlands 152 2 158 3 295 5Residential - Belgium 56 1 46 0 92 1Residential building 208 2 204 3 387 6
Non-Residential 162 0 220 -2 421 0
Infra - Netherlands 329 -16 306 -15 690 -26Infra - Belgium 58 4 57 3 116 7Infra - Germany 126 3 126 1 319 7Infra total 513 -8 489 -11 1.125 -12
Total operations 1.053 0 1.040 -6 2.211 3
Group costs/eliminations/others -107 -8 -118 -5 -233 -8Revenues/ EBIT Business 946 -7 922 -11 1.979 -5
Adjustment EBIT JV's -5 -4 -10Write-down land/ real estate -1 -1 -12Restructuring costs -1 0 -3Extra-ordinary items -8 -5 -24
Revenues/EBIT Total 946 -15 922 -16 1.979 -29
Financial results -3 -4 -10Result joint ventures after tax 3 3 7Others 0 0 1Result before tax -15 -17 -30Taxes 2 2 3Result after tax -12 -15 -27
Actual2016
H1 Full YearActual2015
Profit and loss account(in million €) Actual
2015

CASH FLOW STATEMENT(x € 1 million)
Operating result -15 -16 -29
Adjustments for:9 9 181 1 2
1 1 11
-15 -71 -21Change in other working capital -36 -11 46
-1 -2 -7
Cash flow from operating activities before interest and tax -56 -89 20
Interest paid/received -6 -7 -11Tax expense paid -4 0 0
Cash flow from operating activities -66 -96 9
Cash flow from investment activities -2 -2 -9
Cash flow from financing activities 21 89 51
Net cash flow in the period -47 -9 51
Cash and cash equivalents at 1 January 125 74 74
Cash and cash equivalents at the end of the period 78 65 125
Depreciation of property, plant and equipmentAmortisation of intangible assets
Change in work in progress
Change in non-current provisions
Adjustment of valuation of property investments and land portfolios,excluding joint ventures
YTD June 2016 YTD June 2015 FY 2015
43

Balance sheet and Financing
• Solvency solid at 25% (FY 2015: 26%)• Fixed (non current) assets base stable• Control net debt through strong focus on working capital (“Fit for cash”)• Reported net debt as per 30/6 of € 77 mln:
Ø € 80 mln drawn under Revolving Credit facilityØ € 45mln in cumulative preference shares (reduced from € 66 mln mid 2015)Ø € 41 mln in project finance arrangements / financial leases to be consolidated under IFRS 11Ø € 78 mln in cash (equivalents)Ø The majority of project finance arrangements on a non recourse (project assets) basis.Ø For recourse net debt, see Annex financial covenants
• Revolving Credit facilityØ Compliant with financial covenants (see Annex: financial covenants)Ø As of 1 April 2016, € 256 mln committed facility until 30 June 2018;Ø ICR to be tested on quarterly basis as of Q1, per Q4 2016 at level of 4;Ø Average leverage ratio to be tested as of Mid 2017;Ø Refinancing impacted by sector wide events;Ø Goal: to structurally improve debt / ebitda ratio.
44

x € 1 million
Non-current assetsProperty, plant and equipment 87 90 90Intangible assets 112 112 113Joint ventures and associates 77 77 74Other fixed assets 98 101 93
374 380 370Current assets
Strategic land portfolio 162 172 185Residential properties in preparation or under construction 58 76 87Other inventory 17 18 20Work in progress 153 152 149Trade and other receivables 313 267 294Cash and cash equivalents 78 125 65
781 810 800
1.155 1.190 1.170
245 266 274
Non-current liabilitiesInterest-bearing 134 103 155Non-interest-bearing 32 32 35
166 135 190
Interest-bearing loans and other current financing liabilities 21 32 18Trade and other payables 566 580 563Work in progress 134 148 95Other 23 29 30
744 789 706
1.155 1.190 1.170
Solvancy rate based on guarantee capital 25% 26% 29%
Net debt 77 10 108
Total assets
Equity and liabilities 30 June 2016 31 December 2015
Current liabilities
Total equity and liabilities
30 June 2015
Equity
Condensed consolidated statement of financial position
Assets 30 June 2016 31 December 2015 30 June 2015
45

Appendices
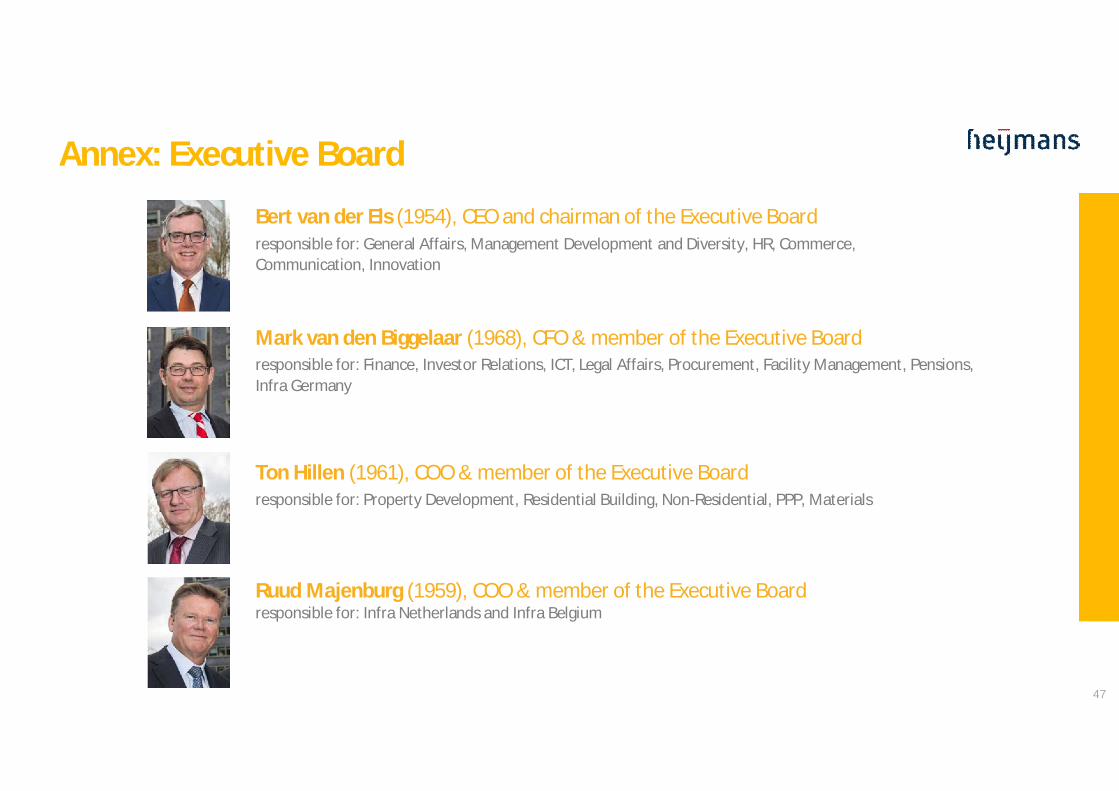
Bert van der Els (1954), CEO and chairman of the Executive Boardresponsible for: General Affairs, Management Development and Diversity, HR, Commerce,Communication, Innovation
Mark van den Biggelaar (1968), CFO & member of the Executive Boardresponsible for: Finance, Investor Relations, ICT, Legal Affairs, Procurement, Facility Management, Pensions,Infra Germany
Ton Hillen (1961), COO & member of the Executive Boardresponsible for: Property Development, Residential Building, Non-Residential, PPP, Materials
Ruud Majenburg (1959), COO & member of the Executive Boardresponsible for: Infra Netherlands and Infra Belgium
Annex: Executive Board
47

Services and maintenanceMinistry of Defense
48

Annex: Financial covenants
• Financial covenants were met MY ‘16:Ø Interest Cover: 3.6 (>3)Ø Leverage Ratio: 2.2 (<3)Ø To be tested quarterly resp. semi-
annuallyØ As of Mid 2017, introduction of average
leverage ratio• Accounting figures to be adjusted for
covenant calculations, including:Ø To add impact Joint Ventures that are no
longer consolidated after introduction ofIFRS 11
Ø To deduct impact of ringfenced (nonrecourse) project financings in relation toPFI/PPP activities
Ø To deduct impact of cumulativepreference shares
49
Financial Covenants
Amounts x € 1 million2016 MY 2015 FY 2015 MY
Interest bearing debt 155,5 135,1 173,4Minus: cash and cash equivalents 78,1 125,4 65,5Net debt 77,5 9,7 107,9Adjustments:Net debt Joint Ventures 88,8 75,5 70,7Net debt non recourse project finance -78,8 -80,8 -61,3Cumulative preference shares B -45,1 -45,1 -66,1Other -5,4 -4,0 0,9Net debt covenants (A) 36,9 -44,7 52,1Underlying operating result (including joint ventures) -1,5 -5,1 -7,2Depreciation and amortisation 18,6 19,1 21,8Underlying EBITDA 17,0 14,0 14,6Adjustments:Capitalised interest 2,6 2,9 2,4EBITDA non recourse projects -5,0 -1,7 -0,6Other 2,0 2,3 1,9EBITDA covenants (B) - 12 months rolling 16,6 17,4 18,3Net interest 10,5 11,1 9,5
Adjustments:Net interest joint ventures 2,4 3,1 3,5Interest cumulative preference shares B -3,6 -4,5 -5,2Net interest non recourse project financings -3,9 -3,7 -2,6Other -0,8 -3,2 -1,6Net interest covenants (C) - 12 months rolling 4,6 2,9 3,5
Leverage ratio (A/B) <3 2,2 -2,6 2,9Interest cover ratio (B/C) >3 3,6 6,0 5,1The interest cover ratio should at least be at the following levels:Q2 2016: > 3Q3 2016: > 3.5Q4 2016 (and beyond): > 4

50
Heijmans One,First houses sold andplaced in Limburg

1. Process and timing
2. Land positions
Overhoeks – Amsterdam
Bananenstraat Rotterdam
Noorderhaven Zutphen
Annex: Property development
51
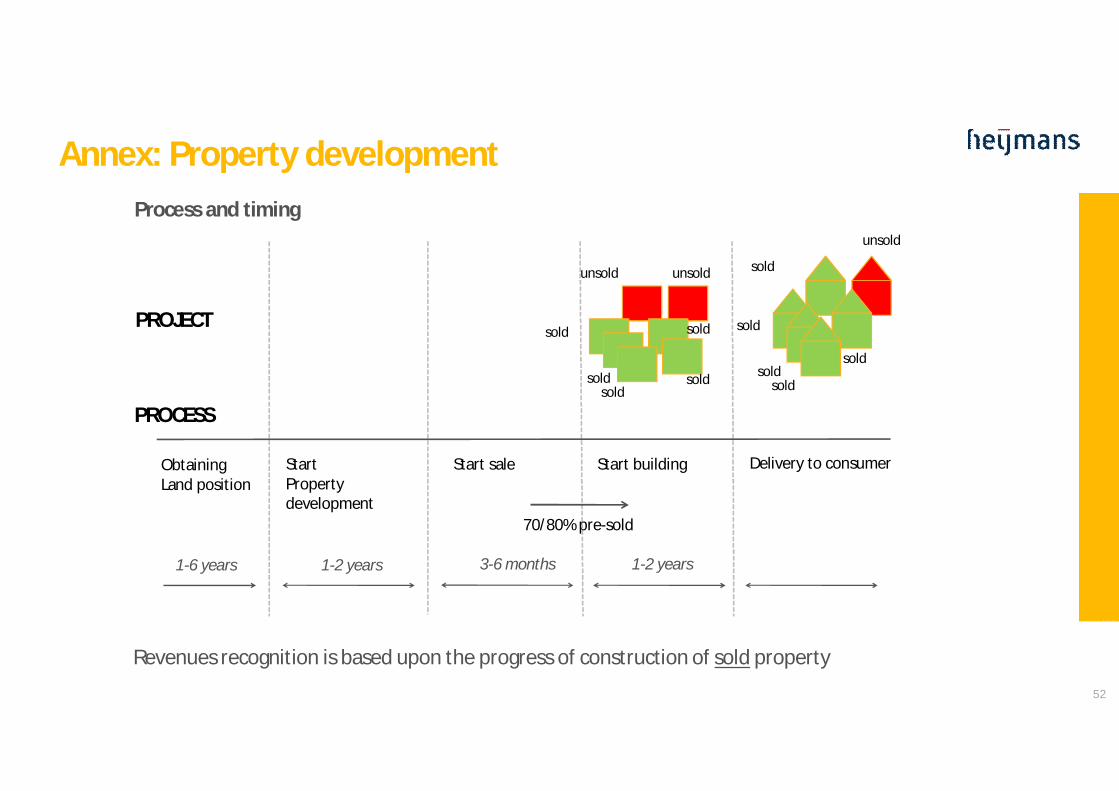
Start sale Start building Delivery to consumerStartPropertydevelopment
70/80% pre-sold
sold
sold
sold
unsold
sold
unsoldunsold
sold
sold
soldPROJECT
PROCESS
ObtainingLand position
1-2 years 3-6 months 1-2 years1-6 years
Revenues recognition is based upon the progress of construction of sold property
sold soldsold
Annex: Property developmentProcess and timing
52

Geographical spreadland positions(In millions, FY 2015)
• Individual valuation per position, tested periodically• € 1 million in impairments in H1 2016• Future land bank obligations declining steadily
Strategic positions 31-12-2015 30-6-2015 31-12-2014 30-6-2014(in millions euro)Brabant & Gelderland 3 4 4 4Northern provinces 14 16 17 21Randstad area 25 31 30 36Southern provinces 3 3 3 4Totals 45 54 54 65Land in exploitation 31-12-2015 30-6-2015 31-12-2014 30-6-2014(in millions euro)Brabant & Gelderland 57 57 57 66Northern provinces 6 7 7 9Randstad area 51 54 51 57Southern provinces 13 13 13 15Totals 127 131 128 147
Conditional obligations with limited cash impact
Conditional obligations with cash impact
Unconditional obligations 53

Fenix LoftsRotterdam Katendrecht
54

Policies and corporate philosophy gradually developed and implemented as from mid 2008:
• Compact set-up with direct reporting to Executivemanagement;
• Centralised organisation model: Heijmans acts inthe market as ‘One Company’;
• Centralised tender management. Directinvolvement executive management;
• Centralised procurement;• Senior management bonus system based on
corporate goals;• Periodic review meetings for businesses and
(relevant) projects. Also in execution phase tomonitor project start up and stick to the planapproach;
• ‘Best in class’ project reporting providing goodinsight on project opportunities as well as risks,specific issues, cash flow and progress. Furtherimprove uniformity;
• Uniform risk classification for all projects into threecategories. Direct involvement from Executive boardin large and complex projects in all phases;
• Culture of openness on project performance. Issuesto be escalated as soon as possible to enableeffective follow-up and support;
• High level of attention for cash management on alllevels in the organisation (“Fit for cash” program);
• Implementation of uniform ERP landscape.Objective to improve control & efficiency;
• Balance limitations of project size (over time) versuscapacity. Partnering where required;
• Simplified legal structure with limited nr. of entitiesand managing directors > a.o. integration of Dutchinfrastructure companies into one Heijmans Infra
Annex: Risk Management
55

FrankiHammer Strasse,Hamburg (D)
56

• At t = 0 (for example in the final design stage), 10 mln should be deducted from future profits. The next twoyears of turnover will not contribute any gross margin
• At t = 1, 50% of the gross profit is already recognized in the previous year. EUR 5 mln should be deducted fromfuture profits (in year 2 no gross margin contribution) and EUR 5 mln should be recorded as loss in the P&L
• At t=2 (just before completion) almost all gross profit has already been recognized as profits in previous year.The setback should be recorded as financial loss in year 2
Progress in time
Annex: IFRS % of completion method
57
Progress production
50%
100%
T=2T=1
• Direct costing applied, i.e. the grossmargin is recognized on the basis of thepercentage of completion method.
• In this method, 50% of the gross profitis recognized half way the project, and100% at completion.
• Suppose a EUR 100 mln with 10% grossmargin and a 2 year constructionperiod.
• What happens if a setback of EUR 10mln is discovered?

We are building the spatialcontours of tomorrow
58

Project images in this handoutSlide Project Location Segment
Front New Amsterdam Court House PPP Amsterdam Non Residential2 A4 Motorway Delft-Schiedam Infra6 Eemskwartier Groningen Property Development
6 Meijster’s Buiten Utrecht Property Development
6 Luggage Hall Eindhoven Airport Non-residential6 Technical University Eindhoven Non-residential
6 N23 Westfrisiaweg Province of North Holland Infra6 Water sewage plant RWZI Utrecht Infra10 A27 / A1 PPP Utrecht - Eemnes Infra12 National Military Museum Soesterberg Non-residential16 Het Timmerhuis Rotterdam Property Development18 Plein van Leiden Leiden Residential22 Hart van Zuid PPP Rotterdam Non Residential / Property Development24 Kanaleneiland Utrecht Property Development / Residential26 Transformation Amsterdam School of Arts Amsterdam Residential28 Lounge 2 Schiphol Airport Non-residential30 A9 Gaasperdammerweg PPP Amsterdam Infra32 A12 Motorway PPP Ede-Veenendaal-Grijsoord Infra34 Wilhelminakanaal Tilburg Infra36 Elisabeth Center Antwerp (Be) Non-residential Belgium38 Erpho-Bogen Muenster (De) Infra Germany (Oevermann)40 Wijnhavenkwartier Den Haag Property Development / Residential48 Services / maintenance Ministry of Defense 19 locations Non-residential50 Heijmans One Replaceable Heijmans Technology / Residential51 Overhoeks Amsterdam Property Development51 Bananenstraat Rotterdam Property Development / Residential51 Noorderhaven Zutphen Property Development / Residential54 Fenix Lofts Rotterdam Katendrecht Property Development / Residential56 Hammerstrasse Hamburg (De) Infra Germany (Franki) 59

This presentation has been prepared by and is the responsibility of Heijmans N.V. This presentation is being supplied to you solely for your information and use. The information may not be furtherdistributed or passed on to other people or published or reproduced in whole or in part. The information may be subject to updating, completion, revision and amendment and such informationmay change materially.
This presentation contains certain forward-looking statements relating to the business, financial performance and results of the Heijmans N.V. and the industry in which it operates. Thesestatements are based on Heijmans N.V.'s and its management's current plans, estimates and projections, as well as its expectations of external conditions and events. In particular the words“expect”, “anticipate”, “predict”, “estimate”, “project”, “plan”, “may”, “should”, “would”, “will”, “intend”, “believe” and similar expressions are intended to identify forward looking statements.Forward-looking statements are statements of future expectations that are based on current expectations and assumptions and involve known and unknown risks and uncertainties that couldcause actual results, performance or events to differ materially from those expressed or implied in these statements. Neither Heijmans N.V. nor any of its subsidiaries undertake any obligation topublicly update or revise any forward-looking statement as a result of new information, future events or other information.
No representation or warranty, express or implied, is or will be made by Heijmans N.V., its advisors or any other person as to the accuracy, completeness or fairness of the information or opinionscontained in the presentation and any reliance you place on them will be at your sole risk. Without prejudice to the foregoing, neither Heijmans N.V., its associates, its advisors, nor itsrepresentatives accept any liability whatsoever for any loss howsoever arising, directly or indirectly, from the use of this presentation or its contents or otherwise arising in connection with thispresentation. The presentation does not constitute or form part of, and should not be constructed as, an offer or invitation to subscribe for or purchase any securities.
HEIJMANS N.V. CONTACT:PO Box 2 Guido Peters5240 BB Rosmalen, The Netherlands Investor Relations Heijmanswww.heijmans.nl +31 73 543 5482http://twitter.com/HeijmansNL [email protected]
Disclaimer