roberto leon 1, tiziano perea 1, jerome hajjar 2 and mark ...jfhajjar/cft/downloads/leon et al. --...
TRANSCRIPT
1
DETERMINATION OF BUCKLING LOADS FROM TRIAXIAL LOAD TESTS OF SLENDER CONCRETE-FILLED TUBE BEAM-COLUMNS
Roberto Leon1, Tiziano Perea1, Jerome Hajjar2 and Mark Denavit2
ABSTRACT
This paper briefly describes efforts at determining buckling loads of slender concrete-filled tube beam-columns. Although utilizing state-of-the-art equipment and controllers, unexpected difficulties were encountered on extracting buckling loads for the specimens due to (a) frictional forces in the actuators, (b) large initial bidirectional imperfections, (c) initial stresses due to construction and (d) correlating data from different sensors. In addition, the complex load histories used required that all of these phenomena be carefully accounted for in all the simulation studies. Successful extraction of buckling loads required that behavior of the loading system be characterized through integration of data from different sensors and simulations using stiffness and displacements obtained directly from the test. Calibration of advanced simulation tools well into the late stages of the load history have also been preliminary documented.
INTRODUCTION
Composite concrete-steel beam-columns are known as being one of the toughest and most efficient structural members for use in seismic design. In developing design provisions for such composite columns for the 2005 Specification for Structural Steel Buildings (AISC, 2005), the senior authors noted that databases contained few if any tests on slender composite beam-columns (Leon at. al, 2007; Leon and Hajjar, 2008). To address this deficiency in the short term and from the design standpoint, the Specification assumed that slender composite beam-column could be modeled as steel sections with an equivalent moment of inertia. In the longer term, the authors proposed and have carried out a series of advanced tests on 18 circular and rectangular concrete-filled (CFT) slender columns to address a number of outstanding issues, the principal one being how the stiffness of the members evolves with different combinations of axial loads and moments. In this test series, a number of the columns were so slender as to challenge the capabilities of the advanced control systems and loading fixtures used. This paper carefully describes the test series and the initial attempts at extracting the correct buckling loads. Characterizing this fundamental behavior is a key to the calibration of mixed-formulation models that can be used to properly model the performance of these beam-columns in real structures.
1 School of Civil and Environmental Engineering, Georgia Tech; Atlanta ,GA 2 Dept. of Civil and Environmental Engineering, University of Illinois, Urbana-Champaign, IL
2
EXPERIMENTAL PROGRAM
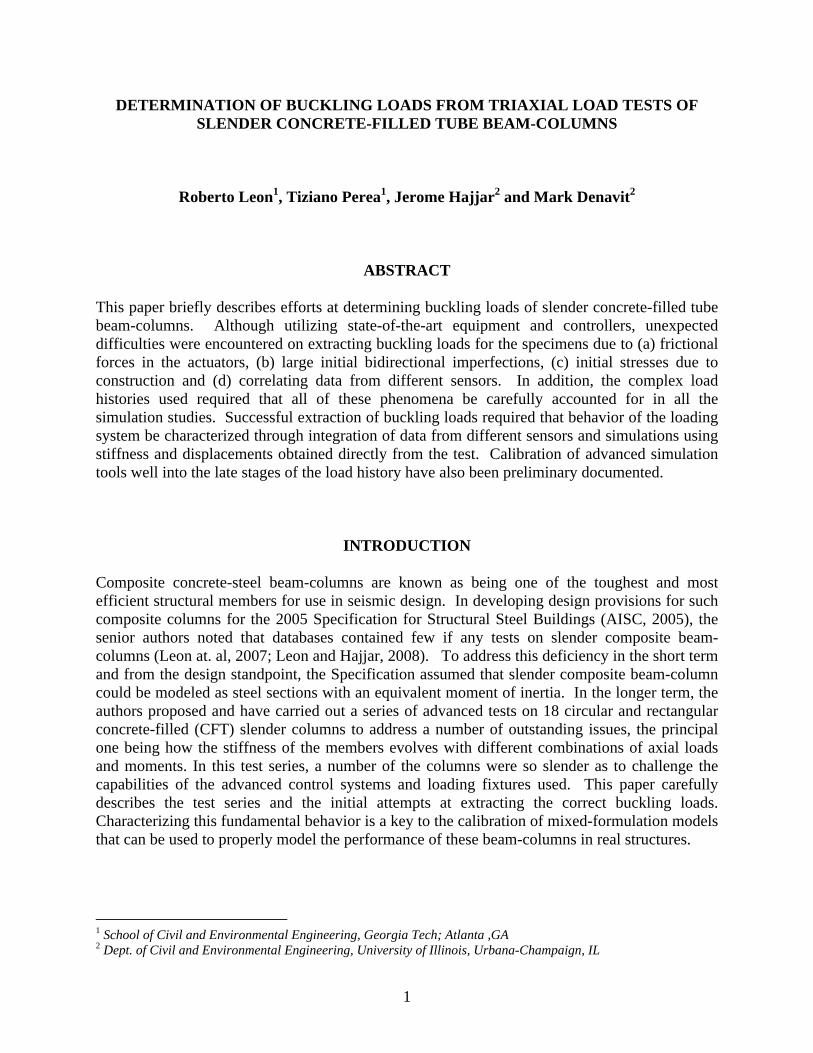
Test Specimens The test matrix selected for these tests aims to fill gaps found in the available experimental databases (Leon et al., 2005; Goode et al., 2006). Eighteen specimens with different steel tube shapes, width-thickness ratios (h/t, D/t) and lengths (L), and filled with normal and high strength concrete were constructed. The test matrix is shown in Table 1 along with the nominal material strengths. The 2005 Specification allows a maximum D/t of 103.6 for circular tubes and a maximum h/t of 56.7 for rectangular tubes, so some of the larger tubes shown in Table 1 are very near or above those limits. Details of a typical specimen are shown in Figure 1.
Table 1 – Test matrix Specimen L Steel section Fy fc’ D/t name (ft) HSS D x t (ksi) (ksi) C5-18-5 18 HSS5.563x0.134 42 5 45 C12-18-5 18 HSS12.75X0.25 42 5 55 C20-18-5 18 HSS20x0.25 42 5 86 Rw-18-5 18 HSS20x12x0.25 46 5 67 Rs-18-5 18 HSS20x12x0.25 46 5 67 C12-18-12 18 HSS12.75X0.25 42 12 55 C20-18-12 18 HSS20x0.25 42 12 86 Rw-18-12 18 HSS20x12x0.25 46 12 67 Rs-18-12 18 HSS20x12x0.25 46 12 67 C12-26-5 26 HSS12.75X0.25 42 5 55 C20-26-5 26 HSS20x0.25 42 5 86 Rw-26-5 26 HSS20x12x0.25 46 5 67 Rs-26-5 26 HSS20x12x0.25 46 5 67 C12-26-12 26 HSS12.75X0.25 42 12 55 C20-26-12 26 HSS20x0.25 42 12 86 Rw-26-12 26 HSS20x12x0.25 46 12 67 Rs-26-12 26 HSS20x12x0.25 46 12 67 C5-26-12 26 HSS5.563x0.134 42 12 45
The specimens were fabricated from A500 Grade B material. Actual yield strengths measured from coupon tests ranged from 46.1 to 55.6 ksi and 53.0 to 53.9 ksi for the circular and rectangular tubes, respectively. The infill concrete was self-consolidating (SCC). The compression strength for the lower strength mix (5 ksi) ranged from 5.5 to 8.9 ksi from cylinder tests conducted at the time of testing. The strength for the higher strength mix (12 ksi), which contained silica fume and fly ash, ranged from 11.3 to 13.8 ksi at time of testing. Thick plates were welded at either end of the specimen (Figure 1). The thicker bottom plate connected the specimen to the strong floor (to simulate a fixed base) and the thinner top plate to the crosshead (simulating a roller, pinned or fixed condition). Finite element analyses were conducted to check the strength of the base plates, the welds and the entre connection.
3
Figure 1 – Typical test specimen (Group of C20)
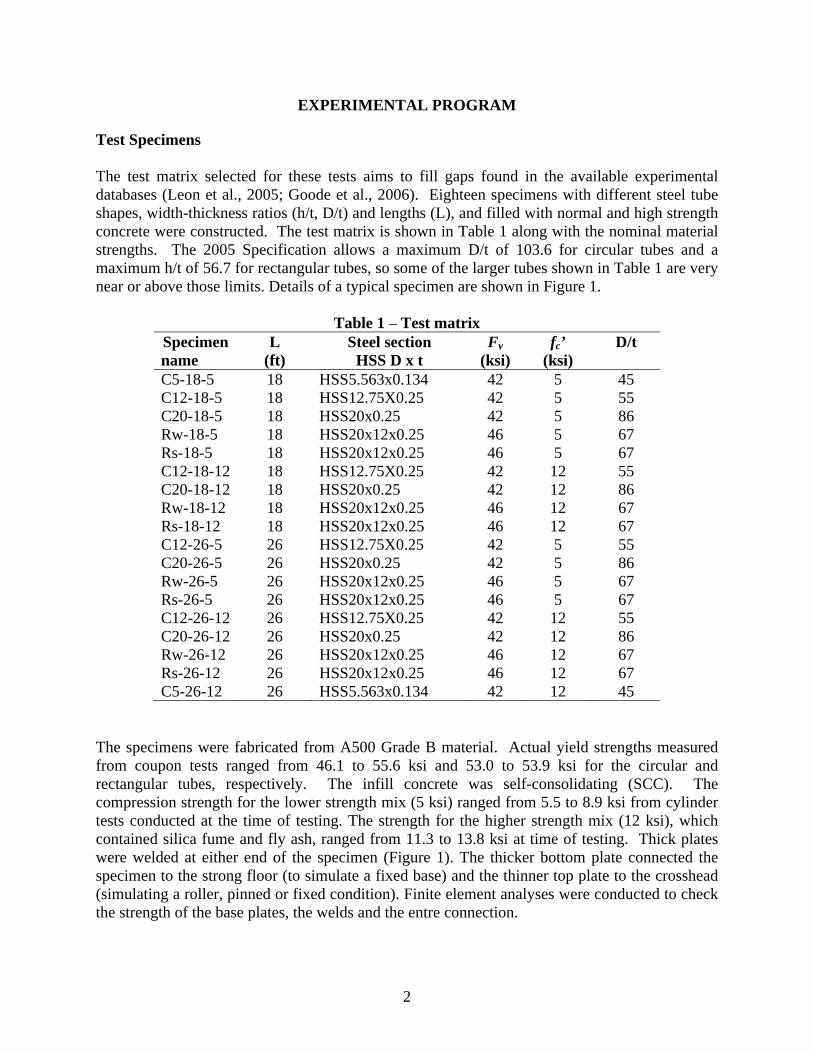
Testing Apparatus These full-scale specimens were conducted on the Multi-Axial Sub-assemblage Testing (MAST) laboratory, a NEES facility at the University of Minnesota. The MAST system (Figure 2), built by MTS Corporation, consist of a stiff steel crosshead connected to 4 vertical actuators (with a load capacity of 330 kips and stroke of ±20 inches each) and 2 actuators in each horizontal axis (with a load capacity of 220 kips and stroke of ±20 inches each). All of the actuators are pin-pin connected, with the cross-head free-floating, giving the MAST system the capability of controlling the top 6 DOFs with a maximum capacity of Pz=1320 kips in vertical force, Fx=Fy=440 kips in shear, and a maximum stroke of ±20 in for horizontal and vertical displacements. The vertical opening of the MAST system can be adjusted between 18 and 28 feet. The MTS controller is very similar to those used to control a 6 DOF shake table installation.
(a) MAST system (b) Specimen 3C20, 18 ft (c) Specimen 11C20, 26 ft
Figure 2 – MAST system and CFT specimens
4
Instrumentation The specimens were extensively instrumented with redundant measuring systems in order to characterize the moment-curvature behavior of the critical cross-sections near the bottom of the specimens. In addition, as the specimens were designed to be loaded primarily as fixed-free cantilever columns in order to increase their slenderness, a large number of displacement transducers were used to track lateral deformations. The primary aim of the tests was to track the changes in effective stiffness along the length of the beam-column as the loading progressed. Thus arrays of strain gages, LVDTs and LEDs for a Metris K600 DDM laser system were placed at close intervals near the critical sections. The instrumentation was also designed to limit the loss of data due to the local buckling that was expected to form at the latter stages of the testing. Typical channel counts included 8 loads cells, 18 LVDTs, 5 string pots, 30 strain gages and 40 LEDs. In addition, extensive video and photographic data was collected. Load Histories The CFT specimens were subjected to a complex load protocol consisting of several distinct load cases (LC), each intended to addresses the main objectives of the test series: • Buckling load of the CFT columns accounting for the effectiveness of the composite stiffness
on the stability effects with given boundary conditions. This was LC1, which applied incremental compression through vertical displacement control (with all the other DOFs at the top set to zero load) until instability arose.
• Determination of the maximum flexural capacity under different gravity conditions to allow the construction of P-M interaction diagram for CFT beam-columns. This was LC2, in which increasing cyclic unidirectional lateral displacements were applied under constant gravity force until the peak and softening were found. These tests were repeated at multiple axial load levels.
• Evaluation of the concrete confinement, the progression of steel local buckling and its effects on the composite stiffness, ductility and strength degradation. This was LC3, where multidirectional lateral displacements with constant gravity force were applied. Several displacement patterns, including “diamond” and “figure 8” shapes were used.
• Evolution of the flexural (EIeff) and torsional (GJeff) stiffness. This was LC4 in which monotonic uniaxial or biaxial displacements to the maximum system stroke were applied. This was followed in several specimens by twisting to obtain data on torsional performance.
Initial Test Configuration The pretest setup in the CCFT specimens for each tests had the following sequence: • Columns were instrumented and strains monitored during casting to measure the effects of
the wet concrete; appreciable bulging near the bottom was evident for the RCFTs. • The cured specimen was loosely bolted to the floor just outside its final intended location
(center of the MAST system), the crosshead was moved above the specimen, the specimen was loosely bolted to the crosshead, the base connection released and the crosshead used as a crane to move the specimen to the center position.
• The base plate was loosely connected to the strong floor at its final intended position, the top bolts released, and the connecting threaded rods at the bottom tensioned to 60% of their yield stress to insure that no plate uplift could occur for cases of low axial force.
• The out-of-plumbness and the out-of-straightness with respect to the X and Y axes were measured using both a plum bob and a theodolite. Initial imperfections for the column, which often were in excess of L/500; this was not surprising as the columns were very long.
• Offsets for crosshead forces were taken. With all the instrumentation connected to the DAQ, data started being recorded with offsets for the crosshead forces only. At the starting point,
5
the crosshead forces and moments were zero, with some noise level (Fz ≈ ± 0.32 kip, Fx = Fy ≈ ± 0.11 kip, Mx = My ≈ ± 2.2 kip-ft, Mz ≈ ± 2.9 kip-ft).
• Final connection and tensioning of the top plate to the crosshead. Threaded rods were tensioned until 60% of the yield stress was reached. The connection process created forces and moments that were monitored and recorded.
• Removal of the forces and moments induced during the connection. The crosshead was moved until the system came back to the initial state of zero forces and moments. The data taken during this process was named LC0 and served as the baseline for the test.
• Rest of the offsets taken. Once in the initial state, offsets for the crosshead position and offsets for the entire instrumentation were taken. Initial strains from the gages and relative displacements from the LVDTs were then set to zero within the resolution range.
EXPERIMENTAL RESULTS FOR THE GROUP C20 DURING LC1
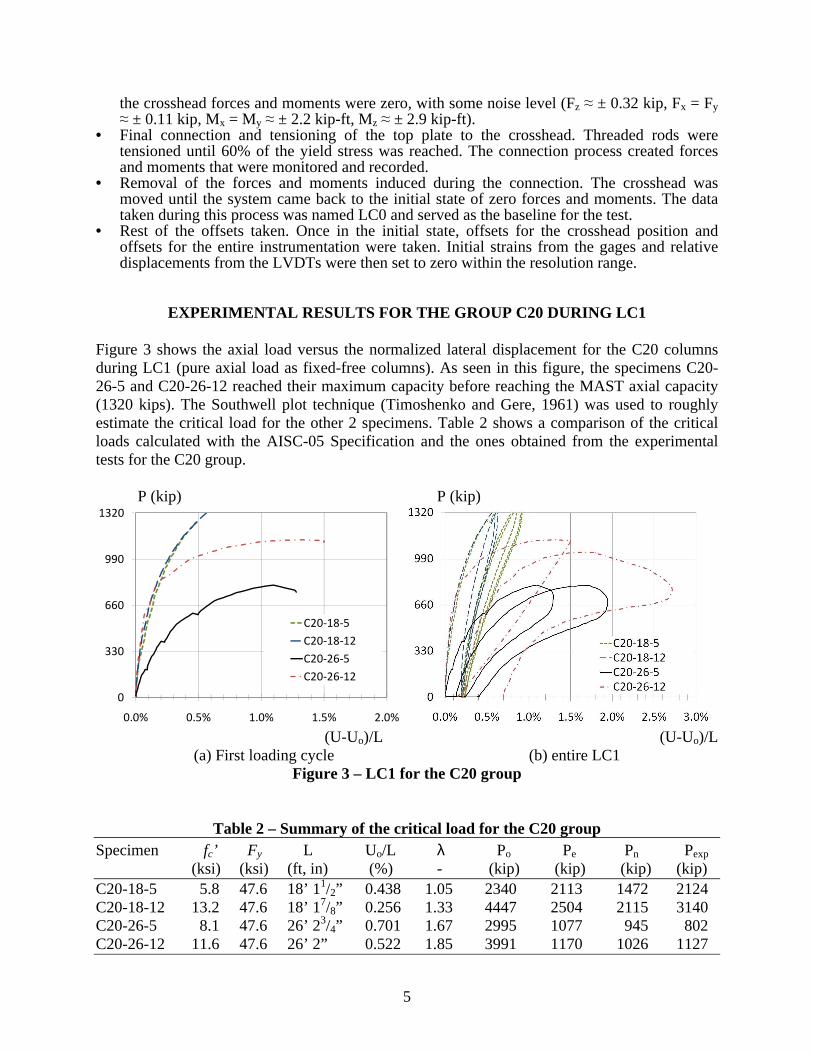
Figure 3 shows the axial load versus the normalized lateral displacement for the C20 columns during LC1 (pure axial load as fixed-free columns). As seen in this figure, the specimens C20-26-5 and C20-26-12 reached their maximum capacity before reaching the MAST axial capacity (1320 kips). The Southwell plot technique (Timoshenko and Gere, 1961) was used to roughly estimate the critical load for the other 2 specimens. Table 2 shows a comparison of the critical loads calculated with the AISC-05 Specification and the ones obtained from the experimental tests for the C20 group. P (kip) P (kip)
(U-Uo)/L (U-Uo)/L
(a) First loading cycle (b) entire LC1 Figure 3 – LC1 for the C20 group
Table 2 – Summary of the critical load for the C20 group Specimen fc’ Fy L Uo/L λ Po Pe Pn Pexp (ksi) (ksi) (ft, in) (%) - (kip) (kip) (kip) (kip) C20-18-5 5.8 47.6 18’ 11/2” 0.438 1.05 2340 2113 1472 2124 C20-18-12 13.2 47.6 18’ 17/8” 0.256 1.33 4447 2504 2115 3140 C20-26-5 8.1 47.6 26’ 23/4” 0.701 1.67 2995 1077 945 802 C20-26-12 11.6 47.6 26’ 2” 0.522 1.85 3991 1170 1026 1127
0
330
660
990
1320
0.0% 0.5% 1.0% 1.5% 2.0%
C20-18-5
C20-18-12
C20-26-5
C20-26-12
6
200 400 600 800 1000 1200 1400 1600 1800 20000
0.5
1
200 400 600 800 1000 1200 1400 1600 1800 20000
2
4
6
200 400 600 800 1000 1200 1400 1600 1800 2000
-2
-1
0
1
200 400 600 800 1000 1200 1400 1600 1800 2000
-5
0
5
200 400 600 800 1000 1200 1400 1600 1800 2000
-1000
-500
0
P/Pmax
U/Umax
Ux
Uy
Fx
Fy
My
Mx
North
SouthEast
Differences between the critical values were expected due to the following reasons: • Effective stiffness. The equivalent stiffness (EIeff) as calculated in the AISC-05 is an
approximation of the “true” effective stiffness. Even though the AISC equations give considerable credit to the circular sections due to confinement, significant differences were expected in the CFTs buckling capacity due to this parameter.
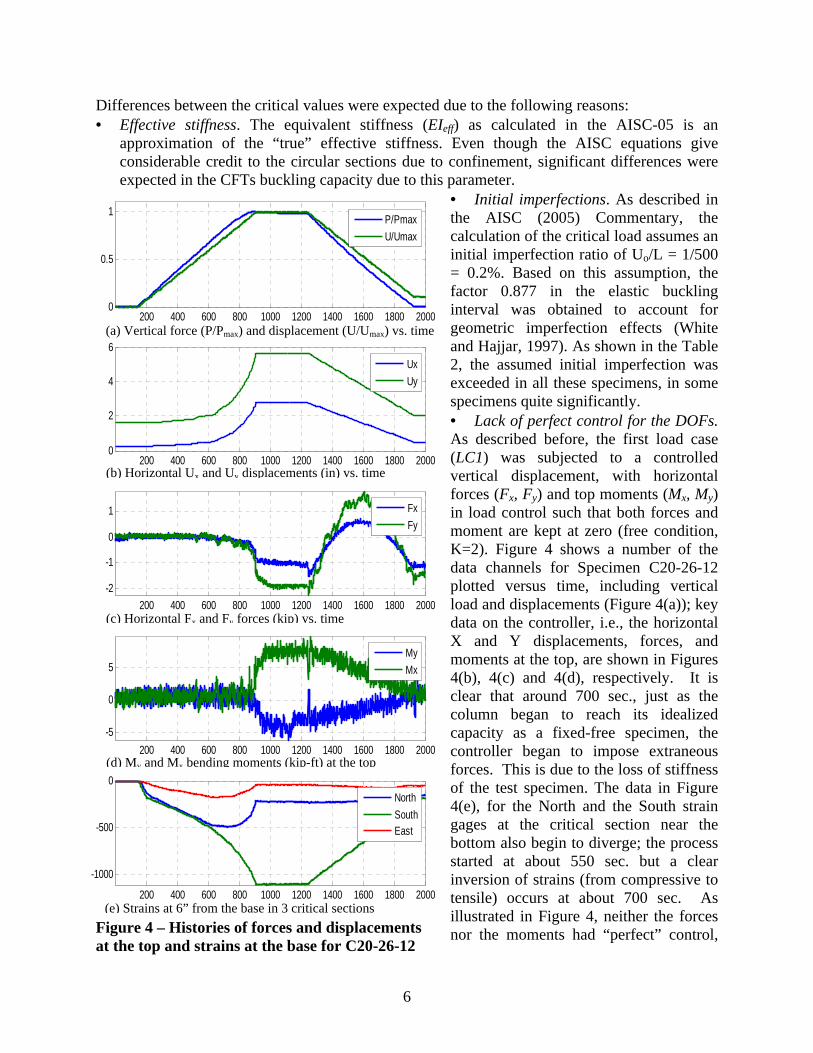
• Initial imperfections. As described in the AISC (2005) Commentary, the calculation of the critical load assumes an initial imperfection ratio of Uo/L = 1/500 = 0.2%. Based on this assumption, the factor 0.877 in the elastic buckling interval was obtained to account for geometric imperfection effects (White and Hajjar, 1997). As shown in the Table 2, the assumed initial imperfection was exceeded in all these specimens, in some specimens quite significantly. • Lack of perfect control for the DOFs. As described before, the first load case (LC1) was subjected to a controlled vertical displacement, with horizontal forces (Fx, Fy) and top moments (Mx, My) in load control such that both forces and moment are kept at zero (free condition, K=2). Figure 4 shows a number of the data channels for Specimen C20-26-12 plotted versus time, including vertical load and displacements (Figure 4(a)); key data on the controller, i.e., the horizontal X and Y displacements, forces, and moments at the top, are shown in Figures 4(b), 4(c) and 4(d), respectively. It is clear that around 700 sec., just as the column began to reach its idealized capacity as a fixed-free specimen, the controller began to impose extraneous forces. This is due to the loss of stiffness of the test specimen. The data in Figure 4(e), for the North and the South strain gages at the critical section near the bottom also begin to diverge; the process started at about 550 sec. but a clear inversion of strains (from compressive to tensile) occurs at about 700 sec. As illustrated in Figure 4, neither the forces nor the moments had “perfect” control,
Figure 4 – Histories of forces and displacements at the top and strains at the base for C20-26-12
(a) Vertical force (P/Pmax) and displacement (U/Umax) vs. time
(b) Horizontal Ux and Uy displacements (in) vs. time
(c) Horizontal Fx and Fy forces (kip) vs. time
(d) My and Mx bending moments (kip-ft) at the top
(e) Strains at 6” from the base in 3 critical sections
7
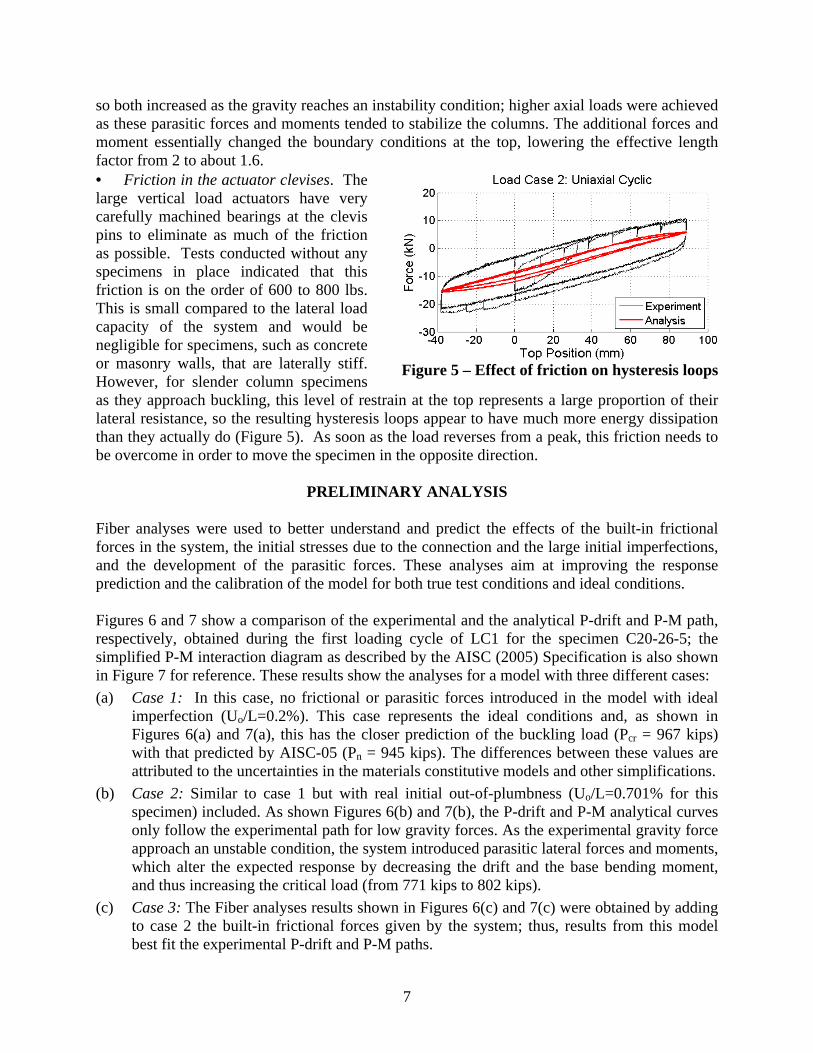
so both increased as the gravity reaches an instability condition; higher axial loads were achieved as these parasitic forces and moments tended to stabilize the columns. The additional forces and moment essentially changed the boundary conditions at the top, lowering the effective length factor from 2 to about 1.6. • Friction in the actuator clevises. The large vertical load actuators have very carefully machined bearings at the clevis pins to eliminate as much of the friction as possible. Tests conducted without any specimens in place indicated that this friction is on the order of 600 to 800 lbs. This is small compared to the lateral load capacity of the system and would be negligible for specimens, such as concrete or masonry walls, that are laterally stiff. However, for slender column specimens as they approach buckling, this level of restrain at the top represents a large proportion of their lateral resistance, so the resulting hysteresis loops appear to have much more energy dissipation than they actually do (Figure 5). As soon as the load reverses from a peak, this friction needs to be overcome in order to move the specimen in the opposite direction.
PRELIMINARY ANALYSIS
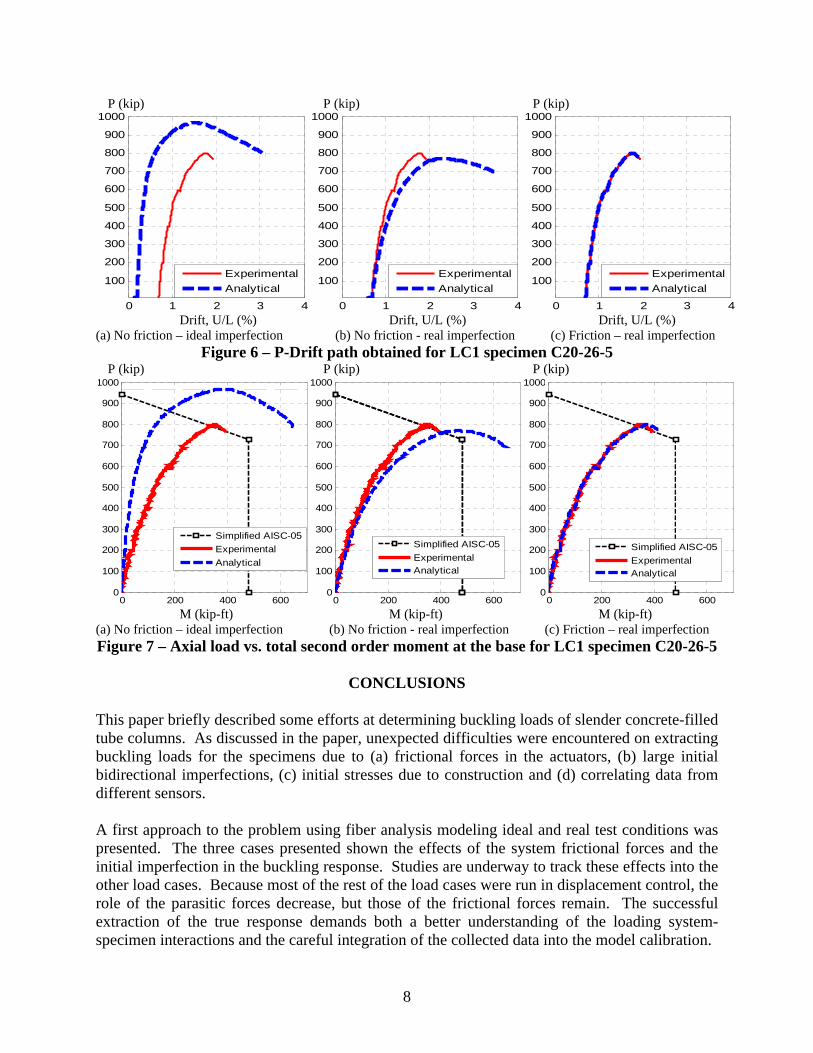
Fiber analyses were used to better understand and predict the effects of the built-in frictional forces in the system, the initial stresses due to the connection and the large initial imperfections, and the development of the parasitic forces. These analyses aim at improving the response prediction and the calibration of the model for both true test conditions and ideal conditions. Figures 6 and 7 show a comparison of the experimental and the analytical P-drift and P-M path, respectively, obtained during the first loading cycle of LC1 for the specimen C20-26-5; the simplified P-M interaction diagram as described by the AISC (2005) Specification is also shown in Figure 7 for reference. These results show the analyses for a model with three different cases:
(a) Case 1: In this case, no frictional or parasitic forces introduced in the model with ideal imperfection (Uo/L=0.2%). This case represents the ideal conditions and, as shown in Figures 6(a) and 7(a), this has the closer prediction of the buckling load (Pcr = 967 kips) with that predicted by AISC-05 (Pn = 945 kips). The differences between these values are attributed to the uncertainties in the materials constitutive models and other simplifications.
(b) Case 2: Similar to case 1 but with real initial out-of-plumbness (Uo/L=0.701% for this specimen) included. As shown Figures 6(b) and 7(b), the P-drift and P-M analytical curves only follow the experimental path for low gravity forces. As the experimental gravity force approach an unstable condition, the system introduced parasitic lateral forces and moments, which alter the expected response by decreasing the drift and the base bending moment, and thus increasing the critical load (from 771 kips to 802 kips).
(c) Case 3: The Fiber analyses results shown in Figures 6(c) and 7(c) were obtained by adding to case 2 the built-in frictional forces given by the system; thus, results from this model best fit the experimental P-drift and P-M paths.
Figure 5 – Effect of friction on hysteresis loops
8
P (kip) P (kip) P (kip)
Drift, U/L (%) Drift, U/L (%) Drift, U/L (%) (a) No friction – ideal imperfection (b) No friction - real imperfection (c) Friction – real imperfection
Figure 6 – P-Drift path obtained for LC1 specimen C20-26-5 P (kip) P (kip) P (kip)
M (kip-ft) M (kip-ft) M (kip-ft) (a) No friction – ideal imperfection (b) No friction - real imperfection (c) Friction – real imperfection Figure 7 – Axial load vs. total second order moment at the base for LC1 specimen C20-26-5
CONCLUSIONS This paper briefly described some efforts at determining buckling loads of slender concrete-filled tube columns. As discussed in the paper, unexpected difficulties were encountered on extracting buckling loads for the specimens due to (a) frictional forces in the actuators, (b) large initial bidirectional imperfections, (c) initial stresses due to construction and (d) correlating data from different sensors. A first approach to the problem using fiber analysis modeling ideal and real test conditions was presented. The three cases presented shown the effects of the system frictional forces and the initial imperfection in the buckling response. Studies are underway to track these effects into the other load cases. Because most of the rest of the load cases were run in displacement control, the role of the parasitic forces decrease, but those of the frictional forces remain. The successful extraction of the true response demands both a better understanding of the loading system-specimen interactions and the careful integration of the collected data into the model calibration.
0 1 2 3 4
100
200
300
400
500
600
700
800
900
1000
Experimental
Analytical
0 1 2 3 4
100
200
300
400
500
600
700
800
900
1000
Experimental
Analytical
0 1 2 3 4
100
200
300
400
500
600
700
800
900
1000
Experimental
Analytical
0 200 400 6000
100
200
300
400
500
600
700
800
900
1000
Simplified AISC-05
Experimental
Analytical
0 200 400 6000
100
200
300
400
500
600
700
800
900
1000
Simplified AISC-05
ExperimentalAnalytical
0 200 400 6000
100
200
300
400
500
600
700
800
900
1000
Simplified AISC-05
ExperimentalAnalytical
9
ACKNOWLEDGEMENT The work described here is part of a NEESR project supported by the National Science Foundation under Grant No. CMMI-0619047, the American Institute of Steel Construction, the Georgia Institute of Technology, and the University of Illinois at Urbana-Champaign. In-kind funding was provided by Atlas Tube Inc. and LeJeune Steel Co. The valuable group effort of the MAST Personnel to the experimental program is greatly appreciated. Any opinions, findings, and conclusions expressed in this material are those of the authors and do not necessarily reflect the views of the National Science Foundation or other sponsors.
REFERENCES AISC (2005). Specifications for structural steel buildings. ANSI/AISC 360-05. Chicago, Illinois,
USA.
AISC Commentary (2005). Commentary on the specifications for structural steel buildings. AISC. Chicago, IL, USA.
Goode C. (2007). ASCCS database of concrete-filled steel tube columns. ASCCS, http://web.ukonline.co.uk/asccs2/
Leon, R. and Kim, D. (2005). A database for composite columns, School of Civil and Environmental Engineering. Georgia Institute of Technology. Atlanta, Georgia.
Leon, R. Kim, D. and Hajjar, J. (2007). Limit state response of composite columns and beam-columns, Part I: formulation of design provisions for the 2005 AISC specification. Engineering Journal, AISC. 44(4): 341–358.
Leon, R. and Hajjar, J. (2008). Limit state response of composite columns and beam-columns part II: Application of design provisions for the 2005 AISC specification. Engineering Journal, AISC. 45(1): 21-46.
Timoshenko, S. and Gere, J. (1961). Theory of elastic stability, McGraw-Hill, New York.
White, D. and Hajjar, J. (1997). Buckling Models and Stability Design of Steel Frames: a Unified Approach. Journal of Constructional Steel Research. 42(3): 171-207.