robust 3d geological models: hard data is key
TRANSCRIPT
Robust 3D Geological Models: Hard Data is Key
Francine Fallara, P.Geo., M.Sc.A.
3D Mapping GeologySession VGP11AAbstract 34841
Joint AssemblyMay 4th, 2015
Montreal, Québec
AGU-GAC-MAC-CGU
2
Objectives: Incorporation and use of hard data
Robust 3D Geological Models: Hard Data is Key
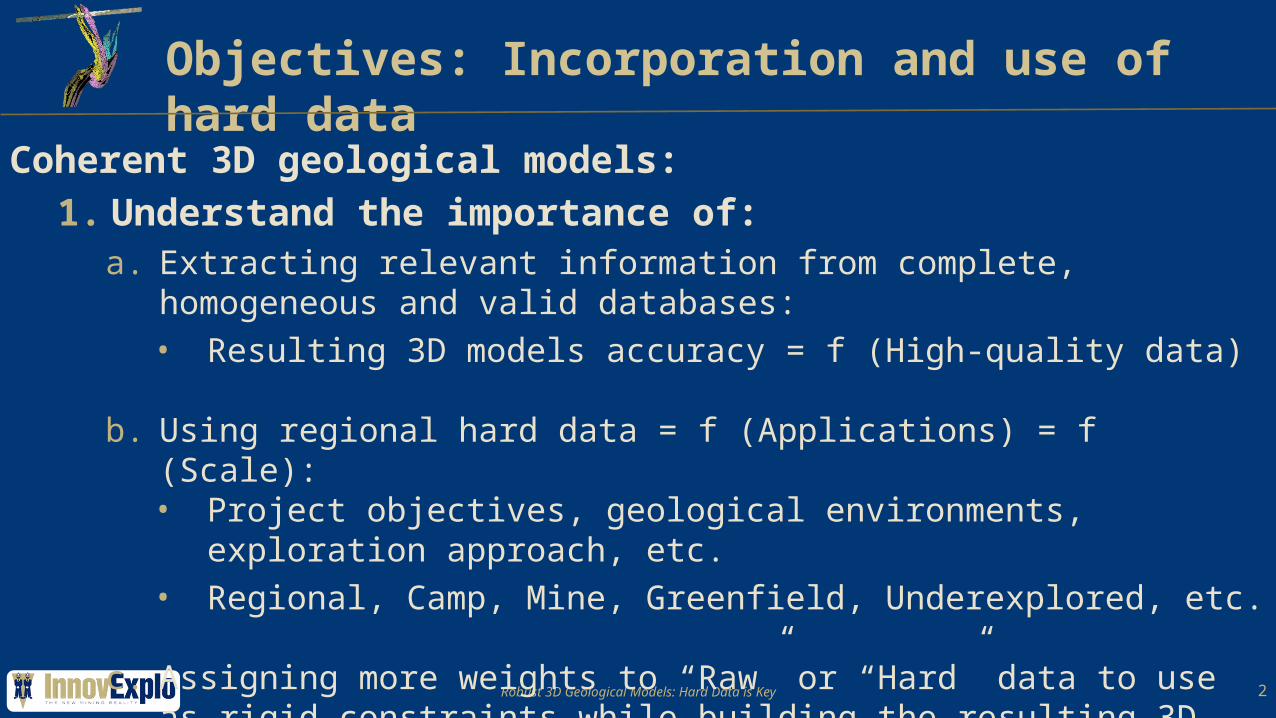
Coherent 3D geological models:1. Understand the importance of:
a. Extracting relevant information from complete, homogeneous and valid databases:• Resulting 3D models accuracy = f (High-quality data)
b. Using regional hard data = f (Applications) = f (Scale):• Project objectives, geological environments, exploration approach, etc.• Regional, Camp, Mine, Greenfield, Underexplored, etc.
c. Assigning more weights to “Raw” or “Hard” data to use as rigid constraints while building the resulting 3D geological model

3
Introduction: Why 3D geological modelling?
Robust 3D Geological Models: Hard Data is Key
3D models are used to better understand the geology of a studied area:
a. One region can have a completely different geometry at depth vs its surface outline
Surface projection
Fallara, Rabeau, Cheng and De Kemp (2008)
DEM
Faults2D to 3D transition

4
Introduction: 2D to 3D transition using hard data
Robust 3D Geological Models: Hard Data is Key
Key hard data integration vs resulting coherent 3D geological models:
a. 3D models are initiated by the importation of elevation points (DEM) to create the topographic surface:
• Topo surface accuracy = f (punctual and outcrop contours + DDH collars)
b. Geological field mapping, historical compilations and underground mapping combines the following hard data (quantitative and qualitative):
• Outcrops with geological labels, structural measures, main lithological and stratigraphic (marker horizons) contacts, faults and folds traces, mineralized zones, drill holes markers, assays, lithogeochemistry, alteration indexes, facies textures, physical rock properties, geophysics, etc.

5
Introduction: 2D to 3D transition using hard data
Robust 3D Geological Models: Hard Data is Key
Fallara et al. (2006)
2D to
3D
tran
sitio
n
Fallara, Rabeau, Cheng and De Kemp (2008)

6Robust 3D Geological Models: Hard Data is Key
Berra et al. (2014)
Accurate 3D modeling must reproduce key geological characteristics:
• Respect stratigraphy chronology and spatial lithological unit relationships:
• Simplify lithological contacts to best link 2D and 3D data
• Reconciliation geological and structural data
• Define structural domains and trends:• Strike, Dip, Bedding
• Enhance regional structures with geophysical maps
2D to 3D transition: Hard data uniformity analysis
Excellent correspondence with measured field data and
underground mapping

7
Case Study 1: 3D Regional ModelVery limited hard data constraints
Robust 3D Geological Models: Hard Data is Key
2012: Acquired Rouyn Noranda Mining Camp: Canada's most established VMS districts Include: Horne Mine Complex area and 13 other former producers Bounded: Destor-Porcupine and Larder Lake-Cadillac fault zones (2 most productive gold
bearing structures in North America)Color Coded Surface Geology imageDigital Elevation Model
Noranda Camp 3D Model
8Robust 3D Geological Models: Hard Data is Key
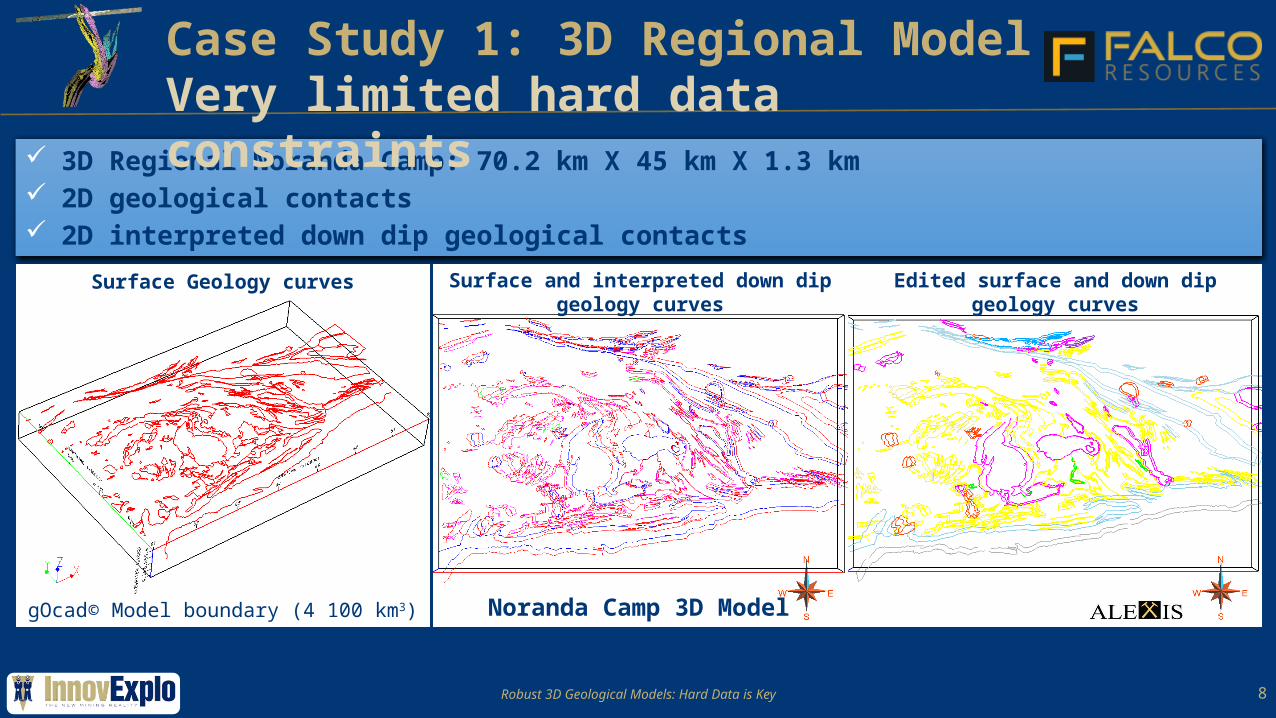
3D Regional Noranda Camp: 70.2 km X 45 km X 1.3 km 2D geological contacts 2D interpreted down dip geological contacts
gOcad© Model boundary (4 100 km3)
Surface Geology curves Surface and interpreted down dip geology curves
Edited surface and down dip geology curves
Noranda Camp 3D Model
Case Study 1: 3D Regional ModelVery limited hard data constraints

9Robust 3D Geological Models: Hard Data is Key
3D Regional Noranda Camp: 70.2 km X 45 km X 1.3 km 2D fault contacts 2D interpreted down dip fault contacts
Edited surface and down dip geology curves with fault traces
Surface plan map with previously built ‘Central Camp’ model and fault traces
Noranda Camp 3D ModelgOcad© Model boundary (4 100 km3)
Surface Geology curves
Case Study 1: 3D Regional ModelVery limited hard data constraints

10Robust 3D Geological Models: Hard Data is Key
06_Felsic_Intrusions
03_Duparquet_Sediments04_Kewagama_Sediments
05_Cadillac Sediments
01_Pontiac_Sediments08_Rhyolite_Porphyries
09_Ultramafics
02_Syenite07_Dufresnoy_Diorite
11_Mafics
10_Rhyolite
3D Geological contact surfaces Lithological Domains (regions) in Voxet
3D surfaces
Case Study 1: 3D Regional ModelVery limited hard data constraints
11Robust 3D Geological Models: Hard Data is Key
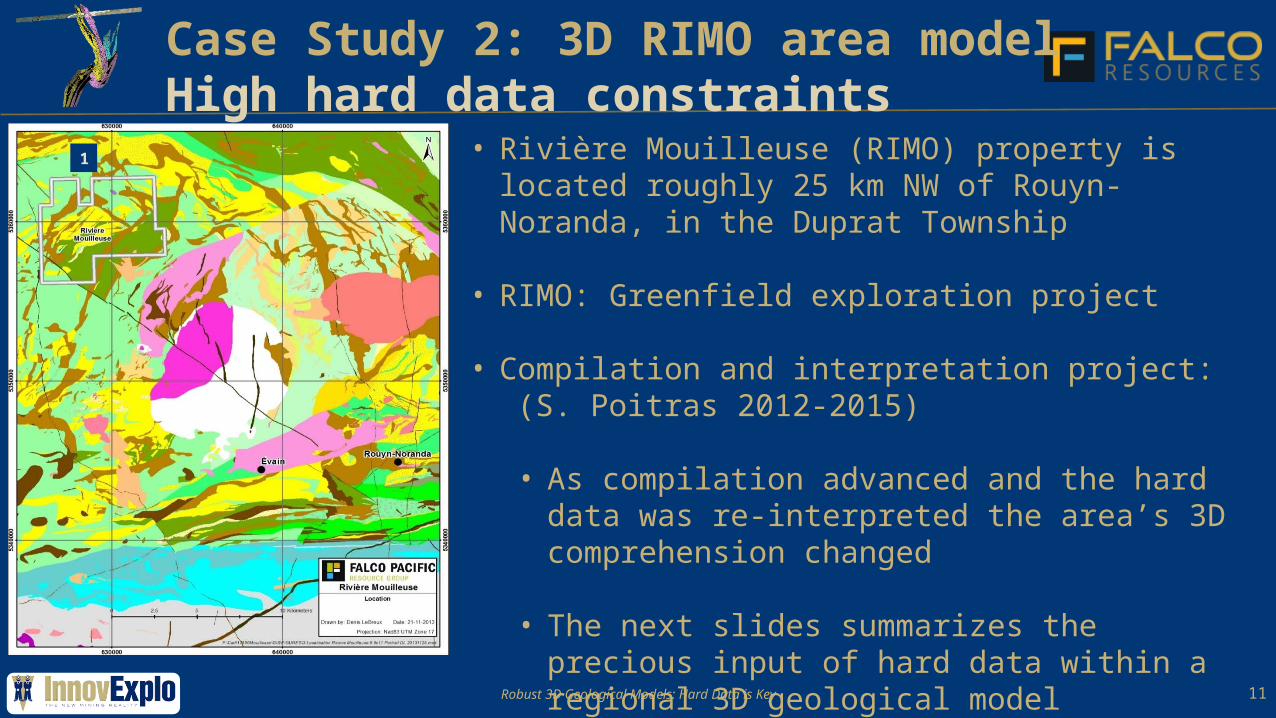
1 • Rivière Mouilleuse (RIMO) property is located roughly 25 km NW of Rouyn-Noranda, in the Duprat Township
• RIMO: Greenfield exploration project
• Compilation and interpretation project:(S. Poitras 2012-2015)
• As compilation advanced and the hard data was re-interpreted the area’s 3D comprehension changed
• The next slides summarizes the precious input of hard data within a regional 3D geological model
Case Study 2: 3D RIMO area modelHigh hard data constraints

12Robust 3D Geological Models: Hard Data is Key
Years of detailed compilation integrated into a common platform Powerful querying and target generating capabilities in a mature mining camp
Falco ResourcesDatabase
Historical DDH*
Historical Rock samples*
Total 16 585 45 929
Total length drilled (m) 4 133 045 NA
Total length sampled (m) 545 982 NA
Assays 256 300 17 066Lithogeochemistry 47 914 32 682
*As of late April 2014Unified platform with quantitative and qualitative
geological, geophysical and geochemical data
Integrated approach: 3D gOcad© modelsFallara et al. (2006)
Case Study 2: 3D RIMO area modelHigh hard data constraints

13Robust 3D Geological Models: Hard Data is Key
Surface level -500 m level from the surface
-1000 m level from the surface -2000 m level from the surface
DDH density distribution (200 m radius) and depth
1 1
1 1
Case Study 2: 3D RIMO area modelHigh hard data constraints
RIMO area

14Robust 3D Geological Models: Hard Data is Key
Type: VMS±Au (Concepts and interpretations; S. Poitras 2012-2015)
Hard data compilation: Added roughly 10,000 samples (March 17th, 2014): • Compiled thousands of metals and whole-rock analysis from historical
statutory reports and from private companies including geophysics, mapping and prospecting works done between 1951 to today
New geological highlights for the rhyolite contact:• Often marked by thin cherty exhalative horizon mineralized: PY-PO-CP-SP• Capped by an undrilled exhalite strongly anomalous in zinc• Possible distal VMS deposit at depth?
Spatial distribution of these new samples on the geological map:• Helped to trace the felsic/mafic units contacts• Traced a folded contour clearly showing both flanks to be underexplored: 2.4
km along strike not drilled on the northern flank
Case Study 2: 3D RIMO area modelHigh hard data constraints

15Robust 3D Geological Models: Hard Data is Key
Type: VMS±Au (Concepts and interpretations; S. Poitras 2012-2015)
Samples comparison of P. Riopel and L. Martin (2006): Horne type felsic geochemistry study in the Noranda Camp noted that:
• RIMO’s felsic rocks have identical Horne Mine geochemical signatures
• prospecting works done between 1951 to todayCarbonate alteration (molar CO2/CaO) from CONSOREM 2005:
• RIMO’s felsic rocks have identical Horne Mine geochemical signatures
Latest geochronology study: Exchanged with J. Goutier (McNicoll et al., 2014)
• Noted the felsic rocks of the RIMO area are older (≈2700 ) than those 𝑀𝑎from the central camp and corresponds to the Horne Mine’s felsic units
Case Study 2: 3D RIMO area modelHigh hard data constraints

16Robust 3D Geological Models: Hard Data is Key
Type: VMS±Au (Concepts and interpretations; S. Poitras 2012-2015)
Questioned and re-interpreted the structural domains associated to Au:• Western boundary = NW-SE Rivière Mouilleuse Fault (Smokey Creek Fault)• Major Proterozoic units displacements: Proving hydrothermal activity over a long period
(McNicoll, Goutier et al., 2014)• Southern boundary = Major NE-SW Hunter Creek Fault
Used historical reports to help understand the stratigraphy chronology: Kanasuta River overfold anticline:• Only literature reference (P. Verpaelst, 1986): Axial plane ENE plunging NE (about 30°)• Stratigraphy: Oriented SW-NE to WSW to ENE (N050-070°) with a low sub-horizontal
dip to the SE
Tested the hypothesis of a sub-horizontal stratigraphy:• Chose recent/well documented DDH (MB-94-19, MB-94-21 and MB-98-26; Cambior) on the southern flank• Verified their existence on the field (2 out of 3 casing and the 3rd setting were found)• Linked in 3D their rhyolite-andesite contact intersections: Attitude: N076.5° dipping SE 11.2°• Searched and found multiple mapping reports observing varying dips from 10 to 80° SE (average 30°)
Case Study 2: 3D RIMO area modelHigh hard data constraints

17Robust 3D Geological Models: Hard Data is Key
Type: VMS±Au (Concepts and interpretations; S. Poitras 2012-2015)
Explained the poorly and/or un-interpreted MegaTEM anomalies: Prior modelling had been defined based on a sub-vertical stratigraphy:• Explaining why the historical DDH (DUP-04-08) had missed the anomaly
"EM-01A" which had been drilled "down-dip”; i.e. remained unverified• New ground geophysical survey: Planned in SE portion of the overfold
anticline (optimized EM in-loop configuration for maximum coupling for sub-horizontal conductors)
Results of the EM in-loop survey outlined:The chosen firm was not aware of these new interpretations on purpose making sure no biased interpretations would be concluded.
• 17 EM conductors: Oriented NE (moderate to good)• Most conductors were defined to be sub-horizontal with a SE dip• Defined a new brittle faults network: NNW with apparent dextral movements• Top conductors bodies are mainly at 50 to 200 m depths
Case Study 2: 3D RIMO area modelHigh hard data constraints
18Robust 3D Geological Models: Hard Data is Key
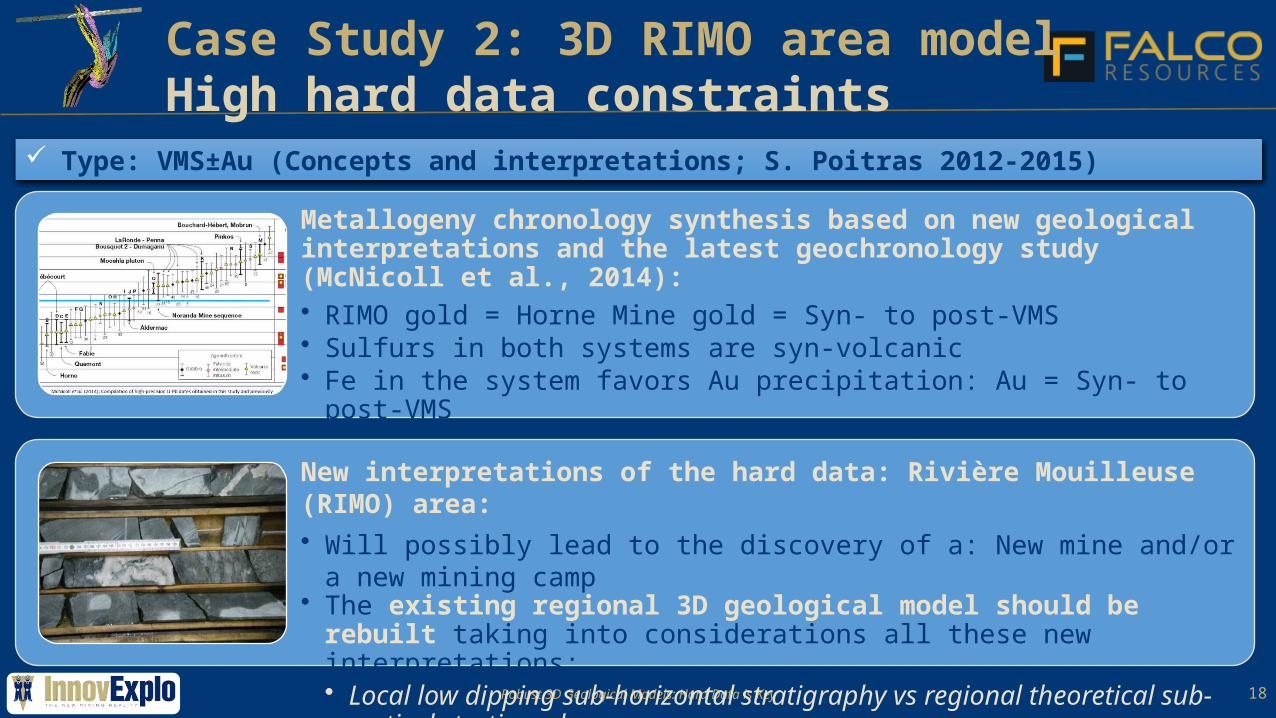
Type: VMS±Au (Concepts and interpretations; S. Poitras 2012-2015)
Metallogeny chronology synthesis based on new geological interpretations and the latest geochronology study (McNicoll et al., 2014):• RIMO gold = Horne Mine gold = Syn- to post-VMS• Sulfurs in both systems are syn-volcanic• Fe in the system favors Au precipitation: Au = Syn- to post-VMS• Pierce (1933) thesis: also interpreted Au = Post-VMS mineralization
New interpretations of the hard data: Rivière Mouilleuse (RIMO) area: • Will possibly lead to the discovery of a: New mine and/or a new mining camp• The existing regional 3D geological model should be rebuilt taking into
considerations all these new interpretations:• Local low dipping sub-horizontal stratigraphy vs regional theoretical sub-
vertical stratigraphy• Several EM sub-horizontal conductors still remain undrilled
Case Study 2: 3D RIMO area modelHigh hard data constraints
19Robust 3D Geological Models: Hard Data is Key
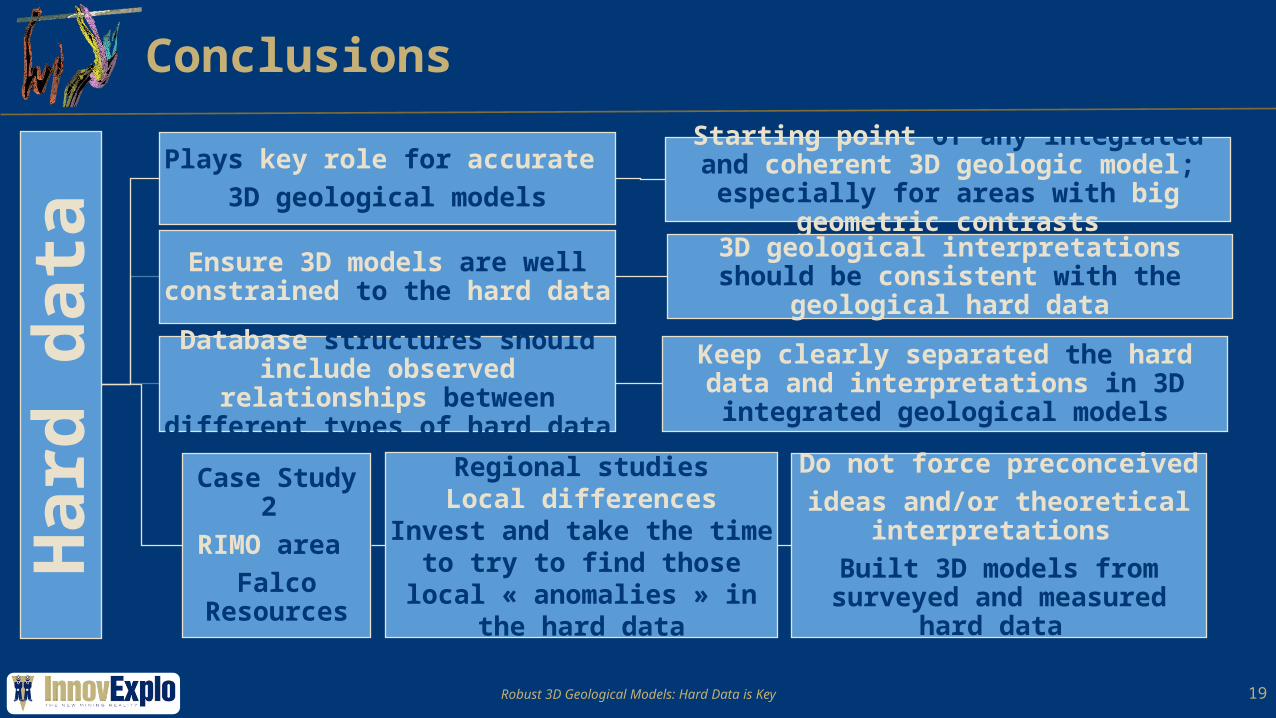
ConclusionsH
ard
data
Plays key role for accurate 3D geological models
Starting point of any integrated and coherent 3D geologic model; especially for
areas with big geometric contrasts
Ensure 3D models are well constrained to the hard data
3D geological interpretations should be consistent with the geological hard data
Database structures should include observed relationships between
different types of hard data
Keep clearly separated the hard data and interpretations in 3D integrated geological
models
Case Study 2 RIMO area
Falco Resources
Regional studiesLocal differences
Invest and take the time to try to find those local
« anomalies » in the hard data
Do not force preconceived ideas and/or theoretical
interpretations Built 3D models from surveyed
and measured hard data

20Robust 3D Geological Models: Hard Data is Key
Conclusions
3D m
aps
If hard data is absent3D modelling is essentially performed
with blinders onResults theory-driven 3D models
lacking geologists input and “real” field data observations
3D map modelsNot a goal but a tool that should be
dynamic, modified, questioned, shared and updated
Future value of this tool is defined as how well a multi-disciplinary team of
geologists, geophysicists, geochemists, engineers, metallurgists and environmental experts will use itWard et al. (2012) Field surface data
Underground mappingDrill holes

21Robust 3D Geological Models: Hard Data is Key
Special thanks to the Falco Resources Exploration Team:
Michael Byron Vice President Exploration, DirectorStéphane Poitras Exploration ManagerNancy Lafrance Exploration GeologistHughes de Corta Exploration GeologistStéphane Guenette Data EntryDenis Lebreux Database ManagerCarmen Gervais Accountant
Acknowledgements
Perfect example of an exploration team investing time to complete the database with historic data
compilations, field surveys and DDH…
Outside the box interpretations not confined to well-known theoretical models
by applying unbiased data-driven approaches….
Best of luck for your future careers!