rohm co., ltd. financial highlights for the year ended … · rohm co., ltd. financial highlights...
TRANSCRIPT
ROHM CO., LTD. Financial Highlights for the Year Ended on March 31, 2012
May 9, 2012
1. Consolidated Financial Results
(Figures are rounded down to the nearest million yen. Any fraction less than the unit is rounded off)
Year ended
March 31, 2012
Year ended March
31, 2011
Actual Actual Amount Percentage Annual
Increase/decrease
from the previous
year
First six
months
Increase/decrease from the
first six months of the
previous year
Year ending March 31,2013 (Projected)Increase/decrease from the year ended
March 31,2011
months
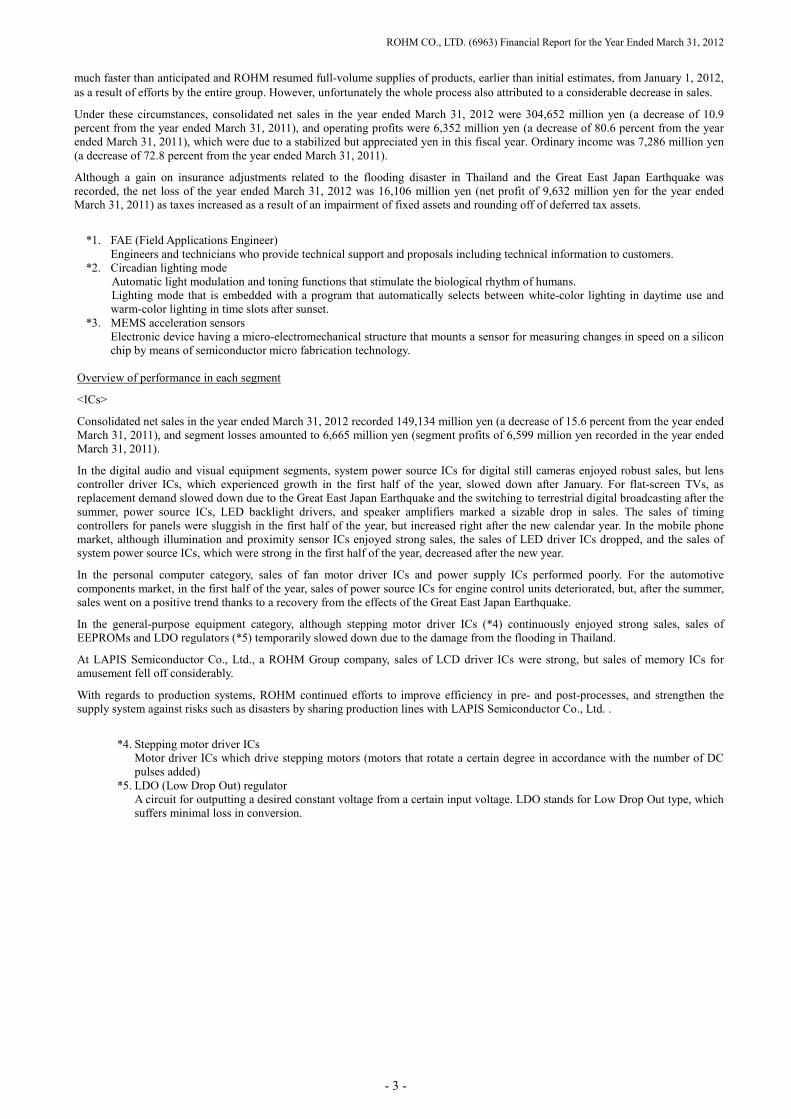
Millions of yen 304,652 341,885 -37,233 -10.9% 315,000 +3.4% 157,000 -4.7%
Millions of yen 209,046 219,149 -10,103 -4.6% 217,400 108,600
Millions of yen 89,253 89,999 -746 -0.8% 83,600 42,600
Millions of yen 6,352 32,736 -26,384 -80.6% 14,000 +120.4% 5,800 -41.6%
(Operating income margin)
(2.1%) (9.6%) (-7.5%) (4.4%) (3.7%)
Cost of sales
Operating income
Net sales
Selling, general and administrative expenses
(Operating income margin)
Millions of yen 7,286 26,805 -19,519 -72.8% 14,500 +99.0% 5,500 -17.2%
(Ordinary income margin) (2.4%) (7.8%) (-5.4%) (4.6%) (3.5%)
Millions of yen -16,106 9,632 -25,738 - 10,000 - 3,000 -
(net income margin) (-5.3%) (2.8%) (-8.1%) (3.2%) (1.9%)
yen -149.41 88.07 -237.48 - 92.75 27.83
% -2.5 1.4 -3.9
Ordinary income
Net income
Basic net income per share
Ratio of net income to equity % -2.5 1.4 -3.9
% 1.0 3.4 -2.4
Millions of yen 737,326 759,988 -22,662 -3.0%
Millions of yen 634,280 668,778 -34,498 -5.2%
% 86.0 87.7 -1.7Equity ratio
Net assets
Total assets
Ratio of net income to equity
Ordinary income to total assets
Net assets per share yen 5,880.27 6,184.91 -304.64 -4.9%
Capital expenditures Millions of yen 51,117 40,042 +11,075 +27.7% 62,000 +21.3% 36,400 +108.9%
Depreciation Millions of yen 35,915 37,216 -1,301 -3.5% 46,200 +28.6% 20,800 +22.3%
Research and development costs Millions of yen 39,763 37,898 +1,865 +4.9% 38,500 -3.2% 19,900 +2.5%
Net financial revenue Millions of yen 1,599 1,385 +214 +15.4%
Millions of yen (loss) 1,284 (loss) 7,152 (gain) 5,868
Foreign exchange rate (Average yen-dollar rate) yen/US$ 79.31 85.82 -6.51 -7.6% 80.00 80.00
Foreign currency exchange gains/losses
* The projected data are based on the information available at the time of release of this report. Therefore, a number of important factors including changes in business conditions
may cause actual results to differ materially from those projected.
Contact: Public Relations and Investor Relations Dept., ROHM CO., LTD.
21, Saiin Mizosaki-cho, Ukyouku, Kyoto 615-8585 +81-75-311-2121
Note: This report is a translation of the financial highlights of the Company prepared in accordance with the provisions set forth in the Securities and Exchange Law and its related
accounting regulations, and in conformity with accounting principles generally accepted in Japan. The original version of this report is written in Japanese. In the event of any
discrepancies in words, accounts, figures, or the like between this report and the original, the original Japanese version shall govern.
- Financial Highlights 1 -

1. Consolidated Financial Results (Continued from the previous page)
(Figures are rounded down to the nearest million yen. Any fraction less than the unit is rounded off)
Year ended
March 31, 2012
Year ended March
31, 2011
Actual Actual Amount Percentage AnnualIncrease/decrease
from the previous
year
First six
months
Increase/decrease from
the first six months of
the previous year
Sales by individual segments and by individual regions (Note1)
149,134 176,672 -27,538 -15.6% 149,232 +0.1% 74,815 -7.6%
(Japan) (62,919) (70,825) (-7,906) (-11.2%) (53,791) -14.5% (26,405) -21.2%
Increase/decrease from the year
ended March 31,2011
IC
Year ending March 31,2013 (Projected)
Millions of yen
(Japan) (62,919) (70,825) (-7,906) (-11.2%) (53,791) -14.5% (26,405) -21.2%
(Asia) (76,956) (93,284) (-16,328) (-17.5%) (87,276) +13.4% (44,534) +5.6%
(Americas) (6,765) (8,888) (-2,123) (-23.9%) (5,770) -14.7% (2,778) -28.3%
(Europe) (2,492) (3,674) (-1,182) (-32.2%) (2,393) -4.0% (1,096) -20.0%
103,861 113,543 -9,682 -8.5% 106,751 +2.8% 53,862 -4.0%
(Japan) (37,394) (37,849) (-455) (-1.2%) (36,438) -2.6% (18,360) -4.1%
(Asia) (58,140) (66,193) (-8,053) (-12.2%) (61,461) +5.7% (31,160) -5.0%
Discrete semiconductor devices
(Americas) (3,947) (4,752) (-805) (-16.9%) (4,478) +13.5% (2,210) +13.9%
(Europe) (4,379) (4,747) (-368) (-7.8%) (4,372) -0.1% (2,131) -5.1%
51,656 51,669 -13 -0.0% 59,016 +14.2% 28,321 +2.4%
(Japan) (17,304) (13,957) (+3,347) (+24.0%) (24,373) +40.8% (11,001) +23.5%
(Asia) (29,035) (31,439) (-2,404) (-7.6%) (29,588) +1.9% (14,713) -7.6%
(Americas) (1,894) (2,416) (-522) (-21.6%) (1,905) +0.6% (968) -3.0%
(Europe) (3,422) (3,855) (-433) (-11.3%) (3,149) -8.0% (1,638) -9.9%
Others
(Europe) (3,422) (3,855) (-433) (-11.3%) (3,149) -8.0% (1,638) -9.9%
304,652 341,885 -37,233 -10.9% 315,000 +3.4% 157,000 -4.7%
(Japan) (117,618) (122,632) (-5,014) (-4.1%) (114,603) -2.6% (55,767) -9.5%
(Asia) (164,133) (190,917) (-26,784) (-14.0%) (178,326) +8.6% (90,408) -0.5%
(Americas) (12,606) (16,056) (-3,450) (-21.5%) (12,154) -3.6% (5,957) -12.5%
(Europe) (10,294) (12,278) (-1,984) (-16.2%) (9,915) -3.7% (4,867) -10.5%
Total
Sales by application (Note2)
Visual % 5.4 7.7 -2.3
Audio 9.3 9.3 0.0
Home appliance 3.4 3.1 +0.3
Other consumer 13.9 14.2 -0.3
Computer and OA 12.5 11.9 +0.6
Telecommunications 12.9 14.0 -1.1
Automotive 15.1 12.9 +2.2
Sales by application (Note2)
Other industrial 5.5 4.7 +0.8
Subassemblies 17.5 17.5 0.0
Others 4.5 4.7 -0.2
IC Millions of yen 27,252 14,913 +12,339 +82.7% 25,000 -8.3% 14,700 +137.3%
Discrete semiconductor devices 11,334 16,872 -5,538 -32.8% 20,300 +79.1% 12,100 +159.3%
Capital expenditures by individual segments
Others 7,603 5,426 +2,177 +40.1% 13,400 +76.2% 8,400 +145.9%
Sales and Administrative Expenses Division 4,925 2,829 +2,096 +74.1% 3,300 -33.0% 1,200 -61.8%
Total 51,117 40,042 +11,075 +27.7% 62,000 +21.3% 36,400 +108.9%
Notes: 1 The sales mentioned above are for external customers.
2 Since ROHM changed the way it classifies sales by application as of the year ended March 31, 2012, the company changed its components for the year ended
March 31, 2011 and posted those component ratios by application accordingly.
- Financial Highlights 2 -

2. Relevant information
(Figures are rounded down to the nearest million yen. Any fraction less than the unit is rounded off)
Year ended March 31, 2012 Year ended March 31, 2011
Actual Actual Amount Percentage
yen 60.0 130.0 -70.0
(Year-end cash dividends) (yen) (30.0) (65.0) (-35.0)
Number of employees
Increase/decrease from the year ended March 31,2011
Annual cash dividends
Domestic 5,900 5,833 +67 +1.1%
Overseas 15,395 15,727 -332 -2.1%
Total 21,295 21,560 -265 -1.2%
(Number of R&D employees) (3,243) (2,900) (+343) (+11.8%)
Number of consolidated subsidiaries 48 50 -2
(Domestic) (12) (15) (-3)
(Overseas) (36) (35) (+1)
6 6 0
(0) (0) (0)
1 1 0
(0) (0) (0)
Number of affiliated companies
(Number of companies accounted for by equity method)
Number of non-consolidated subsidiaries
(Number of companies accounted for by equity method)
29,255 28,577 +678 +2.4%
Financial institution shareholding ratio % 21.52 21.76 -0.24
Foreign shareholding ratio % 49.72 49.03 +0.69
Number of shareholders
- Financial Highlights 3 -

Financial Report for the Year Ended March 31, 2012 (Japan GAAP, Consolidated)
May 9, 2012
Listed Company Name: ROHM CO., LTD. Stock Exchange Listings Tokyo, Osaka
Code No.:6963 URL http://www.rohm.co.jp
Company Representative: (Title) President (Name) Satoshi Sawamura
Contact Person: (Title) Director, Accounting & Finance Headquarters (Name) Eiichi Sasayama TEL +81-75-311-2121
Scheduled date of annual meeting of shareholders June 28, 2012 Scheduled first-dividend payment date June 29, 2012
Scheduled date of securities report for submission June 28, 2012
Supplementary material prepared for account closing: Yes
Financial results briefing available: Yes (For analysts and institutional investors)
(Figures are rounded down to the nearest million yen.)
1. Consolidated Business Results for the Year Ended March 31, 2012 (From April 1, 2011 to March 31, 2012) (1) Consolidated Operating Results (Accumulated total) (The percentages [%] represent changes from the previous year)
Net sales Operating income Ordinary income Net income
Millions of yen % Millions of yen % Millions of yen % Millions of yen %
Year ended March 31, 2012
Year ended March 31, 2011
304,652
341,885
-10.9
1.9
6,352
32,736
-80.6
74.0
7,286
26,805
-72.8
55.1
-16,106
9,632
―
35.0
(Note) Comprehensive Income Year ended March 31, 2012: -22,585 million yen ( – % ) Year ended March 31, 2011: -14,219 million yen ( – % )
Basic net income
per share
Diluted net income
per share
Ratio of net income
to equity
Ordinary income to
total assets
Operating income
to net t sales
Yen Yen % % %
Year ended March 31, 2012
Year ended March 31, 2011
-149.41
88.07
―
―
-2.5
1.4
1.0
3.4
2.1
9.6
(Reference) Investment loss (-gain) on equity method Year ended March 31, 2012: – million yen Year ended March 31, 2011: – million yen
(2) Consolidated Financial Position
Total assets Net assets Equity ratio Net assets per share
Millions of yen Millions of yen % Yen
Year ended March 31, 2012
Year ended March 31, 2011
737,326
759,988
634,280
668,778
86.0
87.7
5,880.27
6,184.91
(Reference) Shareholder’s equity Year ended March 31, 2012: 633,982 million yen Year ended March 31, 2011: 666,831 million yen
(3) Consolidated Cash Flows
Cash flows from operating
activities
Cash flows from investing
activities
Cash flows from financing
activities
Cash and cash equivalents at
end of year
Millions of yen Millions of yen Millions of yen Millions of yen
Year ended March 31, 2012
Year ended March 31, 2011
36,858
63,557
-45,788
-52,985
-10,494
-24,434
208,745
230,721
2. Dividend Details Dividend per share
Total annual dividend
Shareholder payout ratio
(consolidated)
Dividend on equity ratio
(consolidated)
End of the first quarter
End of the interim
End of the third quarter
End of year Annual
Yen Yen Yen Yen Yen
Millions of yen
% %
Year ended March 31, 2011 ― 65.00 ― 65.00 130.00 14,129 147.6 2.1
Year ended March 31, 2012 ― 30.00 ― 30.00 60.00 6,468 ― 1.0
Year ending March 31, 2013
(Estimates) ― 30.00 ― 30.00 60.00
64.7
3. Consolidated Business Results Forecast for the Year Ending March 31, 2013 (From April 1, 2012 to March 31, 2013) (The percentages [%] shown for Fiscal 2013 figures represent changes from the previous fiscal year and
those for the quarter figures represent changes from the interim data of the previous fiscal year.)
Net sales Operating income Ordinary income Net income Basic net income
per share
Interim
Millions of yen
157,000
%
-4.7
Millions of yen
5,800
%
-41.6
Millions of yen
5,500
%
-17.2
Millions of yen
3,000
%
―
Yen
27.83
Fiscal 2013 315,000 3.4 14,000 120.4 14,500 99.0 10,000 ― 92.75

* Note
(1) Major Change in Subsidiaries during the Year Ended March 31, 2012 (Changes to specified subsidiaries accompanying revision on the scope of consolidation): None
New company - (Company name: ) Excluded company - (Company name: )
(2) Changes in Accounting Policies, Changes in Accounting Estimates, and Restatement of Revisions [1] Changes in accounting policies according to revisions to accounting standards: None [2] Changes in accounting policies other than items indicated in [1]: None [3] Changes in accounting estimates: None [4] Restatement of revisions: None
(3) Number of Shares Outstanding (common shares)
[1] Year-end number of shares outstanding (incl. treasury stocks)
Year ended March 31, 2012 113,400,000
shares Year ended March 31, 2011
115,300,000 shares
[2] Year-end number of treasury stocks
Year ended March 31, 2012 5,585,173
shares Year ended March 31, 2011
7,484,318 shares
[3] Average number of shares during the term
Year ended March 31, 2012 107,815,275
shares Year ended March 31, 2011
109,357,216 shares
(Reference) Summary of non-consolidated operating results 1. Non-consolidated Business Results for Year Ended March 31, 2012 (From April 1, 2011 to March 31, 2012) (1)Non-consolidated Results of Operations (The percentages [%] represent changes from the previous year)
Net sales Operating income Ordinary income Net income
Millions of yen % Millions of yen % Millions of yen % Millions of yen %
Year ended March 31, 2012
Year ended March 31, 2011
255,787
294,303
-13.1
7.3
-7,506
3,374
―
-39.0
8,428
55,041
-84.7
197.1
-68,982
50,514
―
264.7
Basic net income per share Diluted net income
per share
Yen Yen
Year ended March 31, 2012
Year ended March 31, 2011
-639.82
461.92
─
─
(2)Non-consolidated Financial Position
Total assets Net assets Equity ratio Net assets per share
Millions of yen Millions of yen % Yen
Year ended March 31, 2012
Year ended March 31, 2011
467,061
541,789
403,511
484,811
86.4
89.5
3,742.63
4,496.67
(Reference) Shareholder’s equity Year ended March 31, 2012: 403,511 million yen
Year ended March 31, 2011: 484,811 million yen
*Disclosure regarding implementation status of auditing procedures This financial report is not subject to auditing procedures under the Financial Instruments and Exchange Act. At the time of disclosure of this financial report, auditing procedures for financial statements under the Financial Instruments and Exchange Act had not been completed. *Explanation on Adequate Usage of Business Results Forecast Since the statement regarding the business results forecast accounted for in this financial report is based on current information acquired by ROHM as well as specific legitimate prerequisites, actual business results may be considerably different due to various factors. For conditions on the preposition of business forecasts and notes in using business forecasts, please refer to the financial report “1. Business results (1) Analysis of business results,” on page 4 of the supplementary materials.

ROHM CO., LTD. (6963) Financial Report for the Year Ended March 31, 2012
- 1 -
Appendix
• Table of Contents
1. Business Results ........................................................................................................................................................ 2
(1) Analysis of Business Results ................................................................................................................................. 2 (2) Financial Analysis ................................................................................................................................................. 5 (3) Basic Policy for Profit Distribution for the Year Ended March 31, 2012 and Year Ending March 31, 2013 ........ 6 (4) Risk concerning the Company’s Businesses ......................................................................................................... 6
2. Status of the ROHM Group ....................................................................................................................................... 8 3. Management Policies ................................................................................................................................................. 9
(1) ROHM’s Basic Management Policy ..................................................................................................................... 9 (2) Referenced Corporate Performance Indices .......................................................................................................... 9 (3) Mid- to Long-term Corporate Strategies ............................................................................................................... 9 (4) Priority Issues...................................................................................................................................................... 10
4. Consolidated Financial Statements for the Year Ended March 31, 2011 ................................................................. 12 (1) Consolidated Balance Sheets .............................................................................................................................. 12 (2) Consolidated Statement of Income and comprehensive income ......................................................................... 14
Consolidated Statement of Income ...................................................................................................................... 14 Consolidated statement of comprehensive income .............................................................................................. 15
(3) Consolidated Statement of Shareholders' Equity ................................................................................................ 16 (4) Consolidated Statement of Cash Flow ................................................................................................................ 18 (5) Note on Going Concern ...................................................................................................................................... 19 (6) Major Items for the Preparations of Consolidated Financial Statements ............................................................ 19 (7) Change in Indication Method .............................................................................................................................. 19 (8) Additional Information ........................................................................................................................................ 19 (9) Notes on Consolidated Financial Statements ...................................................................................................... 20
(Notes on Consolidated Statement of Changes in Shareholders’ Equity) ............................................................ 20 (Segment information) ......................................................................................................................................... 21 (Per Share Data) ................................................................................................................................................... 24 (Significant subsequent events) ........................................................................................................................... 24
5. Others ....................................................................................................................................................................... 25 (1) Production, orders and actual sales status ........................................................................................................... 25 (2) Transfer of directors ............................................................................................................................................ 26
*Separately attached as supplementary material is an “Overview of business results of the year ended March 31, 2012.”

ROHM CO., LTD. (6963) Financial Report for the Year Ended March 31, 2012
- 2 -
1. Business Results
(1) Analysis of Business Results
[1] Business results for the year ended March 31, 2012
Overall condition of business performance
During the year ended March 31, 2012, the severe conditions of the world economy deepened further due to the effects of the Great
East Japan Earthquake, financial and monetary problems in Europe, and a spontaneous decline in stock values worldwide. Within
individual regions, in the US, personal consumption stopped growing at a low level and consumer prices were on an upward trend as
unemployment rate remained high in the first half of the year. Although some improvements were seen after autumn, the recovery of
the overall economy has been weak. Nonetheless, since the beginning of the new year, the jobs situation has improved, and the
economy has gradually headed towards a recovery.
In Europe, personal consumption, which was sluggish in the first half of the year, stopped slowing down in Germany after autumn. Due
to the financial crisis that started in Greece, business confidence worsened mainly in Southern Europe, and the average unemployment
rate in the Euro zone rose to the highest level since 1997; thus, the overall economy was at a stagnated shape.
In Asia, during the first half of the year, the overall economy was robust as personal consumption was strong, but the pace of business
expansion slowed down due to increasing anxiety over inflation and the effects of the Great East Japan Earthquake and flooding in
Thailand. As for exports, though strong in the first half of the fiscal year, the pace of growth slowed down due to the deteriorating
European economies. In Japan, exports sank and personal consumption fell considerably due to decreased production of automobiles
and other products, on account of the earthquake. The economy progressed along a recovery track after summer, but then again
reverted towards a slowdown due to a stabilized but appreciated yen, while the jobs situation still remained bleak. After mid-February,
the economy gradually recovered due to the Bank of Japan’s monetary easing measures, an appreciation of the yen, and an adjustment
to fallen stock prices.
Within the electronic industry, although smart phones and energy-saving related equipment, including LED lighting and solar power
generators, enjoyed solid sales, inventory adjustment was prolonged due to a slowdown in production and sales of electronic products.
Market segments for audio visual equipment, game consoles, personal computers and flat-screen TVs remained in a distressed state,
having been affected by the Great East Japan Earthquake and a worsening economy. In addition, flooding in Thailand cast a shadow
over the production of automobiles and other electronic equipment.
Consequently, the electronic component industry suffered from these harsh conditions as well.
In individual sectors, in Japan, production volume of audio-visual equipment, including digital still cameras, game consoles, and
automotive equipment drastically decreased due to the effects of supply chain interruptions and energy-saving measures that went to
effect after f the Great East Japan Earthquake in March, 2011. After the summer, accompanied by the recovery from the earthquake,
the overall economy tended to pick up, but did not achieve a full-fledged recovery. In addition, after autumn, the market of digital still
cameras was affected by the flooding in Thailand, and sales of flat screen TVs considerably decreased as replacement demand spurred
by the transition to digital terrestrial broadcasting had come to the end of its cycle. In Asia, the production of personal computers and
flat-screen TVs decreased as it was affected by the Great East Japan Earthquake and the deteriorating European economies. Also, the
production of digital still cameras and hard disks temporarily decreased due to the flooding in Thailand. Sales of smart phones and
tablet PCs were strong.
In the US, the telecommunication infrastructure market and automotive market enjoyed robust sales, but the consumer-electronics
market including TV sets, as well as the personal computer market remained sluggish.
In Europe, the consumer-electronics market remained in a slow state. Markets of automotive segments and telecommunication infrastructure, which were robust in the first half, entered into an adjustment phase due to a deteriorating interregional market in the second half of the year.
Under these circumstances, the ROHM Group exerted itself to strengthen production lines of automotive and electronic equipment, industrial instruments including medical equipment, digital home appliances, IT and mobile equipment, and also enhanced sales by increasing the number of FAEs (*1) at individual sales bases including China. In addition, the group continued to strengthen its sales structure for non-Japanese customers by establishing new sales companies in India and Brazil, and proceeding with efforts to form a structure capable of responding to changes in global markets.
The ROHM Group also aims to improve the global environment, by continuing to develop new power devices including SiC (silicon carbide) and other eco-friendly products. The group also started the world’s first mass-production of full-SiC power modules in March. ROHM group has developed specific driver ICs for automotive LED rear lighting, head lights and daytime running lights, whose markets continue to expand. Furthermore, product lineups of the household LED lighting equipment including LED ceiling lights were drastically enhanced by AGLED Co., Ltd. (renamed from Maruzen Electric Co., Ltd. on October 1, 2011). Recently, the group started selling mini- krypton type LED light bulbs of 180 degree light distribution angle. In March, LED ceiling lights equipped as a standard feature with a “circadian lighting mode.”(*2) were offered to the market,, thus the group continued to focus on increasing sales of LED-related devices and LED lighting whose markets are expanding rapidly as next-generation energy-saving lighting sources.
The ROHM Group also worked to augment business synergy, by strengthening partnership structures with LAPIS Semiconductor Co., Ltd. (renamed from OKI Semiconductor Co, Ltd. on October 1, 2011), which ROHM acquired in 2008, SiCrystal AG, a German SiC wafer manufacturer that ROHM purchased in 2009, and the US-based Kionix, Inc., which is a MEMS acceleration sensor (*3) supplier.
On the other hand, in the manufacturing arena, the ROHM Group was forced to temporarily suspend operations at the two strongholds
of Miyagi and Ibaragi on account of the Great East Japan Earthquake, and at factories including two semiconductor assembly plants
and a molding plant due to the flooding in Thailand. It is important to note that recovery from the damages caused by the flooding was
ROHM CO., LTD. (6963) Financial Report for the Year Ended March 31, 2012
- 3 -
much faster than anticipated and ROHM resumed full-volume supplies of products, earlier than initial estimates, from January 1, 2012,
as a result of efforts by the entire group. However, unfortunately the whole process also attributed to a considerable decrease in sales.
Under these circumstances, consolidated net sales in the year ended March 31, 2012 were 304,652 million yen (a decrease of 10.9 percent from the year ended March 31, 2011), and operating profits were 6,352 million yen (a decrease of 80.6 percent from the year ended March 31, 2011), which were due to a stabilized but appreciated yen in this fiscal year. Ordinary income was 7,286 million yen (a decrease of 72.8 percent from the year ended March 31, 2011).
Although a gain on insurance adjustments related to the flooding disaster in Thailand and the Great East Japan Earthquake was recorded, the net loss of the year ended March 31, 2012 was 16,106 million yen (net profit of 9,632 million yen for the year ended March 31, 2011) as taxes increased as a result of an impairment of fixed assets and rounding off of deferred tax assets.
*1. FAE (Field Applications Engineer)
Engineers and technicians who provide technical support and proposals including technical information to customers. *2. Circadian lighting mode
Automatic light modulation and toning functions that stimulate the biological rhythm of humans. Lighting mode that is embedded with a program that automatically selects between white-color lighting in daytime use and warm-color lighting in time slots after sunset.
*3. MEMS acceleration sensors Electronic device having a micro-electromechanical structure that mounts a sensor for measuring changes in speed on a silicon
chip by means of semiconductor micro fabrication technology. Overview of performance in each segment
<ICs>
Consolidated net sales in the year ended March 31, 2012 recorded 149,134 million yen (a decrease of 15.6 percent from the year ended March 31, 2011), and segment losses amounted to 6,665 million yen (segment profits of 6,599 million yen recorded in the year ended March 31, 2011).
In the digital audio and visual equipment segments, system power source ICs for digital still cameras enjoyed robust sales, but lens controller driver ICs, which experienced growth in the first half of the year, slowed down after January. For flat-screen TVs, as replacement demand slowed down due to the Great East Japan Earthquake and the switching to terrestrial digital broadcasting after the summer, power source ICs, LED backlight drivers, and speaker amplifiers marked a sizable drop in sales. The sales of timing controllers for panels were sluggish in the first half of the year, but increased right after the new calendar year. In the mobile phone market, although illumination and proximity sensor ICs enjoyed strong sales, the sales of LED driver ICs dropped, and the sales of system power source ICs, which were strong in the first half of the year, decreased after the new year.
In the personal computer category, sales of fan motor driver ICs and power supply ICs performed poorly. For the automotive components market, in the first half of the year, sales of power source ICs for engine control units deteriorated, but, after the summer, sales went on a positive trend thanks to a recovery from the effects of the Great East Japan Earthquake.
In the general-purpose equipment category, although stepping motor driver ICs (*4) continuously enjoyed strong sales, sales of EEPROMs and LDO regulators (*5) temporarily slowed down due to the damage from the flooding in Thailand.
At LAPIS Semiconductor Co., Ltd., a ROHM Group company, sales of LCD driver ICs were strong, but sales of memory ICs for amusement fell off considerably.
With regards to production systems, ROHM continued efforts to improve efficiency in pre- and post-processes, and strengthen the supply system against risks such as disasters by sharing production lines with LAPIS Semiconductor Co., Ltd. .
*4. Stepping motor driver ICs
Motor driver ICs which drive stepping motors (motors that rotate a certain degree in accordance with the number of DC pulses added)
*5. LDO (Low Drop Out) regulator A circuit for outputting a desired constant voltage from a certain input voltage. LDO stands for Low Drop Out type, which suffers minimal loss in conversion.
ROHM CO., LTD. (6963) Financial Report for the Year Ended March 31, 2012
- 4 -
<Discrete semiconductor devices>
Consolidated net sales for the year ended March 31, 2012 recorded 103,861 million yen (a decrease of 8.5 percent from the year ended March 31, 2011), and segment profits were 11,616 million yen (a decrease of 39.0 percent from the year ended March 31, 2011).
In the diode and transistor categories, overall sales slowed down due to the effects of the Great East Japan Earthquake and the flooding in Thailand, and a sluggish flat screen TV market. Sales of high efficiency power MOSFETs, which were robust in the first half of the fiscal year, deteriorated after autumn.
In the light emitting diode category, blue LEDs, which had experienced weak sales, enjoyed a robust trend after the new year. Overall sales results were on a recovery path, but did not achieve considerable growth.
In the area of laser diodes, sales of dual wavelength pulsation lasers for CD/DVD (*6) and lasers for DVD moved towards recovery.
In addition, ROHM strengthened its lineup of SiC diode / transistor products, which the company began selling as next-generation high efficiency devices in 2010, and the group started mass-production of full SiC modules by modulizing these devices.
ROHM also continued to improve production efficiency at individual group factories in Thailand, the Philippines, and Tianjin, China, as well as making efforts to enhance the BCM (Business Continuity Management) structure.
*6. Dual wavelength pulsation laser for CD/DVD
Dual wavelength laser diode of self-pulsation type in which a single element generates two lights, of 780 nm used in playing CDs and 650 nm used in playing DVDs.
<Others>
Consolidated net sales for the year ended March 31, 2012 marked 51,656 million yen (a decrease of 0.0 percent from the year ended March 31, 2011), and segment losses were 482 million yen (segment profits of 4,633 million yen recorded in the year ended March 31, 2011).
In the resistors category, sales of super-small 0402 size resistors greatly increased, but overall sales slowed down.
In the tantalum capacitor category, sales decreased due to the effects of the flooding in Thailand.
In the module product category, as the result of enhancing product line up of LED lighting module products, which have been garnering attention, sales of power modules used in LED lighting and infrared reception modules for remote control steadily increased.
Demand for lighting products (LED lighting) also increased as demand for energy-saving products drastically increased for straight tube type LED lights. Consequently, the sales were on the rise.
In the sensor category, sales of proximity sensors were strong as smart phones enjoyed strong sales.
In the print head category, sales were sluggish because of adjustments continuing in the mini-printer market.
In the LED display category, as the existing mobile phone market was sluggish, sales of mainly dot-matrix displays slowed down.
In medical segments, micro blood testing systems started seeing an increase in sales after autumn in partnership with Arkray, Inc., a company that manufactures and sells medical equipment.
In the area of production systems, the ROHM Group continued efforts to strengthen production management systems and BCM structure, to improve production efficiency, and to reduce costs at a group factory in Dalian, China.
The net sales mentioned above are sales to external customers.
[2] Prospects for the Next Fiscal Year
Overall conditions concerning the performance prospects for the next fiscal year
In regards to the world economy, the US economy is seeing a recovery trend, but its resilience is weak. European economies remain in
a volatile state as the financial crisis continues to smolder. In the electronics industry, the flat screen TVs market, which greatly
decreased, seems to have at last gotten off the bottom, but did not reach to a full-fledged recover. We cannot help judging that the
market still remains in a severe state.
The ROHM Group continues to develop new products that fit market needs, and improve new product lineups, and especially develop
products in new fields and launch them on markets in a timely manner, to note SiC devices, sensor devises and LED related devices.
The group also continued to make utmost efforts to increase sales by expanding sales in the automotive and industrial equipment
markets where further market growth is expected, strengthen our customer support system in overseas markets, and restructure
production systems and cost reduction efforts, thus we are working to improve performance and corporate values.
With these conditions in mind, consolidated business result forecast throughout the fiscal year is as follows.
Net Sales: 315,000 million yen ( 3.4 percent up from the previous fiscal year)
Operating Income 14,000 million yen ( 120.4 percent up from the previous fiscal year)
Ordinary Income: 14,500 million yen ( 99.0 percent up from the previous fiscal year)
Net Income 10,000 million yen ( Loss of 16,100 million yen for this fiscal year)
ROHM CO., LTD. (6963) Financial Report for the Year Ended March 31, 2012
- 5 -
Details of consolidated sales prospects of individual segments are as follows.
Integrated circuits 149,200 million yen (0.1 percent up from the previous fiscal year)
Discrete semiconductor devices 106,700 million yen (2.8 percent up from the previous fiscal year)
Others 59,000 million yen (14.2 percent up from the previous fiscal year) The forecasts are based on an exchange rate of ¥80 to US$1.
(2) Financial Analysis
Analysis on status of assets, liabilities, net assets and cash flow
During the fiscal year ended March 31, 2012, total assets decreased by 22,662 million yen from the previous fiscal year and amounted to 737,326 million yen. The main factors behind the decrease are as follows: cash and time deposits decreased by 19,087 million yen, intangible fixed assets decreased by 16,615 million yen, and securities decreased by 12,476 million yen, respectively, while liquidity assets increased by 30,709 million yen (of which accrued insurance increased 29,504 million yen).
Liabilities increased by 11,837 million yen from the previous fiscal year and amounted to 103,046 million yen. The main cause was our accounts payable increasing by 6,682 million yen.
Net assets decreased by 34,498 million yen from the previous fiscal year and amounted to 634,280 million yen. The main causes behind were a decrease in owners’ equity by 26,353 million yen and foreign currency translation adjustments by 4,417 million yen, respectively.
Consequently, equity ratio decreased from the 87.7 percent from the previous fiscal year to 86.0 percent.
The cash flow status in the year ended March 31, 2012 is as follows.
Cash flow from operating activities recorded a decrease of 26,699 million yen, which amounts to a plus of 36,858 million yen (a plus of 63,557 million yen in the year ended March 31, 2011). This is mainly attributable to certain negative factors in that the net profit before tax changed to a loss and gains on insurance claims, which did not incur in the previous year, were earned, and to certain positive factors in that accrued losses increased and insurance payments accrued in this term, which did not incur in the previous year.
Cash flow from investment activities recorded a minus of 45,788 million yen (a minus of 52,985 million yen in the year ended March 31, 2011) by decrease in expenses 7,197 million yen. This is mainly attributable to time deposits changing from an increase to a decrease, which worked as a positive factor, and expenses increasing due to purchase of subsidiary stocks, which worked as a negative factor.
Cash flow from financial activities decreased by 13,940 million yen (a minus of 24,434 million yen in the year ended March 31, 2011) and recorded a minus of 10,494 million yen in the year ended March 31, 2012. It was mainly due to the positive effects of a decrease in expenses due to the acquisition of own shares.
As a result of adding a decrease in exchange rate changes of 2,551 million yen, cash and cash equivalents decreased by 21,976 million yen from the previous fiscal year, and amounted to 208,745 million yen.
Plant and equipment investment of 62,000 million yen and depreciation of 46,200 million yen are scheduled as events with potential to significantly affect cash flow in the next fiscal year.
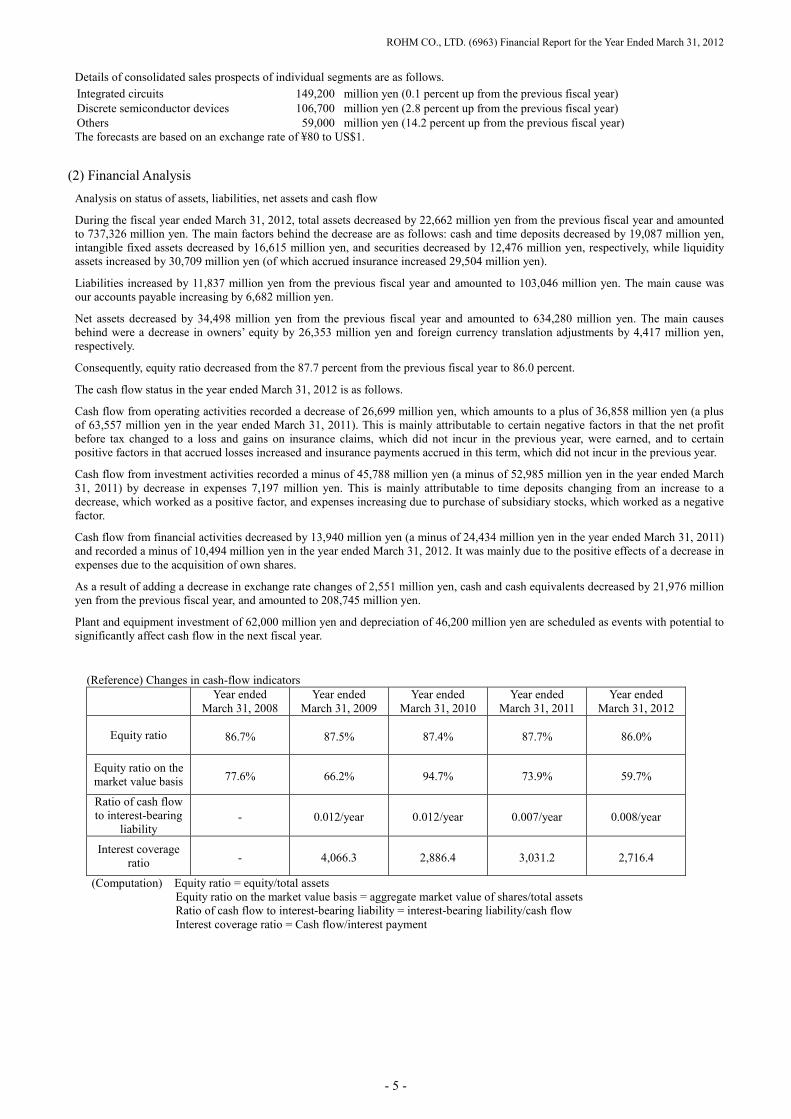
(Reference) Changes in cash-flow indicators
Year ended
March 31, 2008 Year ended
March 31, 2009 Year ended
March 31, 2010 Year ended
March 31, 2011 Year ended
March 31, 2012
Equity ratio 86.7% 87.5% 87.4% 87.7% 86.0%
Equity ratio on the market value basis 77.6% 66.2% 94.7% 73.9% 59.7%
Ratio of cash flow to interest-bearing
liability - 0.012/year 0.012/year 0.007/year 0.008/year
Interest coverage ratio - 4,066.3 2,886.4 3,031.2 2,716.4
(Computation) Equity ratio = equity/total assets Equity ratio on the market value basis = aggregate market value of shares/total assets Ratio of cash flow to interest-bearing liability = interest-bearing liability/cash flow Interest coverage ratio = Cash flow/interest payment

ROHM CO., LTD. (6963) Financial Report for the Year Ended March 31, 2012
- 6 -
(3) Basic Policy for Profit Distribution for the Year Ended March 31, 2012 and Year Ending March 31, 2013
[1] Basic Policy for Profit Distribution
In profit distribution to shareholders, ROHM is implementing actions in order to meet shareholders’ expectations for improving future value of the Company, by thoroughly considering the Company’s business results, financial status, and funding demands for business investment.
Under the global-scale restructuring and shakeout of the semiconductor industries, ROHM aggressively infuses funds to necessary capital investments and M&A to win out over competition, and strives to improve business performance from a long-term perspective, in order to live up to the expectations of shareholders.
On the other hand, from the long-term viewpoint of making continuous improvements to corporate value and ensuring stable and continuous payment of dividends, ROHM will make utmost efforts to stably pay dividends and maintain business performance and cash flow.
The world economy is expected to remain unstable for a while. In addition, due to the effects of the Great East Japan Earthquake and the flooding in Thailand, the electronics market still remains in a sluggish state. In the semiconductor industries, market growth in the mid- to long-term can be expected alongside further development of informatization despite such negative effects. However, global competition will intensify. The group is conducting company-wide efforts to enhance its corporate value through investment in cash reserves and generated cash flows both carefully and effectively, and ensure its manufacturing facilities are equipped with the proper equipment required to enhance its developmental and technological expertise. ROHM’s competitiveness is based on its expertise in technology, which leads to joint ventures and company acquisitions that ensure attractive returns. This allows ROHM to improve its net income per share (EPS) and return on equity (ROE).
[2] Profit Distribution for the Year Ended March 31, 2012
In consideration of obligations to provide a return to shareholders, the performance for this fiscal year (ended March 31, 2012), and future capital requirements, the year-end dividend will be 30 yen per share. As a result, the annual dividend, with 30 yen per share added as an interim dividend, is scheduled to be 60 yen per share.
[3] Schedule of Profit Distribution for the Year Ending March 31, 2013
Profit distributions for the year ending March 31, 2013 are scheduled, in consideration of performance for the next fiscal year and cash flow status, at 30 yen per share as an interim dividend and 30 yen per share as a year-end dividend, totaling 60 yen.
[4] Retirement of Treasury Stock
The ROHM Group considers the maximum treasury stock holdings to be 5 percent of the total outstanding shares, and, in principle, any amount beyond this limit shall be retired at the end of every fiscal year. The group continuously possesses treasury stocks on hand in order to secure management flexibility by utilizing them for merger and acquisition activity and other needs as required.
(4) Risk concerning the Company’s Businesses
The following are risks that may have a significant impact on the financial status and operating results of the ROHM Group.
[1] Risks Associated with Market Changes
The semiconductor industry and electronics component industry are subject to sharp, abrupt changes in market conditions, due to
factors such as the tendency of end-set manufacturers in adjusting production according to the sales status of electronic products, as
well as competition in prices and technology development. Prices are especially susceptible to sudden drops according to the
supply-demand relationship, while competition from emerging Asian manufacturers tends to cause instability with regard to
maintaining and increasing sales and procuring profits.

ROHM CO., LTD. (6963) Financial Report for the Year Ended March 31, 2012
- 7 -
[2] Exchange Risks
The ROHM Group has expanded its stronghold in global development, production, and sales; meaning the financial statements
prepared in each local currency are converted into the Japanese yen in order to prepare consolidated financial statements. Accordingly,
even if the values in local currencies remain the same, the profits and losses on the consolidated financial statement may be affected
because of the exchange rates at the time of conversion.
The ROHM Group, while conducting production activities in Japan and Asian countries, sells its products in Japan, Asia, the U.S., and
Europe. This means different currencies are used between production and sales bases and consequently exchange rate fluctuations
exert a continual influence on ROHM. Generally, a strong Japanese yen conversion adversely affects our business performance, while
a weak yen conversion has a favorable impact.
[3] Risks of Product Defects
As stated in the Company Mission, the ROHM Group places top priority on quality, and produces products subject to stringent quality
control standards. However, this does not guarantee that it never produces defective products or that it will never be liable to
compensate buyers for product defects. If a buyer should make a claim for defects with regard to ROHM products, company
performance might be adversely affected.
[4] Legal Risks
In order to manufacture products distinguished from those of other companies, the ROHM Group develops various new technologies
and know-how, and produces and sells products worldwide based on these proprietary technologies. The ROHM Group has a division
that specializes in the strict supervision of in-house activities so as to ensure that the technologies and know-how used by the Group do
not infringe on the intellectual property rights of other companies such as patent rights. In addition, in all business fields in which the
ROHM Group is involved, the Group complies with all relevant laws and regulations with respect to the utilization and handling of
exhaust air, drainage, harmful materials, waste treatment, surveys on soil/underground water pollution, and protection of the
environment, health, and safety. However, the Group may incur legal responsibilities in this respect due to unexpected events, possibly
having an adverse influence on business results.
[5] Natural Disasters and Geopolitical Risks
The ROHM Group performs development, manufacturing, and sales activities not only in Japan, but also worldwide. To diversify the
risks, the Group locates production lines at different bases as a countermeasure. However, these production bases may be damaged due
to earthquake, typhoon, flooding, and other natural disasters, or political uncertainty or international conflicts. Business results could
be adversely affected by stalled product supply or considerable changes in electronics markets due to these disasters.
[6] Mergers and Acquisitions Risks
The ROHM Group, taking into account future business prospects, considers it necessary to investigate and implement mergers and
acquisitions worldwide with a focus on entering new fields that are relevant to our existing business, and to always make utmost efforts
to improve corporate value and broaden the size of business. In conducting mergers and acquisitions, we thoroughly study, review, and
discuss before any acquisitions are made. Nonetheless, due to unexpected circumstances or significant changes in market forces after
an acquisition, an acquired business may not progress as expected and we may suffer loss in some cases as a result.
[7] Other Risks and Corporate Risk Management System
In addition to the above-mentioned risks, there are various other risks that may influence the financial condition and business
performance during business activities, such as risks related to logistics, material procurements, security leaks, and information
systems. The ROHM Group set up a “Risk Management and BCM (Business Continuity Management) Committee” with the aim of
averting these risks or minimizing such effects, by strengthening our risk management structure in ways that would consent business to
continue.

ROHM CO., LTD. (6963) Financial Report for the Year Ended March 31, 2012
- 8 -
2. Status of the ROHM Group
The ROHM Group consists of ROHM Co., Ltd., 49 consolidated subsidiaries (13 in Japan and 36 outside Japan) and 6 affiliated companies (4 in Japan and 2 outside Japan). We are a comprehensive electronic component manufacturer, whose principal business is the manufacture and sales of electronic components.
The group diagram and information on affiliated companies are given below.
Users
Sales
ROHM Semiconductor U.S.A.,LLC ROHM Semiconductor GmbH ROHM Semiconductor Korea Corporation ROHM Semiconductor Trading (Dalian) Co., Ltd. ROHM Semiconductor (Shanghai) Co., Ltd. ROHM Electronics (Shenzhen) Co., Ltd. ROHM Semiconductor Hong Kong Co., Ltd. ROHM Semiconductor Taiwan Co., Ltd. ROHM Semiconductor Singapore Pte., Ltd. ROHM Semiconductor Philippines Corporation ROHM Semiconductor (Thailand) Co., Ltd. ROHM Semiconductor Malaysia Sdn. Bhd. ROHM Semiconductor India Pvt. Ltd. ROHM Semiconductor do Brasil Ltda.
Manufacture,
Development and Sales
Kionix, Inc.
ROHM Co., Ltd.
Manufacture
ROHM Hamamatsu Co., Ltd. ROHM Tsukuba Co., Ltd. ROHM Wako Co., Ltd. ROHM Apollo Co., Ltd. ROHM Mechatech Co., Ltd. ROHM Korea Corporation ROHM Electronics Philippines, Inc. ROHM Integrated Systems (Thailand) Co., Ltd. ROHM Semiconductor (China) Co., Ltd. ROHM Electronics Dalian Co., Ltd. ROHM-Wako Electronics (MALAYSIA) Sdn. Bhd. ROHM Mechatech Philippines, Inc. ROHM Mechatech (Thailand) Co.,Ltd. ROHM Mechatech (Tianjin) Co.,Ltd.
Manufacture, Development and Sales
LAPIS Semiconductor Co., Ltd.
.
Manufacture
LAPIS Semiconductor Miyagi Co., Ltd.
LAPIS Semiconductor Miyazaki Co., Ltd.
Raw materials for semiconductor manufacturer
Raw materials
Semi-finished products
Finished products Finished products
Finished
products
Finished products
Raw materials Semi-finished products Finished products Metallic molds
Semi-finished products
Finished products
Raw materials
Semi-finished products
Finished products Raw materials
Manufacture,
Development and Sales
SiCrystal AG
Finished products
Manufacture,
Development and Sales
AGLED Co., Ltd.
Pro
du
cts
for
gen
eral
con
sum
ers
Fin
ish
ed p
rodu
cts
Raw
mat
eria
ls
Finished products
Raw
mat
eria
ls

ROHM CO., LTD. (6963) Financial Report for the Year Ended March 31, 2012
- 9 -
3. Management Policies
(1) ROHM’s Basic Management Policy
ROHM believes that, in creating and improving perpetual and overall corporate status, added-values created by the company’s
business activities should be allocated to all constituents, including shareholders, employees, and stakeholders in local communities in
appropriate proportions, while retained earnings should be allotted to business investment and efforts to increase its competitive
strength. To pursue this objective, it is also essential to obtain the understanding and cooperation of all those with a stake in the
company’s performance. Making ROHM shares more attractive to investors has been one of the highest priorities of company
management.
With these perspectives, ROHM has committed itself to developing market-leading products by focusing on high value-added system
ICs, Power Devices, LED related products, and Sensor devices for digital information technologies, mobile electronic equipment,
industrial instruments and automotive components, where we can expect further market expansion. As a fundamental policy, ROHM
pursues a stable supply of high quality, cost-competitive products in high volume through optimal utilization of its distinctive
production technologies, and will consequently maintain a leading position in the global electronic components market.
(2) Referenced Corporate Performance Indices
ROHM is moving forward with various efforts, including the development of new products, while reinforcing sales operations to
ensure profits. ROHM uses indices representing profits, such as EBITDA (*), as well as asset turnover ratio and plant and equipment
investment efficiency. In addition, we are also striving to improve the net income per share (EPS) and financial efficiency, in order to
enhance shareholder value.
* EBITDA (earnings before interest, taxes, depreciation, and amortization)
An index obtained by adding interest expenses and depreciation to income before income taxes and minority interests. It is commonly used to
compare corporate earning power internationally.
(3) Mid- to Long-term Corporate Strategies
Amidst anticipated expansion in the electronics industry over the medium to long term, and parallel to further progress of
informatization, global competition is expected to intensify, due mainly to broader demand fluctuations, ultimately mandating a
realignment of the industry and an elimination of noncompetitive businesses.
To ensure stable growth and a strong, well-balanced financial position under these circumstances, a range of measures should be
implemented: the development of original high value-added products, utilizing world-ranked advanced technologies, enhanced cost
competitiveness, the establishment of a global production and distribution network that conveys high customer satisfaction in both
domestic and overseas markets, as well as strengthening of sales and technical support for customers.
We also consider it extremely important to construct a concrete BCM system that maintains a stable supply chain in the event of
natural disasters.
ROHM puts top priority on consistent development and production systems and the significance of quality, and devotes ceaseless effort
to achieve these values.
As concrete measures, ROHM will enhance digital, analog, and integrated digital/analog technologies via continuous enhancements to
our R&D system. For this purpose, ROHM is reinforcing customer support and in-house R&D system for further future growth with
the development bases of the “Kyoto Technology Center”, “Yokohama Technology Center”, and “Optical Device Research Center” at
the core of technological enhancement.
ROHM is actively involved in a wide range of joint projects with a multitude of domestic and foreign universities regarding
next-generation R&D, including comprehensive industrial-academic collaboration alliances with Kyoto University and Tsinghua
University in China; joint efforts with the Semiconductor Industry Research Institute of Japan—a think-tank of the Japanese
semiconductor industry; and participation in other Japanese national leading-edge R&D projects that integrate
industry-government-academia expertise. ROHM is also promoting partnerships with other companies whenever necessary to
complement its technologies and consequently improve the efficiency of its R&D activities. Furthermore, ROHM is advancing with
research and development for the next generation by moving forward with the development of using SiC substrates, which are
expected to be far superior in terms of voltage endurance, high electric current, and low-loss to semiconductor devices made with
conventional silicon substrates, and will proceed with the introduction of these devices to the market. At the same time, ROHM will
move into new fields and technologies including bio-related business for medical related fields. In addition, the company is expanding
into new fields and technologies by enhancing the lineups of biochips for the medical equipment industry and developing non-volatile
logic ICs that nullify power consumption when on standby. ROHM makes the utmost efforts to build partnerships with SiCrystal AG, a
SiC wafers manufacturer in Germany, and Kionix, Inc. in the US, a supplier of MEMS acceleration sensors, which we acquired in
2009, as well as strengthening lineups of sensor related products via internal development. In addition, ROHM will enrich its product
lineup for LED products including LED lighting, peripheral LED devices that are mounted in LED lighting, and LED driver ICs.
At production bases, ROHM is responding to global competition in the industry by enhancing its cost competitiveness and supply
system to achieve global success. As concrete schemes, in the front-end process centered on domestic group factories, ROHM is
advancing with the enlargement and miniaturization of wafers, while in the back-end process - focused on overseas group factories,
ROHM is working to improve production efficiency and establish a prompt supply system of new high quality products globally.
By focusing first and foremost on quality not only in manufacturing operations but also in the field of technological development
including IC design and development of manufacturing technologies, the ROHM will extend its efforts group-wide to enhance product
reliability. ROHM will also continue to produce components such as wafers, photomasks, and lead frames in-house, develop products

ROHM CO., LTD. (6963) Financial Report for the Year Ended March 31, 2012
- 10 -
that exceed competitor products in terms of quality and reliability, and reduce lead times, ultimately improving its global
competitiveness.
In addition, with a view to expanding the company’s share in growing overseas markets, ROHM not only consolidates design center
networks in Europe, the USA, and Asia, but also strengthens sales, technology, and quality support systems for customers worldwide
by increasing local design personnel and FAEs. To respond to increasing global needs for digitalization and standardization, the
company makes the utmost efforts to reinforce the lineup of ASSPs (application-specific standard products) (*). At the same time,
ROHM is dedicated to restructuring and integrating corporate organizations both in and outside Japan, in order to continue improving
its business efficiency and accelerate the decision-making process.
In regards to sales, ROHM exerts itself to enrich the organizational structure so as to rapidly respond to changes in global markets and
enhance the sales system to non-Japanese customers by increasing sales strongholds in inland China, India, and Brazil.
In the area of environmental conservation, the ROHM Group will continue to establish and implement environmental management
systems based on “ISO 14001” as well as develop new products that contribute to energy conservation such as
low-power-consumption products. ROHM is committed at both domestic and overseas production bases to attaining zero-emission
goals by promoting the recycling of waste and continuing to support “green” procurement and supply. In Australia, ROHM has
promoted a tree-planting project as part of its efforts against global warming. Furthermore, ROHM swiftly responded to the RoHS
Directive, the European environmental regulations, and imposed analyses of toxic substances by acquiring accreditation of the
“ISO/IEC 17025” laboratory and undertaking business activities in consideration of global environmental protection.
As for CSR activities, ROHM signed the United Nations Global Compact (UNGC) in May 2011, and requested the ROHM Group as
well as procurement partners to uphold universal principles related to “human rights,” “labor standards,” “the environment” and
“corruption prevention.” The group also was the first to introduce ISO 26000, an international standard for social responsibility, and
promote CSR management within the scope of a global standard.
* ASSP (Application Specific Standard Product)
General-purpose ICs specializing in functions for specific fields. They are advantageous in that they serve as general-purpose
components as well as support a broad base of customers rather than being limited to specific customers.
(4) Priority Issues
The world economy gradually moved toward recovery from the abrupt economic slowdown triggered by the financial crisis in the US
in 2008. However, because of continuing tough employment environments in the individual regions, as well as the financial crisis in
Europe, pressure was newly put on the overall economy, thus it has not yet achieved a full-fledged recovery.
The electronics industry is expected to grow in the mid- to long-term due to increasing demand for digital home information equipment
and more sophisticated automotive electronic control systems. However, worldwide economic deterioration, technological competition
and price wars are expected to continuously intensify. These factors mandate the increasing necessity of a constant supply of
internationally competitive, innovative and high quality products and technologies with sustained efforts toward comprehensive cost
reduction efforts.
The ROHM Group had continued to use the “OKI” brand as a transitional measure regarding “OKI Semiconductor Co., Ltd.,” which
ROHM purchased in 2008. After its acquisition and the elapse of a certain period of time, their recognition as a member of the ROHM
Group increased. So, in October 2011, the company changed its name to “LAPIS Semiconductor Co., Ltd.” Furthermore, Maruzen
Electric Co., Ltd., a company that develops, manufactures, and sells lighting equipment was added to the ROHM Group in October
2011, and had its name changed to “AGLED Co., Ltd.” They are strengthening the lineup of household lighting products of the
“AGLED®” brand.
Under these circumstances, the ROHM Group will make utmost efforts in developing new products and technologies such as SiC
related products including SBD (*1), DMOSFET (*2), and IPM (*3) and new technologies, chip sets for next-generation embedded
processor by Intel in the US - through cooperation with LAPIS Semiconductor Co., Ltd., and LED lighting products. Such efforts, will
promote the development and expansion of sales of eco-friendly products targeted at improving power conversion efficiency and
power-saving devices in a variety of markets including automotive, flat-panel TVs, information and telecommunication, and mobile
equipment markets.
ROHM expanded its sensor business through acquisition of Kionix, Inc. in the US, in 2009, The company also increased sales of LED
lighting by way of cultivating new sales channels, thus strengthening efforts to develop new markets that will respond to business
needs in the near future.
Furthermore, ROHM will take vigorous steps to enter different market segments such as the human health and fitness business based
on bio-sensing via enhanced micro-fabrication technology it has cultivated, thus exerting company-wide efforts to synergize business
resources to the fullest extent in order to further increase stock value and corporate value.
On the other hand, in order to keep pace with rapid changes in the global and Asian electronic components markets, and increase
market share, ROHM will not only develop and disseminate new products but also continue with enhancements intended to strengthen
sales structures for non-Japanese customers, by increasing sales bases in inland China and FAEs, and developing new sales companies
set up in India and Brazil.
Regarding the effects of massive flooding in Thailand in October 2011, the ROHM Group was forced to temporarily suspend
operations at two production bases and one molding plant. Afterwards, in regards to the recovery efforts, ROHM made the utmost
efforts to minimize the effects on various fields of endeavor, with special consideration going to the recovery of production as the top
priority issue. In addition, the group resumed full-volume supply on January 1, 2012 by recovering production via a substitute
production system and outsourced consignment.

ROHM CO., LTD. (6963) Financial Report for the Year Ended March 31, 2012
- 11 -
In the future, based on the experiences of the Great East Japan Earthquake and the flooding in Thailand, ROHM will further strengthen
the management system needed for continuous business by reviewing and restructuring measures against natural disasters and
geopolitical risks. *1. SBD (Schottky Barrier Diode)
Diode of good properties at high frequency. *2. DMOSFET (Double-Defused MOSFET) SiC transistor that ROHM started mass-producing before everyone else in the world. It can
conduct both low-ON resistance and high speed movement. *3 IPM (Intelligent Power Module)
Power module embedded with driver circuits, power device including SBD of SiC, DMOSFET, and IGBT (Insulated Gate Bipolar Transistor), and a self-protection function.

ROHM CO., LTD. (6963) Financial Report for the Year Ended March 31, 2012
- 12 -
4. Consolidated Financial Statements for the Year Ended March 31, 2011
(1) Consolidated Balance Sheets (Unit: millions of yen)
Year Ended March 31, 2011 (March 31, 2011)
Year Ended March 31, 2012 (March 31, 2012)
Assets
Current assets
Cash and time deposits 230,286 211,199
Notes and accounts receivable trade 73,297 67,393
Securities 28,094 15,618
Commodities and products 23,525 24,366
Products in progress 35,350 38,508
Raw materials and inventories 25,077 30,652
Prepaid pension cost 2,263 2,250
Deferred tax assets 8,475 1,369
Refundable income taxes 397 2,887
Others 9,765 40,474
Allowance for doubtful accounts -286 -265
Total current assets 436,247 434,457
Fixed assets
Tangible fixed assets
Buildings and structures 211,806 208,252
Accumulated depreciation -127,164 -129,037
Buildings and structures (net) 84,641 79,215
Machinery, equipment and vehicles 476,651 460,311
Accumulated depreciation -416,041 -400,069
Machinery, equipment and vehicles (net) 60,609 60,242
Tools and furniture 42,672 40,600
Accumulated depreciation -36,637 -34,478
Tools and furniture (net) 6,035 6,121
Land 85,903 79,791
Construction in progress 15,026 20,015
Total tangible fixed assets 252,216 245,386
Intangible fixed assets
Goodwill 20,346 5,561
Others 7,879 6,049
Total intangible fixed assets 28,225 11,610
Investments and other assets
Investment securities 37,159 39,886
Deferred tax assets 1,597 1,735
Others 5,088 4,784
Allowance for doubtful accounts -545 -533
Total investments and other assets 43,299 45,872
Total fixed assets 323,741 302,869
Total assets 759,988 737,326

ROHM CO., LTD. (6963) Financial Report for the Year Ended March 31, 2012
- 13 -
(Unit: millions of yen)
Year Ended March 31, 2011
(March 31, 2011) Year Ended March 31, 2012
(March 31, 2012)
Liabilities
Current liabilities
Notes and accounts payable trade 21,904 23,979
Other accounts payable 22,486 29,168
Accrued income taxes 3,180 1,551
Deferred tax liabilities 1,053 1,227
Allowance for restructuring expenses 147 2,056
Allowance for disaster loss 1,745 61
Others 13,815 16,291
Total current liabilities 64,333 74,337
Long-term liabilities
Deferred tax liabilities 16,554 18,899
Liabilities for retirement benefits 8,344 7,700
Others 1,976 2,109
Total long-term liabilities 26,876 28,709
Total liabilities 91,209 103,046
Net assets
Shareholders' equity
Common share 86,969 86,969
Capital surplus 102,403 102,403
Retained earnings 633,388 589,999
Treasury stock-at cost -67,120 -50,084
Total shareholders' equity 755,641 729,288
Other comprehensive income
Net unrealized gain on available-for-sale securities 5,859 3,780
Foreign currency translation adjustments -94,669 -99,086
Total unrealized or translated gains/losses -88,810 -95,306
Minority interests 1,947 297
Total net assets 668,778 634,280
Total of liabilities and net assets 759,988 737,326

ROHM CO., LTD. (6963) Financial Report for the Year Ended March 31, 2012
- 14 -
(2) Consolidated Statement of Income and comprehensive income
(Consolidated Statement of Income) (Unit: millions of yen)
Year Ended March 31, 2011 (From April 1, 2010 To March 31, 2011)
Year Ended March 31, 2012 (From April 1, 2011 To March 31, 2012)
Net sales 341,885 304,652
Cost of sales 219,149 209,046
Gross profit 122,736 95,606
Selling, general and administrative expenses 89,999 89,253
Operating income 32,736 6,352
Non-operating income
Interest income 991 1,171
Dividend income 415 441
Rent Income 120 130
Others 444 1,036
Total non-operating income 1,971 2,781
Non-operating expenses
Foreign currency exchange loss 7,152 1,284
Laid-off expenses - 322
Others 749 240
Total non-operating expenses 7,902 1,847
Ordinary income 26,805 7,286
Extraordinary gains
Gain on sales of fixed assets 87 275
Reversal of allowance for doubtful accounts 34 -
Profit from ending retirement benefit scheme 1,796 -
Gain on insurance adjustments - 18,320
Total extraordinary gains 1,919 18,596
Extraordinary losses
Loss on sale/disposal of fixed assets 109 8
Abandonment loss on fixed assets 1,967 340
Impairment loss 2,516 24,180
Loss from disaster 995 -
Advance depreciation deduction of fixed assets - 134
Loss on revaluation of investment securities 270 164
Loss on revaluation of affiliate companies’ shares 341 812
Provision for allowance for doubtful accounts 5 -
Special severance payments for early retired employees 2,969 778
Restructuring expenses - 1,939
Environmental spending - 220
Affected amount accompanying application of accounting standards on asset retirement obligations
148 -
Total extraordinary losses 9,324 28,578
Income (Loss) before taxes 19,400 -2,696
Income taxes-current 7,372 3,724
Income tax-deferred 2,152 9,649
Total income taxes 9,524 13,374
Income (Loss) before minority interests 9,875 -16,070
Minority interests 243 35
Net income (Loss) 9,632 -16,106

ROHM CO., LTD. (6963) Financial Report for the Year Ended March 31, 2012
- 15 -
(Consolidated statement of comprehensive income) (Unit: millions of yen)
Year Ended March 31, 2011 (From April 1, 2010 To March 31, 2011)
Year Ended March 31, 2012 (From April 1, 2011 To March 31, 2012)
Income (Loss) before minority interests 9,875 -16,070 Other comprehensive income
Valuation difference of available-for-sale securities -2,261 -2,079 Other valuation difference of foreign exchange translations -21,833 -4,434
Total other comprehensive income -24,095 -6,514
Comprehensive Income -14,219 -22,585
(breakdown) Comprehensive Income Attributable to Parent Company Shareholders
-14,439 -22,602
Comprehensive Income Attributable to Minority Shareholders 219 17

ROHM CO., LTD. (6963) Financial Report for the Year Ended March 31, 2012
- 16 -
(3) Consolidated Statement of Shareholders' Equity (Unit: millions of yen)
Year Ended March 31, 2011 (From April 1, 2010 To March 31, 2011)
Year Ended March 31, 2012 (From April 1, 2011 To March 31, 2012)
Shareholders' equity
Common share
Balance at the beginning of the fiscal year 86,969 86,969
Changes during the fiscal year
Total changes during the fiscal year - -
Balance as of the end of the fiscal year 86,969 86,969
Capital surplus
Balance at the beginning of the fiscal year 102,403 102,403
Changes during the fiscal year
Retired treasury stocks - -17,039
Transfer from retained earnings to capital surplus - 17,039
Total changes during the fiscal year - -
Balance as of the end of the fiscal year 102,403 102,403
Retained earnings
Balance at the beginning of the fiscal year 637,999 633,388
Changes during the fiscal year
Dividends from retained earnings -14,243 -10,242
Net income (Loss) 9,632 -16,106
Transfer from retained earnings to capital surplus - -17,039
Total changes during the fiscal year -4,611 -43,388
Balance as of the end of the fiscal year 633,388 589,999
Treasury stock
Balance at the beginning of the fiscal year -57,105 -67,120
Changes during the fiscal year
Acquisition of treasury stock -10,014 -3
Retired treasury stocks - 17,039
Total changes during the fiscal year -10,014 17,035
Balance as of the end of the fiscal year -67,120 -50,084
Total shareholders' equity
Balance at the beginning of the fiscal year 770,267 755,641
Changes during the fiscal year
Dividends from retained earnings -14,243 -10,242
Net income (Loss) 9,632 -16,106
Acquisition of treasury stock -10,014 -3
Total changes during the fiscal year -14,625 -26,352
Balance as of the end of the fiscal year 755,641 729,288

ROHM CO., LTD. (6963) Financial Report for the Year Ended March 31, 2012
- 17 -
(Unit: millions of yen)
Year Ended March 31, 2011 (From April 1, 2010 To March 31, 2011)
Year Ended March 31, 2012 (From April 1, 2011 To March 31, 2012)
Total of Accumulated other comprehensive income
Net unrealized gain on available-for-sale securities
Balance at the beginning of the fiscal year 8,121 5,859
Changes during the fiscal year
Changes (net) in sections other than shareholders' equity during the fiscal year -2,262
-2,079
Total changes during the year -2,262 -2,079
Balance as of the end of the fiscal year 5,859 3,780
Foreign currency translation adjustments
Balance at the beginning of the fiscal year -72,860 -94,669
Changes during the fiscal year
Changes (net) in sections other than shareholders' equity
during the fiscal year
-21,809 -4,416
Total changes during the year -21,809 -4,416
Balance as of the end of the fiscal year -94,669 -99,086
Total of accumulated other comprehensive income
Balance at the beginning of the fiscal year -64,738 -88,810
Changes during the fiscal year
Changes (net) in sections other than shareholders' equity during the fiscal year
-24,071 -6,496
Total changes during the year -24,071 -6,496
Balance as of the end of the fiscal year -88,810 -95,306
Minority interests
Balance at the beginning of the fiscal year 2,189 1,947
Changes during the fiscal year
Changes (net) in sections other than shareholders' equity during the fiscal year
-242 -1,649
Total changes during the year -242 -1,649
Balance as of the end of the fiscal year 1,947 297
Total net assets
Balance at the beginning of the fiscal year 707,718 668,778
Changes during the fiscal year
Dividends from retained earnings -14,243 -10,242
Net income (Loss) 9,632 -16,106
Acquisition of treasury stock -10,014 -3
Changes (net) in sections other than shareholders' equity during the fiscal year
-24,313 -8,145
Total changes during the year -38,939 -34,498
Balance as of the end of the fiscal year 668,778 634,280

ROHM CO., LTD. (6963) Financial Report for the Year Ended March 31, 2012
- 18 -
(4) Consolidated Statement of Cash Flow (Unit: millions of yen)
Year Ended March 31, 2011 (From April 1, 2010 To March 31, 2011)
Year Ended March 31, 2012 (From April 1, 2011 To March 31, 2012)
Operating Activities
Net income (Loss) before tax and other adjustments 19,400 -2,696
Depreciation 39,019 34,924
Impairment loss 2,516 24,180
Gain on insurance adjustments - -18,320
Amortization of goodwill 7,058 5,251
Increase (-decrease) in net liability for retirement benefits -1,830 -629
Decrease (-increase) in prepaid pension cost 351 12
Increase (-decrease) in allowance for restructuring expenses -282 1,911
Increase (-decrease) in allowance for disaster loss 1,745 -1,684
Interest and dividends income -1,406 -1,613
Foreign currency exchange loss (-gain)-net 2,427 842
Revaluation loss (-gain) on securities/investment securities 611 977
Decrease (-increase) in notes and accounts receivable -trade 2,246 5,336
Decrease (-increase) in inventories -1,493 -13,791
Increase (-decrease) in notes and accounts payable -trade 3,104 2,274
Increase (-decrease) in other accounts payable -4,999 998
Others 1,884 -1,926
Subtotal 70,354 36,045
Insurance proceeds received - 6,593
Interest and dividends -received 1,384 1,530
Interest expenses -21 -13
Income taxes -refunded (-paid) -8,160 -7,297
Net cash used by operating activities 63,557 36,858
Investing Activities
Decrease (-increase) in time deposits -6,310 5,039
Purchase of securities and investment securities -7,746 -10,204
Revenue from sales and paying-off of securities and investment securities
4,498 6,675
Purchases of tangible fixed assets -40,628 -41,708
Proceeds from sales of tangible fixed assets 208 361
Expense accompanying purchases of subsidiary shares -601 -4,521
Others -2,405 -1,430
Net cash used in investing activities -52,985 -45,788
Financing Activities
Purchases of treasury stock -10,014 -3
Dividends paid -14,243 -10,242
Others -176 -248
Net cash used in financing activities -24,434 -10,494
Effect of Exchange Rate Changes on Cash and Cash Equivalents -14,551 -2,551
Net Increase(-decrease) in Cash and Cash Equivalents -28,414 -21,975
Cash and Cash Equivalents at Beginning of the Fiscal Year 259,135 230,721
Cash and Cash Equivalents at End of the Fiscal Year 230,721 208,745
ROHM CO., LTD. (6963) Financial Report for the Year Ended March 31, 2012
- 19 -
(5) Note on Going Concern
No applicable items
(6) Major Items for the Preparations of Consolidated Financial Statements
Items regarding standards for accounting procedures
Standard for accounting important allowance
Liabilities for retirement benefits
In order to provide retirement benefits to employees, ROHM is allocating the allowance based on retirement liabilities and estimated
amount for pension assets as of the end of the year ended March 31, 2012.
Actuarial gain and loss are amortized in the fiscal year following the fiscal year in which the gain or loss is recognized by the
straight-line method over stated years that do not exceed the average remaining service period of eligible employees as of the
relevant consolidated fiscal year (10 to 13 years).
Past service liability is calculated by the straight-line method, using a certain number of years (10 to 13 years) within the average
remaining service period of the employee at the time of occurrence, and allotting it as costs.
Regarding matters other than those mentioned above, since there are no significant changes from the descriptions in the latest
securities report (submitted on June 29, 2011), information other than that listed above has been omitted from this disclosure.
(7) Change in Indication Method
(Consolidated cash flow statement)
In the consolidated fiscal year ended March 31, 2011, “Expense accompanying purchase of subsidiary shares”, which was included
in “Others” of “Investing Activities,” became more significant in terms of monetary value, therefore ROHM decided to record the
amount independently from the current consolidated fiscal year. In order to reflect the change in posting method, the company has
changed the sequence in consolidated financial statement.
As a result, -3,006 million yen, which was listed in “Others” in “Investing Activities” in the consolidated cash flow statement of the
previous year, was changed to -601 million yen of “Expense accompanying purchase of subsidiary shares” and -2,405 million yen of
“Others.”
(8) Additional Information
(Accounting standards and implementation guidance on correction of accounting changes and errors)
Effective from the accounting changes and errors after the beginning of the current fiscal year, the group is applying the
“Accounting Standard for Accounting Changes and Error Corrections” (ASBJ Statement No.24 of December 4, 2009) and
“Guidance on Accounting Standard for Accounting Changes and Errors” (ASBJ Guidance No.24 of December 4, 2009).

ROHM CO., LTD. (6963) Financial Report for the Year Ended March 31, 2012
- 20 -
(9) Notes on Consolidated Financial Statements
(Notes on Consolidated Statement of Changes in Shareholders’ Equity)
Year ended March 31, 2011 (From April 1, 2010 to March 31, 2011)
1. Classifications and total number of shares outstanding and classifications and numbers of treasury stocks (Unit: thousand shares)
At the beginning of the year ended March 31, 2011
Increase during the year ended
March 31, 2011
Decrease during the year ended
March 31, 2011
Number of shares on March 31, 2011
Shares outstanding
Common shares 115,300 - - 115,300
Total 115,300 - - 115,300
Treasury stocks
Common shares 5,732 1,752 - 7,484
Total 5,732 1,752 - 7,484
(Note) The 1,752 thousand units under own shares include 1,749 thousand units acquired according to Article 156 of Companies Act and 2 thousand shares of less than one unit that were purchased.
2. Notes on dividends
(1) Dividend paid
(Decision) Classification of
shares Total dividend
amount Dividend per share Base date Date of Effect
Annual meeting of shareholders
June 29, 2010 Common shares 7,121 million yen 65.00 yen March 31, 2010 June 30, 2010
Board of Directors’ meeting
November 8, 2010 Common shares 7,121 million yen 65.00 yen September 30, 2010 December 3, 2010
(2) Of the dividends whose base date belongs to the year ended March 31, 2011, those whose dates of effect are after the end of the year
(Decision) Classification
of shares Total dividend
amount Assets available
for dividends Dividend per
share Base date Date of Effect
Annual meeting of shareholders June 29, 2011
Common shares
7,008 million yen Retained earnings
65.00 yen March 31, 2011 June 30, 2011
Year ended March 31, 2012 (From April 1, 2011 to March 31, 2012)
1. Classifications and total number of shares outstanding and classifications and numbers of treasury stocks (Unit: thousand shares)
At the beginning of the year ended
March 31, 2012
Increase during the year ended March
31, 2012
Decrease during the year ended March 31,
2012
Number of shares on March 31, 2012
Shares outstanding
Common shares (Note 1) 115,300 - 1,900 113,400
Total 115,300 - 1,900 113,400
Treasury stocks
Common shares (Note 1,2) 7,484 0 1,900 5,585
Total 7,484 0 1,900 5,585
(Note) 1. Regarding the number of issued stocks, the decrease 1,900 thousand units in own shares were due to cancellation. 2. Concerning common shares, the increase of 0 thousand units of treasury stocks comes from the purchase of odd stock.
2. Notes on dividends
(1) Dividend paid
(Decision) Classification of
shares Total dividend
amount Dividend per share Base date Date of Effect
Annual meeting of shareholders June 29, 2011
Common shares 7,008 million yen 65.00 yen March 31, 2011 June 30, 2011
Board of Directors’ meeting
November 9, 2011 Common shares 3,234 million yen 30.00 yen September 30, 2011 December 2, 2011

ROHM CO., LTD. (6963) Financial Report for the Year Ended March 31, 2012
- 21 -
(2) Of the dividends whose base date belongs to the year ended March 31, 2012, those whose dates of effect are after the end of the
year
(Decision) Classification of
shares Total dividend
amount Assets available
for dividends Dividend per
share Base date Date of Effect
Annual meeting of shareholders June 28, 2012
Common shares 3,234 million yen Retained earnings
30.00 yen March 31, 2012 June 29, 2012
(Segment information)
1. Segment information
(1) Overview of reportable segments
The reportable segments of the ROHM Group are units of the group for which separated financial information is available, and which is the subject of the periodical review by the board of directors for the purpose of deciding the distribution of management resources and evaluating business performance.
The ROHM Group is a comprehensive manufacturer of electronic components, and sets up operational divisions by individual product categories at its headquarters. Each operational division draws up comprehensive production plans and business strategies for both domestic and overseas operations, and develops global production activities. Therefore, from a management standpoint, the group attaches great importance to the supervision of profits and losses by operational segments organized as operational divisions of individual product categories. For this reason, the group is consolidating operational segments in consideration of characteristics of the products each operational division is manufacturing and similarities of production process, and setting up two reportable segments as “ICs” and “Discrete semiconductor devices”.
In the “ICs” segment, products such as analog ICs, logic ICs, memory ICs and ASICs are manufactured and foundry business operations are conducted.
Products manufactured in the “Discrete semiconductor devices” segment include diodes, transistors, light-emitting diodes, and laser diodes.
(2) Calculating method of amount of sales, profit or loss, asset, liabilities, and other items of individual segment information
Accounting processing for each reported operating segment is basically identical to accounting standards used for compiling consolidated financial statements.
Profits of reported segments are operating profits. “Internal sales between individual segments or amount transferred” are calculated based on market price.
Although assets of common categories such as sales and administrative expenses, are included in “Adjustments,” depreciation costs derived from these assets are allocated to individual segments according to in-house standards to calculate individual segment profits.
(3) Information regarding amount of sales, profit or loss, asset, liabilities, and other items of individual segment information
The year ended March 31, 2011 (From April 1, 2010 to March 31, 2011) (Unit: millions of yen)
Reportable segments
Others (Note) 1
Total Adjusted amount (Note) 2
Amount on consolidated
income statement
ICs Discrete
semiconductor devices
Subtotal
Sales Sales to customers 176,672 113,543 290,216 51,669 341,885 - 341,885 Inter-segment sales or transfer
2,067 1,191 3,259 5 3,264 -3,264 -
Total 178,740 114,734 293,475 51,675 345,150 -3,264 341,885
Segment profit 6,599 19,036 25,635 4,633 30,269 2,467 32,736
Segment asset 130,262 81,655 211,918 38,040 249,958 510,030 759,988
Other items Depreciation expense 19,872 14,789 34,662 5,523 40,185 -1,244 38,941 Depreciation of goodwill
6,817 192 7,010 48 7,058 - 7,058
Increase in tangible fixed asset and intangible fixed asset
15,574 17,140 32,715 6,316 39,031 3,341 42,373
(Note) 1. “Others” is an operational segment that is not included in reportable segments, consisting of business in resistors, printheads, optical modules, tantalum capacitors, power modules, and lightings.

ROHM CO., LTD. (6963) Financial Report for the Year Ended March 31, 2012
- 22 -
2. Adjustments are as follows.
[1] The adjusted amount of the segment profit, -2,467 million yen, mainly includes general administrative expenses of -1,100 million yen that do not attribute to the segment, and the settlement adjusted amount of 3,567 million yen, which is not allocated to the segment (such as adjustment for retirement benefits).
[2] The adjusted amount of 510,030 million yen in segment assets contains corporate assets of 514,861 million yen that have not been allocated to individual segment information and a downward adjustment of fixed assets of -4,830 million yen. Corporate assets do not belong to reported segments, consisting of cash and time deposits of 230,286 million yen, land of 85,903 million yen, and notes receivable and accounts receivable of 73,297 million yen.
[3] Adjustments to increases in tangible fixed assets and intangible fixed assets apply to fixed assets of common categories such as sales and administrative expenses.
The year ended March 31, 2012 (From April 1, 2011 to March 31, 2012) (Unit: millions of yen)
Reportable segments
Others (Note) 1
Total Adjusted amount (Note) 2
Amount on consolidated
income statement
ICs Discrete
semiconductor devices
Subtotal
Sales Sales to customers 149,134 103,861 252,995 51,656 304,652 - 304,652 Inter-segment sales or transfer
1,795 1,009 2,805 0 2,805 -2,805 -
Total 150,930 104,870 255,801 51,657 307,458 -2,805 304,652
Segment profit (-loss) -6,665 11,616 4,951 -482 4,469 1,883 6,352
Segment asset 128,798 83,362 212,161 35,446 247,608 489,718 737,326
Other items Depreciation expense 18,446 13,277 31,723 5,115 36,839 -1,914 34,924
Depreciation of goodwill
4,953 174 5,127 123 5,251 - 5,251
Increase in tangible fixed asset and intangible fixed asset
30,132 13,484 43,616 7,603 51,220 2,793 54,014
(Note) 1. “Others” is an operational segment that is not included in reportable segments, consisting of business in resistors, printheads, optical modules, tantalum capacitors, power modules, and lightings.
2. Adjustments are as follows.
[1] The adjusted amount of the segment profit (loss), 1,883 million yen, mainly includes general administrative expenses of -623 million yen that do not attribute to the segment, and the settlement adjusted amount of 2,506 million yen, which is not allocated to the segment (such as adjustment for retirement benefits).
[2] The adjusted amount of 489,718 million yen in segment assets contains corporate assets of 494,432 million yen that have not been allocated to individual segment information and a downward adjustment of fixed assets of -4,714 million yen. Corporate assets do not belong to reported segments, consisting of cash and time deposits of 211,199 million yen, land of 79,791 million yen, and notes receivable and accounts receivable of 67,393 million yen.
[3] Adjustments to increases in tangible fixed assets and intangible fixed assets apply to fixed assets of common categories such as sales and administrative expenses.
2. Relevant information
Previous fiscal year (From April 1, 2010 to March 31, 2011)
(1) Information on individual products and services
As the classification of products and services is identical to segment classification, it has been omitted.
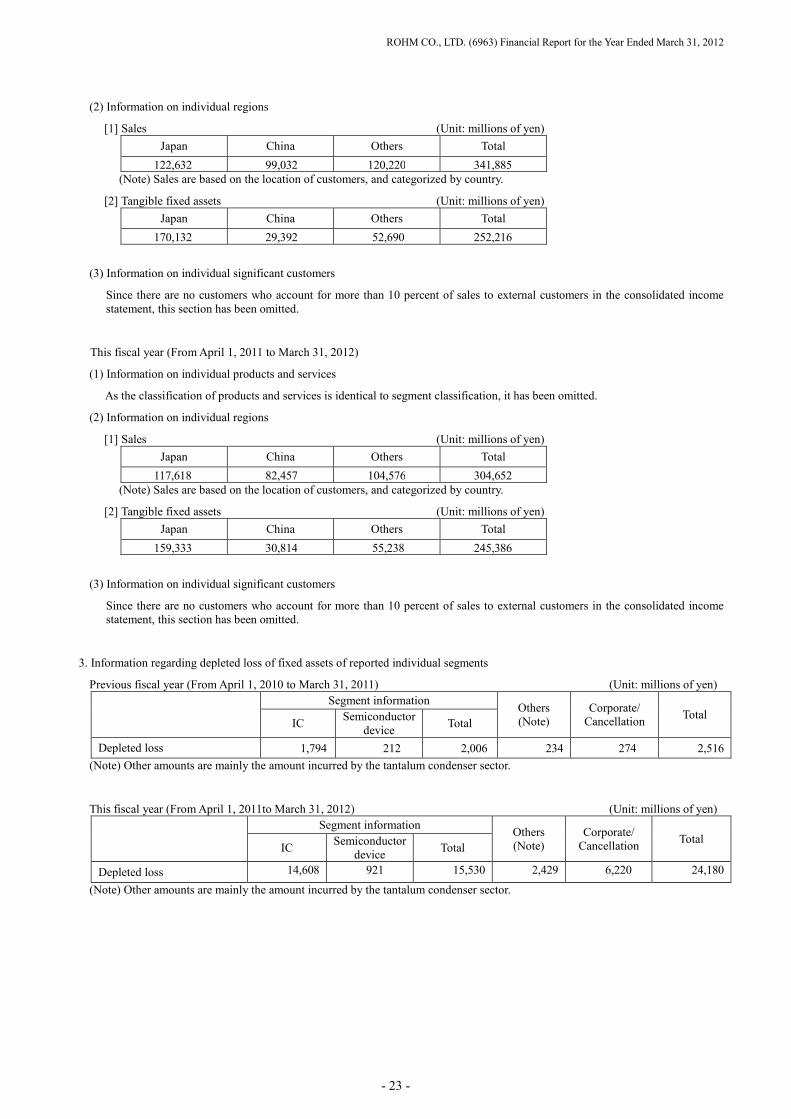
ROHM CO., LTD. (6963) Financial Report for the Year Ended March 31, 2012
- 23 -
(2) Information on individual regions
[1] Sales (Unit: millions of yen)
Japan China Others Total
122,632 99,032 120,220 341,885
(Note) Sales are based on the location of customers, and categorized by country.
[2] Tangible fixed assets (Unit: millions of yen)
Japan China Others Total
170,132 29,392 52,690 252,216
(3) Information on individual significant customers
Since there are no customers who account for more than 10 percent of sales to external customers in the consolidated income statement, this section has been omitted.
This fiscal year (From April 1, 2011 to March 31, 2012)
(1) Information on individual products and services
As the classification of products and services is identical to segment classification, it has been omitted.
(2) Information on individual regions
[1] Sales (Unit: millions of yen)
Japan China Others Total
117,618 82,457 104,576 304,652
(Note) Sales are based on the location of customers, and categorized by country.
[2] Tangible fixed assets (Unit: millions of yen)
Japan China Others Total
159,333 30,814 55,238 245,386
(3) Information on individual significant customers
Since there are no customers who account for more than 10 percent of sales to external customers in the consolidated income statement, this section has been omitted.
3. Information regarding depleted loss of fixed assets of reported individual segments
Previous fiscal year (From April 1, 2010 to March 31, 2011) (Unit: millions of yen)
Segment information Others (Note)
Corporate/ Cancellation
Total IC
Semiconductor device
Total
Depleted loss 1,794 212 2,006 234 274 2,516
(Note) Other amounts are mainly the amount incurred by the tantalum condenser sector.
This fiscal year (From April 1, 2011to March 31, 2012) (Unit: millions of yen)
Segment information Others (Note)
Corporate/ Cancellation
Total IC
Semiconductor device
Total
Depleted loss 14,608 921 15,530 2,429 6,220 24,180
(Note) Other amounts are mainly the amount incurred by the tantalum condenser sector.

ROHM CO., LTD. (6963) Financial Report for the Year Ended March 31, 2012
- 24 -
4. Information regarding depreciation amount of goodwill and undepreciated balance
Previous fiscal year (From April 1, 2010 to March 31, 2011) (Unit: millions of yen)
Segment information Others (Note)
Corporate/ Cancellation
Total IC
Semiconductor device
Total
Undepreciated amount of the fiscal year ended March 31, 2011
19,101 708 19,809 536 - 20,346
(Note) 1. The amount under “Others” is for the lighting sector.
2. “Depreciation of goodwill” has been omitted, as similar information is disclosed in “1. Segment information (3) Information regarding amount of sales, profit or loss, asset, liabilities, and other items of individual segment information.”
This fiscal year (From April 1, 2011 to March 31, 2012) (Unit: millions of yen)
Segment information Others (Note)
Corporate/ Cancellation
Total IC
Semiconductor device
Total
Undepreciated amount of the fiscal year ended March 31, 2012
5,561 - 5,561 - - 5,561
(Note) “Depreciation of goodwill” has been omitted, as similar information is disclosed in “1. Segment information (3) Information regarding amount of sales, profit or loss, asset, liabilities, and other items of individual segment information.”
5. Information regarding profits of negative goodwill of reported individual segments
Previous fiscal year (From April 1, 2010 to March 31, 2011)
There is no relevant information.
This fiscal year (From April 1, 2011 to March 31, 2012)
There is no relevant information.
(Per Share Data)
Year ended March 31, 2011 Year ended March 31, 2012
Net asset per share 6,184 .91yen 5,880 .27yen
Net income (loss) per share 88 .7yen -149 .41yen
(Notes) 1. Net income per share after adjustment of residual securities is a net loss per share, and as residual securities do not exist, it has been omitted. The amount of net income per share after adjustment of residual securities is not posted as there are no residual securities.
2. The basis for the calculation of the net asset per share is as follows:
Year ended March 31, 2011 Year ended March 31, 2012
Total net asset 668,778 million yen 634,280 million yen
Amount deducted from the total of net asset 1,949 299
(Minority interests included in the above amount) (1,947) (297)
Year-end net asset from common shares 666,829 633,980
Year-end number of common shares used to calculate net asset per share
107,815 thousand shares 107,814 thousand shares
3. The basis for the calculation of the net income per share is as follows:
Year ended March 31, 2011 Year ended March 31, 2012
Net income (Loss) 9,632 million yen -16,106 million yen
Amount not attributable to common shareholders 1 1
Net income (loss) from common shares 9,631 -16,108
Average number of common shares during the year
109,357 thousand shares 107,815 thousand shares
(Significant subsequent events)
There is no relevant information.

ROHM CO., LTD. (6963) Financial Report for the Year Ended March 31, 2012
- 25 -
5. Others
(1) Production, orders and actual sales status
[1] Actual production
(Unit: millions of yen)
Year ended March 31, 2011 Year ended March 31, 2012
From April 1, 2010 To March 31, 2011
From April 1, 2011 To March 31, 2012
ICs 177,924 147,359
Semiconductor device 113,596 106,910
Total of reported segment 291,521 254,269
Other 52,947 51,659
Total 344,468 305,929
(Notes) The amounts above are calculated based on the average sale prices for each fiscal year and consumption tax and the like are excluded.
[2] Orders
(Unit: millions of yen)
Year ended March 31, 2011
From April 1, 2010 To March 31, 2011
Year ended March 31, 2012
From April 1, 2011 To March 31, 2012
Order received Order backlog Order received Order backlog
ICs 173,757 26,736 146,001 23,602
Semiconductor device 115,704 18,239 99,872 14,250
Total of reported segment 289,462 44,975 245,873 37,853
Other 51,758 8,715 50,353 7,412
Total 341,220 53,690 296,227 45,265
(Notes) The above amount does not contain consumption tax and the like.

ROHM CO., LTD. (6963) Financial Report for the Year Ended March 31, 2012
- 26 -
[3] Actual sales
Actual sales by product category (domestic) (Unit: millions of yen)
Year ended March 31, 2011
From April 1, 2010 To March 31, 2011
Year ended March 31, 2012
From April 1, 2011 To March 31, 2012
Sales Domestic Ratio Sales Domestic Ratio
ICs 70,825 40.1% 62,919 42.2%
Semiconductor device 37,849 33.3 37,394 36.0
Total of reported segment 108,675 37.4 100,314 39.7
Other 13,957 27.0 17,304 33.5
Total 122,632 35.9 117,618 38.6
Actual sales by product category (overseas) (Unit: millions of yen)
Year ended March 31, 2011
From April 1, 2010 To March 31, 2011
Year ended March 31, 2012
From April 1, 2011 To March 31, 2012
Sales Oversea Ratio Sales Oversea Ratio
ICs 105,847 59.9% 86,214 57.8%
Semiconductor device 75,693 66.7 66,466 64.0
Total of reported segment 181,541 62.6 152,681 60.3
Other 37,712 73.0 34,352 66.5
Total 219,253 64.1 187,033 61.4
Actual sales by product category (total) (Unit: millions of yen)
Year ended March 31, 2011
From April 1, 2010 To March 31, 2011
Year ended March 31, 2012
From April 1, 2011 To March 31, 2012
Sales Percent Distribution Sales Percent Distribution
ICs 176,672 51.7% 149,134 48.9%
Semiconductor device 113,543 33.2 103,861 34.1
Total of reported segment 290,216 84.9 252,995 83.0
Other 51,669 15.1 51,656 17.0
Total 341,885 100.0 304,652 100.0
(Notes) The above amount does not contain consumption tax and the like.
(2) Transfer of directors
There is no relevant information.