rohm semiconductor's micro site - rohm co., ltd ......ordinary profit to total assets operating...
TRANSCRIPT

ROHM Co., Ltd. Financial Highlights for the Year Ended on March 31, 2020
May 11, 2020
1. Consolidated Financial Results (Figures are rounded down to the nearest million yen. Any fraction less than the unit is rounded off.)
'20/3 '19/3 '21/3 (Projected)
Millions ofyen 362,885 398,989 -36,104 -9.0% Undecided - Undecided -
Millions ofyen 251,125 254,727 -3,602 -1.4% Undecided Undecided
Millions ofyen 82,269 88,352 -6,083 -6.9% Undecided Undecided
Millions ofyen 29,489 55,909 -26,420 -47.3% Undecided - Undecided -
(8.1%) (14.0%) (-5.9%)
Millions ofyen 35,774 64,689 -28,915 -44.7% Undecided - Undecided -
(9.9%) (16.2%) (-6.3%)
Millions ofyen 25,632 45,441 -19,809 -43.6% Undecided - Undecided -
(7.1%) (11.4%) (-4.3%)
Figures in ( ) indicate ratio to sales.
yen 247.66 431.29 -183.63 -42.6% Undecided Undecided
% 3.5 6.0
% 3.0 5.2
yen 7,185.83 7,332.04 -146.21 -2.0%
Millions ofyen 73,817 101,325 -27,508 -27.1%
Millions ofyen 38,941 57,291 -18,350 -32.0% Undecided - Undecided -
Millions ofyen 44,328 45,415 -1,087 -2.4% Undecided - Undecided -
Millions ofyen 33,384 39,578 -6,194 -15.7% Undecided - Undecided -
Millions ofyen (gain)401 (gain)3,927 (loss)3,526
yen/US$ 109.10 110.69 -1.59 -1.4% Undecided Undecided
(Note)
2. EBITDA is calculated by adding back depreciation to operating profit. Contact:
Net assets per share
EBITDA
Capital expenditures
Depreciation
Research and development costs
Foreign exchange gains (losses)
Foreign exchange rate(Average yen-dollar rate)
Operating profit
Ordinary profit
Profit attributable to owners of parent
Net income (loss) per share
ROE
Public Relations and Investor Relations Div., ROHM Co., Ltd.21, Saiin Mizosaki-cho, Ukyo-ku, Kyoto 615-8585 Japan +81-75-311-2121
1. Because it is difficult to calculate the rational financial results forecast at this stage, about projected data, we do it with undecided and do not list it. We will announce it immediately in futurewhen rational expectation is enabled.
Change fromthe previous year
Actual Actual Amount Percentage
ROA
AnnualChange fromthe previous
year
Change fromthe first six
months of theprevious year
Net sales
Cost of sales
Selling, general andadministrative expenses
First sixmonths
Note1
Note:This report is a translation of the financial highlights of the Company prepared in accordance with the provisions set forth in the Securities and Exchange Law and its related accounting regulations, and in conformty with accounting principles generally accepted in Japan. The original version of this report is written in Japanese. In the event of any discrepancies in words, accounts, figures, or the like between this report and the original, the original Japanese version shall govern.
Note2
-Financial Highlights1-

1. Consolidated Financial Results (Continued from the previous page)(Figures are rounded down to the nearest million yen. Any fraction less than the unit is rounded off.)
'20/3 '19/3
(Note)
170,432 183,313 -12,881 -7.0% Undecided - Undecided -
(Japan) (71,671) (73,787) (-2,116) (-2.9%) (-) (-) (-) (-)
(Asia) (84,821) (96,874) (-12,053) (-12.4%) (-) (-) (-) (-)
(Americas) (8,030) (7,136) (+894) (+12.5%) (-) (-) (-) (-)
(Europe) (5,908) (5,514) (+394) (+7.2%) (-) (-) (-) (-)
139,038 152,861 -13,823 -9.0% Undecided - Undecided -
(Japan) (45,490) (48,493) (-3,003) (-6.2%) (-) (-) (-) (-)
(Asia) (73,239) (83,870) (-10,631) (-12.7%) (-) (-) (-) (-)
(Americas) (8,579) (9,702) (-1,123) (-11.6%) (-) (-) (-) (-)
(Europe) (11,728) (10,795) (+933) (+8.6%) (-) (-) (-) (-)
33,275 40,158 -6,883 -17.1% Undecided - Undecided -
(Japan) (8,699) (10,112) (-1,413) (-14.0%) (-) (-) (-) (-)
(Asia) (21,264) (26,119) (-4,855) (-18.6%) (-) (-) (-) (-)
(Americas) (1,248) (1,022) (+226) (+22.1%) (-) (-) (-) (-)
(Europe) (2,063) (2,904) (-841) (-29.0%) (-) (-) (-) (-)
20,139 22,655 -2,516 -11.1% Undecided - Undecided -
(Japan) (3,579) (3,998) (-419) (-10.5%) (-) (-) (-) (-)
(Asia) (12,361) (14,160) (-1,799) (-12.7%) (-) (-) (-) (-)
(Americas) (1,799) (1,953) (-154) (-7.9%) (-) (-) (-) (-)
(Europe) (2,398) (2,543) (-145) (-5.7%) (-) (-) (-) (-)
362,885 398,989 -36,104 -9.0% Undecided - Undecided -
(Japan) (129,440) (136,392) (-6,952) (-5.1%) (-) (-) (-) (-)
(Asia) (191,686) (221,024) (-29,338) (-13.3%) (-) (-) (-) (-)
(Americas) (19,659) (19,815) (-156) (-0.8%) (-) (-) (-) (-)
(Europe) (22,098) (21,757) (+341) (+1.6%) (-) (-) (-) (-)
Consumer % 32.5 31.7 +0.8
Telecommunications 8.2 8.9 -0.7
Automotive 36.0 34.4 +1.6
Industrial 11.9 12.7 -0.8
Computers and OA 11.4 12.3 -0.9
Major End Products
Consumer
Telecommunications
Automotive
Industrial
Computers and OA
(Note) The above amounts are sales to external customers.
TV, Video Camera, Audio, Microwave Oven, Air Conditioner, Refrigerator, Washing Machine, Air Cleaner, DigitalStill Camera, Game Machine, Electronic Musical Instrument, Electronic Cigarette, Drone, etc.
Smartphone, FAX, Wearable Electronics(excludes Medical Equipment), etc.
Engine Control Unit, Air Bag, Car Navigation, Car Audio, ADAS, etc.
Medical Equipment, Electrical Measuring Equipment, Machine Tool, Vending Machine, Solar Power, Smart Meter,Security Equipment, Communications Infrastructures, Cloud Server etc.
PC, PC Server, Tablet PC, Printer, Data Storage(DVD, HDD, Semiconduntor Memory), Monitor, Terminal, etc.
AnnualChange fromthe previous
year
First sixmonths
Change fromthe first six
months of theprevious year
Sales by segment and by region
ICs
Discrete semiconductor devices
Modules
Others
Total
Sales by application
'21/3 (Projected)
Millions ofyen
Change fromthe previous year
Actual Actual Amount Percentage
-Financial Highlights2-

2.Relevant information(Figures are rounded down to the nearest million yen. Any fraction less than the unit is rounded off.)
'20/3 '19/3
Millionsof yen 8,550 17,119 -8,569 -50.1% Undecided - Undecided -
22,001 30,407 -8,406 -27.6% Undecided - Undecided -
1,922 1,979 -57 -2.9% Undecided - Undecided -
2,735 4,694 -1,959 -41.7% Undecided - Undecided -
3,731 3,089 +642 +20.8% Undecided - Undecided -
38,941 57,291 -18,350 -32.0% Undecided - Undecided -
Number 26,013 29,817 -3,804 -12.8%
Financial institution shareholding ratio % 26.40 31.47 -5.07
Foreign shareholding ratio % 40.40 38.79 +1.61
Domestic Number 5,693 5,757 -64 -1.1%
Overseas Number 16,498 17,142 -644 -3.8%
Total Number 22,191 22,899 -708 -3.1%
(Number of R&D employees) (Number) (2,836) (3,048) (-212) (-7.0%)
Number 43 44 -1
(Domestic) (Number) (10) (10) (0)
(Overseas) (Number) (33) (34) (-1)
Number 3 3 0
(Number) (0) (0) (0)
Number 1 1 0
(Number) (0) (0) (0)(Number of companies accounted for by equitymethod)
Discrete semiconductor devices
Modules
Others
Sales and administrative division
Total
Number of shareholders
Number of employees
Number of consolidated subsidiaries
Number of affiliated companies
(Number of companies accounted for by equitymethod)
Number of non-consolidated subsidiaries
Change fromthe first sixmonths of
the previousyear
Capital expenditures by individual segments
ICs
Change fromthe previous year
Actual Actual Amount Percentage
'21/3 (Projected)
Annual
Changefrom theprevious
year
First sixmonths
-Financial Highlights3-

Financial Report for the Year Ended March 31, 2020 (Japan GAAP, Consolidated)
May 11, 2020
Listed Company Name: ROHM CO., LTD. Stock Exchange Listings: Tokyo Code No.: 6963 URL https://www.rohm.com Company Representative: (Title) President (Name) Isao Matsumoto Contact Person: (Title) Senior Corporate Officer,
Director of Accounting & Finance Headquarters (Name) Kunio Uehara
TEL +81-75-311-2121 Scheduled Date of Annual Meeting of Shareholders June 26, 2020 Scheduled Dividend Payment Date June 29, 2020 Scheduled Date of Securities Report for Submission June 26, 2020 Supplementary Material Prepared for Account Closing: Yes Financial Results Briefing Available: Yes (For analysts and institutional investors)
(Figures are rounded down to the nearest million yen.)
1. Consolidated Financial Results for the Year Ended March 31, 2020 (From April 1, 2019 to March 31, 2020) (1) Consolidated Results of Operations (The percentages [%] represent change from the previous year.)
Net sales Operating profit Ordinary profit Profit attributable to owners
of parent Millions of yen % Millions of yen % Millions of yen % Millions of yen % Year ended March 31, 2020 362,885 -9.0 29,489 -47.3 35,774 -44.7 25,632 -43.6
Year ended March 31, 2019 398,989 0.5 55,909 -1.9 64,689 19.3 45,441 22.0
(Note) Comprehensive income Year ended March 31, 2020: 5,725 million yen (-87.4%) Year ended March 31, 2019: 45,507 million yen (-4.4%)
Net income
per share Diluted net income
per share Net income
to equity Ordinary profit to
total assets Operating profit
to net sales Yen Yen % % % Year ended March 31, 2020 Year ended March 31, 2019
247.66 431.29
244.90 ―
3.5 6.0
4.2 7.4
8.1 14.0
(Reference) Investment loss (-gain) on equity method Year ended March 31, 2020: — million yen Year ended March 31, 2019: — million yen
(2) Consolidated Financial Position
Total assets Net assets Equity ratio Net assets per share Millions of yen Millions of yen % Yen
Year ended March 31, 2020 Year ended March 31, 2019
848,873 874,427
715,479 766,754
84.2 87.6
7,185.83 7,332.04
(Reference) Shareholder’s equity Year ended March 31, 2020: 714,990 million yen Year ended March 31, 2019: 766,266 million yen
(3) Consolidated Cash Flows
Cash flows from operating
activities Cash flows from investing
activities Cash flows from financing
activities Cash and cash equivalents at
end of period Millions of yen Millions of yen Millions of yen Millions of yen
Year ended March 31, 2020 Year ended March 31, 2019
79,130 65,990
-8,676 -53,997
-17,075 -30,647
275,539 228,065
2. Dividend Details
Dividend per share Total annual
dividend
Shareholder payout ratio
(consolidated)
Dividend on net asset ratio (consolidated)
End of the first quarter
End of the interim
End of the third quarter
End of year Annual
Yen Yen Yen Yen Yen Millions of yen % % Year ended March 31, 2019 ― 75.00 ― 75.00 150.00 15,771 34.8 2.1 Year ended March 31, 2020 ― 75.00 ― 75.00 150.00 15,300 60.6 2.1 Year ending March 31, 2021 (Estimates)
― 75.00 ― 75.00 150.00
―
3. Consolidated Financial Results Forecast for the Year Ending March 31, 2021 (From April 1, 2020 to March 31, 2021) Because it is difficult to calculate the rational financial results forecast at this stage, about consolidated financial results forecast, we do it with undecided and do not list it. We will announce it immediately in future when rational expectation is enabled.

* Note
(1) Major Changes in Subsidiaries During the Year Ended March 31, 2020 (Changes to specified subsidiaries accompanying revision on the scope of consolidation): None
(2) Changes in Accounting Policies, Changes in Accounting Estimates, and Restatement of Revisions [1] Changes in accounting policies according to revisions to accounting standards: Yes [2] Changes in accounting policies other than items indicated in [1]: None [3] Changes in accounting estimates: None [4] Restatement of revisions: None
(3) Number of Shares Outstanding (common shares)
[1] Year-end number of shares outstanding (incl. treasury stocks)
Year ended March 31, 2020 110,000,000 shares
Year ended March 31, 2019 110,000,000 shares
[2] Year-end number of treasury stocks Year ended March 31, 2020 10,504,865 shares
Year ended March 31, 2019 5,493,365 shares
[3] Average number of shares during the period Year ended March 31, 2020 103,358,690 shares
Year ended March 31, 2019 105,316,328 shares (Reference) Summary of non-consolidated operating results 1. Non-consolidated Financial Results for Year Ended March 31, 2020 (From April 1, 2019 to March 31, 2020) (1)Non-consolidated Results of Operations (The percentages [%] represent change from the previous year.)
Net sales Operating profit Ordinary profit Net income
Millions of yen % Millions of yen % Millions of yen % Millions of yen %
Year ended March 31, 2020
Year ended March 31, 2019 309,598 342,360
-9.6 -1.8
6,473 23,969
-73.0 -12.1
24,501 44,034
-44.4 2.6
21,606 35,372
-38.9 32.1
Net income per share Diluted net income
per share Yen Yen
Year ended March 31, 2020
Year ended March 31, 2019 209.04 335.87
206.65 ―
(2)Non-consolidated Financial Position
Total assets Net assets Equity ratio Net assets per share
Millions of yen Millions of yen % Yen
Year ended March 31, 2020
Year ended March 31, 2019 518,473 528,371
413,884 456,060
79.8 86.3
4,159.85 4,363.94
(Reference) Shareholder’s equity Year ended March 31, 2020: 413,884 million yen Year ended March 31, 2019: 456,060 million yen
<Reasons for year-over-year variance in non-consolidated financial results> A variance between non-consolidated financial results for the fiscal years ended March 31, 2019 (prior year) and March 31, 2020 (current year) can be largely explained by lower sales and a higher burden of fixed costs in the current year as compared with the prior year.
*Disclosure Regarding Implementation Status of Auditing Procedures This financial report is not subject to auditing by Certified Public Accountant or Audit Firm. *Explanation on Adequate Usage of Financial Results Forecast Because it is difficult to calculate the rational financial results forecast at this stage, about consolidated financial results forecast, we do it with undecided and do not list it. We will announce it immediately in future when rational expectation is enabled.

ROHM CO., LTD. (6963) Financial Report for the Year Ended March 31, 2020
1
○ Table of Contents
1. Overview of Business Results and Financial Condition ............................................................................ 2 (1) Overview of Business Results for Fiscal Year Ended March 31, 2020 ................................................. 2 (2) Financial Condition ............................................................................................................................... 3 (3) Cash Flow ............................................................................................................................................. 4 (4) Future Outlook ...................................................................................................................................... 4 (5) Basic Policy for Profit Distribution and Dividends for Fiscal Year Ended March 31, 2020 and Fiscal
Year Ending March 31, 2021 ................................................................................................................ 4
2. Basic Thinking behind the Selection of Accounting Standards ................................................................. 5 3. Consolidated Financial Statements and Important Notes ........................................................................... 6
(1) Consolidated Balance Sheet .................................................................................................................. 6 (2) Consolidated Statement of Income and Consolidated Statement of Comprehensive Income ............... 8
(Consolidated statement of income) ...................................................................................................... 8 (Consolidated statement of comprehensive income) ............................................................................. 9
(3) Consolidated Statement of Shareholder’s Equity .................................................................................. 10 (4) Consolidated Statement of Cash Flow .................................................................................................. 12 (5) Notes on Consolidated Financial Statements ........................................................................................ 13
(Note on going concern) ........................................................................................................................ 13 (Changes in accounting policies) ........................................................................................................... 13 (Changes in presentation methods) ........................................................................................................ 13 (Segment information) ........................................................................................................................... 13 (Per share data) ...................................................................................................................................... 16 (Significant subsequent events) ............................................................................................................. 16
4. Others ......................................................................................................................................................... 17 Transfer of Directors .............................................................................................................................. 17
*Separately attached as supplementary material are “Financial Highlights for the Year Ended March 31, 2020.”
ROHM CO., LTD. (6963) Financial Report for the Year Ended March 31, 2020
2
1. Overview of Business Results and Financial Condition
(1) Overview of Business Results for Fiscal Year Ended March 31, 2020
General Overview of Business Performance
Overall, during the fiscal year ended March 31, 2020, the global economy faced difficult challenges as it continued to struggle
primarily due to the ongoing U.S.-China trade friction and China’s economic slowdown and, from the beginning of 2020, the global
outbreak of the new coronavirus (COVID-19) started to take a heavy toll on industrial production and consumer spending in China and
around the world.
By region, in the United States, capital spending remained constrained in the private sector and the growth of consumer spending
slowed. In China, the growth of consumer spending remained sluggish throughout 2019 and started decelerating sharply from the
beginning of 2020. Economic growth in Europe and Asia remained sluggish primarily due to the impact of the economic slowdown in
China. Japan’s economy also faced significant challenges mainly due to a decline in capital spending and exports and a slowdown in
consumer spending.
In the electronics industry, the automotive electronics market generally remained sluggish primarily due to a continuing downturn in
vehicle sales, despite rising demand for “safety” and “environmental performance” continuing to fuel the increasing use of in-vehicle
electronics around the world. In the industrial equipment market, market conditions for machine tools and industrial machines
deteriorated, and demand in the consumer product market also remained weak. Against such a backdrop, semiconductors and other
electronic components continued to face challenges.
Working within this business environment, the ROHM Group continued to strengthen product lineups for the automotive electronics
and industrial equipment markets – where mid- to long-term growth is expected – and to further strengthen its sales network in China.
Moreover, we at the ROHM Group directed time and resources to developing new products and technologies around a core of analog,
power and standard products as well as other technological fields where the ROHM Group excels, and also we established a technical
support system to be used for activities such as making system solution proposals to customers.
In terms of production, we continued to improve quality and efficiency, and pushed ahead with “production innovation” by building a
state-of-the-art quality management system and converting our production sites into smart factories (*1). In addition, we undertook
efforts to implement the centralized management of factories to ensure the further strengthening of our stable supply system and
improvements in production efficiency. Furthermore, we constructively invested in equipment that will increase the Group’s
production capacity in the mid to long term. This included accelerating the construction of a new factory for producing SiC devices
(*2), which have high growth potential going forward.
Under these circumstances, consolidated net sales for the fiscal year ended March 31, 2020 were 362,885 million yen, down 9.0%
from the prior year, and operating profit decreased 47.3% from the prior year to 29,489 million yen.
Ordinary profit also decreased 44.7% from the prior year to 35,774 million yen, while profit attributable to owners of parent
decreased 43.6% from the prior year to 25,632 million yen.
Moreover, EBITDA (*3), an accounting metric that we emphasize in the ROHM Group, was 73,817 million yen for the fiscal year
ended March 31, 2020, down 27.1% from the prior year.
*1. Smart factory
A factory that improves product quality and production efficiency by interconnecting production systems over a network.
*2. SiC (Silicon carbide) device
A compound semiconductor composed of Si (silicon) and C (carbon). SiC devices exponentially improve electrical power
conversion efficiency over earlier Si (silicon) devices because of a higher withstand voltage, lower ON resistance and faster
operating speed. They also operate stably at high temperatures.
*3. EBITDA (Earnings before interest, taxes, depreciation and amortization)
An accounting metric widely used around the world to compare businesses in terms of earning power, calculated by adding
interest and depreciation to a company’s pretax earnings. The ROHM Group simplifies the EBITDA calculation by adding
back depreciation to operating profit.
Overview of Performance by Segment
Integrated Circuits (ICs)
Consolidated net sales for the fiscal year ended March 31, 2020 were 170,432 million yen, down 7.0% from the prior year, and

ROHM CO., LTD. (6963) Financial Report for the Year Ended March 31, 2020
3
segment profit was 12,578 million yen, down 21.3% from the prior year.
In the automotive electronics market, although an increased number of isolated gate driver ICs (*4) for xEV (*5) and power ICs for
car bodies and advanced driver-assistance systems (ADAS) were newly adopted, sales of driver ICs for automotive infotainment (*6),
a mainstay of the market, decreased due to market downturn. In the industrial equipment market, sales of ICs for the factory
automation (FA) market, such as motor-driver ICs and power ICs, decreased. In the consumer product market, sales of ICs for
smartphones, personal computers (PC), televisions and other audio-visual products were generally challenging.
*4. Isolated gate driver IC
A kind of gate driver IC for driving power semiconductors like SiC and IGBT (*7) that incorporate a built-in insulating
element critical to protecting people and systems.
*5. xEV
A collective acronym for vehicles that use an electric power drive, such as electric vehicles (EV), hybrid vehicles (HV) and
plug-in hybrid vehicles (PHV).
*6. Infotainment
A collective term, mainly for automotive use, for systems that provide a combination of entertainment and information.
*7. IGBT (Insulated gate bipolar transistor)
A power semiconductor device that integrates a MOSFET and a bipolar transistor. As IGBTs offer both low ON resistance and
fast switching, they are widely used to control the voltage of large power supplies.
Discrete Semiconductor Devices
Consolidated net sales for the fiscal year ended March 31, 2020 were 139,038 million yen, down 9.0% from the prior year, and
segment profit was 10,407 million yen, down 65.4% from the prior year.
With regard to transistors, sales for PC storage applications increased, but sales for the consumer product and industrial equipment
markets, among other things, remained challenging. As for diodes, sales for smartphone applications increased, but sales for the
automotive electronics market, especially those for infotainment applications, decreased. Regarding power devices, IGBT sales grew
but SiC device sales declined, adversely affected by deteriorating conditions in the automotive electronics and industrial equipment
markets. Likewise, light-emitting diode (LED) sales for the consumer product and industrial equipment markets declined. Laser diode
sales also decreased, especially in the consumer product market.
Modules
Consolidated net sales for the fiscal year ended March 31, 2020 were 33,275 million yen, down 17.1% from the prior year, and
segment profit was 3,491 million yen, down 41.0% from the prior year.
With regard to printheads, sales for mobile payment terminals and other applications fell. As for optical modules, while sales of
sensor modules for smartphones declined, sales for the automotive electronics market grew with an increased adoption of automotive
LED modules for rear lights.
Others
Consolidated net sales for the fiscal year ended March 31, 2020 were 20,139 million yen, down 11.1% from the prior year, and
segment profit was 1,948 million yen, down 52.4% from the prior year.
With regard to resistors, in the automotive electronics market, sales for car body applications increased, while sales for infotainment
applications declined the most. Resistor sales also declined in the consumer product market. Sales of tantalum capacitors also fell,
especially in the PC market.
Sales referenced in the “Overview of Performance by Segment” section above were to customers outside of the ROHM Group.
(2) Financial Condition
Total assets decreased by 25,554 million yen from the end of the previous fiscal year to 848,873 million yen. The main factors behind
this were decreases of 21,446 million yen in investment securities, 9,244 million yen in inventories and 7,861 million yen in property,

ROHM CO., LTD. (6963) Financial Report for the Year Ended March 31, 2020
4
plant and equipment, partially offset by an increase of 30,042 million yen in cash and deposits.
Total liabilities increased by 25,720 million yen from the end of the previous fiscal year to 133,393 million yen. This was largely due
to an increase of 40,935 million yen in bonds payable, partially offset by decreases of 5,650 million yen in accounts payable (other),
4,147 million yen in income taxes payable and 2,747 million yen in current liabilities (other) (including 2,623 million yen in accrued
expenses).
Total net assets decreased by 51,275 million yen from the end of the previous fiscal year to 715,479 million yen. This decrease was
largely due to a 41,296 million yen purchase of treasury shares and decrease of 12,030 million yen in foreign currency translation
adjustment.
As a result, our equity ratio decreased to 84.2% from 87.6% at the end of the previous fiscal year.
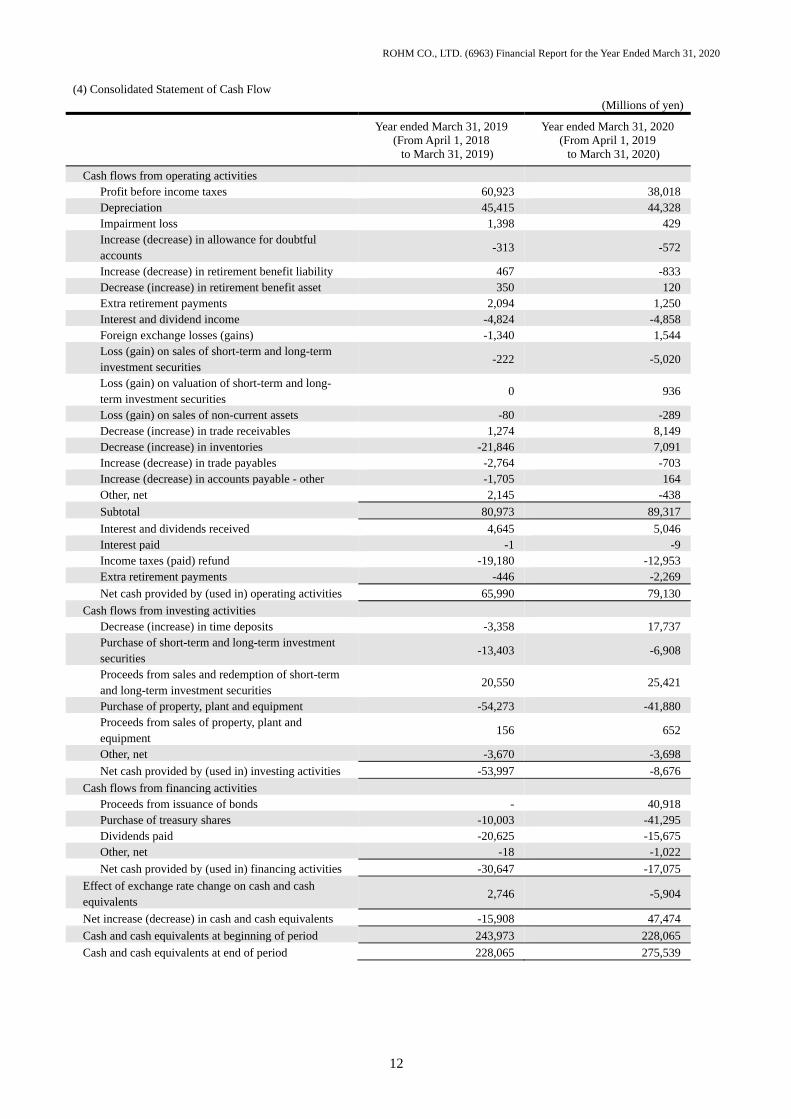
(3) Cash Flow
Cash flows from operating activities were positive 79,130 million yen, up 13,140 million yen from the previous fiscal year’s positive
65,990 million yen. This was largely due to decreases in inventories and trade receivables, partially offset by a decrease in profit
before income taxes.
Cash flows from investing activities were negative 8,676 million yen, an improvement of 45,321 million yen from the previous fiscal
year’s negative 53,997 million yen. This was largely due to decreases in time deposits, purchase of property, plant and equipment, and
purchase of short-term and long-term investment securities.
Cash flows from financing activities were negative 17,075 million yen, an improvement of 13,572 million yen from the previous
fiscal year’s negative 30,647 million yen. This was largely due to an increase in proceeds from issuance of bonds and a decrease in
dividends paid, partially offset by an increase in purchase of treasury shares.
After factoring in a decrease of 5,904 million yen in effect of exchange rate change on cash and cash equivalents, cash and cash
equivalents increased 47,474 million yen from the end of the previous fiscal year to 275,539 million yen.
(4) Future Outlook
Since early 2020, the global outbreak of COVID-19 has had wide-ranging global impacts, causing a sharp decline in consumer
spending and seriously disrupting companies’ activities, such as the procurement of parts and materials, production and logistics.
Currently, no one seems to be able to say when the COVID-19 outbreak will end. As COVID-19-related restrictions are imposed on
our production and sales activities around the world, including in China, the Philippines and Malaysia, the ROHM Group’s business
activities are being severely restricted, resulting in temporary production suspensions or lower capacity utilization.
Given such circumstances, we have taken steps to strengthen the biosecurity system at our production and sales bases around the
world, implement measures to maintain the health of the ROHM Group’s employees and ensure the continuation of a stable supply
system to customers. At the same time, by taking into consideration the possibility that the impact of the COVID-19 outbreak may
continue for an extended period of time, we have implemented a variety of financial stabilization measures, including establishing
commitment lines.
As it is very difficult for us to forecast, at this stage, the impact that the COVID-19 outbreak may have on our business performance
going forward, we have decided not to provide financial results forecast for the fiscal year ending March 31, 2021 at this time. We will
announce financial results forecast for the upcoming fiscal year when we can more accurately forecast our business performance
during the period.
(5) Basic Policy for Profit Distribution, and Dividends for Fiscal Year Ended March 31, 2020 and Fiscal Year Ending March
31, 2021
[1] Basic Policy for Profit Distribution
In the semiconductor and electronic component business, the ROHM Group wants to meet shareholder expectations by further
improving business results from both mid- and long-term perspectives through forward-looking investments in equipment, plants, and
research and development (R&D) activities, as well as in merger and acquisition (M&A) activities.

ROHM CO., LTD. (6963) Financial Report for the Year Ended March 31, 2020
5
The ROHM Group believes that, while it is important to continue these efforts to achieve sustainable growth, it is also necessary to
find ways to share profits that can balance our financial conditions and capital requirements with investor expectations and thus to
improve our overall corporate value.
The basis of our policy for shareholder returns is to ensure stable ordinary dividend payouts to shareholders. We will continue to do
our best to avoid dividend reduction to the extent possible, barring sudden changes in our business performance or financial conditions,
and to raise the level of ordinary dividend payouts to shareholders by further improving our business performance over the long term.
Furthermore, we will ensure that our consolidated dividend payout ratio is not less than 30%. We will adopt a proactive stance on
shareholder returns, such as considering additional measures to redistribute profits to shareholders if the situation permits.
With regard to the free cash flow generated each year, we will use this cash flow for capital expenditures and investments in M&A
activities to further improve shareholder value in the mid to long term. At the same time, we will continue to look for ways to improve
our financial metrics such as return on equity (ROE) by taking into full consideration our balance sheet structure, such as avoiding an
excessive buildup of surplus funds.
[2] Profit Distribution for Fiscal Year Ended March 31, 2020
In light of our business performance for the fiscal year ended March 31, 2020 and our policy of ensuring stable dividend payouts to
shareholders, we plan to pay a year-end dividend of 75 yen per share, which together with the interim dividend payout of 75 yen per
share, will result in a total dividend of 150 yen per share for the full year.
[3] Profit Distribution Plan for Fiscal Year Ending March 31, 2021
Profit distribution for the fiscal year ending March 31, 2021 will take into consideration our business performance and cash flow in
that fiscal year, as well as our policy of ensuring stable dividend payouts to shareholders. We plan to pay a total of 150 yen per share
for the upcoming fiscal year, which consists of an interim dividend of 75 yen per share and a year-end dividend of 75 yen per share.
[4] Retirement of Treasury Shares
As a guideline, the ROHM Group sets 5% of its total outstanding shares as the maximum limit of its treasury stock holdings, and, in
principle, any amount beyond this limit is retired at the end of each fiscal year. Also, the Group always keeps on hand a certain amount
of treasury stocks, which is no more than 5% of its total outstanding shares, in order to ensure management flexibility, such as for
M&A activities and other needs as required.
2. Basic Thinking behind the Selection of Accounting Standards
The ROHM Group’s accounting practices comply with Japanese accounting standards.
In preparation for the future application of the International Accounting Standards (IAS) and the International Financial Reporting
Standards (IFRS), the ROHM Group has been conducting related research and analyses, including identifying differences between
IAS/IFRS and Japanese accounting standards, but no decision has been made yet as to when the ROHM Group will adopt IAS/IFRS.
ROHM CO., LTD. (6963) Financial Report for the Year Ended March 31, 2020
6
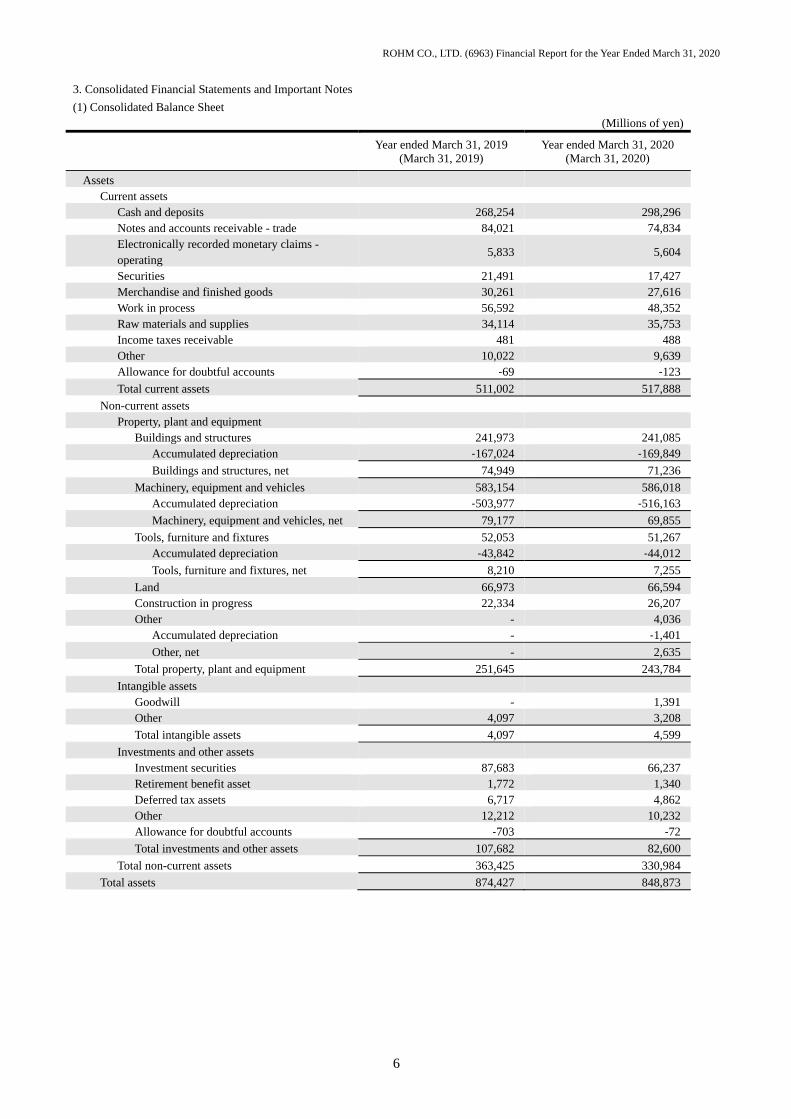
3. Consolidated Financial Statements and Important Notes
(1) Consolidated Balance Sheet (Millions of yen)
Year ended March 31, 2019 (March 31, 2019)
Year ended March 31, 2020 (March 31, 2020)
Assets Current assets
Cash and deposits 268,254 298,296 Notes and accounts receivable - trade 84,021 74,834 Electronically recorded monetary claims - operating
5,833 5,604
Securities 21,491 17,427 Merchandise and finished goods 30,261 27,616 Work in process 56,592 48,352 Raw materials and supplies 34,114 35,753 Income taxes receivable 481 488 Other 10,022 9,639 Allowance for doubtful accounts ‐69 ‐123
Total current assets 511,002 517,888
Non-current assets Property, plant and equipment
Buildings and structures 241,973 241,085 Accumulated depreciation ‐167,024 ‐169,849
Buildings and structures, net 74,949 71,236
Machinery, equipment and vehicles 583,154 586,018 Accumulated depreciation ‐503,977 ‐516,163
Machinery, equipment and vehicles, net 79,177 69,855
Tools, furniture and fixtures 52,053 51,267 Accumulated depreciation ‐43,842 ‐44,012
Tools, furniture and fixtures, net 8,210 7,255
Land 66,973 66,594 Construction in progress 22,334 26,207 Other - 4,036
Accumulated depreciation - ‐1,401
Other, net - 2,635
Total property, plant and equipment 251,645 243,784
Intangible assets Goodwill - 1,391 Other 4,097 3,208
Total intangible assets 4,097 4,599
Investments and other assets Investment securities 87,683 66,237 Retirement benefit asset 1,772 1,340 Deferred tax assets 6,717 4,862 Other 12,212 10,232 Allowance for doubtful accounts ‐703 ‐72
Total investments and other assets 107,682 82,600
Total non-current assets 363,425 330,984
Total assets 874,427 848,873

ROHM CO., LTD. (6963) Financial Report for the Year Ended March 31, 2020
7
(Millions of yen)
Year ended March 31, 2019 (March 31, 2019)
Year ended March 31, 2020 (March 31, 2020)
Liabilities Current liabilities
Notes and accounts payable - trade 11,873 11,024 Electronically recorded obligations - operating 4,252 3,838 Accounts payable - other 26,453 20,803 Income taxes payable 8,137 3,990 Other 25,457 22,710
Total current liabilities 76,174 62,367
Non-current liabilities Bonds payable - 40,935 Deferred tax liabilities 19,964 17,430 Retirement benefit liability 10,688 10,908 Other 845 1,752
Total non-current liabilities 31,499 71,026
Total liabilities 107,673 133,393
Net assets Shareholders' equity
Share capital 86,969 86,969 Capital surplus 102,403 102,403 Retained earnings 634,606 644,563 Treasury shares ‐47,430 ‐88,726
Total shareholders' equity 776,549 745,210
Accumulated other comprehensive income Valuation difference on available-for-sale securities
28,850 22,015
Foreign currency translation adjustment ‐35,487 ‐47,517 Remeasurements of defined benefit plans ‐3,645 ‐4,716
Total accumulated other comprehensive income ‐10,282 ‐30,219
Non-controlling interests 487 488
Total net assets 766,754 715,479
Total liabilities and net assets 874,427 848,873
ROHM CO., LTD. (6963) Financial Report for the Year Ended March 31, 2020
8
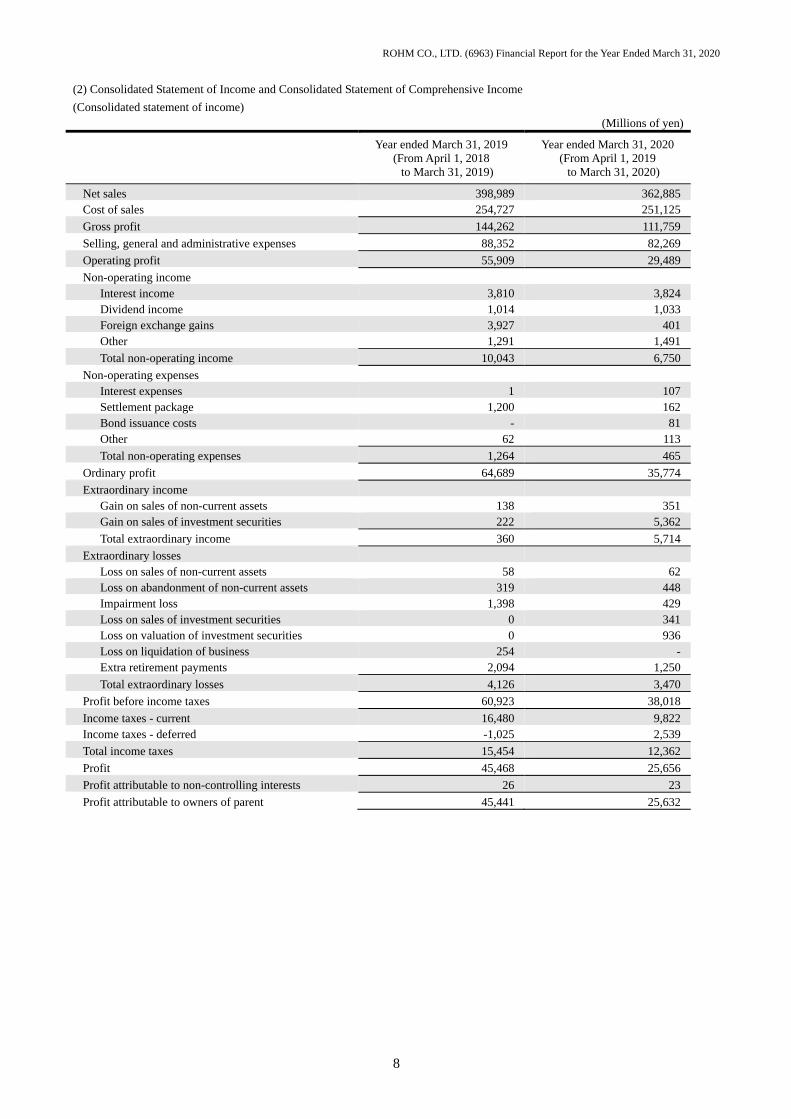
(2) Consolidated Statement of Income and Consolidated Statement of Comprehensive Income
(Consolidated statement of income) (Millions of yen)
Year ended March 31, 2019
(From April 1, 2018 to March 31, 2019)
Year ended March 31, 2020 (From April 1, 2019 to March 31, 2020)
Net sales 398,989 362,885 Cost of sales 254,727 251,125
Gross profit 144,262 111,759
Selling, general and administrative expenses 88,352 82,269
Operating profit 55,909 29,489
Non-operating income Interest income 3,810 3,824 Dividend income 1,014 1,033 Foreign exchange gains 3,927 401 Other 1,291 1,491
Total non-operating income 10,043 6,750
Non-operating expenses Interest expenses 1 107 Settlement package 1,200 162 Bond issuance costs - 81 Other 62 113
Total non-operating expenses 1,264 465
Ordinary profit 64,689 35,774
Extraordinary income Gain on sales of non-current assets 138 351 Gain on sales of investment securities 222 5,362
Total extraordinary income 360 5,714
Extraordinary losses Loss on sales of non-current assets 58 62 Loss on abandonment of non-current assets 319 448 Impairment loss 1,398 429 Loss on sales of investment securities 0 341 Loss on valuation of investment securities 0 936 Loss on liquidation of business 254 - Extra retirement payments 2,094 1,250
Total extraordinary losses 4,126 3,470
Profit before income taxes 60,923 38,018
Income taxes - current 16,480 9,822 Income taxes - deferred -1,025 2,539
Total income taxes 15,454 12,362
Profit 45,468 25,656
Profit attributable to non-controlling interests 26 23
Profit attributable to owners of parent 45,441 25,632
ROHM CO., LTD. (6963) Financial Report for the Year Ended March 31, 2020
9
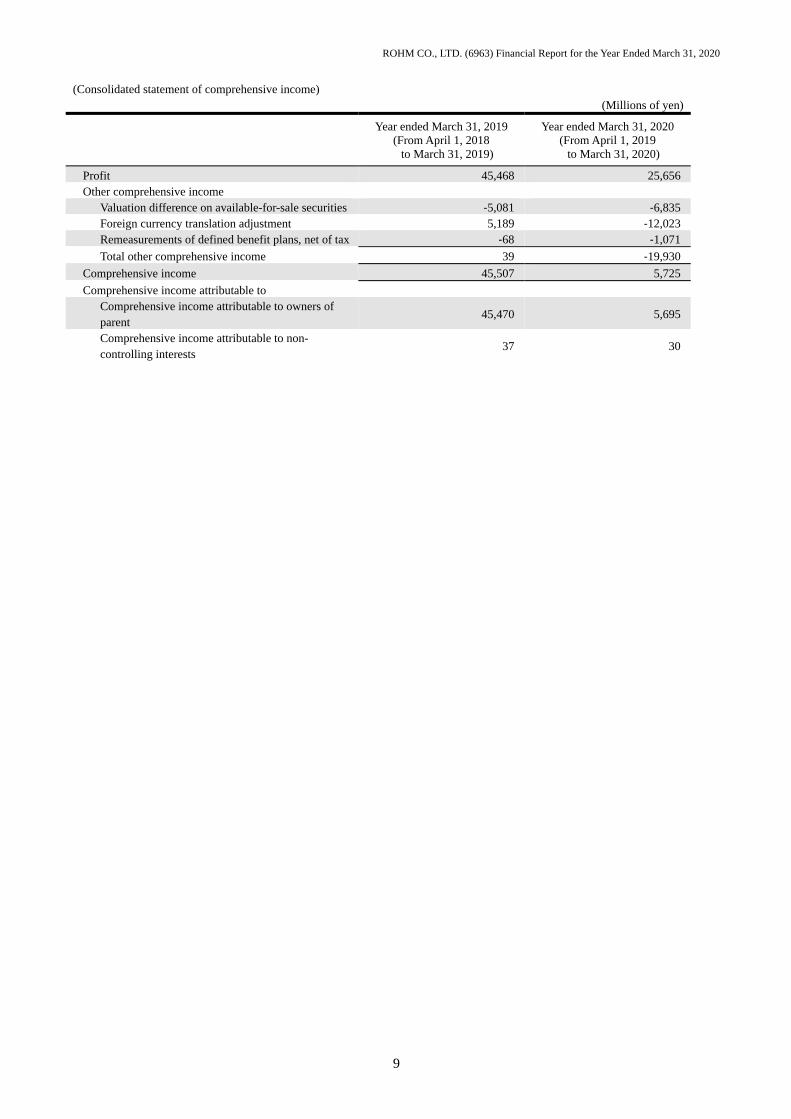
(Consolidated statement of comprehensive income) (Millions of yen)
Year ended March 31, 2019
(From April 1, 2018 to March 31, 2019)
Year ended March 31, 2020 (From April 1, 2019 to March 31, 2020)
Profit 45,468 25,656 Other comprehensive income
Valuation difference on available-for-sale securities ‐5,081 ‐6,835 Foreign currency translation adjustment 5,189 ‐12,023 Remeasurements of defined benefit plans, net of tax ‐68 ‐1,071
Total other comprehensive income 39 ‐19,930
Comprehensive income 45,507 5,725
Comprehensive income attributable to Comprehensive income attributable to owners of parent
45,470 5,695
Comprehensive income attributable to non-controlling interests
37 30

ROHM CO., LTD. (6963) Financial Report for the Year Ended March 31, 2020
10
(3) Consolidated Statement of Shareholder’s Equity
Year ended March 31, 2019 (From April 1, 2018 to March 31, 2019) (Millions of yen)
Shareholders' equity
Share capital Capital surplus Retained earnings
Treasury shares Total shareholders'
equity Balance at beginning of current period
86,969 102,403 620,151 -47,788 761,736
Changes of items during period
Dividends of surplus -20,625 -20,625
Profit attributable to owners of parent
45,441 45,441
Purchase of treasury shares
-10,003 -10,003
Disposal of treasury shares
-0 0 0
Retirement of treasury shares
-10,360 10,360 -
Transfer to capital surplus from retained earnings
10,360 -10,360 -
Net changes of items other than shareholders' equity
Total changes of items during period
- - 14,455 357 14,812
Balance at end of current period
86,969 102,403 634,606 -47,430 776,549
Accumulated other comprehensive income
Non-controlling
interests
Total net assets
Valuation difference on available-for-sale securities
Foreign currencytranslation adjustment
Remeasurements of defined benefit plans
Total accumulated
other comprehensive
income Balance at beginning of current period
33,931 -40,666 -3,576 -10,311 452 751,877
Changes of items during period
Dividends of surplus -20,625
Profit attributable to owners of parent
45,441
Purchase of treasury shares
-10,003
Disposal of treasury shares
0
Retirement of treasury shares
-
Transfer to capital surplus from retained earnings
-
Net changes of items other than shareholders' equity
-5,081 5,178 -68 28 34 63
Total changes of items during period
-5,081 5,178 -68 28 34 14,876
Balance at end of current period
28,850 -35,487 -3,645 -10,282 487 766,754

ROHM CO., LTD. (6963) Financial Report for the Year Ended March 31, 2020
11
Year ended March 31, 2020 (From April 1, 2019 to March 31, 2020) (Millions of yen)
Shareholders' equity
Share capital Capital surplus Retained earnings
Treasury shares Total shareholders'
equity Balance at beginning of current period
86,969 102,403 634,606 -47,430 776,549
Changes of items during period
Dividends of surplus -15,675 -15,675
Profit attributable to owners of parent
25,632 25,632
Purchase of treasury shares
-41,295 -41,295
Net changes of items other than shareholders' equity
Total changes of items during period
- - 9,956 -41,295 -31,339
Balance at end of current period
86,969 102,403 644,563 -88,726 745,210
Accumulated other comprehensive income
Non-controlling
interests
Total net assets
Valuation difference on available-for-sale securities
Foreign currency
translation adjustment
Remeasurements of defined benefit plans
Total accumulated
other comprehensive
income Balance at beginning of current period
28,850 -35,487 -3,645 -10,282 487 766,75
4 Changes of items during period
Dividends of surplus -15,675
Profit attributable to owners of parent
25,632
Purchase of treasury shares
-41,295
Net changes of items other than shareholders' equity
-6,835 -12,030 -1,071 -19,937 1 -19,935
Total changes of items during period
-6,835 -12,030 -1,071 -19,937 1 -51,275
Balance at end of current period
22,015 -47,517 -4,716 -30,219 488 715,47
9
ROHM CO., LTD. (6963) Financial Report for the Year Ended March 31, 2020
12
(4) Consolidated Statement of Cash Flow (Millions of yen)
Year ended March 31, 2019
(From April 1, 2018 to March 31, 2019)
Year ended March 31, 2020 (From April 1, 2019 to March 31, 2020)
Cash flows from operating activities Profit before income taxes 60,923 38,018 Depreciation 45,415 44,328 Impairment loss 1,398 429 Increase (decrease) in allowance for doubtful accounts
-313 -572
Increase (decrease) in retirement benefit liability 467 -833 Decrease (increase) in retirement benefit asset 350 120 Extra retirement payments 2,094 1,250 Interest and dividend income -4,824 -4,858 Foreign exchange losses (gains) -1,340 1,544 Loss (gain) on sales of short-term and long-term investment securities
-222 -5,020
Loss (gain) on valuation of short-term and long-term investment securities
0 936
Loss (gain) on sales of non-current assets -80 -289 Decrease (increase) in trade receivables 1,274 8,149 Decrease (increase) in inventories -21,846 7,091 Increase (decrease) in trade payables -2,764 -703 Increase (decrease) in accounts payable - other -1,705 164 Other, net 2,145 -438
Subtotal 80,973 89,317
Interest and dividends received 4,645 5,046 Interest paid -1 -9 Income taxes (paid) refund -19,180 -12,953 Extra retirement payments -446 -2,269
Net cash provided by (used in) operating activities 65,990 79,130
Cash flows from investing activities Decrease (increase) in time deposits -3,358 17,737 Purchase of short-term and long-term investment securities
-13,403 -6,908
Proceeds from sales and redemption of short-term and long-term investment securities
20,550 25,421
Purchase of property, plant and equipment -54,273 -41,880 Proceeds from sales of property, plant and equipment
156 652
Other, net -3,670 -3,698
Net cash provided by (used in) investing activities -53,997 -8,676
Cash flows from financing activities Proceeds from issuance of bonds - 40,918 Purchase of treasury shares -10,003 -41,295 Dividends paid -20,625 -15,675 Other, net -18 -1,022
Net cash provided by (used in) financing activities -30,647 -17,075
Effect of exchange rate change on cash and cash equivalents
2,746 -5,904
Net increase (decrease) in cash and cash equivalents -15,908 47,474
Cash and cash equivalents at beginning of period 243,973 228,065
Cash and cash equivalents at end of period 228,065 275,539
(5) Notes on Consolidated Financial Statements (Note on going concern)
None.
(Changes in accounting policies) (Application of IFRS 16 “Leases”)
From the the fiscal year ended March 31, 2020, we are applying IFRS 16 “Leases” (issued January 13, 2016) to consolidated subsidiaries outside of Japan except for those in the USA. By rule, the borrower under this standard recognizes the assets and liabilities of all leases. We have applied this accounting standard by recognizing the cumulative impact over time on the date the standard went into effect.
As a result, at the fiscal year ended March 31, 2020, increases were reported respectively in right-of-use assets (“other” under property, plants, and equipment) of 4,036 million yen, accumulated depreciation of right-of-use assets (accumulated depreciation of other under property, plant, and equipment) of 1,401 million yen, and lease liabilities (“other” under current and non-current liabilities) of 2,293 million yen. The 479 million yen in land use rights that was previously included in “other” under intangible assets is included in “other” and “accumulated depreciation” under property, plants, and equipment, as of the fiscal year ended March 31, 2020. The impact of this new accounting standard on balances and pre-share information for the period is insignificant.
(Changes in Presentation Methods)
(Consolidated Statement of Income) “Interest expenses” were included in “Other” under “Non-operating expenses” in the previous fiscal year.
However, interest expenses are presented separately in the consolidated statement of income from the current fiscal year as they have increased in importance in terms of monetary amount. We have reclassified the prior year’s consolidated financial statements to reflect this change in presentation method.
As a result, 63 million yen in “Other” under “Non-operating expenses” in the prior year’s consolidated statement of income has been reclassified to 1 million yen in “Interest expenses” and 62 million yen in “Other” under “Non-operating expenses” to make them conform to the current year’s presentation.
(Consolidated Statement of Cash Flow) “Loss (gain) on sales of short-term and long-term investment securities” and “Extra retirement payments” were
included in “Other” under “Cash flows from operating activities” in the previous fiscal year. However, they are presented separately in the consolidated statement of cash flow from the current fiscal year as they have increased in importance in terms of monetary amount. We have reclassified the prior year’s consolidated financial statements to reflect this change in presentation method.
As a result, 1,477 million yen in “Other” under “Cash flows from operating activities” in the prior year’s consolidated statement of cash flow has been reclassified to -222 million yen in “Loss (gain) on sales of short-term and long-term investment securities”, -446 million yen in “Extra retirement payments” and 2,145 million yen in “Other” under “Cash flows from operating activities” to make them conform to the current year’s presentation.
(Segment information) 1. Overview of reportable segments
The reportable segments of the ROHM Group are units of the group for which separated financial information is available, and which is the subject of the periodical review by the board of directors for the purpose of deciding the distribution of management resources and evaluating business performance.
The ROHM Group is a comprehensive manufacturer of electronic components, and sets up operational divisions by individual product categories at its headquarters. Each operational division draws up comprehensive production plans and business strategies for both domestic and overseas operations, and develops global production activities. Therefore, from a management standpoint, the group attaches great importance to the supervision of profits and losses by operational segments organized as operational divisions
13

of individual product categories. For this reason, the group is consolidating operational segments in consideration of characteristics of the products each operational division is manufacturing and similarities of production process, and setting up three reportable segments as “ICs,” “Discrete Semiconductor Devices,” and “Modules.”
In the “ICs” segment, products such as analog ICs, logic ICs, memory ICs and MEMS are manufactured. Products manufactured in the “Discrete Semiconductor Devices” segment include diodes, transistors,
light-emitting diodes, and laser diodes. Products of the “Modules” segment include printheads, optical modules, and power modules.
2. Calculating method of amount of sales, profit or loss, asset, and other items of individual reportable segmentinformation
Accounting processing for each reported operating segment is basically identical to accounting standards used for compiling consolidated financial statements.
The segment profit are based on operating profit, while “Inter-segment sales or transfer” are based on market prices.
Although assets of common categories such as sales and administrative expenses, are included in “Adjusted amount,” depreciation costs derived from these assets are allocated to individual segments according to in-house standards to calculate individual segment.
3. Information regarding amount of sales, profit or loss, asset, and other items of individual reportable segmentinformationYear ended March 31, 2019 (From April 1, 2018 to March 31, 2019)
(Unit: Millions of yen)
Reportable segments
Others (Note 1) Total
Adjusted amount (Note 2)
Amount on consolidate
financial statements (Note 3)
ICs
Discrete semi-
conductor devices
Modules Subtotal
Net sales
Sales to customers 183,313 152,861 40,158 376,333 22,655 398,989 - 398,989
Inter-segment sales or
transfer 2,559 6,933 43 9,535 60 9,596 -9,596 -
Subtotal 185,872 159,795 40,202 385,869 22,716 408,585 -9,596 398,989
Segment profit 15,990 30,054 5,918 51,962 4,093 56,056 -146 55,909
Segment asset 129,030 126,835 17,157 273,023 19,316 292,339 582,088 874,427
Other items
Depreciation 20,908 20,055 3,279 44,243 2,005 46,248 -832 45,415
Amortization of goodwill - - - - - - - -
Increase in property,
plant and equipment and
intangible assets
17,119 30,407 1,979 49,506 4,694 54,201 3,089 57,291
(Note) 1. “Others” is an operational segment that is not included in reportable segments, consisting of business in resistors and tantalum capacitors.
2. Adjusted amount are as follows.[1] The adjusted amount of the segment profit, -146 million yen, mainly includes general
administrative expenses of -773 million yen that do not attribute to the segment, and thesettlement adjusted amount of 626 million yen, which is not allocated to the segment (such asadjustment for retirement benefits).
14
[2] The adjusted amount of 582,088 million yen in segment assets contains corporate assets of583,365 million yen that have not been allocated to individual segment information and adownward adjustment of non-current assets of -1,276 million yen. Corporate assets do not belongto reported segments, consisting of cash and deposits of 268,254 million yen, investmentsecurities of 87,683 million yen, and notes and accounts receivable (trade) of 84,021 million yen.
[3] The adjusted amount of depreciation is the settlement adjusted amount (after subtractingunrealized gains on fixed assets) that is not allocated to the segment.
[4] Adjustments to increases in property, plant and equipment and intangible assets apply tonon-current assets of common categories such as sales and administrative expenses.
3. Segment profits are adjusted with operating income on consolidated financial statements.
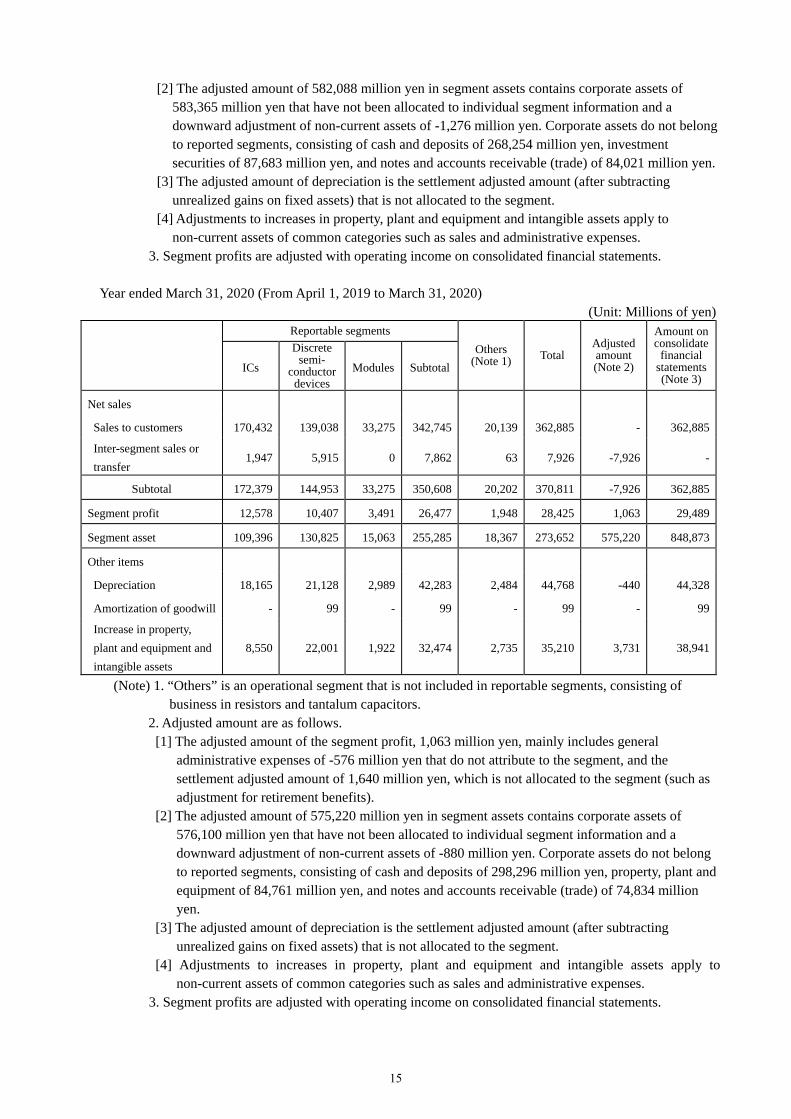
Year ended March 31, 2020 (From April 1, 2019 to March 31, 2020) (Unit: Millions of yen)
Reportable segments
Others (Note 1) Total
Adjusted amount (Note 2)
Amount on consolidate
financial statements (Note 3)
ICs
Discrete semi-
conductor devices
Modules Subtotal
Net sales
Sales to customers 170,432 139,038 33,275 342,745 20,139 362,885 - 362,885
Inter-segment sales or
transfer 1,947 5,915 0 7,862 63 7,926 -7,926 -
Subtotal 172,379 144,953 33,275 350,608 20,202 370,811 -7,926 362,885
Segment profit 12,578 10,407 3,491 26,477 1,948 28,425 1,063 29,489
Segment asset 109,396 130,825 15,063 255,285 18,367 273,652 575,220 848,873
Other items
Depreciation 18,165 21,128 2,989 42,283 2,484 44,768 -440 44,328
Amortization of goodwill - 99 - 99 - 99 - 99
Increase in property,
plant and equipment and
intangible assets
8,550 22,001 1,922 32,474 2,735 35,210 3,731 38,941
(Note) 1. “Others” is an operational segment that is not included in reportable segments, consisting of business in resistors and tantalum capacitors.
2. Adjusted amount are as follows.[1] The adjusted amount of the segment profit, 1,063 million yen, mainly includes general
administrative expenses of -576 million yen that do not attribute to the segment, and thesettlement adjusted amount of 1,640 million yen, which is not allocated to the segment (such asadjustment for retirement benefits).
[2] The adjusted amount of 575,220 million yen in segment assets contains corporate assets of576,100 million yen that have not been allocated to individual segment information and adownward adjustment of non-current assets of -880 million yen. Corporate assets do not belongto reported segments, consisting of cash and deposits of 298,296 million yen, property, plant andequipment of 84,761 million yen, and notes and accounts receivable (trade) of 74,834 millionyen.
[3] The adjusted amount of depreciation is the settlement adjusted amount (after subtractingunrealized gains on fixed assets) that is not allocated to the segment.
[4] Adjustments to increases in property, plant and equipment and intangible assets apply tonon-current assets of common categories such as sales and administrative expenses.
3. Segment profits are adjusted with operating income on consolidated financial statements.
15

(Per share data)
Year ended March 31, 2019 Year ended March 31, 2020
Net assets per share 7,332.04 yen 7,185.83 yen
Net income per share 431.29 yen 247.66 yen
Diluted net income per share - 244.90 yen
(Note) 1. Net income per share after adjustment of residual securities for the year ended March 31, 2019 has been omitted as there are no diluted shares.
2. The basis for the calculation of the net income per share and diluted net income per share is asfollows.
Year ended March 31, 2019 Year ended March 31, 2020
Net income per share
Profit attributable to owners of parent (million yen)
45,441 25,632
Amount not attributable to common shareholders (million yen)
20 35
Profit attributable to owners of parent common shareholders (million yen)
45,421 25,597
Average number of common shares during the year (thousand shares)
105,316 103,358
Diluted net income per share
Adjustment of profit attributable to owners of parent (million yen)
- -44
(of which interest income after deducting an amount equivalent to taxes) (million yen)
(-) (-44)
Increase in number of outstanding common shares (thousand shares)
- 980
(of which convertible bond-type bonds with subscription rights to shares) (thousand shares)
(-) (980)
Outline of diluted shares that were not included in the calculation of diluted net income per share because they had no dilutive effects
- -
(Significant subsequent events)
None.
16

4. Others
Transfer of Directors (As of June 26, 2020)
(1) Candidate DirectorDirector Kazuhide Ino
(2) Retiring DirectorsDirector Tadanobu FujiwaraDirector Yoshiaki Suenaga
17