roleoffatbodylipogenesisinprotectionagainsttheeffects ... ·...
TRANSCRIPT

Role of Fat Body Lipogenesis in Protection against the Effectsof Caloric Overload in Drosophila*□S
Received for publication, January 9, 2013, and in revised form, January 24, 2013 Published, JBC Papers in Press, January 25, 2013, DOI 10.1074/jbc.M112.371047
Laura Palanker Musselman‡, Jill L. Fink‡, Prasanna Venkatesh Ramachandran‡, Bruce W. Patterson§,Adewole L. Okunade§, Ezekiel Maier¶, Michael R. Brent¶, John Turk‡, and Thomas J. Baranski‡1
From the Divisions of ‡Endocrinology, Metabolism, and Lipid Research and §Geriatrics and Nutritional Sciences, Department ofMedicine, Washington University School of Medicine, St. Louis, Missouri 63110 and ¶Department of Computer Science and Centerfor Genome Sciences and Systems Biology, Washington University, St. Louis, Missouri 63130
Background: A high sugar diet leads to obesity and insulin resistance in Drosophila.Results: The metabolic fate of dietary glucose is reprogrammed in high sugar-fed and lean animals.Conclusion:Obesity is protective against the deleterious effects of a high sugar diet.Significance:Anemerging perspective that obesity is protective against sequelae of humanmetabolic disease is conserved in thefly.
TheDrosophila fat body is a liver- and adipose-like tissue thatstores fat and serves as a detoxifying and immune responsiveorgan.We have previously shown that a high sugar diet leads toelevated hemolymph glucose and systemic insulin resistance indeveloping larvae and adults.Here, we used stable isotope tracerfeeding to demonstrate that rearing larvae on high sugar dietsimpaired the synthesis of esterified fatty acids from dietary glu-cose. Fat body lipid profiling revealed changes in both carbonchain length and degree of unsaturation of fatty acid substitu-ents, particularly in stored triglycerides. We tested the role ofthe fat body in larval tolerance of caloric excess. Our experi-ments demonstrated that lipogenesis was necessary for animalsto tolerate high sugar feeding as tissue-specific loss of orthologsof carbohydrate response element-binding protein or stearoyl-CoA desaturase 1 resulted in lethality on high sugar diets. Bycontrast, increasing the fat content of the fat body by knock-down of king-tubbywas associated with reduced hyperglycemiaand improved growth and tolerance of high sugar diets. Ourwork supports a critical role for the fat body and theDrosophilacarbohydrate response element-binding protein ortholog inmetabolic homeostasis in Drosophila.
Caloric restriction has been the subject of much study inmodel organisms.More recently, caloric excess has been shownto elicit many of the same negative consequences in model
organisms as have long been observed in humans (1–7). Workfrom our laboratory and that of others has shown that feedingDrosophila a high sugar diet (HSD)2 results in amodel of type 2diabetes (T2D) that includes hyperglycemia, obesity, insulinresistance, cardiac arrhythmias, and reduced lifespan (4, 8, 73).Drosophila larvae eat continually and store fat for metamor-
phosis as they develop, making them a convenient model sys-tem for studying relationships between nutrition and obesity.TheDrosophila fat body (FB) is an organ that serves the roles ofadipose tissue, liver, and the immune system. The FB is theanimal’s primary fat storage depot as well as the source of anti-microbial peptides, endocrine mediators of neuronal function,and cytochrome p450 enzymes that catalyze detoxification andbiosynthetic reactions (9–12). FB insulin and adipokinetic hor-mone (glucagon ortholog) signaling can control lipid storage ina manner similar to that in human liver (13, 14). Therefore, westudied the role of theDrosophila FB in the response to anHSD.
High calorie diets are associated with non-alcoholic fattyliver disease, obesity, and insulin resistance in rodents andhumans (2, 15–18), but the role of lipid accumulation remainscontroversial. An emerging concept is that obesity is protectiveagainst T2D (19, 20). It has been postulated that obesity itself isnot harmful, but when the capacity to store triglyceride (TAG)is exceeded, accumulation of saturated free fatty acids or theirderivatives (called lipotoxicity) acts to damage tissues and con-tribute to the complications of T2D (21, 22).We used biochemical and genetic approaches to understand
lipid biology in the setting of caloric excess. We demonstratedthat the Drosophila FB plays an essential role in systemic met-abolic homeostasis in the face of dietary excess. The rates ofsynthesis from labeled glucose into fatty acids and lipid storagepools were reduced upon HSD rearing. Lipids were stored inlarger droplets and contained TAG species with fatty acid sub-
* This work was supported, in whole or in part, by National Institutes of HealthGrants T32 GM007464 (to L. P. M.), 5K12HD001459-12 (to L. P. M.), P60DK20579 through the Washington University Diabetes Research and Train-ing Center (to J. T. and T. J. B.), P20 RR020643 (to T. J. B.), P30 DK56341through the Nutrition Obesity Research Center (to A. L. O., B. W. P., andJ. T.), P41-RR00954 through the Biomedical Mass Spectrometry Resource(to J. T.), and 1R41DK76338, a Small Business Technology Transfer grant (toMedros, Inc.). This work was also supported by Children’s Discovery Insti-tute Grant MD-II-2010-41 (to M. R. B. and T. J. B.) and Washington Univer-sity (to T. J. B.). T. J. B. is a co-founder of Medros, Inc.
□S This article contains supplemental Table S1.1 To whom correspondence should be addressed: Division of Endocrinology,
Metabolism, and Lipid Research, Dept. of Medicine, Washington UniversitySchool of Medicine, Box 8127, 660 S. Euclid Ave., St. Louis, MO 63110. Tel.:314-747-3997; Fax: 314-362-7641; E-mail: [email protected].
2 The abbreviations used are: HSD, high sugar diet; T2D, type 2 diabetes; FB,fat body; TAG, triglyceride; NEFA, nonesterified fatty acid; TFA, total free �esterified fatty acid; PE, phosphatidylethanolamine; PC, phosphatidylcho-line; PI, phosphatidylinositol; ESI, electrospray ionization; HS, high sugar;FA, fatty acid; ChREBP, carbohydrate response element-binding protein;Desat1, stearoyl-CoA desaturase 1; GO, gene ontology.
THE JOURNAL OF BIOLOGICAL CHEMISTRY VOL. 288, NO. 12, pp. 8028 –8042, March 22, 2013© 2013 by The American Society for Biochemistry and Molecular Biology, Inc. Published in the U.S.A.
8028 JOURNAL OF BIOLOGICAL CHEMISTRY VOLUME 288 • NUMBER 12 • MARCH 22, 2013
by guest on May 3, 2019
http://ww
w.jbc.org/
Dow
nloaded from
stituents that had shorter carbon chains and a greater degree ofunsaturation in the FBs ofHSD-fed larvae comparedwith thosein larvae fed control diets. TAG storage in the FB amelioratedthe adversemetabolic effects of HSD feeding because hypergly-cemia was exacerbated in lean animals and reduced when FBTAG content was increased in tissue-specific loss of functionexperiments. Our data support a model where TAG storage isprotective when consuming an HSD. When the capacity tostore TAG is exceeded during this form of caloric excess, wepropose that dysregulated lipogenesis results in adverse conse-quences, which may include an increase in free fatty acids.
EXPERIMENTAL PROCEDURES
Fly Lines and Husbandry—Canton-S and cgGAL4 lines werefromBloomingtonDrosophila StockCenter. The controlw1118,UAS-Dcr2, UAS-Mioi, UAS-desat1i, and UAS-King-Tubbyi
lines were from the Vienna Drosophila RNAi Center. Knock-down was confirmed by semiquantitative RT-PCR of RNAfrom transgene-expressing flies. Diets were a modification ofBloomington semi-defined food and contained 0.15 or 0.7 M
sucrose as the sugar source as described previously (4). Larvaewere reared from egg lay until wandering third instar and har-vested from the vial wall for all experiments except tracerstudies.Stable Isotope Tracer Experiments—[U-13C6]Glucose was
used as 10% of dietary sugar in either 5 (control) or 34% (high)glucose Bloomington semi-defined food diets. Third instarCanton-S larvae were fed unlabeled diets until early third instarand transferred to tracer diets (Fig. 1A). Twenty-five larvaewere homogenized in water, and aqueous and hexane phaseswere obtained as described (23). Lipids from the organicphase were derivatized to fatty acid methyl esters using eitheriodomethane (nonesterified fatty acids (NEFAs)) or 10% acetylchloride in methanol (total free � esterified fatty acids (TFAs))and analyzed by GC/MS as described previously (23). TFA andNEFA concentrations were determined by quantitative GCusing a flame ionization detector relative to a known amount ofC17:0 internal standard fatty acid added to the sample prior toprocessing (23). We calculated the lipid derived from dietarysugar by multiplying the FA 13C percent enrichment (Fig. 1, Cand D) and the FA pool size (Table 1) for each condition. Thisproduct was then divided by the 13C atom percent enrichmentin the tracer food (Fig. 1E) as extrapolated from the trehaloselabeling. The rates of synthesis of NEFA and TFA were thenderived from the slopes of the plotted values. The distributionof mass isotopomers of TFA or NEFAmethyl ester species wasdetermined by GC/MS as described previously (24, 25) on anAgilent 5973 MSD instrument using a 30-m � 0.25-mmDB-5MS column. Isotopomer distributions of labeled glucoseand trehalose were measured by GC/MS on trimethylsilylderivatives. All GC/MS isotopic enrichments were correctedfor the natural abundance of 13C in larvae prior to the con-sumption of tracer diets. The total atom percent excess 13Ccontent within TFA and NEFA was estimated from the mea-sured fatty acid distribution profile and the total atom percentexcess 13C for each fatty acid species calculated from the distri-bution of labeled isotopomers.
Electrospray Ionization Mass Spectrometric Analyses ofGlycerolipids—Larvae were homogenized in PBS and extractedby the method of Bligh and Dyer (26). The extract was concen-trated to dryness under nitrogen and reconstituted in chloro-form/methanol (1:1) to which LiCl was added (final [Li�], 2mM). Phosphatidylcholine (PC) (27) and TAG (28) species wereanalyzed as Li� adducts by positive ion ESI-MS/MS, and phos-phatidylethanolamine and phosphatidylinositol (PI) specieswere analyzed as [M � H]� ions by negative ion ESI-MS/MS(29) on a Finnigan (San Jose, CA) TSQ-7000 triple stage qua-drupole mass spectrometer with an ESI source controlled byFinnigan ICIS software. Lipid extracts were infused (1 �l/min)into the source with a Harvard syringe pump and analyzedunder previously described instrumental conditions (27). Fortandem MS, precursor ions selected in the first quadrupolewere accelerated (32–36-eV collision energy) into a chambercontaining argon (2.3–2.5 millitorrs) to induce collisionallyactivated dissociation, and product ions were analyzed in thefinal quadrupole. Identities of lipid molecular species in thetotal ion current profiles were determined from their tandemspectra as described.Lipid Droplet Staining—For Nile Red staining, larvae were
inverted and fixed in 4% paraformaldehyde for 20min and thentreated with 0.001% Nile Red in PBS for 30 min. Animals werewashed, and then fat bodies were dissected out andmounted inVectashield. Slides were imaged at 60� magnification on aNikon confocal microscope.Hemolymph Glucose—Hemolymph was collected and
assayed as described previously (4).Triglyceride Assays—Total triglycerides were assayed as
described previously (4).Lipase Assays—Measurement of lipase activity in larval
homogenates was adapted from Ref. 30 as follows. Ten larvaewere homogenized in 200 �l of citrate buffer, pH 5. 40 �l ofhomogenate was incubatedwith 150�l of excess glycerol tribu-tyrate substrate (170 mM; sonicated to mix into citrate buffer)for 4 h at 37 °C. After 4 h, samples were spun to pellet debris,and 20 �l of supernatant was added to 100 �l of Free GlycerolReagent (Sigma F6428), incubated at 37 °C for 30min, and readaccording to the manufacturer’s instructions. Free glycerol lev-els in larvae measured immediately after homogenization werenegligible (�5%).Ketone Assays—Six larvae were homogenized in PBS on ice
and analyzed using theWakoTotal Ketone Body assay kit (415-73301 and 411-73401) according to the manufacturer’sinstructions.Coenzyme A (CoA) Determinations—Eighty larvae were
homogenized in PBS on ice, treated with 25 mM DTT, and fro-zen at �80 °C. After defrosting, larval pellets and debris wereremoved by centrifugation, and protein was removed by TCAprecipitation. The supernatant was washed with water-satu-rated ether, and the aqueous phase was dried and resuspendedin buffer A. Free CoA was quantified using reversed-phaseHPLC with buffers and methods as described (31) using a CoAstandard curve with a range of 0–20 nmol/sample for quantifi-cation. CoA eluted as a single peak around 28 min. Recovery ofa CoA standard using this method was �30%.
The Fat Body Controls Metabolic Homeostasis
MARCH 22, 2013 • VOLUME 288 • NUMBER 12 JOURNAL OF BIOLOGICAL CHEMISTRY 8029
by guest on May 3, 2019
http://ww
w.jbc.org/
Dow
nloaded from

Gene Expression—RNAwas isolated from 75–150wanderingL3 FBs using TRIzol, DNase-treated, and purified using RNeasycolumns (Qiagen). Poly(A) RNA was used to generate a cDNAlibrary as described (32). An Illumina sequencer was used togenerate 3–10 million reads per sample, and the reads werealigned to theDrosophila genome sequence using TopHat (33).Reads that aligned were considered for gene expression quan-tificationwithCufflinks (34) using theMB8 genome annotation(which the Brent laboratory produced in its role as the infor-matics group for the Fly Transcriptome Group of the NationalHuman Genome Research Institute modENCODE project).Gene expression was normalized using quantile normalization,and statistically significant differences (p � 0.05) were identi-fied using an unpaired, two-tailed Student’s t test. Completeexpression data can be viewed at theGene ExpressionOmnibus(GEO) under accession number GSE43734.
RESULTS
Metabolic Channeling of Glucose Is Reduced by HSD Feeding—We have shown previously that consumption of an HSD byDrosophila larvae results in phenotypes that model type 2 dia-betes, including elevated hemolymph sugars, obesity, and insu-lin resistance. When fed excess calories in the form of an HSD,larvae routed energy from the diet into lipid storage in the fatbody (4). We hypothesized that in the face of chronic exposureto HSD this storage capacity is limiting, leading to altered pro-cessing of dietary carbon and the model T2D phenotypes. Todetermine howHSD feeding alters carbon flux, we undertook anovel approach using stable isotope tracer methodology withuniformly 13C-labeled glucose to study the partitioning of car-bons from dietary glucose ([U-13C6]glucose). Flies were feddiets in which [U-13C6]glucose made up 10% of the total addedglucose content. The fate of dietary [U-13C6]glucose wastracked into NEFA and TFA. These two pools were of interestbecause free, non-esterified fatty acids are thought to be toxic,whereas TAG-esterified fatty acids are likely to be inert inhuman adipose and liver (35, 36). Wild-type animals werereared on unlabeled control or HSD foods until the early thirdlarval instar and then transferred to labeled foods (Fig. 1A).Transfer experiments allowed us to evaluate the chronic effectsof HSD rearing and simplified the comparison between labeledfoods.HSDs reduced larvalweight in these experiments, similarto published data from our laboratory (Fig. 1B and Ref. 4).
After consuming labeled food for up to 24 h, larvae werecollected andhomogenized, and lipidswere extracted for deter-mination of free and total fatty acid 13C content by GC/MS. Forboth labeling conditions, we observed significant 13C labeling ofindividual fatty acids (C14:0, C16:1, C16:0, C18:1, and C18:0) inthe NEFA and TFA pools (data not shown). The relative per-centage of 13C labeling increased over the 24-h labeling periodand was similar for each free fatty acid except for C18:0 in bothNEFA andTFA, which consistently exhibited lower 13C enrich-ment at each time point (data not shown). NEFA species exhib-ited higher 13C enrichment after consumption of the labeledHSD compared with labeled control food and was not affectedby the rearing diet (Fig. 1C).When reared on control diets, TFA13C enrichmentwas similar to that observed forNEFA (Fig. 1,CandD). In contrast to control rearing, larvae reared onHS diets
synthesized TFA that incorporated a lower fraction of 13C-la-beled carbons than did NEFA (Fig. 1, C andD). The lower TFA13C enrichment in HSD-reared larvae persisted for at least 24 hafter transfer to 13C-labeled HS or control food (3.6 � 0.06(S.E.) versus 5.2 � 0.06 atom % and 1.1 � 0.02 versus 2.0 � 0.1atom %, respectively; Fig. 1D). These results support a modelthat larvae fed an HSD increased the incorporation of dietarysugar into lipids, but chronic exposure to HSD resulted in adiminished ability to store dietary sugar as lipid.From a technical standpoint, the higher level of 13C enrich-
ment observed in larvae fed an HS tracer diet might have beendue in part to less dilution of the tracer by other metabolicallyactive sugars and carbohydrates. To estimate the atom percentcontent ofmetabolically available 13C in each diet, wemeasuredthe 13C enrichment into trehalose. The incorporation of tracerinto trehalose occurred more rapidly than for NEFA or TFA(Fig. 1, C, D, and E). Based on the monoexponential rise toplateau in trehalose 13C content, we calculated that the bio-available 13C was 8.1% in control (0.3 M glucose) and 9.2% inHSD (2 M glucose) foods, respectively (Fig. 1E). These valueswere used to determine the synthesis rates of NEFA and TFAderived from dietary carbohydrates (see below). The rate of 13Cenrichment observed in the fatty acids is a function of both therate of synthesis from the bioavailable 13C and the size of thepre-existing pool of that fatty acid. The pre-existing lipid poolsize for TFAwas larger inHSD-reared larvae (Table 1), contrib-uting to the initial decrease in the observed 13C enrichment inTFA.The NEFA and TFA synthesized from dietary bioavailable
carbohydrate carbons after transfer to the tracer diets areshown in Fig. 1, F and G. NEFA synthesis on a 13C control dietwas independent of the rearing diet (94.4 � 3.3 (S.E.) pmol ofFA/larva/h for control-reared and 95.7 � 4.0 pmol of FA/lar-va/h for HS-reared). By contrast, on the HS 13C tracer diet,larvae reared on control food had a higher rate of synthesis ofNEFA from dietary carbohydrates compared with HS-rearedlarvae (359.9 � 9.5 versus 212.4 � 6.7 pmol of FA/larva/h; Fig.1F). When compared with NEFAs, the rates of synthesis ofTFAs were 20–30 times higher yet also demonstrated effects ofthe rearing diets. HSD-reared larvae exhibit a much reducedrate of TFA synthesis from dietary carbohydrates comparedwith those reared on control food regardless of the tracer diet:5.06 � 0.25 versus 6.92 � 0.30 nmol of FA/larva/h for HS 13Clabeling and 1.19 � 0.05 versus 2.56 � 0.11 nmol of FA/larva/hfor control labeling conditions (Fig. 1G). These differencesbetween NEFA and TFA synthesis rates supported the hypoth-esis that prolonged consumption of an HSD diminished therates of synthesis of lipids from dietary sugar and led us tomoreclosely examine the processing of dietary glucose into NEFAand TFA.Incorporation of glucose carbons into fatty acids occurs
through a two-carbon acetyl-CoA intermediate that can beeither singly (m � 1) or doubly (m � 2) labeled. An (m �2)-labeled acetyl-CoA molecule arises directly from [U-13C6]-glucose through glycolysis-derived pyruvate by way of citrateand is exported for FA synthesis, whereas singly labeled acetyl-CoA molecules have undergone one or more rounds of thetricarboxylic acid cycle and/or been diverted to other paths,
The Fat Body Controls Metabolic Homeostasis
8030 JOURNAL OF BIOLOGICAL CHEMISTRY VOLUME 288 • NUMBER 12 • MARCH 22, 2013
by guest on May 3, 2019
http://ww
w.jbc.org/
Dow
nloaded from

such as conversion to phosphoenolpyruvate for gluconeogene-sis, before export from the mitochondrion as citrate for lipo-genesis (Fig. 2A). Therefore, the ratio of (m � 2)/(m � 1) isotopically labeled fatty acids (isotopomers) reflectsthe metabolic route of carbon atoms derived from dietary glu-cose. Larvae fed the labeled HSD exhibited higher m � 2 andm � 1 content in NEFA compared with larvae fed labeled con-trol food that was due in part to the higher percentage of 13Clabeling of sugars in the food as well as a general increase inlipogenesis induced by the HSD. Interestingly, neither the dieton which the larvae were reared nor the tracer diet had mucheffect on theNEFA isotopomer distribution 6 h after transfer to13C diets (Fig. 2B). By contrast, the isotopomer labeling patternin TFA clearly reflected the sugar content of the diet on whichthe larvae were reared. HSD-reared larvae transferred to eitherlabeledHSDor control food exhibitedmarked reductions of the
FIGURE 1. Stable isotope tracer studies of glucose metabolism. A, larvae were reared on control or HSD foods and then transferred as early L3 to dietscontaining 10% [U-13C6]glucose. Larvae were fed tracer diets as indicated, and lipid concentrations and 13C (*) enrichment were measured in non-esterified(NEFA) and total fatty acids (TEFA) by GC/MS. Labeled glucose can be metabolized into acetyl-CoA (which can be either singly or doubly labeled with 13C andincorporated into de novo synthesized non-esterified fatty acids (1). These labeled fatty acids can be esterified as TAG (2). B, larval weights at 24 h after transferto tracer diets. C, tracer incorporation from dietary [U-13C6]glucose into NEFAs. D, tracer incorporation from dietary [U-13C6]glucose into TFAs. E, tracerincorporation from dietary [U-13C6]glucose into trehalose. F, normalized NEFA synthesis rates from dietary carbohydrate. G, normalized TFA synthesis ratesfrom dietary carbohydrate. Shown is the weighted average of 14-, 16-, and 18-carbon fatty acids. Error bars are �S.E. An unpaired, two-tailed t test was used toderive p values. ctl, control; carbs, carbohydrates.
TABLE 1Lipid pool sizes in control and HSD-reared larvaeTFA and NEFA contents of larvae reared on unlabeled diets until early L3 weremeasured by GC analysis at the indicated time after transfer of the larvae to tracerdiets. Pool sizes were calculated as mean nmol/larva �S.D. ctl, control.
2 h 6 h 24 h
nmol/larva nmol/larva nmol/larvaTFActl3 13C ctl 95.6 � 21.7 117.8 � 4.0 251.7 � 28.6ctl3 13C HS 110.2 � 20.1 116.6 � 12.7 287.9 � 45.9HS3 13C ctl 149.1 � 25.9 127.9 � 3.3 199.8 � 21.2HS3 13C HS 143.7 � 5.5a 161.3 � 20.0a 299.1 � 14.8
NEFActl3 13C ctl 5.34 � 0.87 8.43 � 1.38 13.85 � 2.62ctl3 13C HS 6.11 � 0.56 6.99 � 0.71 16.94 � 0.45HS3 13C ctl 3.74 � 0.80 4.87 � 0.52a 12.43 � 1.51HS3 13C HS 4.81 � 0.17a 4.79 � 0.90a 11.06 � 1.00a
a A significant difference from larvae fed the same tracer diet but reared on con-trol food at the same time point, p � 0.05 using a two-tailed, unpaired Student’st test.
The Fat Body Controls Metabolic Homeostasis
MARCH 22, 2013 • VOLUME 288 • NUMBER 12 JOURNAL OF BIOLOGICAL CHEMISTRY 8031
by guest on May 3, 2019
http://ww
w.jbc.org/
Dow
nloaded from

(m � 2)/(m � 1) ratio in TFA compared with larvae reared oncontrol food and then switched to a 13C-labeled diet (Fig. 2C).The reduced ability of larvae to generate TFA from m � 2 FAspersisted for 24 h, although transfer of the larvae from HS tocontrol diets did partially restore the ability to usem� 2 acetyl-CoA (Fig. 2D), correlating with an increase in growth (Fig. 1B).The strikingly different isotopomer labeling patterns of NEFAcompared with those of TFA indicate that NEFA and TFAwere derived from different pools of acetyl-CoA and thatTFA synthesis was more greatly affected by HSD rearing.Taken together, these results support a model in which pro-cessing of dietary carbohydrate into esterified fatty acidsstored in the FB is fundamentally altered in chronically HSD-fed larvae (Fig. 2A).The FB Lipidome Is Affected by Diet—To determine whether
HSD consumption affects FB content of individual glycerolipidmolecular species, ESI-MS/MS analyses were performed on FBlipids extracted from larvae raised on control food or a 0.7 M
sucrose HSD (Fig. 3, A and B). Wandering third instar larvaewere studied because this postfeeding stage exhibits many diet-dependent phenotypes, including obesity and insulin resistance(4). The relative abundances of various glycerolipid classes in
FB were found to be similar to those reported previously forwhole flies. The major lipid classes were TAG and phospholip-ids, and less than 10% of total lipid comprised diglycerides,ceramides, and free fatty acids (data not shown andRef. 37).Wetherefore examined the molecular species of TAG and phos-pholipids further. Tandemmass spectra indicated that the pre-dominant fatty acid substituents in larval FB TAG had carbonchain lengths of C16 or C18 with some C14 and even less withC12 (Fig. 3C).When TAG species were represented by the sum of the car-
bon chain lengths of and the total number of double bonds intheir FA substituents, HSD consumption was associated with areduction in mean total chain length compared with a controldiet (C47.053 � 0.042 versus C47.300 � 0.017, p � 0.0054).This is illustrated by the lower relative abundance of longerchain (C50 and C52) TAG species and a higher relative abun-dance of shorter chain (C44, C46, and C48) TAG species in FBof HSD-fed larvae compared with those fed a control diet (Fig.3, D and E). HSD-fed larvae also exhibited an increase in themean total number of double bonds (�1.549 � 0.002 versus�1.390� 0.006, p� 1.31� 10�5) in their FB TAGFA substitu-ents as reflected by the higher relative abundance of doubly and
FIGURE 2. A shift in metabolic channeling of dietary glucose occurs upon HSD feeding. A, proposed route of dietary glucose into lipid in larvae reared oncontrol or chronic HS diets. Dietary [U-13C6]glucose undergoes glycolysis and then enters the tricarboxylic acid cycle (TCA) to follow a metabolic route eitherdirectly (m � 2; solid line) or indirectly (m � 1; dotted line) into fatty acids. OAA, oxaloacetate; PEP, phosphoenolpyruvate; pyr, pyruvate; G-6-P, glucose6-phosphate. This diagram is simplified, and some steps have been omitted. B–D, isotopomer composition (m � 2 or m � 1) of NEFA at 6 h (B) or TFA at 6 h (C)or TFA at 24 h (D) after transfer to labeled diets. Shown is the weighted average of 14-, 16-, and 18-carbon fatty acids. Error bars are �S.E. The ratio of (m � 2)/(m � 1) for each condition is shown beneath the graphs. An unpaired, two-tailed t test was used to derive p values. ctl, control.
The Fat Body Controls Metabolic Homeostasis
8032 JOURNAL OF BIOLOGICAL CHEMISTRY VOLUME 288 • NUMBER 12 • MARCH 22, 2013
by guest on May 3, 2019
http://ww
w.jbc.org/
Dow
nloaded from

triply unsaturated species and a lower relative abundance ofmonounsaturated and saturated species in HSD-fed larval FBcompared with FB from larvae fed control food (Fig. 3F).PC was the most abundant phospholipids in larval FBs with
phosphatidylethanolamine and PI making up most of theremainder. Only one species of phosphatidylglycerol wasobserved in larval FB, albeit at levels just slightly above back-ground (data not shown). Tandem mass spectra indicated thatthe most abundant PC species contained C16:1 and C18:1 FAsubstituents (data not shown). When FB PC species were rep-resented by the sum of the carbon chain lengths of and the totalnumber of double bonds in their FA substituents (Fig. 4A), HSDconsumption led to a reduction in mean total chain length(C32.259 � 0.016 versus C32.429 � 0.027, p � 0.00543) com-pared with a control diet as reflected by a lower relative abun-dance of longer chain (C34 and C36) PC species and a higherrelative abundance of shorter chain (C32 and C28) PC speciesin HSD-fed larvae compared with those fed control food (Fig.
4B). HSD feeding had little effect on the double bond content ofFB PC fatty acid substituents (Fig. 4C).Phosphatidylethanolamine in FBs from larvae reared on an
HSD exhibited trends in chain length and unsaturation thatwere similar to those for TAG but of smaller magnitude (Fig. 4,D–F). The composition of larval FB PI (Fig. 4G) was alsoaffected by HSD in a manner similar to that for TAG with adecrease in mean total carbon chain length (C33.180 � 0.015versus C33.322 � 0.033, p � 0.017) as reflected by a lower rel-ative abundance of longer chain (C34 and C36) PI species in FBand a higher relative abundance of shorter chain (C32) PI spe-cies for HSD larvae compared with those fed control food (Fig.4H). An increase inmean double bond content (�1.438� 0.002versus �1.292 � 0.009, p � 2.28 � 10�4) of FA substituents inFB PI was also observed for HSD-fed larvae as reflected by ahigher relative abundance of doubly unsaturated species and alower relative abundance ofmonounsaturated species forHSD-fed larvae compared with those fed control food (Fig. 4I). These
FIGURE 3. An HSD induced changes in TAG fatty acid length and saturation. Wandering third instar FBs were isolated from larvae reared on control (ctl) or0.7 M sucrose HSD and subjected to ESI-MS analyses. A and B represent total ion current tracings that display the distribution of TAG molecular species as [M �Li]� ions. C, collisionally activated dissociation tandem mass spectrum analysis of fatty acid composition of m/z 811 (D–F) TAG composition of FBs. Error bars are�S.E. *, p � 0.05; **, p � 0.01.
The Fat Body Controls Metabolic Homeostasis
MARCH 22, 2013 • VOLUME 288 • NUMBER 12 JOURNAL OF BIOLOGICAL CHEMISTRY 8033
by guest on May 3, 2019
http://ww
w.jbc.org/
Dow
nloaded from

findings indicate that caloric excess affected the carbon chainlengths and degree of unsaturation of fatty acid substituents ofglycerolipids in larval FBs.HSDs Increase the Steady-state Levels of NEFA and Ketones—
Our tracer studies demonstrated differences in the ability oflarvae to channel dietary glucose carbons into stored fat versusNEFA. Given the proposed role of NEFA in pathophysiology ofinsulin resistance, we measured NEFAs in larvae and foundthem to be elevated on an HSD (Fig. 5A). One potential sourceof NEFA could be lipolysis; however, lipase activity was mark-edly reduced in larvae fed HSD (Fig. 5B), consistent with anincrease in NEFA synthesis by an HSD and an attempt by theanimal to retain these FAs in a stored form. Expression profilingstudies also suggested that lipogenesis, lipid storage, and �-ox-idation were increased on an HSD (4). �-Oxidation could leadto increased ketones, which are another potential source for usein generating NEFA. Ketone concentrations increased in larvaereared on an HSD compared with those reared on control food(Fig. 5C). Finally, CoA is required for NEFA to undergo �-oxi-dation or esterification into TAG and might be expected to belimiting in a setting of excess NEFA. CoA is also required forketone production andmany other cellular processes. FreeCoA
wasmeasured andwas decreased on anHSD (Fig. 5D), althoughthe difference was not significant (p � 0.18).Lean Larvae Are Intolerant of anHSD—In response to exces-
sive nutrient consumption, both mammals and flies increasefatty acid synthesis and esterification into TAG storage pools(2, 4, 38, 39). We previously observed that HSD-fed wanderingthird instar larvae exhibited gene expression changes thatreflect increased lipogenesis and decreased lipolysis (4). Theseresults are consistent with TAG accumulation in the FB,the major lipid storage organ, in HSD-fed larvae (4). To deter-mine whether the HSD-induced rise in FB TAG content is pro-tective or maladaptive, we used fat body-specific RNA interfer-ence (indicated by superscript i) to manipulate lipid storage.The expression of two putative lipogenic genes,Mio (CG18362)and desat1 (CG5887), was increased by feeding an HSD to lar-vae (4), so these genes became candidates of interest.To generate lean FBs, we targetedMio, which encodes a pro-
tein homologous to mammalian ChREBP, a carbohydrate-re-sponsive transcription factor that up-regulates glycolytic andlipogenic gene expression in response to increased intracellularsugar levels (40). We also targeted stearoyl-CoA desaturase 1(Desat1), which is a transcriptional target of vertebrate
FIGURE 4. An HSD induced changes in phospholipid fatty acid length and saturation. Wandering third instar FBs were isolated from larvae reared oncontrol or 0.7 M sucrose HSD and subjected to ESI-MS analyses. A–C, phosphatidylcholine composition. D–F, phosphatidylethanolamine composition. G–I,phosphatidylinositol composition. An unpaired, two-tailed t test was used to derive p values. *, p � 0.05; **, p � 0.01. Error bars are �S.E.
The Fat Body Controls Metabolic Homeostasis
8034 JOURNAL OF BIOLOGICAL CHEMISTRY VOLUME 288 • NUMBER 12 • MARCH 22, 2013
by guest on May 3, 2019
http://ww
w.jbc.org/
Dow
nloaded from

ChREBP. Vertebrate Desat1 is an enzyme that catalyzes con-version of saturated long chain fatty acids into monounsatu-rated fatty acids and participates in TAG synthesis (41). Inter-estingly, larvae with FB-specific loss of either Mio or Desat1were unable to tolerate anHSDof 1M sucrose (data not shown).A high sucrose diet is likewise lethal to lean mouse ChREBPmutants (42), implying that up-regulation of these genes in theFB upon chronic HSD feeding protects against caloric excess(Table 2). We therefore used an HSD of 0.7 M sucrose to studythese mutants. Both cg-GAL4; UAS-Mioi and cg-GAL4; UAS-desat1i larvae were smaller than wild-type larvae reared on the0.7 M HSD (Fig. 6A). HSD-reared cg-GAL4; UAS-Mioi and cg-GAL4;UAS-desat1i larvae contained less TAG than control lar-vae (Fig. 6B). Imaging the lipid droplets in the FB revealed anapparent reduction of lipid storage in cg-GAL4; UAS-Mioi andcg-GAL4;UAS-desat1i larval fat bodies comparedwith controls(Fig. 6, C–F). Upon consumption of the 0.7 M HSD, both ofthese lean animals exhibited increased hemolymph glucoseconcentrations compared with controls (Fig. 6, G and H). Thissuggests that fat storage in the FB protects against deleteriouseffects of an HSD.Lipogenesis Is Protective against Hyperglycemia in HSD-fed
Drosophila Larvae—To examine further the functional role ofFB lipid storage in the face of an HSD, we increased larval fatcontent by generating an FB-specific loss of functionmutant ofking-tubby (CG9398), which is the fly ortholog of the mamma-lian Tubby gene. Loss of Tubby is correlated with obesity inmice, worms, and humans (43–47). Wandering third instar cg-GAL4; UAS-king-tubbyi larvae were larger than stage-matched controls when reared on the HSD (Fig. 6I). Consist-ent with the role of Tubby in other organisms, cg-GAL4;UAS-king-tubbyi larvae exhibited increased TAG accumula-tion compared with control animals fed an HSD (Fig. 6J).
Obese cg-GAL4; UAS-king-tubbyi larvae had significantlylower hemolymph glucose levels (Fig. 6K), consistent with aprotective role of fat storage against the development of diet-induced diabetes in Drosophila.
FIGURE 5. Steady state levels of lipid metabolic substrates are affected byan HSD. Wandering wild-type (cg-GAL4; Vw1118) third instar larvae werereared on control (ctl) (0.15 M sucrose) or HSD (0.7 M), homogenized, andanalyzed. A, NEFA concentrations. B, lipase activity measured over 4 h. C, totalketone body concentrations. D, free CoA concentrations. Error bars are �S.E.An unpaired, two-tailed t test was used to derive p values.
TABLE 2Expression changes induced by an HSD in wild-type larval fat bodyWild-type Vw1118;UAS-Dcr2; cgGAL4 larvae were reared on a 0.15 M (control (ctl))or 0.7MHSD, and FBswere isolated for RNAextraction.A two-tailed Student’s t testwas used to derive p values. For simplicity, only a selection of genes is shown here;for full data, please see GEO accession number GSE43734. TCA, tricarboxylic acid;PEPCK, phosphoenolpyruvate carboxykinase.
CG number/category Name
Fold changeHSD/ctl
p vs.ctl
TrehaloseCG4104 Tps1 2.23 0.040CG30035 Tret-1 1.72 0.018CG8234 Tret-2 1.89 0.026
GlycolysisCG8251 Pgi 2.10 0.003CG6058 Aldolase 1.72 0.005CG1721 Pglym78 1.84 0.013CG17654 Eno 1.95 0.007CG7070 PyK 1.76 0.008CG9042 Gpdh 5.72 0.000
LipogenesisCG11198 ACC 0.54 0.197CG3523 Fatty-acid synthase 1.88 0.012CG17374 Fatty-acid synthase 0.51 0.152CG6178 Fatty-acid-CoA ligase 3.64 0.023CG3209 GPAT 1.32 0.028CG4729 GPAT 1.41 0.021CG17608 GPAT 1.92 0.047CG31991 mdy (DGAT) 1.72 0.034CG8522 SREBP 0.88 0.078CG18362 Mio/dChREBP 1.71 0.000CG5887 desat1 2.90 0.001
LipolysisCG11325 AKHR 2.64 0.001CG5560 Doppelgänger of brummer 0.63 0.001
�-OxidationCG12891 CPT1 1.50 0.018CG2107 CPT2 1.25 0.091CG4630 Carnitine acyl-carnitine translocase 2.63 0.008CG6178 Acyl-CoA synthase 3.64 0.023CG9527 Acyl-CoA dehydrogenase 1.88 0.002CG17544 Acyl-CoA dehydrogenase 0.24 0.040CG9547 Acyl-CoA dehydrogenase 0.61 0.018CG9709 Acyl-CoA oxidase 57D-d 3.09 0.073CG9707 Acyl-CoA oxidase 57D-p 0.73 0.031CG8778 Enoyl-CoA hydratase 0.77 0.040CG5044 3-Hydroxyisobutyryl-CoAhydrolase 0.76 0.002CG14630 Carnitine biosynthesis;
�-butyrobetaine dioxygenaseactivity
0.76 0.027
TCA cycleCG9244 Aconitase 1.51 0.001CG7998 Malate dehydrogenase 1.47 0.027CG7430 �-Ketoglutarate dehydrogenase 1.57 0.006
Ketone and CoAmetabolism
CG1140 SCOT (acetoacyl-CoA synthase) 1.30 0.557CG5725 fbl (pantothenate kinase) 1.82 0.036CG10932 Acetoacyl-CoA thiolase 1.11 0.533CG9149 Acetoacyl-CoA thiolase 1.04 0.898CG10399 HMG-CoA lyase 1.79 0.456CG4311 HMG-CoA synthase 1.39 0.062CG8322 ATP-citrate lyase 1.11 0.570CG1774 Acyl-CoA thioester hydrolase 10.59 0.000
GluconeogenesisCG17725 PEPCK 2.32 0.027CG10924 PEPCK 1.75 0.024CG31692 fbp 1.56 0.060CG1516 Pyruvate carboxylase 2.63 0.019
GlycogenolysisCG11325 AKHR 2.64 0.001CG7254 GlyP 1.81 0.003
The Fat Body Controls Metabolic Homeostasis
MARCH 22, 2013 • VOLUME 288 • NUMBER 12 JOURNAL OF BIOLOGICAL CHEMISTRY 8035
by guest on May 3, 2019
http://ww
w.jbc.org/
Dow
nloaded from

AnHSDAffects Gene Expression and Lipid Content in aMio-dependent Fashion in the FB—To study howHSDconsumptioncauses changes in FB physiology, we profiled gene expression in
the FB of control and HSD-reared wandering third instar lar-vae. A total of 456 down-regulated genes and 528 up-regulatedgenes was determined to be differentially expressed in FBs ofHSD-fed larvae compared with controls using a paired t testwith a cutoff of p � 0.05 and no -fold change requirements(supplemental Table S1). As expected, genes encoding enzymesinvolved in glycolysis, lipogenesis, and trehalose synthesis andtransport were up-regulated in HSD-fed larvae (Table 2). Sur-prisingly, chronicHSD feeding resulted in increased expressionof enzymes involved in glycogenolysis, gluconeogenesis, andfatty acid �-oxidation (Table 2). GOstat (48) was used to groupexpression changes into categories that are expected to influ-ence cellular pathway activity. A relatively large number ofcytochrome P450 oxidoreductases were significantly down-regulated by chronic HSD feeding (Table 3) as was the expres-sion of many stress response proteins (Table 3). Note, however,that cytochrome P450 4e3 is the fourth most highly up-regu-lated gene (18-fold, p � 0.01) in HSD-fed larvae (supplementalTable S1). Genes encoding five glutathione S-transferases weredown-regulated in HSD-fed larvae (GEO accession numberGSE43734). Other genes that GOstat identified as up-regulatedin response to HSD-feeding encoded several proteins localizedto endoplasmic reticulum and Golgi and enzymes involved intRNA aminoacylation (Table 3).To understand how the transcription factor Mio might lead
to reduced viability and a systemic disruption of lipid homeo-stasis in response to HSD feeding, we profiled gene expressionin cg-GAL4; UAS-Mioi larval FBs on a 0.7 M sucrose HSD. Atotal of 1683 down-regulated genes and 1869 up-regulatedgenes was found to be differentially expressed in FBs of controland Mio mutant HSD-fed larvae using a paired t test with acutoff of p � 0.05 without -fold change requirements. Consist-ent with the hypothesis that ChREBP is largely a transcriptionalactivator of glucose catabolism, we observed a decrease in expres-sionofgenes involved inglycolysis, pyruvatemetabolism,and lipo-genesis inMiomutant fat bodies,many of whichwere induced bythe HSD (Tables 2 and 4 and supplemental Table S1). One ofthe most highly up-regulated categories, however, was lipases,consistentwith the leanness observed in thesemutants. Expres-sion of enzymes controlling the levels of ketone and CoA sub-strates for fatty acid synthesis were also misregulated in cg-GAL4; UAS-Mioi FBs (Table 4). Transcription of genesencoding many members of the insulin signaling pathway wassignificantly reduced inmutants, whichmay account for part ofthe hyperglycemia observed in cg-GAL4; UAS-Mioi HSD-fedlarvae (Table 4). Proteases and mitochondrial and ribosomalproteins in cg-GAL4; UAS-Mioi larval FBs were GO categoriesof interest because theymay be repressed byChREBP (Table 5).GO analysis also suggested that growth and the immuneresponse are reduced at the transcriptional level inMiomutantfat bodies (Table 5).Because our analyses implicated Mio in the control of lipid
metabolismandMio is essential for tolerance ofHSDs,we char-acterized the lipid composition of Mio mutant FBs by ESI-MS(Fig. 7). Lipid levels of all types (comprising TAG, PI, PC, andphosphatidylethanolamine) analyzed were reduced in Miomutant FBs (data not shown). Specific substituents were alsoaffected in cg-GAL4; UAS-Mioi mutants. We observed an
FIGURE 6. TAG accumulation is necessary to tolerate an HSD. Wanderingthird instar larvae were reared on a 0.7 M HSD for these studies. A, larval size incg-GAL4; UAS-Mioi and cg-GAL4; UAS-desat1i larvae compared with controls.Larval TAG in cg-GAL4; UAS-Mioi (B) and cg-GAL4; UAS-desat1i larvae (E and F)are compared with controls. C, FB lipid storage droplets in wild-type larvaereared on a control (0.15 M sucrose) diet. D, FB lipid storage in wild-type larvaereared on an HSD. E, FB lipid storage in cg-GAL4; UAS-Mioi larvae reared on anHSD. F, FB lipid storage in cg-GAL4; UAS-desat1i larvae reared on an HSD. G,hemolymph glucose concentrations in cg-GAL4; UAS-Mioi larvae comparedwith controls. H, hemolymph glucose concentrations in cg-GAL4; UAS-desat1i
larvae compared with controls. I, larval size in cg-GAL4; UAS-King-Tubbyi larvaecompared with controls. J, larval TAG in cg-GAL4; UAS-King-Tubbyi larvae com-pared with controls. K, hemolymph glucose concentrations in cg-GAL4; UAS-King-Tubbyi larvae compared with controls. An unpaired, two-tailed t test wasused to derive p values. Error bars are �S.E.
The Fat Body Controls Metabolic Homeostasis
8036 JOURNAL OF BIOLOGICAL CHEMISTRY VOLUME 288 • NUMBER 12 • MARCH 22, 2013
by guest on May 3, 2019
http://ww
w.jbc.org/
Dow
nloaded from
increased mean carbon chain length of the fatty acid substitu-ents (C47.908 � 0.042 versus C47.053 � 0.042, p � 0.0018) inFBTAG fromHSD-fed cg-GAL4;UAS-Mioimutants comparedwith controls (Fig. 7,A andB). Fatty acid substituents seemed tobe more saturated inMiomutant FBs compared with controls,although these data were not highly significant (Fig. 7C). NEFAand ketonesweremeasured in cg-GAL4;UAS-Mioimutants. FBMio knockdown marginally affected NEFA levels (12% reduc-tion, p � 0.08), whereas ketones were reduced significantlycompared with wild-type larvae on the 0.7 MHSD (Fig. 7,D andE). Interestingly, lipase activity was not increased in cg-GAL4;UAS-Mioi larvae despite a strong increase in expression ofmostlipases comparedwithwild-type larvae on a 0.7MHSD (Fig. 7F).Together, these data suggest that Mio transcriptionally con-trols lipogenesis, lipid storage, and fatty acid substituent lengthand saturation in the fly.
DISCUSSION
Caloric excess is associated with several human pathologicstates, including cancer, obesity, and cardiovascular and liverdiseases, and aberrant tissue lipogenesis correlates with diseaseseverity (49–54). Here, we have explored the effects ofHSDs onlipidmetabolism in the simplemodel organismDrosophila.Weobserved a switch in metabolism of dietary glucose in HSD-reared larvae that attenuated FA esterification. The fate of car-bon atoms from dietary glucose was dependent on the rearingdiet of the larvae: carbons weremore directly incorporated intoesterified lipids in larvae reared on the control diet comparedwith HS-reared animals. Lipogenesis was required in the fatbody for tolerance of HSDs, suggesting that this pathway actsprotectively against the deleterious consequences of HSD con-sumption, whichmay result fromhigh free fatty acid or reducedCoA concentrations.Our results in the fruit fly support amodelin which excess dietary sugar is stored as TAG; when the capac-ity of the FB to store fat is exceeded, negative consequences forgrowth and metabolism ensue.AMetabolic Switch in Larvae Reared on an HSD—In healthy
larvae, energy from dietary sugar is stored as FB TAG. When
dietary sugar consumption is excessive, larvae must accommo-date an increased flux of sugar-derived lipids into storageforms. Stable isotope labeling studies revealed thatHSD feedingaffected both the rate and route of dietary glucose metabolism(Figs. 1 and 2). Of note, some of the effects of HSD on growthand metabolic diversion of glucose carbons can be reversedafter transfer to a control diet (Figs. 1B and 2,C andD). Animalsreared on an HSD initiated a robust transcriptional responsetoward increasing TAG storage in the FB (Table 2), suggestingthat larvae attempted to incorporate excess sugar into stored fatbut that their ability to do so was limited. Rerouting of dietarycarbons may be one mechanism by which the animal accom-modates dietary excess. Both the tricarboxylic acid cycle andgluconeogenesis are increased at the transcriptional level by anHSD (Table 2). These could contribute to a metabolic detourfor dietary carbon to produce more singly labeled acetate inHSD-reared larvae (Fig. 2A). Much of the decrease in TFA syn-thesized from dietary glucose can be accounted for by thereduction in doubly labeled, directly synthesized FAs, suggest-ing that this rerouting affects the rate of synthesis of TFA fromdietary carbohydrate inHSD-reared larvae. Interestingly, HSD-induced rerouting of dietary glucose carbons did not occur intheNEFA pool, and this pool was affected differently by rearingdiet than the TFA pool (Figs. 1, C, D, F, and G, and 2, B–D).Thus, the precursors for synthesis of free and esterified fattyacids reside in two distinguishable pools in whole larvae. Thesedifferent fatty acid poolsmight reside in distinct anatomic com-partments, such as FB andmuscle or oenocyte, tissues known tobe involved in fat metabolism (55). They could also representlipogenesis in two subcellular locations, perhaps by one of threedifferent fatty acid synthases (CG3523, CG3524, andCG17374)encoded in the fly genome.Flux of Excess Dietary Carbon into Stored TAG Can Protect
Drosophila from HSD-induced Hyperglycemia—Classical stud-ies have identified several Drosophila mutants with perturbedglucose and lipid homeostasis (for a review, see Ref. 56). Weused a tissue-specific approach to study the role of the FB in
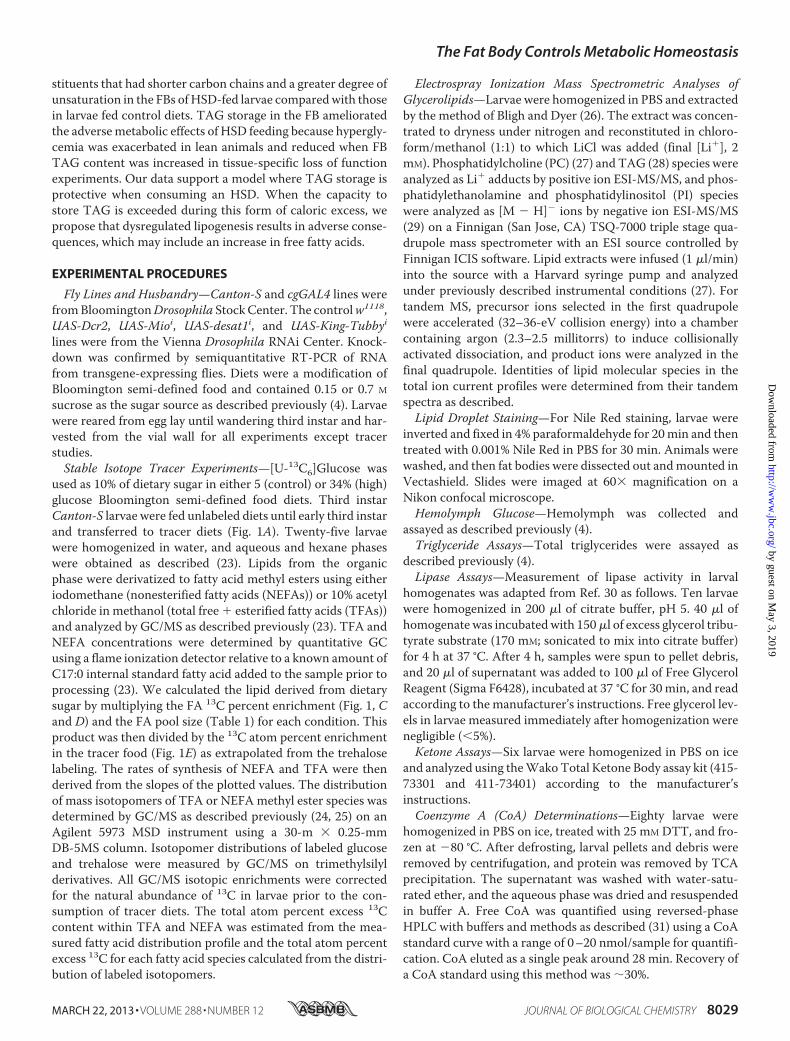
TABLE 3Gene ontology (GO) categories of mRNAs significantly up- or down-regulated in the fat body by an HSDCOPI, coatomer protein 1.
GO category p value GenesUp- or
down-regulated
Endoplasmic reticulum 3.39 � 10�10 axs, ca-p60a, cg6512, cg10908, cg14476, cnx99a, cpr, crc, gtp-bp, hsc70-3,l(1)g0320, l(2)not, oststt3, p115, pek, pdi, sec31, sec61�, spase18–21,spase25, spp, surf4, syx5, tango14, ter94, tram
Up
Golgi apparatus 3.26 � 10�6 �cop, �cop, �cop, �cop, �cop, �4galt7, fws, garz, grasp65, lva, nucb1,p115, pgant5, pgant6, sec31, syx5, tango1, tango12
Up
Aminoacyl-tRNA ligase activity 5.84 � 10�8 aats-ala, aats-asn, aats-asp, aats-cys, aats-glupro, aats-gly, aats-ile, aats-thr, aats-trp, aats-val, cg16912, cg17259, cg31133, cg33123
Up
COPI vesicle coat 1.80 � 10�4 �cop, �cop, �cop, �cop, �cop UpOxidoreductase 4.94 � 10�8 acox57d-p, cat, cg1319, cg3699, cg5493, cg5840, cg6870, cg7280, cg8193,
cg9512, cg9547, cg10962, cg14630, cg14946, cg17544, cg31169, cg33099,cyp6a8, cyp6a9, cyp6a18, cyp6a21, cyp6d4, cyp6d5, cyp6v1, cyp12a4,cyp12a5, cyp12d1-d, cyp12d1-p, cyp28d1, eo, gdh, ho, ifc, nmdmc,phgpx, ppox, pxn, sodh-1, sodh-2, uro
Down
Response to stress 0.00966 ark, cat, cdc42, cdk9, hml, hsp23, hsp70ba, hsp70bb, hsp70bbb, hsp70bc,ip3k1,mei-41,mthl10, pain, phgpx, spel1
Down
Actin cytoskeleton organization andbiogenesis
0.00966 arc-p20, arpc3b, capt, cdc42, ced-12, chic, hem, kel,mei-41,msp-300,rac1, rhogef2, spir, src42a
Down
UDP-N-acetylglucosamine-peptideN-acetylglucosaminyltransferasecomplex
0.045 cg4050, cg5038 Down
The Fat Body Controls Metabolic Homeostasis
MARCH 22, 2013 • VOLUME 288 • NUMBER 12 JOURNAL OF BIOLOGICAL CHEMISTRY 8037
by guest on May 3, 2019
http://ww
w.jbc.org/
Dow
nloaded from
regulating glucose disposal and energy storage.Our results sup-port a model in which FB lipogenesis protects against deleteri-ous effects of HSD consumption. In general, we have found thatlean animals consistently have decreased viability on an HSD,whereas fatter animals exhibit improved growth and hemo-lymph sugar homeostasis (Fig. 6 and data not shown). Ourresults indicate that Mio acts as the Drosophila ChREBPortholog (dChREBP). Similarly, reducing king-tubby expres-sion resulted in increased larval size and adiposity, resemblingmammalian Tubby mutants (44, 45, 47). Interestingly, tubby
mutant mice are normoglycemic despite severe adult onsetobesity (44). These and other studies support an emerging, pro-tective role for fat storage that appears to be evolutionarily con-served (see below).Dysregulated Metabolite Pools May Contribute to Toxicity of
HSD—Although it is tempting to speculate that an individuallipid or metabolite impairs growth and disrupts glucose andlipid metabolism in wild-type larvae fed an HSD, it is morelikely to be dysregulation of multiple pathways that togetherresult in insulin resistance. We found changes in NEFA, CoA,
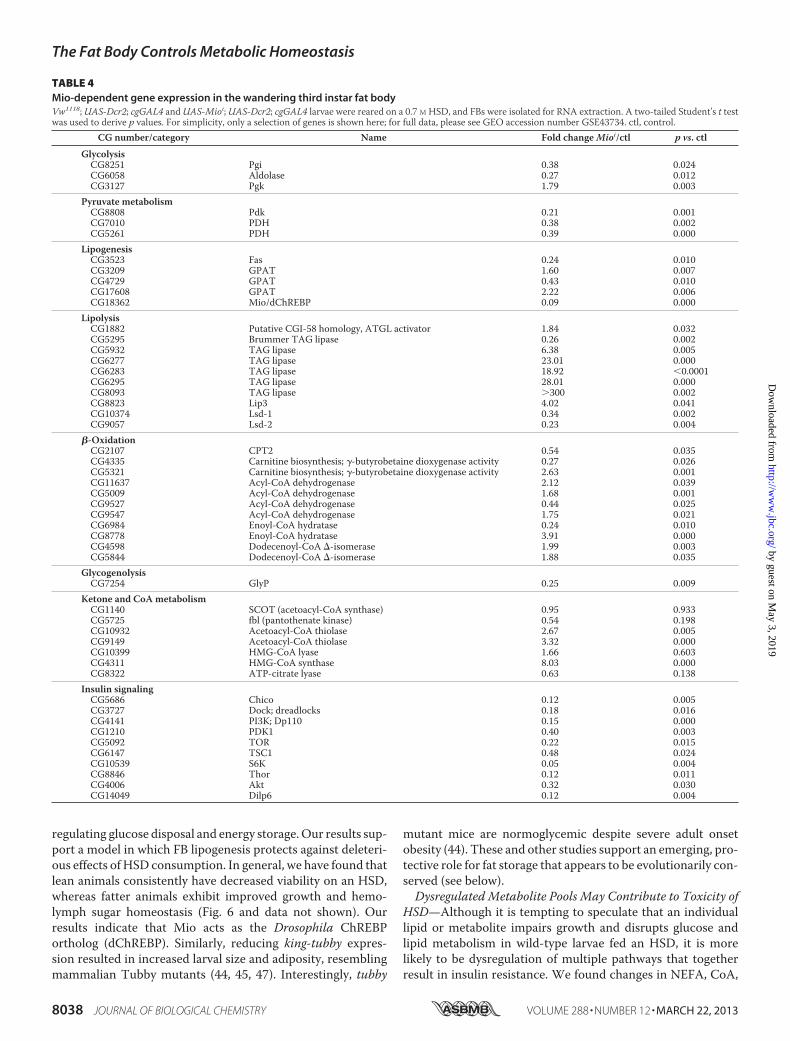
TABLE 4Mio-dependent gene expression in the wandering third instar fat bodyVw1118;UAS-Dcr2; cgGAL4 andUAS-Mioi;UAS-Dcr2; cgGAL4 larvae were reared on a 0.7 M HSD, and FBs were isolated for RNA extraction. A two-tailed Student’s t testwas used to derive p values. For simplicity, only a selection of genes is shown here; for full data, please see GEO accession number GSE43734. ctl, control.
CG number/category Name Fold changeMioi/ctl p vs. ctl
GlycolysisCG8251 Pgi 0.38 0.024CG6058 Aldolase 0.27 0.012CG3127 Pgk 1.79 0.003
Pyruvate metabolismCG8808 Pdk 0.21 0.001CG7010 PDH 0.38 0.002CG5261 PDH 0.39 0.000
LipogenesisCG3523 Fas 0.24 0.010CG3209 GPAT 1.60 0.007CG4729 GPAT 0.43 0.010CG17608 GPAT 2.22 0.006CG18362 Mio/dChREBP 0.09 0.000
LipolysisCG1882 Putative CGI-58 homology, ATGL activator 1.84 0.032CG5295 Brummer TAG lipase 0.26 0.002CG5932 TAG lipase 6.38 0.005CG6277 TAG lipase 23.01 0.000CG6283 TAG lipase 18.92 �0.0001CG6295 TAG lipase 28.01 0.000CG8093 TAG lipase 300 0.002CG8823 Lip3 4.02 0.041CG10374 Lsd-1 0.34 0.002CG9057 Lsd-2 0.23 0.004
�-OxidationCG2107 CPT2 0.54 0.035CG4335 Carnitine biosynthesis; �-butyrobetaine dioxygenase activity 0.27 0.026CG5321 Carnitine biosynthesis; �-butyrobetaine dioxygenase activity 2.63 0.001CG11637 Acyl-CoA dehydrogenase 2.12 0.039CG5009 Acyl-CoA dehydrogenase 1.68 0.001CG9527 Acyl-CoA dehydrogenase 0.44 0.025CG9547 Acyl-CoA dehydrogenase 1.75 0.021CG6984 Enoyl-CoA hydratase 0.24 0.010CG8778 Enoyl-CoA hydratase 3.91 0.000CG4598 Dodecenoyl-CoA �-isomerase 1.99 0.003CG5844 Dodecenoyl-CoA �-isomerase 1.88 0.035
GlycogenolysisCG7254 GlyP 0.25 0.009
Ketone and CoA metabolismCG1140 SCOT (acetoacyl-CoA synthase) 0.95 0.933CG5725 fbl (pantothenate kinase) 0.54 0.198CG10932 Acetoacyl-CoA thiolase 2.67 0.005CG9149 Acetoacyl-CoA thiolase 3.32 0.000CG10399 HMG-CoA lyase 1.66 0.603CG4311 HMG-CoA synthase 8.03 0.000CG8322 ATP-citrate lyase 0.63 0.138
Insulin signalingCG5686 Chico 0.12 0.005CG3727 Dock; dreadlocks 0.18 0.016CG4141 PI3K; Dp110 0.15 0.000CG1210 PDK1 0.40 0.003CG5092 TOR 0.22 0.015CG6147 TSC1 0.48 0.024CG10539 S6K 0.05 0.004CG8846 Thor 0.12 0.011CG4006 Akt 0.32 0.030CG14049 Dilp6 0.12 0.004
The Fat Body Controls Metabolic Homeostasis
8038 JOURNAL OF BIOLOGICAL CHEMISTRY VOLUME 288 • NUMBER 12 • MARCH 22, 2013
by guest on May 3, 2019
http://ww
w.jbc.org/
Dow
nloaded from

FIGURE 7. Loss of Mio in the fat body affects lipid metabolism. Wandering third instar FBs were isolated from control or cg-GAL4; UAS-Mioi larvae reared on0.7 M sucrose HSDs and subjected to ESI-MS analyses. A, composition of FB TAG. B, relative chain lengths of fatty acids esterified as TAG. C, saturation of fattyacids esterified as TAG. D, NEFA concentrations. E, total ketone body concentrations. F, lipase activity measured over 4 h. An unpaired, two-tailed t test was usedto derive p values. *, p � 0.05; **, p � 0.01. Error bars are �S.E.
TABLE 5GO categories of mRNAs significantly up- or down-regulated by loss of Mio/dChREBP in the fat bodyCOPI, coatomer protein 1.
GO category p value GenesUp- or
down-regulatedRibosome 1.18 � 10�45 cg6764,mrpl10,mrpl17,mrpl21,mrpl23,mrpl24,mrpl27,mrpl30,mrpl36,mrpl39,mrpl40,
mrpl41,mrpl46,mrpl51,mrpl52,mrps5,mrps14,mrps16,mrps17,mrps18c,mrps22,mrps25,mrps26,mrps28, qm, rpl7a, rpl8, rpl9, rpl11, rpl12, rpl13a, rpl19, rpl21, rpl23,rpl29, rpl30, rpl36, rpl38, rpl39, rplp1, rplp2, rps3, rps5a, rps6, rps9, rps10b, rps11, rps14a,rps14b, rps15aa, rps15ab, rps17, rps18, rps23, rps27a, rps29, tko
Up
Mitochondrion 1.07 � 10�35 aldh, arg, cchl, cg1824, cg1907, cg2543, cg2658, cg2789, cg3621, cg3683, cg3719, cg3803,cg4095, cg4225, cg4592, cg4598, cg4769, cg4995, cg5037, cg5254, cg5548, cg6020, cg6404,cg6412, cg6439, cg7430, cg7598, cg7943, cg8680, cg8728, cg9172, cg9547, cg10320, cg12400,cg14482, cg31075, cg32230, cg32250, cg32649, cova, cyp12a4, dnapol-�35, eftum,ferrochelatase, gata, got2, hsp60, hsp68, idh, l(1)g0255, l(2)37cc,mrpl10,mrpl17,mrpl21,mrpl23,mrpl24,mrpl27,mrpl30,mrpl36,mrpl39,mrpl40,mrpl41,mrpl46,mrpl51,mrpl52,mrps5,mrps14,mrps16,mrps17,mrps18c,mrps22,mrps25 mrps26,mrps28,mtacp1,mt:coi,mt:coii,mt:coiii,mt:cyt-b,mt:nd1,mt:nd2,mt:nd3,mt:nd4l,mt:nd5,mt:nd6, nd75, nemy, oat, pink1, porin, scpx, scs�, scu, sucb, sun, surf1, t-cp1, tko, yip2
Up
COPI vesicle coat 2.24 � 10�6 chop24, �cop, �cop, �cop, �cop, �cop, �cop UpElectron transport 1.30 � 10�10 cg3560, cg3621, cg3683, cg4169, cg4769, cg5548, cg6020, cg6666, cg7181, cg8680, cg9172,
cg10320, cg11015, cg11455, cg12079, cg12859, cg14482, cg12400, cg17280, cg32230,cg32649, cg41623, cova, cyt-b5,mtacp1,mt:coi,mt:coii, pdsw, rfesp, ox
Up
Proteolysis 6.91 � 10�8 aos1, ate1, cg2200, cg7142, cg8299, cg8952, cg9631, cg10472, cg10908, cg11911, cg11912,cg12000, cg13779, cg16749, cg16996, cg16997, cg17571, cg17684, cg18179, cg18180,cg30025, cg30031, cg31728, cg32147, ice, jon66ci, pros45, jon25biii, jon25bii, jon25bi,jon44e, jon65ai, jon65aii, jon65aiii, jon65aiv, jon66cii,jon74e, jon99ci, jon99cii, jon99ciii,jon99fii, kaz1-orfb, roc1a, �try, �try, �try, �try, �try, try, try, pros26.4, pros28.1, pros29,pros35, prosma5, psn, rpn7, rpn11, rpn12, rps27a, rpt3, sras, ter94, th, uch-l3, w, yip7
Up
Growth regulation 1.58 � 10�5 akt1, babo, chico, dsx, eif-4e, foxo, lack, lk6, path, phl, pi3k92e, pk61c, s6k, samuel, �-spec,thor, tkv, tor, tsc1, tsg101, wts, yki
Down
Protein transport 1.64 � 10�5 arr, cact, cas, cg4289, cg6359, cg6842, cg9426, cg14804, cora, cos,dco, emb, fbp1, fs(2)ket,hkl,hop, kap-�1, kap-�3, lwr,mbo,nup214, olf186-f, sec6, slmb, srp54k, srpr�, tim8, tom40, tom70
Down
Programmed cell death 4.66 � 10�5 aac11, ago2, akap200, akt1, ark, art4, bruce, cas, cbt, cg3829, cg5651, cg17019, decay, dream,ecr, egfr, egr, eif-4e, eip74ef, eip75b, hkl, hr78, ik2, l(1)g0148, l(2)01424, ofs, pall, pk61c,pnt, pp2a-b, pr2, puc, raw, sktl, slmb, usp, wts, yki, zip
Down
Immune system process 8.17 � 10�6 adgf-a, ago2, brm, cact, cdc42, cg6509, dcr-2, dif, egfr, egr, eip75b, gef26, hel89b, hep, hop, kis,lola, lwr,mask,mbo,mp1,mys, nej, par-1, pgrp-lc, pgrp-le, phl, pnt, pvr, r, rac1, rel, rho1,srp, stat92e, su(var)2–10, tab2, tepii, thor, tl, tlk, tub, ush, ytr
Down
Hemocyte differentiation 8.65 � 10�6 adgf-a, dif, egfr, hep, hop, lwr, phl, pnt, pvr, rac1, srp, stat92e, tl, ush, ytr DownHistone modification 7.51 � 10�6 art4, ash1, atac1, bur, cg1716, cg10542, cg15835, e(z), jil-1, parg, pr-set7, rpd3, rtf1, sir2,
su(var)4–20, su(z)12, tlkDown
The Fat Body Controls Metabolic Homeostasis
MARCH 22, 2013 • VOLUME 288 • NUMBER 12 JOURNAL OF BIOLOGICAL CHEMISTRY 8039
by guest on May 3, 2019
http://ww
w.jbc.org/
Dow
nloaded from

and ketone levels in HSD-fed larvae. NEFA excess might beexpected to increase �-oxidation and lipid storage, and weobserved an increase in expression of enzymes that direct theseprocesses. The increased �-oxidation could deplete essentialmetabolites, such as CoA, which is required for more than 100enzymatic reactions.HS dietsmay have reducedCoAmodestly,but the difference was not statistically significant. It is difficultto know the physiologic relevance of a small decrease in CoAlevels; however, therewas a transcriptional response to increaseCoA levels (pantothenate kinase and acyl-CoA thioester hydro-lase were up-regulated 1.8- and 10-fold, respectively; Table 2).Finally, decreased CoA levels would also impair the ability touse ketones for lipogenesis and might explain the increasedketones observed in larvae fed HSD. Any or all of these meta-bolic disturbances could contribute to the toxicity of HSDfeeding.The transcription factor Mio/dChREBP clearly plays a cen-
tral role in the regulation of the glucose and lipidmetabolism ofthe animals exposed to caloric excess byHSD.On control diets,fat body-specificMio/dChREBPmutants (cg-GAL4;UAS-Mioi)grow and develop normally and do not exhibit increased hemo-lymph glucose concentrations compared with wild-type larvae(data not shown), suggesting that Mio/dChREBP-dependentmetabolism of dietary sugar is not essential under these condi-tions. The cg-GAL4; UAS-Mioi larvae are lean and do showreduced expression of lipogenic genes on a control diet (datanot shown and supplemental Table S1). Therefore, an inabilityto store dietary glucose as TAG is deleterious only in the face ofcaloric excess.On anHSD, lean,Mio/dChREBPmutant fat bodies displayed
features of general metabolic imbalance. Despite transcrip-tional up-regulation of several lipases, ChREBPmutants had noincrease in lipase activity and exhibited marginally reducedtotal NEFA. Mutants also increased expression of insulin sig-naling pathway components, yet growthwas impaired. Ketoneswere dramatically reduced inMio/dChREBP knockdown coin-cident with increased expression of enzymes involved in con-version of ketones into NEFA (Table 4). This might reflect thattheMio/dChREBP knockdown larvae consume ketones for theessential synthesis of lipids due to a diminished ability to usemore direct paths from glucose to lipogenesis.An Evolutionarily Conserved Maximum TAG Capacity
Model for T2D—Previously published work demonstrates thatdespite resulting in caloric excess larval HSD consumptiondoes not result in increased TAG per animal measured at theend of larval development when TAG storage reaches its max-imum (4). HSD-reared larvae contain a larger pool of storedlipids midway through development than controls such thattheir capacity to further store lipids may be compromised(Table 1). Growing evidence in othermodels suggests that stor-age of excess NEFA in adipose TAG may be protective againstT2D, an idea that challenges the current paradigm that obesitycauses T2D (57, 58). Increasing fat storage in adipose tissueprotects mice fromT2D (59, 60), and animals that cannot storefat normally are insulin-resistant when fed normal diets (61,62). A number of studies in humans are also consistent with amaximum TAG capacity model for T2D (for a review, see Ref.63). Gastric bypass surgery ameliorates T2D (64), whereas
liposuction does not (65), suggesting that the capacity tostore fat is important. Peroxisome proliferator-activatedreceptor (PPAR)-� agonists act as insulin sensitizers, and thesedrugs increase adiposity while decreasing hepatic and circulat-ing lipid levels, effects that are also consistent with a protectivefunction for fat storage in adipose tissue (66). In contrast,ectopic TAG accumulation in non-adipose tissues, such asmuscle, liver, or blood, is associated with insulin resistance (fora review, see Ref. 67).ESI-MS analyses of lipidmolecular species revealed that fatty
acid substituents of glycerolipids in HSD-reared larvae exhibitshorter carbon chains and increased unsaturation comparedwith those from larvae reared on a control diet (Figs. 3 and 4),and desaturase activity was protective in HSD-fed larvae (Fig.6). Recent work describing the TAG signature of insulin resist-ance in humans associated increased risk with reduced carbonchain length and double bond content (68). Fatty acid carbonchain length has also been associated with insulin resistance inmice (69), and desaturation has been associated with insulinsensitivity in mice and cultured cells (70, 71). Esterified fattyacid substituents in Mio/dChREBP mutant FBs were longercompared with controls. Interestingly, expression of Elovl6, amammalian ortholog of these elongases, is dependent onChREBP (72), and knock-out of Elovl6 reduced fatty acid sub-stituent length and decreased both lipogenic and oxidative geneexpression in the face of a high fat/high sucrose diet (69). Wehypothesize that saturated fatty acids are one source of cellulardamage in HSD-fedDrosophila. The ability to store excess die-tary carbon as TAG could be protective against free saturatedlong chain fatty acids or other lipotoxicmolecules that accumu-late when their safe storage capacity is exceeded.
Acknowledgments—We thank Alan Bohrer, Trey Coleman, FreidaCustodio, Fong Fu-Hsu, Jennifer Shew, and Sarah Spencer for experttechnical assistance and Peter Crawford for helpful discussions. Wealso thank the Bloomington Drosophila Stock Center and the ViennaDrosophila RNAi Center for fly strains.
REFERENCES1. Ceriello, A. (2006) Effects of macronutrient excess and composition on
oxidative stress: relevance to diabetes and cardiovascular disease. Curr.Atheroscler. Rep. 8, 472–476
2. Fukuchi, S., Hamaguchi, K., Seike, M., Himeno, K., Sakata, T., and Yoshi-matsu, H. (2004) Role of fatty acid composition in the development ofmetabolic disorders in sucrose-induced obese rats. Exp. Biol. Med. 229,486–493
3. Gagliardi, L., and Wittert, G. (2007) Management of obesity in patientswith type 2 diabetes mellitus. Curr. Diabetes Rev. 3, 95–101
4. Musselman, L. P., Fink, J. L., Narzinski, K., Ramachandran, P. V., Hathira-mani, S. S., Cagan, R. L., and Baranski, T. J. (2011) A high-sugar dietproduces obesity and insulin resistance in wild-type Drosophila. Dis.Model. Mech. 4, 842–849
5. Reed, L. K., Williams, S., Springston, M., Brown, J., Freeman, K., DesRo-ches, C. E., Sokolowski, M. B., and Gibson, G. (2010) Genotype-by-dietinteractions drive metabolic phenotype variation in Drosophila melano-gaster. Genetics 185, 1009–1019
6. Skorupa, D. A., Dervisefendic, A., Zwiener, J., and Pletcher, S. D. (2008)Dietary composition specifies consumption, obesity, and lifespan in Dro-sophila melanogaster. Aging Cell 7, 478–490
7. Sullivan, S. (2010) Implications of diet on nonalcoholic fatty liver disease.Curr. Opin. Gastroenterol. 26, 160–164
The Fat Body Controls Metabolic Homeostasis
8040 JOURNAL OF BIOLOGICAL CHEMISTRY VOLUME 288 • NUMBER 12 • MARCH 22, 2013
by guest on May 3, 2019
http://ww
w.jbc.org/
Dow
nloaded from
8. Pasco,M. Y., and Léopold, P. (2012)High sugar-induced insulin resistanceinDrosophila relies on the lipocalin Neural Lazarillo. PLoS One 7, e36583
9. Chung, H., Sztal, T., Pasricha, S., Sridhar, M., Batterham, P., and Daborn,P. J. (2009) Characterization of Drosophila melanogaster cytochromeP450 genes. Proc. Natl. Acad. Sci. U.S.A. 106, 5731–5736
10. Géminard, C., Rulifson, E. J., and Léopold, P. (2009) Remote control ofinsulin secretion by fat cells in Drosophila. Cell Metab. 10, 199–207
11. Kühnlein, R. P. (2011) The contribution of the Drosophila model to lipiddroplet research. Prog. Lipid Res. 50, 348–356
12. Lemaitre, B., and Hoffmann, J. (2007) The host defense of Drosophilamelanogaster. Annu. Rev. Immunol. 25, 697–743
13. DiAngelo, J. R., and Birnbaum, M. J. (2009) Regulation of fat cell mass byinsulin in Drosophila melanogaster.Mol. Cell. Biol. 29, 6341–6352
14. Lee, G., and Park, J. H. (2004) Hemolymph sugar homeostasis and starva-tion-induced hyperactivity affected by genetic manipulations of the adi-pokinetic hormone-encoding gene in Drosophila melanogaster. Genetics167, 311–323
15. Clifton, P. M. (2008) Dietary treatment for obesity. Nat. Clin. Pract. Gas-troenterol. Hepatol. 5, 672–681
16. Hession, M., Rolland, C., Kulkarni, U., Wise, A., and Broom, J. (2009)Systematic review of randomized controlled trials of low-carbohydrate vs.low-fat/low-calorie diets in themanagement of obesity and its comorbidi-ties. Obes. Rev. 10, 36–50
17. Leclercq, I. A., and Horsmans, Y. (2008) Nonalcoholic fatty liver disease:the potential role of nutritional management. Curr. Opin. Clin. Nutr.Metab. Care 11, 766–773
18. Tappy, L., Le, K. A., Tran, C., and Paquot, N. (2010) Fructose and meta-bolic diseases: new findings, new questions. Nutrition 26, 1044–1049
19. Samuel, V. T., and Shulman, G. I. (2012) Mechanisms for insulin resist-ance: common threads and missing links. Cell 148, 852–871
20. Taubes, G. (2009) Insulin resistance. Prosperity’s plague. Science 325,256–260
21. Brookheart, R. T., Michel, C. I., and Schaffer, J. E. (2009) As amatter of fat.Cell Metab. 10, 9–12
22. Postic, C., andGirard, J. (2008)Contribution of de novo fatty acid synthesisto hepatic steatosis and insulin resistance: lessons from genetically engi-neered mice. J. Clin. Investig. 118, 829–838
23. Patterson, B. W., Zhao, G., Elias, N., Hachey, D. L., and Klein, S. (1999)Validation of a new procedure to determine plasma fatty acid concentra-tion and isotopic enrichment. J. Lipid Res. 40, 2118–2124
24. Bohlin, K., Patterson, B. W., Spence, K. L., Merchak, A., Zozobrado, J. C.,Zimmermann, L. J., Carnielli, V. P., and Hamvas, A. (2005) Metabolickinetics of pulmonary surfactant in newborn infants using endogenousstable isotope techniques. J. Lipid Res. 46, 1257–1265
25. Chinkes, D. L., Aarsland, A., Rosenblatt, J., and Wolfe, R. R. (1996) Com-parison of mass isotopomer dilution methods used to compute VLDLproduction in vivo. Am. J. Physiol. Endocrinol. Metab. 271, E373–E383
26. Bligh, E. G., and Dyer,W. J. (1959) A rapidmethod of total lipid extractionand purification. Can. J. Biochem. Physiol. 37, 911–917
27. Hsu, F. F., Bohrer, A., and Turk, J. (1998) Formation of lithiated adducts ofglycerophosphocholine lipids facilitates their identification by electros-pray ionization tandemmass spectrometry. J. Am. Soc. Mass Spectrom. 9,516–526
28. Hsu, F. F., and Turk, J. (1999) Structural characterization of triacylglycer-ols as lithiated adducts by electrospray ionization mass spectrometry us-ing low-energy collisionally activated dissociation on a triple stage qua-drupole instrument. J. Am. Soc. Mass Spectrom. 10, 587–599
29. Hsu, F. F., and Turk, J. (2000) Characterization of phosphatidylinositol,phosphatidylinositol-4-phosphate, and phosphatidylinositol-4,5-bisphos-phate by electrospray ionization tandemmass spectrometry: a mechanis-tic study. J. Am. Soc. Mass Spectrom. 11, 986–999
30. Sieber, M. H., and Thummel, C. S. (2009) The DHR96 nuclear receptorcontrols triacylglycerol homeostasis in Drosophila. Cell Metab. 10,481–490
31. Chakravarthy, M. V., Pan, Z., Zhu, Y., Tordjman, K., Schneider, J. G.,Coleman, T., Turk, J., and Semenkovich, C. F. (2005) “New” hepatic fatactivates PPAR� to maintain glucose, lipid, and cholesterol homeostasis.Cell Metab. 1, 309–322
32. Haynes, B. C., Skowyra,M. L., Spencer, S. J., Gish, S. R.,Williams,M.,Held,E. P., Brent, M. R., and Doering, T. L. (2011) Toward an integrated modelof capsule regulation in Cryptococcus neoformans. PLoS Pathog. 7,e1002411
33. Trapnell, C., Pachter, L., and Salzberg, S. L. (2009) TopHat: discoveringsplice junctions with RNA-Seq. Bioinformatics 25, 1105–1111
34. Trapnell, C., Williams, B. A., Pertea, G., Mortazavi, A., Kwan, G., vanBaren, M. J., Salzberg, S. L., Wold, B. J., and Pachter, L. (2010) Transcriptassembly and quantification by RNA-Seq reveals unannotated transcriptsand isoform switching during cell differentiation. Nat. Biotechnol. 28,511–515
35. Neuschwander-Tetri, B. A. (2010) Nontriglyceride hepatic lipotoxicity:the newparadigm for the pathogenesis ofNASH.Curr.Gastroenterol. Rep.12, 49–56
36. Sørensen, T. I., Virtue, S., and Vidal-Puig, A. (2010) Obesity as a clinicaland public health problem: is there a need for a new definition based onlipotoxicity effects? Biochim. Biophys. Acta 1801, 400–404
37. Hammad, L. A., Cooper, B. S., Fisher, N. P., Montooth, K. L., and Karty,J. A. (2011) Profiling and quantification ofDrosophila melanogaster lipidsusing liquid chromatography/mass spectrometry. Rapid Commun. MassSpectrom. 25, 2959–2968
38. Magkos, F., Yannakoulia, M., Chan, J. L., and Mantzoros, C. S. (2009)Management of the metabolic syndrome and type 2 diabetes throughlifestyle modification. Annu. Rev. Nutr. 29, 223–256
39. Niswender, K. (2010) Diabetes and obesity: therapeutic targeting and riskreduction—a complex interplay. Diabetes Obes. Metab. 12, 267–287
40. Postic, C., Dentin, R., Denechaud, P. D., and Girard, J. (2007) ChREBP, atranscriptional regulator of glucose and lipid metabolism. Annu. Rev.Nutr. 27, 179–192
41. Sampath, H., and Ntambi, J. M. (2011) The role of stearoyl-CoA desatu-rase in obesity, insulin resistance, and inflammation. Ann. N.Y. Acad. Sci.1243, 47–53
42. Iizuka, K., Bruick, R. K., Liang, G., Horton, J. D., and Uyeda, K. (2004)Deficiency of carbohydrate response element-binding protein (ChREBP)reduces lipogenesis as well as glycolysis. Proc. Natl. Acad. Sci. U.S.A. 101,7281–7286
43. Ashrafi, K., Chang, F. Y.,Watts, J. L., Fraser, A. G., Kamath, R. S., Ahringer,J., and Ruvkun, G. (2003) Genome-wide RNAi analysis of Caenorhabditiselegans fat regulatory genes. Nature 421, 268–272
44. Coleman, D. L., and Eicher, E. M. (1990) Fat (fat) and tubby (tub): twoautosomal recessive mutations causing obesity syndromes in the mouse.J. Hered. 81, 424–427
45. Shiri-Sverdlov, R., Custers, A., vanVliet-Ostaptchouk, J. V., vanGorp, P. J.,Lindsey, P. J., van Tilburg, J. H., Zhernakova, S., Feskens, E. J., van der A,D. L., Dollé,M. E., vanHaeften, T.W., Koeleman, B. P., Hofker,M. H., andWijmenga, C. (2006) Identification of TUB as a novel candidate geneinfluencing body weight in humans. Diabetes 55, 385–389
46. van Vliet-Ostaptchouk, J. V., Onland-Moret, N. C., Shiri-Sverdlov, R., vanGorp, P. J., Custers, A., Peeters, P. H., Wijmenga, C., Hofker, M. H., andvan der Schouw, Y. T. (2008) Polymorphisms of the TUB gene are associ-ated with body composition and eating behavior in middle-aged women.PLoS One 3, e1405
47. Wang, Y., Seburn, K., Bechtel, L., Lee, B. Y., Szatkiewicz, J. P., Nishina,P. M., and Naggert, J. K. (2006) Defective carbohydrate metabolism inmice homozygous for the tubbymutation. Physiol. Genomics 27, 131–140
48. Beissbarth, T., and Speed, T. P. (2004) GOstat: find statistically overrep-resented Gene Ontologies within a group of genes. Bioinformatics 20,1464–1465
49. Fay, J. R., Steele, V., and Crowell, J. A. (2009) Energy homeostasis andcancer prevention: the AMP-activated protein kinase.Cancer Prev. Res. 2,301–309
50. Knight, J. A. (2011) Diseases and disorders associated with excess bodyweight. Ann. Clin. Lab. Sci. 41, 107–121
51. Kritchevsky, D. (1995) The effect of over- and undernutrition on cancer.Eur. J. Cancer Prev. 4, 445–451
52. Lim, J. S., Mietus-Snyder, M., Valente, A., Schwarz, J. M., and Lustig, R. H.(2010) The role of fructose in the pathogenesis of NAFLD and the meta-bolic syndrome. Nat. Rev. Gastroenterol. Hepatol. 7, 251–264
The Fat Body Controls Metabolic Homeostasis
MARCH 22, 2013 • VOLUME 288 • NUMBER 12 JOURNAL OF BIOLOGICAL CHEMISTRY 8041
by guest on May 3, 2019
http://ww
w.jbc.org/
Dow
nloaded from

53. Mensink, R. P., Plat, J., and Schrauwen, P. (2008) Diet and nonalcoholicfatty liver disease. Curr. Opin. Lipidol. 19, 25–29
54. Reaven, G., Abbasi, F., and McLaughlin, T. (2004) Obesity, insulin resist-ance, and cardiovascular disease. Recent Prog. Horm. Res. 59, 207–223
55. Gutierrez, E.,Wiggins, D., Fielding, B., andGould, A. P. (2007) Specializedhepatocyte-like cells regulate Drosophila lipid metabolism. Nature 445,275–280
56. Baker, K. D., and Thummel, C. S. (2007) Diabetic larvae and obese flies-emerging studies of metabolism in Drosophila. Cell Metab. 6, 257–266
57. Tan, C. Y., and Vidal-Puig, A. (2008) Adipose tissue expandability: themetabolic problems of obesity may arise from the inability to becomemore obese. Biochem. Soc. Trans. 36, 935–940
58. Unger, R. H., and Scherer, P. E. (2010) Gluttony, sloth and the metabolicsyndrome: a roadmap to lipotoxicity. Trends Endocrinol. Metab. 21,345–352
59. Gavrilova, O., Marcus-Samuels, B., Graham, D., Kim, J. K., Shulman, G. I.,Castle, A. L., Vinson, C., Eckhaus, M., and Reitman, M. L. (2000) Surgicalimplantation of adipose tissue reverses diabetes in lipoatrophic mice.J. Clin. Investig. 105, 271–278
60. Kim, J. Y., van de Wall, E., Laplante, M., Azzara, A., Trujillo, M. E., Hof-mann, S. M., Schraw, T., Durand, J. L., Li, H., Li, G., Jelicks, L. A., Mehler,M. F., Hui, D. Y., Deshaies, Y., Shulman, G. I., Schwartz, G. J., and Scherer,P. E. (2007) Obesity-associated improvements in metabolic profilethrough expansion of adipose tissue. J. Clin. Investig. 117, 2621–2637
61. Aitman, T. J., Glazier, A. M., Wallace, C. A., Cooper, L. D., Norsworthy,P. J., Wahid, F. N., Al-Majali, K. M., Trembling, P. M., Mann, C. J., Shoul-ders, C. C., Graf, D., St Lezin, E., Kurtz, T. W., Kren, V., Pravenec, M.,Ibrahimi, A., Abumrad, N. A., Stanton, L. W., and Scott, J. (1999) Identi-fication of Cd36 (Fat) as an insulin-resistance gene causing defective fattyacid and glucose metabolism in hypertensive rats. Nat. Genet. 21, 76–83
62. Kim, J. K., Gavrilova, O., Chen, Y., Reitman, M. L., and Shulman, G. I.(2000) Mechanism of insulin resistance in A-ZIP/F-1 fatless mice. J. Biol.Chem. 275, 8456–8460
63. DeFronzo, R. A. (2004) Dysfunctional fat cells, lipotoxicity and type 2diabetes. Int. J. Clin. Pract. Suppl. 143, 9–21
64. Sjöström, L., Lindroos, A. K., Peltonen, M., Torgerson, J., Bouchard, C.,Carlsson, B., Dahlgren, S., Larsson, B., Narbro, K., Sjöström, C. D., Sulli-van, M., and Wedel, H.; Swedish Obese Subjects Study Scientific Group(2004) Lifestyle, diabetes, and cardiovascular risk factors 10 years afterbariatric surgery. N. Engl. J. Med. 351, 2683–2693
65. Klein, S., Fontana, L., Young, V. L., Coggan,A. R., Kilo, C., Patterson, B.W.,andMohammed, B. S. (2004)Absence of an effect of liposuction on insulinaction and risk factors for coronary heart disease. N. Engl. J. Med. 350,2549–2557
66. Mayerson, A. B., Hundal, R. S., Dufour, S., Lebon, V., Befroy, D., Cline,G. W., Enocksson, S., Inzucchi, S. E., Shulman, G. I., and Petersen, K. F.(2002) The effects of rosiglitazone on insulin sensitivity, lipolysis, andhepatic and skeletal muscle triglyceride content in patients with type 2diabetes. Diabetes 51, 797–802
67. van Herpen, N. A., and Schrauwen-Hinderling, V. B. (2008) Lipid accu-mulation in non-adipose tissue and lipotoxicity. Physiol. Behav. 94,231–241
68. Rhee, E. P., Cheng, S., Larson,M.G.,Walford, G. A., Lewis, G.D.,McCabe,E., Yang, E., Farrell, L., Fox, C. S., O’Donnell, C. J., Carr, S. A., Vasan, R. S.,Florez, J. C., Clish, C. B., Wang, T. J., and Gerszten, R. E. (2011) Lipidprofiling identifies a triacylglycerol signature of insulin resistance and im-proves diabetes prediction in humans. J. Clin. Investig. 121, 1402–1411
69. Matsuzaka, T., Shimano, H., Yahagi, N., Kato, T., Atsumi, A., Yamamoto,T., Inoue, N., Ishikawa, M., Okada, S., Ishigaki, N., Iwasaki, H., Iwasaki, Y.,Karasawa, T., Kumadaki, S., Matsui, T., Sekiya, M., Ohashi, K., Hasty,A. H., Nakagawa, Y., Takahashi, A., Suzuki, H., Yatoh, S., Sone, H., Toyo-shima, H., Osuga, J., and Yamada, N. (2007) Crucial role of a long-chainfatty acid elongase, Elovl6, in obesity-induced insulin resistance.Nat.Med.13, 1193–1202
70. Coll, T., Eyre, E., Rodríguez-Calvo, R., Palomer, X., Sánchez, R.M.,Merlos,M., Laguna, J. C., and Vázquez-Carrera, M. (2008) Oleate reverses palmi-tate-induced insulin resistance and inflammation in skeletal muscle cells.J. Biol. Chem. 283, 11107–11116
71. Miyazaki, M., Flowers, M. T., Sampath, H., Chu, K., Otzelberger, C., Liu,X., and Ntambi, J. M. (2007) Hepatic stearoyl-CoA desaturase-1 defi-ciency protects mice from carbohydrate-induced adiposity and hepaticsteatosis. Cell Metab. 6, 484–496
72. Wang, Y., Botolin, D., Xu, J., Christian, B., Mitchell, E., Jayaprakasam, B.,Nair, M. G., Peters, J. M., Busik, J. V., Olson, L. K., and Jump, D. B. (2006)Regulation of hepatic fatty acid elongase and desaturase expression indiabetes and obesity. J. Lipid Res. 47, 2028–2041
73. Na, J., Musselman, L. P., Pendse, J., Baranski, T. J., Bodmer, R., Ocorr, K.,and Cagan, R. (2013) A Drosophilamodel of high sugar diet-induced car-diomyopathy. PLoS Genet. 9, e1003175
The Fat Body Controls Metabolic Homeostasis
8042 JOURNAL OF BIOLOGICAL CHEMISTRY VOLUME 288 • NUMBER 12 • MARCH 22, 2013
by guest on May 3, 2019
http://ww
w.jbc.org/
Dow
nloaded from

Thomas J. BaranskiPatterson, Adewole L. Okunade, Ezekiel Maier, Michael R. Brent, John Turk and
Laura Palanker Musselman, Jill L. Fink, Prasanna Venkatesh Ramachandran, Bruce W.Drosophilain
Role of Fat Body Lipogenesis in Protection against the Effects of Caloric Overload
doi: 10.1074/jbc.M112.371047 originally published online January 25, 20132013, 288:8028-8042.J. Biol. Chem.
10.1074/jbc.M112.371047Access the most updated version of this article at doi:
Alerts:
When a correction for this article is posted•
When this article is cited•
to choose from all of JBC's e-mail alertsClick here
Supplemental material:
http://www.jbc.org/content/suppl/2013/01/25/M112.371047.DC1
http://www.jbc.org/content/288/12/8028.full.html#ref-list-1
This article cites 73 references, 16 of which can be accessed free at
by guest on May 3, 2019
http://ww
w.jbc.org/
Dow
nloaded from