rollover risk and the maturity transformation function … · rollover risk and the maturity...
TRANSCRIPT

Working Paper/Document de travail 2014-8
Rollover Risk and the Maturity Transformation Function of Banks
by Teodora Paligorova and João A. C. Santos

2
Bank of Canada Working Paper 2014-8
March 2014
Rollover Risk and the Maturity Transformation Function
of Banks
by
Teodora Paligorova1 and João A. C. Santos2
1Financial Markets Department Bank of Canada
Ottawa, Ontario, Canada K1A 0G9 [email protected]
2Federal Reserve Bank of New York
and Nova School of Business and Economics
Bank of Canada working papers are theoretical or empirical works-in-progress on subjects in economics and finance. The views expressed in this paper are those of the authors.
No responsibility for them should be attributed to the Bank of Canada, the Federal Reserve Bank of New York or the Federal Reserve System.
ISSN 1701-9397 © 2014 Bank of Canada

ii
Acknowledgements
We are grateful to Anat Admati, Charles Gaa, Scott Hendry, Jorge Cruz Lopez, Randall Morck and Francisco Trebbi for helpful comments, as well as participants at the 2013 TAU Finance Conference. We thank Vitaly Bord and Phoebe White for outstanding research assistance.
iii
Abstract
This paper shows that banks that rely heavily on short-term funding engage less in maturity transformation in an attempt to decrease their exposure to rollover risk. These banks shorten both the maturity of their portfolio of loans as well as the maturity of newly issued loans. We find that the loan yield curve becomes steeper with banks’ increasing use of short-term funding. The loan maturity shortening is driven by banks and affects borrowers’ financing choices—they turn to the bond market for long-term funding. To the extent that borrowers do not manage to compensate for the undesirable shortening of loan maturities by going to the bond market, they may become more exposed to rollover risk due to banks. This potential synchronization of banks’ and borrowers’ rollover risk can be a source of financial instability once short-term funding suddenly disappears.
JEL classification: G21 Bank classification: Financial stability
Résumé
Les auteurs montrent qu’en cherchant à limiter leur exposition au risque de refinancement, les banques qui recourent massivement au financement à court terme assurent moins leur fonction de transformation des échéances. Ces banques raccourcissent non seulement la durée de leur portefeuille de prêts, mais aussi celle des prêts nouvellement accordés. Les auteurs constatent que la pente de la courbe des taux des crédits est d’autant plus prononcée que le recours au financement à court terme est important. Par ailleurs, la réduction de la durée des prêts est entièrement le fait des banques et restreint le choix des modalités de financement des emprunteurs, qui se tournent vers les marchés obligataires pour satisfaire leurs besoins de financement à long terme. Dans la mesure où les emprunteurs ne réussiraient pas à compenser les inconvénients liés à la diminution de la durée des prêts bancaires en empruntant sur le marché obligataire, ils pourraient voir augmenter leur exposition au risque de refinancement à cause des banques. La possibilité que le risque de refinancement des banques se matérialise en même temps temps que celui auquel les emprunteurs sont exposés constituerait une source d’instabilité financière en cas de tarissement subit du financement à court terme.
Classification JEL : G21 Classification de la Banque : Stabilité financière
Non-Technical Summary
Financial economists have made significant progress in understanding firms’ debt maturity
choices. One popular view supported by ample empirical evidence is that firms’ private in-
formation about their own credit risk is an important determinant of debt maturity. Firms
balance two opposing factors—short-term debt makes borrowing costs more sensitive to pub-
lic information but also allows firms to borrow at an opportune time. However, much less is
known about the role of the financial conditions of suppliers in debt maturity.
The goal of this paper is to examine how banks’ reliance on short-term wholesale
funding (e.g., repurchase agreements, commercial paper, interbank loans) affects the maturity
of loans issued to non-financial corporations. With the start of the 2007-2009 financial crisis
when short-term funding disappeared quickly, it has been better understood that this is a
highly unstable source of funding, which can have important financial stability implications.
We document that those banks that rely more on short-term wholesale funding tend
to shorten the maturity of their loans. After ruling out various competing explanations—for
example, banks tend to shorten the maturity of loans in order to monitor borrowers more
effectively by making them revisit the banks more often—we argue that banks that rely more
on short-term funding and hence are exposed to rollover risk decrease the gap between the
maturity of their assets and liabilities, namely by shortening the maturity of loans, in order
to mitigate the costs associated with the realization of this risk. Importantly, because this
outcome is driven by banks and is to some extent undesirable to borrowers, our analysis shows
that borrowers turn to the bond market in order to compensate for the shortening of the loan
maturities.
One policy implication is that banks’ short-term funding unintendedly affects the avail-
ability and cost of long-term credit by making borrowers more dependent on the bond market.
To the extent that borrowers do not manage to compensate for the ‘undesirable’ shortening of
loans by going to the bond market, they may end up with greater exposure to rollover risk due
to banks. This potential synchronization of banks’ and borrowers’ rollover risk may become a
source of financial instability once short-term funding suddenly disappears.

1 Introduction
When banks rely on insured demandable deposits, they are able to perform maturity trans-
formation without exposing themselves to rollover risk. Over the past several years, banks
have branched out into non-deposit (uninsured) funding such as short-term wholesale funding,
which has given them the opportunity to meet their funding needs at lower costs, but it has
also exposed them to rollover risk. In this paper, we investigate whether banks take into ac-
count the rollover risk arising from reliance on short-term wholesale funding by shortening the
maturity of their loans. Ascertaining the answer to this question is important: ‘self-insurance’
through shortening of loan maturities in order to decrease the maturity gap between assets and
liabilities can reduce banks’ exposure to rollover risk, but it can also hinder banks’ maturity
transformation function, with potential negative implications for the availability and cost of
long-term bank loans.
Any attempt to identify a potential link between the maturity of banks’ funding sources
and the maturity of their lending business, referred to as the bank funding hypothesis, has to
consider other explanations for the maturity of loans. For example, banks that rely on short-
term funding and thus are exposed to monitoring by creditors may shorten the maturity of the
loans in order to strengthen the monitoring of their own borrowers (monitoring hypothesis).1
Banks may also adjust their loan maturity policies in response to a change in borrowers’
funding preferences (bond financing hypothesis). For example, firms plagued with moral hazard
problems can access the bond market if they are able to first take out a loan that elicits bank
monitoring (Holmstrom and Tirole (1997)).2 Accordingly, if firms opt to use bond financing,
they may first take out a short-term bank loan in order to capitalize on bank monitoring and
access the bond market on better terms, thereby explaining the decline in the maturity of bank
loans.3
1There are several ways banks can increase their ability to monitor borrowers, including holding a seniorclaim (Berglof and Thadden (1994)), demanding collateral (Rajan and Winton (1995)), adding covenants to theloan agreement (Gorton and Kahn (2000)), and shortening the maturity of the loan (Diamond (1993)).
2Datta et al. (1998) show that firms that have outstanding bank loans at the time of their bond issues areable to raise bond financing on better terms.
3Similarly, if it becomes less expensive to access the bond market, as Gande et al. (1999) argue occurred
2
In our investigation of the maturity of corporate loans over the past two decades,
we consider these and other potential explanations for loan maturities, including borrowers’
incentives to synchronize the maturities of their assets and debt obligations. Our findings
provide strong evidence in support of the bank funding hypothesis: to decrease exposure to
rollover risk, banks shorten the maturity of loans in response to their increased reliance on
short-term funding. We find that banks’ increasing use of repo funding and wholesale funding,
our two proxies for short-term funding, leads to both a reduction in the average loan maturity
and a reduction in the effective maturity of banks’ portfolio of loans, defined as the average
time to maturity of new and existing loans in the banks’ portfolio of loans.
We also find that the shortening of loan maturities by banks that rely extensively
on short-term funding is prevalent among term loans and does not affect credit lines. This
finding supports the bank funding hypothesis and it is contrary to the monitoring hypothesis.
Only the shortening of term loan maturities is effective in reducing liquidity risk arising from
banks’ increased use of short-term funding. In the case of credit lines, however, banks only
provide a commitment to extend future funding; the shortening of maturities would not provide
protection against liquidity risk and would be costly to banks.4 This finding is also contrary
to the monitoring hypothesis, in which we would expect a decline in the maturities of both
term loans and credit lines, since they can force the borrower to renew their contracts more
often. We obtain additional results that do not support the monitoring hypothesis. For
instance, borrowers that need monitoring the most do not experience the strongest decline in
loan maturities compared to borrowers that need less monitoring.5
following the gradual repeal of the Glass-Steagall Act that started in the late 1980s, borrowers may opt tosubstitute bank debt with bond financing. Since bond financing is predominantly long-term, this substitutionwould lead to a relative decline in both the amount of long-term bank loans and the maturity of outstandingbank debt.
4Bord and Santos (2014) show that banks charge higher undrawn fees when they extend credit lines withlonger maturities. The undrawn fee, which includes both a commitment fee and an annual fee, is the price theborrower pays the credit line provider for the liquidity risk it incurs by guaranteeing the borrower access tofunding at its discretion over the life of the credit line and up to the total commitment amount.
5To affirm that demand in short-term loans is not driving the use of wholesale funding, in section 5 weconduct several tests. We are aware that banks’ increasing use of short-term funding could be the result ofvarious factors, including their incentive to capitalize on favorable repo markets, the outcome of a maturity racea la Brunnermeier and Oehmke (2013), or a ratchet effect as in Admati et al. (2013).
3

In addition, we find that the loan yield curve becomes steeper, whereby short-term
loans originated by banks that rely more on wholesale funding become relatively cheaper than
those originated by banks that rely less on wholesale funding. This finding adds support to
the bank funding hypothesis and it runs counter to the bond financing hypothesis. According
to the bank funding hypothesis, the shortening of loan maturities should go together with a
relative decrease in the cost of short-term loans in banks that rely extensively on short-term
funding and aim to make these loans more appealing to borrowers. In contrast, according
to the bond financing hypothesis, if borrowers’ preferences for bond financing increase and if
they choose to (strategically) take short-term loans prior to bond issuance to capitalize on
bank monitoring, then the increased demand for short-term loans should be accompanied by
an increase in loan rates.6
We find other results that put into question our conjecture that high demand for bonds
explains the decline in the maturity of bank loans. For instance, we find that firms that first
take out shorter loans are more likely to issue bonds shortly after the origination of bank loans,
and not vice versa. In addition, we find that bonds issued shortly after bank loans by high
wholesale funding banks are of relatively longer maturity than comparable bonds issued by
low wholesale banks, consistent with firms’ attempts to compensate for shortening of debt.
Our findings have several important implications. They indicate that banks opt to
manage the liquidity risk arising from their reliance on short-term wholesale funding by short-
ening the maturity of their assets, in particular their corporate loans, having implications for
the cost of bank lending. Specifically, we observe that the cost of long-term loans increases as
banks rely more on short-term funding. Our results also help to explain the downward trend
in the average maturity of outstanding bank loans over the past two decades, documented by
Mian and Santos (2011).7 Our findings also provide evidence of a new source of refinancing
risk for corporations and, more generally, a new source of financial fragility. By forcing bor-
6If borrowers’ appetite for more bond financing derives from a decline in the cost of access to the bondmarket, to the extent that bank loans and bond financing are substitutes, this would lead firms to substitutelong-term bank loans with bond financing, as in the bank funding hypothesis. However, if the bank fundinghypothesis is at play, the relative cost of short-term loans will be smaller and hence the cost of bank and bondlong-term debt higher. See section 5.2 for details.
7While average maturity is close to four years in 1988, it declines to just over two-and-a-half-years in 2010.
4
rowers to come back to banks more often through shorter loans, banks can potentially monitor
borrowers better while at the same time exposing borrowers to refinancing risk. By relying
on short-term wholesale funding and thus exposing themselves to refinancing risk, banks that
lend short-term loans could automatically expose their borrowers to higher refinancing risk.
The combination of banks’ refinancing risk with borrowers’ refinancing risk has the potential
to be mutually reinforcing and contribute to a financial crisis. Lastly, our findings suggest
that regulatory initiatives aiming to align the maturity of bank assets more closely with the
maturity of liabilities, in order to reduce banks’ exposure to liquidity risk, may have an adverse
effect by virtue of banks’ decision to move away from the long-term lending business.8
Our paper is most closely related to the literature on corporate debt maturity. This
literature, including Barclay and Smith (1995), Stohs and Mauer (1996), Guedes and Opler
(1996), Johnson (2003), Berger et al. (2005), and Custodio et al. (2013), primarily focuses on
the cross-sectional relationships between firm characteristics and a firm’s choice of corporate
debt maturity, and pays little attention to the firm’s choice of maturity on each debt issue or
the role that credit suppliers play in firms’ debt maturity. Custodio et al. (2013) study the
maturity of new bond issues and syndicated loans, but they too do not consider the role of
banks in the maturity of firms’ loan choices, a key aspect of our investigation.
In this regard, our paper is related to a recent literature that has identified a set of bank-
specific factors that affect their loan policies. This literature has linked the spreads and the size
of the loan to various bank-specific drivers, including capital standards (Hubbard et al. (2002)
and Santos and Winton (2011)), lending standards (Paligorova and Santos (2012)), bank losses
(Santos (2011)), liquidity shocks (Ivashina and Scharfstein (2010)), and banks’ use of bond
financing (Hale and Santos (2010)). In contrast, we investigate the effect of banks’ increasing
use of short-term wholesale funding on the maturity of loans.
The remainder of our paper is organized as follows. We discuss the data, empirical
8The Basel Committee has proposed the implementation of a net stable funding ratio (NSFR) that requires aminimum amount of funding, expected to be stable over a one-year time horizon, based on liquidity risk factorsassigned to assets and off-balance-sheet liquidity exposures. In particular, the NSFR limits overreliance onshort-term wholesale funding, encourages better assessment of funding risk across all on- and off-balance-sheetitems, and promotes funding stability.
5
strategy and sample characteristics in section 2. In section 3, we report results of the effect
of wholesale funding on loan maturity. In section 4, we investigate the bank monitoring
hypothesis. In section 5, we consider the hypothesis that the decline in loan maturity is the
result of a change in borrowers’ preferences for bond financing. Section 6 concludes the paper.
2 Data, methodology and sample characterization
2.1 Data
The data for this project come from several sources, including the Federal Reserve Board
and the Office of the Comptroller of the Currency; the Loan Pricing Corporation’s Dealscan
database (LPC); Compustat; the Center for Research on Securities Prices (CRSP); Merrill
Lynch’s bond yield indices; the Federal Reserve’s Bank Call Reports; and the Fixed Investment
Securities Database (FISD).
LPC is dominated by syndicated loans, and contains information on individual loans,
including its purpose and type; information about the borrower, including its sector of activity
and its legal status (private or public firm); and finally, information on the lending syndicate,
including the identity and role of the banks in the syndicate.
We use Compustat to obtain information on borrowers’ balance sheets. Even though
LPC contains loans from both privately held and publicly listed firms, given that Compustat
is dominated by publicly held firms, we have to exclude loans to privately held firms from our
sample.
We rely on the CRSP database to link companies and subsidiaries that are part of the
same firm, and to link companies over time that went through mergers, acquisitions or name
changes.9 We then use these links to merge the LPC and Compustat databases to determine
the financial condition of the firm at the time it borrowed from banks. We also use CRSP to
gather data on firms’ stock prices.
We use Merrill Lynch’s yield indices on new long-term industrial bonds to control for
changes in the risk premium in credit markets. We consider the indices on yields of triple-
9We adopted a conservative criterion and dropped companies that could not be reasonably linked.
6

A and triple-B rated bonds because these go further back in time than the indices on the
investment-grade and below-grade bonds.
We rely on the Reports of Condition and Income compiled by the Federal Deposit
Insurance Corporation, the Comptroller of the Currency, and the Federal Reserve System
to obtain bank data, including the portion of funding raised in wholesale markets, capital-to-
asset ratio, size, profitability and risk, for the lead bank(s) in each lending syndicate. Wherever
possible, we get these data at the bank holding company level using Y9C reports. When these
reports are not available, we rely on Call Reports, which have data at the bank level.
Finally, we use information on firms’ bond issuance from the FISD to investigate
whether firms react to the shortening of loan maturity by issuing more often in the bond
market. We also use this data source to investigate whether firms attempt to compensate for
the shortening of bank debt by issuing bonds of longer maturity.
2.2 Methodology
Our methodology has three parts. Part one investigates whether banks adjust the maturity of
their corporate loans in response to the increased use of short-term funding. Part two explores
whether the decline in loan maturity could be the result of other hypotheses, including a change
in banks’ monitoring preferences or in borrowers’ funding preferences. Part three investigates
firms’ bond financing in an attempt to find whether banks’ shortening of lending has any effect
on firms’ financial policies. We describe next the tests we conduct in the three parts of our
methodology.
2.2.1 Bank funding hypothesis
Banks can convert short-term deposits into long-term loans without being exposed to creditors’
withdrawal of funds because of deposit insurance. However, when banks rely on uninsured
short-term funding, such as wholesale funding, they may not be able to originate long-term
loans, because they may self-insure against liquidity risk by matching short maturities of
financing and loans. In a theoretical model, Winton (2003) shows that institutions faced with
liquidity needs will first use their most liquid assets as a source of financing.
7
Banks’ short-term funding and loan maturity
We consider three tests of the bank funding hypothesis. To determine whether there is a
link between banks’ use of short-term funding and loan maturity, our first test builds on the
following regression model:
LMATURITYl,f,b,t = αWHOLESALEl,f,b,t−1
+ βXb,t−1 + γYf,t−1 + λZl,t + ζMt + FEb + TimeEffects+ ϵl,f,b,t.
(1)
LMATURITYl,f,b,t is the natural log of the maturity of loan l that bank b extends to firm f
during quarter t. We measure WHOLESALE as the ratio of the sum of federal funds pur-
chased and securities sold under repurchase agreements, commercial paper, brokered deposits,
and other borrowed money to total assets.10 We also consider the ratio of the federal funds
purchased and securities sold under agreements to repurchase to total assets (REPO FF ) as
an alternative proxy for the maturity of banks’ liabilities. This proxy will likely capture the
part of the wholesale funding with the shortest maturity.11 WHOLESALEb,t−1 is our key
variable of interest. Based on model (1), the coefficient α tells us whether banks shorten the
maturity of loans when they increase their use of wholesale funding. We also control for the
sets of bank-, borrower- and loan-specific factors, Xb,t−1, Yf,t−1 and Zl,t−1, respectively, which
are discussed next.
Our set of bank controls includes L ASSETS BK, the log of bank’s total assets, to
control for bank size, and CAPITAL BK, the ratio of the bank’s equity to total assets, to
account for the bank’s capital ratio. It also includes LIQUIDITY BK, the bank’s holdings of
cash and marketable securities as a fraction of total assets, to control for liquidity. Lastly, our
set of bank controls includes CHARGE − OFFS BK and ROA BK, the bank’s charge-offs
and return on assets, respectively, to control for the bank’s performance.
10 We use information from Schedule HC FR Y-9C. Detailed definitions are available athttp://www.federalreserve.gov/reportforms/forms/FR_Y-9C20110630_i.pdf.
11 Due to the lack of data, we cannot use separately the federal funds purchased and the securities sold underagreements to repurchase throughout the entire sample period. See section 3.5 for more details.
8
We complement this set of bank controls with a set of borrower-specific controls. Since
banks, in general, are less willing to extend long-term loans to riskier firms, our firm-specific
controls attempt to capture different aspects of firm risk. To that end, we control for the
borrower’s leverage, LEV ERAGE, profit margin, PROFMARGIN, and size as captured by
the log of its sales in hundreds of millions of dollars, L SALES. Larger firms are typically
better established and better diversified across customers, suppliers and regions. Similarly,
firms with a higher profit margin have a higher cushion to service their debt and are less
risky as well. Firms with high leverage, on the other hand, have a higher risk of default. As
leverage increases, so does liquidity risk, hence firms with high leverage are expected to use
more long-term debt, all else equal.
We also control for the firm’s tangibles, TANGIBLES, and for its growth opportunities
as measured by its market-to-book ratio, MKTOBOOK, since firms with fewer tangible assets
and those with more growth opportunities are more likely to have incentives (opportunities)
to take on more risk. Firms with high growth opportunities may use short-term debt to limit
agency issues related to an underinvestment problem. DEBT MATUR is the ratio of non-bank
long-term debt to total debt, included to control for the maturity effect of other financing
sources. Lastly, we include dummy variables to control for the firm’s sector of activity as
determined by the single-digit SIC industry groups. A given industry may face additional risk
factors that are not captured by firm controls, so the dummy variable allows us to capture
such risk at a very broad level.
We further include a set of loan-specific controls. This set includes L AMOUNT, the
log of the loan amount to control for the size of the loan, and dummy variables to account
for the purpose of the loan. To that end, we distinguish loans taken out for working capi-
tal purposes, WORK CAPITAL, for mergers and acquisitions, M&A, for recapitalizations,
RECAPITALIZATION, for corporate purposes, CORP PURPOSES, and to back up a
commercial paper program, CPBKUP. We control for the share of the loan retained by the
lead arranger, BKSHARE, since this drives the bank’s monitoring incentives.12 Lastly, our
12It is a challenge to control for the effect of the retained share of the lead bank, since this variable is missingfor a large percentage of the loans in Dealscan. To alleviate this problem, we complement the information on
9
set of loan-specific controls includes the dummy variable, TERM LOAN . This distinction is
important because in the case of term loans the bank provides the borrower with funds for the
duration of the loan, while in the case of credit lines it offers only a commitment to lend to
the borrower. As we will discuss below, we will build on this distinction to isolate the role of
banks’ funding choices on their loan maturity policies from other alternative explanations.
To account for general effects of the economic environment, we add macro controls and
time effects to these three sets of controls. Mt account for macroeconomic factors that may
also play a role in loan maturities. We include the slope of the yield curve (SLOPE YC) and
the bond spread (SPREAD), which is the difference between Moody’s indices on the yields of
triple-A and triple-B rated bonds. We expect that a more restrictive economic environment
(steeper yield curve and lower SPREAD) will decrease the maturity of loans, all else equal. We
cluster the errors at the bank level. To account for time effects, we include the year and quarter
fixed effects. To reduce concerns that our results are driven by time-invariant heterogeneity at
the bank level, we estimate all our loan maturity models with bank fixed effects (FEb).13
Do banks synchronize the maturities of their assets and liabilities?
The previous tests focus on maturity at the loan level. If banks aim at reducing the liquidity
risk arising from the shortening of their liabilities, one could arguably claim that their goal
should be to reduce the maturity of their portfolio of loans. Therefore, a loan reduction is
expected not only for new loans but also for maturity extensions at the bank level.
To investigate this hypothesis, we begin by computing the number of years left up to
the lead bank’s share in Dealscan with information from another proprietary data source on syndicated loans(the Shared National Credit program). This procedure reduces the number of observations for which we do nothave data on the lead banks’ retained share, but it does not eliminate the problem entirely. To deal with themissing data, we apply the so-called “dummy variable adjustment” approach: we plug in an arbitrary value forthe cases of missing retained shares and then include in the regression a dummy variable coded one if data in theoriginal variable were missing, and zero otherwise, and the interaction term between the dummy variable andthe modified variable. We are aware that this technique may bias the estimates of the coefficients of retainedshares. We also apply alternative methods of filling in for missing observations, such as the subgroup meanshare by bank quarter, and obtain similar estimates. Moreover, retained share and the method of refilling thedata do not seem to affect our main estimates of interest, which are the estimates of wholesale funding on loanmaturity.
13In a robustness check, we include separately bank-year and year-quarter fixed effects, to account for time-invariant heterogeneity for each bank within a given year. The results in our regression analysis remain un-changed.
10
loan maturity, which gives us the “effective maturity” of the loan at time t. Next, we average
these values for all loans in the banks’ books to determine the average effective maturity of the
bank’s portfolio of loans as of time t. Using this information we then estimate the following
model of the maturity of the bank’s portfolio of loans:
LMATURITY LEFTb,t = αWHOLESALEyb,t−1 + βXyb,t−1 + ζMyt + FEb+
TimeEffects+ ϵb,t. (2)
LMATURITY LEFTb,t is the natural log of the average effective maturity in the bank’s port-
folio of loans computed at the end of year t. As in the previous section, WHOLESALEyb,t−1 is
our key variable of interest. Using the quarterly data, we calculate yearly averagesWHOLESALEy
and REPO FFy. We also control for the set of yearly adjusted bank-specific variables, Xyb,t−1,
that we discussed above, a set of year dummies (TimeEffects), andMt, to account for macroe-
conomic factors that may also play a role in loan maturities. As in our previous analyses, to
reduce concerns that our results are driven by uncontrolled bank heterogeneity we include bank
fixed effects (FEb).
2.2.2 Bank monitoring hypothesis
Banks can shorten the maturity of their loans not because they want to reduce the liquidity
risk arising from their added use of short-term funding, but because they want to strengthen
the monitoring of their borrowers. Specifically, it may be that banks that rely on short-term
wholesale funding are exposed themselves to monitoring by creditors, which motivates them
to monitor their borrowers more strictly. We consider two tests to distinguish between these
two hypotheses. The first one builds on the type of contract the bank has with the borrower,
namely whether it is a term loan or a credit line. The idea of this test is the following. If banks
shorten loan maturities because they want to increase the monitoring of borrowers, then we
should find a shortening of the maturity of their term loans and of their credit lines, since both
will force borrowers to come back for renewals more often within a shorter period of time.
In contrast, if the shortening of the loan maturity is driven by the bank’s objective to
11

reduce liquidity risk, then we should expect the result to be stronger for term loans than for
credit lines: in the case of term loans the bank provides the borrower with funds for the duration
of the loan, while in the case of credit lines it offers only a commitment to lend. To ascertain
the importance of these hypotheses, we extend our model of loan maturity as well as our model
of the extension of loan maturity and include the interaction between WHOLESALEb,t−1 and
the dummy variable TERM LOAN.
Our second test to distinguish the bank funding hypothesis from the monitoring hy-
pothesis builds on the following idea. Under the bank funding hypothesis, there is no apparent
reason for banks to target a decline in loan maturities when they lend to any given group of
borrowers. In contrast, under the monitoring hypothesis we should expect the decline in loan
maturities to be present for loans in which the banks have high monitoring incentives through
a large retained share by the lead bank. Equally plausible, banks with a high retained share
may have incentives to keep low sensitivity of wholesale funding and loan maturity (not using
maturity as a monitoring device), because borrowers’ performance is already improved and no
additional monitoring is needed. Hence, if the sensitivity between loan maturity and wholesale
funding differs for the different retained share of the lead bank, it may be that bank monitoring
is driving the result. To that end, we start by investigating the extent to which banks with
high monitoring incentives, as determined by the share of the loan they retain, originate loans
with shorter maturities. Next, we investigate whether this link is stronger among banks that
rely more extensively on wholesale funding.
2.2.3 Bond financing hypothesis
Another hypothesis that can explain a change in loan maturities is related to a change in
borrowers’ preferences for funding sources. It is possible that borrowers choose to take (strate-
gically) short-term loans and then capitalize on bank monitoring to access the bond market
under better terms. It is also possible that borrowers have preferences for bond financing
because of lower costs, and in turn choose to substitute bank borrowing with another type of
long-term financing such as bond financing. Yet another possibility is that borrowers access
the bond market in an attempt to compensate for the shortening of the maturity of their loans.
12
A key distinction between these alternatives is that while borrowers’ access to the
bond market induced by a change in the maturity of bank lending is supply driven, under
the bond financing hypothesis the access is demand driven. This difference is critical for us
to determine the relative importance of these hypotheses. Note that while under the bank
funding hypothesis we would expect an increase in interest rates of long-term loans relative to
short-term loans to make borrowers take more short-term loans, under the bond hypothesis
we would expect a negative relationship between bond and loan spreads.
To distinguish the bank funding hypothesis from the bond hypothesis, we investigate
the slope of the yield curve and its relationship to wholesale funding, and the relationship
between bond and loan spreads. In addition, we examine whether the probability of bond
issuance is higher after term loan origination, and whether banks’ reliance on wholesale funding
is positively associated with the likelihood of bond issuance after a term loan issuance.
2.2.4 Other explanations for the maturity of bank loans
Firms may demand short-term loans because they use assets with a shorter life span (Hart and Moore
(1994)). It may be the case that banks that rely on short-term funding respond to firms’ de-
mand for short-term loans. Although this possibility is not mutually exclusive with the bank
funding hypothesis, according to which banks shorten the maturity of loans in response to
their own use of short-term funding to minimize the associated costs with exposure to liquidity
risk, we propose several tests that try to distinguish between the two hypotheses. We examine
the relationship between maturities of loans and bank wholesale funding for firms that are
expected to demand (i) long-term loans because of the longer duration of their assets, and (ii)
short-term loans because of the shorter duration of their assets. If the negative relationship
between wholesale funding and loan maturities is stronger for the set of firms that are not
expected to demand short-term loans compared to the set of firms that are expected to do so,
then we can conclude that firms’ incentives to match their assets and liabilities cannot explain
our result and hence loan maturities are likely not driven by firms’ demand.
13

2.3 Sample characterization
Table 1 reports the characteristics of our sample. For our regression analysis, we have 20,730
loans taken out by 2,683 publicly listed non-financial corporations between 1990 and 2010 from
80 banks. As is common in corporate samples, many variables are positively skewed, with mean
values greater than median values. For example, the median firm has log sales equal to 2.0, a
leverage ratio equal to 32 percent, and a market-to-book value of 1.4, whereas the mean firm
has log sales of 2.2, a leverage ratio of 35 percent, and a market-to-book value equal to 1.7.
Several other variables, including the fraction of tangible assets, the stock return and the stock
volatility, are also positively skewed.
Turning to the loan controls, we find that the loan amount is positively skewed, with a
median of $195 million and a mean of $539 million. The same is true for the loan spread, with
a median of 200 basis points over LIBOR and a mean of 216 basis points over LIBOR. The
mean and the median maturity is four years. A third of the loans (32 percent) are originated
for corporate purposes. With regards to the type of contract, 28 percent of loans are term
loans. On average, the lead arranger holds 45 percent of the loan.
Next, we consider the set of bank controls that we use in our study. To capture any
potential effects that may arise from ownership transfers between entities of the same holding
company, we measure these controls at the holding company level and not at the bank level.
For ease of exposition, though, we continue to refer to these as bank controls. Banks are
significantly larger, with the median of the log of bank assets 19.2 and the mean 19.0. The
average bank has an equity-to-assets ratio of about 8 percent, and uses about 16 percent or 34
percent of wholesale funding, depending on whether we include in the definition of wholesale
funding brokered deposits or uninsured deposits, respectively.
According to our hypothesis, banks with high wholesale funding tend to decrease the
maturity of their loans. To determine whether high wholesale funding banks tend to originate
more short-term loans, we plot the kernel densities of the ratios of loan maturities over the
median maturity separately for banks that rely on high wholesale funding and those that rely
less on wholesale funding. The upper graph of Figure 1 shows the kernel densities of the ratio
14

of loan maturity over the median for HIGH/LOW WHOLESALE banks based on the median
value of wholesale funding. If the ratio takes values greater than one, the loan maturity is
higher than the median maturity. For values lower than one, the loans are viewed as short-
term loans. The purpose is to compare the extent to which the kernel densities for high and
low wholesale funding banks overlap.
We first compare the overlap of both densities for values of the maturity ratio lower
than one. The figure clearly shows that the high wholesale funding banks originate more
short-term loans than the low wholesale funding banks. When looking for values of the ratio
higher than one, aiming to compare the distributions of long-term loans, we see that the high
wholesale funding banks originate fewer long-term loans compared to the low wholesale funding
banks. This graph shows that along the whole distribution of loan maturities, high wholesale
funding banks originate more short-term loans compared to low wholesale banks. This finding
is reinforced when measuring bank wholesale funding with REPO FF , shown in the lower
graph of Figure 1.
3 Banks’ use of short-term funding and loan maturity
In this section, we first report results of the relation between loan maturity and bank wholesale
funding. We also investigate whether banks align the effective maturity of their portfolio of
loans, that is the average time to maturity of new and existing loans in banks’ portfolio of
loans with the maturity of their liabilities. We consider two cross-sectional tests of whether
certain banks are more likely to discount loan maturities as they rely on short-term funding.
Finally, we isolate periods of a drastic exogenous increase in REPO FF and explore its impact
on loan maturities.
3.1 Shortening of maturities of new loans
Table 2 reports results from specifications that estimate the effect of bank wholesale funding
on loan maturities. In columns (1) through (3), we focus on our first proxy for the maturity
of banks’ liabilities, WHOLESALE, and in columns (4) through (6) we focus on our second
15

proxy, REPO FF.
In columns (1) and (4), we report regression models that take into account the effects of
our proxies for the maturity of banks’ liabilities, without separately accounting for the effects of
term loans and credit lines. We leave out all loan controls to reduce concerns about endogeneity
arising from the simultaneous determination of maturity and other loan characteristics. The
coefficients of interest in these models are those on the wholesale funding WHOLESALE in
column (1) and REPO FF in column (4). Both coefficients are not statistically significant,
implying that, on average, loan maturity does not depend on the maturity of banks’ liabilities.14
Under the bank funding hypothesis, we expect banks that increasingly rely on short-
term funding to shorten the maturity of their term loans, but not necessarily the maturity of
their credit lines. If banks synchronize the asset and liability sides of their balance sheets in
order to reduce the liquidity risk inherent in short-term funding, it is more likely that they do
so with their term loans because they need to set aside the total amount for the loan, unlike
for credit lines, which require only banks’ commitment to provide financing. In contrast, under
the monitoring hypothesis we would expect that link to be present in term loans as well as in
credit lines, because both of them force the borrower to come back to the bank more often,
therefore strengthening bank monitoring.
To differentiate the effect of banks’ use of short-term funding on the maturity of their
term loans and credit lines, we expand our model and include the interaction of the dummy
variable TERM LOAN with our proxies for banks’ use of short-term funding. The results of
this exercise are reported in columns (2) and (5).
In column (2), the negative coefficient on the interaction term between term loans and
wholesale funding (WHOLESALE×TERM LOAN) is -0.321, implying that as wholesale
funding increases by 1%, loan maturities shorten by 38% more for term loans than for credit
lines. In fact, wholesale funding does not affect loan maturities for credit lines in any meaningful
14In unreported specifications, we consider alternative definitions of wholesale funding that allow for scal-ing to total funding as opposed to total assets. We define total funding to be the sum of deposits, federalfunds purchased and securities sold under agreements to repurchase, commercial paper, subordinated notes anddebentures, and other liabilities. This measure accounts for the fraction of short-term funding in total funding.The results and main conclusions remain unchanged.
16

way, since the estimate on WHOLESALE, 0.089, is not statistically significant. In columns
(3) and (6), we further expand the set of controls to account for loan controls. In column
(3), the total effect of wholesale funding on loan maturities is -0.343, which is the sum of the
estimates on WHOLESALE×TERM LOAN and WHOLESALE. One standard deviation
increase in WHOLESALE leads to a 3.3% decrease in loan maturities (-0.343×0.096). As
for credit lines, the estimate on WHOLESALE is statistically insignificant, implying that
wholesale funding does not affect the maturity of credit lines.
Turning to columns (5) and (6), which report the results for banks’ use of repo funding,
REPO FF, we see that the estimates on the interaction terms, REPO FF×TERM
LOAN, are -0.262 and -0.378, respectively, and the corresponding total effects are -0.163 and
-0.311, yielding similar conclusions as in columns (2) and (3).15
Looking at the coefficient estimates on bank controls, we find that more liquid banks
originate loans with shorter maturities. The estimates on the remaining bank controls are not
significant. Large firms as proxied by the log values of sales LSALES have loans with shorter
maturity, possibly because they are better diversified and can afford to raise cheaper short-
term funding on a frequent rollover base. Firms with higher levels of leverage (LEV ERAGE)
are associated with loans with longer maturity, potentially trying to decrease their exposure to
liquidity risk. More profitable firms, having fewer liquidity constraints, have loans with shorter
maturities. Similarly to Barclay and Smith (1995), we document that the debt maturity struc-
ture is inversely related to a firm’s growth opportunities (MKTOBOOK). Loans originated
for working capital, M&A, corporate purposes and commercial paper backup have shorter ma-
turity compared to the respective reference group. Larger loans have a longer-term maturity;
so do loans originated for the purpose of recapitalization. We include the retained share of the
lead arranger in the regression (BKSHARE), and for the non-missing observations we find
that a large retained share is associated with shorter loans.
The results reported in Table 2 assume that WHOLESALE and REPO FF alone
15We also conduct a similar exercise for loan renegotiations using the SNC database, which accounts formaturity extensions versus new loans. We find that banks that rely more on short-term funding tend to alsodecrease the period of maturity extensions of loans. The results are available from the authors upon request.
17

affect loan maturity differently for term loans and credit lines. However, it may be the case
that all other characteristics affect loan maturity differently for term loans and credit lines.
To address this concern, we estimate specifications that allow for the complete interaction of
the term loan variable (TERM LOAN) with all other controls. For brevity, in Table 3 we
report only the coefficients on WHOLESALE and REPO FF and their interactions with
the term loan variable. As in the previous table, the left-hand columns report the results
for WHOLESALE and the right-hand columns report the results for REPO FF. Columns
(1) and (3) omit loan controls and columns (2) and (4) account for these controls. Lastly, as
before, we estimate all of these models with bank fixed effects.
The results across all four specifications in Table 3 indicate that banks shorten the
maturity of their loans as they rely more on short-term funding. Note that the coefficients
on both WHOLESALE×TERM LOAN and REPO FF×TERM LOAN are negative and
highly statistically significant in columns (1)-(2) and (3)-(4), respectively. Similarly to the
results in Table 2, the coefficients on WHOLESALE and REPO FF are small and also not
statistically significant, thus confirming that banks’ short-term funding does not affect the
maturity of credit lines but only of term loans. To summarize, even when we account for a
full interaction of the type of loan with all variables in the regression specification, we still find
that banks’ reliance on wholesale funding tends to shorten the maturity of their loans.
3.2 Shortening of the effective maturity of loan portfolios
So far we have documented that as banks increase their use of short-term funding, they shorten
the maturities of new term loans. We have argued that these findings support the bank funding
hypothesis that banks shorten the maturity of their lending business in order to reduce the
costs associated with exposure to liquidity risk due to strong reliance on short-term liabilities.
But, if that is the case, then one would expect this result to occur not only at the loan level, as
we have documented so far, but also at the loan portfolio level. To that end, we investigate the
effective maturity of the bank loan portfolios, defined yearly as the average time to maturity
of new and existing loans for the whole portfolio. Looking at the effective maturity of the loan
portfolio is beneficial, since it allows us to shed light on the hypothesis that banks attempt to
18
align the maturities of their assets and liabilities. The results of this investigation are reported
in Table 4. Using the SNC data, all models include a set of bank controls for assets, liquidity,
capital, net charge-offs and return on assets. All regressions are estimated with bank and year
fixed effects.
Columns (1)-(3) report the results using our first proxy for banks’ use of short-term
funding, WHOLESALEy, and columns (4)-(6) report the results for our second proxy, REPO
FFy. The estimate on wholesale funding in column (1) is -0.366, suggesting that a one standard
deviation increase in WHOLESALEy is associated with a 3.7% reduction in the maturity of
the entire loan portfolio. Based on column (2), the discount of wholesale funding on effective
maturity is pertinent to the portfolio of term loans only, which is consistent with our earlier
findings. The estimate on wholesale funding for the portfolios of credit lines in column (3) is
of much smaller magnitude. In column (4), the estimate on REPO FFy is -0.547, suggesting
that REPO FFy, our proxy for banks’ funding liabilities with the shortest maturity, leads
to the strongest decrease in effective maturity. In column (5), the estimate on REPO FFy
suggests that the maturity of term loans is decreasing when banks rely on repo funding. This
is not the case for credit lines, for which the estimate on REPOFF is not significant (column
(6)).
We conclude that when banks take into account the maturities of new loans and the
maturities left of previous loans, they shorten the maturity of the loan portfolio with greater
reliance on wholesale funding. Finding evidence at the portfolio level provides additional
support for banks’ alignment of the maturities of their assets and liabilities.
3.3 Do short-term loans become less expensive as banks use more short-
term funds?
We have implicitly assumed so far that the decline in loan maturities is supply driven. However,
it is conceivable that such an effect is instead demand driven. For example, a change in
borrowers’ funding preferences toward bond financing could potentially lead to a decline in
loan maturities, since banks will originate fewer long-term loans. We look closely at the bond
financing hypothesis in section 5.2. In this section, we estimate yield curves for banks with
19

different levels of wholesale funding in order to understand whether short-term loans become
relatively cheaper for banks that rely more on wholesale funding.
If the effect of shorter loan maturity is coming from banks’ balance-sheet adjustments,
we expect to find a corresponding impact on loan spreads. Specifically, if high wholesale
funding banks tend to shorten the maturity of term loans, a unit increase in the maturity
of term loans together with a unit increase in wholesale funding should lead to higher loan
spreads. Hence, banks that rely on wholesale funding are expected to offer relatively cheaper
short-term loans compared to banks that rely less on wholesale funding. Finding a decrease in
both the maturity of loans and their spreads seems to be consistent with a change in banks’
lending policies, rather than with a change in the demand for short-term loans by borrowers.
To address this possibility in Table 5, we estimate loan spread regressions. To capture
the differential impact of the maturity of banks’ funding sources on loan spreads for loans
with different maturities, we include the interaction between our proxies for the maturity of
bank liabilities WHOLESALE and REPO FF and the maturity of loans. This interaction
captures the incremental effect of wholesale funding (repo funding) for a 1% increase in loan
maturities. We estimate this effect controlling for a set of firm-, bank-, and loan-specific
factors similar to previous studies of loan spreads (i.e., Santos and Winton (2008) and Santos
(2011)).16 Following our previous analysis, we estimate our loan-spread model with bank fixed
effects.
Columns (1) and (2) report the results for the entire sample, while the remaining
columns report the results separately for term loans and credit lines. In column (1), we see
that the coefficients on WHOLESALE and the interaction term WHOLESALE×LMATUR
ITY are both significant. Since the sum of these two coefficients is -0.051, the relationship
between loan spreads and wholesale funding becomes weaker as loan maturity increases. Based
on column (1), as banks increase the use of wholesale funding, they cut the interest rates on
the longer-term loans by less than they cut the rate on shorter-term loans. In other words, as
banks increase their use of wholesale funding, they cut loan spreads in a way that makes short-
16Leaving out the set of loan controls to alleviate concerns about the endogeneity of some of these variablesdoes not affect our findings in any meaningful way.
20

term borrowing relatively cheaper and thus more appealing to borrowers. The loan yield curve
becomes steeper when banks rely more on short-term funding compared to banks that rely
less on short-term funding. Similar conclusions hold based on column (2), where REPO FF
is used as a measure of bank short-term funding.
In columns (3) and (4), which report the results for term loans and credit lines, respec-
tively, we see that the coefficient on the interaction term WHOLESALE×LMATURITY is
0.303 in the former model and 0.113 in the latter model, suggesting that the decline in the
relative spread of short-term credit is stronger for term loans. The remaining columns of Table
5 indicate that these conclusions hold when we use our second proxy REPO FF.
Finding that banks that use more short-term funding offer relatively less-expensive
short-term borrowing, together with the evidence that this effect is present for term loans,
adds important support to a bank-driven decline in the maturity of loans. These results are
important because they add critical support to the bank funding hypothesis and at the same
time create doubt that the shortening of loan maturity is driven by demand theories (see
section 5).
3.4 Does banks’ exposure to liquidity risk affect loan maturities?
The main hypothesis in our paper is that banks tend to decrease the maturity of their loans
when they rely more on short-term funding to ameliorate the potential effect of a sudden stop
of funding. In this section, we provide additional supporting evidence for this hypothesis by
comparing the loan maturity policies of banks that rely more on insured deposits to banks that
rely less on insured deposits. The former will be cushioned from wholesale funding withdrawals
and hence less motivated to match the maturity of their assets and liabilities. Banks that rely
on insured deposits will find less need to decrease the maturity of their loans if short-term
funding is the preferred source of funding.
In Table 6 we estimate loan maturity regressions similar to those in Table 2. We
split the sample into banks that rely more on insured deposits (H INSURED) and banks
that rely less on insured deposits (L INSURED), as defined by the median value of insured
deposits scaled to bank assets. As a portion of deposit funding, insured deposits are those
21

deposits with values lower than the insurable minimum. Insured deposits are not part of our
wholesale funding measure and the correlation between insured deposits and our two measures
of wholesale funding REPO FF and WHOLESALE is very low, allowing us to examine
in a meaningful way banks’ change in the sensitivity of loan maturities to wholesale funding
depending on the degree to which banks rely on insured deposits.
In columns (1) and (2), we find that banks that rely less on insured deposits ex-
hibit almost three-times larger negative sensitivity of loan maturity to wholesale funding
(WHOLESALE+WHOLESALE×TERM LOAN) relative to banks that rely more on in-
sured deposits (column (2)).
A similar result is observed when we use REPO FF as a proxy for the bank’s short-
term bank funding in columns (3) and (4). This test provides additional evidence on the channel
through which banks that rely more on short-term funding decrease their loan maturities.
Namely, those banks that have access to more stable funding sources such as insured deposits
are less inclined to decrease the maturity of their loans, arguably because they are not concerned
about rollover risk.
In Table 7 we report the results from a similar test, using net charge-offs instead. Our
hypothesis is that rollover risk is more pronounced for banks with high charge-offs because
creditors will be more likely to withdraw funding if the bank has relatively high levels of
uncollectible loans. This hypothesis addresses the possibility that banks attract more short-
term funding because they are more likely to fail, namely because of lower asset quality.
In columns (1) and (3), we focus on banks with low charge-off levels (L CHAR), defined
as charge-off levels lower than the sample median, and in columns (2) and (4) we examine the
high charge-off banks, defined as banks with charge-off levels higher than the sample median.
The total effect of WHOLESALE and WHOLESALE×TERM LOAN in column (1) is
twice as small as that in column (2). This result suggests that banks with high charge-offs
are more concerned with the possibility of not rolling over their short-term funding, and hence
they try to match the maturity gap between assets and liabilities. Conversely, low charge-off
banks do not shorten the maturity of loans to the same extent, because they are less exposed
to rollover risk. Similar evidence is found when looking at the REPO FF measure in columns
22
(3) and (4).
Overall, our cross-sectional tests at the bank level confirm that banks that are more
concerned with rollover risk shorten the maturity of loans by more. Namely, banks that rely
more on stable insured funding are less likely to experience the effect of funds’ withdrawal,
and hence they do not try to match the maturity of liabilities and loans compared to banks
that have less access to insured funds. In a similar spirit, banks that have high net charge-offs
are more likely not to have their funding rolled over, and therefore they self-insure more by
reducing the maturities of their loans.
3.5 (Exogenous) Jump in Repo Funding
To obtain convincing evidence that banks’ reliance on short-term funding causes a decrease
in loan maturities, one needs to examine a setting in which banks experience a ‘shock’ to the
maturity of their liabilities that is unrelated either to a change in bank assets or liabilities.
Using such a ‘shock’ allows one to find causal evidence of the effect of the maturity of bank
liabilities on the maturity of their lending. However, detecting such an event that makes banks
exogenously more dependent on short-term funding is non-trivial.
We start by inspecting the time-series patterns of our proxies for the maturity of banks’
liabilities, WHOLESALE and REPOFF. We focus on the latter measure because it is more
narrowly defined, which makes it easier to identify pronounced time-series patterns. Figure 2
depicts the quarterly mean of REPO FF, the ratio of federal funds purchased and repo sold
to assets, used in our previous regressions. In Figure 2, we can observe two periods in which
REPO FF is unambiguously trending up for several consecutive quarters. From 1992Q2 to
1995Q1, REPOFF grew 22%; a similar increase is documented from 1998Q3 to 2000Q3. The
question then arises as to whether there is some specific reason for these patterns. Looking
separately at repo sold and federal funds purchased, the two components of REPO FF, we
note that repo sold is increasing over time, but that is not the case for federal funds purchased.
Unfortunately, we do not have information about these two series separately over the period
1997Q1 to 2001Q4. However, based on the pattern on REPOFF, that is the sum of these two
series, we can infer that the increase in REPOFF from 1998Q3 to 2000Q3 is probably driven
23

by an increase in repo sold and not by fed funds purchased, since it exhibits a decrease from
1998Q3 to 2000Q3. Hence, our investigation is narrowed down to the reasons for observing
such an increase in repo sold in the period 1998Q3 to 2000Q3.
The repo market underwent a major reform in 1998. GCF (general collateral finance)
repo was introduced to reduce transaction costs and enhance liquidity in the repo market.17
This innovation in the market for repurchase agreements provides several advantages to dealers
over conventional general collateral repos. In particular, GCF repo provides for netting in set-
tlement, accommodates settlement later in the day and thus allows collateral to be easily substi-
tuted. These features reduce transaction costs, enhance liquidity and facilitate the efficient use
of collateral. The benefits of GCF repo plausibly contributed to the rapid growth in settlement
volume from $11.3 billion in 2000 to $101.3 billion in 2002, when GCF repo was considered to
account for 54% of the interdealer transactions on Treasury collateral (Fleming and Garbade
(2003)).
Although we do not have direct evidence as to why individual banks increase their
reliance on REPO FF, our conjecture is that at least part of this increase is due to the
introduction of GCF repo. For this reason, we assume that the period 1998Q3 to 2000Q3 is a
period of an exogenous increase in repo funding.18
In Table 8, we examine whether the relationship between loan maturity and the ma-
turity of the bank’ liabilities, as proxied by REPO FF, differs in the period of exogenous
increase in repo compared to the rest. JUMP varies by banks, and it takes one if REPO FF
increases from 1998Q3 to 2000Q3 and zero otherwise. Our hypothesis is that banks with pos-
itive growth in REPO FF exhibit stronger sensitivity of loan maturity to REPO FF in an
attempt to attenuate the potential effect of rollover risk.
In column (1), based on the negative sign of the triple-interaction term betweenWHOLESALE,
JUMP and TERM LOAN, we conclude that, in periods of arguably exogeneous decreases
in the maturity of banks’ funding induced by a positive shock in REPO FF, loan maturity is
17See Fleming and Garbade (2003) for a detailed description of GCF repo.
18Because we did not find a similar explanation for the increase of repo in the period 1992Q2 to 1995Q1, weomit this period, possibly driven by other time trends in the economy.
24

more sensitive to the maturity of banks’ liabilities when compared to other periods in which
the possible decline in the maturity of bank liabilities is not exogeneous. The same conclusion
holds in column (2), where we proxy for the maturity of banks’ funding by REPO FF .
4 Could banks’ monitoring incentives explain loan maturity
shortening?
In the model of Holmstrom and Tirole (1997), banks bear all of the monitoring costs but they
share only a part of the benefits, therefore facing moral hazard in terms of exerting lower
monitoring effort. Being exposed to this kind of moral hazard, lead arrangers in lending
syndicates are expected to retain a larger share of the loan in order to signal their willingness
to monitor borrowers’ performance (e.g., Sufi (2007)). In the context of bank funding and loan
maturities, it may be the case that banks that rely on short-term funding use the maturity of
loans as a monitoring instrument by forcing borrowers to revisit banks more often in a search
for new loans or maturity extensions.
As we noted above, the fact that we find a shortening of maturity for term loans, but not
for credit lines, raises questions about the bank monitoring hypothesis. Under this hypothesis,
we would not expect this difference, because banks could increase their monitoring opportu-
nities by shortening the maturity of either term loans or credit lines, since both would force
borrowers to come back more often. To further test these hypotheses, we examine whether the
relationship between banks’ funding and maturity varies for different levels of bank monitoring
incentives. If banks use the maturity of their loans as a monitoring device, then we would
expect the estimate on WHOLESALE+WHOLESALE×TERM LOAN to be larger and
negative for banks with higher monitoring incentives relative to those with weaker monitoring
incentives. Alternatively, banks with a higher retained share may not use maturity shortening
as a monitoring device; on the contrary, they may extend loan maturities because they choose
to originate loans to more creditworthy borrowers. Overall, monitoring by lead arrangers can
be associated either with a shortening or an extending of loan maturities. Hence, the most
convincing evidence that our results are not driven by the monitoring hypothesis is to find no
25
relationship between the retained share and the sensitivity of the loan maturity to our proxies
of the maturity of banks’ liabilities.
When banks retain a larger share of the loans, they have stronger monitoring incentives,
because they have more skin in the game. If high wholesale banks use the maturity of their loans
as a monitoring device, then we would expect the estimate onWHOLESALE+WHOLESALE
×TERM LOAN to be larger for banks with more skin in the game when compared to banks
with less skin in the game. To test this hypothesis, we split our sample into loans with large
versus those with small retained shares and estimate our loan maturity model. To further
reduce concerns that our results are driven by the set of loans for which we are not able to
obtain information on the retained share, we also estimate our model for this set of loans.
Table 9 reports the results of this test. As before, columns (1)-(3) report the results
for WHOLESALE, while columns (4)-(6) report the results for REPO FF. Examining the
sum of the estimates of WHOLESALE+WHOLESALE×TERM LOAN in columns (1)
and (2), we observe that banks that retain a relatively small share shorten the maturity of
loans in a similar way as banks with a large share. Similar evidence is confirmed in column
(4) where we use REPO FF, and in column (5) the corresponding estimate is not significant.
These results are not consistent with the monitoring hypothesis, since banks’ retained shares
do not seem to matter for the relationship of loan maturity and bank wholesale funding.
Note that the missing information about the retained share does not appear to drive our
results—based on columns (3) and (6), both estimates on WHOLESALE×TERM LOAN
and REPO FF×TERM LOAN are insignificant.
In sum, our results do not seem to support the idea that banks’ monitoring incentives
drive the relation between loan maturities and wholesale funding, since we do not find this
relationship to be stronger among banks with more monitoring incentives, as proxied by their
skin in the game.
26

5 Could loan maturity shortening be driven by borrowers’ de-
mand?
Our findings show that as banks increase their use of short-term funding they also increase the
interest rates on long-term loans compared to that on loan maturity shortening, and that this
result is indeed bank driven and not demand driven by borrowers. To further reduce concerns
that our findings derive from a change in borrowers’ preferences, in this section we report the
results of two tests we developed. The first test builds on the idea that firms cater to the
duration of their assets when they decide on the maturity of their borrowing. The second test,
in turn, considers the possibility of our results deriving from a change in borrowers’ preferences
for bond financing.
5.1 Do firms cater to the duration of their assets?
Firms may have incentives to match the maturities of their assets and debt obligations. In the
model of Hart and Moore (1994) a borrower cannot commit to repay debt and can walk away
from debt obligations at any time. Although the lender can seize the assets in the event of the
borrower’s default, accumulated skill and knowledge cannot be acquired by the creditor. Debt
maturity can help resolve this problem because as assets become longer lived, they provide the
creditor with security to wait longer before being repaid. The lender’s threat to seize assets is
more credible when assets are longer lived. According to this model, assets with a long/short
life are likely to be financed by long-/short-term debt.
If firms match the maturities of their assets and liabilities, as Stohs and Mauer (1996)
document, one may wonder whether our finding of maturity shortening is driven by firms’
adjustments to their balance sheets. If the maturities of banks’ liabilities and short-term loans
are correlated through an omitted factor that captures firms’ appetite for “short-termism,”
then our results could be explained by firms’ demand for short-term loans as opposed to
banks’ supply of short-term loans. Similar to firms, banks may also have incentives to match
the duration of assets and liabilities. As a result, a non-random sorting between banks that
demand short-term assets (to match their short-term funding) and firms that demand short-
27

term loans (to match the duration of their assets) may be present in the data. If so, we would
expect the decrease in loan maturities to be driven by borrowers and to be more pronounced
for firms that need short-term loans and for banks that rely more on short-term funding.
To investigate this conjecture, we examine whether the discount on loan maturity
driven by banks with higher WHOLESALE or REPOFF varies with the level of borrowers’
asset duration. Asset duration is related to depreciation costs at the industry level.19 A
higher depreciation rate requires substantial investments to keep the stocks at a constant
level. Industries with high depreciation rates include software, communication equipment,
computers, petroleum and natural gas exploration. A higher depreciation rate in a certain
industry implies a shorter duration of assets. For assets with certain depreciation (depr) and
for constant productivity (prgrowth),20 the asset duration at the industry level is calculated
as 1+prgrowthdepr+prgrowth . Assuming that firms with a shorter duration of assets prefer short-term
financing, we would expect a larger decrease in their loan maturities compared to firms with
a longer asset duration. We rely on an industry measure of asset duration as opposed to a
firm-based measure, to avoid endogenous responses at the firm level.
We split our sample of borrowers into three groups depending on the distribution
of industry asset duration, which is unlikely to be affected by a single firm choice of asset
duration. The first group includes firms in the first tercile of the asset duration distribution
(short duration), and the second and the third groups include firms in the second and third
terciles, respectively. In Table 10 we report the same set of loan maturity regressions as in
Table 3 separately for the three classes of asset duration. Columns (1)-(3) and (4)-(6) report
results for WHOLESALE and REPO FF, respectively. Starting with columns (1) to (3),
the estimates on the interaction terms between wholesale funding and term loans are negative
and significant for all three groups of asset duration classes. However, the sensitivity between
loan maturity and our proxies for the maturity of the bank’s liabilities is the largest for firms
19Data come from the Bureau of Economic Analysis (BEA) fixed-asset tables. The information can be re-trieved from http://www.bea.gov/, Table 3.4ES Current-Cost Depreciation of Private Fixed Assets by Industry.The reported depreciation costs for each industry are based on data on service lives and sales of vintage assets.
20The choice of the value of productivity growth does not affect the value of duration. We calculate durationbased on 0.03 productivity.
28

with long asset duration that are supposed to issue long-term financing to match assets and
liabilities.
Finding a much smaller discount on loan maturity for short and medium asset duration
(columns (1) and (2)) than for long asset duration (column (3)) is contrary to our expectation
that banks with the shortest maturity funding, as proxied by their use of wholesale funding,
WHOLESALE, may respond to a firm’s demand for short-term loans. In contrast, firms that
are expected to demand long-term loans because of long asset duration experience the strongest
maturity cut. Similar results are documented in columns (4) to (6) when using REPO FF.
These findings suggest that firms that prefer long-term loans ex ante receive shorter-maturity
loans compared to firms that prefer shorter-term loans, implying that our results are not driven
by firms’ demand for short-term loans.
5.2 Is loan maturity shortening related to bond financing?
As noted above, the decline in loan maturity could also be the result of a change in borrowers’
funding preferences for bond financing. According to the bond financing hypothesis, borrowers
strategically take short-term loans from banks that rely extensively on short-term funding, with
the purpose of accessing the bond market afterwards. Therefore, a firm may first take a short-
term loan, capitalize on bank monitoring and access the bond market on better terms. If this
is the case, one should observe a surge in short-term loans and a decline in the demand for
long-term loans as borrowers switch to the bond market. An alternative hypothesis is that
firms may not be strategic in terms of sequencing their access first to the bank and then to
the bond market, but rather may respond to banks’ shortening of maturities by reaching for
long-term bonds.
In terms of pricing implications, because the increase in short-term loans is demand
driven in the first case, one would expect a relative increase in the spread of short-term versus
long-term loans if banks rely more on short-term funding. However, if firms go to the bond
market in order to compensate for the shorter bank loans, a relative change in loan rates is
not expected. Based on our previous analysis of loan spreads in section 3.3, we observe that
short-term loans become relatively cheaper than long-term loans when banks increase their use
29
of short-term funding, which is somewhat at odds with the explanation that firms’ demand for
short-term loans increased. An equally plausible hypothesis is that bond financing has become
relatively cheaper over time and has made borrowers substitute the long-term bank funding
with bond financing. If this explanation drives our results, we should observe a negative
relationship between bond and loan spreads, holding all else equal.
In order to trace the interaction between term loans and bond financing, we isolate
firm-quarter windows before and after the issuance of a term loan.21 Using a pre-/post-loan
framework allows us to identify the impact of each term loan on the terms of subsequently
issued bonds. In Table 11, column (1), we report estimates of the probability of bond issuance
on the lagged sales, leverage, tangibility, market-to-book ratios, profit margin and log of the
spread between the triple-B and triple-A index yields. In column (1), the estimate on the
AFTER TL variable, which takes the value of one for the period after the term loan and zero
for the period before the term loan, has a positive and significant sign, indicating that it is
more likely that a firm will issue a bond after receiving a term loan than during the pre-loan
period. This result is consistent with firms’ behaviour of reaching for bonds, presumably with
longer maturity.
Assuming that the shortening of bank liabilities is the channel through which banks
shorten loan maturities, we include the interaction of AFTER TL×WHOLESALEq in the
bond issuance models reported in column (2).22
We expect that term loans granted by banks that rely more on wholesale funding
are more likely to be followed by bond issuance than term loans that are originated by
lower wholesale banks. The positive sign on the interaction term between AFTER TL and
WHOLESALEq confirms that high wholesale funding (i.e., shorter loan maturities) is asso-
ciated with a higher likelihood of bond issuance. The same conclusion holds in column (3),
where we report results for REPO FFq.
21We focus only on term loans as opposed to credit lines, since they are a closer substitute to bonds.
22For the purpose of this analysis, we modify WHOLESALEq in the following way: all observations postterm loan take the value of the average WHOLESALEq per firm quarter; WHOLESALEq is set to zero inthe quarter before the term loan origination. That is why WHOLESALEq cannot be estimated together withAFTER TL×WHOLESALEq and AFTER TL.
30
In columns (4) and (5) we focus on bond spreads. If bond financing becomes relatively
more attractive compared to term loan issuance, then we would expect a negative relationship
between term loan spreads and bond spreads. In specifications (4) and (5), we observe that
the sign of the estimate on AISDq is positive, implying that the increase in loan spreads is
associated with an increase in bond spreads. A similar conclusion can be derived from the
positive sign of WHOLESALEq and REPO FFq, suggesting that high wholesale funding
banks issue relatively more expensive long-term loans, which makes borrowers go to the bond
market and push the bond spreads upward.
In columns (6) and (7) we directly address whether the maturities of term loans and
bonds are related. We estimate a model in which the dependent variable is the ratio of the
average bond maturity for all issues in the period after the term loan origination over the
maturity of the term loan.23 The positive coefficients on WHOLESALEq in column (6) and
on REPO FFq in column (7) suggest that as wholesale funding increases, the ratio of bond
to term loan maturities increases as well, which is consistent with the explanation that firms
try to reach for long-term bonds after they have originated term loans with a shorter maturity
than desired.
In sum, our tests of the bond financing hypothesis show the following: first, firms are
more likely to issue bonds after term loan issuance than before term loan issuance; second,
firms that take out loans from banks that rely extensively on short-term funding are more
likely to issue bonds after term loan origination than before term loan issuance; third, the
ratio of bond maturity to term loan maturity is larger for firms that take loans from banks
that rely more on short-term funding; fourth, the cost of bonds issued after the term loans
is not cheaper than the cost of term loans, indicating that firms are unlikely to access the
bond market because of cheaper bond financing. Altogether, these findings are consistent with
the hypothesis that banks’ shortening of loan maturities makes borrowers search for long-term
bonds, rather than with the alternative hypothesis that easier access to the bond market makes
borrowers substitute bank funding with bond financing.
23For windows with more than one bond issue, the bond maturity is averaged. If there are no bond issues,the bond maturity is set to zero and hence the ratio of bond to term loan maturities is zero.
31

6 Conclusion
Banks have increasingly relied on repo funding and more generally on wholesale funding to
finance their activities in the past decade. Thus far, the focus of researchers and policy-makers
has been on the implications of bank funding sources for the stability of the financial system.
Little is known, however, about the effect of these funding sources on the maturity of bank
assets. Yet, several banking theories suggest that the short-term nature of these funding sources
is likely to affect banks’ lending policies. In this paper, we focus on the effect they may have
on loan maturity.
Our results show that banks that rely more on short-term funding tend to reduce the
maturity of their loans. This result is found in the maturity of new loans and in the maturity
of banks’ portfolio of corporate loans. These findings are mostly supply driven by banks and
not by borrowers. Consistent with this explanation, we find that loans with shorter maturities
become relatively cheaper as banks rely more on short-term funding. Further, we find that
firms that operate in industries with shorter-duration assets (i.e., need more short-term debt)
also experience a cut in the maturity of their term loans. In addition, we find that firms try to
make up for the shorter undesirable maturity of loans by going to the bond market, where they
manage to access longer-term bonds. This substitution of bank funding with bond financing
is not driven by a potential decline in the cost of bond financing. We also find that banks
that rely more on insured deposits or have lower net charge-offs—both less concerned about
rollover risk—have a smaller sensitivity of loan maturity to wholesale funding than the rest.
Our results have implications for financial stability. Forcing borrowers to revisit banks
within shorter periods of time can potentially expose them to refinancing risk. To the extent
that borrowers do not manage to compensate for the undesirable shortening of loans by going
to the bond market, they may end up with greater exposure to rollover risk due to banks. This
potential synchronization of banks’ and borrowers’ rollover risk may be a source of financial
instability once short-term funding suddenly disappears.
32
References
Admati, A., DeMarzo, P., Hellwig, M., and Pfleiderer, P. (2013). The leverage ratchet effect.
SSRN, 2304969.
Barclay, M. and Smith, C. (1995). The maturity structure of corporate debt. Journal of
Finance, 50(2):609–631.
Berger, A., Espinosa-Vega, M., Frame, W., and Miller, N. (2005). Debt maturity, risk, and
asymmetric information. Journal of Finance, 60:2895–2923.
Berglof, E. and Thadden, E. V. (1994). Short-term versus long-term interests: Capital structure
with multiple investors. Quarterly Journal of Economics, 109:1055–1084.
Bord, V. and Santos, J. (2014). Banks’ liquidity and the cost of liquidity to corporations.
Journal of Money Credit and Banking, 46:13–45.
Brunnermeier, M. and Oehmke, M. (2013). The maturity rat race. Journal of Finance,
68(2):483–521.
Custodio, C., Ferreira, M., and Laureano, L. (2013). Why are US firms using more short-term
debt? Journal of Financial Economics, 108 (1):182–212.
Datta, S., Iskandar-Datta, M., and Patel, A. (1998). Bank monitoring and the pricing of
corporate public debt. Journal of Financial Economics, 51:435–449.
Diamond, D. (1993). Seniority and maturity of debt contracts. Journal of Financial Economics,
33(3):341–368.
Fleming, M. and Garbade, K. (2003). The repurchase agreeement refined: GCF repo. Current
Issues in Economics and Finance, Federal Reserve Bank of New York, 9 (6):1–7.
Gande, A., Puri, M., and Saunders, A. (1999). Bank entry, competition, and the market for
corporate securities underwriting. Review of Financial Economics, 54:165–195.
33
Gorton, G. and Kahn, J. (2000). The design of bank loan contracts. Review of Financial
Studies, 13(2):331–364.
Guedes, J. and Opler, T. (1996). The determinants of the maturity of corporate debt issues.
Journal of Finance, 51(5):1809–1833.
Hale, G. and Santos, J. (2010). Do banks propagate debt market shocks? Federal Reserve
Bank of San Francisco, 2010-08.
Hart, O. and Moore, J. (1994). A theory of debt based on the inalienability of human capital.
Quarterly Journal of Economics, 109:841–879.
Holmstrom, B. and Tirole, J. (1997). Financial intermediation, loanable funds, and the real
sector. Quarterly Journal of Economics, 112(3):663–691.
Hubbard, R., Kuttner, K., and Palia, D. (2002). Are there bank effects in borrowers’ costs
of funds? Evidence from a matched sample of borrowers and banks. Journal of Business,
75(4):559–581.
Ivashina, V. and Scharfstein, D. (2010). Bank lending during the financial crises of 2008.
Journal of Financial Economics, 97:319–338.
Johnson, S. (2003). Debt maturity and the effects of growth opportunities and liquidity risk
on leverage. Review of Financial Studies, 16(1):209–236.
Mian, A. and Santos, J. (2011). Liquidity risk and maturity management over the business
cycle. Federal Reserve Bank of New York, mimeo.
Paligorova, T. and Santos, J. (2012). Monetary policy and bank risk-taking: Evidence from
the corporate loan market. SSRN 1991471.
Rajan, R. and Winton, A. (1995). Covenants and collateral as incentives to monitor. Journal
of Finance, 50:1113–1146.
Santos, J. (2011). Bank loan pricing following the subprime crisis. Review of Financial Studies,
24:1916–1943.
34

Santos, J. and Winton, A. (2008). Bank loans, bonds, and informational monopolies across
the business cycle. Journal of Finance, 63:1315–1359.
Santos, J. and Winton, A. (2011). Bank capital, borrower power, and loan rates. Federal
Reserve Bank of New York, mimeo.
Stohs, M. and Mauer, D. (1996). The determinants of corporate debt maturity structure.
Journal of Business, 69:279–312.
Sufi, A. (2007). Information asymmetry and financing arrangements: Evidence from syndicated
loans. Journal of Finance, 62:629–668.
Winton, A. (2003). Institutional liquidity needs and the structure of monitored finance. Review
of Financial Studies, 16(4):1273–1313.
35

Appendix 1: Definition of Variables
ASSET DURATION is Macaulay’s duration of assets at the industry level. It is the ratio of
one plus constant productivity growth rate over the sum of constant productivity growth
rate and depreciation. The source is the Bureau of Economic Analysis fixed-asset table
available at http://www.bea.gov/National/nipaweb/nipawebLegacy/FAweb/AllFATables.asp.
BKSHARE is the loan retained share by the lead bank.
BOND SPREAD is credit spreads over the Treasury with the same maturity as that of the
bond.
CAPITAL BK is the ratio of bank equity over risk-weighted assets.
CHARGE −OFFS BK is the bank net charge-off over risk-weighted assets.
CORP PURPOSES is one if a loan is originated for corporate purpose.
CPBKUP is an indicator variable that takes one if the loan is used for commercial paper
backup.
DEBT MATUR is the ratio of firm long-term debt to total debt.
EX RET is the one-year stock return over the market return.
INSURED is the ratio of deposits of less than $100,000 over total assets.
For a detailed description of the exact items, see
http://www.federalreserve.gov/reportforms/forms/FR_Y-9C20110630_i.pdf.
JUMP is a dummy variable that takes one if the REPO FF growth is positive for the period
1998Q3 to 2000Q3 and zero otherwise.
LAISD is the natural log of the all-in-drawn loan spread over LIBOR (in basis points) at
origination.
L AMOUNT is the natural log of loan amount in hundreds of millions of dollars.
36

L ASSETS BK is the natural log of bank assets.
LEV ERAGE is total firm debt over total assets.
LIQUIDITY BK is the ratio of bank current assets over risk-weighted assets.
LMATURITY is the natural log of one plus the maturity of the loan in years. LOAN MATURITY
in years is reported in Table 1.
LSALES is the natural log of the firm’s annual sales in hundreds of millions of U.S. dollars.
M&A is a dummy variable that takes one if the loan is originated for the purpose of mergers
and acquisitions.
MATb/MATl is the natural log of one plus the ratio of the average bond maturity over the
average loan maturity in four (eight) quarters after a term loan is issued.
MISSING SHARE is a dummy variable that takes one if the retained share is missing and
zero otherwise.
MKTBOOK is the ratio of firm market to book value of the firm.
PR BOND is the probability of bond issuance four quarters before and four quarters after a
term loan issuance with the same maturity as that of the bond.
PROF MARGIN is the firm ratio of net income over sales.
RECAPITALIZATION is an indicator variable that takes one if the loan is used for re-
capitalization.
REPO FF is the ratio of quarterly fed funds purchased and securities sold under agreements
to repurchase (repos) over assets.
ROABK is the bank’s net income before taxes over risk-weighted assets.
SLOPE Y C is the daily difference between the yields of the five- and one-year zero-coupon
bonds.
37

SPREAD is the daily difference between the Moody’s indices on the yields of AAA- and
BBB-rated bonds.
STOCK V OL is the one-year stock return volatility using daily returns.
TANGIBLES is inventories plus plant, property and equipment over total assets.
TERM LOAN is equal to one if a loan is a term loan.
WHOLESALE is the ratio of quarterly fed funds purchased and securities sold under agree-
ments to repurchase (repos), brokered deposits, commercial paper, mortgage indebted-
ness and obligations under capitalized leases over assets.
WORKCAPITAL is one if the loan is for working capital.
38
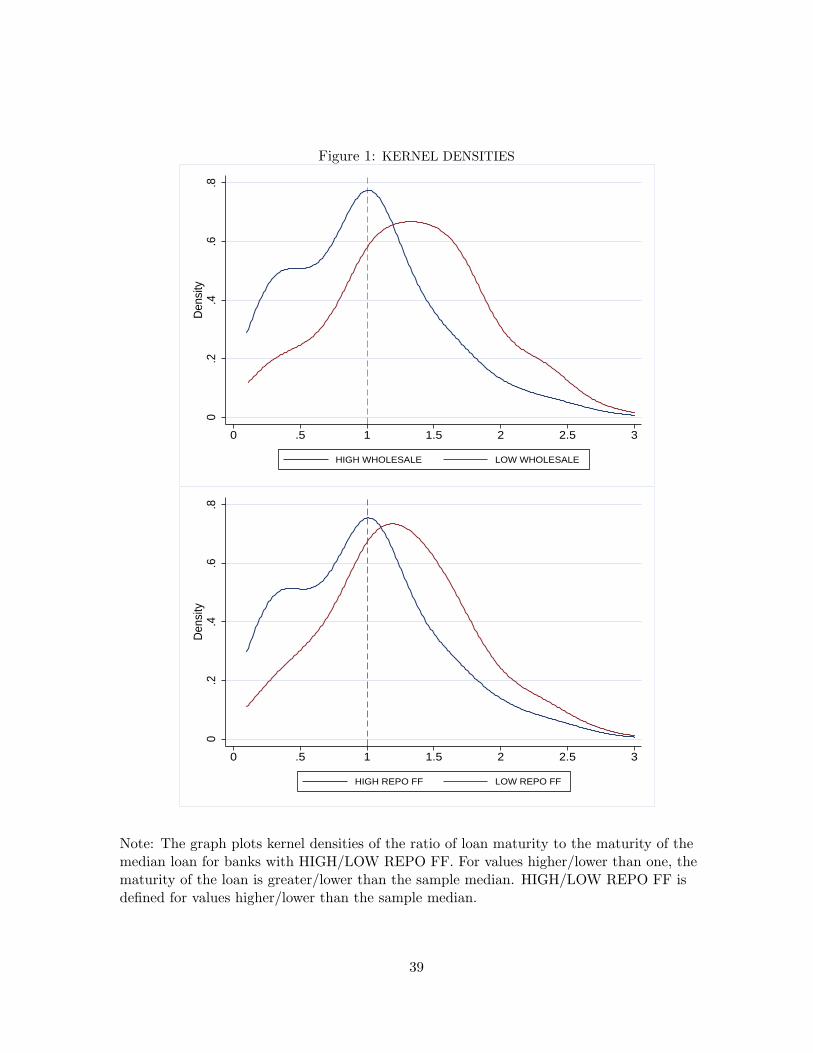
Figure 1: KERNEL DENSITIES
0.2
.4.6
.8D
ensi
ty
0 .5 1 1.5 2 2.5 3
HIGH WHOLESALE LOW WHOLESALE
0.2
.4.6
.8D
ensi
ty
0 .5 1 1.5 2 2.5 3
HIGH REPO FF LOW REPO FF
Note: The graph plots kernel densities of the ratio of loan maturity to the maturity of themedian loan for banks with HIGH/LOW REPO FF. For values higher/lower than one, thematurity of the loan is greater/lower than the sample median. HIGH/LOW REPO FF isdefined for values higher/lower than the sample median.
39

Figure 2: FEDERAL FUNDS PURCHASED AND REPO SOLD
0.0
2.0
4.0
6
1990q1 1993q4 1997q3 2001q2 2005q1 2008q4
Repo Sold Federal Funds Purchased
REPO FF
Note: Repo sold is the ratio of securities sold under agreement to repurchase over assets atthe quarterly level. Federal funds purchased is the ratio of federal funds purchased overassets. REPO FF is the ratio of the sum of repo sold and federal funds purchased over totalassets. From 1997Q1 to 2001Q4, the series for repo sold and federal funds purchased are notavailable separately.
40

Table 1: DESCRIPTIVE STATISTICSThis table reports the distributions of all firm, loan, bank and macro controls used in theanalysis. The definitions of the variables are provided in Appendix 1.
MEAN ST.DEV 25th MEDIAN 75th
FIRM CONTROLS
L SALES 2.242 1.556 0.959 2.012 3.297LEVERAGE 0.350 0.249 0.173 0.321 0.481TANGIBLES 0.709 0.367 0.433 0.693 0.959MKTBOOK 1.714 0.987 1.118 1.401 1.926PROF MARGIN -0.014 0.264 -0.007 0.032 0.071EX RET 0.001 0.001 -0.001 0.000 0.002STOCK VOL 0.033 0.021 0.019 0.028 0.041DEBT MATUR 6.157 2.921 4.098 4.609 8.693BOND MATURITY 11.815 8.791 6.969 9.893 12.684PR BOND 0.042 0.200 0.000 0.000 0.000BOND SPREAD 2.675 2.233 0.722 2.398 4.155MATb/MATl 0.201 0.490 0.000 0.000 0.951
LOAN CONTROLS
L AMOUNT (mils.) 539.000 992.000 50.000 195.000 528.000CORP PURPOSES 0.323 0.468 0.000 0.000 1.000M&A 0.105 0.306 0.000 0.000 0.000RECAPITALIZATION 0.021 0.141 0.000 0.000 0.000CPBKUP 0.051 0.22 0.000 0.000 0.000WORK CAPITAL 0.158 0.364 0.000 0.000 0.000TERM LOANS 0.276 0.448 0.000 0.000 1.000LOAN MATURITY (YRS) 4.033 2.464 2.002 4.009 5.005AISD 216.452 143.14 100 200 200BKSHARE (%) 44.535 36.762 8.143 28.000 100
BANK CONTROLS
CHARGE-OFFS BK 0.001 0.001 0.001 0.001 0.001CAPITAL BK 0.075 0.015 0.065 0.076 0.085L ASSETS BK 19.090 1.382 18.213 19.203 20.261LIQUIDITY BK 0.056 0.024 0.001 0.001 0.001ROA BK 0.001 0.001 0.001 0.001 0.002WHOLESALE 0.240 0.096 0.175 0.228 0.296REPO FF 0.071 0.095 0.019 0.045 0.096
MACRO CONTROLS
SLOPE YC 0.914 0.813 0.238 0.739 1.591SPREAD -1.074 0.667 -1.379 -0.889 -0.629
41

Table 2: MATURITY AND WHOLESALE FUNDING: LOAN LEVEL ANALYSISThe dependent variable is the log of loan maturity at the loan level (LMATURITY). Allvariables are defined in Appendix 1. All specifications include quarter, year and bank fixedeffects. Standard errors are clustered at the bank level. *** denotes 1% significant level, **denotes 5% significant level, and * denotes 10% significant level.
(1) (2) (3) (4) (5) (6)
TERM LOAN 0.464*** 0.510*** 0.409*** 0.438***(0.037) (0.033) (0.024) (0.022)
WHOLESALE 0.016 0.089 0.098(0.069) (0.081) (0.076)
WHOLESALE×TERM LOAN -0.321*** -0.440***(0.108) (0.108)
REPO FF 0.054 0.099 0.067(0.095) (0.109) (0.101)
REPO FF×TERM LOAN -0.262* -0.378***(0.143) (0.136)
L ASSETS BK -0.001 -0.003 -0.002 -0.002 -0.003 -0.001(0.005) (0.005) (0.005) (0.004) (0.004) (0.004)
LIQUIDITY BK -0.208 -0.182 -0.212 -0.126 -0.091 -0.093(0.173) (0.153) (0.147) (0.172) (0.164) (0.165)
CAPITAL BK -0.734 -0.657 -0.581 -0.428 -0.447 -0.482(0.523) (0.521) (0.485) (0.462) (0.447) (0.427)
CHARGE-OFFS BK -6.358 -2.067 -3.929 -8.743 -5.729 -8.221(5.530) (5.604) (5.863) (6.913) (7.646) (7.961)
ROA BK -2.299 -3.096 -1.889 -5.923 -5.930 -4.433(11.549) (10.331) (10.403) (9.458) (8.611) (9.037)
LSALES -0.099*** -0.083*** -0.145*** -0.095*** -0.082*** -0.144***(0.010) (0.010) (0.007) (0.010) (0.010) (0.007)
LEVERAGE 0.350*** 0.259*** 0.140*** 0.327*** 0.259*** 0.137***(0.048) (0.038) (0.036) (0.048) (0.037) (0.035)
DEBT MATUR 0.290*** 0.262*** 0.174*** 0.286*** 0.266*** 0.178***(0.022) (0.022) (0.019) (0.021) (0.022) (0.019)
PROFMARGIN -0.015*** -0.014*** -0.011*** -0.014*** -0.015*** -0.011***(0.003) (0.003) (0.004) (0.003) (0.003) (0.004)
TANGIBLES -0.069*** -0.048*** -0.018 -0.064*** -0.045*** -0.017(0.018) (0.016) (0.014) (0.021) (0.017) (0.016)
MKTOBOOK -0.032*** -0.025*** -0.023*** -0.032*** -0.026*** -0.023***(0.005) (0.005) (0.005) (0.006) (0.005) (0.005)
EX RET 22.967*** 23.116*** 22.486*** 22.357*** 22.246*** 21.897***(2.215) (2.033) (1.760) (2.625) (2.330) (2.109)
STOCK VOL -3.929*** -4.502*** -3.025*** -3.717*** -4.552*** -3.088***(0.622) (0.530) (0.384) (0.597) (0.523) (0.379)
WORKCAPITAL -0.028 -0.034*(0.018) (0.017)
M&A -0.079*** -0.078***(0.021) (0.020)
RECAPITALIZATION 0.148*** 0.140***(0.055) (0.054)
CORP PURPOSES -0.063*** -0.065***(0.015) (0.014)
CPBKUP -0.489*** -0.503***(0.034) (0.032)
L AMOUNT 0.110*** 0.108***(0.007) (0.007)
MISSING SHARE×BKSHARE 0.003*** 0.003***(0.000) (0.000)
BKSHARE -0.003*** -0.003***(0.000) (0.000)
SLOPE YC -0.016 -0.017 -0.002 -0.015 -0.015 -0.001(0.016) (0.013) (0.013) (0.015) (0.013) (0.013)
SPREAD 0.103*** 0.103*** 0.089*** 0.106*** 0.103*** 0.091***(0.016) (0.016) (0.015) (0.014) (0.014) (0.015)
Observations 20,730 20,730 20,730 20,730 20,730 20,730R2 0.139 0.190 0.258 0.135 0.187 0.256

Table 3: MATURITY AND WHOLESALE FUNDING: FULL INTERACTIONThe dependent variable is the log of loan maturity (LMATURITY). All specifications accountfor a complete interaction between each variable and the TERM LOAN variable (unreported).Each regression includes firm, bank and macro controls. Each regression accounts for year,quarter and bank fixed effects. All variables are defined in Appendix 1. Standard errors areclustered at the bank level. *** denotes 1% significant level, ** denotes 5% significant level,and * denotes 10% significant level.
(1) (2) (3) (4)
WHOLESALE 0.130 0.124(0.084) (0.082)
WHOLESALE×TERM LOAN -0.509*** -0.535***(0.185) (0.158)
REPO FF 0.135 0.097(0.105) (0.092)
REPO FF×TERM LOAN -0.458* -0.547***(0.246) (0.203)
Loan Controls No Yes No YesR2 0.174 0.249 0.171 0.247Observations 20,730 20,730 20,730 20,730
43

Table 4: EFFECTIVE MATURITY AND WHOLESALE FUNDING: BANK-YEAR ANALYSISThe dependent variable is log of the effective maturity at the bank-year level (LMATURITYLEFT). TL includes the effective maturity of the term loan portfolio. CL includes the ef-fective maturity of the credit lines portfolio. The bank controls are at the yearly level. Allspecifications include year and bank fixed effects. All variables are defined in Appendix 1.Standard errors are clustered at the bank level. *** denotes 1% significant level, ** denotes5% significant level, and * denotes 10% significant level.
(1) (2) (3) (4) (5) (6)TL CL TL CL
WHOLESALEy -0.366* -0.580* -0.258(0.216) (0.331) (0.422)
REPO FFy -0.547* -0.639** -0.439(0.302) (0.260) (0.413)
LASSETSy BK 0.012 0.016 0.038 0.067 0.031 0.071(0.042) (0.042) (0.050) (0.053) (0.038) (0.052)
LIQUIDITYy BK -1.129* -1.159* -1.671* -1.162* -1.048* -1.264*(0.618) (0.630) (0.985) (0.690) (0.535) (0.672)
CAPITALy BK 1.043 1.150 0.565 2.020 0.119 1.945(0.969) (0.985) (1.585) (1.496) (0.852) (1.489)
CHARGE-OFFSy BK 21.006* 19.987* 13.118 5.764 16.306 4.157(11.757) (11.661) (17.143) (15.202) (10.348) (15.146)
ROAy BK -9.197* -8.540 5.575 -9.624 -3.486 -9.116(5.508) (5.336) (6.844) (7.228) (4.303) (7.408)
SLOPEy YC -0.076*** -0.078*** -0.056 -0.093*** -0.055*** -0.097***(0.023) (0.023) (0.047) (0.030) (0.018) (0.029)
SPREADy 0.201*** 0.219*** 0.197** 0.167*** 0.219*** 0.200***(0.050) (0.054) (0.081) (0.031) (0.054) (0.040)
Observations 1,197 1,197 1,197 1,197 1,197 1,197R2 0.157 0.159 0.124 0.090 0.166 0.093
44
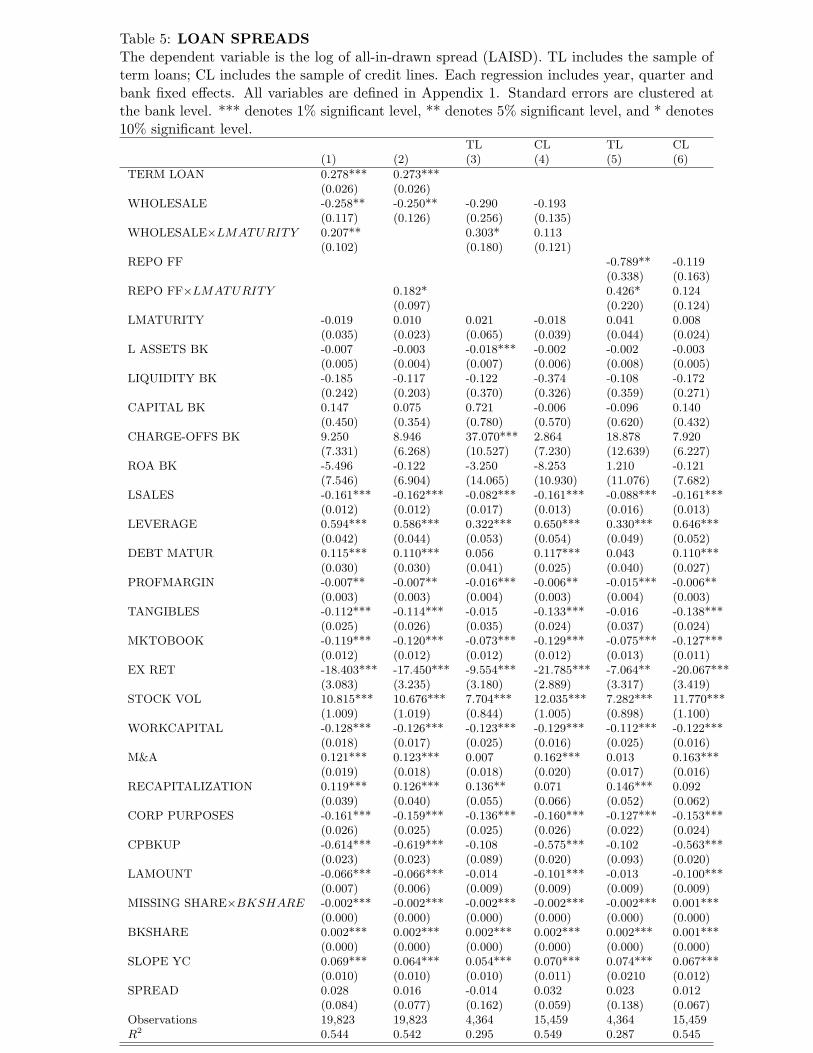
Table 5: LOAN SPREADSThe dependent variable is the log of all-in-drawn spread (LAISD). TL includes the sample ofterm loans; CL includes the sample of credit lines. Each regression includes year, quarter andbank fixed effects. All variables are defined in Appendix 1. Standard errors are clustered atthe bank level. *** denotes 1% significant level, ** denotes 5% significant level, and * denotes10% significant level.
TL CL TL CL(1) (2) (3) (4) (5) (6)
TERM LOAN 0.278*** 0.273***(0.026) (0.026)
WHOLESALE -0.258** -0.250** -0.290 -0.193(0.117) (0.126) (0.256) (0.135)
WHOLESALE×LMATURITY 0.207** 0.303* 0.113(0.102) (0.180) (0.121)
REPO FF -0.789** -0.119(0.338) (0.163)
REPO FF×LMATURITY 0.182* 0.426* 0.124(0.097) (0.220) (0.124)
LMATURITY -0.019 0.010 0.021 -0.018 0.041 0.008(0.035) (0.023) (0.065) (0.039) (0.044) (0.024)
L ASSETS BK -0.007 -0.003 -0.018*** -0.002 -0.002 -0.003(0.005) (0.004) (0.007) (0.006) (0.008) (0.005)
LIQUIDITY BK -0.185 -0.117 -0.122 -0.374 -0.108 -0.172(0.242) (0.203) (0.370) (0.326) (0.359) (0.271)
CAPITAL BK 0.147 0.075 0.721 -0.006 -0.096 0.140(0.450) (0.354) (0.780) (0.570) (0.620) (0.432)
CHARGE-OFFS BK 9.250 8.946 37.070*** 2.864 18.878 7.920(7.331) (6.268) (10.527) (7.230) (12.639) (6.227)
ROA BK -5.496 -0.122 -3.250 -8.253 1.210 -0.121(7.546) (6.904) (14.065) (10.930) (11.076) (7.682)
LSALES -0.161*** -0.162*** -0.082*** -0.161*** -0.088*** -0.161***(0.012) (0.012) (0.017) (0.013) (0.016) (0.013)
LEVERAGE 0.594*** 0.586*** 0.322*** 0.650*** 0.330*** 0.646***(0.042) (0.044) (0.053) (0.054) (0.049) (0.052)
DEBT MATUR 0.115*** 0.110*** 0.056 0.117*** 0.043 0.110***(0.030) (0.030) (0.041) (0.025) (0.040) (0.027)
PROFMARGIN -0.007** -0.007** -0.016*** -0.006** -0.015*** -0.006**(0.003) (0.003) (0.004) (0.003) (0.004) (0.003)
TANGIBLES -0.112*** -0.114*** -0.015 -0.133*** -0.016 -0.138***(0.025) (0.026) (0.035) (0.024) (0.037) (0.024)
MKTOBOOK -0.119*** -0.120*** -0.073*** -0.129*** -0.075*** -0.127***(0.012) (0.012) (0.012) (0.012) (0.013) (0.011)
EX RET -18.403*** -17.450*** -9.554*** -21.785*** -7.064** -20.067***(3.083) (3.235) (3.180) (2.889) (3.317) (3.419)
STOCK VOL 10.815*** 10.676*** 7.704*** 12.035*** 7.282*** 11.770***(1.009) (1.019) (0.844) (1.005) (0.898) (1.100)
WORKCAPITAL -0.128*** -0.126*** -0.123*** -0.129*** -0.112*** -0.122***(0.018) (0.017) (0.025) (0.016) (0.025) (0.016)
M&A 0.121*** 0.123*** 0.007 0.162*** 0.013 0.163***(0.019) (0.018) (0.018) (0.020) (0.017) (0.016)
RECAPITALIZATION 0.119*** 0.126*** 0.136** 0.071 0.146*** 0.092(0.039) (0.040) (0.055) (0.066) (0.052) (0.062)
CORP PURPOSES -0.161*** -0.159*** -0.136*** -0.160*** -0.127*** -0.153***(0.026) (0.025) (0.025) (0.026) (0.022) (0.024)
CPBKUP -0.614*** -0.619*** -0.108 -0.575*** -0.102 -0.563***(0.023) (0.023) (0.089) (0.020) (0.093) (0.020)
LAMOUNT -0.066*** -0.066*** -0.014 -0.101*** -0.013 -0.100***(0.007) (0.006) (0.009) (0.009) (0.009) (0.009)
MISSING SHARE×BKSHARE -0.002*** -0.002*** -0.002*** -0.002*** -0.002*** 0.001***(0.000) (0.000) (0.000) (0.000) (0.000) (0.000)
BKSHARE 0.002*** 0.002*** 0.002*** 0.002*** 0.002*** 0.001***(0.000) (0.000) (0.000) (0.000) (0.000) (0.000)
SLOPE YC 0.069*** 0.064*** 0.054*** 0.070*** 0.074*** 0.067***(0.010) (0.010) (0.010) (0.011) (0.0210 (0.012)
SPREAD 0.028 0.016 -0.014 0.032 0.023 0.012(0.084) (0.077) (0.162) (0.059) (0.138) (0.067)
Observations 19,823 19,823 4,364 15,459 4,364 15,459R2 0.544 0.542 0.295 0.549 0.287 0.545

Table 6: MATURITY AND WHOLESALE FUNDING FOR BANKS WITHHIGH/LOW INSURED DEPOSITSThe dependent variable is the log of loan maturity (LMATURITY). L/H INSURED takes oneif the ratio of insured deposits over assets is lower/higher than the sample median. Loan, firm,bank and macro controls are accounted for in each specification. Each regression includes year,quarter and bank fixed effects. All variables are defined in Appendix 1. Standard errors areclustered at the bank level. *** denotes 1% significant level, ** denotes 5% significant level,and * denotes 10% significant level.
(1) (2) (3) (4)
L INSURED H INSURED L INSURED H INSURED
TERM LOAN 0.634*** 0.476*** 0.508*** 0.433***(0.042) (0.040) (0.040) (0.024)
WHOLESALE 0.244** -0.007(0.119) (0.095)
WHOLESALE×TERM LOAN -0.847*** -0.257(0.137) (0.177)
REPO FF 0.248 -0.037(0.160) (0.160)
REPO FF×TERM LOAN -0.776*** -0.233(0.276) (0.192)
Observations 10,364 10,366 10,364 10,366R2 0.255 0.315 0.252 0.312
Table 7: MATURITY AND WHOLESALE FUNDING FOR BANKS WITHHIGH/LOW NET CHARGE-OFFSThe dependent variable is the log of loan maturity (LMATURITY). L/H CHARGE-OFFStakes one if the ratio of insured deposits over assets is lower/higher than the sample median.Loan, firm, bank and macro controls are accounted for in each specification. Each regressionincludes year, quarter and bank fixed effects. All variables are defined in Appendix 1. Stan-dard errors are clustered at the bank level. *** denotes 1% significant level, ** denotes 5%significant level, and * denotes 10% significant level.
(1) (2) (3) (4)
L CHAR H CHAR L CHAR H CHAR
TERM LOAN 0.483*** 0.574*** 0.414*** 0.487***(0.047) (0.050) (0.030) (0.040)
WHOLESALE 0.122 0.088(0.087) (0.133)
WHOLESALE×TERM LOAN -0.355** -0.667***(0.145) (0.194)
REPO FF -0.032 0.367(0.143) (0.234)
REPO FF×TERM LOAN -0.222* -0.816*(0.124) (0.433)
Observations 15,547 5,183 15,547 5,183R2 0.254 0.231 0.261 0.235
46

Table 8: JUMP in REPO FFThe dependent variable is the log of loan maturity. JUMP is a dummy variable that takesone if a bank has positive growth of REPO FF from 1998Q3 to 2000Q3. Loan, firm, bank andmacro controls are accounted for in each specification. Each regression includes year, quarterand bank fixed effects. All variables are defined in Appendix 1. Standard errors are clusteredat the bank level. *** denotes 1% significant level, ** denotes 5% significant level, and *denotes 10% significant level.
(1) (2)
TERM LOAN 0.465*** 0.421***(0.047) (0.028)
WHOLESALE 0.035(0.086)
WHOLESALE×TERM LOAN -0.261*(0.148)
TERM LOAN×JUMP 0.120* 0.049(0.067) (0.045)
WHOLESALEb×JUMP 0.172(0.133)
WHOLESALEb×JUMP×TERM LOAN -0.489**(0.228)
REPO FF -0.025(0.086)
REPO FF×TERMLOAN -0.228(0.159)
REPO FF×JUMP 0.246(0.177)
REPO FF×JUMP×TERM LOAN -0.429*(0.247)
Observations 20,730 20,730R2 0.258 0.257
47
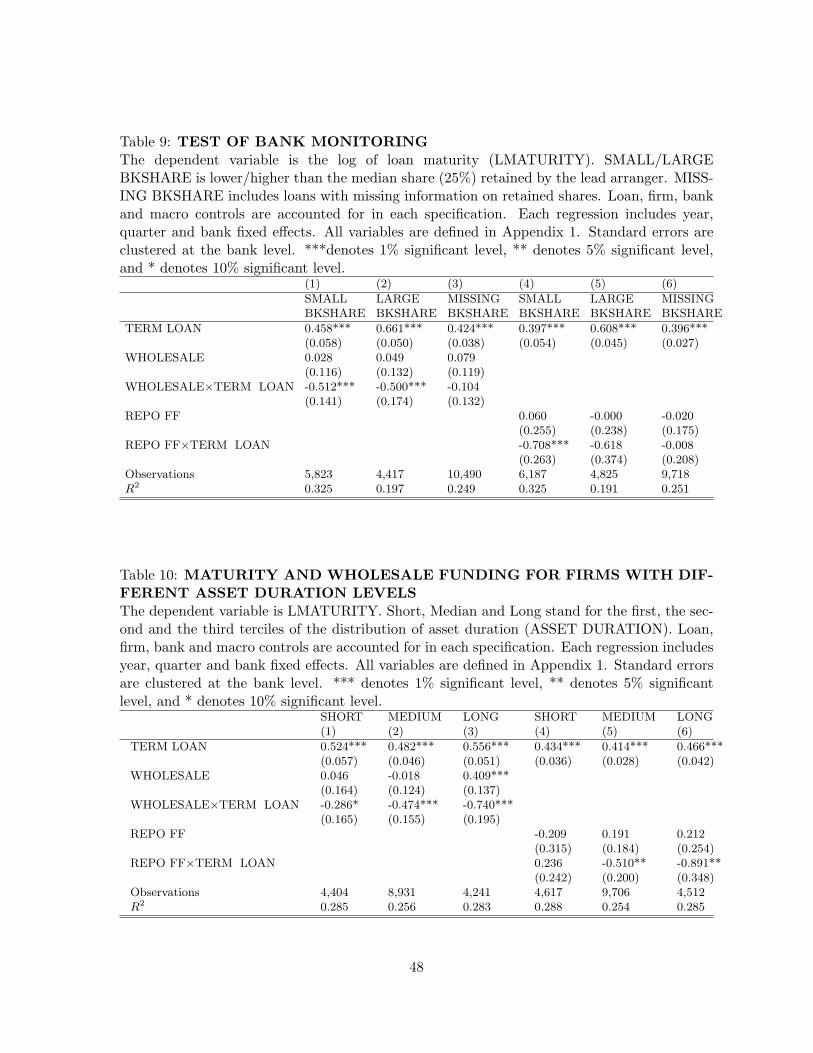
Table 9: TEST OF BANK MONITORINGThe dependent variable is the log of loan maturity (LMATURITY). SMALL/LARGEBKSHARE is lower/higher than the median share (25%) retained by the lead arranger. MISS-ING BKSHARE includes loans with missing information on retained shares. Loan, firm, bankand macro controls are accounted for in each specification. Each regression includes year,quarter and bank fixed effects. All variables are defined in Appendix 1. Standard errors areclustered at the bank level. ***denotes 1% significant level, ** denotes 5% significant level,and * denotes 10% significant level.
(1) (2) (3) (4) (5) (6)
SMALL LARGE MISSING SMALL LARGE MISSINGBKSHARE BKSHARE BKSHARE BKSHARE BKSHARE BKSHARE
TERM LOAN 0.458*** 0.661*** 0.424*** 0.397*** 0.608*** 0.396***(0.058) (0.050) (0.038) (0.054) (0.045) (0.027)
WHOLESALE 0.028 0.049 0.079(0.116) (0.132) (0.119)
WHOLESALE×TERM LOAN -0.512*** -0.500*** -0.104(0.141) (0.174) (0.132)
REPO FF 0.060 -0.000 -0.020(0.255) (0.238) (0.175)
REPO FF×TERM LOAN -0.708*** -0.618 -0.008(0.263) (0.374) (0.208)
Observations 5,823 4,417 10,490 6,187 4,825 9,718R2 0.325 0.197 0.249 0.325 0.191 0.251
Table 10: MATURITY AND WHOLESALE FUNDING FOR FIRMS WITH DIF-FERENT ASSET DURATION LEVELSThe dependent variable is LMATURITY. Short, Median and Long stand for the first, the sec-ond and the third terciles of the distribution of asset duration (ASSET DURATION). Loan,firm, bank and macro controls are accounted for in each specification. Each regression includesyear, quarter and bank fixed effects. All variables are defined in Appendix 1. Standard errorsare clustered at the bank level. *** denotes 1% significant level, ** denotes 5% significantlevel, and * denotes 10% significant level.
SHORT MEDIUM LONG SHORT MEDIUM LONG(1) (2) (3) (4) (5) (6)
TERM LOAN 0.524*** 0.482*** 0.556*** 0.434*** 0.414*** 0.466***(0.057) (0.046) (0.051) (0.036) (0.028) (0.042)
WHOLESALE 0.046 -0.018 0.409***(0.164) (0.124) (0.137)
WHOLESALE×TERM LOAN -0.286* -0.474*** -0.740***(0.165) (0.155) (0.195)
REPO FF -0.209 0.191 0.212(0.315) (0.184) (0.254)
REPO FF×TERM LOAN 0.236 -0.510** -0.891**(0.242) (0.200) (0.348)
Observations 4,404 8,931 4,241 4,617 9,706 4,512R2 0.285 0.256 0.283 0.288 0.254 0.285
48
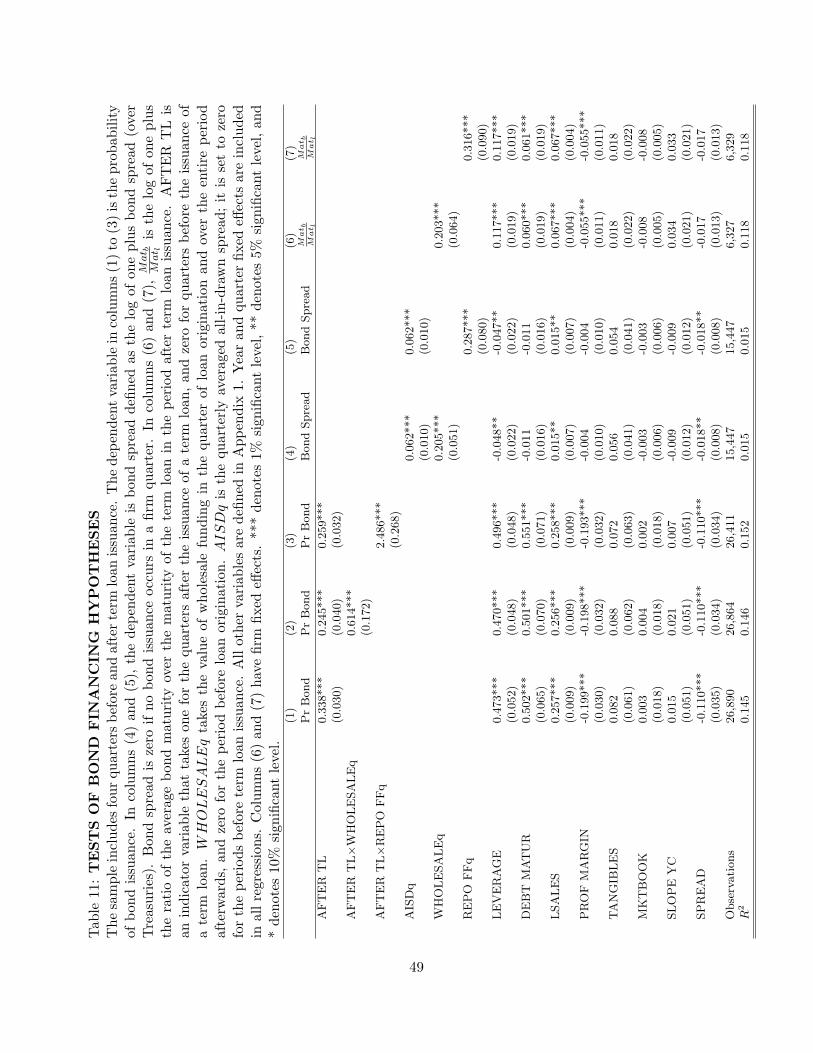
Tab
le11:TESTS
OF
BOND
FIN
ANCIN
GHYPOTHESES
Thesampleincludes
fourquarters
beforean
dafterterm
loanissuance.Thedep
endentvariablein
columns(1)to
(3)istheprobability
ofbon
dissuan
ce.In
columns(4)an
d(5),
thedep
endentvariable
isbondspreaddefined
asthelogofoneplusbondspread(over
Treasuries).
Bon
dspread
iszero
ifnobon
dissuan
ceoccurs
inafirm
quarter.In
columns(6)and(7),
Mat b
Mat l
isthelogofoneplus
theratioof
theaveragebon
dmaturity
over
thematurity
oftheterm
loanin
theperiodafter
term
loanissuance.AFTER
TL
isan
indicator
variab
lethat
takes
oneforthequartersafter
theissuance
ofaterm
loan,andzero
forquartersbefore
theissuance
of
aterm
loan
.W
HOLESALEqtakes
thevalueof
wholesale
fundingin
thequarter
ofloanoriginationandover
theentire
period
afterw
ards,
andzero
fortheperiodbeforeloanorigination.AISDqis
thequarterly
averaged
all-in-drawnspread;it
issetto
zero
fortheperiodsbeforeterm
loan
issuan
ce.Allother
variablesare
defined
inAppendix
1.Yearandquarter
fixed
effects
are
included
inallregression
s.Columns(6)an
d(7)havefirm
fixed
effects.***denotes1%
significantlevel,**denotes5%
significantlevel,and
*denotes
10%
sign
ificantlevel.
(1)
(2)
(3)
(4)
(5)
(6)
(7)
PrBond
PrBond
PrBond
BondSpread
BondSpread
Mat b
Mat l
Mat b
Mat l
AFTER
TL
0.338***
0.245***
0.259***
(0.030)
(0.040)
(0.032)
AFTER
TL×W
HOLESALEq
0.614***
(0.172)
AFTER
TL×REPO
FFq
2.486***
(0.268)
AISDq
0.062***
0.062***
(0.010)
(0.010)
WHOLESALEq
0.205***
0.203***
(0.051)
(0.064)
REPO
FFq
0.287***
0.316***
(0.080)
(0.090)
LEVERAGE
0.473***
0.470***
0.496***
-0.048**
-0.047**
0.117***
0.117***
(0.052)
(0.048)
(0.048)
(0.022)
(0.022)
(0.019)
(0.019)
DEBT
MATUR
0.502***
0.501***
0.551***
-0.011
-0.011
0.060***
0.061***
(0.065)
(0.070)
(0.071)
(0.016)
(0.016)
(0.019)
(0.019)
LSALES
0.257***
0.256***
0.258***
0.015**
0.015**
0.067***
0.067***
(0.009)
(0.009)
(0.009)
(0.007)
(0.007)
(0.004)
(0.004)
PROF
MARGIN
-0.199***
-0.198***
-0.193***
-0.004
-0.004
-0.055***
-0.055***
(0.030)
(0.032)
(0.032)
(0.010)
(0.010)
(0.011)
(0.011)
TANGIB
LES
0.082
0.088
0.072
0.056
0.054
0.018
0.018
(0.061)
(0.062)
(0.063)
(0.041)
(0.041)
(0.022)
(0.022)
MKTBOOK
0.003
0.004
0.002
-0.003
-0.003
-0.008
-0.008
(0.018)
(0.018)
(0.018)
(0.006)
(0.006)
(0.005)
(0.005)
SLOPE
YC
0.015
0.021
0.007
-0.009
-0.009
0.034
0.033
(0.051)
(0.051)
(0.051)
(0.012)
(0.012)
(0.021)
(0.021)
SPREAD
-0.110***
-0.110***
-0.110***
-0.018**
-0.018**
-0.017
-0.017
(0.035)
(0.034)
(0.034)
(0.008)
(0.008)
(0.013)
(0.013)
Observations
26,890
26,864
26,411
15,447
15,447
6,327
6,329
R2
0.145
0.146
0.152
0.015
0.015
0.118
0.118
49