route 1, box 86m goodwell, oklahoma 73939-9705 (580) 349
TRANSCRIPT

Route 1, Box 86M Goodwell, Oklahoma 73939-9705 (580) 349-5440
www.agr.okstate.edu/goodwell
Division of Agricultural Sciences and Natural Resources Oklahoma Panhandle Research and Extension Center
Oklahoma State University Department of Animal Science
Department of Entomology and Plant Pathology Department of Plant and Soil Sciences
Department of Biosystems and Agricultural Engineering USDA – ARS
! Alfalfa ! Animal Waste Management
! Bermuda Grass ! Corn
! Corn Insects ! Grain Sorghum ! Cattle Nutrition ! Soil Fertility ! Soybeans ! Sunflowers ! Wheat
THE OKLAHOMA PANHANDLE RESEARCH AND EXTENSION CENTER Division of Agricultural Sciences and Natural Resources
Department of Plant and Soil Sciences Oklahoma Agricultural Experiment Station Oklahoma Cooperative Extension Service
Oklahoma State University
The Division of Agricultural Sciences and Natural Resources (DASNR)/Oklahoma Agricultural Experiment Station (OAES)/Oklahoma Cooperative Extension Service (OCES) at Oklahoma State University (OSU) have a long history working cooperatively with Oklahoma Panhandle State University (OPSU). A Memorandum of Agreement that outlined the major missions of each entity strengthened this cooperative effort in July 1994. OPSU’s primary role is teaching. OAES is the research arm of the DASNR and is responsible for the continuum of the most fundamental to strictly applied research. OCES transfers technology generated from research programs to clientele. These three entities complete the spectrum and constitute a true partnership to service problems related to panhandle agriculture. The Department of Plant and Soil Sciences with sole support from OAES and OCES has staffed the Oklahoma Panhandle Research and Extension Center (OPREC) with a Director, Area Crop-Soils Research/Extension Specialist, Area Livestock Extension Specialist, Senior Office Assistant, Senior Station Superintendent, Field Foreman, Field Assistant/Equipment Operator, wage payroll and part-time OPSU student labor. The Director, in addition to his day-to-day administrative duties, and the two Area Specialists are fully engaged in on- and off-station applied research and extension programs throughout the panhandle area. Oklahoma State University faculty in departments of Plant and Soil Sciences, Entomology and Plant Pathology, Biosystems and Agricultural Engineering, Agricultural Economics, Animal Science, and USDA/ARS continue to expand their research and extension efforts on the Center and in the panhandle area. Development of management practices to achieve maximum economic yield of all the crops, as well as potential new crops adapted to the area has been the focal point of both research and educational programs. Other studies have concentrated on varietal development of both hard red winter wheat and the new crop, hard white winter wheat. Performance of bermudagrass, buffalograss, alfalfa, soybean, wheat, grain sorghum, corn, and the efficient use of fertilizer, pesticides, water, and animal waste are being evaluated.
Progress made in development of research and educational programs adapted to the panhandle area has been significant since establishing the Center. However with increased fuel, fertilizer, pesticide, and irrigation costs much more work needs to be initiated. Your continued support in our research and extension programs will help serve the clientele of the panhandle area.
Robert L. Westerman
Assistant Director OAES

Oklahoma Panhandle Research and Extension Center
~Advisory Board~ Mr. Jack Alexander Mr. Ron Overstreet 6232 Park Lane P.O. Box 754
Guymon, Oklahoma 73942 Boise City, Oklahoma 73933
Mr. Bert Allard, Jr. Mr. Richard Radcliff P.O. Box 588 Route 1, Box 12 Texhoma, Oklahoma 73949 Forgan, Oklahoma 73938
Dr. Dan Baker Mr. Curtis Raines P.O. Box 430 Route 3, Box 162
Goodwell, Oklahoma 73939 Guymon, Oklahoma 73942 Mr. Lawrence Bohl Mr. Tom Stephens
Route 1, Box 86M Route 1, Box 29 Goodwell, Oklahoma 73939 Guymon, Oklahoma 73942
Dr. D.C. Coston Mr. J.B. Stewart 139 Ag Hall OSU P.O. Box 102 Stillwater, Oklahoma 74078 Keyes, Oklahoma 73947 Mr. Bob Dietrick Dr. Jim Stiegler P.O. Box 279 139 Ag Hall, OSU
Tyrone, Oklahoma 73951 Stillwater, Oklahoma 74078
Dr. John Goodwin Dr. John Townsend P.O. Box 430 P.O. Box 430
Goodwell, Oklahoma 73939 Goodwell, Oklahoma 73939 Mr. Rick Heitschmidt Dr. Robert Westerman
Route 1, Box 52 369 Ag Hall OSU Forgan, Oklahoma 73938 Stillwater, Oklahoma 74078
Mr. Jim Kramer Dr. Kenneth Woodward
1114 S. Monroe Route 1, Box 114A Hugoton, Kansas 67951 Texhoma, Oklahoma 73949
Dr. Jay Lark P.O. Box 430 Goodwell, Oklahoma 73939

2000 Oklahoma Panhandle Research and Extension Center
Staff and Principal Investigators
Mark L. Wood Assistant Professor and Director (580) 349-5440 Lawrence Bohl Station Superintendent (580) 349-5440 Rick Kochenower Area Research and Extension Specialist, Agronomy (580) 349-5441 Charles Strasia Area Extension Specialist, Livestock (580) 349-5439 Jason Parton Senior Agriculturist Craig Chesnut Field Foreman Matt LaMar Field Equipment Operator Judy Prater Senior Office Assistant Charles Taliaferro Regents Professor, Forage Breeding, Department of Plant (405) 744-6410 and Soil Sciences, Oklahoma State University Tom Royer Assistant Professor, State Entomology Specialist, (405) 744-9406 Entomology and Plant Pathology Department, Oklahoma State University Brett Carver Professor, Wheat Genetics, Department of Plant and Soil (405) 744-6414 Sciences, Oklahoma State University William Raun Professor, Soil Fertility Research Leader, Department of Plant (405) 744-6414 and Soil Sciences, Oklahoma State University Jeff Hattey Associate Professor, Animal Waste Research Leader, (405) 744-9586 Department of Plant and Soil Sciences, Oklahoma State University Tim Springer Scientist, USDA-ARS, Southern Plains Range Research (580) 256-7449 Station, Woodward Oklahoma Norm Elliot Scientist, USDA-ARS, Plant Science and Water Conservation (405) 624-4141 Plant Science and Research Laboratory, Stillwater Kristopher Giles Assistant Professor, Field Crop Entomologist, Entomology and (405) 744-6298 Plant Pathology, Oklahoma State University

Climatological data for Oklahoma Panhandle Research and Extension Center, 2000.
Temperature Precipitation Wind Month Max Min Max.
mean Min. mean
2000 Inches
Long term mean
One day total
AVG mph
Max mph
Jan 71 9 52 22 0.20 0.30 0.15 11.0 51.4 Feb 79 15 62 29 0.05 0.46 0.04 13.1 59.2 March 77 23 58 33 5.39 0.95 1.50 12.6 57.0 April 90 25 71 40 1.93 1.33 1.09 14.3 52.6 May 99 35 82 51 1.01 3.25 0.28 13.8 81.2 June 96 50 86 60 2.29 2.86 0.51 14.0 68.6 July 103 59 95 66 0.76 2.58 0.37 12.2 58.7 Aug 104 58 98 66 1.09 2.28 0.57 12.3 60.1 Sept 104 29 90 56 0.03 1.77 0.02 13.6 47.4 Oct 96 29 70 46 5.68 1.03 1.77 11.9 49.9 Nov 66 15 51 25 0.02 0.77 0.01 11.2 44.8 Dec 63 4 43 18 0.14 0.31 0.12 11.7 63.9
Annual total 71.5 42.7 18.59 17.9 NA NA NA Data from Mesonet Station at OPREC
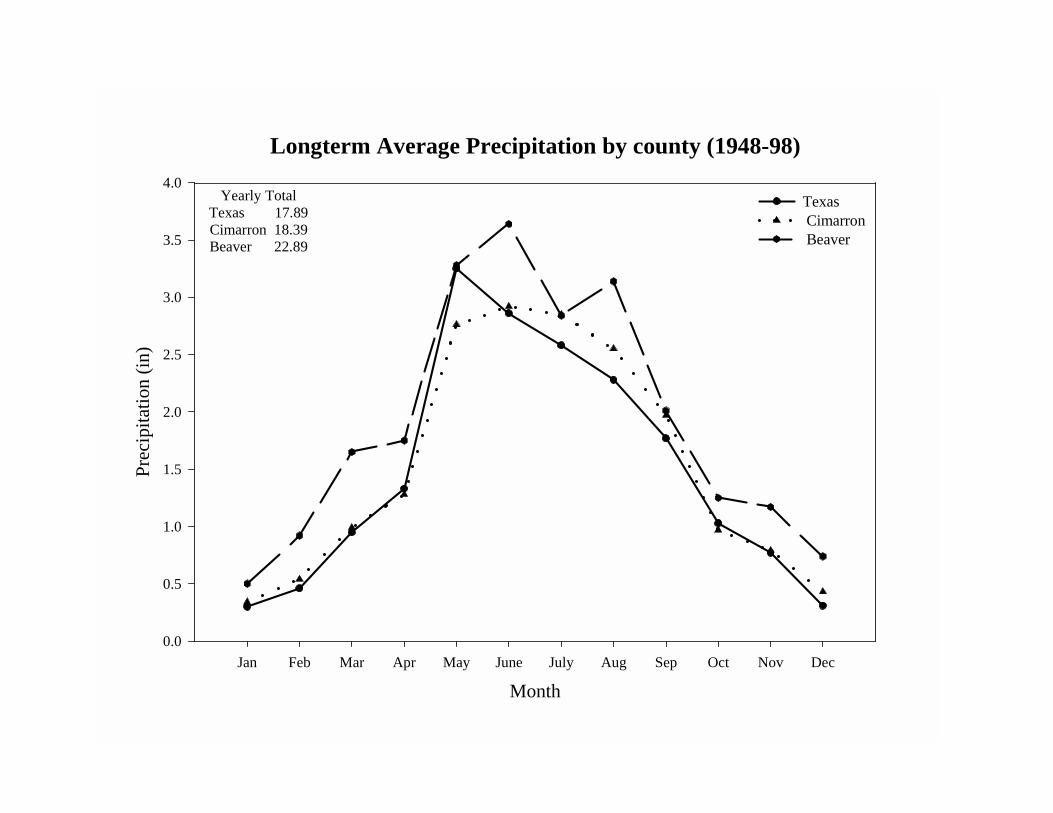
Longterm Average Precipitation by county (1948-98)
MonthJan Feb Mar Apr May June July Aug Sep Oct Nov Dec
Prec
ipita
tion
(in)
0.0
0.5
1.0
1.5
2.0
2.5
3.0
3.5
4.0Texas Cimarron Beaver
Yearly TotalTexas 17.89Cimarron 18.39Beaver 22.89

2,987 TOTAL EVENTS
BEAVER COUNTY 1948-99
RAINFALL (inches).01-.24 .25-.49 .50-1.0 1.0-2.0 > 2.O
PER
CEN
T O
F EV
ENTS
0
10
20
30
40
50
60
70
1767
542442
18551
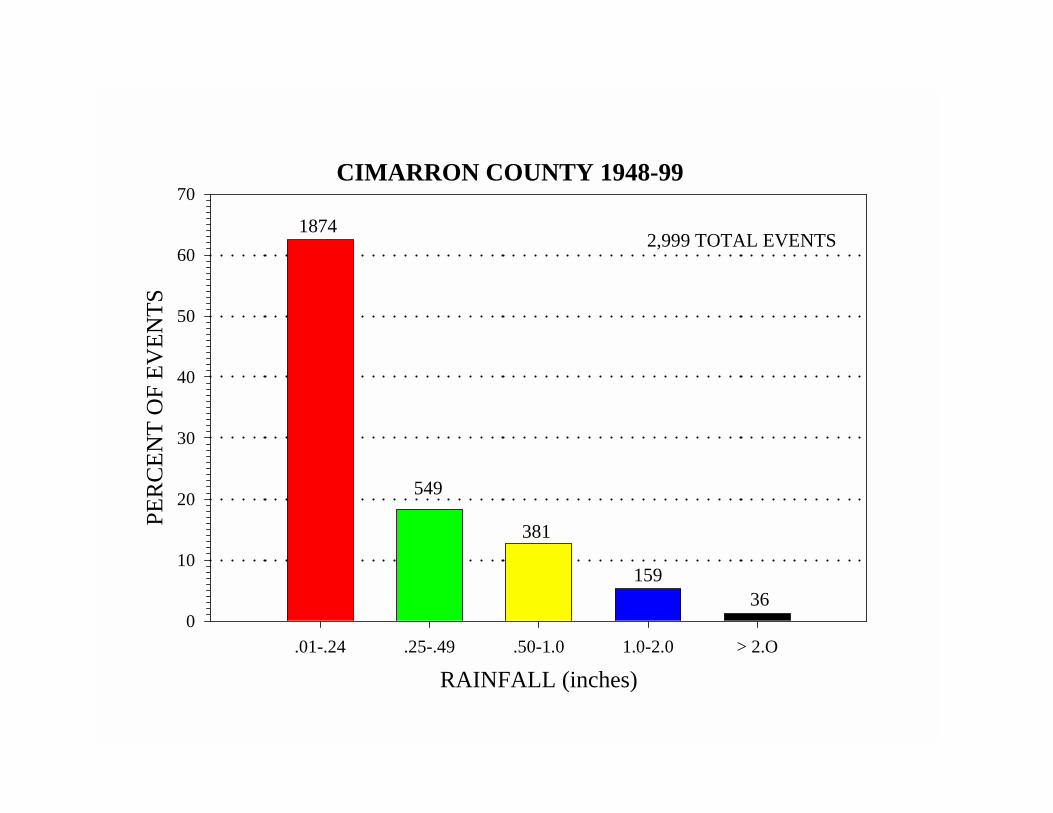
CIMARRON COUNTY 1948-99
RAINFALL (inches).01-.24 .25-.49 .50-1.0 1.0-2.0 > 2.O
PER
CEN
T O
F EV
ENTS
0
10
20
30
40
50
60
70
1874
549
381
15936
2,999 TOTAL EVENTS

TEXAS COUNTY 1948-99
RAINFALL (inches).01-.24 .25-.49 .50-1.0 1.0-2.0 > 2.O
PER
CEN
T O
F EV
ENTS
0
10
20
30
40
50
60
701835
479341
176
25
2,856 TOTAL EVENTS

Oklahoma Panhandle Research & Extension Center 2000 Research Highlights
Animal Waste Buffalograss Fertilization with Animal Manures .................................................. 1 Effects of Long-Term Swine Waste Application in Forage
Production Systems................................................................................................ 2 Crops Corn Planting Date................................................................................................. 6 Genetic Improvement and Variety and Variety Development in Winter Wheat: Relevance to the Oklahoma Panhandle .................................................... 9 Greenbug IPM Research ...................................................................................... 11 Irrigated Crop Rotation 2000............................................................................... 13 Irrigated Wheat for Forage and Grain Experiment .............................................. 14 Narrow Row Soybean Weed Control .................................................................. 16 No-Till vs Minimum-Till Dry-Land Crop Rotations........................................... 18 Soybean Planting Date 2000................................................................................ 20 Soybean Planting Rate 2000 ................................................................................ 21 Soil Fertility
Effect of Nitrogen and Residue Management on Yield and Grain Nitrogen Uptake of Irrigated Corn...................................................................................... 22
Improving Fertilizer Nitrogen Use Efficiency Using Alternative Legume Interseeding in Continuous Corn ......................................................................... 27

1
Progress Report
Buffalograss Fertilization with Animal Manures
Tim Springer USDA, ARS, SPRRS
2000 18th Street Woodward, OK 73801
An experiment was continued evaluating animal manure on irrigated buffalograss. The
manure sources evaluated were solid cattle manure (SCM), liquid swine manure (LSM),
composted dairy manure (CDM), and inorganic nitrogen fertilizer (IOF) applied at three
rates (0, 60, and 120 kg/ha) on 19 May and 17 July 2000. Two forage harvests were
taken during the growing season and forage height was measured before each harvest.
Plots were harvested on 14 July and 16 October 2000. Significant differences (P<0.01)
in average forage height was found for manure sources (P<0.01; IOF, 21 cm; LSM, 21
cm.; CDM, 18 cm; SCM, 18 cm.) and manure application rates (P<0.05; 0, 17; 60, 20,
and 120, 23.) Significant differences in season total forage dry matter (DM) production
was found for manure application rates (P<0.01; 15,460 kg/ha DM at 120 kg/ha
application rate; 11,650 kg/ha DM at 60 kg/ha application rate; and 7,770 kg/ha DM at 0
application rate). A year by application rate interaction was found for DM production
when data were combined over the last three years (P<0.01). Similar DM production
across treatments in the year after establishment (1998) accounted for the interaction.
Manure source (P>0.45) and manure source by application rate interactions (P>0.11)
were absent for forage DM production when years were combined.
Other publication on fertilization of buffalograss: Springer, T.L. 2000. Utilization of animal manure for the production of buffalograss in
the southern High Plains. Southern Pasture Crop Improvement Conference Proceedings,
June 12-14, 2000, Raleigh, NC.
Springer, T.L. and C.M. Taliaferro. 2001. Nitrogen fertilization of buffalograss. Crop
Science 41:139-142
2
EFFECTS OF LONG-TERM SWINE WASTE APPLICATION IN FORAGE
PRODUCTION SYSTEMS J. Parton, C. Turner, R Kochenower, J. Warren and J. Hattey.
OBJECTIVES 1. To evaluate warm-season and cool-season forage production in the southern Great
Plains region when managed for high yield potential as part of a swine waste management program.
2. Evaluate the effects of long-term land application of swine waste on biological, chemical and physical properties of the soil.
INTRODUCTION Livestock production is an important component of agriculture production in the Oklahoma panhandle. Current livestock production includes beef, dairy, and swine. Therefore an effort is important to evaluate integration of the livestock production systems through the use of swine effluent applications to forage production systems. To efficiently utilize forages and swine effluent in a production system, a combination of warm-season and cool-season grasses would be ideal. For the first objective, warm-season grasses and cool-season grasses suitability will be evaluated for swine waste-nutrient management program in the southern Great Plains. Each of the forage species selected have proven to be productive in various management systems but none have been evaluated for the benefit of high yielding systems in the southern Great Plains. Selected cultivars of each of these forages will be established in small plots to determine their cold tolerance, limitations, persistence and response in high yield potential systems. PROCEDURE Forage plots were established during the 1998-growing season with soil samples collected prior to establishment of the plots. Cool-season and warm-season perennial grasses were selected. Warm-season grasses were bermudagrass (Midland Cynodon dactylon (L.) Pers.), and buffalograss (Bison, Buchloe dactyloides (Nutt.) Engelm.). Perennial cool-season grasses selected were pubescent wheatgrass (Luna, Thinopyrum intermedium (Host) Barkworth and Dewey), and orchardgrass (Paiute, Dactylis glomerata L.). During the 1999 growing season, N was applied at 0, 50, 150 and 450 lb. N ac-1 as swine effluent or urea. Forages were harvested as needed during the growing

3
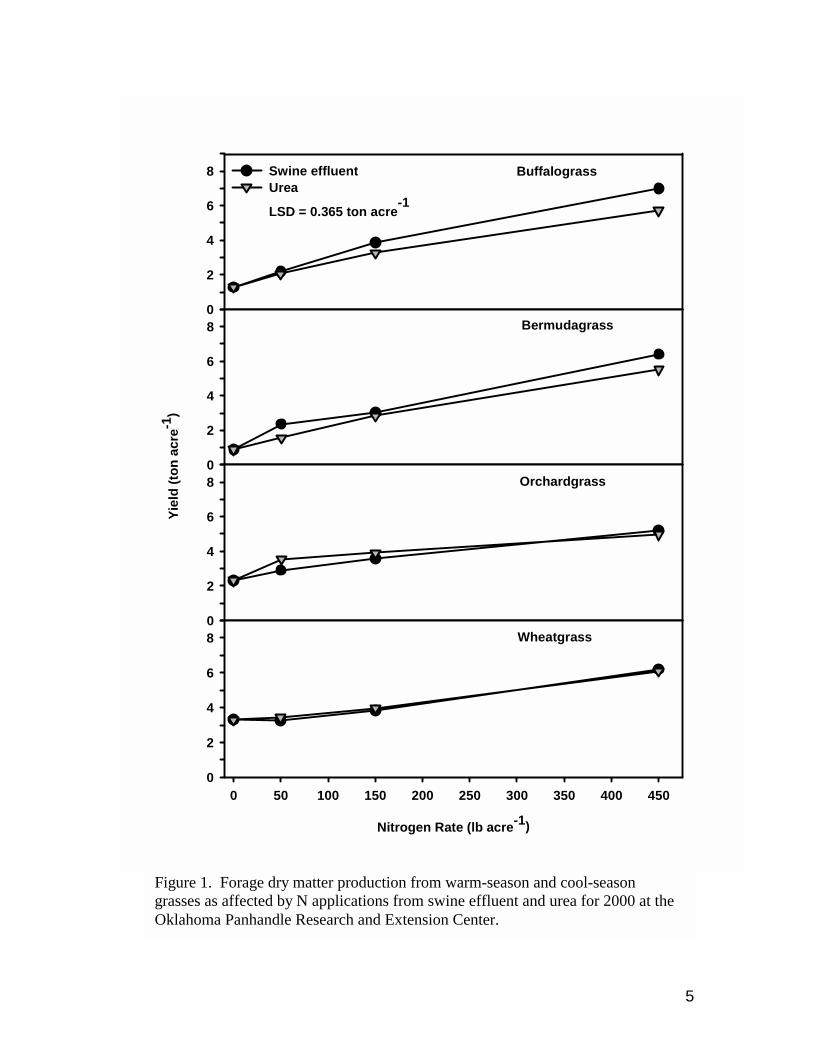
season to determine yields. Plot establishment for this experiment was 3x6 m plots with borders separating plots and replications to minimize effluent movement between plots. RESULTS Forage yields for 2000 indicate that there was a significant difference among forage species with production increasing as the quantity of N applied increased regardless of the source. The response of all forage species was linear suggesting that yields would continue to increase with added N (Fig.1). The greatest yields averaged across swine effluent and urea was observed for buffalograss, followed by bermudagrass and wheatgrass from N added at 450 lb. ac-1 with 7.0, 6.4, and 6.2 ton ac-1 respectively. The level of production for buffalograss was higher in both 1999 and 2000 indicating that these high production levels can be maintained. These yield levels will continue to be evaluated for several years establishing long-term results. These forage plots were established during 1998, and in 2000 ragweed (Ambrosia), kochia [Kochia scoparia (L.) Schrad.] and pigweed (Amaranthus) had invaded increasing with nitrogen rate increases. Dry matter yields were harvested so that only the desired forage was harvested. Management for weed species is in forage systems is currently being evaluated. Loss of stand has been monitored for the two years and in a monoculture cropping system they have done well. Research in mixed forage systems has shown that buffalograss is out competed in dual forage cropping systems (Richard, C.E. and E.F. Redente. 1995). This is especially true for buffalograss, a native species to the southern Great Plains but generally not included in intensive management systems. Figure 1 shows that buffalograss outperformed bermudagrass at all levels of N applied with exception of the 50 lb N ac-1 applied using swine effluent. Although buffalograss has constantly out performed bermudagrass they were very similar in their response to swine effluent applications. A similar response was observed with the cool season species where wheatgrass consistently responded to added N with yields greater than orchardgrass. Annual production from the warm season buffalograss and cool season wheatgrass indicate they were comparable for total production. This would suggest that a grazing system developed to utilize these forages during their optimum growing season could decrease the time period for supplemental feeding. Comparison of N sources indicated that there is no significant difference between swine effluent and urea for these grasses. All grasses responded similar, which is valuable to know. Previous work at the Oklahoma Panhandle Research Extension Center found that
a significant quantity of NH3 could volatilize from swine effluent application to fallow soils. From the two years of work it appears that it is not the case when applied to the forages. It must be noted that this is only two years of data and it is still to be determined if the trend will continue. But the prospects of a sustained production system are encouraging. A comparison of the warm season forages indicates that there was a significant difference in yield between buffalograss and bermudagrass (Table 1) for 1999. That difference between forages was not significant in 2000 due to failure of an irrigation system that limited water supply to the study during a 21-day period of August 2000. For the cool-season species, Wheatgrass consistently yielded more than Orchardgrass for both years. FUTURE WORK Forage harvest will continue on a seasonal bamonitored. In addition, soil samples will bmeasure biological changes in soil environmenC and readily available nutrients. Other soil phosphorus loading, soil organic carbon and sasoils will be movement of salts at various depof evapotranspiration in this semiarid environmof salt accumulation in the upper portion of theof salt accumulation in the profile will limiconcern in this agroecosystem. Physical pstructure, and water infiltration. Acknowledgements: The authors thank the support of USDA, GAgricultural Experiment Station for support of
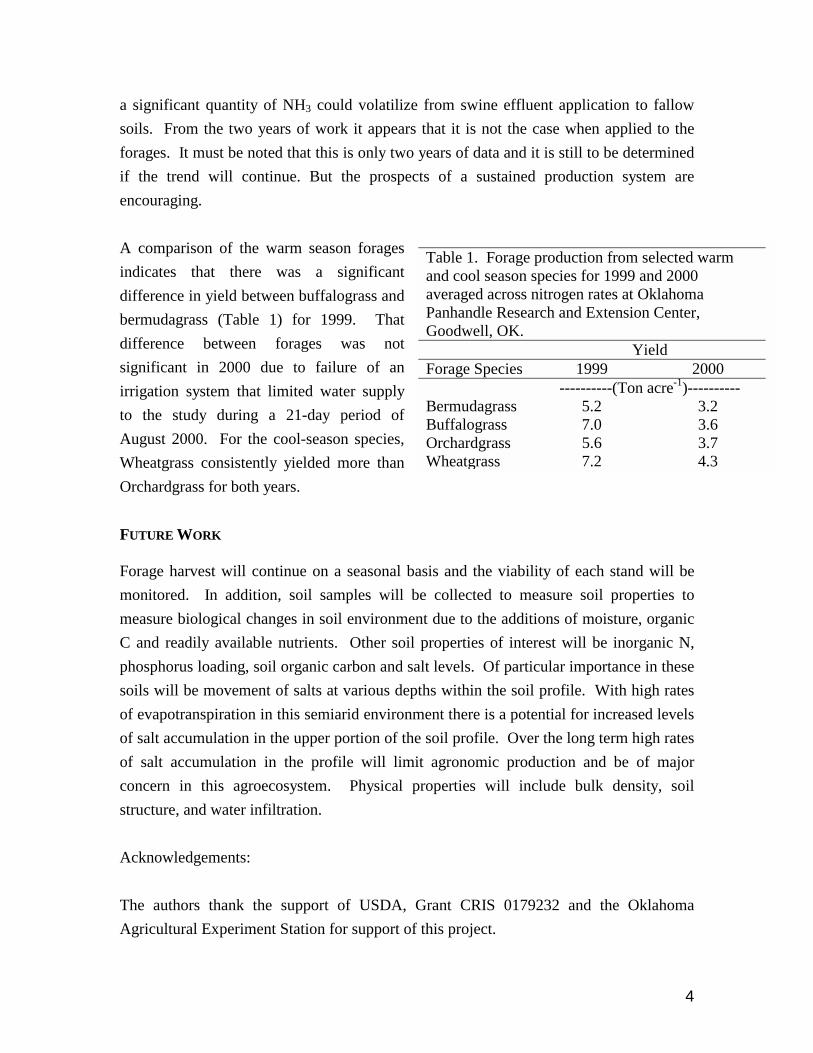
Table 1. Forage production from selected warm and cool season species for 1999 and 2000 averaged across nitrogen rates at Oklahoma Panhandle Research and Extension Center, Goodwell, OK. Yield Forage Species 1999 2000 ----------(Ton acre-1)---------- Bermudagrass 5.2 3.2 Buffalograss 7.0 3.6 Orchardgrass 5.6 3.7 Wheatgrass 7.2 4.3
4
sis and the viability of each stand will be e collected to measure soil properties to t due to the additions of moisture, organic properties of interest will be inorganic N, lt levels. Of particular importance in these ths within the soil profile. With high rates ent there is a potential for increased levels soil profile. Over the long term high rates t agronomic production and be of major roperties will include bulk density, soil
rant CRIS 0179232 and the Oklahoma this project.
5
BuffalograssYi
eld
(ton
acre
-1)
0
2
4
6
8
Bermudagrass
0
2
4
6
8
Swine effluentUrea
LSD = 0.365 ton acre-1
Orchardgrass
0
2
4
6
8
Wheatgrass
Nitrogen Rate (lb acre-1)
0 50 100 150 200 250 300 350 400 4500
2
4
6
8
Figure 1. Forage dry matter production from warm-season and cool-season grasses as affected by N applications from swine effluent and urea for 2000 at the Oklahoma Panhandle Research and Extension Center.

6
Corn Planting Date Rick Kochenower, Oklahoma Panhandle Research and Extension Center, Goodwell
Previous research has reported that planting corn before the optimum date reduces
yields less than planting after the optimum date (Fig. 1). Therefore, in April 2000 a study
was initiated to determine the effect of planting date and starter fertilizer on corn ensilage
and grain yield. Six planting dates were selected April (1, 10, 20, 30) and May (10 and
20). On each selected date corn was planted with and without a starter fertilizer (5 gal/ac
10-34-0) in the row. Nitrogen level was 250 lb/ac (soil test level + applied), 40 lbs/ac P2
O5 was applied based on soil test requirements, and K was sufficient. The hybrid DK
647BtY was planted in four 30-inch rows by 30 feet long plots with an average plant
population of 28,500 plants per acre. Ten feet of one outside row was harvested for
ensilage production and the two middle rows were harvested for grain production.
P L A N T I N G D A T E
2 w e e k s e a r l y o p t i m u m 1 0 d a y s 2 0 d a y s 3 0 d a y s
PE
RC
EN
T Y
IEL
D
6 5
7 0
7 5
8 0
8 5
9 0
9 5
1 0 0
1 0 5
Figure 1. Ten years of grain yields at Lansing, Michigan. Source modern corn production
Results
Starter fertilizer did not affect ensilage or grain yield (Fig. 2 and 3). An April 24
hailstorm slowed growth of corn planted on April 1 and 10. Ensilage and grain yields
were not statistically different for planting dates April 1 until April 30. Later planting
reduced both ensilage and grain yields. Test weight was affected by planting date more
strongly than either ensilage or grain yields with the highest test weight occurring prior to
April 20 (Table 1). In 2000, planting as early as April 1 did not reduce yield or test

7
weight as expected from the Michigan data. This may have been because the earliest date
(April 1) is not too early for optimum yield. The unusually warm temperatures of spring
2000 were likely responsible and results may differ in subsequent years with different
environmental conditions. Several more years of data are needed to determine the
optimum planting date ensilage and grain yields.
P l a n t i n g d a t e
A p r i l 1 A p r i l 1 0 A p r i l 2 0 A p r i l 3 0 M a y 1 0 M a y 2 0
En
sila
ge
yie
ld (
ton
/ac
)
0
5
1 0
1 5
2 0
2 5
3 0
Figure 2. Ensilage yields from corn planting date 2000.
P l a n t i n g d a t e
A p r i l 1 A p r i l 1 0 A p r i l 2 0 A p r i l 3 0 M a y 1 0 M a y 2 0
Gra
in Y
ield
(b
u/a
c)
0
2 0
4 0
6 0
8 0
1 0 0
1 2 0
1 4 0
Figure 3. Grain yields from corn planting date 2000.

8
Table 2. Grain yields and test weights from planting date study 2000. PLANTING
DATE STARTER
FERTILIZER TEST
WEIGHT LB/BU DRY MATTER %
April 10 Yes 58.3a 0.379ab April 1 Yes 57.8a 0.387a
April 10 No 57.0ab 0.376ab April 1 No 56.5abc 0.372abc
April 20 No 56.5abc 0.344cd April 20 Yes 55.8bc 0.357bc April 30 No 55.5bc 0.327de April 30 Yes 54.8c 0.311e
May 10 No 52.5d 0.316de May 10 Yes 52.5d 0.311e May 20 No 51.3d 0.263f May 20 Yes 50.8d 0.271f
Mean 54.9 0.334 CV % 2.5 6.1 LSD 2.0 0.029
Note: Means with different letters are significantly different at the 0.05 level. Harvest date: Ensilage August 14, 2000; Grain September 8, 2000

9
GENETIC IMPROVEMENT AND VARIETY DEVELOPMENT IN WINTER WHEAT: RELEVANCE TO THE OKLAHOMA PANHANDLE
Brett Carver, Wheat Breeding Project Leader Dept. of Plant and Soil Sciences, Stillwater
The Wheat Improvement Team
Wheat variety development research at Oklahoma State University rests in the hands of the Wheat Improvement Team, comprising scientists with expertise in breeding and genetics, genomics, pathology, entomology, management, physiology, biotechnology, and cereal chemistry. This team has adopted the unified goal to develop hard red and hard white winter varieties with marketable grain quality and specific adaptation to all wheat-production zones in Oklahoma. OSU Wheat Breeding
The core breeding program can be divided into three phases, from early to late in the 10-year breeding cycle: i) parent hybridization and seed increase, ii) identification of worthy breeding populations and lines within populations, and iii) statewide testing of breeding lines. The earlier phases, identified as (i) and (ii), receive heavy emphasis on selection under early-planting conditions, with the intent to provide Oklahoma wheat producers with varieties better adapted to dual-purpose management systems. Thus, all breeding materials up through the F6 generation (six generations following the last cross) are planted early to accommodate either cattle grazing or mechanical removal of forage. Much of that work is conducted in central Oklahoma (Stillwater and at the Wheat Pasture Center near Marshall). Breeding lines in subsequent generations are evaluated in two clusters of sites distinguished mostly by disease pressure, specifically leaf rust: Western cluster (Goodwell, Sweetwater, and Altus), and Central cluster (Lahoma, Enid, Marshall, Ft. Cobb, and Stillwater). Field selection encompasses a myriad of agronomic traits, but four which are emphasized most include: i) leaf rust resistance, ii) wheat soil-borne mosaic virus resistance, iii) adaptation to low-pH soils, and iv) adaptation to a dual-purpose system. Weakness in any one of these must be compensated by exceptional strengths in other traits. With regard to physical grain quality, test weight receives highest priority due to its importance in grain grading and its perceived relationship to milling quality.

10
Importance of the Oklahoma Panhandle to OSU Wheat Breeding The Oklahoma Panhandle offers a unique environment to the mix of target
environments for which selection is intended. With reduced pressure from foliar diseases more common in central Oklahoma, the full genetic potential of a given variety is often expressed in grain production, provided that irrigation is supplied in optimal amounts. Thus, irrigated breeding trials, located at Goodwell, provide critical information on “yield potential” of breeding lines, reflecting the upper range of performance. Without irrigation, grain production is primarily limited by drought stress, reflecting the lower end of the yield distribution. Yield potential, however, only partially explains performance under drought. Thus, our breeding strategy is to identify and select lines having improved yield potential in irrigated trials and improved water-use efficiency or drought tolerance in dryland trials, before they are promoted for release.
The Oklahoma Panhandle Research and Extension Center provides a critical site
for determining genetic variability under both irrigated and dryland conditions. Approximately 1,071 field plots under irrigated and 918 plots under dryland conditions are currently dedicated to advanced breeding line evaluation at the Center. In addition, one USDA-ARS sponsored regional nursery, containing candidate cultivars from public and private breeding programs throughout the Great Plains, is evaluated annually, and the results are used to base selection decisions in this program. The Southern Regional performance nursery, features lines with wider adaptation to central and western regions of the southern Great Plains. The results are distributed to breeding programs throughout the region, and they are posted on the Wheat Improvement Team’s website at: http://clay.agr.okstate.edu/wheat/regnurs.html.
Finally, the Center serves another function by supplying a high-yielding
environment for breeder seed multiplication of candidate cultivars currently under consideration for release. Four such cultivars are under increase, including OK96717-99-6756 (Abilene/2180//Chisholm), OK94P549-99-6704 (HBY756A/Siouxland//2180), OK97508 (2174/Cimarron), and OK98680 (Odessa 06/Mesa). All candidate cultivars appear well suited for the Panhandle region and are available for observation by visitors to the Center.

11
Greenbug IPM Research
Gerritt Cuperus, Kris Giles, and Tom Royer, Department of Entomology and Plant Pathology, Oklahoma State University, Stillwater
Norm Elliott and Dean Kindler, USDA-ARS Plant Science and Water Conservation Research Laboratory, Stillwater
David Waits, SST Development Group, Inc., Stillwater.
The goal of the greenbug IPM project is to develop better tools for managing
greenbugs in winter wheat. The project involves developing sampling methods and
economic thresholds for the greenbug in winter wheat that are valid throughout
Oklahoma, and developing an expert system to help growers determine when and how
they should manage greenbug infestations in winter wheat fields.
This year we report on progress towards developing improved economic thresholds
for the greenbug in winter wheat fields in Oklahoma. This is the third year of studies at
four locations: Goodwell, Stillwater, Chickasha, and Tipton to establish improved
economic thresholds. We achieved good infestations of greenbugs in our experimental
plots this autumn at Goodwell, Stillwater, and Chickasha, but not at Tipton. Data for the
statewide study are still being processed so we cannot report our results. However,
results are available for a 4-year study conducted at Stillwater prior to initiating the
statewide project. The Stillwater study yielded several interesting results. First, all
greenbug susceptible winter wheat cultivars tested (‘Karl’, ‘Karl-92’, ‘2137’, and ‘2163’)
suffered the same amount of yield loss for a particular number of greenbugs per tiller.
Second, the same amount of yield was lost for a particular number of greenbugs per tiller
regardless whether greenbugs infested the wheat in autumn or in spring. This result
probably would not hold for heavy infestations in seedling wheat; but heavy infestations
prior to the onset of tillering are unusual in Oklahoma so our results apply to the situation
that typically occurs in winter wheat in Oklahoma. Third, the amount of yield lost to
greenbugs when wheat is under drought stress is about twice that lost when moisture
conditions are adequate.
A model was developed to predict the amount of yield lost in relation to the number
of greenbugs per tiller in a wheat field. The model is meant for use in conjunction with

12
sampling using recently developed methods (Giles et al. 2000) to determine the number
of greenbugs per tiller for the field. The yield loss model is:
Bushels per acre yield loss = 0.22 x (the number of greenbugs per tiller), under
conditions of adequate soil moisture.
Bushels per acre yield loss = 0.51 x (the number of greenbugs per tiller), under
drought conditions.
The model needs to be tested at various locations in the state and modified if
necessary. We hope our research at Goodwell will allow us to verify that the model
works for wheat grown in the Panhandle or will allow us to modify the model so that it
works under Panhandle conditions. Once we have tested the model, it can be used in
conjunction with sampling to make economically justified control decisions for
greenbugs in winter wheat.
References
K. L. Giles, T. A. Royer, N. C. Elliott, and S. D. Kindler. 2000. Binomial sequential
sampling of the greenbug in Oklahoma winter wheat. Journal of Economic Entomology 93:1522-1530.

13
IRRIGATED CROP ROTATION 2000 Rick Kochenower, Oklahoma Panhandle Research and Extension Center, Goodwell
In 1999, an irrigated crop rotation study was established to determine if the crop
rotation effect reported by researchers in dry-land systems exist under a high yield
environment. In 2000, problems with insects, birds, and water well were encounter so
data was not collected but will be collected in 2001. Researchers at Kansas State
University have reported 12 bu/ac yield increases in grain sorghum rotated yearly with
soybeans when proper fertilization is used (Gordon, B., et al., 1999). Researchers at the
University of Minnesota have reported yield increases of 12% (138 vs. 122 bu/ac) in corn
rotated with soybeans when compared to continuous corn (Porter, P.M., et al., 1997).
The crop rotation effect is not clearly understood and has many possible explanations.
What is understood are the benefits in weed management, breaking of insect and disease
cycles, improved soil physical properties, and increased water use efficiency. Rotations
include corn-soybean, corn-sorghum, sorghum-soybean, along with continuous corn,
soybeans, and grain sorghum. Plot size is 10 feet by 30 feet long, planted with a John
Deere 1710 Maxemerge 4-row 30-inch planter. Plots will be harvested for grain yield
with a Massey-Ferguson 8 plot combine. Yields will be collected to evaluate if the crop
rotation effect does exist in an irrigated cropping system.
References:
Gordon, B., D. Whitney, and R. Lamond. 1999. Grain Sorghum Nutrient Management in Reduced Tillage Systems. Proceeding of the 21st Biennial Grain Sorghum Research and Utilization Conference. p 8-10. Porter, P.M., J.G. Lauer, W.E. Lueschen, J.H. Ford, T.R. Hoverstad, E.S. Oplinger, and R.K. Crookston. 1997. Environment effects the corn and soybean rotation effect. Agron. J. 89:442-449.
14
IRRIGATED WHEAT FOR FORAGE AND GRAIN EXPERIMENT Rick Kochenower, Oklahoma Panhandle Research and Extension Center, Goodwell
Gene Krenzer, Dept. of Plant and Soil Sciences, Oklahoma State University, Stillwater
Irrigated wheat is planted in the panhandle region each year to utilize fall forage
for cattle as well as harvest grain the next spring. In the fall of 2000, an experiment was
initiated to determine the effects of seeding rate, planting date, and variety on fall forage
and grain production. Three seeding rates were used 60, 120 and 180 pounds per acre.
Three widely grown Hard Red Winter Wheat varieties (HRW) (TAM 107, Custer, and
Jagger) and a recently released Hard White Winter Wheat (HWW) (Intrada) from
Oklahoma State University were used. Plots where 5 feet wide by 22 feet long planted
with a Hege plot planter. Planting dates were September 1, October 1, and November 1.
The September 1 planting date coincides with planting wheat following corn ensilage
production. The October 1 planting date is reflective of planting wheat following corn
for grain harvest. The November 1 planting date was selected to determine grain
production on late-planted wheat. Forage from the September 1 planting date was
harvested on October 12, and November 1. Forage from the October 1 planting date was
harvested on December 15. The September 1 planting date was scheduled to be
harvested again on December 15, but cold temperatures in November stopped growth.
Three feet of row from each end of a plot was hand clipped to soil surface and placed in
drying oven for 48 hours to determine forage production. Plots were then mowed with a
5-foot finishing mower to simulate forage removal by grazing. After mowing, the
September 1 planting area that was hand clipped was marked so same area could be hand
clipped again for later harvest.
Results
There were no differences in forage yields associated with varieties for the
September 1 planting date, therefore the reported forage yields are an average of all
varieties. Seeding rate and planting date has the largest impact on fall forage production
(Fig. 1). The 180 lb/ac seeding rate and the September 1 planting date resulted in the
highest forage production at 2,790 lbs/ac of dry matter. The 180 lb/ac seeding rate will
also allow earlier grazing due to increased early forage production (Fig. 2). Grain will be

15
harvested in June to determine if seeding rate, planting date, and forage removal effects
grain yield.
Seeding rate (lb/ac)
60 120 180
Fora
ge y
ield
(lb
/ac)
0
500
1000
1500
2000
2500
3000SEPT 1 OCT 1
Figure 1. Total fall forage harvested by December 15 for selected seeding rates and dates.
S eed in g ra te ( lb /ac )
6 0 1 20 1 80
For
age
yiel
d (l
b/ac
)
0
1 00
2 00
3 00
4 00
5 00
6 00
7 00
8 00
9 00
1 00 0
1 10 0
1 20 0
Figure 2. Forage for September 1 planting date when harvested October 12.

16
Narrow Row Soybean Weed Control M.L. Wood
Oklahoma Panhandle Research and Extension Center An experiment was initiated to evaluate fifteen herbicide treatments in a Roundup Ready soybean system. The experiment was located on the Oklahoma Panhandle Research and Extension Center, near Goodwell, Oklahoma. Experimental design included four replications in a randomized complete block design with plots that were 10 ft wide (eight 15” rows) by 30 ft long. Plots were planted on June 19, in a Richfield clay loam with a pH of 7.1 and an organic matter content of 0.78%. Planting population was 150,000 seeds/acre using Asgrow 4602 Roundup Ready soybean seed. Treatments were herbicides applied alone or in a tank mix as a pre-emergent (PRE), early post (EPOST), or a mid post (MPOST), and an untreated check. Treatment particulars are listed in (Table 1). Target weed species for the experiment were Johnsongrass represented by the five-letter code (SORHA) and large crabgrass (DIGSA). Harvest data was not evaluated due to a late hailstorm coupled with the irrigation well going down in August. Data that were evaluated include crop injury and weed control listed in (Table 2). Table 1. Herbicide application data including: date, timing, weed size at application and rating. Application type Date applied [mm/dd/yy] Incorporation equipment Incorporation depth [in] Air/Soil temperature [F] Relative humidity [%] Wind [mph, direction] Weather [sunny, etc.] Soil moisture Crop stage/Height Sprayer type/mph Nozzle type/Size Boom ht/# Noz/spacing in) GPA/Psi Applied by
PPI1
06/19/00 Field Cultivator 2” 85/78 Low 12.5, S>N Ptly. Clody High N/A Cub/4 FF/XR11003VS 16”/6/20” 15.5/25 MLW
PRE2
06/19/00 N/A N/A 87/79 Low 12.5, S>N Ptly. Cloudy High N/A Cub/4 FF/XR11003VS 16”/6/20” 15.5/25 MLW
EPOST3
07/17/00 N/A N/A 73/82 Moderate 6, S>N Hazey High V3/6-8” Cub/4 FF/XR11003VS 16”/6/20” 15.5/26 MLW
MPOST4
07/26/00 N/A N/A 78/81 Low 0, N/A Clear High V4/8-10” Cub/4 FF/XR11003VS 16”/6/20” 15.5/26 MLW
Rainfall (in) 0-24 hr/1-3 days 4-7 days/2nd week 3rd week/4th week
0.00/0.19 0.66/0.27 0.13/0.00
0.00/0.19 0.66/0.27 0.13/0.00
0.01/0.12 0.00/0.00 0.00/1.33
0.00/0.00 0.00/0.00 0.00/1.33
Weed species ----- population/height/# leaves ------ SORHA DIGSA
N/A N/A
N/A N/A
3-4/sqft/6-10”/4-8 1-2/5ft/8”-heading
3-4/sqft/12”/4-8 1-2/5ft/8”-heading
Weed size at rating-----Species/rating/height/# leaves/density Johnsongrass Large crabgrass SORHA/4 WAP/6-10”/4-8/3-4/sqft DIGSA/4 WAP/8-10”/heading/1-2/5ft /8 WAP/30-36”/heading/2-3/sqft /8 WAP/8-10”heading/1-2/5ft
1PPI-pre-plant incorporated. 2PRE-represents pre-emergent. 3EPOST-represents early post emergent. 4MPOST-represents mid post emergent.

17
Table 2. Percent crop injury and weed control four weeks and eight weeks after planting. Crop
Injury SORHA Control
DIGSA Control
SORHA Control
DIGSA Control
Rating Date 7-26-00 7-26-00 7-26-00 8-18-00 8-18-00 # Treatment Conc. &
Type Rate Appl.
Code % % % % %
1 Pendimax/ Roundup Ultra + Ammonium Sulfate
3.3 EC 3 SL
S
1 QT/A 1 QT/A
2 % W/W
PPI MPOST
4 abc1 86 abc 98 ab 100 a 100 a
2 Prowl/ Extreme + NIS + Ammonium Sulfate
3.3 EC 2.17 EC
L S
1 QT/A 1.5 QT/A
0.125 %V/V 1.5 % V/V
PPI MPOST
1 bc 90 ab 100 a 100 a 100 a
3 Micro-Tech/ Roundup Ultra + Ammonium Sulfate
4 ME 3 SL
S
2 QT/A 1 QT/A
2 % W/W
PRE MPOST
0 c 49 d 100 a 93 b 100 a
4 Firstrate/ Roundup Ultra + Ammonium Sulfate
84 WG 3 SL
S
0.305 OZ/A 1 QT/A
2 % W/W
PRE MPOST
3 abc 73 bc 96 ab 99 a 100 a
5 Firstrate/ Roundup Ultra + Ammonium Sulfate
84 WG 3 SL
S
0.6 OZ/A 1 QT/A
2 % W/W
PRE MPOST
3 abc 80 abc 96 ab 98 ab 100 a
6 Boundary/ Roundup Original + NIS + Ammonium Sulfate
7.8 EC 3 SL
L S
1.25 PT/A 1.5 PT/A
0.5 % V/V 2 % W/W
PRE MPOST
0 c 65 cd 100 a 98 ab 100 a
7 Domain/ Roundup Original + NIS + Ammonium Sulfate
60 DF 3 SL
L S
10 OZ/A 1.5 PT/A
0.5 % V/V 2 % W/W
PRE MPOST
0 c 79 abc 100 a 100 a 100 a
8 Canopy/ Roundup Original + NIS + Ammonium Sulfate
75 DF 3 SL
L S
3 OZ/A 1.5 PT/A
0.5 % V/V 2 % W/W
PRE MPOST
6 ab 88 ab 90 c 100 a 100 a
9 Canopy XL/ Roundup Original+ NIS + Ammonium Sulfate
56.3 DF 3 SL
L S
3.41 OZ/A 1.5 PT/A
0.5 % V/V 2 % W/W
PRE MPOST
8 a 79 abc 94 bc 99 a 100 a
10 Extreme + NIS + Ammonium Sulfate
2.17 EC L S
1.5 QT/A 0.125 % V/V
1.5 % V/V
EPOST 4 abc 100 a 100 a 99 a 100 a
11 Roundup Ultra+ Ammonium Sulfate
3 SL S
1 QT/A 2 % W/W
MPOST ND2 ND ND 98 ab 100 a
12 Roundup Ultramax + Ammonium Sulfate
3.7 SL S
1.62 PT/A 2 % W/W
MPOST ND ND ND 98 ab 100 a
13 Firstate+ Roundup Original + NIS + Ammonium Sulfate
84 WG 3 SL
L S
0.6 OZ/A 1.5 PT/A
0.5 % V/V 2 % W/W
MPOST ND ND ND 99 a 100 a
14 Roundup Ultra + Ammonium Sulfate/ Roundup Ultra + Ammonium Sulfate
3 SL S
3 SL S
1 QT/A 2 % W/W
1 QT/A 2 % W/W
MPOST LPOST
ND ND ND 98 ab 100 a
15 Check N/A N/A N/A 0 c 0 e 0 c 0 b LSD (0.05) 6.1 21.4 5.8 5.5 0.0 CV 169.5 20.7 4.5 4.16 0.0 1Means followed by the same letter do no significantly differ (P=0.05, LSD) 2ND-represents no data. At time of rating treatment was not yet complete

18
NO-TILL VS MINIMUM-TILL DRY-LAND CROP ROTATIONS Rick Kochenower, Oklahoma Panhandle Research and Extension Center, Goodwell
In 1999, a study was started to evaluate four different dry-land cropping rotations
and two tillage systems for their long-term sustainability in the panhandle region.
Rotations include Wheat-Sorghum-Fallow (WSF), Wheat-Corn-Fallow (WCF), Wheat-
Soybean-Fallow (WBF), and Continuous Sorghum (CS). Tillage systems include no-till
and minimum tillage, all summer crops will be planted no-till following wheat. Wheat
will be planted no-till as well as with minimum tillage practices following summer crops.
Two maturity classifications were used with all summer crops in the rotations to
determine optimum maturity classifications. Most dry-land producers in the panhandle
region utilize the WSF rotation. Other rotations would allow producers flexibility in
planting, weed management, insect management, and marketing.
Results In both 1999 and 2000, precipitation for May through August was lower than the
long-term mean (Table 1). There was no difference in wheat yield in 2000 among
rotations or tillage treatments with a yield of 27 bushel per acre. Wheat yields were lower
than variety trials on the station, which are in a wheat-fallow-wheat rotation. The year
2000 was the first year of continuous grain sorghum and it was not harvested. With the
lack of precipitation the grain sorghum never headed out. Grain sorghum yields for 1999
were higher for full season hybrids, but the same for 2000 (Table 2). The low grain
sorghum yields for 2000 can be partially explained by less than desirable weed control.
The lack of precipitation did not allow for herbicide activation. Corn yields have been
higher for the 112-day corn than the 108-day corn, however yields from either would not
be economically feasible (Table 2). Soybean yields have been the same with both Group
III and Group IV soybean (Table 2). It appears after two years of the study that the WSF
rotation is best suited for the panhandle region, however if in succeeding years more
precipitation is received yield may improve for corn and soybean.
19
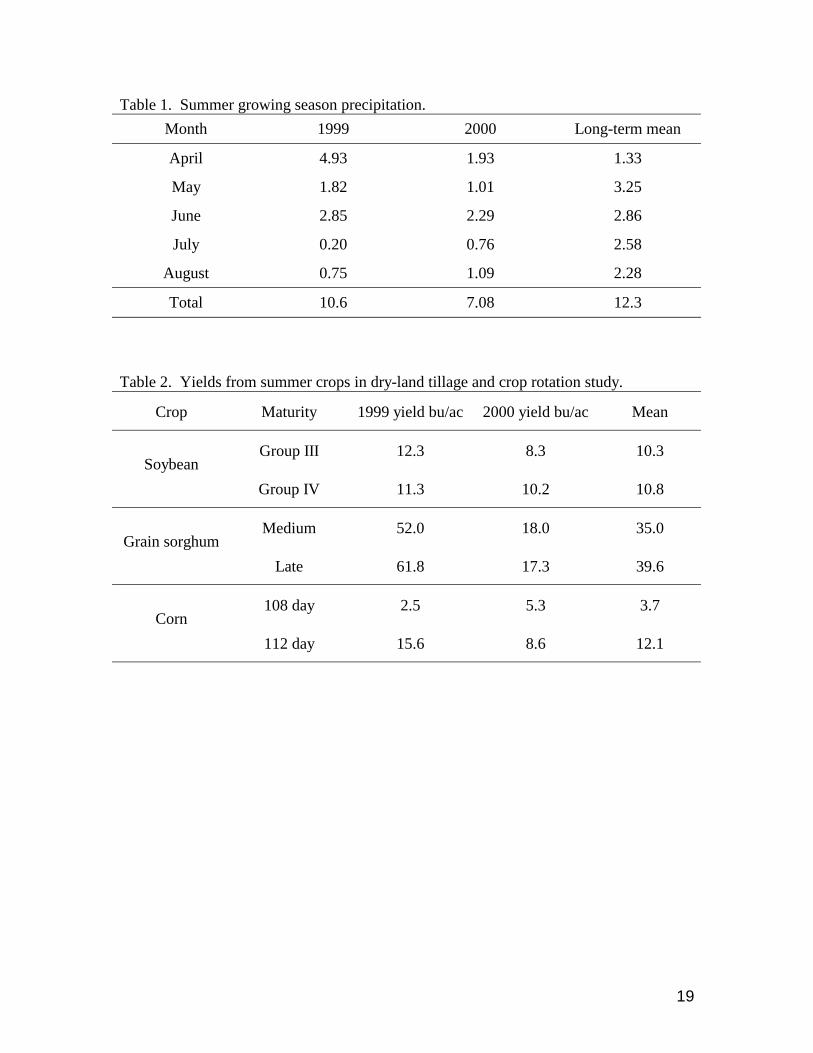
Table 1. Summer growing season precipitation. Month 1999 2000 Long-term mean
April 4.93 1.93 1.33
May 1.82 1.01 3.25
June 2.85 2.29 2.86
July 0.20 0.76 2.58
August 0.75 1.09 2.28
Total 10.6 7.08 12.3
Table 2. Yields from summer crops in dry-land tillage and crop rotation study.
Crop Maturity 1999 yield bu/ac 2000 yield bu/ac Mean
Group III 12.3 8.3 10.3 Soybean
Group IV 11.3 10.2 10.8
Medium 52.0 18.0 35.0 Grain sorghum
Late 61.8 17.3 39.6
108 day 2.5 5.3 3.7 Corn
112 day 15.6 8.6 12.1

20
SOYBEAN PLANTING DATE 2000 Rick Kochenower, Oklahoma Panhandle Research and Extension Center, Goodwell Ron Sholar, Dept. of Plant and Soil Science, Oklahoma State University, Stillwater
Soybeans are a crop with increasing interest among producers in the Oklahoma
panhandle. Previous soybean research concentrated mostly on variety selection through
variety trials at Oklahoma Panhandle Research and Extension Center (OPREC)
Goodwell, OK. Research was started in 1999, to determine optimum planting date for
irrigated soybeans for the region. Plots were 10 feet by 20 feet planted with a 4-row 30-
inch planter on 5 dates (Table 1). Asgrow AG4602RR was planted at a rate of 160,000
seeds per acre. In 1999, plots were harvested on October 18, with a Massey-Ferguson 8
plot combine to determine yield. Data was not collected in 2000 due to a hailstorm and
irrigation problems occurring the first two weeks of August. The month of May was the
optimum planting period 1999. The highest yields were realized on plots planted on May
15, 1999 (Table 1). Planting during the first two weeks of June also produced
acceptable yields. The June 15 planting date resulted in a yield of 45.7 bu/ac. When
planting after this date soybean plants do not have sufficient growth prior to the start of
flowering to produce a yield comparable with the earlier planting dates. The soybean is a
photoperiod sensitive plant, so when the length of sunlight changes flowering is initiated.
Additional research will be conducted to determine if maturity group selection will have
an effect on yields at different planting dates.
Table 1. 1999 Irrigated Soybean planting date study, OPREC, Goodwell, OK. Planting date Yield bu/ac Test wt lb/bu
May 5 60.5 54.0 May 15 72.5 54.8 June 1 60.1 55.3 June 15 45.7 53.6 July 2 33.9 51.3 Mean 54.5 53.8
LSD (0.05%) 8.6 2.3 CV 10.3 2.8

21
SOYBEAN PLANTING RATE 2000 Rick Kochenower, Oklahoma Panhandle Research and Extension Center, Goodwell Ron Sholar, Dept. of Plant and Soil Sciences, Oklahoma State University, Stillwater
Soybeans are a crop with increasing interest from producers in the Oklahoma
panhandle. Previous soybean research concentrated mostly on variety selection through
variety trials at Oklahoma Panhandle Research and Extension Center (OPREC)
Goodwell, OK. Research was started in 1999 to determine optimum planting rate for
irrigated soybeans for the region. In 1999, plots were 5 feet by 20 feet long planted with
a wheat drill with 7.5 inch spacing on June 1, at selected seeding rates (Table 1). In 2000
plots were planted May 15, with wheat drill with 7.5 inch spacing as well as with a 2-row
30-inch planter. The use of two row spacings is to determine if a difference in seeding
rate exist between row spacing. Asgrow AG4602RR, a Roundup Ready variety was
selected for planting. Plots were harvested on October 14, 1999 with a Massey-Ferguson
8 plot combine to determine yield. Data was not collected in 2000 due to a hailstorm and
irrigation problems occurring the first two weeks of August. Target populations, yield in
bushels per acre, number of seeds per acre planted, and seed cost associated with planting
rate are listed in (Table 1). In 1999, results show that a target population of 100,000
plants/ac produced a yield that was comparable to a target population of 250,000
plants/ac. No difference in yields existed between any of the seeding rates. Oklahoma
State University generally recommends a seeding rate of 140,000 - 160,000 seeds/ac to
insure an optimum plant population. Results from 1999 indicate this seeding rate is
adequate for the panhandle. Future research will look at seeding rates for optimum yields
with 7.5, 15, and 30 inch row spacing.
Table 1. 1999 Irrigated Soybean planting rate study, OPREC, Goodwell, OK. Target Population plants/ac Yield Bu/ac Seeds/ac planted Seed cost $/ac
100,000 54.3 125,000 16.79 125,000 52.8 156,250 20.98 150,000 55.5 187,500 25.19 175,000 51.4 218,750 29.38 200,000 52.1 250,000 33.57 225,000 53.6 281,250 37.76 250,000 50.9 312,500 41.95

22
Effect of Nitrogen and Residue Management on Yield and Grain Nitrogen Uptake of
Irrigated Corn
R.W. Mullen, W.E. Thomason, K.J. Wynn, K.W. Freeman, G.V. Johnson,
and W.R. Raun
ABSTRACT Improving the efficiency of nitrogen use in corn production remains important relative to decreasing environmental contamination and increasing net return. In 1995, one field study was initiated to determine the effects of residue and N management on corn yield and N uptake. Two N sources, three N application timings, three N management schemes, and two residue management regimes were investigated. In 1999, urea applied preplant increased yields 22% over anhydrous ammonia injected preplant. Grain yield and N uptake were not affected by timing of N application or residue incorporation in any year of the study. In the past two years of the study corn grain yields were increased via applied N. Soil profile inorganic N was high at the start of this experiment which partially explains the lack of differences due to treatment (residue management and N source) thus far. Table 1. Initial surface (0-15 cm) soil test characteristics and soil classification at Goodwell, OK. Location pH Total N Organic C NH4-N NO3-N P K -----------g kg-1----------- -------------------mg kg-1----------------- Goodwell 7.7 1.4 11.7 65 25 29 580 Classification: Richfield clay loam (fine, montmorillonitic, mesic Aridic Argiustoll) pH-1:1 soil:water, Total N and organic C-dry combustion, NH4-N and NO3-N – 2M KCl extraction, P and K – Mehlich III extraction.

23
Table 2. Treatment structure. Treatment
N rate (kg ha-1)
N source
N method
N management
Residue management
1 0 ---- --- --- IAH 2 0 ---- --- --- IPP 3 118 Urea BAH IAH IAH 4 236 Urea BAH IAH IAH 5 354 Urea BAH IAH IAH 6 118 Urea BAH IPP IPP 7 236 Urea BAH IPP IPP 8 354 Urea BAH IPP IPP 9 118 AA AAI KPP IPP 10 236 AA AAI KPP IPP 11 354 AA AAI KPP IPP 12 118 Urea BPP IPP IPP 13 236 Urea BPP IPP IPP 14 354 Urea BPP IPP IPP AA-anhydrous ammonia, BAH-N broadcast after harvest, NAAI-N injected preplant, BPP-N broadcast preplant, IAH-incorporated after harvest, IPP-incorporated preplant, KPP-N knifed preplant. Table 3. Effect of treatment on grain yield and N uptake in 1995. Treatment Yield Grain N uptake -------------kg ha-1------------ -----------kg N ha-1---------- 1 2869.1 52.6 2 1725.0 32.5 3 2846.2 31.0 4 2350.4 64.3 5 3117.5 55.9 6 3695.4 68.4 7 1893.7 36.7 8 2461.9 45.3 9 2388.5 44.7 10 2915.6 53.2 11 1791.4 34.8 12 1922.2 36.1 13 2059.3 37.5 14 1953.1 36.9
SED 826.7 18.0 SED-standard error of the difference of two equally replicated means.

24
Table 4. Effect of treatment on corn grain yield and N uptake in 1996. Treatment Yield Grain N uptake -----------kg ha-1---------- -----------kg N ha-1---------- 1 10732.5 150.0 2 10767.9 145.3 3 9262.1 129.2 4 10151.6 134.6 5 9659.0 133.2 6 11782.5 153.3 7 11259.7 156.8 8 9636.9 136.9 9 10234.8 143.5 10 9693.8 137.3 11 11325.5 155.3 12 9606.01 134.6 13 10440.4 143.2 14 9014.5 129.1
SED 1403.9 18.0 SED-standard error of the difference of two equally replicated means. Table 5. Effect of treatment on corn grain yield and N uptake in 1997. Treatment Yield Grain N uptake -----------kg ha-1---------- -----------kg N ha-1---------- 1 7302.2 141.0 2 7480.5 129.3 3 7594.6 142.1 4 6938.5 135.1 5 6924.3 129.5 6 6589.1 120.7 7 7009.8 124.3 8 7544.7 136.9 9 7123.9 123.9 10 7088.3 124.1 11 7402.0 129.9 12 7658.8 137.7 13 7416.3 133.6 14 7074.0 130.4
SED 647.4 13.4 SED-standard error of the difference of two equally replicated means.
25
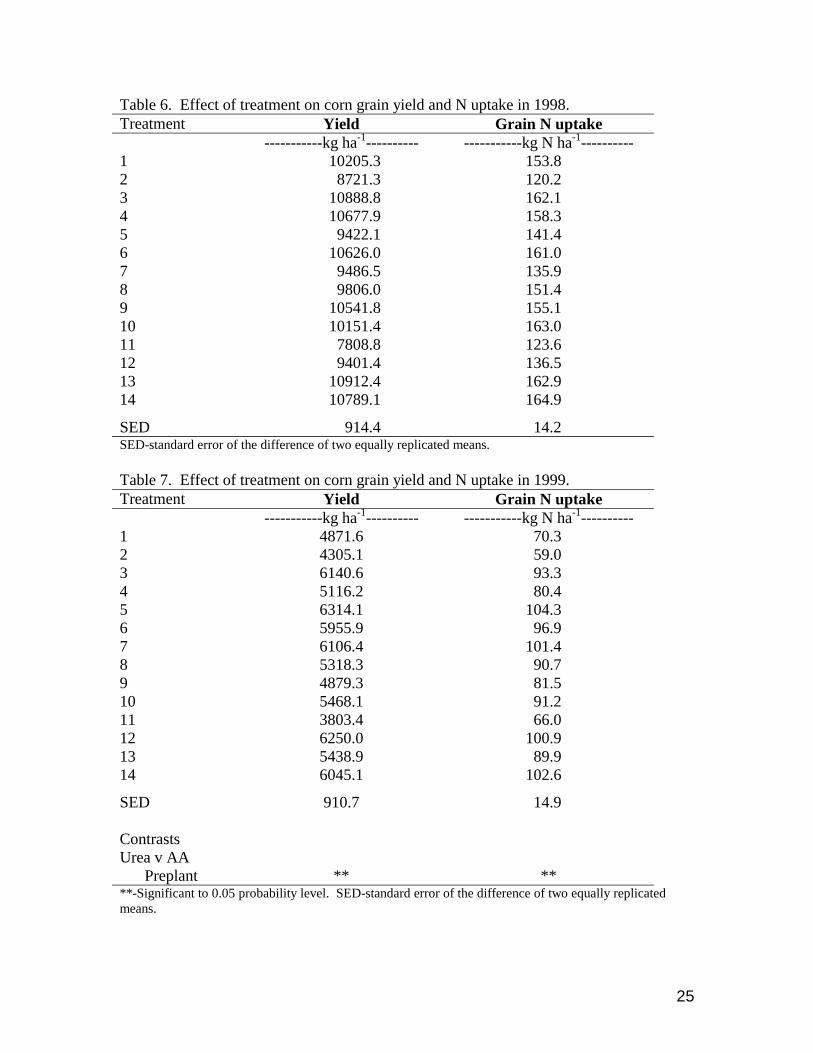
Table 6. Effect of treatment on corn grain yield and N uptake in 1998. Treatment Yield Grain N uptake -----------kg ha-1---------- -----------kg N ha-1---------- 1 10205.3 153.8 2 8721.3 120.2 3 10888.8 162.1 4 10677.9 158.3 5 9422.1 141.4 6 10626.0 161.0 7 9486.5 135.9 8 9806.0 151.4 9 10541.8 155.1 10 10151.4 163.0 11 7808.8 123.6 12 9401.4 136.5 13 10912.4 162.9 14 10789.1 164.9
SED 914.4 14.2 SED-standard error of the difference of two equally replicated means. Table 7. Effect of treatment on corn grain yield and N uptake in 1999. Treatment Yield Grain N uptake -----------kg ha-1---------- -----------kg N ha-1---------- 1 4871.6 70.3 2 4305.1 59.0 3 6140.6 93.3 4 5116.2 80.4 5 6314.1 104.3 6 5955.9 96.9 7 6106.4 101.4 8 5318.3 90.7 9 4879.3 81.5 10 5468.1 91.2 11 3803.4 66.0 12 6250.0 100.9 13 5438.9 89.9 14 6045.1 102.6
SED 910.7 14.9 Contrasts Urea v AA Preplant
**
**
**-Significant to 0.05 probability level. SED-standard error of the difference of two equally replicated means.

26
Table 8. Effect of treatment on corn grain yield and N uptake in 2000. Treatment Yield Grain N uptake -----------kg ha-1---------- -----------kg N ha-1---------- 1 3547.1 50.6 2 4461.1 72.8 3 3470.8 60.1 4 3666.5 66.8 5 3569.5 65.3 6 3301.2 59.5 7 4166.1 76.6 8 4448.8 83.7 9 ------- ------ 10 2682.3 50.7 11 5445.8 99.2 12 2909.8 51.8 13 5245.8 104.2 14 3724.2 63.0
SED 1067.5 18.8 SED-standard error of the difference of two equally replicated means.
27
Improving Fertilizer Nitrogen Use Efficiency Using Alternative Legume Interseeding in Continuous Corn
W.E. Thomason, D.A. Keahey, D.A. Cossey, K.J. Wynn,
C.W. Woolfolk, R.W. Mullen, G.V. Johnson, and W.R. Raun
Abstract Many alternative management systems have been evaluated for corn (Zea
mays L.), soybeans (Glycine max L.), and wheat (Triticum aestivum L.) production, however, most have involved rotations from one year to the next. Legume interseeding systems which employ canopy reduction techniques in corn have not been thoroughly evaluated. One study was initiated in 1994 at the Panhandle Research Station near Goodwell, OK, on a Richfield clay loam soil, to evaluate five legume species: yellow sweet clover (Melilotus officinalis L.), subterranean clover (Trifolium subterraneum L.), alfalfa (Medicago sativa L.), arrowleaf clover (T. vesiculosum L.) and crimson clover (T. incarnatum L.) interseeded into established corn. In addition, the effect of removing the corn canopy above the ear (canopy reduction) at physiological maturity was evaluated. Canopy reduction increased light interception beneath the corn thus enhancing legume growth in late summer, early fall, and early spring the following year prior to planting. Legumes incorporated prior to planting were expected to lower the amount of inorganic nitrogen fertilizer needed for corn production. Crimson clover appeared to be more shade tolerant than the other species, and intereseeding this species resulted in the highest corn grain yields when no N was applied. In the last two years, interseeding crimson clover at physiological maturity, followed by canopy reduction resulted in a 21 bu/ac increase in yield compared to conventionally grown corn with no N applied.
Introduction
Canopy reduction has been used in third world countries as a means of increasing light interception for a relay crop. Canopy reduction is imposed when the corn reaches physiological maturity when nutrient and water uptake has ceased). Over the past 20 years, various researchers have evaluated intercropped legumes for increased nitrogen (N) supply in corn (Zea mays L.) production. As sources of inorganic nitrogen fertilizer become less dependable and prices increase, organic forms, particularly legumes, are being considered as alternative sources for non-legume crops. Searle et al. (1981) stated that corn

28
grain yield was not affected by legume intercrop, indicating neither competitive depression nor nitrogen transfer from the legume. Nair et al. (1979) showed that intercropping corn with soybeans increased yield 19.5% when compared to monoculture corn. Scott et al. (1987) noted yields following medium red clover (T. pratense L.) were equivalent to the addition of 17 kg ha-1 fertilizer-N.
Even though intercropping usually includes a legume, applied nitrogen may still confer some benefits to the system as the cereal component depends heavily on nitrogen for maximum yield (Ofori and Stern, 1986). Chowdhury and Rosario, (1993) found that intercropping corn with mungbeans (Vigna radiata L.) increased yields 71% when the N application rate was increased from 0 to 90 kg/ha. Ebelhar et al. (1984) reported with no fertilizer N applied, there was an increase in corn grain yield from 2.5 to 6.2 Mg ha-1 with hairy vetch (Vicia villosa L.) treatment compared with corn residue. Corn yields increased 62% with applied N (0 versus 120 kg N ha-1).
Canopy reduction is defined as the removal of the corn canopy just above the ear at physiological maturity, where the cut portion is allowed to drop to the soil surface. Some of the basis of canopy reduction come from regions where a relay crop like common beans is produced following corn. In order to increase light interception beneath the corn canopy for the bean plant, the tops of the corn can be removed once physiological maturity is reached. This in turn does not sacrifice the corn yield while increasing the chances of producing a bean crop that would not have been possible if planting took place following corn harvest.
The objective of this work was to evaluate the effect of interseeded legume species and nitrogen rates combined with canopy reduction on corn grain yield and grain protein.
Materials and Methods
One experiment was established in the spring of 1994 at the Oklahoma Panhandle Research and Extension Center near Goodwell, OK on a Richfield clay loam (fine, montmorillonitic, mesic Aridic Argiustoll). Initial soil test characteristics and soil classification are reported in Table 1. A randomized complete block experimental design with three replications was used. Plot size consisted of four rows (30 inch) x 25 ft. All treatments received 90 lb N/ac of urea (45-0-0) in the fall of 1995. In 1996 and for the remaining years of this experiment, treatments 1-5, 7 and 12 received no N to assess legume N fixation

29
compared to identical treatments with 45 lb N/ac. Each year, corn was planted at a seeding rate of 30,000 seeds ac between late April and early May.
Canopy reduction was imposed by removing the tops of the corn plants just above the ear using a machete. This allowed sunlight to reach the legume seedbed. In August, when the corn had reached physiological maturity, five legume species were interseeded by hand at the following seeding rates: yellow sweet clover (Melilotis officinalis L.) 40 lb/ac, subterranean clover (Trifolium subterraneum L.) 40 lb/ac, alfalfa (Medicago sativa L.) 30 lb/ac, arrowleaf clover (T. vesiculosum L.) 20 lb/ac and crimson clover (T. incarnatum L.) 40 lb/ac. Physiological maturity was determined by periodic monitoring grain black layer formation. Following interseeding and canopy reduction, 5 cm of irrigation water was applied for legume establishment and to prevent reduction in growth caused by moisture stress. The legume seeds were inoculated prior to planting with a mixture of Rhizobium meliloti and R. trifolii bacteria. Harvest area consisted of two rows (30 inches) x 25 ft. Harvesting and shelling were performed by hand. Plot weights were recorded and sub-sampled for moisture and chemical analysis. Subsamples were dried in a forced-air oven at 150°F and ground to pass a 140 mesh screen. Total nitrogen concentration was determined on all grain samples using dry combustion (Schepers et al. 1989). Protein N in corn grain can be determined by multiplying %N by 6.25.
Interseeded legumes remained in the field until the following spring when they were incorporated prior to corn planting using a shallow (4 inches) disk. Legumes were only used for ground cover and potential nitrogen fixation and as such were not harvested for seed or forage.
Results and Discussion
By imposing the alternative management practice of canopy reduction, we visually observed an increase in light interception beneath the corn canopy, thus enhancing legume growth in late summer, early fall before corn harvest, and early spring the following year prior to planting. Crimson clover had superior spring growth compared to the other species evaluated as visual biomass production was greater when incorporated in early April prior to planting. No grain yield response to applied N was observed in 1996, or 1997, but by 1998, yields increased 21 bushels as a result of applying N (12 vs 13, Table 2). The lack of fertilizer N response at this site restricted the early evaluation of legume N contribution and species comparison.

30
There was no significant difference between grain yields when tops were cut at physiological maturity compared to the normal practice (5 vs 7, crimson clover with and without canopy reduction, with no N applied) in 1996, 1997 or 1998. However, by 1999, interseeding crimson clover and using canopy reduction resulted in increased yields when compared to that observed where no canopy reduction was employed. It was important to find no differences between canopy reduction and conventional management early on, because it demonstrated the applicability of interseeding in late summer. Weeds, multiple hailstorms, and a lack of timely irrigation severely limited yields of the 2000 crop. No significant treatment effects were found in the 2000 crop year since yields were so low that evaluation of treatments was not thought advisable (Table 2). The average yields for the 7 years of the study indicate no significant differences in yield due to treatment (Table 2).
In the 1998 and 1999 crop years, interseeding crimson clover at physiological maturity, followed by canopy reduction resulted in a 21 bu/ac increase in yield when compared to conventionally grown corn with no N applied (5 versus 12). This N fertilizer savings of approximately 24 lb N/ac would have an economic value of $4.80. Legume interseeding and canopy reduction costs would likely be greater than $4.80, thus restricting what can be promoted at this point in time.
Nitrogen uptake values were calculated for all treatments by multiplying total yield by percent N in the grain (Table 3). In 1997, N uptake was highest in the plots with normal management and either 0 or 90 lb/ac N. This was probably due to residual N mineralization from the soil. Crimson and arrowleaf clover plots also had high N uptake. N uptake for the 1998 crop year was greatest for the 90 lb/ac N rate, however there were no significant differences between this treatment and those with alfalfa or arrowleaf clover. 1999 values for N uptake were highest for plots with crimson and arrowleaf clover. Overall, there is no difference in N uptake for plots treated with 90 lb N/ac or plots with crimson or arrowleaf clover interseeded.
Although not evaluated in this study, mechanized canopy reduction could decrease the time required for grain to lose moisture since more sunlight would directly come in contact with the corn ears when the tops were removed. When grain moisture is high it can delay harvest and/or significantly increase drying costs. Legume seeding rates, alternative species, method of interseeding and
31
interseeding date will all need to be thoroughly evaluated prior to the mechanization and implementation of this practice.
Since nitrate leaching and soil erosion are becoming major concerns in production agriculture today, this experiment may lead to practices that can decrease both, via lowering the amount of inorganic fertilizer N needed for corn production and reducing the amount of bare soil susceptible to wind and water erosion. References Chowdhury, M.K. and E.L. Rosario. 1994. Comparison of nitrogen, phosphorus
and potassium utilization efficiency in maize/mungbean intercropping. J. of Agric. Sci., Cambridge. 122:193-199.
Ebelhar, S.A., W.W. Frye and R.L. Blevins. 1984. Nitrogen from legume cover
crops for no-tillage corn. Agron. J. 76:51-55. Nair, K.P., U.K. Patel, R.P. Singh and M.K. Kaushik. 1979. Evaluation of
legume intercropping in conservation of fertilizer nitrogen in maize culture. J. Agric. Sci. Camb. 93:189-194.
Ofori, Francis and W.R. Stern. 1986. Maize/cowpea intercrop system: effect of
nitrogen fertilizer on productivity and efficiency. Field Crops Res. 14:247-261.
Schepers, J.S., D.D. Francis and M.T. Thompson. 1989. Simultaneous
determination of total C, total N and 15N on soil and plant material. Commun. Soil Sci. Plant Anal. 20:949-959.
Scott, T.W., J. Mt. Pleasant, R.F. Burt and D.J. Otis. 1987. Contributions of
ground cover, dry matter, and nitrogen from intercrops and cover crops in a corn polyculture system. Agron. J. 79:792-798.
Searle, P.G.E., Yuthapong Comudom, D.C. Shedden and R.A. Nance. 1981.
Effect of maize + legume intercropping systems and fertilizer nitrogen on crop yields and residual nitrogen. Field Crops Res. 4:133-145.

32
Table 1. Initial surface (0-15 cm) soil test characteristics and soil classification at Goodwell, OK. Location pH Total N Org. C NH4-N NO3-N P K
---------- g kg-1 --------- --------mg kg-1 -------- -------mg kg-1------ Goodwell 7.7 1.4 11.7 65 25 29 580
Classification: Richfield clay loam (fine, montmorillonitic, mesic Aridic Argiustoll) pH - 1:1 soil:water, Total N and Organic C - dry combustion, NH4-N and NO3-N - 2M KCl extraction, P and K - Mehlich III extraction.

33
Table 2. Treatment structure including legume species interseeded, management of corn canopy and N rate, and corn grain yield means (bu/ac), 1994-2000.
†SED-Standard error of the difference between two equally replicated means ‡CV- Coefficient of variation
Treatment Legume Management N rate, lb/ac 1994 1995 1996 1997 1998 1999 2000 Average ------------ ------------ ------------ ------------ --bu/ac-- ------------ ------------ ------------ 1 Yellow Sweet Clover Tops cut at PM 0 164 130 181 109 116 142 49 114 2 Subterranean Clover Tops cut at PM 0 118 158 189 101 99 116 50 105 3 Alfalfa Tops cut at PM 0 130 96 180 109 103 97 42 101 4 Arrowleaf Clover Tops cut at PM 0 167 137 183 110 111 103 39 104 5 Crimson Clover Tops cut at PM 0 72 139 168 95 111 162 63 115 6 Subterranean Clover Tops cut at PM 45 143 160 173 94 118 124 48 106 7 Crimson Clover Normal 0 148 112 170 105 119 142 47 111 8 Yellow Sweet Clover Tops cut at PM 45 95 143 160 91 108 137 76 110 9 Alfalfa Tops cut at PM 45 121 184 177 96 113 150 41 110 10 Arrowleaf Clover Tops cut at PM 45 148 90 177 98 122 157 50 116 11 Crimson Clover Tops cut at PM 45 145 134 192 92 117 148 46 113 12 No Legume Normal 0 143 119 172 111 101 129 49 107 13 No Legume Normal 90 162 159 190 107 132 141 51 119 SED† 23.6 24.6 23.3 8.5 9.1 21.4 16.4 23.6 CV‡ 21.4 22.3 16.1 10.25 9.8 19.4 41.4 37.5
34
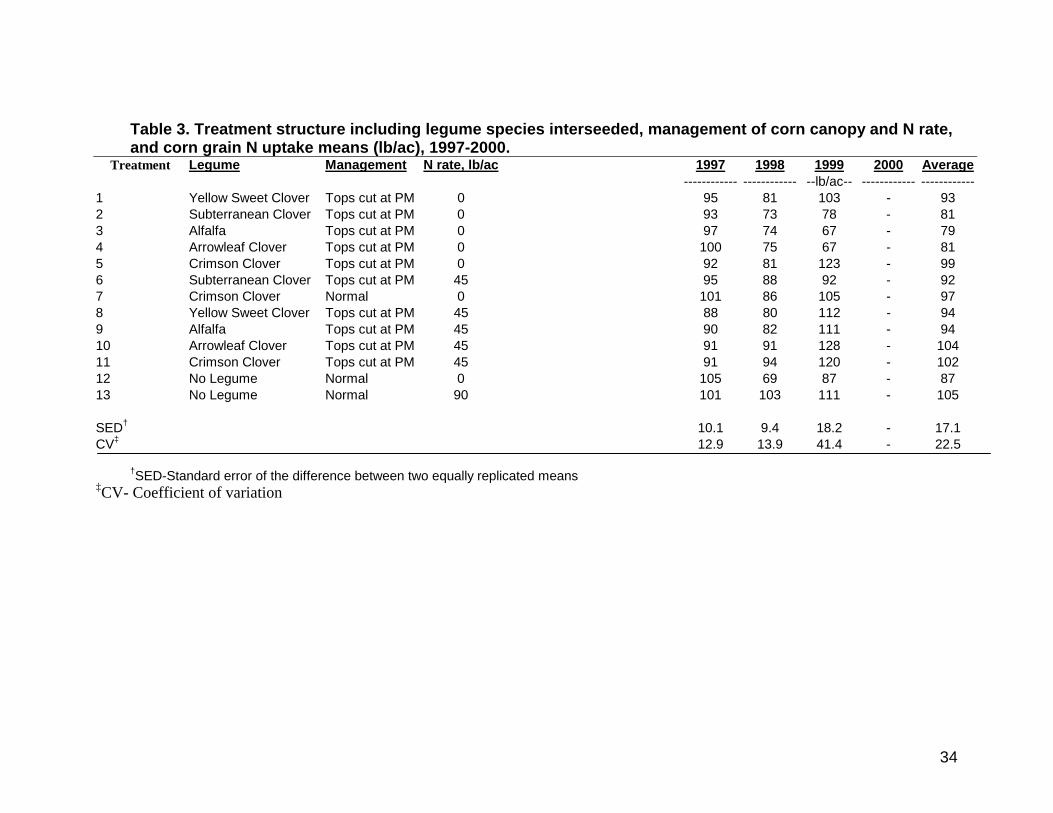
Table 3. Treatment structure including legume species interseeded, management of corn canopy and N rate, and corn grain N uptake means (lb/ac), 1997-2000.
Treatment Legume Management N rate, lb/ac 1997 1998 1999 2000 Average ------------ ------------ --lb/ac-- ------------ ------------ 1 Yellow Sweet Clover Tops cut at PM 0 95 81 103 - 93 2 Subterranean Clover Tops cut at PM 0 93 73 78 - 81 3 Alfalfa Tops cut at PM 0 97 74 67 - 79 4 Arrowleaf Clover Tops cut at PM 0 100 75 67 - 81 5 Crimson Clover Tops cut at PM 0 92 81 123 - 99 6 Subterranean Clover Tops cut at PM 45 95 88 92 - 92 7 Crimson Clover Normal 0 101 86 105 - 97 8 Yellow Sweet Clover Tops cut at PM 45 88 80 112 - 94 9 Alfalfa Tops cut at PM 45 90 82 111 - 94 10 Arrowleaf Clover Tops cut at PM 45 91 91 128 - 104 11 Crimson Clover Tops cut at PM 45 91 94 120 - 102 12 No Legume Normal 0 105 69 87 - 87 13 No Legume Normal 90 101 103 111 - 105 SED† 10.1 9.4 18.2 - 17.1 CV‡ 12.9 13.9 41.4 - 22.5
†SED-Standard error of the difference between two equally replicated means ‡CV- Coefficient of variation